energy, society, and the environment unit 8 energy efficiency
Post on 21-Dec-2015
215 views
TRANSCRIPT
Energy, Society, and the EnvironmentUnit 8
ENERGY EFFICIENCY
Energy Efficiency
• Reducing Demand: Reducing Electricity and Petroleum Use
• Make the Produced Energy Go a Longer Way:
through improved technology conscious energy use energy-conscious development changing lifestyle
new products, new designs new approaches to transportation and buildings
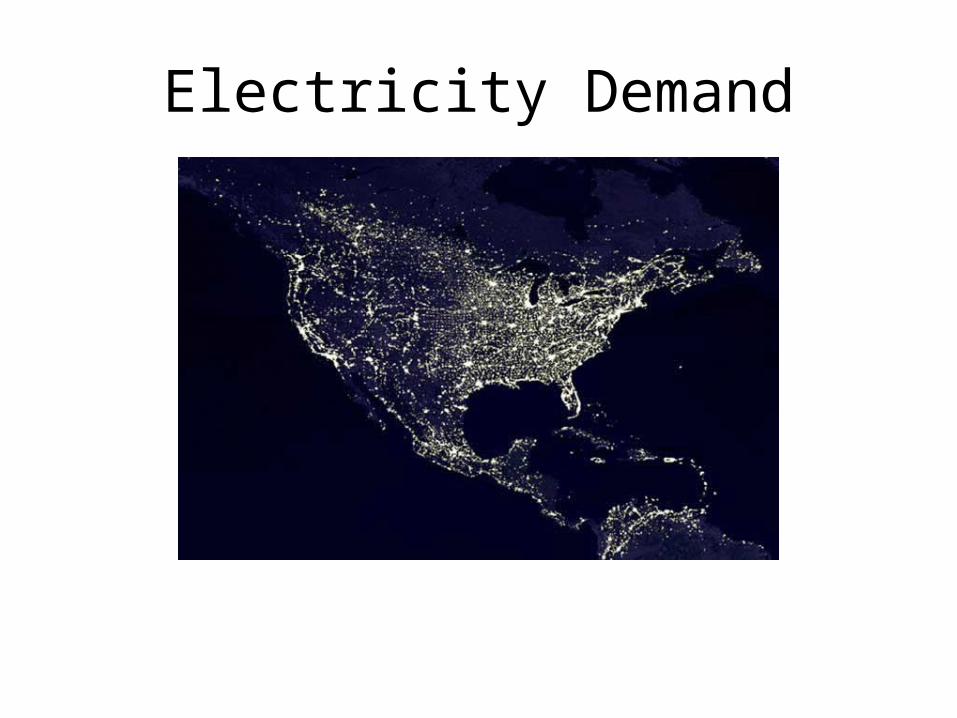
Electricity Demand
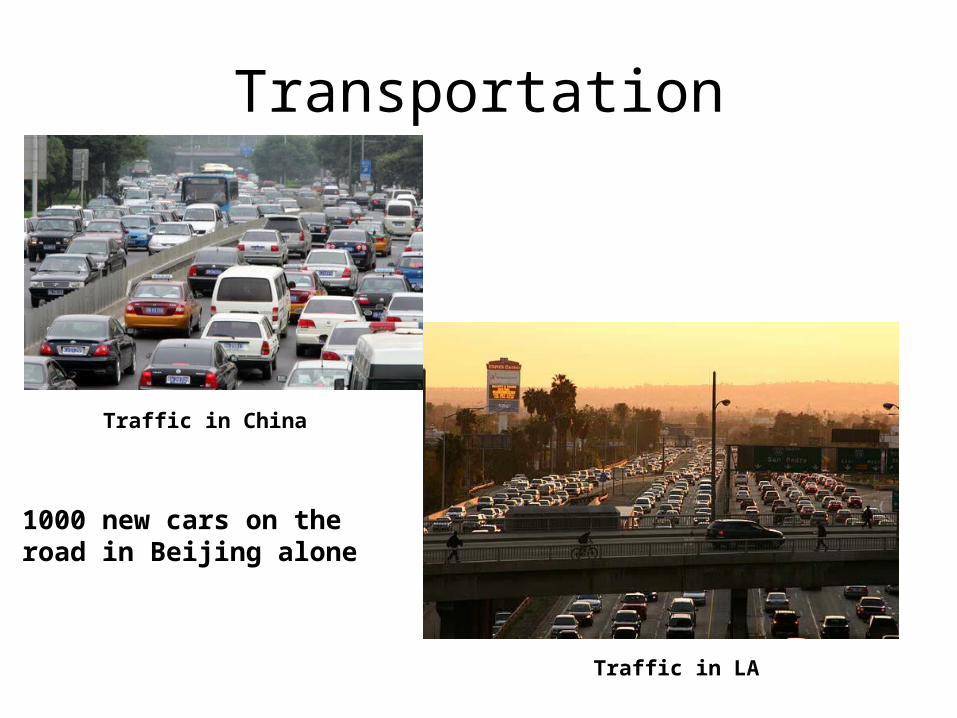
Transportation
Traffic in China
Traffic in LA
1000 new cars on theroad in Beijing alone
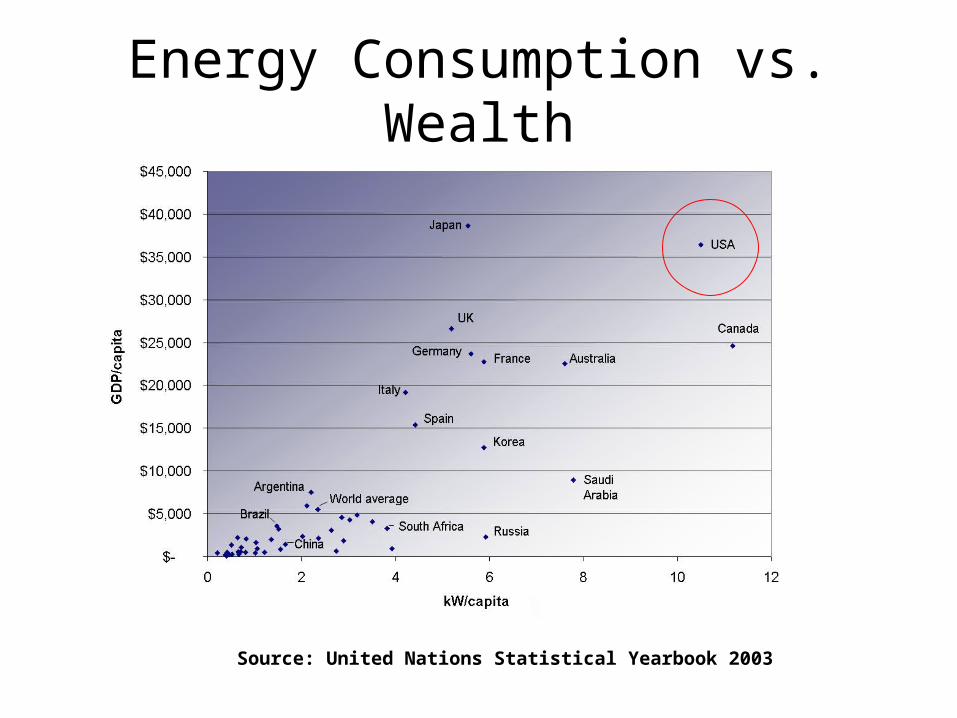
Energy Consumption vs. Wealth
Source: United Nations Statistical Yearbook 2003
Petroleum Consumption
• The United States consumes 21 million barrels/day
• 25% of the world consumption
• Highest consumption per capita after Canada and Saudi Arabia
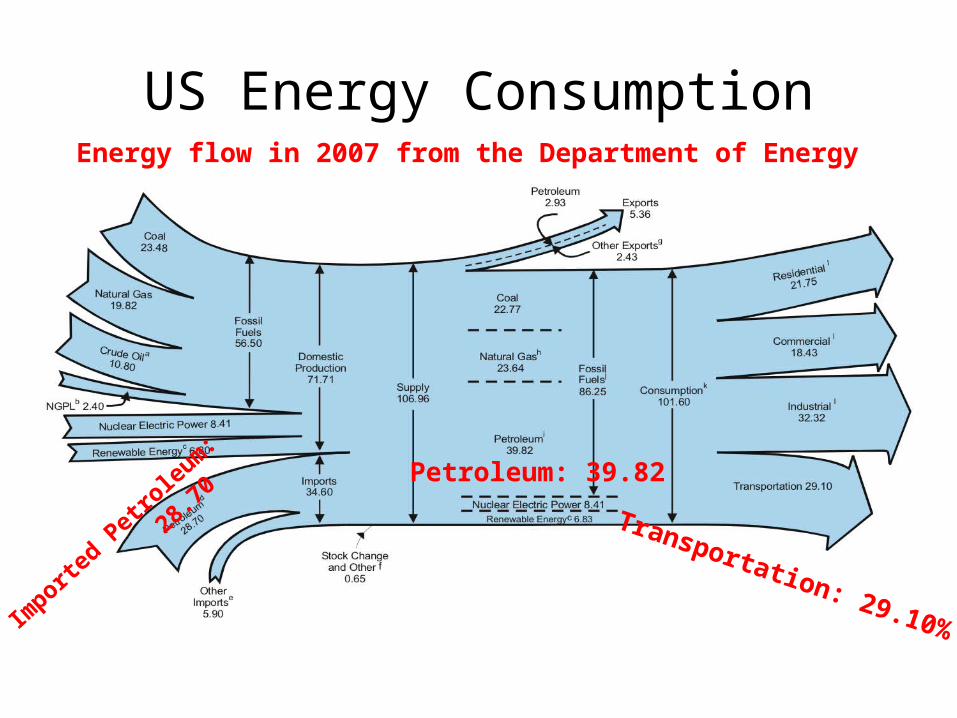
US Energy ConsumptionEnergy flow in 2007 from the Department of Energy
Petroleum: 39.82
Importe
d Pet
role
um:
28.7
0Transportation: 29.10%
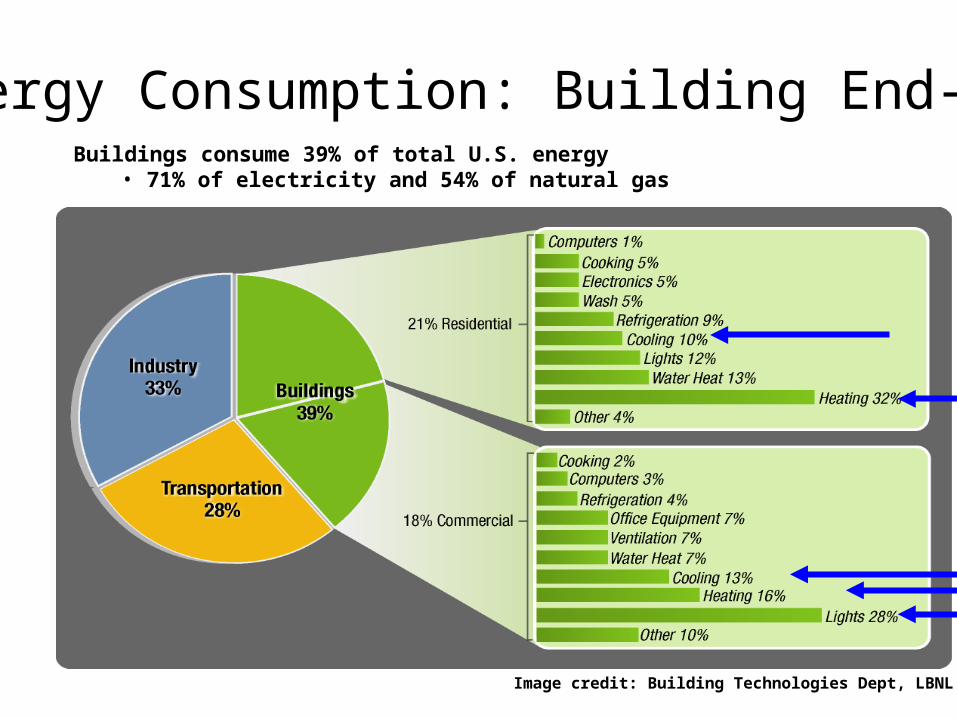
Buildings consume 39% of total U.S. energy• 71% of electricity and 54% of natural gas
Energy Consumption: Building End-Use
Image credit: Building Technologies Dept, LBNL
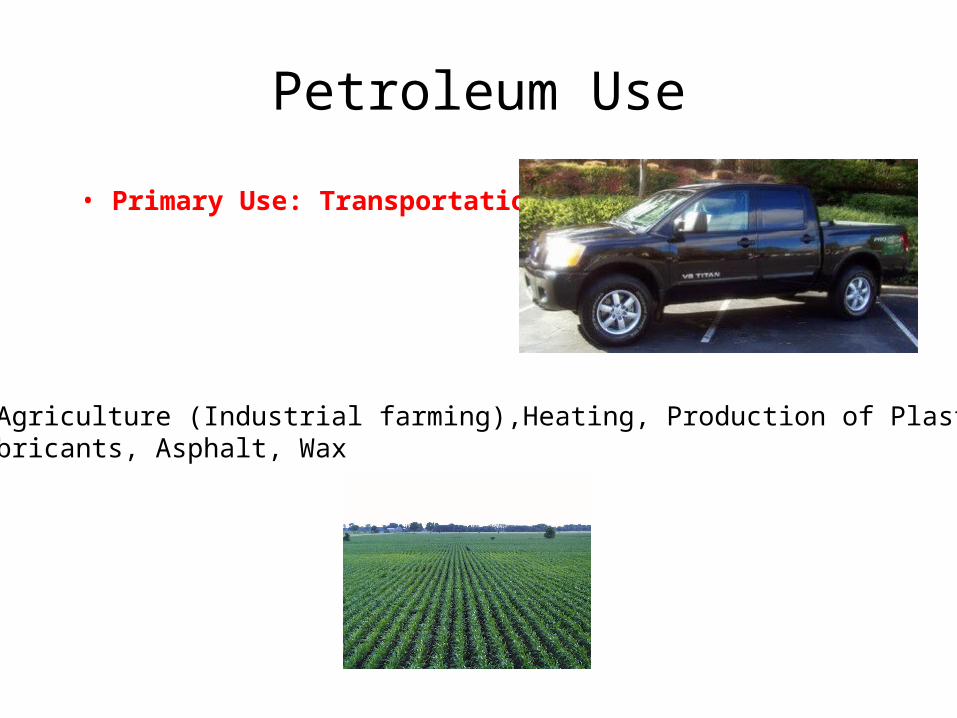
Petroleum Use
• Primary Use: Transportation
• Agriculture (Industrial farming),Heating, Production of Plastics, Lubricants, Asphalt, Wax

Energy Efficiency
I aim to show you that Energy Efficiency has to be the first component of any national energy plan or response to climate change
Energy/cost savings can be HUGE with simple steps
We’ll look at many examples
Today: In Class Demo of Energy Efficient Window Technology
Bill Lake-WrightPrentice Fountain
Home Depot
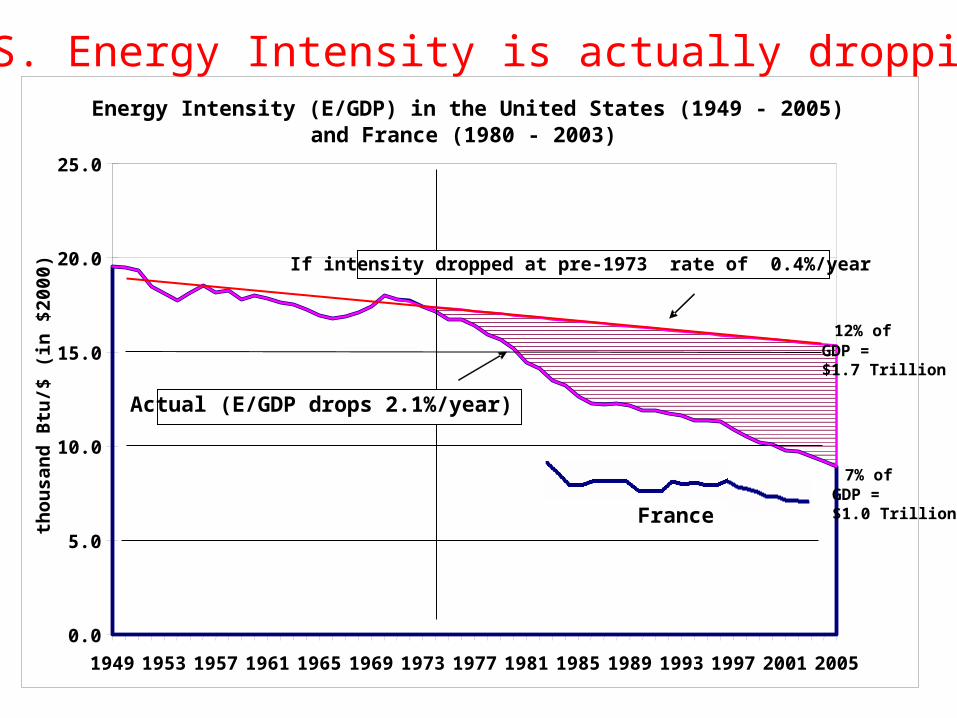
Energy Intensity (E/GDP) in the United States (1949 - 2005) and France (1980 - 2003)
0.0
5.0
10.0
15.0
20.0
25.0
1949 1953 1957 1961 1965 1969 1973 1977 1981 1985 1989 1993 1997 2001 2005
tho
usa
nd
Btu
/$ (
in $
200
0)
If intensity dropped at pre-1973 rate of 0.4%/year
Actual (E/GDP drops 2.1%/year)
France
12% of GDP = $1.7 Trillion
7% of GDP =$1.0 Trillion
U.S. Energy Intensity is actually dropping
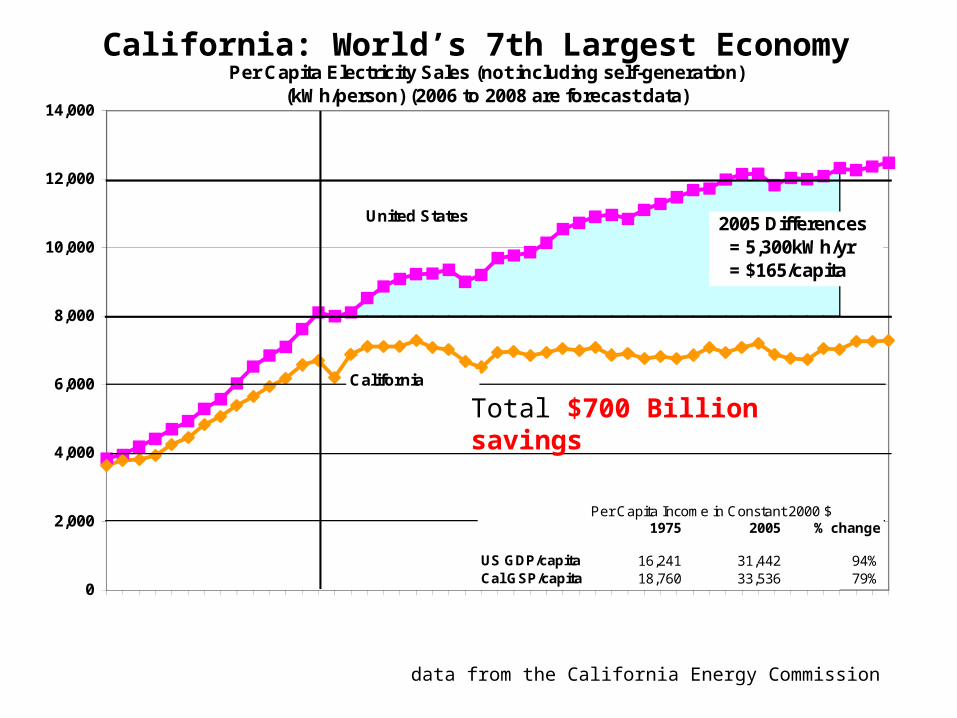
Per Capita Electricity Sales (not including self-generation)(kWh/person) (2006 to 2008 are forecast data)
0
2,000
4,000
6,000
8,000
10,000
12,000
14,000
1960196219641966196819701972197419761978198019821984198619881990199219941996199820002002200420062008
United States
California
Per Capita Income in Constant 2000 $1975 2005 % change
US GDP/capita 16,241 31,442 94%Cal GSP/capita 18,760 33,536 79%
2005 Differences = 5,300kWh/yr = $165/capita
California: World’s 7th Largest Economy
data from the California Energy Commission
Total $700 Billion savings
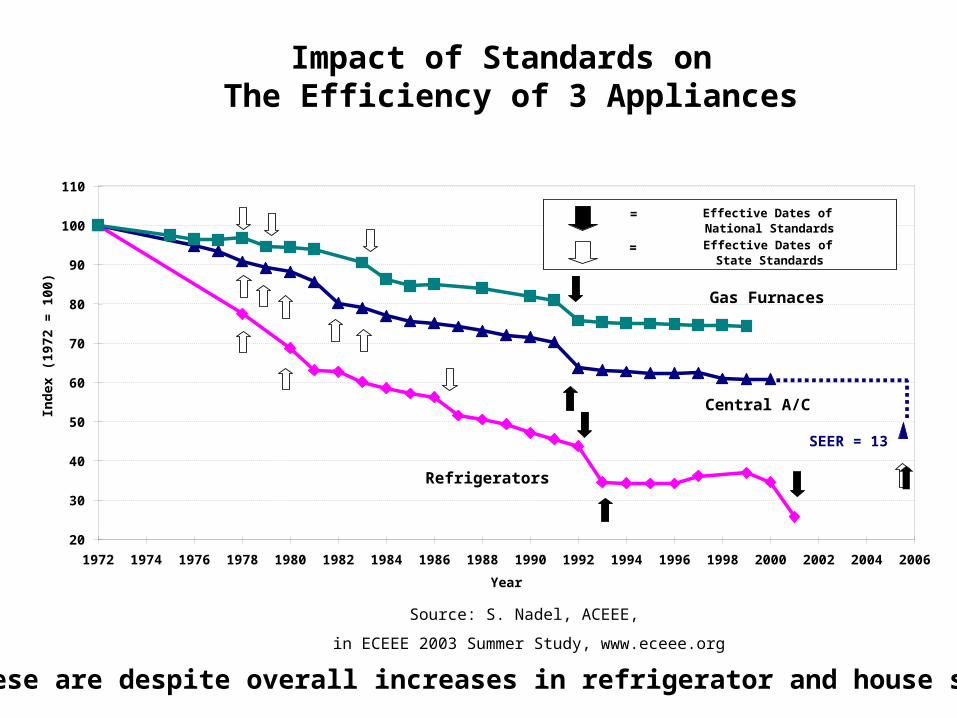
Impact of Standards on The Efficiency of 3 Appliances
Source: S. Nadel, ACEEE,
in ECEEE 2003 Summer Study, www.eceee.org
75%
60%
25%20
30
40
50
60
70
80
90
100
110
1972 1974 1976 1978 1980 1982 1984 1986 1988 1990 1992 1994 1996 1998 2000 2002 2004 2006
Year
Ind
ex (
1972
= 1
00)
Effective Dates of National Standards
=
Effective Dates of State Standards
=
Refrigerators
Central A/C
Gas Furnaces
SEER = 13
** These are despite overall increases in refrigerator and house sizes**
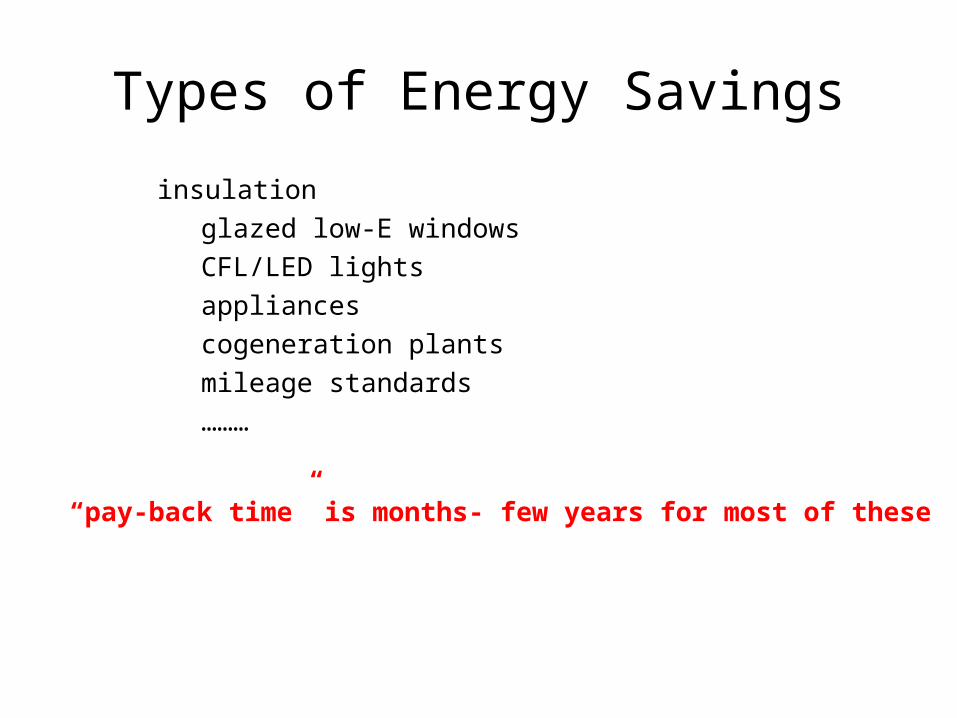
Types of Energy Savings
insulation
glazed low-E windows
CFL/LED lights
appliances
cogeneration plants
mileage standards
………
“pay-back time” is months- few years for most of these
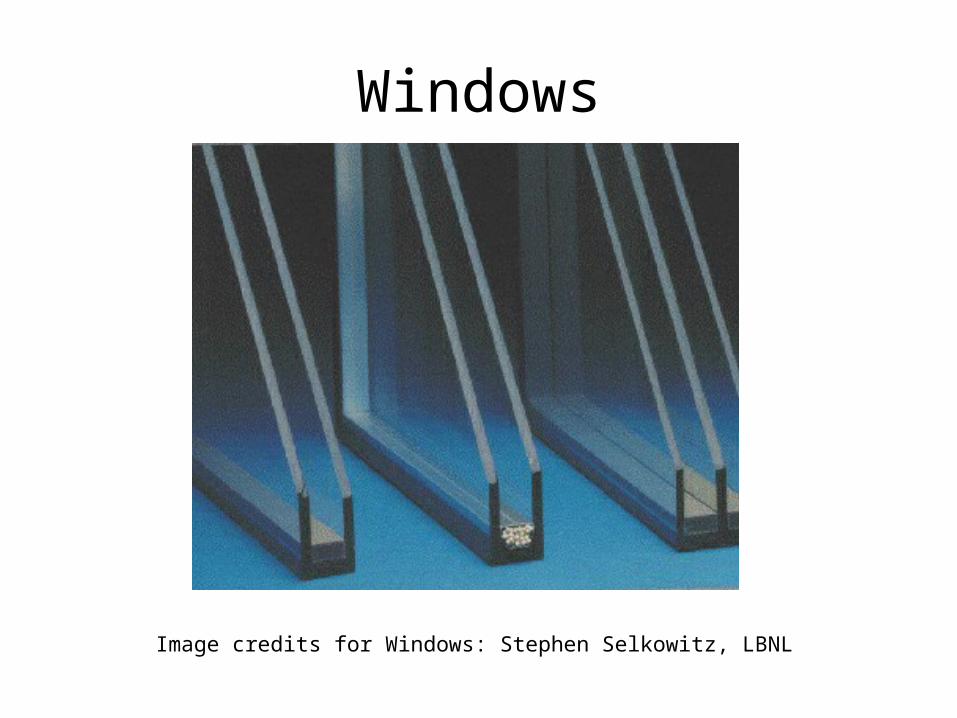
Windows
Image credits for Windows: Stephen Selkowitz, LBNL
Windows
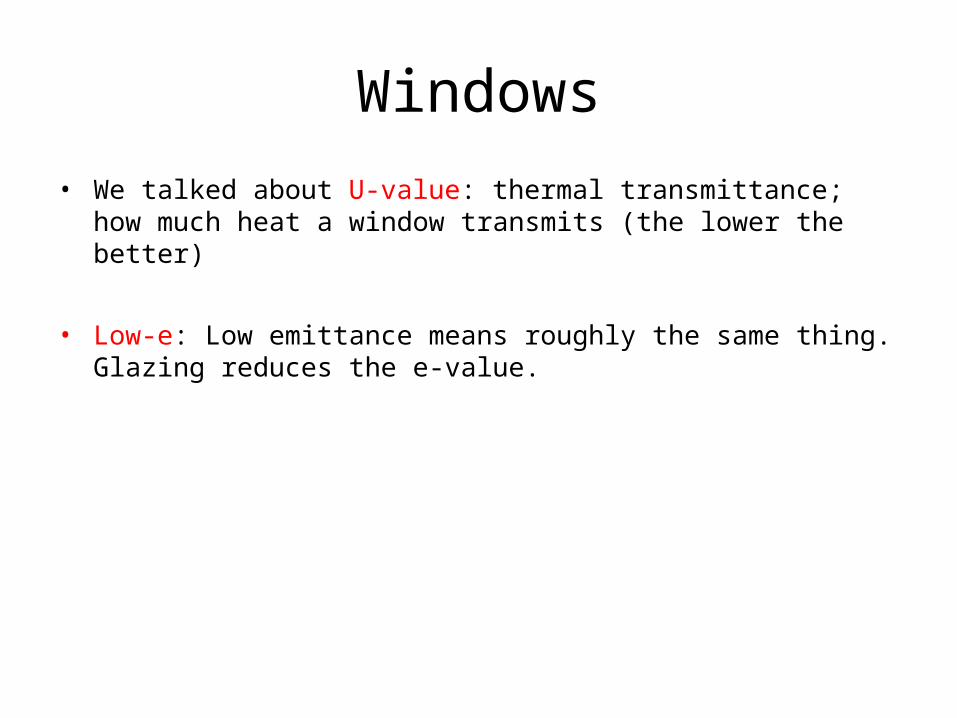
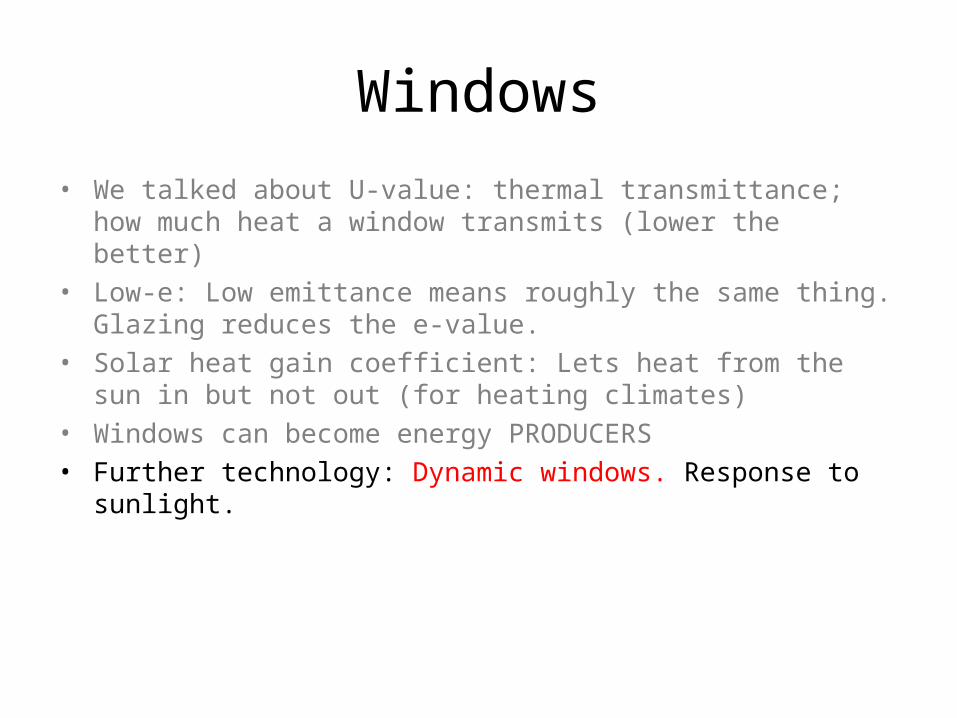
• We talked about U-value: thermal transmittance; how much heat a window transmits (the lower the better)
• Low-e: Low emittance means roughly the same thing. Glazing reduces the e-value.
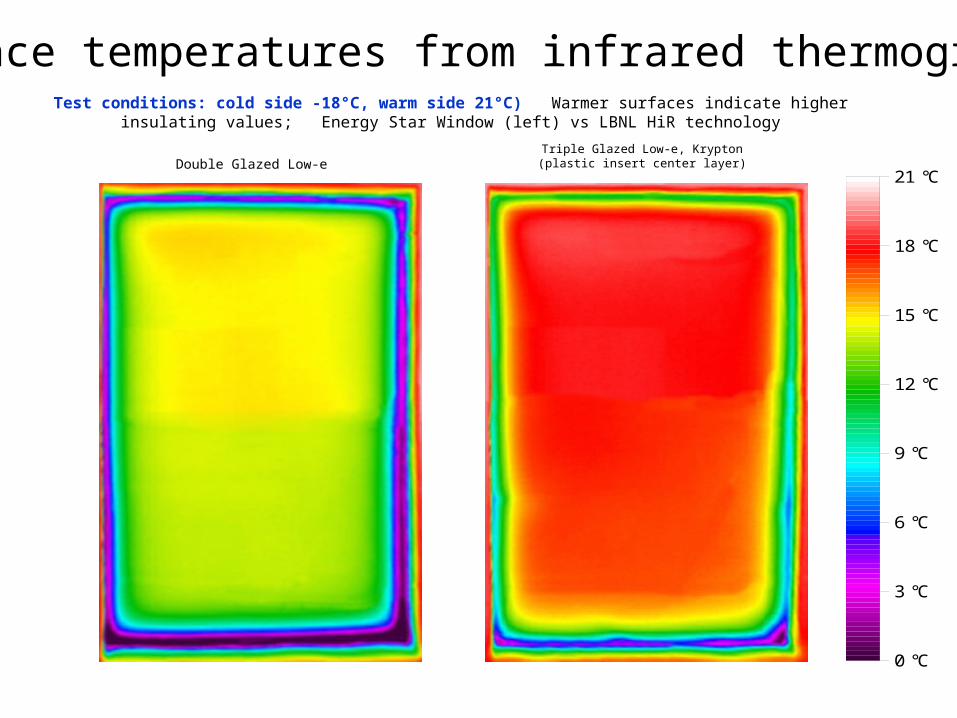
Double Glazed Low-e
0 °C
3 °C
6 °C
9 °C
12 °C
15 °C
18 °C
21 °C
Triple Glazed Low-e, Krypton(plastic insert center layer)
Test conditions: cold side -18°C, warm side 21°C) Warmer surfaces indicate higher insulating values; Energy Star Window (left) vs LBNL HiR technology
Surface temperatures from infrared thermography
Windows
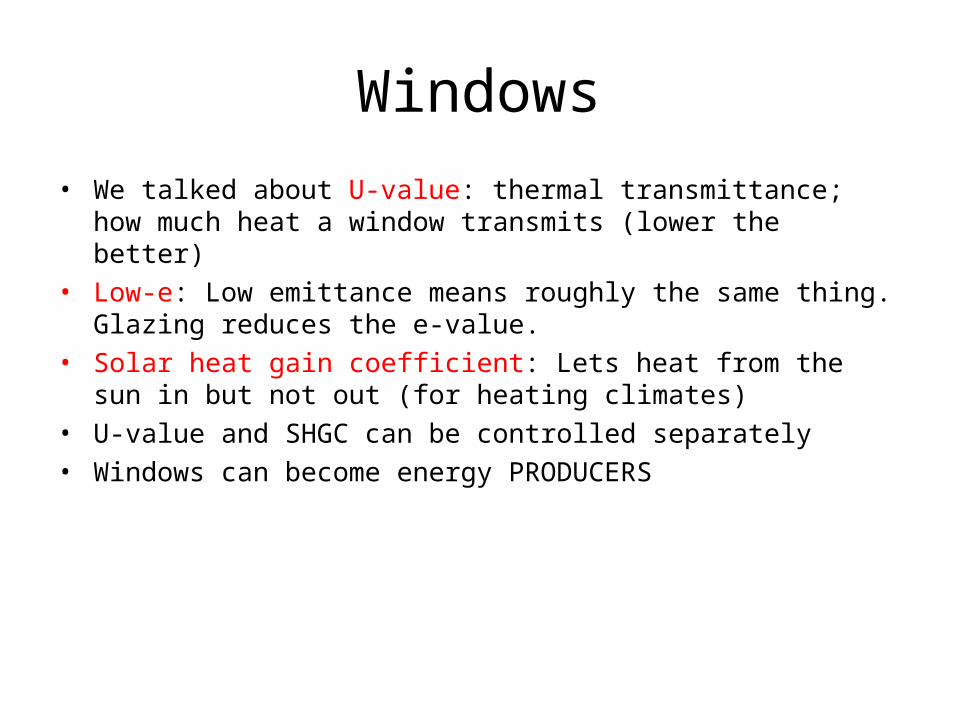
• We talked about U-value: thermal transmittance; how much heat a window transmits (lower the better)
• Low-e: Low emittance means roughly the same thing. Glazing reduces the e-value.
• Solar heat gain coefficient: Lets heat from the sun in but not out (for heating climates)
• U-value and SHGC can be controlled separately• Windows can become energy PRODUCERS
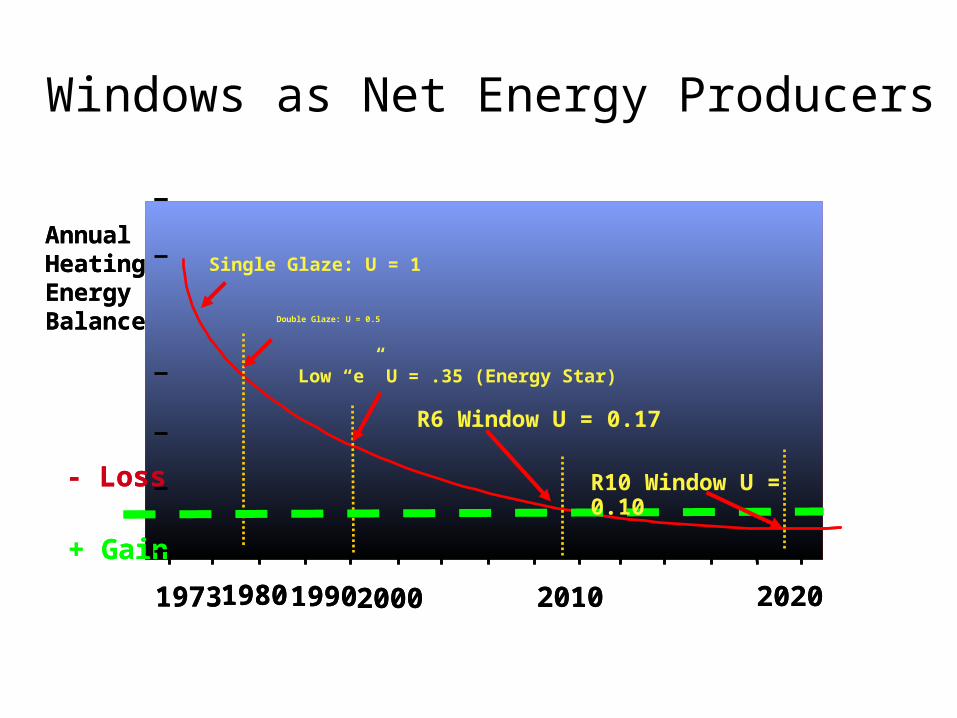
Double Glaze: U = 0.5
+ Gain
- Loss
19731980 2010 2020
Single Glaze: U = 1
1990
Low “e” U = .35 (Energy Star)
2000
R6 Window U = 0.17
R10 Window U = 0.10
AnnualHeatingEnergyBalance Double Glaze: U = 0.5
+ Gain
- Loss
19731980 2010 2020
Single Glaze: U = 1
1990
Low “e” U = .35 (Energy Star)
2000
R6 Window U = 0.17
R10 Window U = 0.10
AnnualHeatingEnergyBalance
Windows as Net Energy Producers
Windows
• We talked about U-value: thermal transmittance; how much heat a window transmits (lower the better)
• Low-e: Low emittance means roughly the same thing. Glazing reduces the e-value.
• Solar heat gain coefficient: Lets heat from the sun in but not out (for heating climates)
• Windows can become energy PRODUCERS• Further technology: Dynamic windows. Response to sunlight.
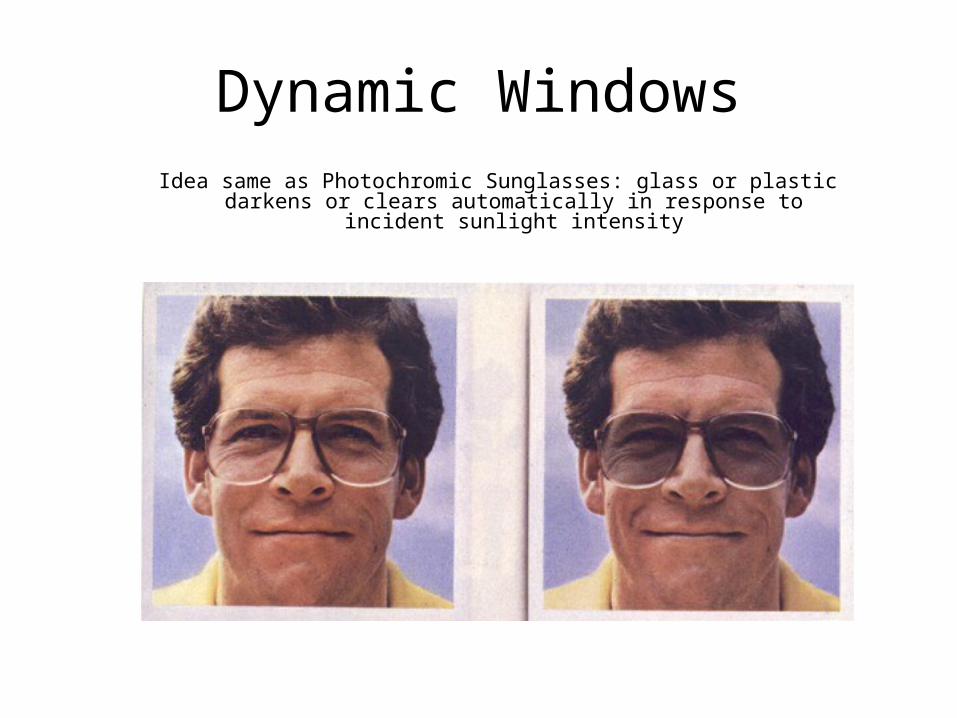
Dynamic WindowsIdea same as Photochromic Sunglasses: glass or plastic darkens or
clears automatically in response to incident sunlight intensity
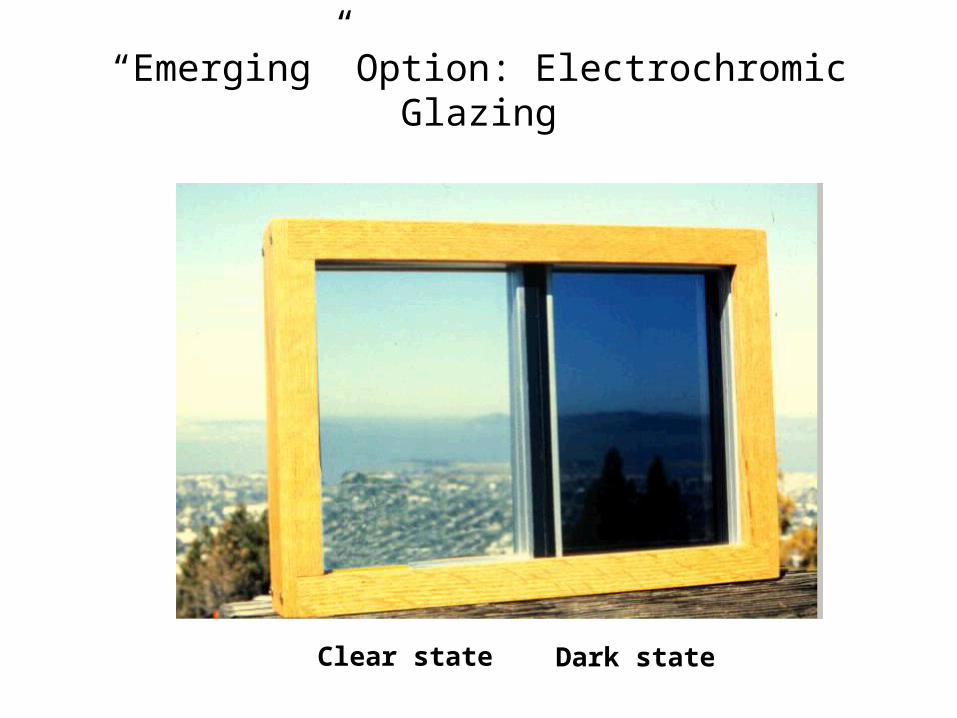
“Emerging” Option: Electrochromic Glazing
Clear state Dark state

Insulation
• Biggest energy gains in buildings achieved through insulation
• Roofs, then windows, then walls
• Degree-days: Number of days x (Tin - Tout)
• Example: Number of degree days accumulated in Fairbanks, AK between December and February when the average outside temperature is 10 F. (Average home T taken to be 65 F)
• Focus on new technology
Cool Roof Technology
•Direct Effect-Light-colored roofs reflect solar radiation, reduce air-conditioning use
•Indirect Effect-Light-colored surfaces in a neighborhood alter surface energy balance; result in lower ambient temperature
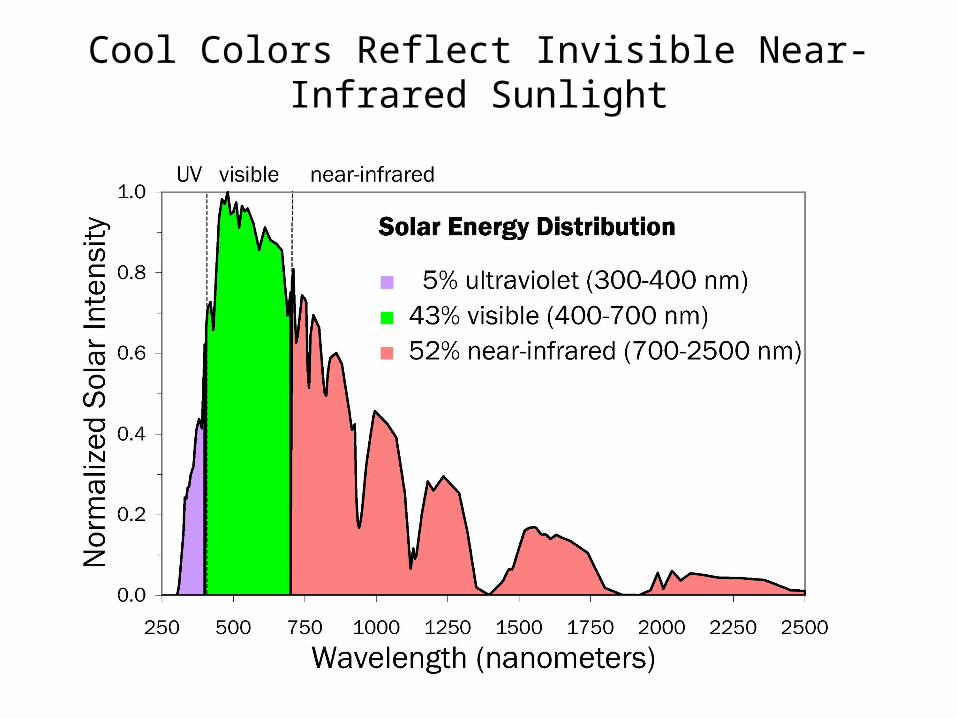
Cool Colors Reflect Invisible Near-Infrared Sunlight
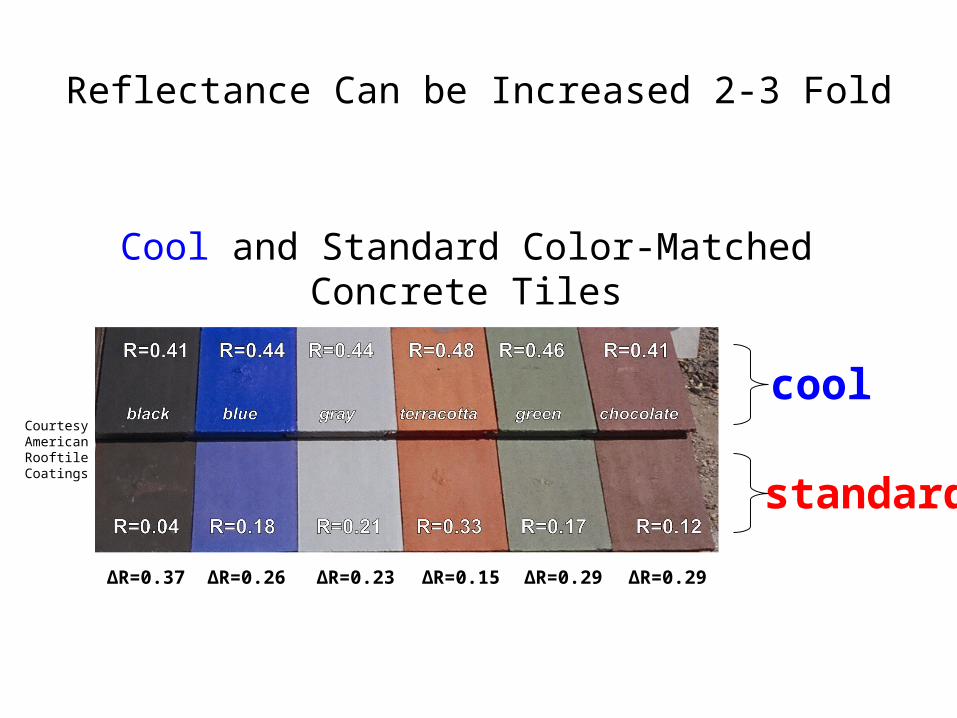
Reflectance Can be Increased 2-3 Fold
Cool and Standard Color-Matched Concrete Tiles
cool
standard
∆R=0.37 ∆R=0.29∆R=0.15∆R=0.23∆R=0.26 ∆R=0.29
CourtesyAmericanRooftile
Coatings
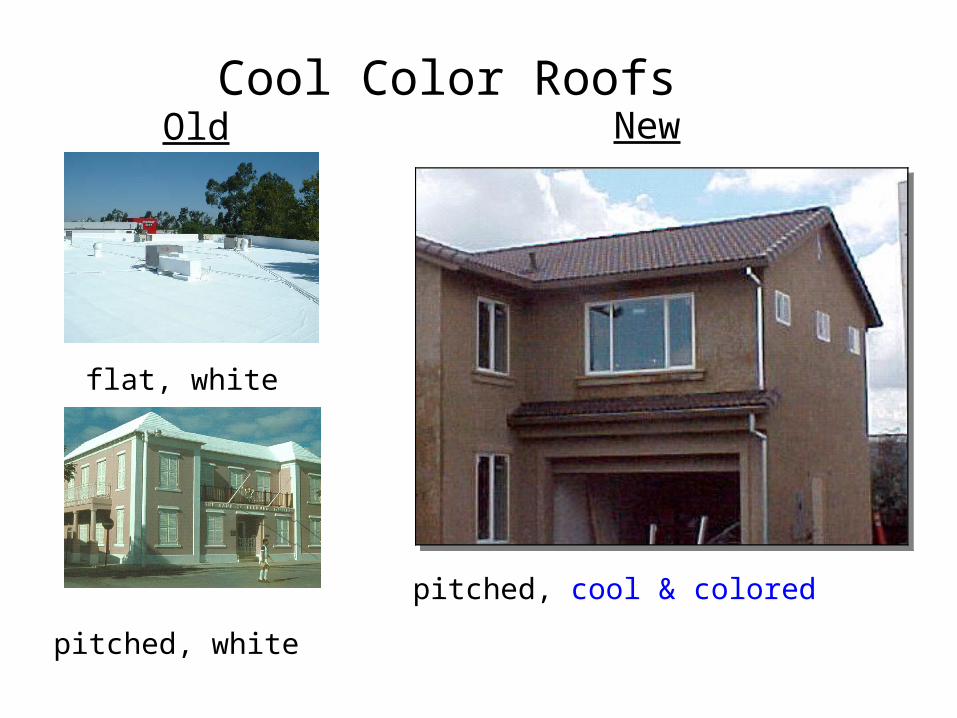
Cool Color Roofs
flat, white
pitched, white
pitched, cool & colored
Old New
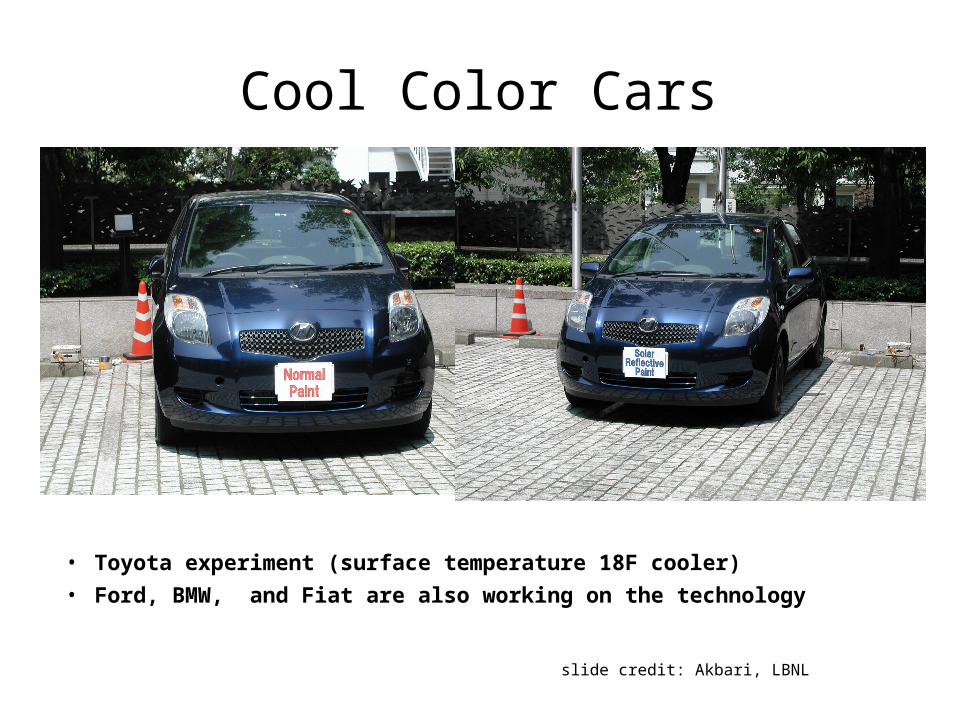
Cool Color Cars
• Toyota experiment (surface temperature 18F cooler)
• Ford, BMW, and Fiat are also working on the technology
slide credit: Akbari, LBNL
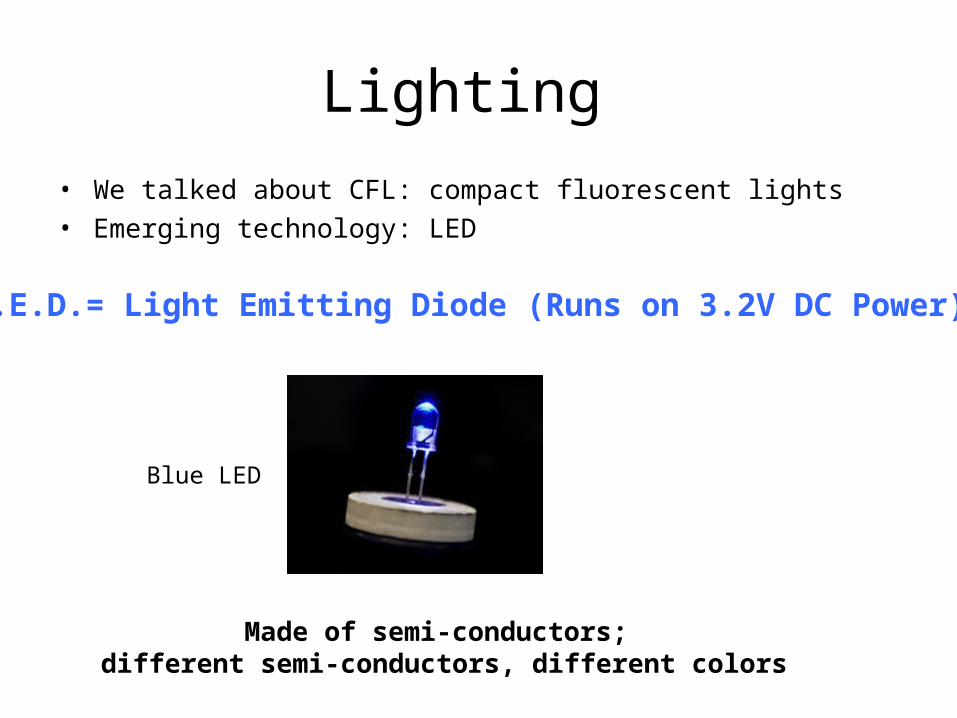
Lighting
• We talked about CFL: compact fluorescent lights• Emerging technology: LED
L.E.D.= Light Emitting Diode (Runs on 3.2V DC Power)
Blue LED
Made of semi-conductors; different semi-conductors, different colors
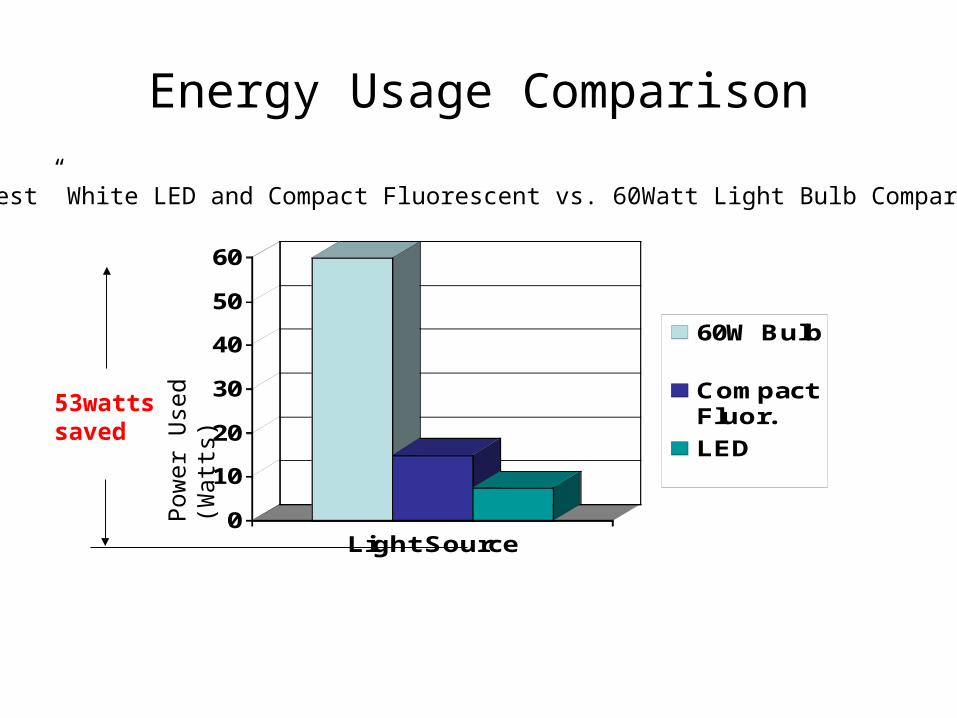
Energy Usage Comparison
0
10
20
30
40
50
60
Light Source
60W Bulb
CompactFluor.
LED
“Best” White LED and Compact Fluorescent vs. 60Watt Light Bulb ComparisonP
ower
Use
d (W
atts
)
53wattssaved
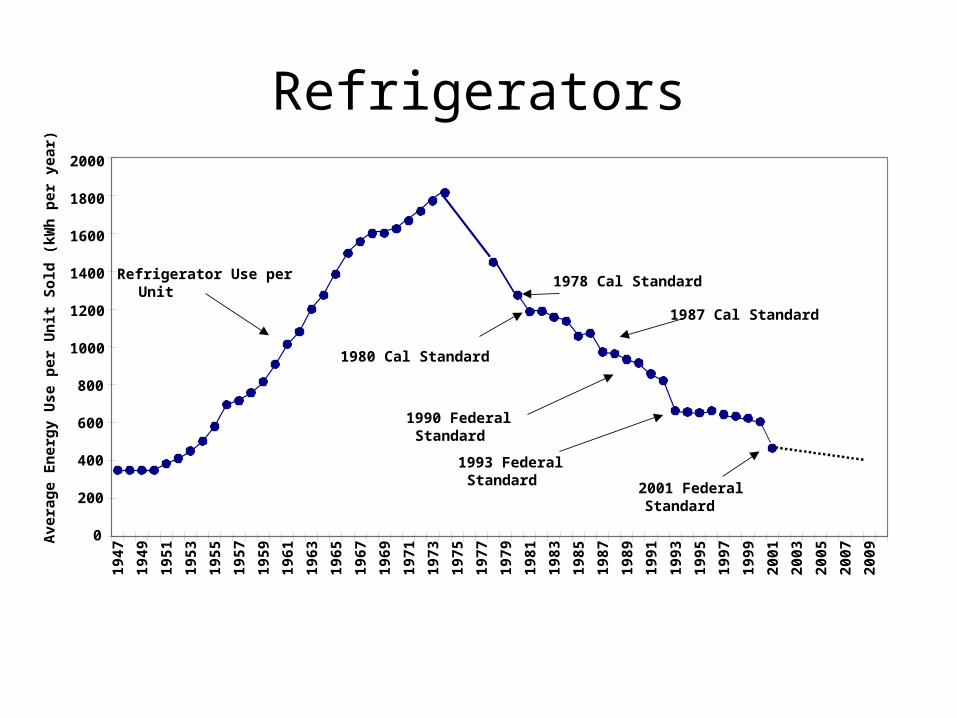
Refrigerators
0
200
400
600
800
1000
1200
1400
1600
1800
2000
1947
1949
1951
1953
1955
1957
1959
1961
1963
1965
1967
1969
1971
1973
1975
1977
1979
1981
1983
1985
1987
1989
1991
1993
1995
1997
1999
2001
2003
2005
2007
2009
Ave
rage
En
ergy
Use
per
Un
it S
old
(k
Wh
per
yea
r)
Refrigerator Use per Unit
1978 Cal Standard
1990 Federal Standard
1987 Cal Standard
1980 Cal Standard
1993 Federal Standard 2001 Federal
Standard
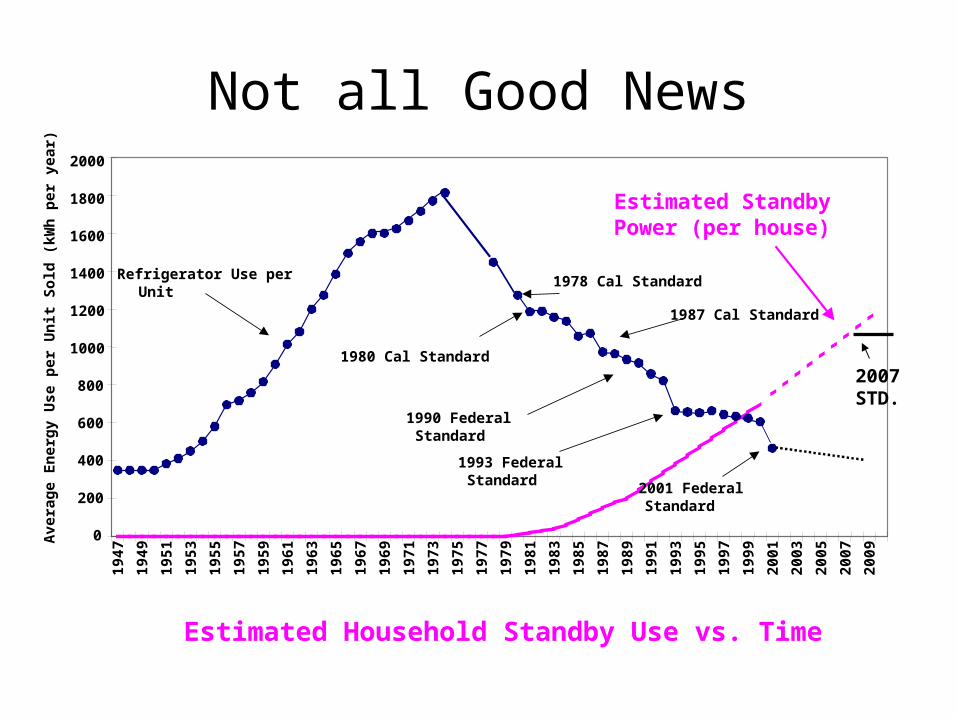
Not all Good News
0
200
400
600
800
1000
1200
1400
1600
1800
2000
1947
1949
1951
1953
1955
1957
1959
1961
1963
1965
1967
1969
1971
1973
1975
1977
1979
1981
1983
1985
1987
1989
1991
1993
1995
1997
1999
2001
2003
2005
2007
2009
Ave
rage
En
ergy
Use
per
Un
it S
old
(k
Wh
per
yea
r)
Refrigerator Use per Unit
1978 Cal Standard
1990 Federal Standard
1987 Cal Standard
1980 Cal Standard
1993 Federal Standard 2001 Federal
Standard
Estimated Standby Power (per house)
2007 STD.
Estimated Household Standby Use vs. Time
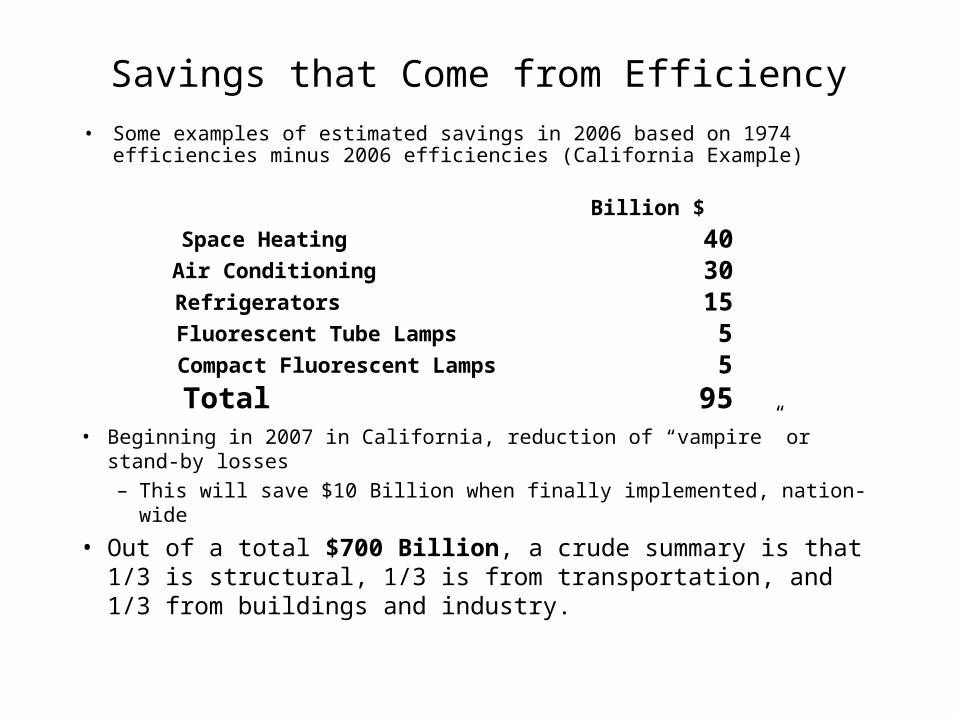
Savings that Come from Efficiency
• Some examples of estimated savings in 2006 based on 1974 efficiencies minus 2006 efficiencies (California Example)
• Beginning in 2007 in California, reduction of “vampire” or stand-by losses– This will save $10 Billion when finally implemented, nation-wide
• Out of a total $700 Billion, a crude summary is that 1/3 is structural, 1/3 is from transportation, and 1/3 from buildings and industry.
Billion $
Space Heating 40Air Conditioning 30Refrigerators 15Fluorescent Tube Lamps 5Compact Fluorescent Lamps 5Total 95

Office hours today: 1:30-2:30
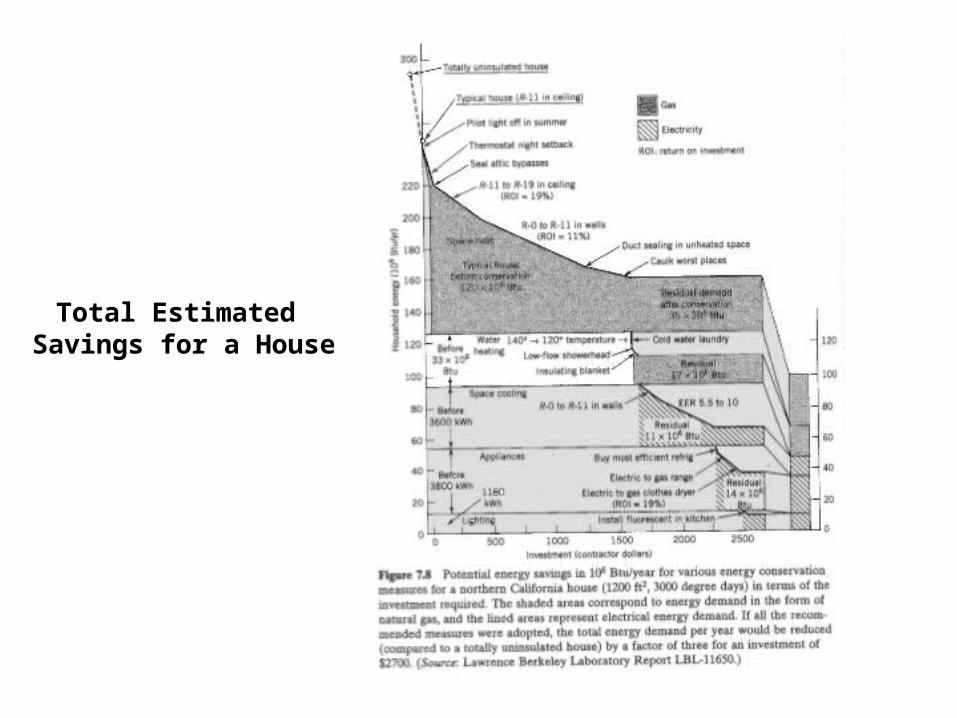
Total Estimated Savings for a House
Energy Conservation
• Technical advances
• Government Policy measures: local and federal
• Consumer Education and Attitude
• Discussion so far: What can technology do for you?
• Now: What can YOU do for energy conservation?
Energy Conscious Attitude
• REDUCE
• REUSE
• RECYCLE
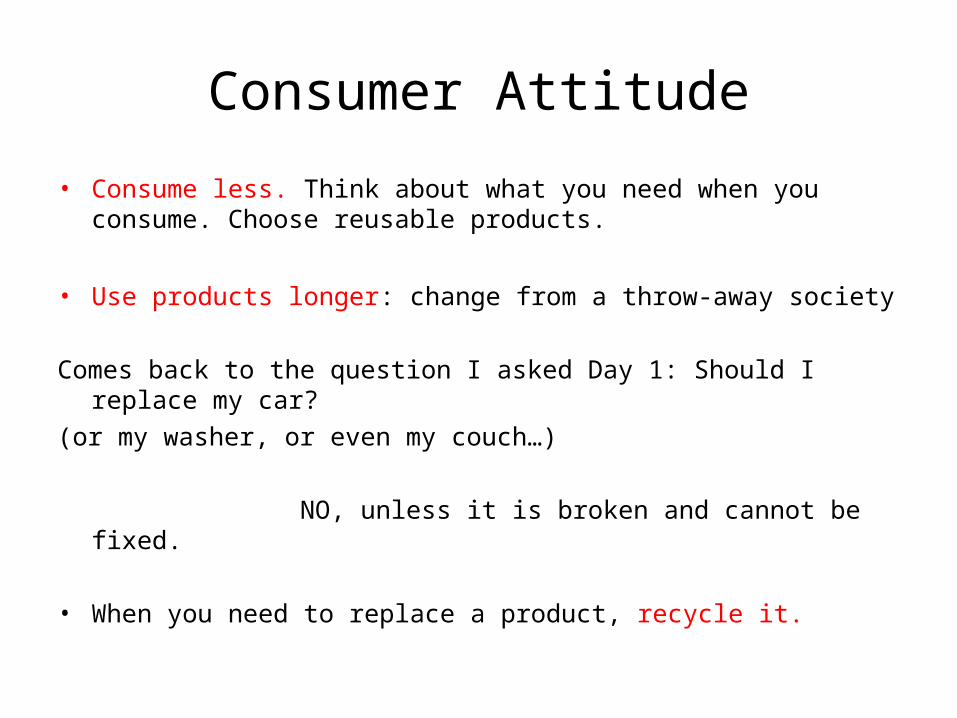
Consumer Attitude
• Consume less. Think about what you need when you consume. Choose reusable products.
• Use products longer: change from a throw-away society
Comes back to the question I asked Day 1: Should I replace my car?
(or my washer, or even my couch…)
NO, unless it is broken and cannot be fixed.
• When you need to replace a product, recycle it.
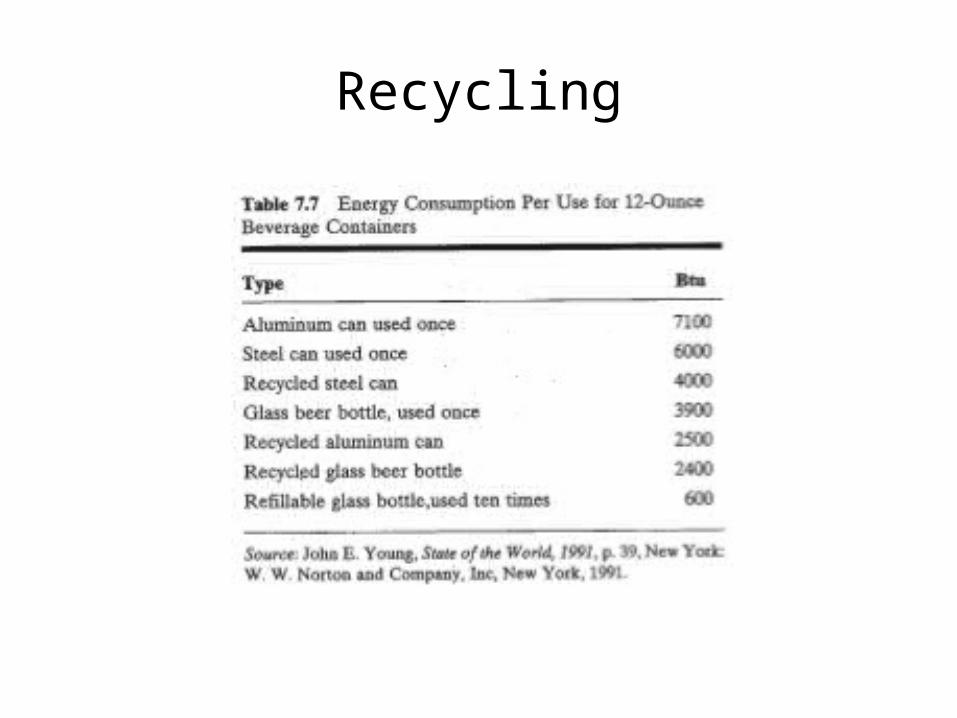
Recycling
Reduce, Reuse, Recycle
We’ll watch a short movie: “The Story of Stuff” by Annie Leonard
Planned Obsolescence
• From Wikipedia: Sloan is credited with establishing annual styling changes, from which came the concept of planned obsolescence. He also established a pricing structure in which (from lowest to highest priced) Chevrolet, Pontiac, Oldsmobile, Buick and Cadillac referred to as the ladder of success did not compete with each other, and buyers could be kept in the GM "family" as their buying power and preferences changed as they aged.
U.S. Energy Plan
California Energy Action Plan of 2003:
1. Energy efficiency and Demand Response
2. Renewable Generation,
3. Increased development of affordable & reliable conventional generation
4. Transmission expansion to support all of California’s energy goals.
The U.S. Energy Plan needs to emulate this.
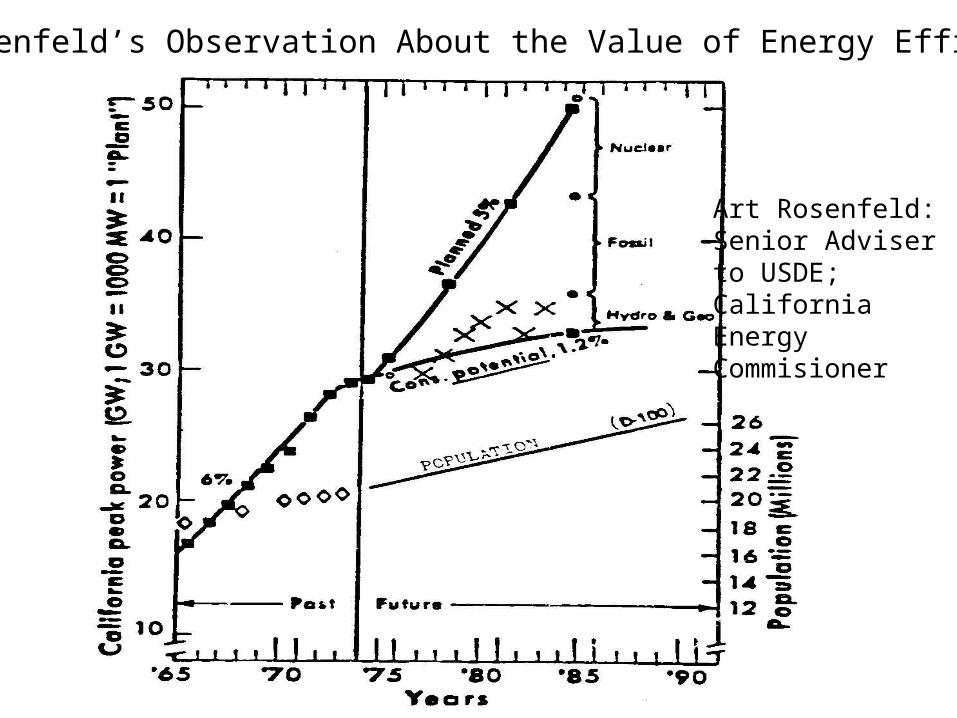
Art Rosenfeld’s Observation About the Value of Energy Efficiency
Art Rosenfeld:Senior Adviser to USDE; California Energy Commisioner
“NEGAWATTS”
• Negawatt revolution: From Megawatts to Negawatts
• You get the most financial benefit from saving electricity, as well as the most environmental benefit.
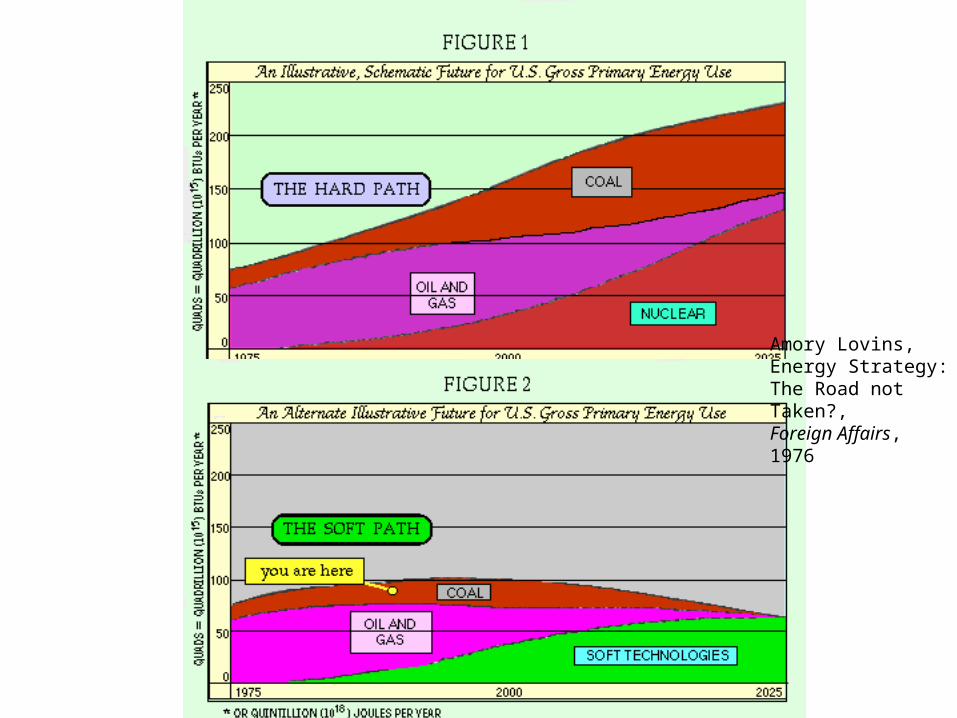
Amory Lovins,Energy Strategy: The Road not Taken?,Foreign Affairs, 1976
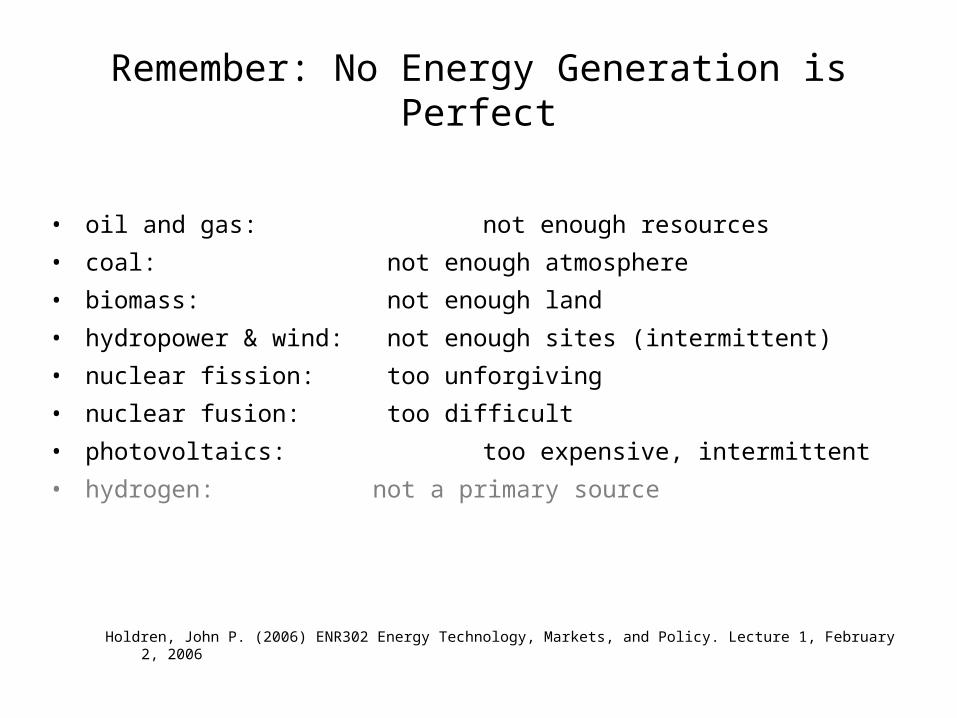
Remember: No Energy Generation is Perfect
• oil and gas: not enough resources
• coal: not enough atmosphere
• biomass: not enough land
• hydropower & wind: not enough sites (intermittent)
• nuclear fission: too unforgiving
• nuclear fusion: too difficult
• photovoltaics: too expensive, intermittent
• hydrogen: not a primary source
Holdren, John P. (2006) ENR302 Energy Technology, Markets, and Policy. Lecture 1, February 2, 2006
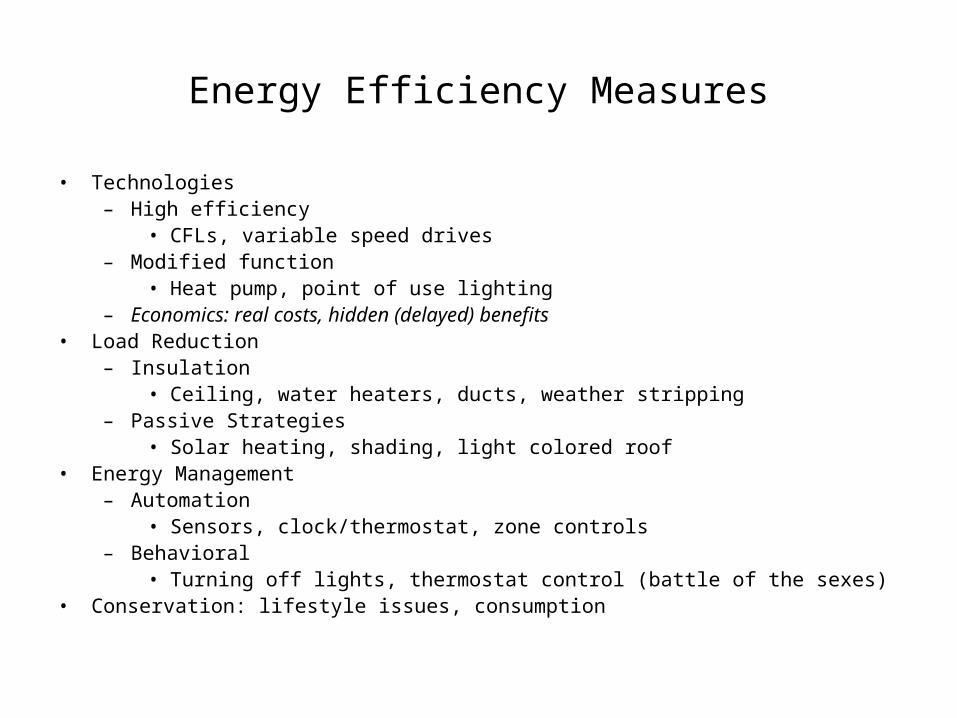
Energy Efficiency Measures
• Technologies– High efficiency
• CFLs, variable speed drives– Modified function
• Heat pump, point of use lighting– Economics: real costs, hidden (delayed) benefits
• Load Reduction– Insulation
• Ceiling, water heaters, ducts, weather stripping– Passive Strategies
• Solar heating, shading, light colored roof• Energy Management
– Automation• Sensors, clock/thermostat, zone controls
– Behavioral• Turning off lights, thermostat control (battle of the sexes)
• Conservation: lifestyle issues, consumption

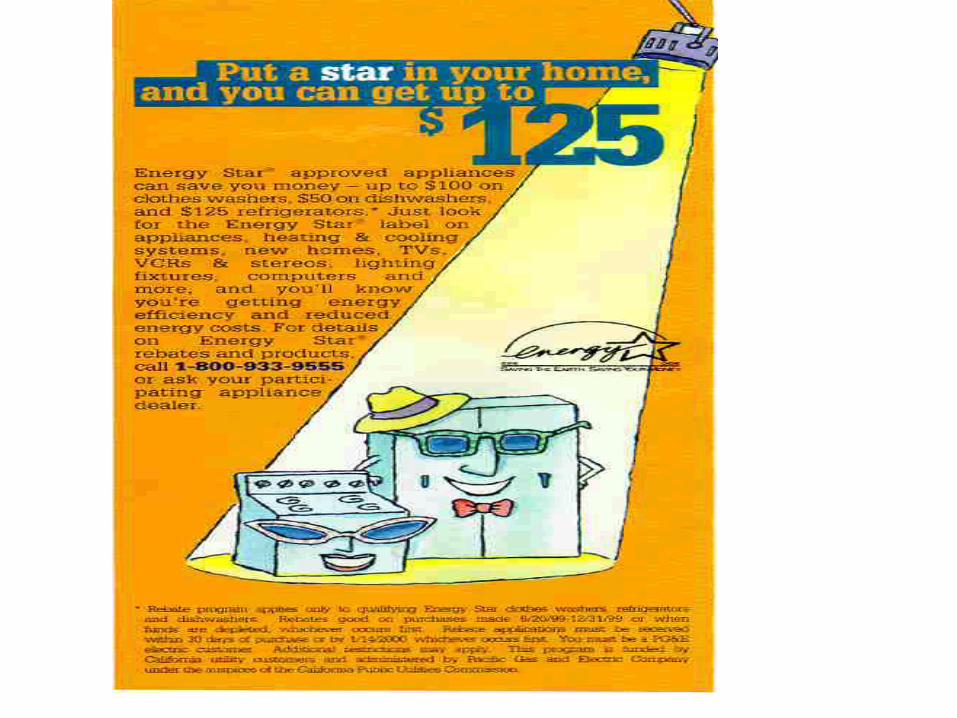
ENERGY STAR-labeled products
Clothes WashersDishwashersRefrigeratorsRoom Air ConditionersTVs, VCRs, Audio EquipmentHome Heating and Cooling Products New Homes Windows Residential Lighting FixturesRoof Products Insulation
Exit Signs Office EquipmentTransformersRoof Products InsulationCommercial Buildings
Residential Commercial
See http://www.energystar.gov/ for more details
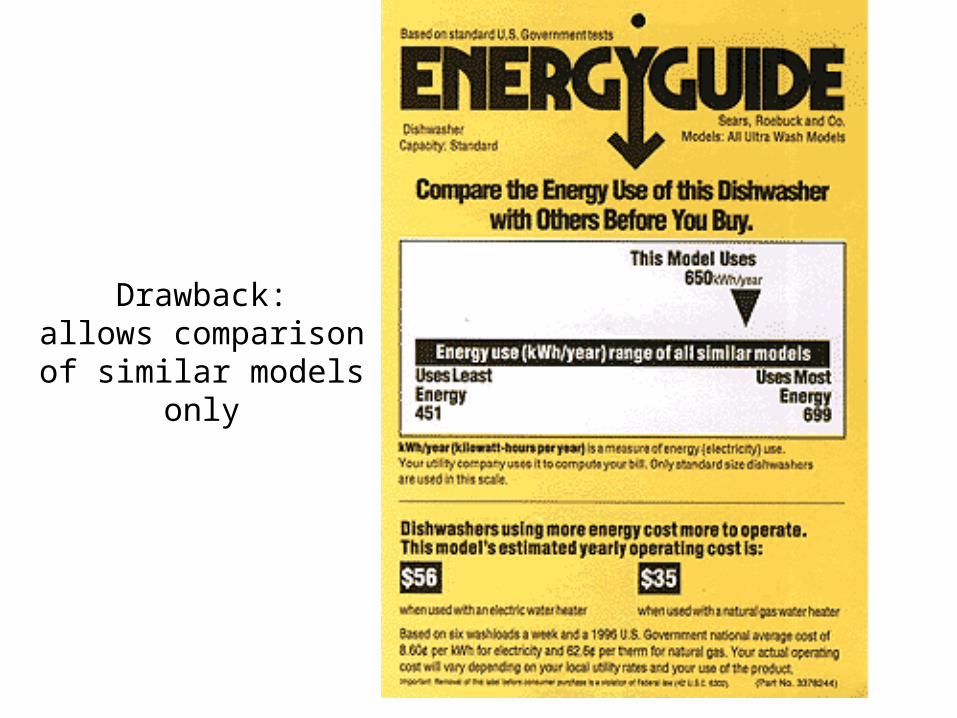
Drawback:allows comparisonof similar models
only