energy modelling in gabi - life cycle assessment lca ...€¢input options of the hydro power...
TRANSCRIPT
Energy modelling in GaBi
PE INTERNATIONAL AG

Agenda
1. Overview electricity model
2. Individual modules – energy
carriers
3. Individual modules – energy
conversion
4. Electricity mixes

Overview
electricity model
3
Overview electricity model
4
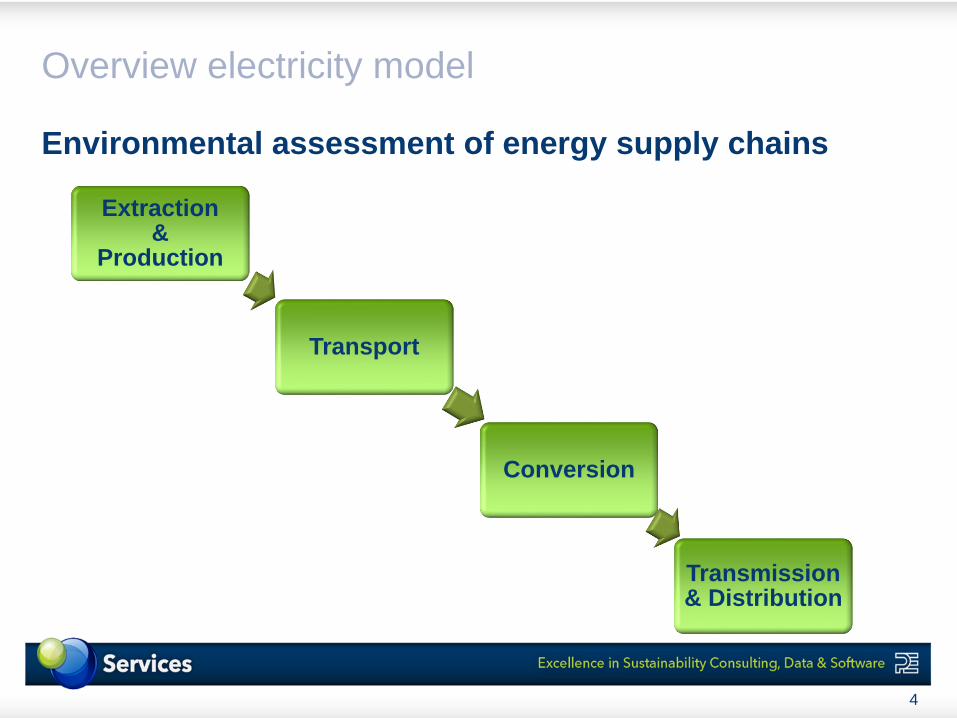
Extraction &
Production
Transport
Conversion
Transmission & Distribution
Environmental assessment of energy supply chains
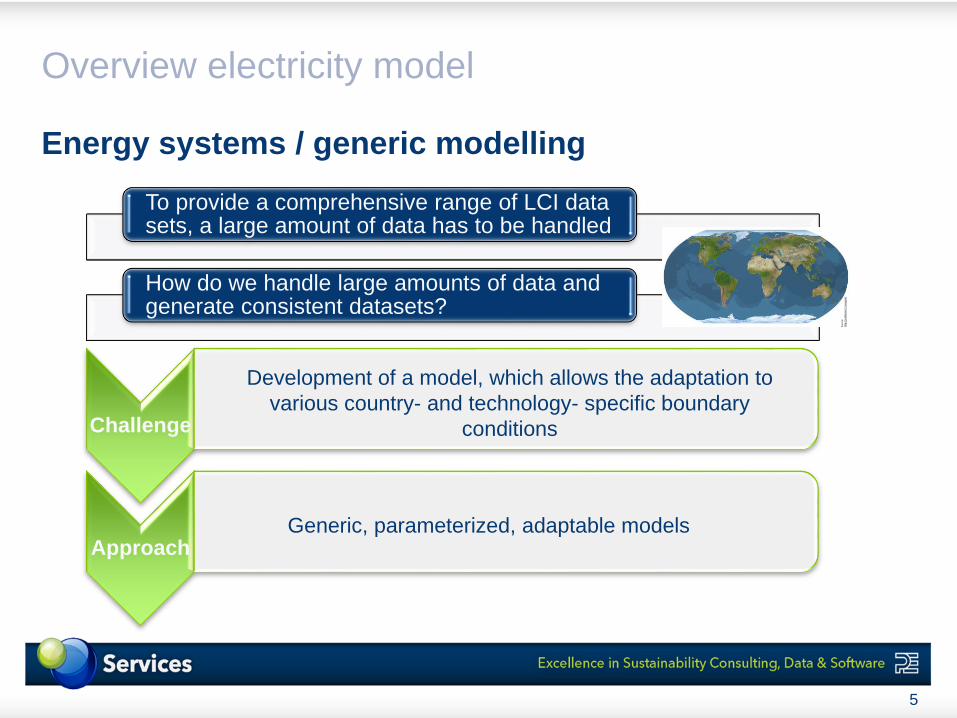
Energy systems / generic modelling
Overview electricity model
5
To provide a comprehensive range of LCI data sets, a large amount of data has to be handled
How do we handle large amounts of data and generate consistent datasets?
Challenge
Approach
Development of a model, which allows the adaptation to
various country- and technology- specific boundary
conditions
Generic, parameterized, adaptable models
Source:
http://visibleearth.nasa.gov/
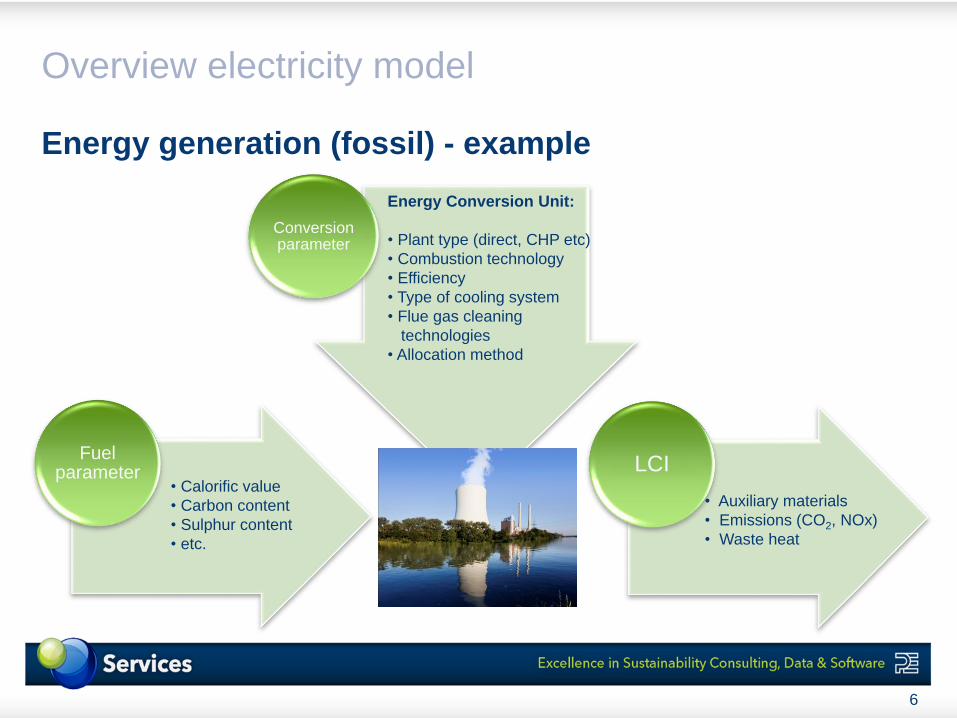
Energy generation (fossil) - example
Overview electricity model
6
Fuel parameter
• Calorific value
• Carbon content
• Sulphur content
• etc.
LCI
• Auxiliary materials
• Emissions (CO2, NOx)
• Waste heat
Conversionparameter
Energy Conversion Unit:
• Plant type (direct, CHP etc)
• Combustion technology
• Efficiency
• Type of cooling system
• Flue gas cleaning
technologies
• Allocation method
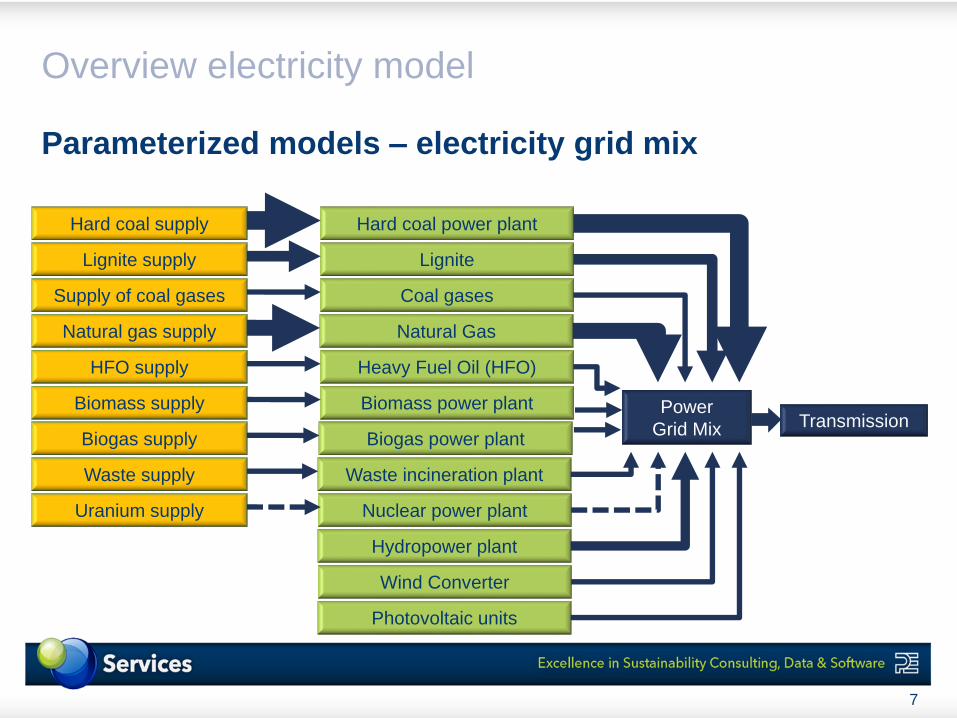
Parameterized models – electricity grid mix
Overview electricity model
7
TransmissionPower
Grid Mix
Hard coal power plant
Lignite
Coal gases
Heavy Fuel Oil (HFO)
Natural Gas
Biomass power plant
Biogas power plant
Waste incineration plant
Photovoltaic units
Wind Converter
Nuclear power plant
Hydropower plant
Supply of coal gases
Natural gas supply
Uranium supply
Biogas supply
Waste supply
HFO supply
Biomass supply
Hard coal supply
Lignite supply

Parameterized models – electricity grid mix
Overview electricity model
8
Hard coal
(Country A)Hard coal
(Country A) Hard coal
power plant Tra
nsm
issio
n
Imported Electricity
System boundary
Energy carrier
production
Electricity conversion
(production & transmission)Energy carrier transport
and mix
Hard coal
Country A
Natural gas
power plant
Transports
(Country A)
Natural Gas
(Country A)Natural Gas
(Country A)Natural Gas
Country A
Transports
(Country A)
TransportTransport
Country An
TransportTransport
Country An
.........
Mix
Mix
• Generic models offer the adaptability to various country and boundary conditions micro, macro and global level
• Results are comparable due to consistent approach and system boundaries
• Allows comprehensive LCI, LCIA, carbon footprint and water footprint analysis
• Complex models with a large amount of data, but reduced number of key parameters are easy to manage and adapt
• High quality data with acceptable time effort reduces costs
• Supports scenario modeling and outlooks
• Creating, maintaining and updating the GaBi databases since 1990
Conclusions
Overview electricity model
9

Individual
modules –
energy carriers
10
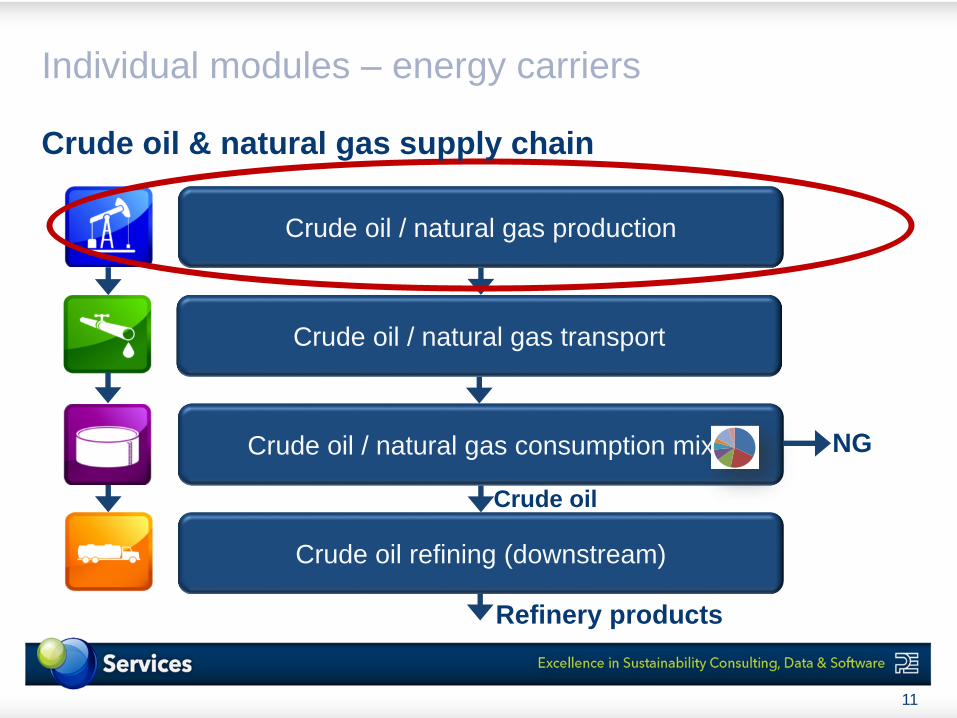
Individual modules – energy carriers
11
Crude oil / natural gas production
Crude oil / natural gas transport
Crude oil refining (downstream)
Crude oil / natural gas consumption mix NG
Refinery products
Crude oil
Crude oil & natural gas supply chain
Individual modules – energy carriers
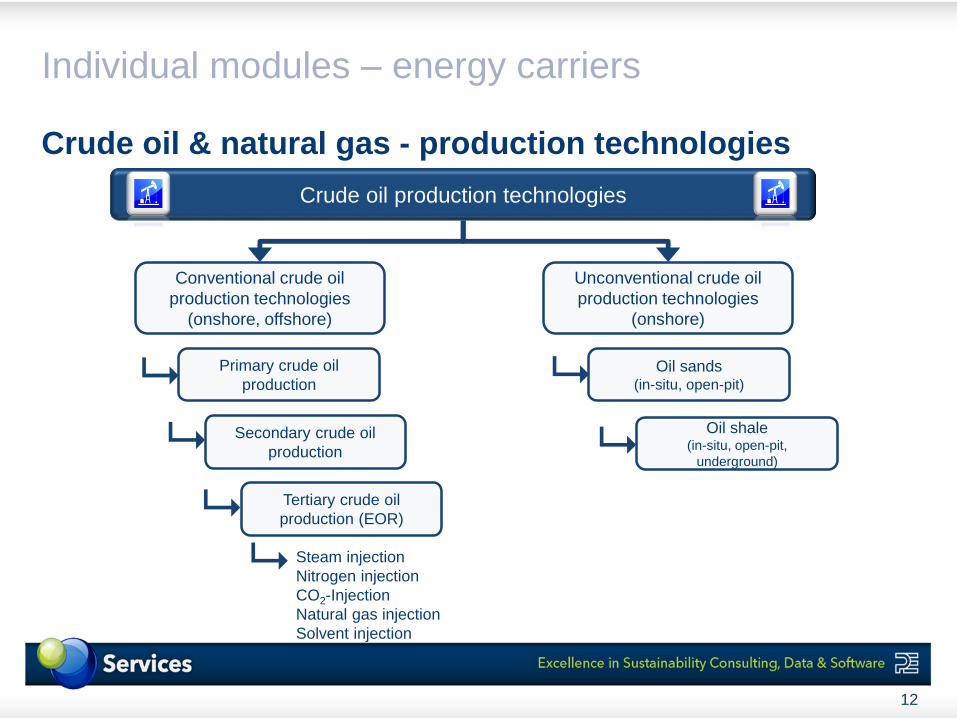
12
Crude oil production technologies
Primary crude oil
production
Secondary crude oil
production
Tertiary crude oil
production (EOR)
Conventional crude oil
production technologies
(onshore, offshore)
Unconventional crude oil
production technologies
(onshore)
Oil sands(in-situ, open-pit)
Oil shale(in-situ, open-pit,
underground)
Steam injection
Nitrogen injection
CO2-Injection
Natural gas injection
Solvent injection
Crude oil & natural gas - production technologies
Individual modules – energy carriers
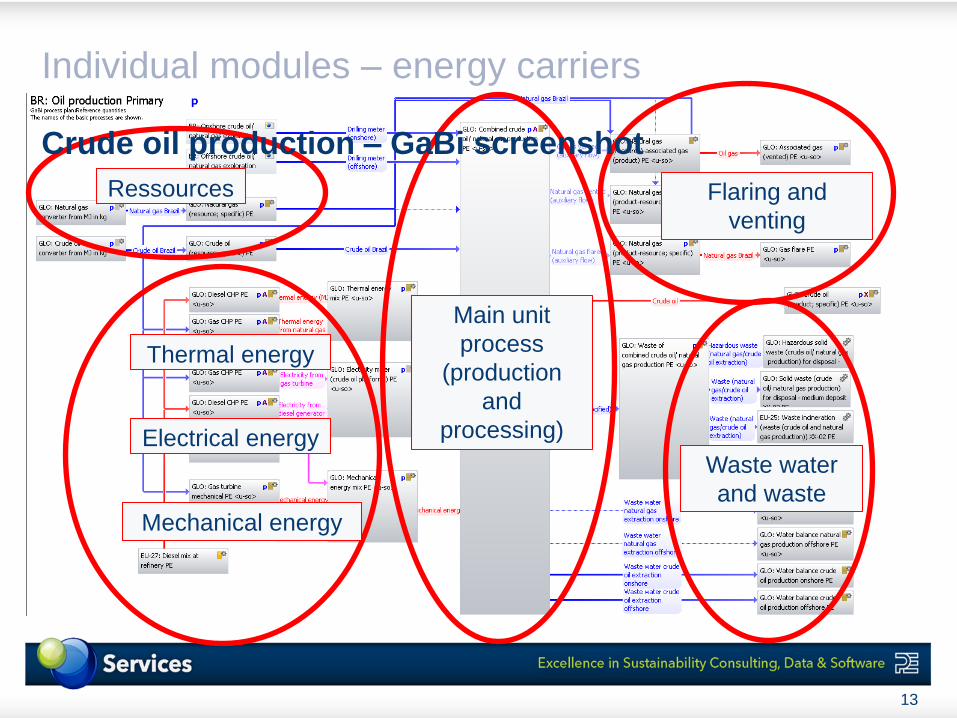
13
Mechanical energy
Thermal energy
Electrical energy
Flaring and
venting
Ressources
Waste water
and waste
Main unit
process
(production
and
processing)
Crude oil production – GaBi screenshot
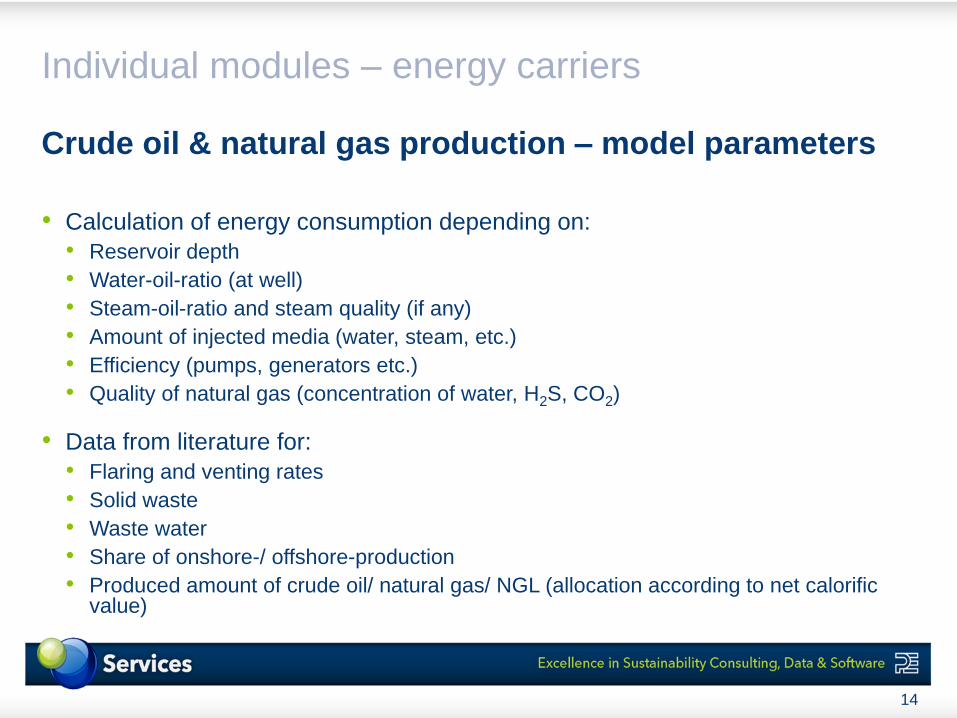
• Calculation of energy consumption depending on:
• Reservoir depth
• Water-oil-ratio (at well)
• Steam-oil-ratio and steam quality (if any)
• Amount of injected media (water, steam, etc.)
• Efficiency (pumps, generators etc.)
• Quality of natural gas (concentration of water, H2S, CO2)
• Data from literature for:
• Flaring and venting rates
• Solid waste
• Waste water
• Share of onshore-/ offshore-production
• Produced amount of crude oil/ natural gas/ NGL (allocation according to net calorific value)
Crude oil & natural gas production – model parameters
Individual modules – energy carriers
14
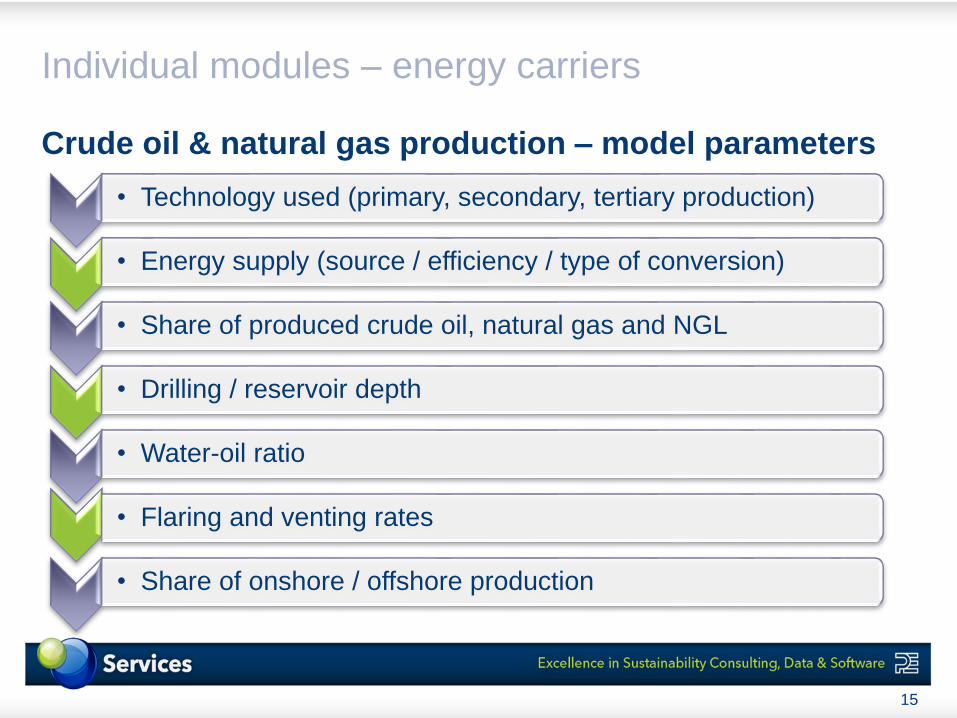
Crude oil & natural gas production – model parameters
Individual modules – energy carriers
15
• Technology used (primary, secondary, tertiary production)
• Energy supply (source / efficiency / type of conversion)
• Share of produced crude oil, natural gas and NGL
• Drilling / reservoir depth
• Water-oil ratio
• Flaring and venting rates
• Share of onshore / offshore production
Individual modules – energy carriers
16
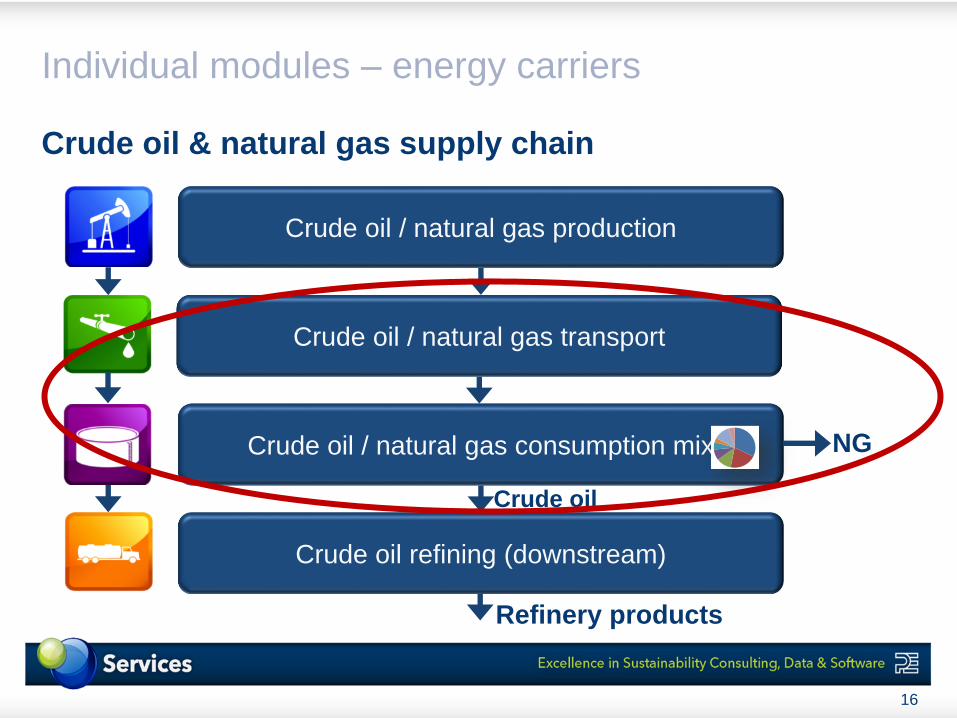
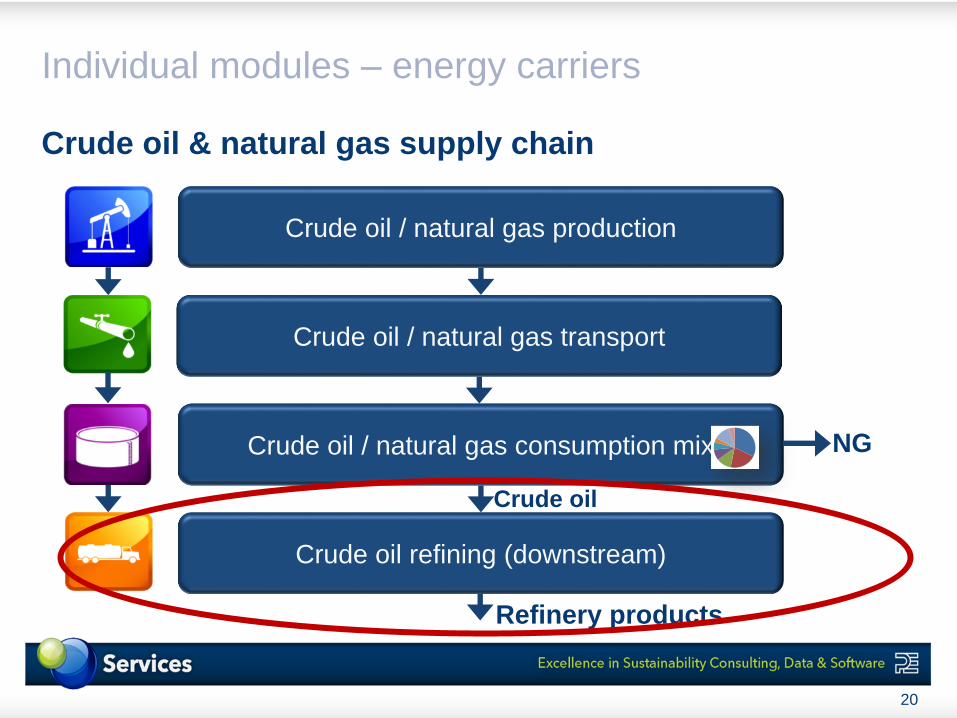
Crude oil / natural gas production
Crude oil / natural gas transport
Crude oil refining (downstream)
Crude oil / natural gas consumption mix NG
Refinery products
Crude oil
Crude oil & natural gas supply chain
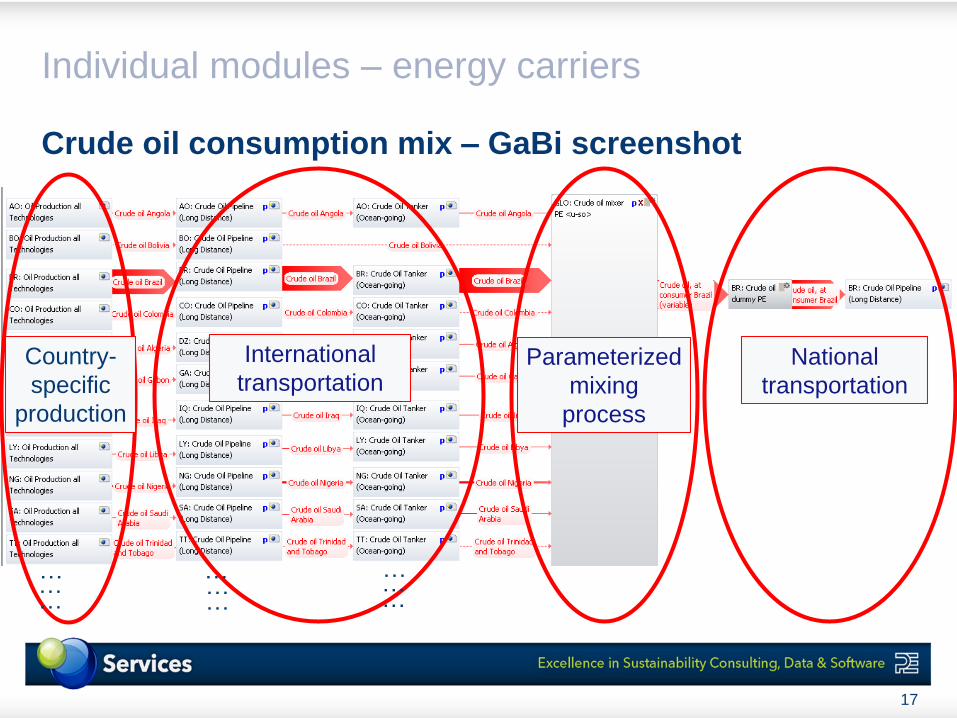
Crude oil consumption mix – GaBi screenshot
Individual modules – energy carriers
17
Country-
specific
production
International
transportationParameterized
mixing
process
National
transportation
………
……
………
…
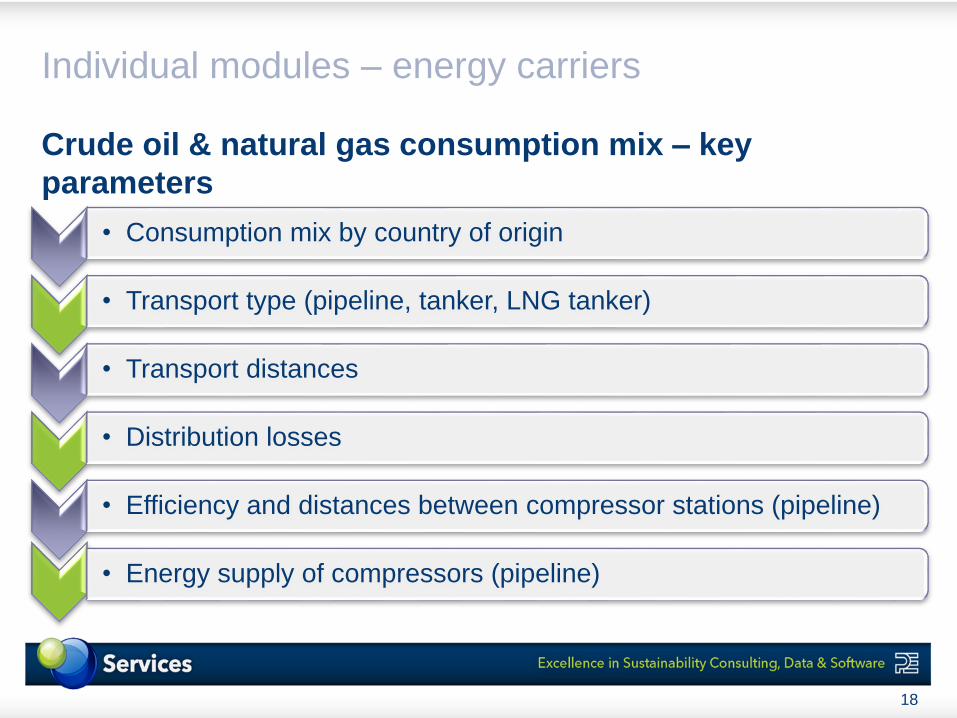
Crude oil & natural gas consumption mix – key
parameters
Individual modules – energy carriers
18
• Consumption mix by country of origin
• Transport type (pipeline, tanker, LNG tanker)
• Transport distances
• Distribution losses
• Efficiency and distances between compressor stations (pipeline)
• Energy supply of compressors (pipeline)
• Mix information based on International Energy Agency (IEA)
statistics
• Transport distance from literature and web calculators
• Tanker vessel and pipeline models in GaBi
Crude oil & natural gas consumption mix - main data
sources
Individual modules – energy carriers
19
Individual modules – energy carriers
20
Crude oil / natural gas production
Crude oil / natural gas transport
Crude oil refining (downstream)
Crude oil / natural gas consumption mix NG
Refinery products
Crude oil
Crude oil & natural gas supply chain
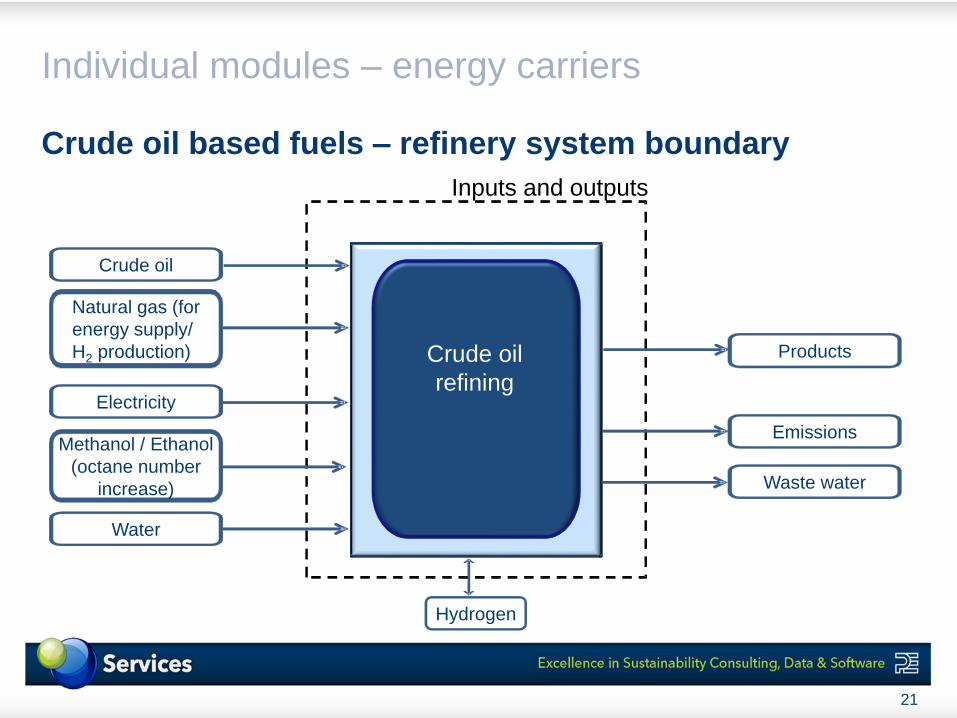
Crude oil based fuels – refinery system boundary
Individual modules – energy carriers
21
Crude oil
Natural gas (for
energy supply/
H2 production)
Methanol / Ethanol
(octane number
increase)
Electricity
Water
Crude oil
refining
Products
Emissions
Waste water
Hydrogen
Inputs and outputs
• Petroleum refineries are complex plants.
• The combination and sequence of the processes is usually very specific to the characteristics of the crude oil and the products to be manufactured.
• Due to the interlinkages within the refinery, all refinery products have to be considered.
• What technologies and processes are used within the refinery?
• Possible approaches regarding level of detail of analysis:
• Refinery as black box model
• Detailed refinery analysis (every single process)
• Hybrid approach
• Level of detail in dependency of scope, level of data availability, etc.
Every refinery is individual
Crude oil based fuels – refinery system boundary
Individual modules – energy carriers
22
Individual modules – energy carriers
23
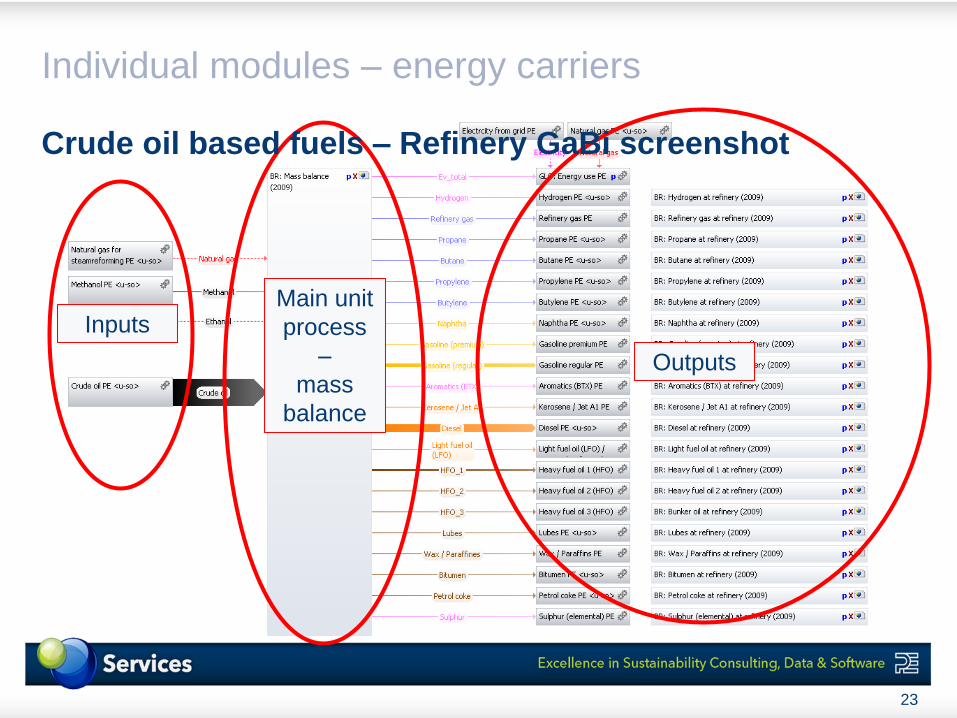
Inputs
Outputs
Main unit
process
–
mass
balance
Crude oil based fuels – Refinery GaBi screenshot
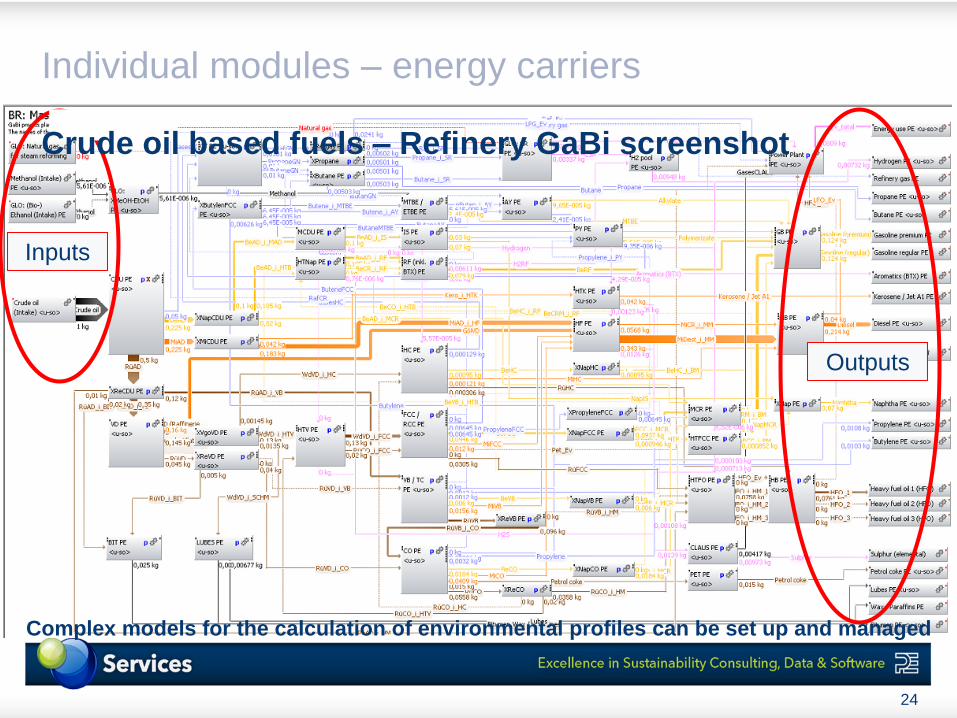
Inputs
Outputs
Complex models for the calculation of environmental profiles can be set up and managed
Individual modules – energy carriers
24
Crude oil based fuels – Refinery GaBi screenshot
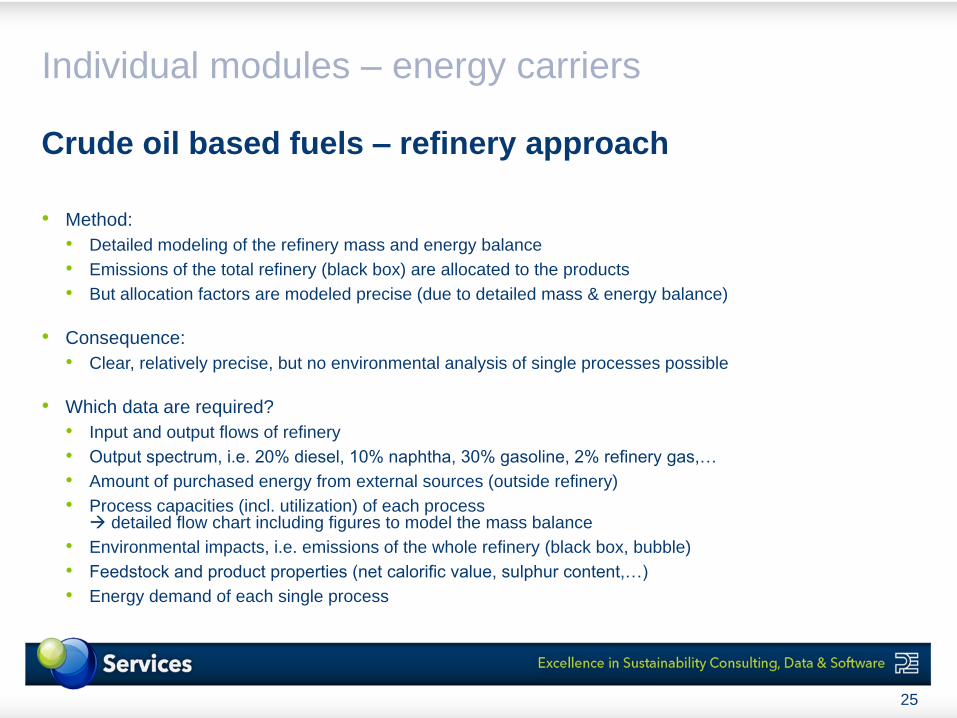
• Method:
• Detailed modeling of the refinery mass and energy balance
• Emissions of the total refinery (black box) are allocated to the products
• But allocation factors are modeled precise (due to detailed mass & energy balance)
• Consequence:
• Clear, relatively precise, but no environmental analysis of single processes possible
• Which data are required?
• Input and output flows of refinery
• Output spectrum, i.e. 20% diesel, 10% naphtha, 30% gasoline, 2% refinery gas,…
• Amount of purchased energy from external sources (outside refinery)
• Process capacities (incl. utilization) of each process detailed flow chart including figures to model the mass balance
• Environmental impacts, i.e. emissions of the whole refinery (black box, bubble)
• Feedstock and product properties (net calorific value, sulphur content,…)
• Energy demand of each single process
Crude oil based fuels – refinery approach
Individual modules – energy carriers
25

Individual modules –energy conversion
26

Hard coal power plant
Individual modules – energy conversion
27
Fuel parameter
• Calorific value
• Carbon content
• Sulphur content
• etc.
LCI
• Auxiliary materials
• Emissions (CO2, NOx)
• Waste heat
Conversionparameter
Energy Conversion Unit:
• Plant type (direct, CHP etc)
• Combustion technology
• Efficiency
• Type of cooling system
• Flue gas cleaning
technologies
• Allocation method
28
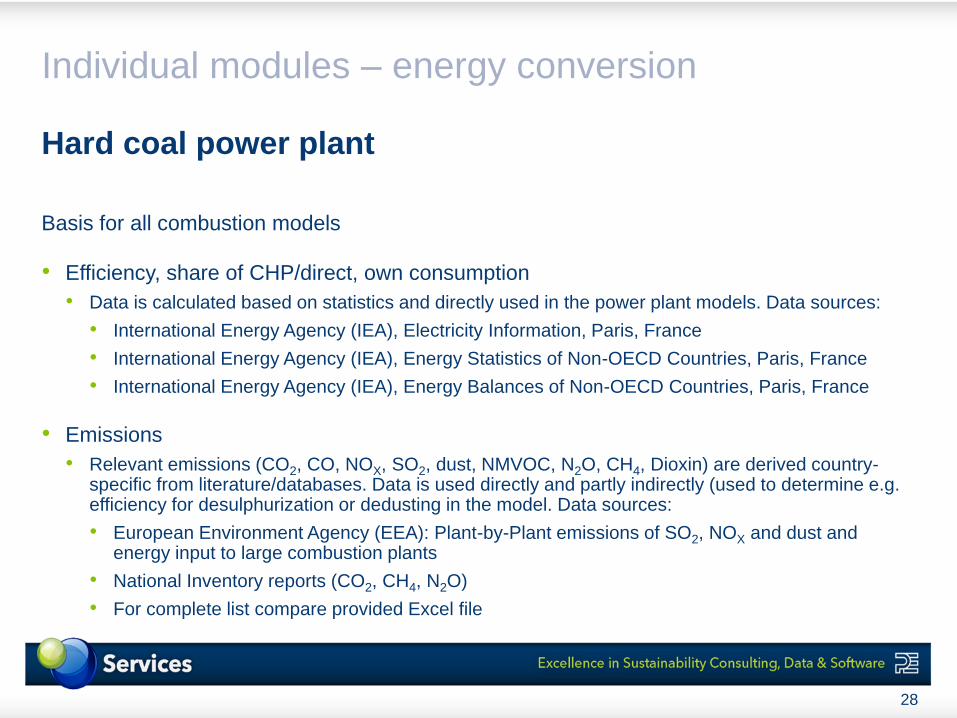
Basis for all combustion models
• Efficiency, share of CHP/direct, own consumption
• Data is calculated based on statistics and directly used in the power plant models. Data sources:
• International Energy Agency (IEA), Electricity Information, Paris, France
• International Energy Agency (IEA), Energy Statistics of Non-OECD Countries, Paris, France
• International Energy Agency (IEA), Energy Balances of Non-OECD Countries, Paris, France
• Emissions
• Relevant emissions (CO2, CO, NOX, SO2, dust, NMVOC, N2O, CH4, Dioxin) are derived country-specific from literature/databases. Data is used directly and partly indirectly (used to determine e.g. efficiency for desulphurization or dedusting in the model. Data sources:
• European Environment Agency (EEA): Plant-by-Plant emissions of SO2, NOX and dust and energy input to large combustion plants
• National Inventory reports (CO2, CH4, N2O)
• For complete list compare provided Excel file
Hard coal power plant
Individual modules – energy conversion
29
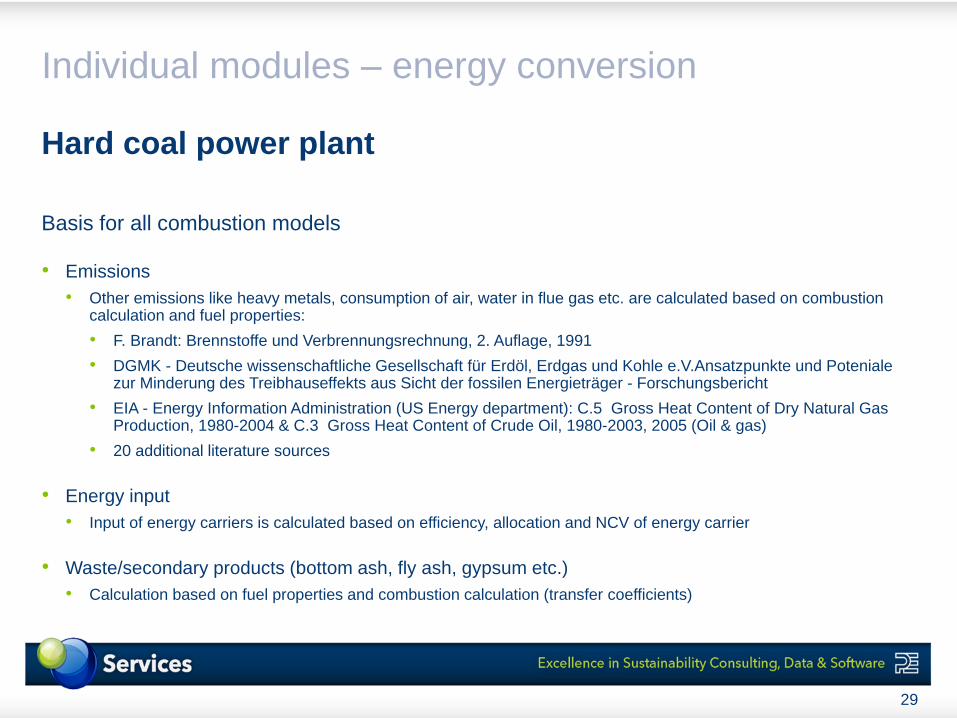
Basis for all combustion models
• Emissions
• Other emissions like heavy metals, consumption of air, water in flue gas etc. are calculated based on combustion calculation and fuel properties:
• F. Brandt: Brennstoffe und Verbrennungsrechnung, 2. Auflage, 1991
• DGMK - Deutsche wissenschaftliche Gesellschaft für Erdöl, Erdgas und Kohle e.V.Ansatzpunkte und Potenialezur Minderung des Treibhauseffekts aus Sicht der fossilen Energieträger - Forschungsbericht
• EIA - Energy Information Administration (US Energy department): C.5 Gross Heat Content of Dry Natural Gas Production, 1980-2004 & C.3 Gross Heat Content of Crude Oil, 1980-2003, 2005 (Oil & gas)
• 20 additional literature sources
• Energy input
• Input of energy carriers is calculated based on efficiency, allocation and NCV of energy carrier
• Waste/secondary products (bottom ash, fly ash, gypsum etc.)
• Calculation based on fuel properties and combustion calculation (transfer coefficients)
Hard coal power plant
Individual modules – energy conversion
30
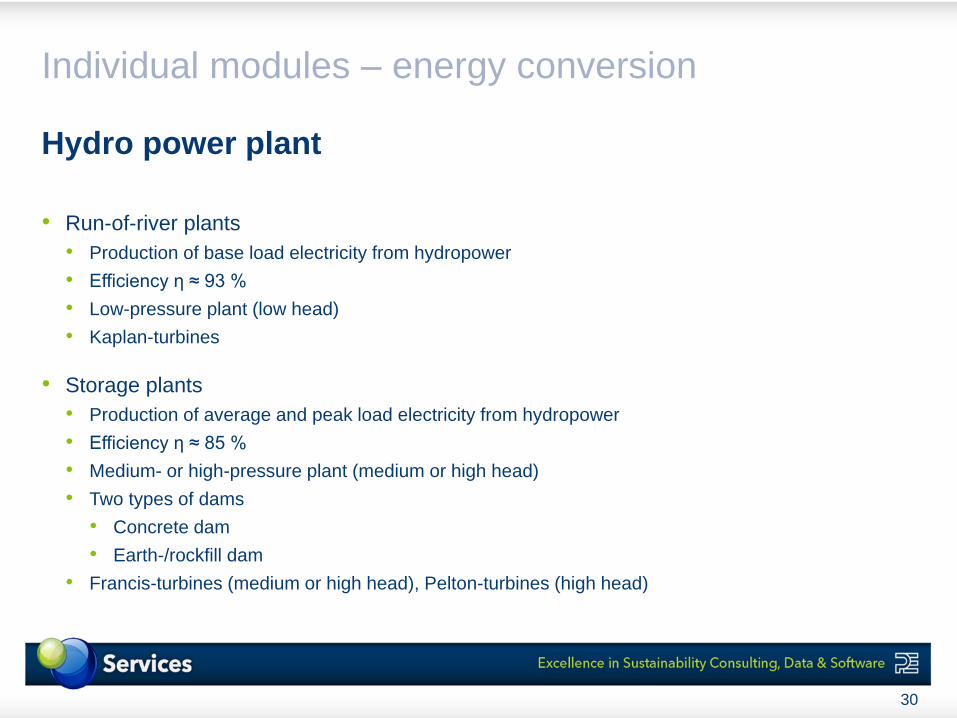
• Run-of-river plants
• Production of base load electricity from hydropower
• Efficiency η ≈ 93 %
• Low-pressure plant (low head)
• Kaplan-turbines
• Storage plants
• Production of average and peak load electricity from hydropower
• Efficiency η ≈ 85 %
• Medium- or high-pressure plant (medium or high head)
• Two types of dams
• Concrete dam
• Earth-/rockfill dam
• Francis-turbines (medium or high head), Pelton-turbines (high head)
Hydro power plant
Individual modules – energy conversion
31
• Pumped storage plants
• Efficiency η ≈ 75 % (storage of base load energy)
• Often combined with storage plants (pumped-storage plants with natural inflow)
• Medium- or high-pressure plant (medium or high head)
• Two types of dams
• Concrete dam
• Earth-/rockfill dam
• Francis-turbines (medium or high head), Pelton-turbines (high head), combined with pumps
Hydro power plant
Individual modules – energy conversion
32
• Greenhouse gas emissions during the operation of run-of-river, storage and pumped-storage plants
• As a result of degradation of biomass in the dammed water depending on
• Climatic boundary conditions
• Climatic cold and moderate regions: Increasing CO2-emissions from aerobic degradation of biomass in the first years of operation, then temporary decreasing within the first 10 years of operation
• Climatic tropical regions: Increasing CH4-emissions from anaerobic degradation of biomass in the first years then slower temporary decreasing, which can be longer than the first 10 years of operation
• Vegetal boundary conditions (amount of inundated biomass)
• Sub polar lea, Cultivated land, Steppe, Boreal forest, Rain forest
• Used values of emissions are arithmetic mean values over 100 years of operation and are based on gross greenhouse gas emissions (problem of absorbed CO2 from atmosphere), net emissions are estimated to be 30 – 50 % lower
• Greenhouse gas emissions of run-of-river plants are minimal since the water is not stored for a long time
Hydro power plant
Individual modules – energy conversion
33
• Input options of the hydro power LCA-models
• Country-specific distribution of electricity production by hydropower [%]
• Country-specific relation between consumed electricity and generated electricity by pumped-
• storage [kWh/kWh]
• Country-specific greenhouse gas emissions from operation [kg CO2 eq. / kWh]
• Plant-specific efficiency [%]
• Country-specific plant life span and life spans of components [a]
• Country-specific share of concrete dams as a part of storage and pumped storage plants [%]
Hydro power plant
Individual modules – energy conversion
34
• Data Source: Vestas EPD, 2006 for 1,65 MW turbine.
• Wind Park with 182 turbines including infrastructure (cables, transformer station)
• Manufacturing considered main components (Foundation, Tower, Nacelle Rotor), transports included
• Use phase: full load hours determined by Power produced from wind from IEA statistics divided by installed capacity from World Wind report
• Maintenance considered according to Vestas data
• End-of-Life: recycling potential for metals, incineration of polymers, foundation not recycled, inert materials to landfill
Wind power plant
Individual modules – energy conversion
Electricity mixes
35
Electricity mixes
36
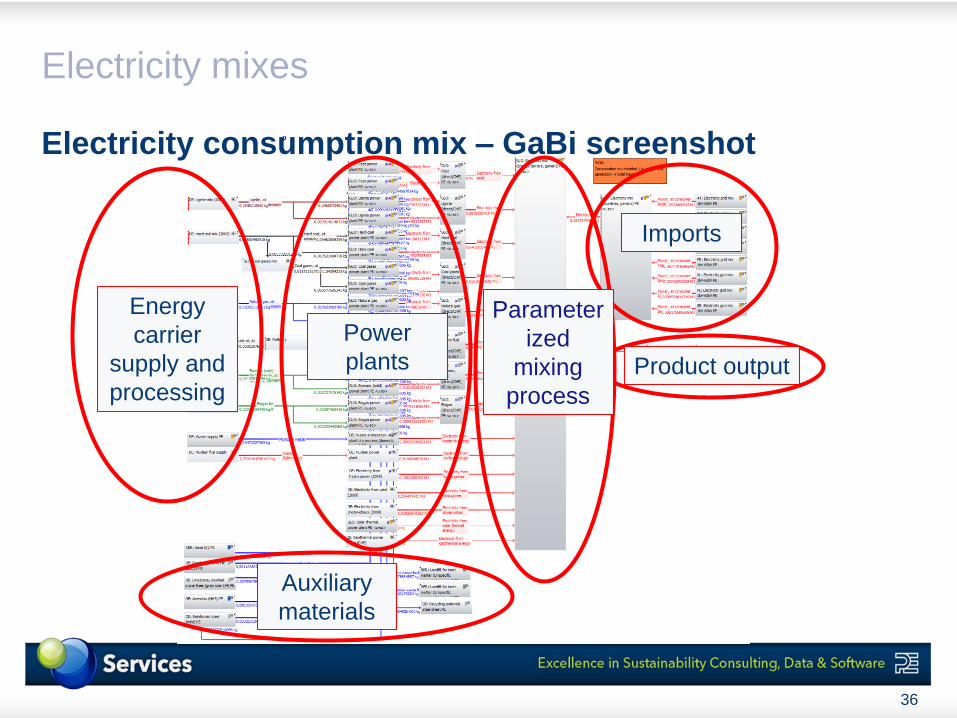
Electricity consumption mix – GaBi screenshot
Imports
Product output
Parameter
ized
mixing
process
Energy
carrier
supply and
processing
Auxiliary
materials
Power
plants
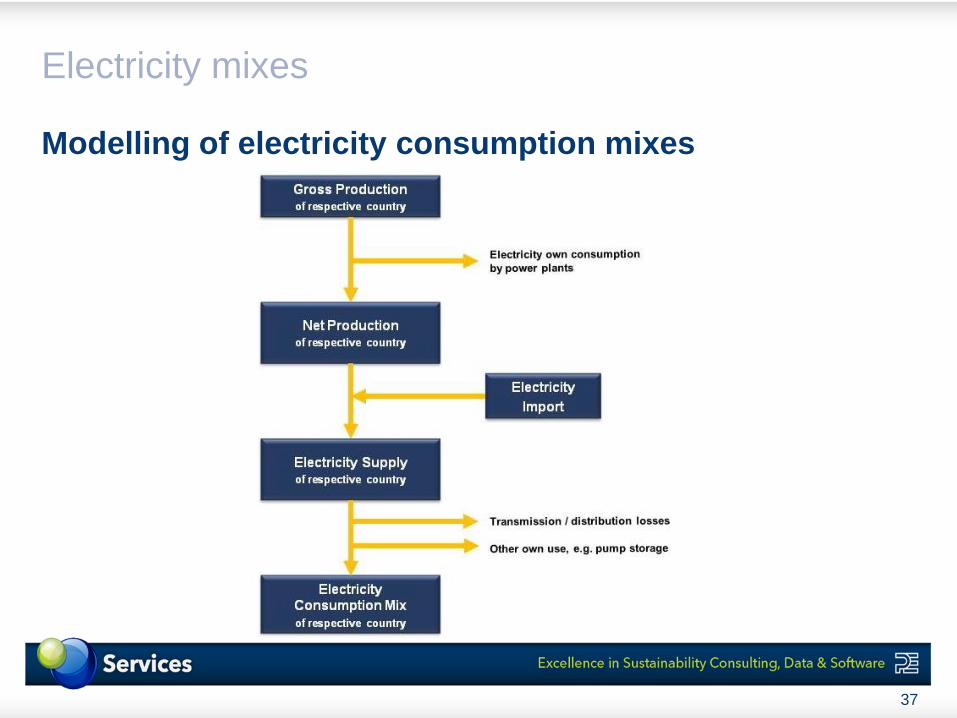
Modelling of electricity consumption mixes
Electricity mixes
37
• Energy mix, net losses, imports (annual average)
• International Energy Agency (IEA), Electricity Information, Paris, France
• International Energy Agency (IEA), Energy Statistics of Non-OECD Countries, Paris, France
• International Energy Agency (IEA), Energy Balances of Non-OECD Countries, Paris, France
• Eurostat: Eurostat Energy Statistics – imports (by country of origin) –
electricity – annual data
• Infrastructure
• FFE München: Ganzheitliche energetische Bilanzierung
Used data - basis for all electricity mixes
Electricity mixes
38
Contact
39
Oliver Schuller (Dr.-Ing.)
Principal Consultant and Team Lead “Oil & Gas” and “Energy & Utilities”
PE INTERNATIONAL
Hauptstrasse 111-113
70771 Leinfelden-Echterdingen
GERMANY
Phone: +49 - 711 341817 20
Fax: +49 - 711 341817 25
E-Mail: [email protected]
Internet: www.pe-international.com