energy expenditure survey and assessment of the … · energy expenditure survey and ... pottery...
TRANSCRIPT
SUSTAINABLE FISHERIES MANAGEMENT PROJECT (SFMP)
Energy Expenditure Survey and Assessment of the Economics of Fish
Processing at Anlo Beach
MAY, 2016
i
This publication is available electronically on the Coastal Resources Center’s website at
http://www.crc.uri.edu/projects_page/ghanasfmp/
For more information on the Ghana Sustainable Fisheries Management Project, contact:
USAID/Ghana Sustainable Fisheries Management Project
Coastal Resources Center
Graduate School of Oceanography
University of Rhode Island
220 South Ferry Rd.
Narragansett, RI 02882 USA
Tel: 401-874-6224 Fax: 401-874-6920 Email: [email protected]
Citation: Kwarteng, E., Nsiah, A.A.H, Aziebor, E. (2016). Energy Expenditure and
Comparative Economics of Fish Processing Techniques Report. The
USAID/Ghana Sustainable Fisheries Management Project (SFMP).
Narragansett, RI: Coastal Resources Center, Graduate School of Oceanography,
University of Rhode Island. GH 2014_ACT076_SNV. 38 pp.
Authority/Disclaimer:
Prepared for USAID/Ghana under Cooperative Agreement (AID-641-A-15-00001), awarded
on October 22, 2014 to the University of Rhode Island, and entitled the USAID/Ghana
Sustainable Fisheries Management Project (SFMP).
This document is made possible by the support of the American People through the United
States Agency for International Development (USAID). The views expressed and opinions
contained in this report are those of the SFMP team and are not intended as statements of
policy of either USAID or the cooperating organizations. As such, the contents of this report
are the sole responsibility of the SFMP team and do not necessarily reflect the views of
USAID or the United States Government.
Cover photo: Heap of fuelwood awaiting bumper season (Credit SNV)
ii
Detailed Partner Contact Information:
USAID/Ghana Sustainable Fisheries Management Project (SFMP) 10 Obodai St., Mempeasem, East Legon, Accra, Ghana
Telephone: +233 0302 542497 Fax: +233 0302 542498
Maurice Knight Chief of Party [email protected]
Kofi Agbogah Senior Fisheries Advisor [email protected]
Nii Odenkey Abbey Communications Officer [email protected]
Bakari Nyari Monitoring and Evaluation Specialist [email protected]
Brian Crawford Project Manager, CRC [email protected]
Justice Odoi USAID Administrative Officer Representative [email protected]
Kofi.Agbogah
Stephen Kankam
Hen Mpoano
38 J. Cross Cole St. Windy Ridge
Takoradi, Ghana
233 312 020 701
Andre de Jager
SNV Netherlands Development Organisation
#161, 10 Maseru Road,
E. Legon, Accra, Ghana
233 30 701 2440
Donkris Mevuta
Kyei Yamoah
Friends of the Nation
Parks and Gardens
Adiembra-Sekondi, Ghana
233 312 046 180
Peter Owusu Donkor
Spatial Solutions
#3 Third Nautical Close,
Nungua, Accra, Ghana
233 020 463 4488
Thomas Buck
SSG Advisors
182 Main Street
Burlington, VT 05401
(802) 735-1162
Victoria C. Koomson
CEWEFIA
B342 Bronyibima Estate
Elmina, Ghana
233 024 427 8377
Lydia Sasu
DAA
Darkuman Junction, Kaneshie Odokor
Highway
Accra, Ghana
233 302 315894
Gifty Asmah
Daasgift Quality Foundation
Headmaster residence, Sekondi College
Sekondi, Western Region, Ghana
233 243 326 178
For additional information on partner activities:
CRC/URI: http://www.crc.uri.edu
CEWEFIA: http://cewefia.weebly.com/
DAA: http://womenthrive.org/development-action-association-daa
Daasgift: https://www.facebook.com/pages/Daasgift-Quality-Foundation-
FNGO/135372649846101
Friends of the Nation: http://www.fonghana.org
Hen Mpoano: http://www.henmpoano.org
SNV: http://www.snvworld.org/en/countries/ghana
SSG Advisors: http://ssg-advisors.com/
Spatial Solutions: http://www.spatialsolutions.co/id1.html
iii
ACRONYMS
Only include acronyms used in the text
CCT Controlled Cooking Test
CEWEFIA Central and Western Region Fishmongers Improvement Association
CR Central Region
CRC Coastal Resources Center at the Graduate School of Oceanography, University
of Rhode Island
CSLP Coastal Sustainable Landscapes Project
DA District Authorities
DAA Development Action Association
DAASGIFT Daasgift Quality Foundation
FC Fisheries Commission
FIRR Financial Internal Rate of Return
FoN Friends of Nation
FtF Feed the Future
HM Hen Mpoano
ICM Integrated Coastal Management
ICT Information, Communication Technology
NGO Non-Governmental Organization
NPV Net Present Value
PB Pay Back
SFC Specific Fuelwood Consumption
SNV Netherlands Development Organization
SS Spatial Solutions
SSG SSG Advisors
UCC University of Cape Coast
URI University of Rhode Island
USAID United States Agency for International Development
USG United States Government
WR Western Region
iv
TABLE OF CONTENTS
CONTENTS
Acronyms ................................................................................................................................. iii
TABLE OF CONTENTS .......................................................................................................... iv
LIST OF FIGURES .................................................................................................................. vi
LIST OF TABLES .................................................................................................................... vi
INTRODUCTION ..................................................................................................................... 1
PROBLEM STATEMENT ........................................................................................................ 2
Objectives of the Study .......................................................................................................... 3
Significance of the Study ....................................................................................................... 3
Methodology .......................................................................................................................... 3
FISH SMOKING IN GHANA................................................................................................... 4
The Chorkor stove.................................................................................................................. 5
Morrison Stove....................................................................................................................... 5
Frismo Fish Smoking Stove ................................................................................................... 6
FISH PROCESSING BUSINESS.............................................................................................. 7
Socio-demographic Characteristics of fish Processors at Anlo Beach .................................. 7
Type of stove used and Ownership ........................................................................................ 7
Fuel Use ................................................................................................................................. 8
Smoke generating materials ................................................................................................. 10
Sources of fish...................................................................................................................... 10
Seasonality in the fish smoking business ............................................................................. 10
FISH SMOKING TECHNOLOGY AND ENERGY CONSUMPTION ................................ 11
Steps for Data Collection ..................................................................................................... 11
Comparing Smoking Time of Stoves ................................................................................... 12
Comparing Drying Abilities of Stoves ................................................................................ 12
Comparing Specific Fuelwood Consumption (SFC) of Stoves ........................................... 13
Energy Efficiency Improvement of Stove ........................................................................... 14
FISH PROCESSING TECHNIQUE AND ENERGY EXPENDITURE ................................ 15
Energy Budget for Bumper Season...................................................................................... 15
Energy Budget for the Lean Season..................................................................................... 17
Annual Energy Budget ......................................................................................................... 18
Energy Budget in Tons ........................................................................................................ 19
INVESTMENT RETURNS (PAYBACK PERIOD, IRR) ...................................................... 20
Investment Cost ................................................................................................................... 20
Payback Period..................................................................................................................... 20
v
Internal Rate of Return (IRR) .............................................................................................. 21
Switching from Chorkor to Morrison Clay stove ................................................................ 21
Case 1: .............................................................................................................................. 21
Case 2: .............................................................................................................................. 23
Switching from Chorkor to Morrison Brick stove ............................................................... 25
Case 1: .............................................................................................................................. 25
Case 2: .............................................................................................................................. 25
Switching from Chorkor to Frismo stove ............................................................................ 25
CONCLUSION ........................................................................................................................ 26
APPENDIX .............................................................................................................................. 27
Questionnaire to the Fish Processor ..................................................................................... 27
REFERENCES ........................................................................................................................ 31
vi
LIST OF FIGURES
Figure 1 Chorkor Stove in Use .................................................................................................. 5 Figure 2 Picture of the Morrison Stove...................................................................................... 6
Figure 3 Picture of the Frismo Stove ......................................................................................... 6 Figure 4 Type of stove popularly used ...................................................................................... 8 Figure 5 Stove Ownership ......................................................................................................... 8 Figure 6 Mode of transporting fuelwood ................................................................................... 9 Figure 7 Fuelwood purchase ...................................................................................................... 9
Figure 8 Smoke generating material ........................................................................................ 10 Figure 9 Seasonality effect on fish smoking business ............................................................. 11
Figure 10 Drying ability of stoves ........................................................................................... 13
Figure 11 SFC of stoves ........................................................................................................... 14 Figure 12 Efficiency improvement of stoves ........................................................................... 15 Figure 13 Expenditure on fuelwood per week ......................................................................... 16 Figure 14 Energy budget for bumper season ........................................................................... 17 Figure 15 Energy budget per week for lean season ................................................................. 18
Figure 16 Energy budget for lean season ................................................................................. 18
Figure 17 Annual energy expenditure...................................................................................... 19 Figure 18 Annual energy budget in tons .................................................................................. 20
LIST OF TABLES
Table 1 Energy consumption and primary sources in Ghana, 2000 .......................................... 3 Table 2 Age Distribution ........................................................................................................... 7
Table 3 Smoking Experience ..................................................................................................... 7 Table 4 Seasonality effects on fish smoking business ............................................................. 11 Table 5 Smoking time per stove .............................................................................................. 12
Table 6 SFC of stoves .............................................................................................................. 13 Table 7 Cost breakdown of fuel per week ............................................................................... 16 Table 8 Cost breakdown on fuelwood for lean season ............................................................ 17
Table 9 Annual energy budget per stove ................................................................................. 19 Table 10 Energy budget in tons ............................................................................................... 19
Table 11 Specifications of stoves ............................................................................................ 20
Table 12 IRR and Pay back period analysis of Morrison clay stove investment at a cost of
GHc 1,500 ................................................................................................................................ 22 Table 13 IRR and PB period analysis of a stove at investment cost of GHc 940 .................... 24
1
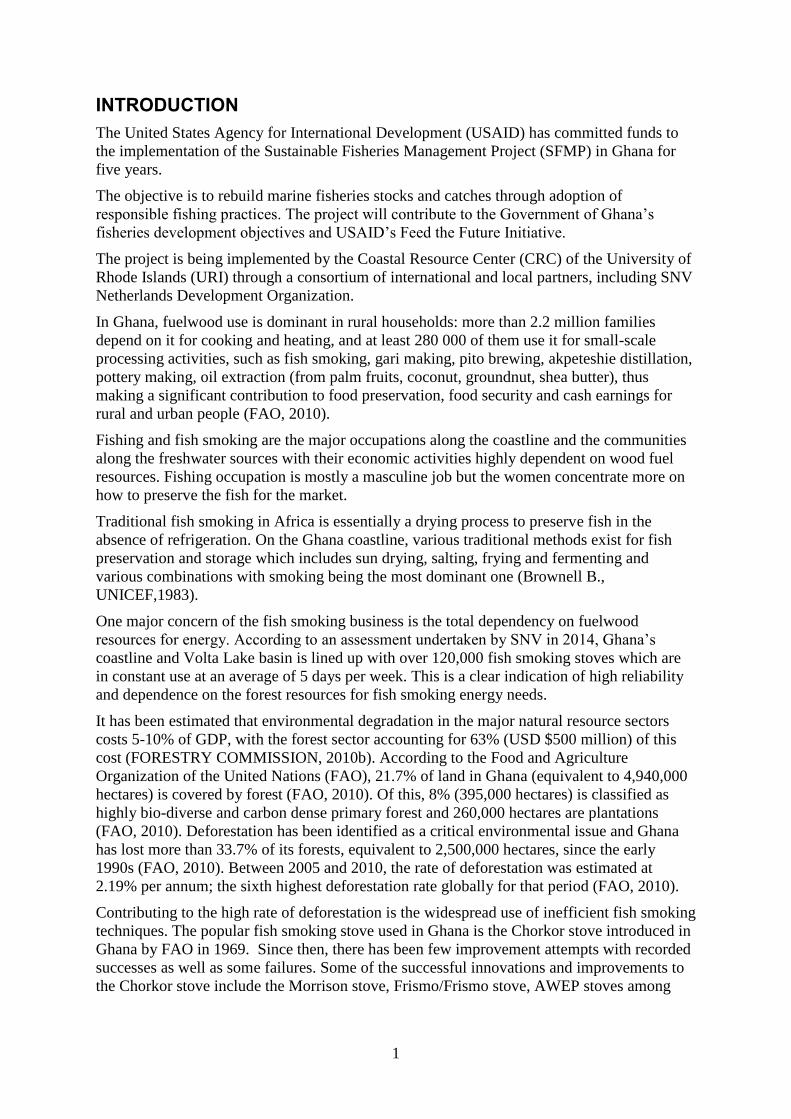
INTRODUCTION
The United States Agency for International Development (USAID) has committed funds to
the implementation of the Sustainable Fisheries Management Project (SFMP) in Ghana for
five years.
The objective is to rebuild marine fisheries stocks and catches through adoption of
responsible fishing practices. The project will contribute to the Government of Ghana’s
fisheries development objectives and USAID’s Feed the Future Initiative.
The project is being implemented by the Coastal Resource Center (CRC) of the University of
Rhode Islands (URI) through a consortium of international and local partners, including SNV
Netherlands Development Organization.
In Ghana, fuelwood use is dominant in rural households: more than 2.2 million families
depend on it for cooking and heating, and at least 280 000 of them use it for small-scale
processing activities, such as fish smoking, gari making, pito brewing, akpeteshie distillation,
pottery making, oil extraction (from palm fruits, coconut, groundnut, shea butter), thus
making a significant contribution to food preservation, food security and cash earnings for
rural and urban people (FAO, 2010).
Fishing and fish smoking are the major occupations along the coastline and the communities
along the freshwater sources with their economic activities highly dependent on wood fuel
resources. Fishing occupation is mostly a masculine job but the women concentrate more on
how to preserve the fish for the market.
Traditional fish smoking in Africa is essentially a drying process to preserve fish in the
absence of refrigeration. On the Ghana coastline, various traditional methods exist for fish
preservation and storage which includes sun drying, salting, frying and fermenting and
various combinations with smoking being the most dominant one (Brownell B.,
UNICEF,1983).
One major concern of the fish smoking business is the total dependency on fuelwood
resources for energy. According to an assessment undertaken by SNV in 2014, Ghana’s
coastline and Volta Lake basin is lined up with over 120,000 fish smoking stoves which are
in constant use at an average of 5 days per week. This is a clear indication of high reliability
and dependence on the forest resources for fish smoking energy needs.
It has been estimated that environmental degradation in the major natural resource sectors
costs 5-10% of GDP, with the forest sector accounting for 63% (USD $500 million) of this
cost (FORESTRY COMMISSION, 2010b). According to the Food and Agriculture
Organization of the United Nations (FAO), 21.7% of land in Ghana (equivalent to 4,940,000
hectares) is covered by forest (FAO, 2010). Of this, 8% (395,000 hectares) is classified as
highly bio-diverse and carbon dense primary forest and 260,000 hectares are plantations
(FAO, 2010). Deforestation has been identified as a critical environmental issue and Ghana
has lost more than 33.7% of its forests, equivalent to 2,500,000 hectares, since the early
1990s (FAO, 2010). Between 2005 and 2010, the rate of deforestation was estimated at
2.19% per annum; the sixth highest deforestation rate globally for that period (FAO, 2010).
Contributing to the high rate of deforestation is the widespread use of inefficient fish smoking
techniques. The popular fish smoking stove used in Ghana is the Chorkor stove introduced in
Ghana by FAO in 1969. Since then, there has been few improvement attempts with recorded
successes as well as some failures. Some of the successful innovations and improvements to
the Chorkor stove include the Morrison stove, Frismo/Frismo stove, AWEP stoves among
2
others. This study will investigate and compare the energy budgets and economics of using
the various fish smoking techniques. The Anlo Beach community is used as a case study.
PROBLEM STATEMENT
The research is directed at addressing three main deficiencies in knowledge identified in the
fish processing business: (1) limited knowledge on energy budget for fish smoking business
(2) limited research on the comparative economics of fish processing technologies available
(3) gab in knowledge on the mass of fuelwood consumed per annum for effective and
sustainable fuelwood planning.
Existing literature provides that, Ghana’s fuelwood consumption is estimated at 20.6 million
cubic meters per year while it provides about 71% of the country’s annual energy demand.
Wood fuel supports most informal enterprises including bread-baking, processing of oil-
palm, local breweries, traditional soap making, fish smoking and traditional food services.
About 90% of rural households use firewood or charcoal for cooking. Demand for wood fuel
is increasing with oil prices and local government agencies derive substantial revenue from
wood fuel taxes and with a potential to increase such revenues if the trade is regularized
(Mason, J. NCRC, 2008).
Generally, fuelwood production and marketing in most parts of Africa requires only minimal
financial and human resources with the raw material which is the wood often obtained for
free. The fuelwood business is thus suitable for the socio-economically rural poor,
contributing to their household income as well as providing a safeguard against food
shortages, unemployment and other similar poverty-related risks (Obiri et al., 2015).
In Ghana, fuelwood gathering and sale coupled with fuel-based income generating activities
are very important livelihoods in forest fringe rural communities (Amuah, 2011). Many of the
rural population rely of adjacent forest resources particularly, fuelwood as secondary income
source to supplement farm income (Obiri et al., 2014).
According to FAO (2007), studies have only recently begun to address issues such as the
income and expenditure potential for households from wood fuel trade.
Ocansey (1985), examined fuelwood exploitation in a village on the outskirts of Accra, and
found that the trade to Accra and other urban centers provided important economic activity
for most villagers especially during fishing seasons. On the average 50.94 cubic meters of
wood fuel left the village every day as compared with an estimated consumption of 1.37
cubic meters per capita per year. As to how much of the wood is been consumed for fish
processing is yet to be investigated.
The absence of a comprehensive knowledge of the demand, a fuels substitution policy may
lead to undesirable consequences for the national economy. On the other hand, since neither
the environmental impact of charcoal and wood fuel use nor the potential for other mitigation
policies were assessed, the chance to develop other, more cost-efficient alternatives was lost.
It is clear now that wood fuels are produced and marketed with a minimum use of foreign
currency (FAO, 2000).
3
Table 1 Energy consumption and primary sources in Ghana, 2000
Electricity Oil and
derivatives
Charcoal Fuelwood
7 838 000 MWh 1 095 000 tonnes 1 000 000 tonnes 8 200 000 tonnes
Source; FAO (2000)
According to Obiri et al., (2014), 96% of fish processors along the coast uses fuelwood as the
main source of fuel for their business. Materials like coconut shells, and sugar cane husks are
normally used to generate smoke.
An assessment by SNV in 2014 revealed that, Ghana’s coastline and Volta Lake basin is
lined up with over 120,000 fish smoking stoves which are in constant use at an average of 5
days every week. This is a clear indication of high reliability and dependence on the forest
wood fuel resources for the energy needs of fish processing business.
The stove improvement attempts to the traditional fish smoking stoves include; Modified
Drum Kiln, Morrison Stove, Frismo/Frismo Fish Smoking Stove, SIF-support Improved Fish
Smoking Stove Kwarteng, E. (2013). Their efficiency levels, usage information, energy
expenditure as well as the economics of choosing a particular stove technology is yet to be
investigated.
Objectives of the Study
The overall objective of this study is to compare the energy consumptions levels, expenditure
and economics of the available stove technologies to provide an evidence based information
on the fish processing business as well as to be able to plan for future energy use and the
development of sustainable mitigation measures.
Specifically, the study seeks to;
Find out fuelwood consumption levels of all available fish smoking processing
techniques in Anlo beach.
Determine the total expenditure on energy per processing technology
Determine the quantities of fuelwood consumed per season
Determine the annual wood consumptions and its financial budgets
Evaluate using financial indicators the technologies that is worth investing in.
Significance of the Study
The purpose for the study is to critically assess the available stove technologies, their
economic benefits, and user friendliness and deduce financial indicators to guide selection
and promotion. This knowledge will guide fish processors to make informed choices as far as
investment is concerned. This will also guide SFMP implementing partners to streamline
their stove promotion messages.
Methodology
The analysis required carrying out series of energy efficiency assessments of the available
stove technologies, direct measurements and observations. For energy assessment of stoves,
the controlled cooking test (CCT) method was used. This method provides information on
percentage improvement in energy efficiency of one stove over another using a standard fish
smoking process. The CCT is one acceptable method of carrying out such assessments. The
test was carried out with assistance of the stove users just as in their normal smoking
4
business; and relevant data was collected. The audit was carried out on the following stoves;
Morrison Brick, Morrison Clay, Frismo and the Chorkor stove.
The soft smoking approach was applied in all cases and the information collected included:
(1) fuel consumption; (2) time to complete smoking; (3) smoke production; (4) convenience
of using the stove. Soft smoking method is specifically employed when smoked fish is not
intended to be stored but rather consumed within a short period of time. The average shelve
live of a soft smoked fish is 3days. Soft smoking requires less fuel, energy and time. The fuel
consumption and time to smoke the fish were measured, the smoke production and the
convenience of using the stoves were assessed by questionnaire and observation.
Fuelwood was directly weighed to determine the quantity and price relationships so as to
determine consumption levels of each technology.
Twenty-six (26) fish processors were purposively sampled from a population of 190 fish
processors from Anlo beach, based on respondents’ processing technology as well as
accessibility. Structured questionnaires were used to carry out interviews to fetch both
generic and specific information on the fish processing business.
FISH SMOKING IN GHANA
Fish is an important source of food and income to many people in the developing world. In
Africa, some 5 percent of the population, about 35 million people, depend wholly or partly on
the fisheries sector, mostly artisanal fisheries, for their livelihood.
Fish smoking in Ghana is traditionally carried out by women in coastal towns and villages
along river banks and on the shores of Lake Volta. Smoking is the most widely practiced
method: practically all species of fish available in the country can be smoked and it has been
estimated that 70-80 percent of the domestic marine and freshwater catch is consumed in
smoked form.
Until the end of the 1960s, the ovens most used for smoking fish in Ghana were cylindrically
and rectangular designed with mud or metal. Using these ovens had considerable
disadvantages such as excessive handling of fish during smoking, a problem more severe
when smoking small species of fish such as anchovies.
The health of women fish smokers was also placed at risk as a result of the smoke entering
their eyes and lungs, their fingers being burnt and exposure to direct heat. The smoking
procedure was very laborious and poor quality smoked fish of low market value was
produced.
In the 1960s and 1970s, several types of traditional ovens were used for fish smoking. They
could not cope with the large volume of fish landed, because of their low capacity and
laborious operating process.
The ovens had low capacity and were inefficient in fuel usage. Since the fishing season
mostly coincided with the raining season, the fish could not be sun-dried. The traditional
ovens were inefficient, more firewood than necessary was used for smoking, which
contributed to forest depletion. Fish arrangement in the traditional stoves system prevents
efficient circulation of heat and smoke since fish is kept in layers with one on top of the
other.
The smoking process had to be interrupted frequently to rearrange the layers to prevent fish
from charring. In cases where sticks are used to separate the layers, the sticks exert
considerable pressure on the fish, often disfiguring the smoked product and reducing its
market value.
5
The Chorkor stove
In the light of lessons learned from the constraints and disadvantages associated with the
earlier ovens, an improved traditional fish smoking oven, the Chorkor, was developed and
introduced in 1969. This innovative model, developed by the Food and Agriculture
Organization (FAO) of the United Nations and the Food Research Institute of the Council for
Scientific and Industrial Research (CSIR) in Ghana, has since demonstrated the potential of
traditional technologies in meeting smoking challenges such as capacity and processing time.
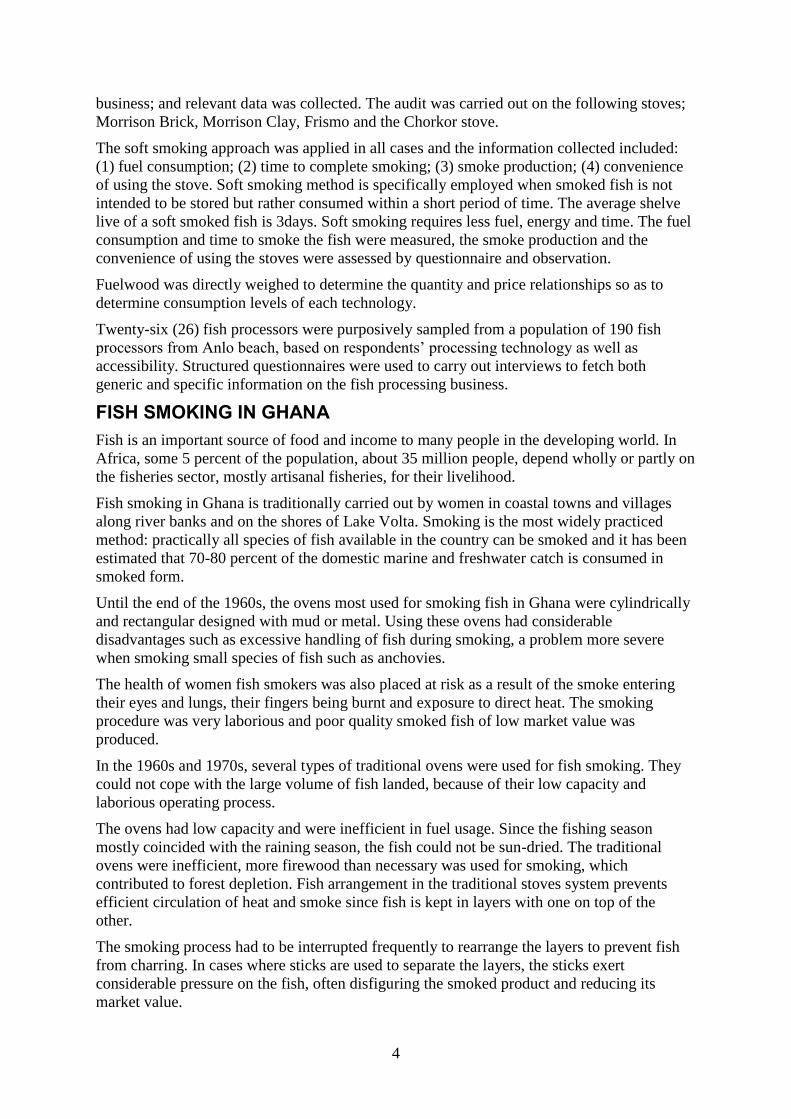
Figure 1 Chorkor Stove in Use
The Chorkor Stove, named after a small fishing community on the outskirts of Accra, has
numerous advantages. It is cheap to construct and can be assembled using locally available
materials. Easy to use, with large capacity and produces quality smoked fish. This simple,
highly effective fish smoking technology was popularized in Ghana through a number of
training programs and promoted using a participatory approach.
Morrison Stove
Morrison Stove is a product of Morrison Energy Limited, a private enterprise that aims at
improving the fish smoking industry with new stove technologies targeted at energy efficient
and user friendliness. Morrison Energy Limited over the years has come out with some
interventions to solve the current high fuelwood consumption and smoke problems associated
with the Chorkor smoker. The design has special trays that interlock with one another and
prevent smoke escape from the sides of the stove. The stove has a cover with a built-in
chimney to direct the smoke above and away.
According to energy assessments conducted by SNV Ghana in 2012, the Morrison stove was
39% more fuel efficient than the Chorkor stove, using 0.38 kg fuel wood per kg smoked fish
while the predominantly used Chorkor stove uses 0.62 kg fuel wood per kg smoked fish.
6
Figure 2 Picture of the Morrison Stove
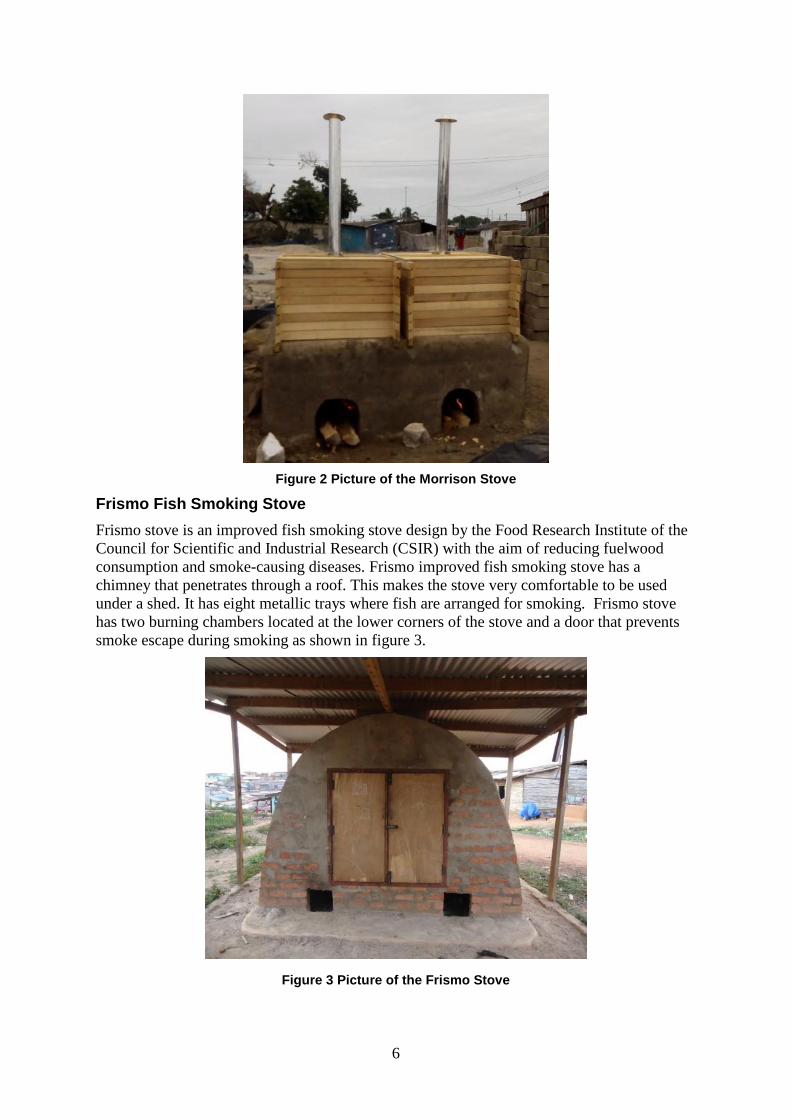
Frismo Fish Smoking Stove
Frismo stove is an improved fish smoking stove design by the Food Research Institute of the
Council for Scientific and Industrial Research (CSIR) with the aim of reducing fuelwood
consumption and smoke-causing diseases. Frismo improved fish smoking stove has a
chimney that penetrates through a roof. This makes the stove very comfortable to be used
under a shed. It has eight metallic trays where fish are arranged for smoking. Frismo stove
has two burning chambers located at the lower corners of the stove and a door that prevents
smoke escape during smoking as shown in figure 3.
Figure 3 Picture of the Frismo Stove
7
FISH PROCESSING BUSINESS
Socio-demographic Characteristics of fish Processors at Anlo Beach
Anlo beach is a small fishing community located in the Shama District in the Western region
of Ghana. Ewes forms the majority part of the population with Anlo language being their
main dialet. Artisanal fishing is the major economic for the men whereas women in the
community engage in fish processing activities such as fish smoking, frying, salting and
fermentation. The land area of Anlo beach community is elevated at an average of 14 meters
above sea level. However the community is occasionally get flooded during high tides.
Gender, Age & Experience
Fish smoking is a women dominated business in Anlo Beach. 99% of the fish processors are
women. Both the young and the old between the ages of 31 and 69 engage in the fish
processing business with an average age 47 years (Table 2). The average working experience
for fish processor at Anlo Beach is 18 years. (Table 3).
Table 2 Age Distribution
Mean Min. Max. Std Deviation
46.6 31 69 10.2
Table 3 Smoking Experience
Mean Min. Max. Std Deviation
18.25 1 40 11.1
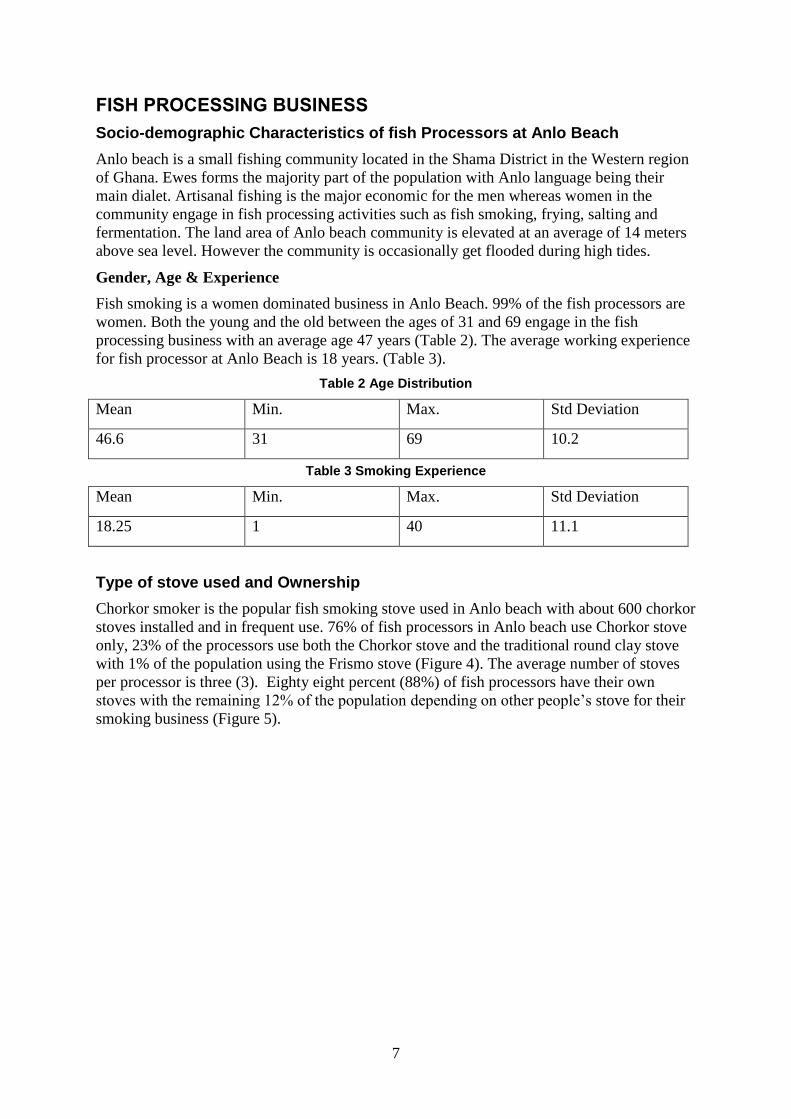
Type of stove used and Ownership
Chorkor smoker is the popular fish smoking stove used in Anlo beach with about 600 chorkor
stoves installed and in frequent use. 76% of fish processors in Anlo beach use Chorkor stove
only, 23% of the processors use both the Chorkor stove and the traditional round clay stove
with 1% of the population using the Frismo stove (Figure 4). The average number of stoves
per processor is three (3). Eighty eight percent (88%) of fish processors have their own
stoves with the remaining 12% of the population depending on other people’s stove for their
smoking business (Figure 5).
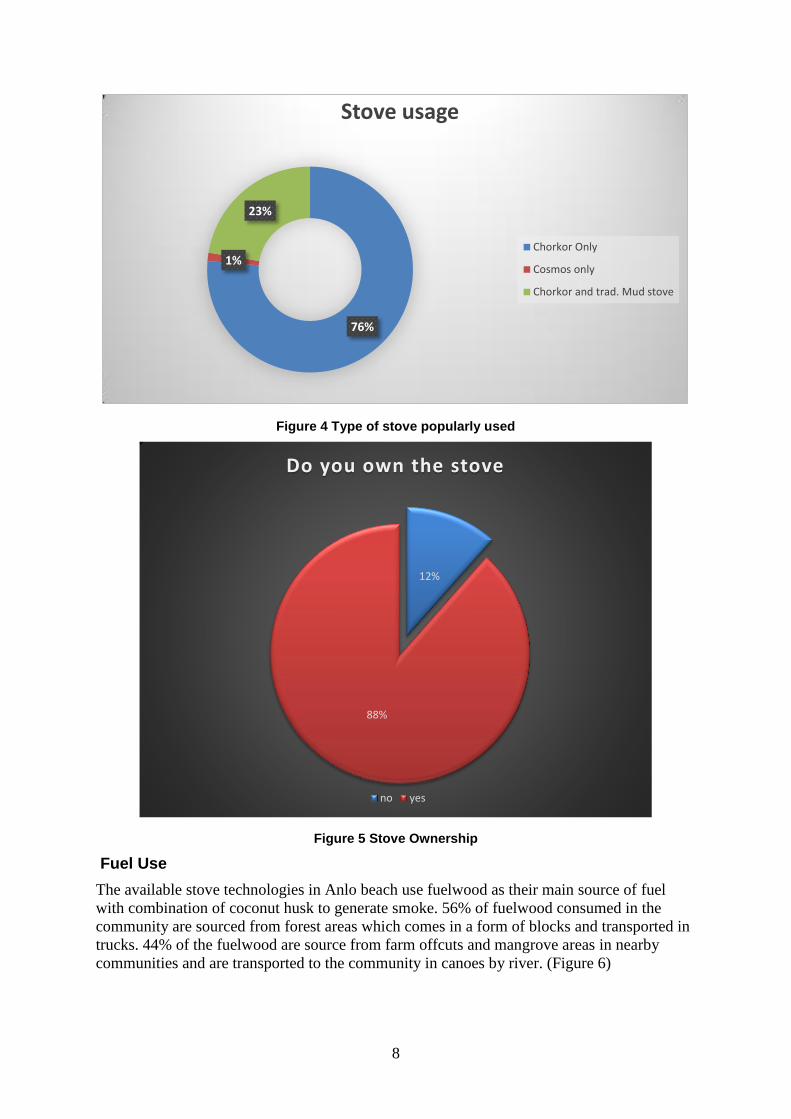
Figure 4 Type of stove popularly used
76%
1%
Stove usage
23%
Chorkor Only
Cosmos only
Chorkor and trad. Mud stove
Figure 5 Stove Ownership
12%
88%
Do you own the stove
no yes
Fuel Use
The available stove technologies in Anlo beach use fuelwood as their main source of fuel
with combination of coconut husk to generate smoke. 56% of fuelwood consumed in the
community are sourced from forest areas which comes in a form of blocks and transported in
trucks. 44% of the fuelwood are source from farm offcuts and mangrove areas in nearby
communities and are transported to the community in canoes by river. (Figure 6)
8
9
Figure 6 Mode of transporting fuelwood
49%
Mode of transporting fuelwood
51% 70.9
72.5
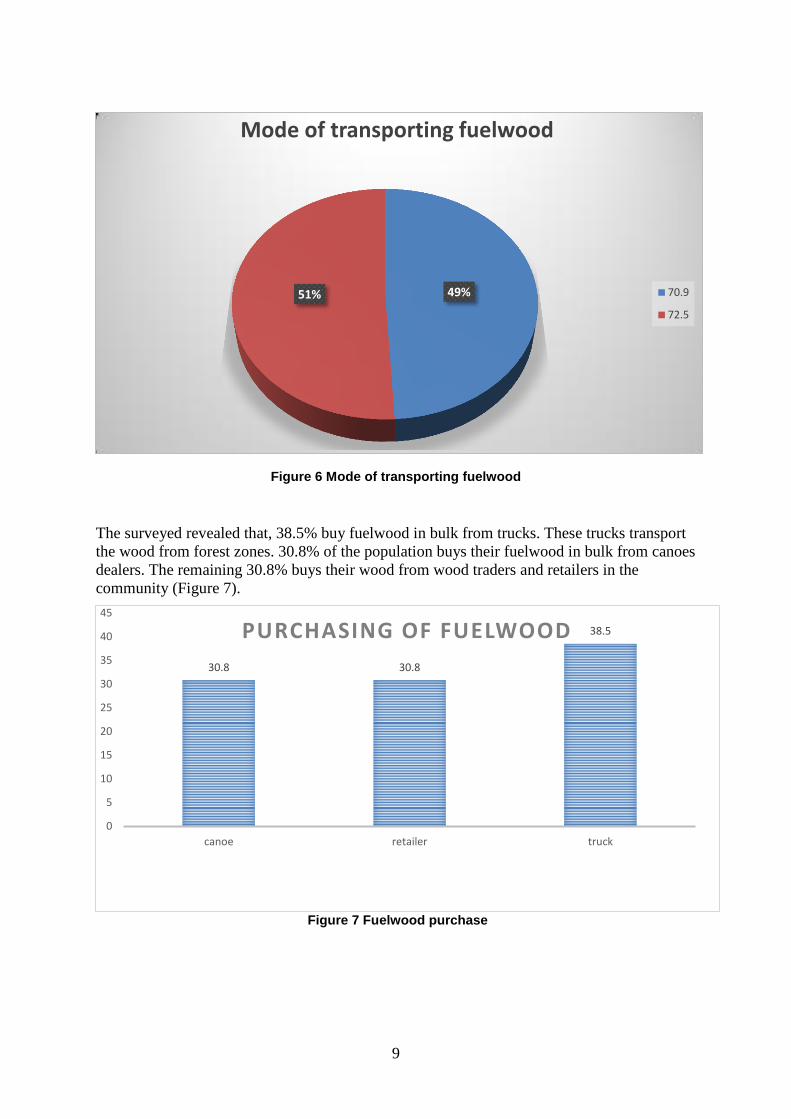
The surveyed revealed that, 38.5% buy fuelwood in bulk from trucks. These trucks transport
the wood from forest zones. 30.8% of the population buys their fuelwood in bulk from canoes
dealers. The remaining 30.8% buys their wood from wood traders and retailers in the
community (Figure 7).
Figure 7 Fuelwood purchase
45
40 PURCHASING OF FUELWOOD 38.5
3530.8 30.8
30
25
20
15
10
5
0
canoe retailer truck
10
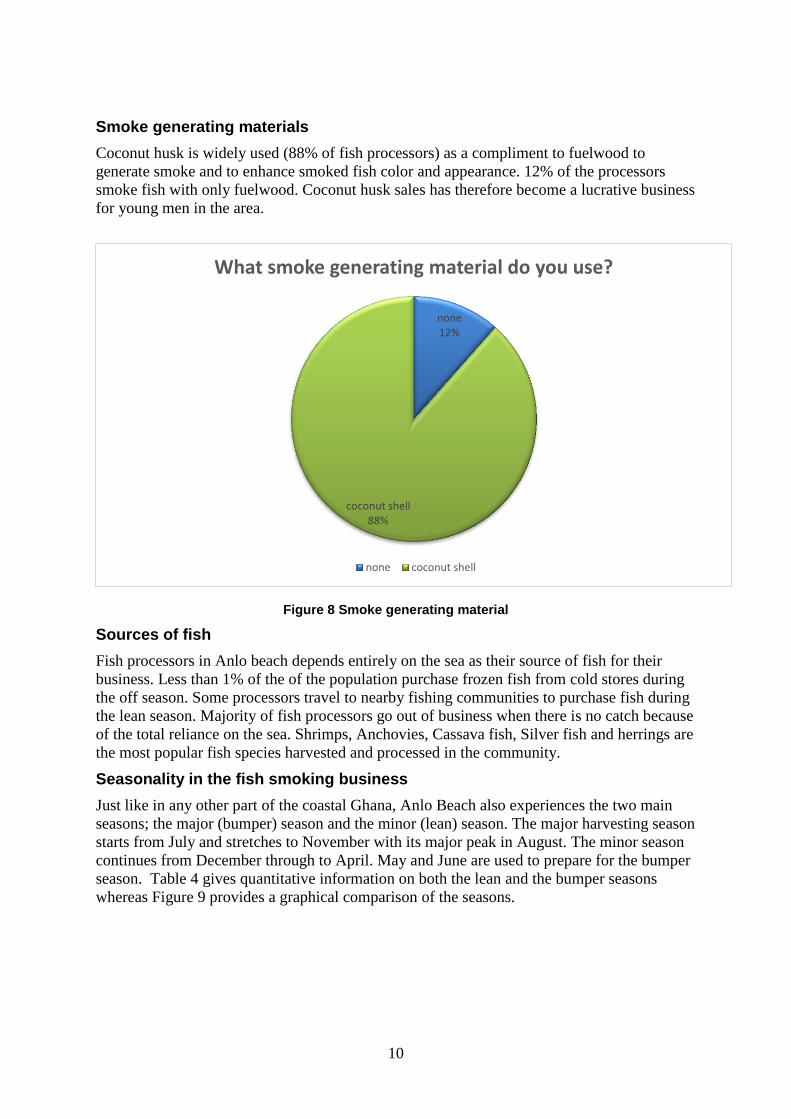
Smoke generating materials
Coconut husk is widely used (88% of fish processors) as a compliment to fuelwood to
generate smoke and to enhance smoked fish color and appearance. 12% of the processors
smoke fish with only fuelwood. Coconut husk sales has therefore become a lucrative business
for young men in the area.
Figure 8 Smoke generating material
What smoke generating material do you use?
none 12%
coconut shell 88%
none coconut shell
Sources of fish
Fish processors in Anlo beach depends entirely on the sea as their source of fish for their
business. Less than 1% of the of the population purchase frozen fish from cold stores during
the off season. Some processors travel to nearby fishing communities to purchase fish during
the lean season. Majority of fish processors go out of business when there is no catch because
of the total reliance on the sea. Shrimps, Anchovies, Cassava fish, Silver fish and herrings are
the most popular fish species harvested and processed in the community.
Seasonality in the fish smoking business
Just like in any other part of the coastal Ghana, Anlo Beach also experiences the two main
seasons; the major (bumper) season and the minor (lean) season. The major harvesting season
starts from July and stretches to November with its major peak in August. The minor season
continues from December through to April. May and June are used to prepare for the bumper
season. Table 4 gives quantitative information on both the lean and the bumper seasons
whereas Figure 9 provides a graphical comparison of the seasons.
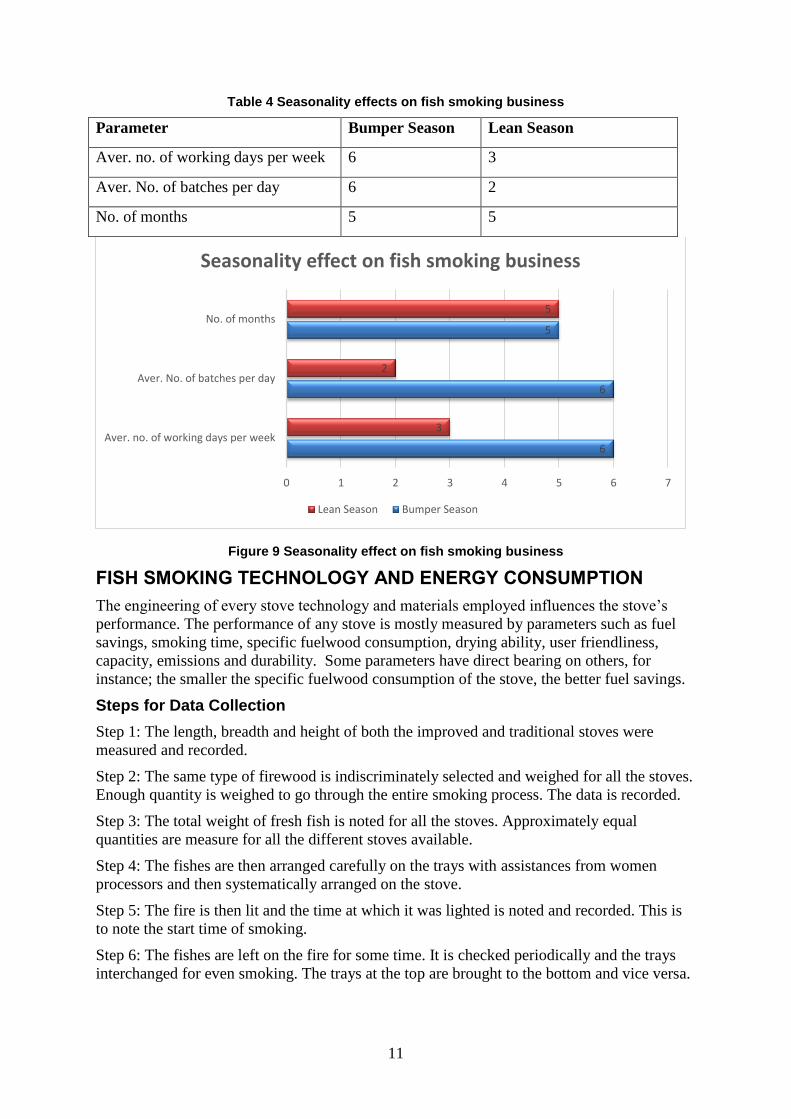
Table 4 Seasonality effects on fish smoking business
Parameter Bumper Season Lean Season
Aver. no. of working days per week 6 3
Aver. No. of batches per day 6 2
No. of months 5 5
Figure 9 Seasonality effect on fish smoking business
Seasonality effect on fish smoking business
5 No. of months
5
2 Aver. No. of batches per day
6
3 Aver. no. of working days per week
6
0 1 2 3 4 5 6 7
Lean Season Bumper Season
FISH SMOKING TECHNOLOGY AND ENERGY CONSUMPTION
The engineering of every stove technology and materials employed influences the stove’s
performance. The performance of any stove is mostly measured by parameters such as fuel
savings, smoking time, specific fuelwood consumption, drying ability, user friendliness,
capacity, emissions and durability. Some parameters have direct bearing on others, for
instance; the smaller the specific fuelwood consumption of the stove, the better fuel savings.
Steps for Data Collection
Step 1: The length, breadth and height of both the improved and traditional stoves were
measured and recorded.
Step 2: The same type of firewood is indiscriminately selected and weighed for all the stoves.
Enough quantity is weighed to go through the entire smoking process. The data is recorded.
Step 3: The total weight of fresh fish is noted for all the stoves. Approximately equal
quantities are measure for all the different stoves available.
Step 4: The fishes are then arranged carefully on the trays with assistances from women
processors and then systematically arranged on the stove.
Step 5: The fire is then lit and the time at which it was lighted is noted and recorded. This is
to note the start time of smoking.
Step 6: The fishes are left on the fire for some time. It is checked periodically and the trays
interchanged for even smoking. The trays at the top are brought to the bottom and vice versa.
11
12
Step 7: The fish processors determine the cooked time at which can be eaten. This is, the end
of soft smoking session. At that point, the time is noted and recorded. The firewood is taken
out of the oven, quenched with sand and weight with any other fuelwood left.
Step 8: The weight of the remaining firewood after soft smoking is also weighed and
recorded.
Step 9: The soft smoked fish is then rearranged on the trays. This time, the number of trays is
reduced to about 4 trays. The fish is therefore arranged in 2 layers per tray. If needed,
additional firewood is weighed for the start of hard smoking.
Step 10: The fire is lit again and the time noted as the start time for hard smoking. The fish is
allowed to smoke and the trays interchanged as and when needed, until the point where it is
hard and dry enough to be stored. This point is determined by the fish smokers.
Step 11: At the point where the fish is dry enough to be stored, the firewood is taken out and
quenched with sand. The time is also noted and recorded as the end time for hard smoking.
The fish is then taken off the tray and weighed to find the weight of hard smoked fish. This
weight is recorded. The dry fish is then put in pans for storage until it is packaged for the
market.
Comparing Smoking Time of Stoves
The smoking time of each stove technology in this context is defined as the total time needed
to complete one soft smoking process. Table 5 shows the smoking time per each stove
technology.
Table 5 Smoking time per stove
Stove Chorkor Frismo Morrison Clay Morrison Brick
Smoking time (minutes) 159 157 169 176
From the analysis, it was realized that, in terms of smoking time, the Frismo stove and the
Chorkor stove are insignificantly better than the Morrison stove (Table 5). Time savings for
using the Frismo and Chorkor stove is not very significant as far as smoking activity is
concerned.
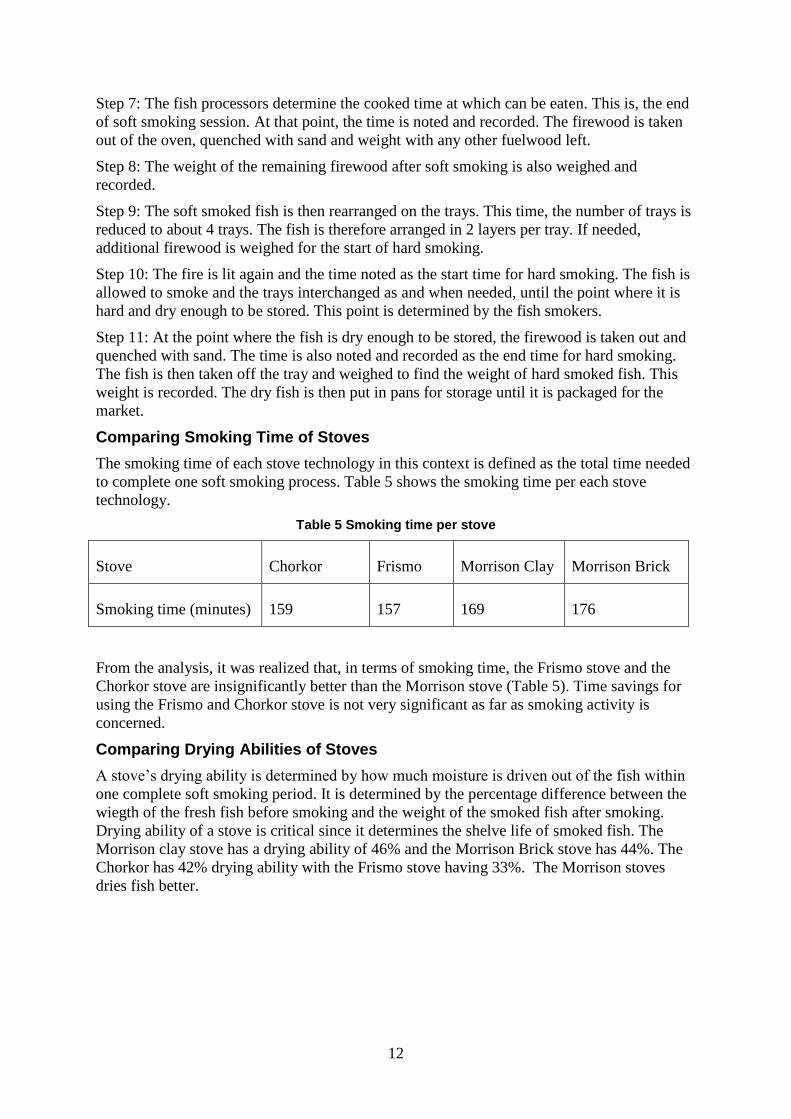
Comparing Drying Abilities of Stoves
A stove’s drying ability is determined by how much moisture is driven out of the fish within
one complete soft smoking period. It is determined by the percentage difference between the
wiegth of the fresh fish before smoking and the weight of the smoked fish after smoking.
Drying ability of a stove is critical since it determines the shelve life of smoked fish. The
Morrison clay stove has a drying ability of 46% and the Morrison Brick stove has 44%. The
Chorkor has 42% drying ability with the Frismo stove having 33%. The Morrison stoves
dries fish better.
13
Figure 10 Drying ability of stoves
Drying Ability of stoves
50
45
40
)% 35
(ty
i 30
liab 25
g 20
ryn
d 15
10
5
0
Morrison Brick Morrison Clay Cosmos Chorkor
stove type
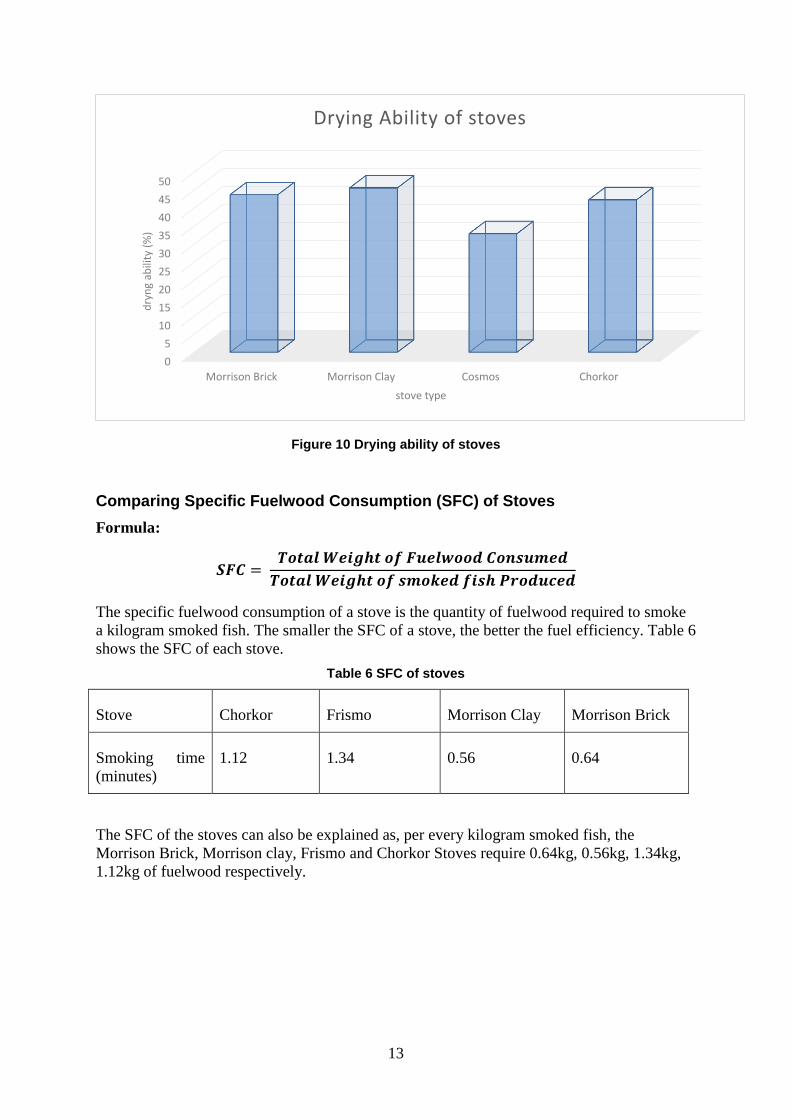
Comparing Specific Fuelwood Consumption (SFC) of Stoves
Formula:
𝑻𝒐𝒕𝒂𝒍 𝑾𝒆𝒊𝒈𝒉𝒕 𝒐𝒇 𝑭𝒖𝒆𝒍𝒘𝒐𝒐𝒅 𝑪𝒐𝒏𝒔𝒖𝒎𝒆𝒅𝑺𝑭𝑪 =
𝑻𝒐𝒕𝒂𝒍 𝑾𝒆𝒊𝒈𝒉𝒕 𝒐𝒇 𝒔𝒎𝒐𝒌𝒆𝒅 𝒇𝒊𝒔𝒉 𝑷𝒓𝒐𝒅𝒖𝒄𝒆𝒅
The specific fuelwood consumption of a stove is the quantity of fuelwood required to smoke
a kilogram smoked fish. The smaller the SFC of a stove, the better the fuel efficiency. Table 6
shows the SFC of each stove.
Table 6 SFC of stoves
Stove Chorkor Frismo Morrison Clay Morrison Brick
Smoking time 1.12 1.34 0.56 0.64
(minutes)
The SFC of the stoves can also be explained as, per every kilogram smoked fish, the
Morrison Brick, Morrison clay, Frismo and Chorkor Stoves require 0.64kg, 0.56kg, 1.34kg,
1.12kg of fuelwood respectively.
14
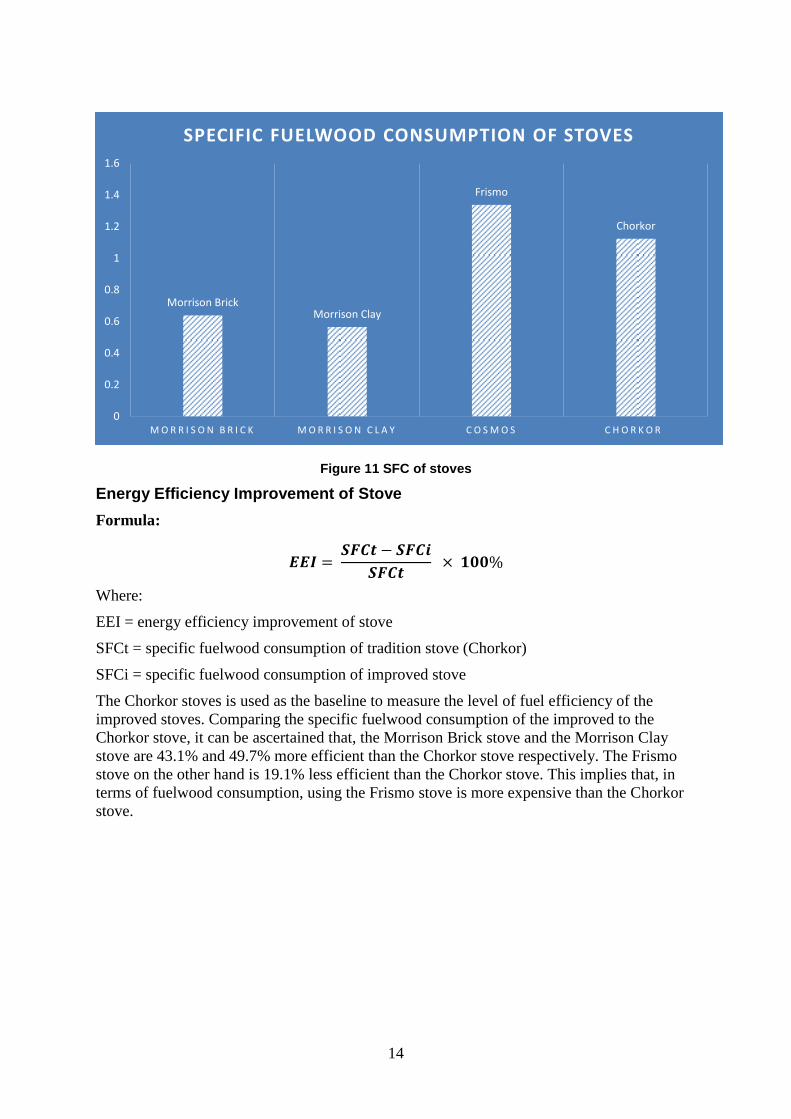
Figure 11 SFC of stoves
Morrison Brick Morrison Clay
Frismo
SPECIFIC FUELWOOD CONSUMPTION OF STOVES
1.6
1.4
1.2 Chorkor
1
0.8
0.6
0.4
0.2
0M O R R I S O N B R I C K M O R R I S O N C L A Y C O S M O S C H O R K O R
Energy Efficiency Improvement of Stove
Formula:
𝑺𝑭𝑪𝒕 − 𝑺𝑭𝑪𝒊𝑬𝑬𝑰 = × 𝟏𝟎𝟎%
𝑺𝑭𝑪𝒕
Where:
EEI = energy efficiency improvement of stove
SFCt = specific fuelwood consumption of tradition stove (Chorkor)
SFCi = specific fuelwood consumption of improved stove
The Chorkor stoves is used as the baseline to measure the level of fuel efficiency of the
improved stoves. Comparing the specific fuelwood consumption of the improved to the
Chorkor stove, it can be ascertained that, the Morrison Brick stove and the Morrison Clay
stove are 43.1% and 49.7% more efficient than the Chorkor stove respectively. The Frismo
stove on the other hand is 19.1% less efficient than the Chorkor stove. This implies that, in
terms of fuelwood consumption, using the Frismo stove is more expensive than the Chorkor
stove.
15
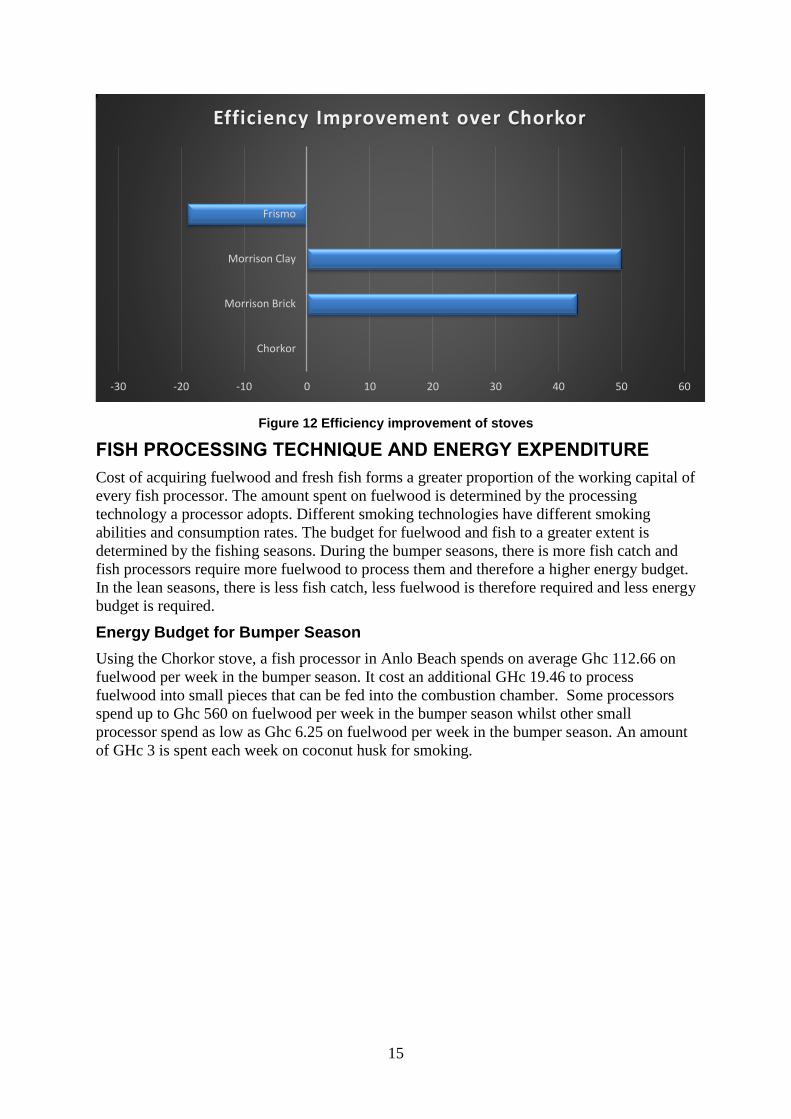
Figure 12 Efficiency improvement of stoves
Frismo
Morrison Clay
Morrison Brick
Chorkor
-30 -20 -10 0 10 20 30 40 50 60
Efficiency Improvement over Chorkor
FISH PROCESSING TECHNIQUE AND ENERGY EXPENDITURE
Cost of acquiring fuelwood and fresh fish forms a greater proportion of the working capital of
every fish processor. The amount spent on fuelwood is determined by the processing
technology a processor adopts. Different smoking technologies have different smoking
abilities and consumption rates. The budget for fuelwood and fish to a greater extent is
determined by the fishing seasons. During the bumper seasons, there is more fish catch and
fish processors require more fuelwood to process them and therefore a higher energy budget.
In the lean seasons, there is less fish catch, less fuelwood is therefore required and less energy
budget is required.
Energy Budget for Bumper Season
Using the Chorkor stove, a fish processor in Anlo Beach spends on average Ghc 112.66 on
fuelwood per week in the bumper season. It cost an additional GHc 19.46 to process
fuelwood into small pieces that can be fed into the combustion chamber. Some processors
spend up to Ghc 560 on fuelwood per week in the bumper season whilst other small
processor spend as low as Ghc 6.25 on fuelwood per week in the bumper season. An amount
of GHc 3 is spent each week on coconut husk for smoking.
16
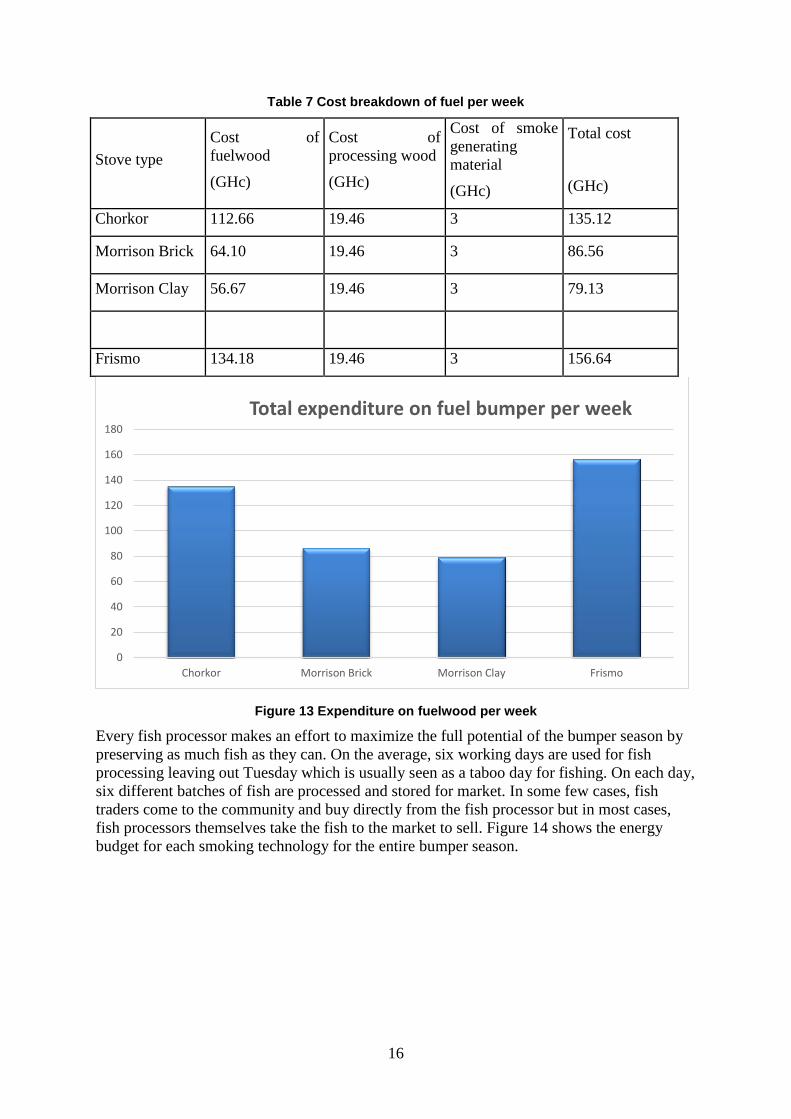
Table 7 Cost breakdown of fuel per week
Stove type
Cost
fuelwood
(GHc)
of Cost of
processing wood
(GHc)
Cost of smoke
generating
material
(GHc)
Total cost
(GHc)
Chorkor 112.66 19.46 3 135.12
Morrison Brick 64.10 19.46 3 86.56
Morrison Clay 56.67 19.46 3 79.13
Frismo 134.18 19.46 3 156.64
Figure 13 Expenditure on fuelwood per week
Total expenditure on fuel bumper per week 180
160
140
120
100
80
60
40
20
0
Chorkor Morrison Brick Morrison Clay Frismo
Every fish processor makes an effort to maximize the full potential of the bumper season by
preserving as much fish as they can. On the average, six working days are used for fish
processing leaving out Tuesday which is usually seen as a taboo day for fishing. On each day,
six different batches of fish are processed and stored for market. In some few cases, fish
traders come to the community and buy directly from the fish processor but in most cases,
fish processors themselves take the fish to the market to sell. Figure 14 shows the energy
budget for each smoking technology for the entire bumper season.
17
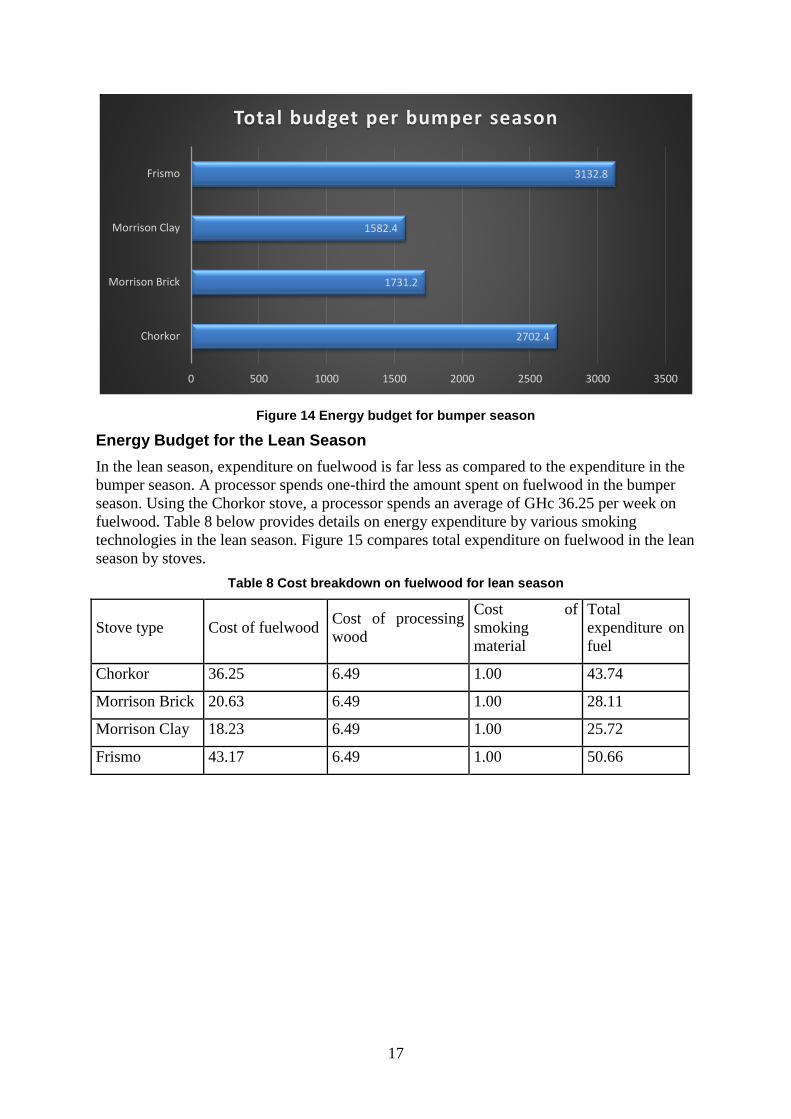
Figure 14 Energy budget for bumper season
Frismo 3132.8
Morrison Clay 1582.4
Morrison Brick 1731.2
Chorkor 2702.4
0 500 1000 1500 2000 2500 3000 3500
Total budget per bumper season
Energy Budget for the Lean Season
In the lean season, expenditure on fuelwood is far less as compared to the expenditure in the
bumper season. A processor spends one-third the amount spent on fuelwood in the bumper
season. Using the Chorkor stove, a processor spends an average of GHc 36.25 per week on
fuelwood. Table 8 below provides details on energy expenditure by various smoking
technologies in the lean season. Figure 15 compares total expenditure on fuelwood in the lean
season by stoves.
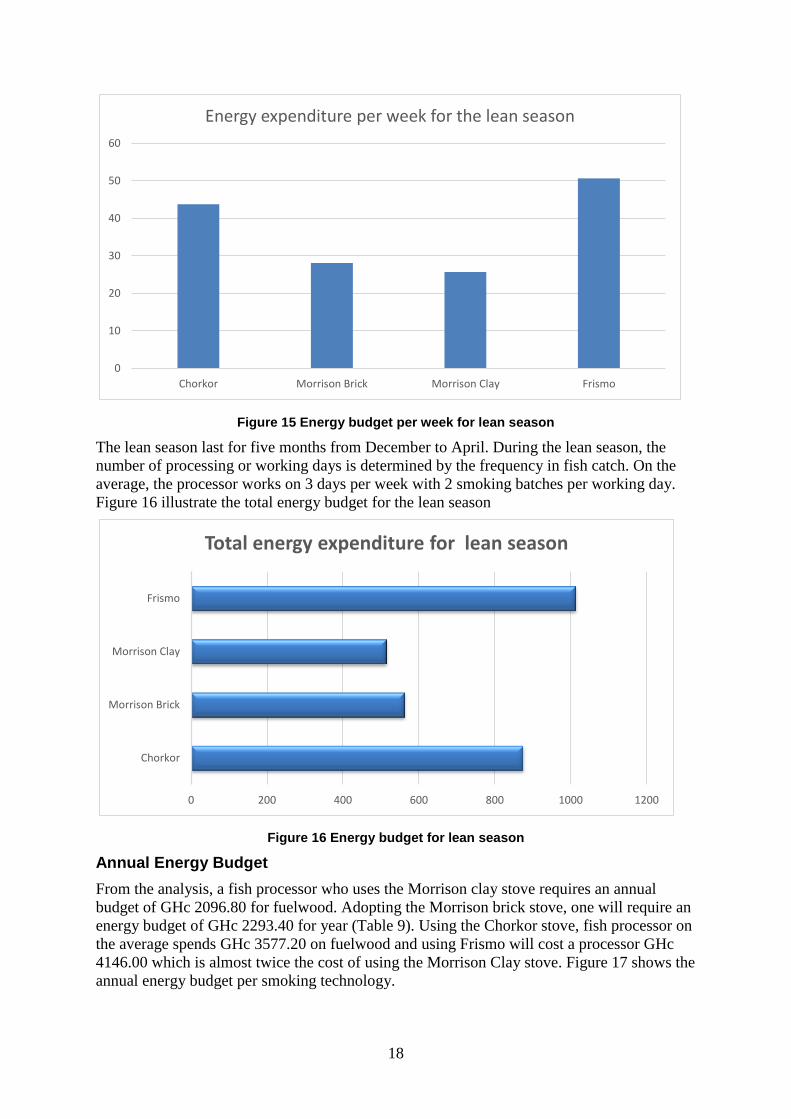
Table 8 Cost breakdown on fuelwood for lean season
Stove type Cost of fuelwood Cost
wood
of processing Cost
smoking
material
of Total
expenditure
fuel
on
Chorkor 36.25 6.49 1.00 43.74
Morrison Brick 20.63 6.49 1.00 28.11
Morrison Clay 18.23 6.49 1.00 25.72
Frismo 43.17 6.49 1.00 50.66
18
Figure 15 Energy budget per week for lean season
Energy expenditure per week for the lean season
60
50
40
30
20
10
0
Chorkor Morrison Brick Morrison Clay Frismo
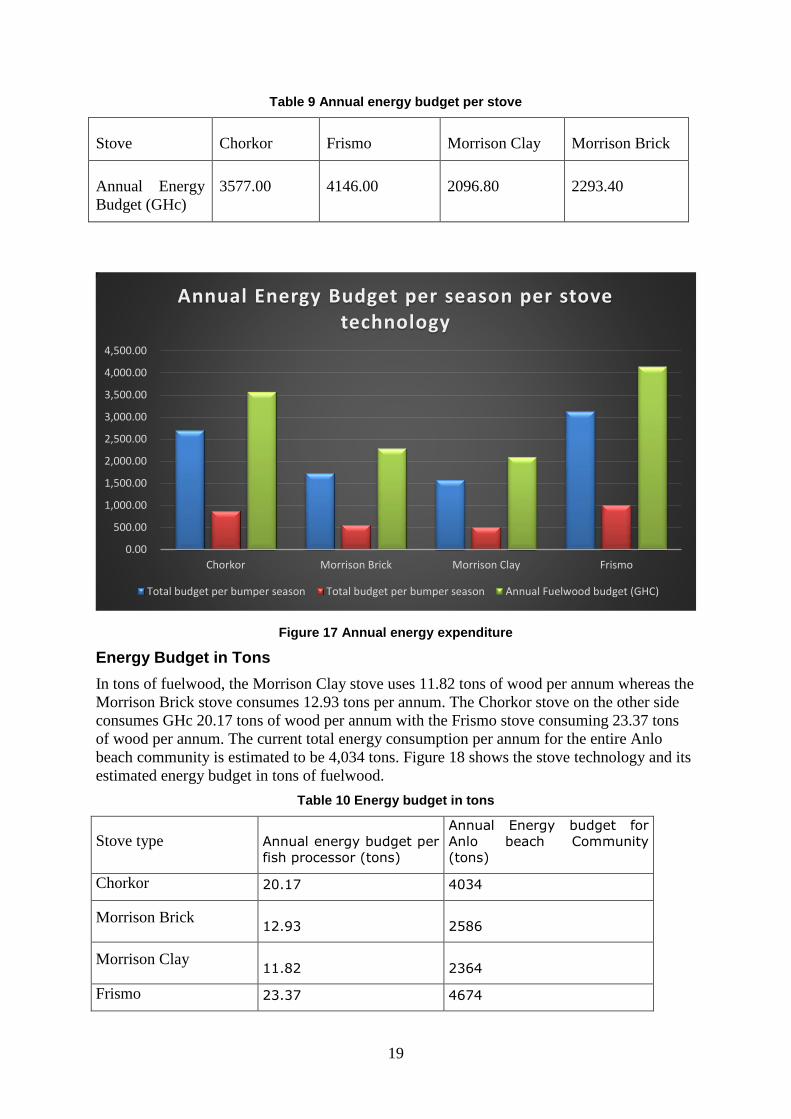
The lean season last for five months from December to April. During the lean season, the
number of processing or working days is determined by the frequency in fish catch. On the
average, the processor works on 3 days per week with 2 smoking batches per working day.
Figure 16 illustrate the total energy budget for the lean season
Figure 16 Energy budget for lean season
Total energy expenditure for lean season
Frismo
Morrison Clay
Morrison Brick
Chorkor
0 200 400 600 800 1000 1200
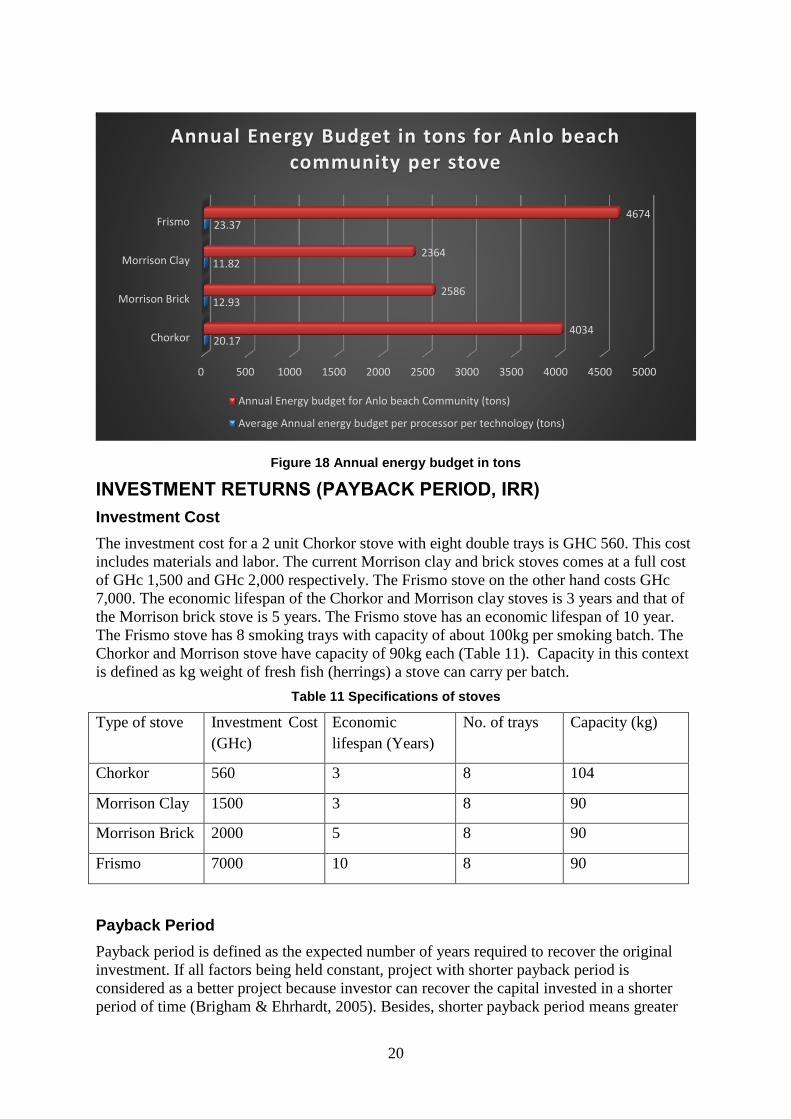
Annual Energy Budget
From the analysis, a fish processor who uses the Morrison clay stove requires an annual
budget of GHc 2096.80 for fuelwood. Adopting the Morrison brick stove, one will require an
energy budget of GHc 2293.40 for year (Table 9). Using the Chorkor stove, fish processor on
the average spends GHc 3577.20 on fuelwood and using Frismo will cost a processor GHc
4146.00 which is almost twice the cost of using the Morrison Clay stove. Figure 17 shows the
annual energy budget per smoking technology.
19
Table 9 Annual energy budget per stove
Stove Chorkor Frismo Morrison Clay Morrison Brick
Annual Energy 3577.00 4146.00 2096.80 2293.40
Budget (GHc)
Figure 17 Annual energy expenditure
4,500.00
4,000.00
3,500.00
3,000.00
2,500.00
2,000.00
1,500.00
1,000.00
500.00
0.00
Chorkor Morrison Brick Morrison Clay Frismo
Annual Energy Budget per season per stove technology
Total budget per bumper season Total budget per bumper season Annual Fuelwood budget (GHC)
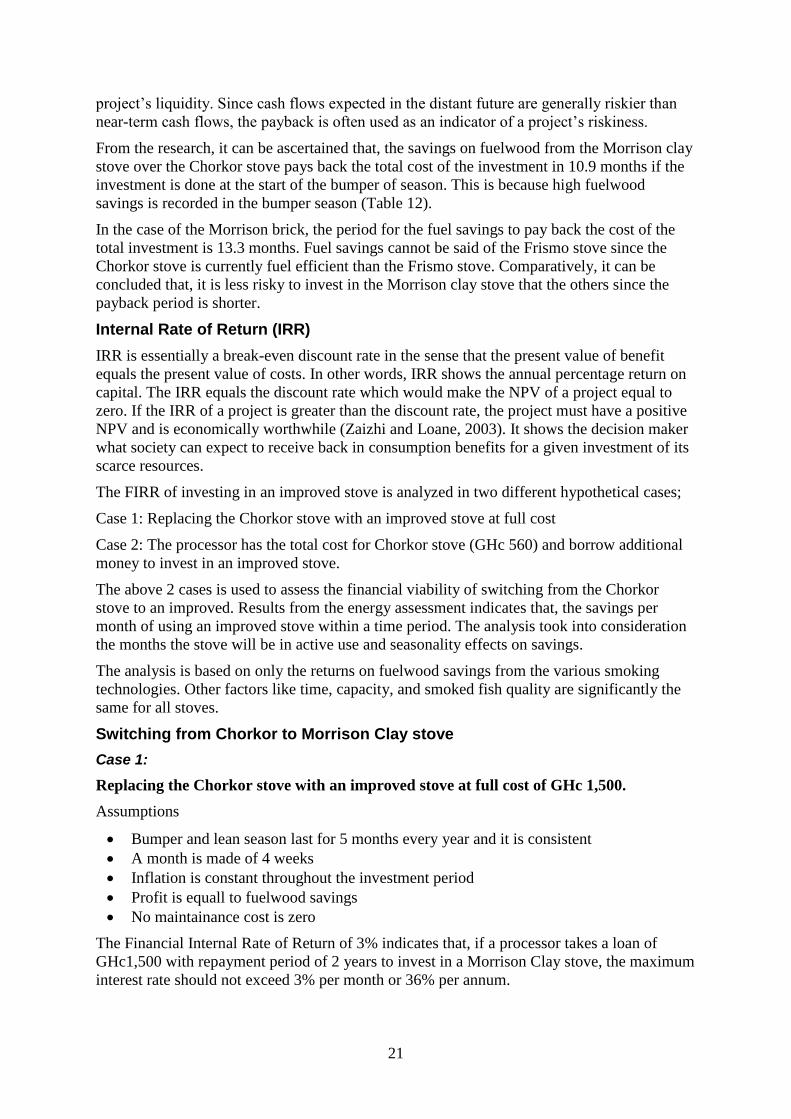
Energy Budget in Tons
In tons of fuelwood, the Morrison Clay stove uses 11.82 tons of wood per annum whereas the
Morrison Brick stove consumes 12.93 tons per annum. The Chorkor stove on the other side
consumes GHc 20.17 tons of wood per annum with the Frismo stove consuming 23.37 tons
of wood per annum. The current total energy consumption per annum for the entire Anlo
beach community is estimated to be 4,034 tons. Figure 18 shows the stove technology and its
estimated energy budget in tons of fuelwood.
Table 10 Energy budget in tons
Stove type Annual energy budget
fish processor (tons)
per
Annual
Anlo
(tons)
Energy
beach
budget for
Community
Chorkor 20.17 4034
Morrison Brick 12.93 2586
Morrison Clay 11.82 2364
Frismo 23.37 4674
20
Figure 18 Annual energy budget in tons
4674 Frismo 23.37
2364 Morrison Clay 11.82
2586 Morrison Brick 12.93
4034 Chorkor 20.17
0 500 1000 1500 2000 2500 3000 3500 4000 4500 5000
Annual Energy Budget in tons for Anlo beach community per stove
Annual Energy budget for Anlo beach Community (tons)
Average Annual energy budget per processor per technology (tons)
INVESTMENT RETURNS (PAYBACK PERIOD, IRR)
Investment Cost
The investment cost for a 2 unit Chorkor stove with eight double trays is GHC 560. This cost
includes materials and labor. The current Morrison clay and brick stoves comes at a full cost
of GHc 1,500 and GHc 2,000 respectively. The Frismo stove on the other hand costs GHc
7,000. The economic lifespan of the Chorkor and Morrison clay stoves is 3 years and that of
the Morrison brick stove is 5 years. The Frismo stove has an economic lifespan of 10 year.
The Frismo stove has 8 smoking trays with capacity of about 100kg per smoking batch. The
Chorkor and Morrison stove have capacity of 90kg each (Table 11). Capacity in this context
is defined as kg weight of fresh fish (herrings) a stove can carry per batch.
Table 11 Specifications of stoves
Type of stove Investment Cost
(GHc)
Economic
lifespan (Years)
No. of trays Capacity (kg)
Chorkor 560 3 8 104
Morrison Clay 1500 3 8 90
Morrison Brick 2000 5 8 90
Frismo 7000 10 8 90
Payback Period
Payback period is defined as the expected number of years required to recover the original
investment. If all factors being held constant, project with shorter payback period is
considered as a better project because investor can recover the capital invested in a shorter
period of time (Brigham & Ehrhardt, 2005). Besides, shorter payback period means greater
21
project’s liquidity. Since cash flows expected in the distant future are generally riskier than
near-term cash flows, the payback is often used as an indicator of a project’s riskiness.
From the research, it can be ascertained that, the savings on fuelwood from the Morrison clay
stove over the Chorkor stove pays back the total cost of the investment in 10.9 months if the
investment is done at the start of the bumper of season. This is because high fuelwood
savings is recorded in the bumper season (Table 12).
In the case of the Morrison brick, the period for the fuel savings to pay back the cost of the
total investment is 13.3 months. Fuel savings cannot be said of the Frismo stove since the
Chorkor stove is currently fuel efficient than the Frismo stove. Comparatively, it can be
concluded that, it is less risky to invest in the Morrison clay stove that the others since the
payback period is shorter.
Internal Rate of Return (IRR)
IRR is essentially a break-even discount rate in the sense that the present value of benefit
equals the present value of costs. In other words, IRR shows the annual percentage return on
capital. The IRR equals the discount rate which would make the NPV of a project equal to
zero. If the IRR of a project is greater than the discount rate, the project must have a positive
NPV and is economically worthwhile (Zaizhi and Loane, 2003). It shows the decision maker
what society can expect to receive back in consumption benefits for a given investment of its
scarce resources.
The FIRR of investing in an improved stove is analyzed in two different hypothetical cases;
Case 1: Replacing the Chorkor stove with an improved stove at full cost
Case 2: The processor has the total cost for Chorkor stove (GHc 560) and borrow additional
money to invest in an improved stove.
The above 2 cases is used to assess the financial viability of switching from the Chorkor
stove to an improved. Results from the energy assessment indicates that, the savings per
month of using an improved stove within a time period. The analysis took into consideration
the months the stove will be in active use and seasonality effects on savings.
The analysis is based on only the returns on fuelwood savings from the various smoking
technologies. Other factors like time, capacity, and smoked fish quality are significantly the
same for all stoves.
Switching from Chorkor to Morrison Clay stove
Case 1:
Replacing the Chorkor stove with an improved stove at full cost of GHc 1,500.
Assumptions
Bumper and lean season last for 5 months every year and it is consistent
A month is made of 4 weeks
Inflation is constant throughout the investment period
Profit is equall to fuelwood savings
No maintainance cost is zero
The Financial Internal Rate of Return of 3% indicates that, if a processor takes a loan of
GHc1,500 with repayment period of 2 years to invest in a Morrison Clay stove, the maximum
interest rate should not exceed 3% per month or 36% per annum.
22
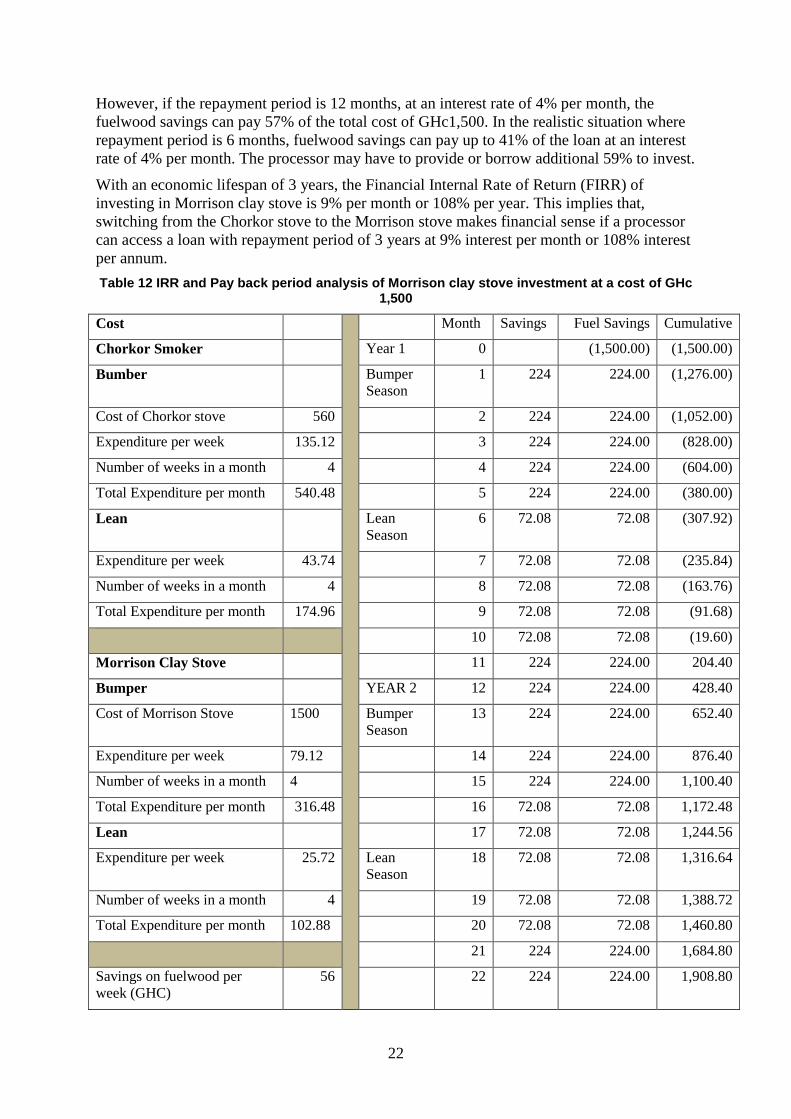
However, if the repayment period is 12 months, at an interest rate of 4% per month, the
fuelwood savings can pay 57% of the total cost of GHc1,500. In the realistic situation where
repayment period is 6 months, fuelwood savings can pay up to 41% of the loan at an interest
rate of 4% per month. The processor may have to provide or borrow additional 59% to invest.
With an economic lifespan of 3 years, the Financial Internal Rate of Return (FIRR) of
investing in Morrison clay stove is 9% per month or 108% per year. This implies that,
switching from the Chorkor stove to the Morrison stove makes financial sense if a processor
can access a loan with repayment period of 3 years at 9% interest per month or 108% interest
per annum.
Table 12 IRR and Pay back period analysis of Morrison clay stove investment at a cost of GHc 1,500
Cost Month Savings Fuel Savings Cumulative
Chorkor Smoker Year 1 0 (1,500.00) (1,500.00)
Bumber Bumper
Season
1 224 224.00 (1,276.00)
Cost of Chorkor stove 560 2 224 224.00 (1,052.00)
Expenditure per week 135.12 3 224 224.00 (828.00)
Number of weeks in a month 4 4 224 224.00 (604.00)
Total Expenditure per month 540.48 5 224 224.00 (380.00)
Lean Lean
Season
6 72.08 72.08 (307.92)
Expenditure per week 43.74 7 72.08 72.08 (235.84)
Number of weeks in a month 4 8 72.08 72.08 (163.76)
Total Expenditure per month 174.96 9 72.08 72.08 (91.68)
10 72.08 72.08 (19.60)
Morrison Clay Stove 11 224 224.00 204.40
Bumper YEAR 2 12 224 224.00 428.40
Cost of Morrison Stove 1500 Bumper
Season
13 224 224.00 652.40
Expenditure per week 79.12 14 224 224.00 876.40
Number of weeks in a month 4 15 224 224.00 1,100.40
Total Expenditure per month 316.48 16 72.08 72.08 1,172.48
Lean 17 72.08 72.08 1,244.56
Expenditure per week 25.72 Lean
Season
18 72.08 72.08 1,316.64
Number of weeks in a month 4 19 72.08 72.08 1,388.72
Total Expenditure per month 102.88 20 72.08 72.08 1,460.80
21 224 224.00 1,684.80
Savings on fuelwood per
week (GHC)
56 22 224 224.00 1,908.80
23
Cost Month Savings Fuel Savings Cumulative
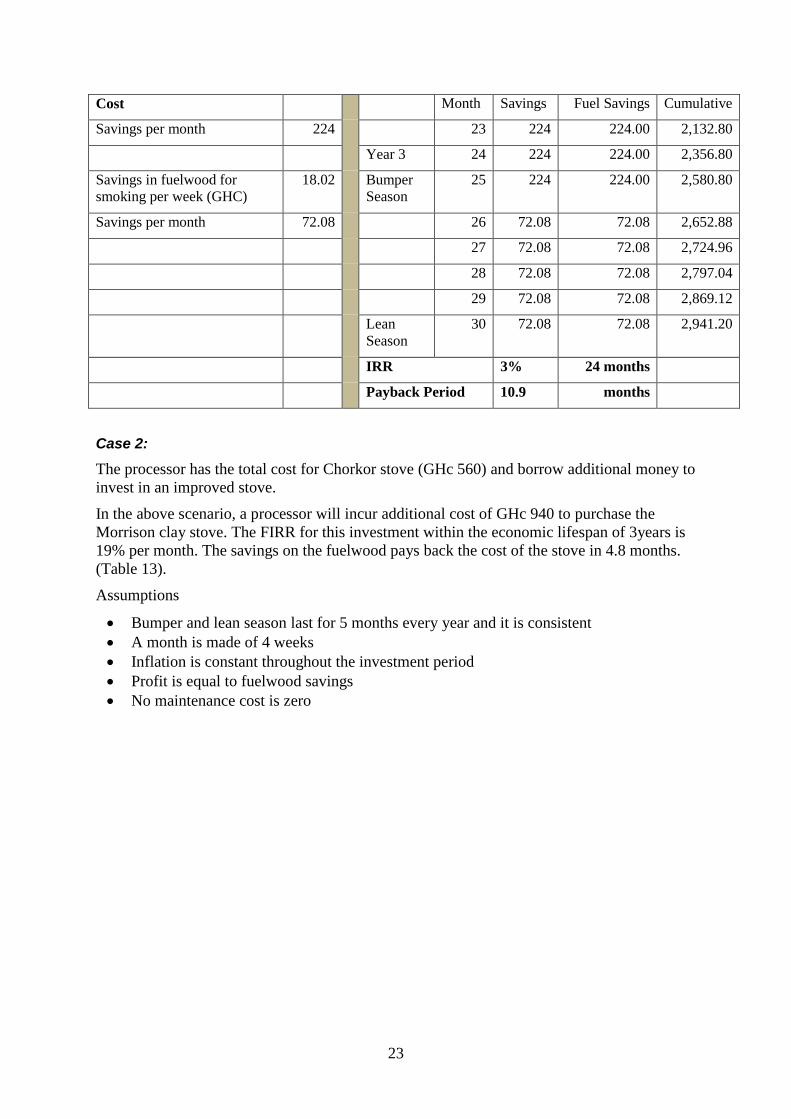
Savings per month 224 23 224 224.00 2,132.80
Year 3 24 224 224.00 2,356.80
Savings in fuelwood for
smoking per week (GHC)
18.02 Bumper
Season
25 224 224.00 2,580.80
Savings per month 72.08 26 72.08 72.08 2,652.88
27 72.08 72.08 2,724.96
28 72.08 72.08 2,797.04
29 72.08 72.08 2,869.12
Lean
Season
30 72.08 72.08 2,941.20
IRR 3% 24 months
Payback Period 10.9 months
Case 2:
The processor has the total cost for Chorkor stove (GHc 560) and borrow additional money to
invest in an improved stove.
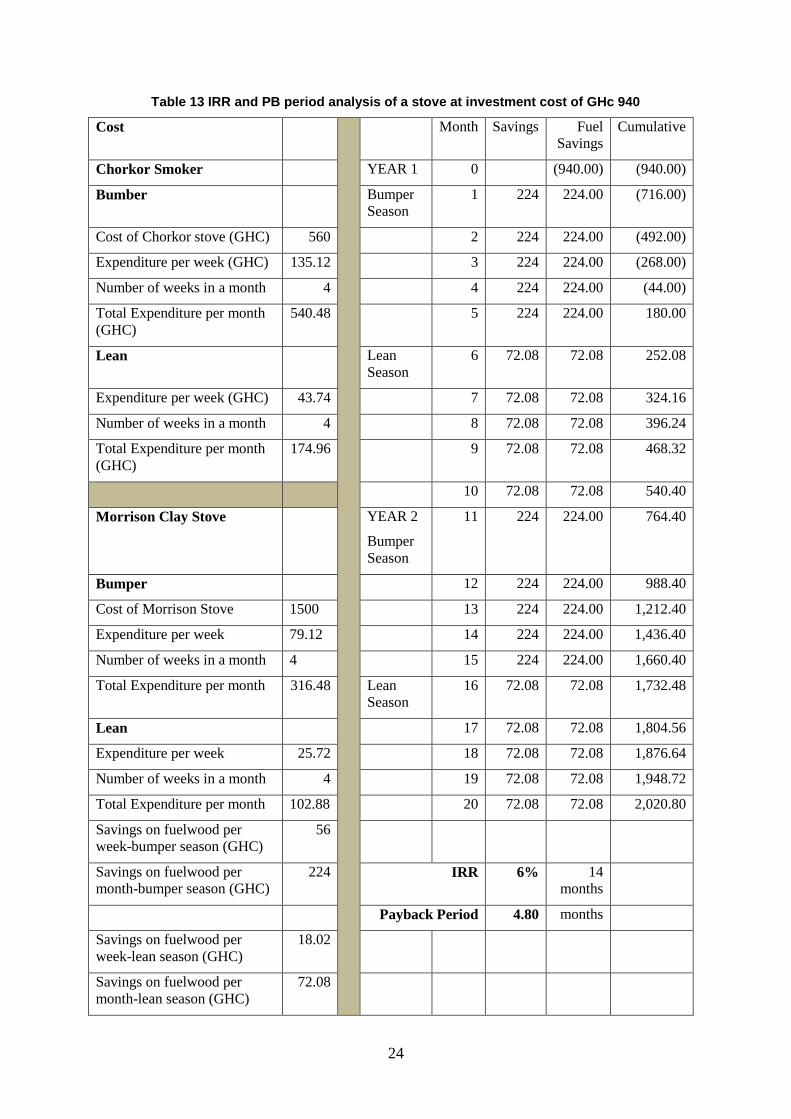
In the above scenario, a processor will incur additional cost of GHc 940 to purchase the
Morrison clay stove. The FIRR for this investment within the economic lifespan of 3years is
19% per month. The savings on the fuelwood pays back the cost of the stove in 4.8 months.
(Table 13).
Assumptions
Bumper and lean season last for 5 months every year and it is consistent
A month is made of 4 weeks
Inflation is constant throughout the investment period
Profit is equal to fuelwood savings
No maintenance cost is zero
24
Table 13 IRR and PB period analysis of a stove at investment cost of GHc 940
Cost Month Savings Fuel
Savings
Cumulative
Chorkor Smoker YEAR 1 0 (940.00) (940.00)
Bumber Bumper
Season
1 224 224.00 (716.00)
Cost of Chorkor stove (GHC) 560 2 224 224.00 (492.00)
Expenditure per week (GHC) 135.12 3 224 224.00 (268.00)
Number of weeks in a month 4 4 224 224.00 (44.00)
Total Expenditure per month
(GHC)
540.48 5 224 224.00 180.00
Lean Lean
Season
6 72.08 72.08 252.08
Expenditure per week (GHC) 43.74 7 72.08 72.08 324.16
Number of weeks in a month 4 8 72.08 72.08 396.24
Total Expenditure per month
(GHC)
174.96 9 72.08 72.08 468.32
10 72.08 72.08 540.40
Morrison Clay Stove YEAR 2
Bumper
Season
11 224 224.00 764.40
Bumper 12 224 224.00 988.40
Cost of Morrison Stove 1500 13 224 224.00 1,212.40
Expenditure per week 79.12 14 224 224.00 1,436.40
Number of weeks in a month 4 15 224 224.00 1,660.40
Total Expenditure per month 316.48 Lean
Season
16 72.08 72.08 1,732.48
Lean 17 72.08 72.08 1,804.56
Expenditure per week 25.72 18 72.08 72.08 1,876.64
Number of weeks in a month 4 19 72.08 72.08 1,948.72
Total Expenditure per month 102.88 20 72.08 72.08 2,020.80
Savings on fuelwood per
week-bumper season (GHC)
56
Savings on fuelwood per
month-bumper season (GHC)
224 IRR 6% 14
months
Payback Period 4.80 months
Savings on fuelwood per
week-lean season (GHC)
18.02
Savings on fuelwood per
month-lean season (GHC)
72.08
25
If a fish processor takes a loan with repayment period of 6 months at an interest rate of 4%
per month which is the more realistic case, the fuelwood savings can pay up to 66% of the
loan (GHc 940). The processor may have to rely on external funds to pay the difference of
34%.
Switching from Chorkor to Morrison Brick stove
Case 1:
Replacing the Chorkor stove with an improved stove at full cost of GHc 2,000.
The Morrison Brick stove has an economic lifespan of 5 years. The FIRR of investing in this
stove based on the fuelwood savings over the investment life 6% per month. This can be
explain as, if a processor can access a loan facility with a repayment period up to 5 years to
purchase the Morrison Brick stove at full cost, then the savings can pay back the cost of
investment and a cost of capital to maximum of 6% per month.
The investment is not feasible if a processor acquires a loan with repayment period of 2 years
to purchase the stove at full cost with total reliance on the fuelwood savings to pay back the
loan.
Since most fish processors falls into the category of microfinancing where loan repayment
barely go beyond a year, realistically 6 months, then, the savings on fuelwood can only pay
up to 27% of the loan amount of GHc 2,000 at an interest rate of 4% per month. A processor
may need an additional 73% funds to support the repayment.
Case 2:
The processor has the total cost for Chorkor stove (GHc 560) and borrow additional
money to invest in an improved stove.
In the above scenario, the processor will require an additional amount of GHc 1440 to
purchase the Morrison Brick stove. The payback period for this investment is 9.6 months.
The FIRR over the lifespan of the investment is 10% per month. This can be explain as, the
fuelwood savings on the investment can payback a loan with repayment period of 5 years at
an interest rate of 10% per month. This kind of loan is not common because, the repayment
period of 5 years with the loan amount in question will not be attractive to most banks.
In a more realistic case where loans with repayment period of 6 months at an interest rate of
4% (common with most MFIs) per month, the fuelwood savings from using the Morrison
Brick stove is capable of paying 37% of the loan.
Switching from Chorkor to Frismo stove
The cost of purchasing the Frismo stove is GHc 7,000. The research indicated the Frismo
stove technology consumes more fuelwood than the Chorkor stove therefore in terms of
fuelwood savings the Frismo stove is poor. There is therefore a negative average savings of
GHc 1138 per annum. Investing in this stove will require total reliance on external funds.
26
CONCLUSION
The rate of fuelwood consumption at the coast for fish processing cannot not be overlooked.
The study analyzed the various fish processing stove technologies, their consumption rate and
efficiencies, capacity, and their internal rate of returns.
Anlo Beach is a small community with about 190 smoked fish processors and about 600 fish
smoking stoves installed and in frequent use. Fuelwood is the main fuel for all the stoves
identified. 88% of the fish processors in the community possess their own processing stoves
and the remaining 12% depends on the peoples stove for their business.
56% of fuelwood consumed in the community are sourced from forest areas which comes in
a form of blocks and transported in trucks. 44% of the fuelwood are source from farm offcuts
and mangrove areas in nearby communities and are transport to the community in canoes by
river.
Two main fishing seasons are experienced in Anlo beach; the major (bumper season) and the
minor (lean season). The major harvesting season spans from July and stretches to November
with its major peak in August. The minor season continues from December through to April.
Seasonal fluctuations have significant influence on the fish smoking business as well as the
rate of fuelwood consumption.
Four different fish smoking stove technologies are available in Anlo beach; the Chorkor,
Morrison clay, Morrison brick and Frismo stove. A controlled cooking test analysis indicated
that, the Morrison Brick stove and the Morrison Clay stove are 43.1% and 49.7% more
efficient than the Chorkor stove respectively. The Frismo stove on the other hand is 19.1%
less efficient than the Chorkor stove.
The annual fuelwood consumption by each smoking technology was assessed and the
following were the findings; a fish processor who uses the Morrison clay stove needs an
annual budget of GHc 2096.80 for fuelwood. Adopting the Morrison brick stove, one will
require an energy budget of GHc 2293.40 for year. Using the Chorkor stove, fish processor
on the average spends GHc 3577.20 on fuelwood and using Frismo will cost a processor GHc
4146.00. In tons, the Morrison Clay stove 11.82 tons of wood per annum whereas the
Morrison Brick stove consumes 12.93 tons per annum. The Chorkor stove on the other side
consumes GHc 20.17 tons of wood per annum with the Frismo stove consuming 23.37 tons
of wood per annum. The current total energy consumption per annum for the entire Anlo
beach community is estimated to be 4,034 tons.
The Morrison clay stove has a better fuelwood savings ability with its fuelwood savings
paying back the full cost of the stove in 10.9 months. The fuelwood savings from the
Morrison brick stove pays back the full cost (GHc 2,000) in 13.3 months. The Frismo stove
on the other has no fuelwood savings over the Chorkor since the Chorkor tends to be energy
efficient than the Frismo stove.

27
APPENDIX
Questionnaire to the Fish Processor
SNV Netherlands Development Organisation is collecting information on energy budgets and
comparative economics of processing techniques at Anlo beach in the Western region of
Ghana to be able to determine the current energy consumptions, expenditure, its financial
implications on fish processing business and the direct impact on the environment to be able
to plan for future energy use and for to help develop sustainable mitigation measures.
Questionnaire No.: ................................ Interviewed by.............................................
1. Name of Respondent: .............................................................................................
2. Phone number: ……………..........................................................................................
3. Age ……………………… 4. Gender: 0.Male [ ] 1.Female [ ]
A. Extent of energy consumption
1. How long have you been in the fish smoking business?
………………………………………….
2. What form of fish do you mostly smoke?
1. Fresh catch from the sea
type……………………………………………………………………………..
2. Frozen fish
type……………………………………………………………………………………
……………….
3. How many boxes of fish do you smoke per day/week/month?
……………………………..
4. Which type of fuel do use for smoking fish: 1. Fuelwood [ ] 2. Fuelwood [ ] 3. Gas [
] others (specify)........................................................
5. Do you use any other type of fuel in smoking? 1. Coconut shell 2. Sugar cane 3.Both
sugar cane and coconut shell 4.Other (specify)
…………………………………………………………………..
1. What is the cost of the smoking material?
………………………………………………………………….
6. What is the name of your fish smoking stove? ............................................................
7. Do you own the fish smoking stove? 1. Yes 0. No How many?
…………………………………
8. Where do you buy the fuelwood from? 1. Retailer 2. Wholesaler 3. Transporters
4. Harvester/producers 5. Other
(specify)…………………………………………………………….

28
9. How much do you spend on the fuel for fish smoking per day/week/ month?
Activity Major fishing
season
Minor fishing
season
Total/Mon
th
Da
y
Wee
k
Mon
th
Da
y
Wee
k
Mon
th
What quantity of fuelwood do you use
(bundles/logs/ blocks/truck)
How much do you spend on fuelwood
(GHC)
11. Do you process the wood in any way before using for smoking? 1. Yes [ ] 0. No
[ ]
12. If Yes, what processing activities do you undertake? Please list them and the associated
costs?
Processing activity Quantity Unit cost
(GHC)
Total Cost (GHC)
1. Splitting of blocks
labour
hammer
chisel
2. Packing split wood
3. Others ……………………
F. Problems/challenges in fuelwood production
1. What are the main problems you face with your stove technology in the course of fish
smoking business?
a. .......................................................................................................................
b. .......................................................................................................................
c. ........................................................................................................................
2. What changes would you like to be implemented to make your fish smoking business and
working environment better?
a. ........................................................................................................................
b. ........................................................................................................................
c. ........................................................................................................................
29
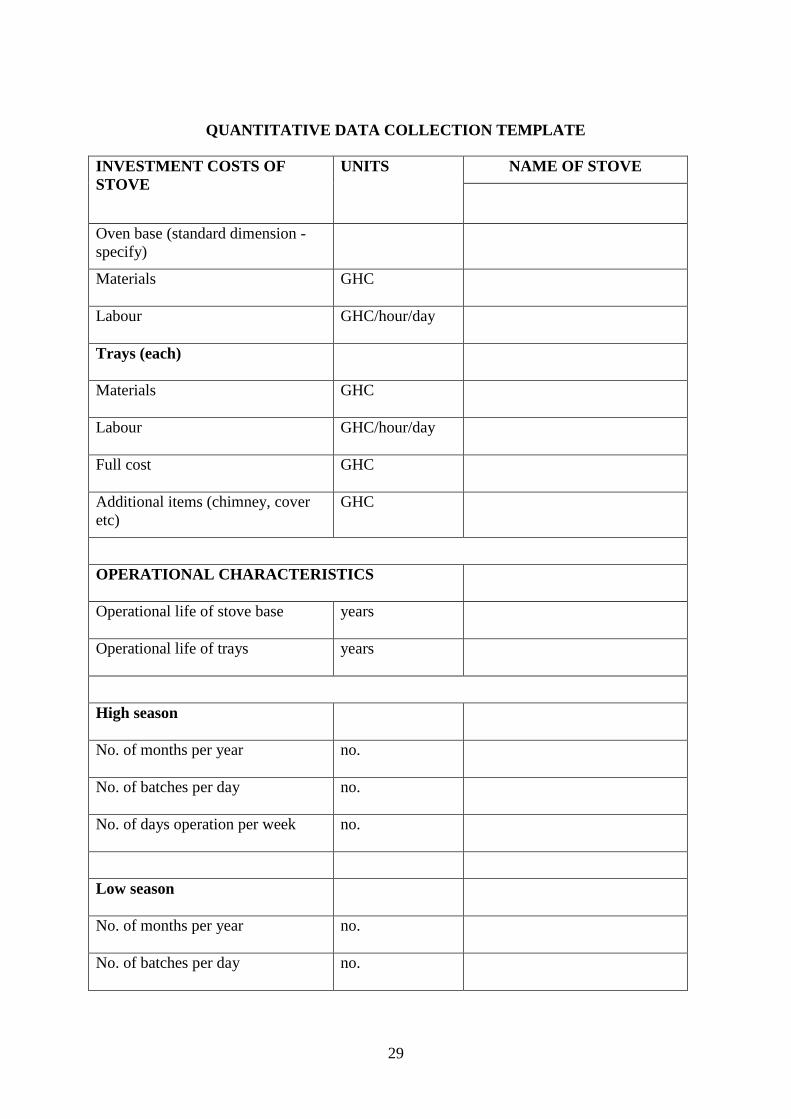
QUANTITATIVE DATA COLLECTION TEMPLATE
INVESTMENT COSTS OF
STOVE
UNITS NAME OF STOVE
Oven base (standard dimension -
specify)
Materials GHC
Labour GHC/hour/day
Trays (each)
Materials GHC
Labour GHC/hour/day
Full cost GHC
Additional items (chimney, cover
etc)
GHC
OPERATIONAL CHARACTERISTICS
Operational life of stove base years
Operational life of trays years
High season
No. of months per year no.
No. of batches per day no.
No. of days operation per week no.
Low season
No. of months per year no.
No. of batches per day no.
30
No. of days operation per week no.
INPUT COSTS
Smoker repairs and maintenance GHC/year
SALES
Cost of packaging/kg final product GHC/kg
Cost of transport/kg final product GHC/kg
Agents/market fees GHC/kg
Selling price per kg final product GHC/kg
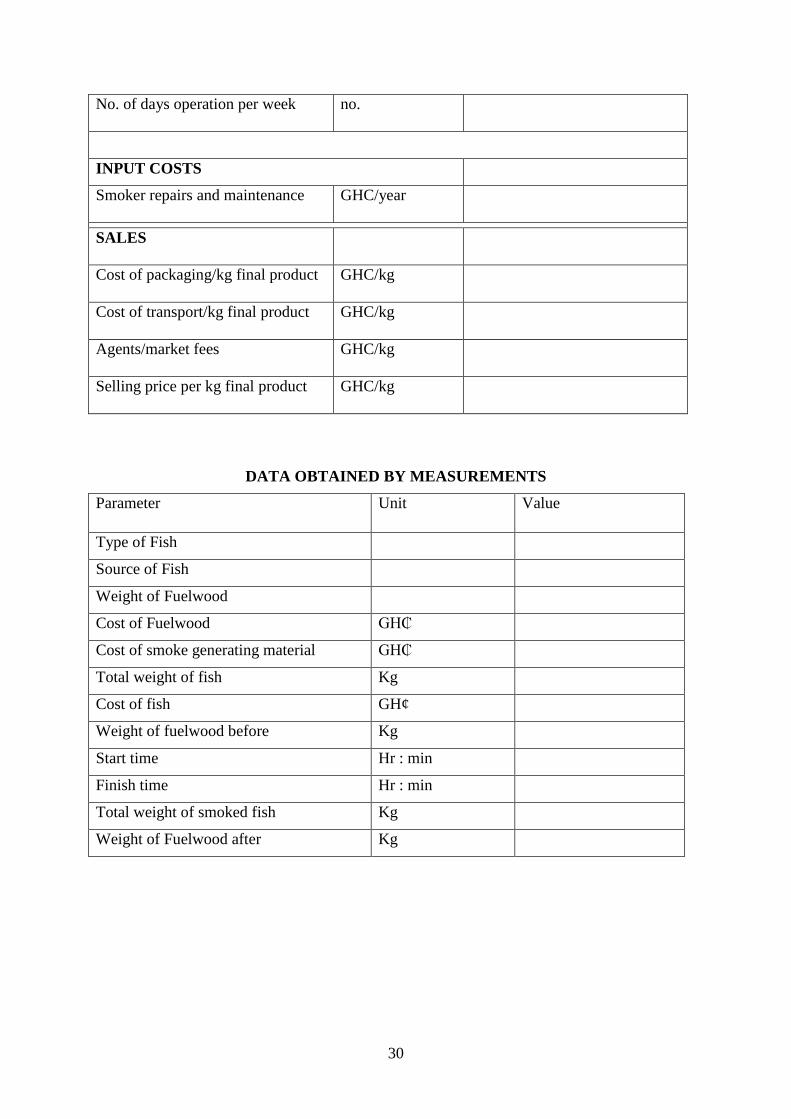
DATA OBTAINED BY MEASUREMENTS
Parameter Unit Value
Type of Fish
Source of Fish
Weight of Fuelwood
Cost of Fuelwood GH₵
Cost of smoke generating material GH₵
Total weight of fish Kg
Cost of fish GH¢
Weight of fuelwood before Kg
Start time Hr : min
Finish time Hr : min
Total weight of smoked fish Kg
Weight of Fuelwood after Kg
31
REFERENCES
Amuah, N.E.E.H, (2011). The potential of agroforestry in fuelwood production for domestic
and income generation activities – A case study of three communities in the Sunyani District
of the Brong Ahafo Region Ghana. MSc. Thesis, Department of Agorforestry, KNUST.
Brigham, E. F. in M. C. Ehrhardt. (2005). Financial Management: Theory and Practice.
Masson, OH (ZDA): South-Western.
Brownell, B., (1983). A practical guide to improved fish smoking in West Africa. UNICEF,
New York.
FAO. (2010). Global Forest Resources Assessment Report.
FAO. (2015). Global Forest Resources Assessment 2015, Desk reference.
Forestry Commission Of Ghana. (2010). Ghana R-PP (Annexes), June, 2012.
http://theredddesk.org/countries/ghana [Accessed April 2016].
Kwarteng, E. (2014). SNV Improved Fish Smoking Project (IFS), Fish smoking stoves
available locally and internationally, SNV Netherlands Development Organization.
Mason, J. J. (2008). Building a Sustainable Model based on Management and Payments for
Ecosystem Services, NCRC.
Obiri and Nunoo. (2014). An analysis of the wood fuel value chain in the Kintampo North
District, Brong Ahafo Region Ghana. Research Report, ITTO, Japan.
Obiri, B., Owusu-Afriyie, K., Kwarteng, E., Nutakor, Eric. (2015). Fuelwood value chain for
the Ghanaian fish smoking industry. The USAID/Ghana Sustainable Fisheries Management
Project (SFMP). Narragansett, RI: Coastal Resources Center, Graduate School of
Oceanography, University of Rhode Island.
Ocansey. (1985). The major significance of minor forest products. FAO, Corporate
documentary repository, Paris.
Tze, S. O., Chun, H. T. (2013). Net Present Value and Payback Period for Building
Integrated Photovoltaic Projects in Malaysia, International Journal of Academic Research in
Business and Social Sciences February 2013, Vol. 3, No. 2 ISSN: 2222-6990.
Zaizhi, Z. and Loane, W., 2003. “Benefit-Cost Analysis of Eucalyptus Management for
Sustainability in Southern China”, ACIAR Proceedings No.111.