energetics at the dna supercoiling transition
TRANSCRIPT
Biophysical Journal Volume 98 April 2010 1267–1276 1267
Energetics at the DNA Supercoiling Transition
Hergen Brutzer, Nicholas Luzzietti, Daniel Klaue, and Ralf Seidel*BIOTEChnology Center Dresden, University of Technology Dresden, Dresden, Germany
ABSTRACT Twisting a DNA molecule held under constant tension is accompanied by a transition from a linear to a plectonemicDNA configuration, in which part of the applied twist is absorbed in a superhelical structure. Recent experiments revealedthe occurrence of an abrupt extension change at the onset of this transition. To elucidate its origin we study this abrupt DNAshortening using magnetic tweezers. We find that it strongly depends on the length of the DNA molecule and the ionic strengthof the solution. This behavior can be well understood in the framework of a model in which the energy per writhe for the initialplectonemic loop is larger than for subsequent turns of the superhelix. By quantitative data analysis, relevant plectonemeenergies and other parameters were extracted, providing good agreement with a simple theory. As a direct confirmation ofthe initial-loop model, we find that for a kinked DNA molecule the abrupt extension change occurs at significantly lower twistthan the subsequent superhelix formation. This should allow pinning of the plectoneme position within supercoiled DNA if akinked substrate is used, and enable the detection of enzymes and proteins which, themselves, bend or kink DNA.
INTRODUCTION
DNA supercoiling in living organisms is a direct conse-
quence of the DNA helical structure. It arises during essential
cellular processes, such as replication and transcription,
when the corresponding cellular factors follow the helical
path of the molecule (1,2). Supercoiling needs therefore to
be counterbalanced (3), but also fulfills important tasks in
genome compaction and transcriptional regulation (4).
To better understand how supercoiling contributes to
cellular function, it is essential to know the mechanical
response of DNA upon overtwisting. A breakthrough for
this topic has been accomplished more than a decade ago,
when it become possible to twist a single DNA molecule
under an applied tension (5). Up to now, many transitions
that DNA undergoes during supercoiling as well as impor-
tant supercoiling parameters have been carefully character-
ized and described. This includes, for example, structural
transitions of B-DNA during supercoiling (6,7), the torsional
rigidity of DNA (8) as well as the twist-stretch coupling
(9,10), the direct measurement of torque during supercoiling
(11,12), and the dynamics of supercoil release (13).
Upon twisting DNA under constant tension, the DNA
length stays approximately constant, as nearly all induced
supercoils are stored in the form of twist. Once a critical
torque level is reached, the molecule undergoes a transition:
it buckles and enters the plectonemic phase in which part
of the DNA forms a superhelical structure. Additionally
added turns are seen in a linear decrease of the DNA length
(Fig. 1 A). The formed superhelix buffers any subsequently
applied twist as writhe (14). Although torque increases line-
arly with the number of added turns before buckling, it
remains constant in the plectonemic phase. The transition
Submitted October 6, 2009, and accepted for publication December 15,2009.
*Correspondence: [email protected]
Editor: Laura Finzi.
� 2010 by the Biophysical Society
0006-3495/10/04/1267/10 $2.00
between linear and plectonemic phase was for a long time
thought to occur gradually, based on the shape of the super-
coiling curves, i.e., plots of DNA length versus added turns
(15). Recently, however, a discrete and abrupt buckling, seen
as a sudden, major DNA length change, has been reported
(16). Whereas most previous measurements had been carried
out using magnetic tweezers, this new study employed
optical tweezers, which due to continuous rotation allowed
a higher resolution of the supercoiling curves. Though the
force dependence of the abrupt buckling transition has
been characterized, its exact origin remained unclear and it
has been speculated that it reflects the formation of the initial
plectonemic loop (16).
Here we investigated the dependence of the abrupt buck-
ling on the concentration of monovalent ions and on the
length of the DNA molecule using magnetic tweezers.
Although we confirm the presence of an abrupt buckling at
increased concentrations of monovalent ions, we find it to
become less pronounced and finally to disappear at low
(20 mM) concentrations of monovalent ions. In addition,
we see a strong dependence of the abrupt buckling on the
DNA length. Quantitative analysis of the postbuckling state
occupancy during supercoiling shows that the structure
formed during buckling is not fixed, but rather variable.
It can buffer considerably more than one supercoil in the
form of writhe depending on the applied force, the DNA
length, and the ionic strength of the solution. As the buckling
transition itself is spread over a certain finite range of applied
turns, we also see that the buckling structure varies through-
out the width of the transition, i.e., more writhe can be
accommodated at higher numbers of turns.
This behavior can be well understood within a model in
which a higher energy per writhe is required to extrude the
initial loop compared to form subsequent turns of the super-
helix. Using estimates for the relevant energies, we can
reproduce almost quantitatively the dependence of relevant
doi: 10.1016/j.bpj.2009.12.4292
A B
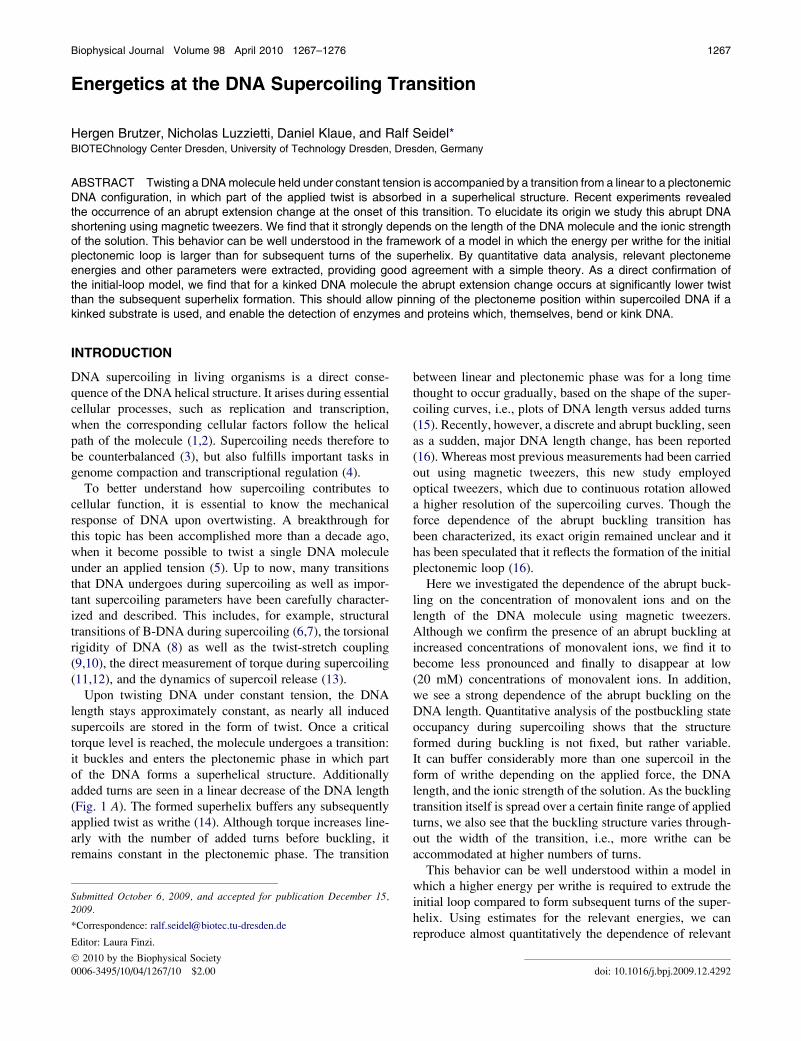
FIGURE 1 Buckling transition measured for different ionic strengths and
DNA lengths. (A) An ~1.9-kbp DNA molecule held at a constant force of
3.0 pN is continuously twisted with a frequency of 0.5 Hz and its length
is recorded simultaneously. Curves are shown for Naþ concentrations of
20 mM, 60 mM, and 320 mM (red, green, and black line). The cartoons
illustrate the experimental configuration and the transition from linear to
superhelical DNA (red line). The magnetic bead (gray sphere) and the
pair of magnets (blue squares) are also shown. (Inset) Enlarged view on
the supercoiling curves of the main figure at the buckling transition.
(B) Supercoiling curve for a 10.9-kbp DNA molecule twisted with 1 Hz at
3.0 pN force in buffer containing 320 mM Naþ. (Inset) Enlarged view on
the supercoiling curves of the main figure at the buckling transition. Data
were taken at 300 Hz and smoothed to 20 Hz.
1268 Brutzer et al.
buckling parameters, e.g., the buckling equilibrium point and
the associated torque change, on the different conditions.
Additionally we investigated a kinked DNA substrate, for
which we observe prebuckling (i.e., an abrupt buckling
before the actual superhelix formation). This behavior pro-
vides independent evidence of the initial-loop model.
Our results provide insight into the energetics of initial-
loop formation and reveal, as a consequence, the presence
of single and multiplectonemic states of supercoiled DNA.
Furthermore, they suggest that the plectoneme position on
kinked DNA substrates can be pinned to a fixed position.
MATERIALS AND METHODS
DNA substrate preparation
The short substrate for the magnetic tweezers experiments was prepared by
cutting a custom-made plasmid using the restriction enzymes XhoI and PvuI,
providing a linear fragment of 1865-bp length with corresponding sticky
ends on either side. Biotin- or digoxigenin-modified attachment handles
were made by digesting a 1.2-kbp biotin- and a digoxigenin dUTP-labeled
PCR fragment from plasmid pBluescript II SKþ (Stratagene, La Jolla,
CA) with XhoI or PvuI, respectively, approximately in the middle of
the fragments. The labeled fragments were subsequently ligated to the
1865-bp fragment. The long 10.9-kbp substrate was prepared similarly by
digesting an appropriate plasmid and the labeled attachment handles with
PciI and SacI. The kinked DNA substrate (1845 bp) was prepared from a
plasmid containing five directly repeated BbvCI sites with 16-bp spacing.
The plasmid was nicked at the BbvCI sites using Nt.BbvCI and simulta-
neously cut with BsrGI and PspOMI. The single-stranded gap resulting
from the nicking reaction was filled with a DNA single strand containing a
20-bp hairpin (N. Luzzietti, H. Brutzer, and R. Seidel, unpublished). Subse-
quently the DNA fragment was ligated as described above to labeled
attachment handles cut with BsrGI and PspOMI.
Biophysical Journal 98(7) 1267–1276
Sample preparation
DNA constructs were bound to 1-mm streptavidin-coated superparamagnetic
microspheres (MyOne, Invitrogen, Carlsbad, CA) and flushed into a flow
cell, whose bottom coverslip was coated with anti-digoxigenin. All measure-
ments were performed at room temperature in 10 mM phosphate buffer at
pH 7.5, supplemented with varying amounts of NaCl to achieve the final
Naþ concentrations as indicated in the text.
Magnetic tweezers
The basic magnetic tweezers protocol has been described (17,18).
The magnetic field was generated using a pair of permanent NdFeB magnets
(W-05-N50-G; Supermagnete, Uster, Switzerland). The length of the DNA
was monitored by measuring the vertical position of the magnetic micro-
sphere with respect to a nonmagnetic reference microsphere attached to
the surface of the flow cell using videomicroscopy and three-dimensional
particle tracking. Images of both beads were acquired simultaneously with
a frequency of 300 Hz using a fast CMOS-camera (EoSens CL; Mikrotron,
Unterschleissheim, Germany) and analyzed in real-time.
DNA supercoiling and data analysis
DNA supercoiling was carried out by rotating the magnetic field (typically at
0.5 Hz) and simultaneously monitoring the DNA length.
The jump size upon abrupt buckling and the postbuckling population was
obtained by fitting a double-Gaussian distribution to the histograms of the
DNA length (Fig. 2, A and B). The values Npb and DNp
b (see Results) were
obtained by fitting the postbuckling state population with Eq. 11, which
provided similar values as Eq. 5. At low forces (<1 pN), where the buckling
transition became too fast, Npb was determined from straight line fits to the
supercoiling curves. For high forces, both methods were found to produce
consistent results.
RESULTS
Abrupt buckling measured with magnetictweezers
Abrupt buckling upon DNA supercoiling has only recently
been discovered using optical tweezers (16). This technique,
however, requires an active feedback to keep the force
constant upon changes of the DNA length. To exclude arti-
facts of the particular measurement technique, we here
employed magnetic tweezers, to detect abrupt buckling at
the onset of supercoiling. In contrast to optical tweezers,
magnetic tweezers can be considered as a constant force
device over the length range of interest. For the supercoiling
experiments we used a short DNA molecule of ~1.9 kbp
length, similarly to one employed previously (16). In con-
trast to the standard magnetic tweezers measurements, in
which the DNA length is measured at discrete supercoiling
steps of full turns, we supercoiled DNA in a continuous
fashion, providing a high rotational resolution similar to
that used in the optical tweezers experiments (16).
At low amounts of monovalent ions (20 mM Naþ) we did
not observe an abrupt buckling, but instead a smooth transi-
tion from the linear to the plectonemic phase (Fig. 1 A, redline). This is more in line with the traditional picture of
DNA supercoiling (15). However, when increasing the ionic
strength (to 60 and 320 mM Naþ), a sudden jump, i.e., an
A B C
D
Buckling transition
ΔNb > 1
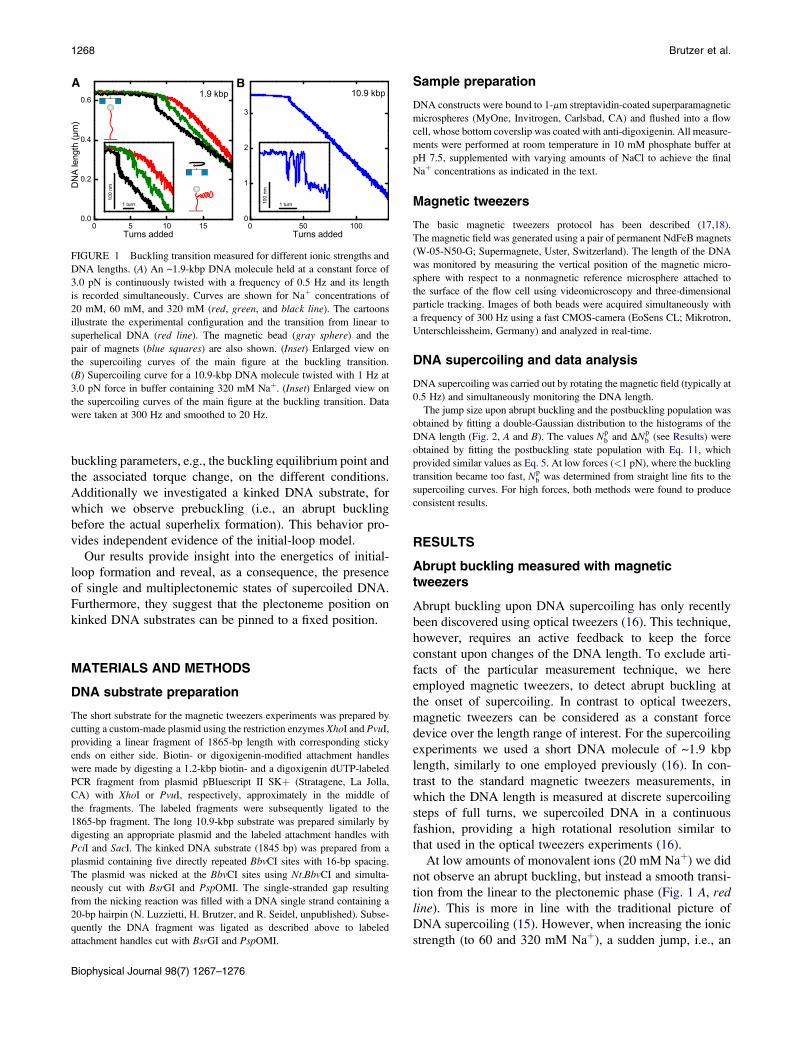
FIGURE 2 Equilibrium occupancy of pre- and postbuckling state. (A) 1.9 kbp and (B) 10.9 kbp DNA molecules were held at a constant force of 3.0 pN in
buffer containing 320 mM Naþ. Time traces were recorded at different amounts of added turns N in the vicinity of the buckling transition. Data were taken at
300 Hz. Normalized length histograms are shown on the right. The DNA was observed to rapidly fluctuate between two distinct states, the pre- and the post-
buckling state. Dotted lines are centered on the peaks of the uppermost histogram and indicate the shift of the states throughout the transition. (C) Occupancy of
the postbuckling state as function of added turns for both DNA lengths (red dots). Experimental conditions are as in panel A. Solid lines are fits to the data
according to Eq. 5, where DNb was taken to be free (black line, DNb of best fit shown in graph) or fixed to DNb ¼ 1 (gray). (D) Illustration representing the
behavior of DNA at the buckling transition, which can involve the formation of a structure comprising >1 turn of writhe.
DNA Supercoiling Transition 1269
abrupt buckling, can be observed before plectoneme for-
mation (Fig. 1 A, green and black lines). Notably, with
increasing salt the abrupt buckling becomes more pro-
nounced and occurs at fewer added turns, whereas the length
change per turn (i.e., the slope) of the supercoiling curve,
after the transition, is reduced.
We also tested the abrupt buckling for a long DNA mole-
cule of 10.9 kbp at 320 mM Naþ, and found it to be even
more pronounced (Fig. 1 B). The jump size increased notably
in length. In addition, the buckling transition ranged over
several turns, and comprised many fluctuations between
the pre- and postbuckling state.
This demonstrates that abrupt buckling is also observed
in constant force measurements with magnetic tweezers.
In addition to previous observations, we find that the abrupt
buckling depends strongly on the ionic strength and on the
length of the DNA.
The width of the buckling transition
The transition from pre- to the postbuckling state must coin-
cide with an abrupt reduction of the DNA twist and thus the
formation of writhe, because only increasing twist drives the
transition. The width of the transition should then provide
information about the abrupt twist reduction. We therefore
measured the population of pre- and postbuckling state under
equilibrium conditions. DNA molecules were held at con-
stant force and time traces were recorded at different discrete
numbers of added turns N, distributed over the width of the
buckling transition (Fig. 2, A and B). Near the buckling
transition, the DNA molecule rapidly fluctuates between a
pre- and postbuckling state for a fixed number of added
turns. In the histograms of the time traces, this can be seen
as two peaks, which are well fit by a Gaussian function.
With increasing amount of added turns, the postbuckling
state becomes more populated and the corresponding peak
becomes relatively larger. From Gaussian fits to the peaks,
we determined the probability for the postbuckling state to
be populated as function of added turns (Fig. 2 C).
A simple expression for the postbuckling state population
can be derived, assuming that for undergoing buckling, a
fixed free energy penalty Eb has to be paid. For example,
Eb must include the displacement of the magnetic bead and
increased DNA bending. The buckling is accompanied by a
twist reduction due to the formation of writhe. It occurs when
Eb is close to the change in twist energy. Before buckling, the
free energy of the DNA upon supercoiling is given by
(19,20)
EpreðNÞ ¼1
2
Cs
L0
ð2pÞ2N2; (1)
where L0 is the contour length of the DNA and Cs is the
effective torsional modulus with (19)
Cs ¼ C
�1� C
4p � kBT
�kBT
p � F
�1=2�: (2)
The value C denotes the DNA torsional modulus, p the
bending persistence length, and F the applied force. For
the torsional modulus and the persistence length, we used
values of 100 kBT nm (8) and 45 nm, respectively. Equation 2
accounts for the fact that, due to DNA writhe fluctuations,
not all added turns contribute to the twist stored in the DNA.
Upon buckling, the DNA twist energy is reduced. How-
ever, the energetic penalty Eb for the formation of the buck-
ling structure has to be overcome, which provides for the free
energy of the postbuckling state, as
EpostðN;DNbÞ ¼ Eb þ1
2
Cs
L0
ð2pÞ2ðN � DNbÞ2; (3)
Biophysical Journal 98(7) 1267–1276
1270 Brutzer et al.
where DNb is the amount of twist, which is transferred into
writhe during buckling. Within this simple two-state model,
the probability that the postbuckling state ppost is occupied
can be calculated using Boltzmann statistics:
ppost ¼1
1 þ exp�
Epost�Epre
kBT
�: (4)
Inserting Eqs. 1 and 3 into this expression yields
ppost ¼1
1 þ exp
�Cs
L0
ð2pÞ2ðNb � NÞDNb
�kBT
� (5)
with Nb being the number of added turns at the point of buck-
ling equilibrium, where the pre- and the postbuckling state
are equally populated. The value Nb is then given by
Nb :¼ NjEpre ¼Epost¼ Eb
Cs
L0
ð2pÞ2DNb
þ 1
2DNb: (6)
Surprisingly, fits of the experimentally obtained postbuck-
ling state occupancy with Eq. 5 provide values for DNb
which are considerably larger than one turn (Fig. 2 C). At
3.0 pN and 320 mM Naþ, we obtain for the writhe within
the buckling structure DNb ¼ 1.6 5 0.1 and 3.4 5 0.2 turns
for the short and the long DNA molecule, respectively.
Remarkable also is the DNA length dependence of DNb.
This suggests that upon abrupt buckling a fixed structure is
not formed, such as with a first initial loop, but instead
a continuous structure, such as a plectonemic superhelix
with multiple turns (Fig. 2 D).
Kinetics of the buckling transition
In addition to studying the equilibrium of the pre- and post-
buckling states, we also analyzed the kinetics at the buckling
transition. To extract the residence times of the individual
states, threshold values were applied to assign each time
point to the pre- or postbuckling state. From this a binary
step function was reconstructed and residence times were
calculated.
A B C
E1
E1+E2
Ple
cton
emic
ene
rgy
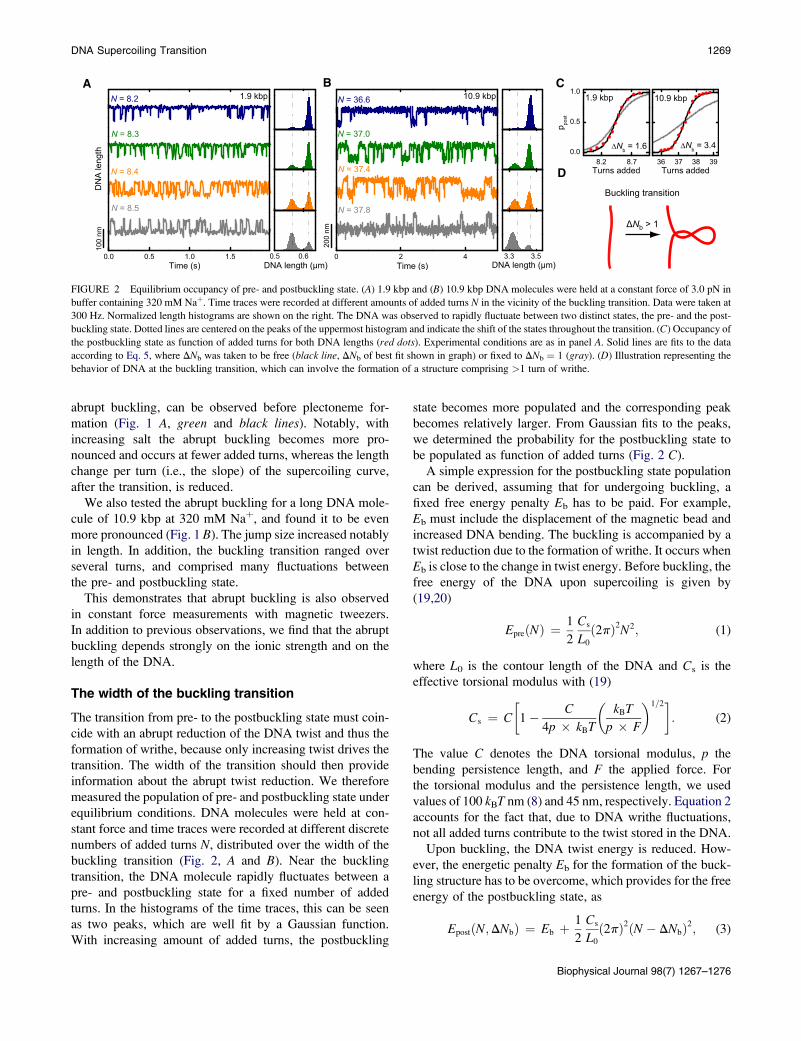
the 1.9 kbp and 10.9 kbp DNA molecule. Solid lines are exponential fits to t
DNpreb and DNpost
b are given in the figure. (C) Schematic drawing of the hypothe
landscape for the initial loop (dark blue straight line and light blue line with tran
with E2 for each subsequent turn. (Inset) Illustration of the plectoneme formatio
Biophysical Journal 98(7) 1267–1276
The residence times appear exponentially distributed for
the short molecules (Fig. 3 A), whereas a minor second expo-
nential component appears for the long DNA (not shown).
The mean residence times tpreb and t
postb change exponentially
with added turns (Fig. 3 B) in agreement with a two-state
system (Fig. 3 B). The torque in the DNA molecule changes
the height of the energy barrier for undergoing the transition.
One can describe the torque dependence of tpreb and t
postb by
adding the torque multiplied by the angular distance to the
barrier as an additional term into an Arrhenius equation,
which results into
t� ¼ tb exp
�� Cs
L0
ð2pÞ2ðN � NbÞDN�b�
kBT
�; (7)
where tb is the mean residence time at the buckling transi-
tion. The value DN�b is substituted by DNpreb or �DNpost
b
corresponding to the distance of the transition state to the
prebuckling or postbuckling state, respectively. Fitting
Eq. 7 to the experimental data, we find the transition state
to be approximately half-way between the pre- and the post-
buckling state for both molecule lengths (Fig. 3 B). Under-
standing of the energetic barrier needs further work, as there
might not be common transition pathways from prebuckling
to postbuckling state and vice versa. At 320 mM Naþ and
3.0 pN force we obtain tb ¼ 35.5 5 0.5 and 75.7 5 0.8 ms
for the short and the long molecule, respectively. Thus, tb
increases with molecular length. This might be due to slower
diffusion of the larger plectonemic structure for the long
molecule. Furthermore, we find that tb decreases, i.e., transi-
tions become more frequent at lower ionic strength and
lower force (data not shown). Generally, we observe that
the transition between the pre- and the postbuckling state
occurs considerably faster than observed previously with
optical tweezers (16). This might be due to different response
dynamics for both tweezers systems. The additional potential
set by the optical trap leads to different energy landscapes
for buckling, which can affect its dynamics.
End-loop model for abrupt buckling
The observations made so far, in particular the length-depen-
dent writhe of the buckling structure, are consistent with
1
E1(Nwr-1)×E2
2Writhe in plectoneme
FIGURE 3 Kinetics of the buckling transition.
Data shown is for 4.0 pN and 320 mM Naþ. (A)
Distributions of the residence times for the pre-
and postbuckling state close to the buckling equilib-
rium (9.8 turns) for the 1.9 kbp DNA molecule. The
solid lines represent a single exponential function
with the mean residence time as characteristic decay
time. (B) Mean residence times of the prebuckling
(red solid circles) and the postbuckling states
(blue solid circles) as function of added turns for
he data according to Eq. 7. The resulting distances to the transition state
tical energy landscape for plectoneme formation. Independent of the actual
sition state), the supercoiling energy attains E1 after one turn and increases
n energies E1 and E2.
DNA Supercoiling Transition 1271
a plectonemic superhelix formed upon abrupt buckling.
However, so far the structural and energetic basis underlying
the observed behavior remains unclear.
For a plectonemic superhelix an apparent discontinuity
can be found at the initial loop, which resembles more
a planar DNA loop (Fig. 3 C). For a given DNA segment
length it is energetically more favorable to form one turn
of the superhelix than a circular loop. Therefore, it is reason-
able to assume that the energy for the first turn of the
superhelix (initial loop) is larger than for any subsequent
superhelical turn. This is similar to an approach developed
by Daniels et al. (21), which only recently became available.
Let E1 be the free energy for the first turn of writhe in the
plectoneme, which comprises the additional energy for the
initial loop formation. The value E2 shall denote the free
energy of every subsequent writhe within the plectoneme
(Fig. 3 C). With Nwr denoting the writhe of the plectoneme,
the free energy of the DNA after buckling for Nwr R 1 is
given by
EppostðN;NwrÞ ¼ E1 þ E2ðNwr � 1Þ þ 1
2
Cs
L0
ð2pÞ2ðN� NwrÞ2:
(8)
The mean writhe Nwr,0 for a given number of added turns N is
then obtained by minimizing Eq. 8 with respect to Nwr.
Hence, one obtains Nwr,0 and the corresponding postbuckling
energy Eppost;0:
Nwr;0 ¼ N � E2
Cs
L0ð2pÞ2
; (9)
Eppost;0 ¼ E1 þ E2
N � 1
2
E2
Cs
L0ð2pÞ2
� 1
!: (10)
Inserting the last equation together with Eq. 1 into Eq. 4
provides now the probability for the DNA to be in the post-
buckling state pp within the framework of the initial-loop
model:
pp ¼1
1þ exp
(Cs
L0
ð2pÞ2ðNpb�NÞ
�DNp
b þðN�Np
bÞ2
�.kBT
):
(11)
In analogy to the simple model above, Npb represents the
position of the buckling transition, i.e., when pre- and post-
buckling state are equally populated:
Npb :¼ Nj
Epre ¼Eppost
¼ E2
Cs
L0ð2pÞ2
þ DNpb : (12)
The value DNpb is the average writhe of the abruptly forming
plectoneme at the buckling equilibrium point Npb , which can
be derived by
DNpb :¼ Nwr;0
N¼N
p
b
¼"
2ðE1 � E2ÞCs
L0ð2pÞ2
#1=2
: (13)
In contrast to the simpler model the writhe of the forming
plectoneme is now predicted to increase linearly with the
added turns, and not to be a constant over the transition
(see Eq. 9). This can directly be confirmed by the experi-
ments, because the postbuckling level shifts gradually
toward lower DNA length over the transition (see histogramsin Fig. 2 and Fig. S1 in the Supporting Material). Note that
within our derivation we limit Nwr not to be smaller than 1,
as we do not know the actual energy landscape for the initial
loop formation (Fig. 3 C). However, as long as DNpbR 1, the
actual energy landscape for the first turn (e.g., a linear
increase with or without an offset, or an additional transition
barrier) does not matter, because independent of the actual
landscape the same results are obtained (Fig. 3 C). As we
find DNpbR 1 for our experimental data, this model is well
applicable.
Estimating the plectoneme formation energies E1
and E2
If E1 and E2 are known, one can predict the mean torque Gand the mean DNA length L as a function of the added turns
and applied force using the expressions derived above,
GðN;FÞ ¼ Cs
L0
2pN � Nwr;0 � pp
�; (14)
LðN;FÞ ¼ L0 � zðF;GÞ ��
DL1 þ ðNwr;0 � 1Þ � dL
dN
�� pp;
(15)
where z(F, G) is the relative extension of the DNA (19), DL1
the length reduction for the initial loop, and dL/dN the slope
of the supercoiling curves after the buckling transition (see
Supporting Material for full expressions). To estimate the
length reduction DL1 as well as the energy E1 for the initial
loop, we assume it to be a perfect circular loop and calculate
its bending energy as well as the energy necessary to shorten
the DNA against the applied force. This is similar to the
simple-loop model used previously to derive an estimate
for postbuckling torque and slope (15), except that here the
DNA shortening is corrected by the relative extension of
the DNA (22). One then obtains for the initial-loop energy
(see Supporting Material):
E1 ¼ 2p½2kBT � p � F � zðF; 0Þ�1=2: (16)
To obtain an estimate for E2, we use the expression for the
postbuckling torque G derived within the composite model
by Marko (20),
Biophysical Journal 98(7) 1267–1276
1272 Brutzer et al.
E2 ¼ 2pG ¼ 2p
8>><>>:
2P ��
F��
kBT � F
p
�1=2�
1� P
Cs
9>>=>>;
1=2
;
(17)
where P is the plectonemic twist stiffness, which is a freely
adjustable parameter depending on the ionic strength of the
solution. The value P is also related to the postbuckling slope
dL/dN (16,20) and can thus be obtained by fitting experi-
mental data (see Supporting Material). We obtained values
for P of 31, 28, 24, 21 kBT nm for 30, 60, 170, 320 mM
Naþ, respectively, in good agreement with previously pub-
lished data (20,23). We note, however, that the composite
model (20) does not provide a satisfactory description of the
postbuckling slope over the full range of applied forces (12).
Using Eqs. 11–16, we can now predict the DNA length
and the torque upon DNA supercoiling at constant force.
Examples of measured and predicted supercoiling curves
can be seen in Fig. 4, A and B. Most importantly our model
can well describe abrupt buckling. Despite simple estimates
for E1 and E2, we obtain remarkable agreement with the
experimental data regarding the buckling point, the width
of the transition, and the jump length.
A B
C D
(E1- E2)/2π
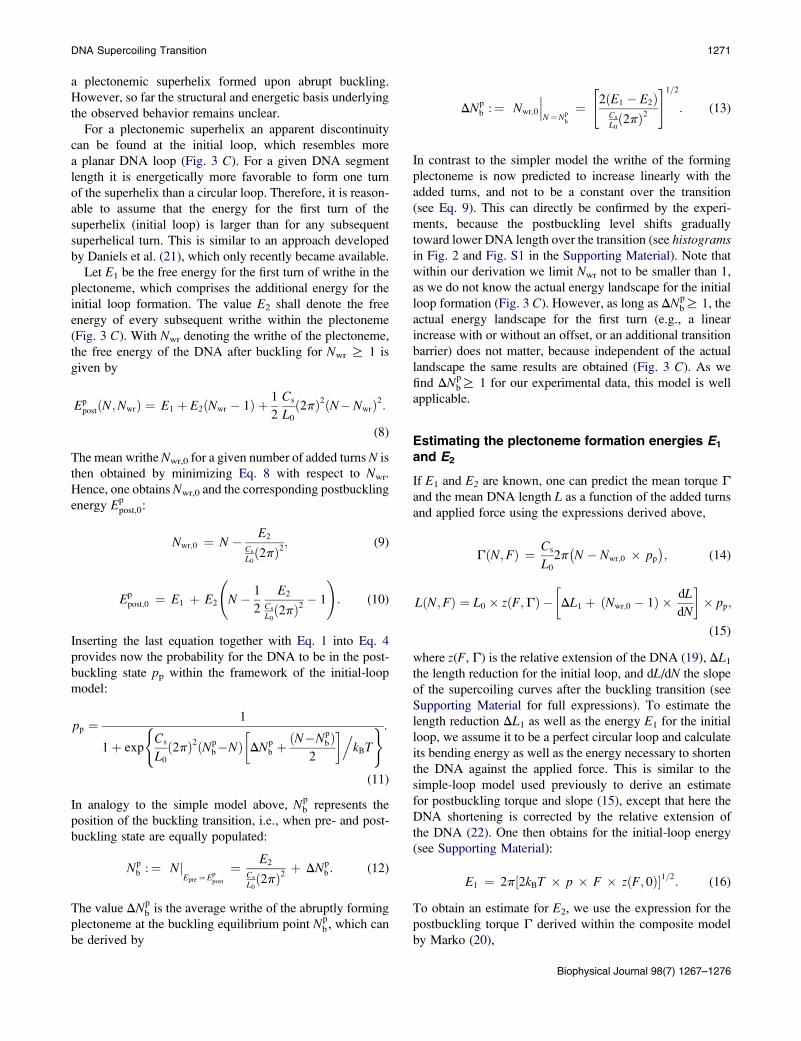
FIGURE 4 Measured supercoiling curves and predictions from the initial-
loop model. (A and B) Supercoiling curves for a 1.9 kbp DNA molecule at
3.0 pN in a buffer containing 320 mM and 60 mM Naþ (as indicated). Data
were taken at 300 Hz (dark shading) and smoothed to 20 Hz (light shading).
The solid red line is the prediction from the initial-loop model according to
Eq. 15 using estimates for the plectoneme formation energies E1 and E2
(Eqs. 16 and 17). (C) Salt dependence of supercoiling curves and (D) torque
development as predicted by the initial-loop model. The shaded area
between the torque overshoot and the postbuckling torque under the black
curve corresponds to the difference between the initial loop energy E1 and
superhelix formation energy E2.
Biophysical Journal 98(7) 1267–1276
We also calculated supercoiling curves and the associated
torque at different salt concentrations (Fig. 4, C and D).
As for the experimental data (Fig. 1 A), the buckling transi-
tion becomes less pronounced at lower salt concentrations.
The presence of an abrupt buckling transition is associated
with an overshoot of the torque, arising from the sudden
writhe formation within the plectoneme (Fig. 4 D). The ener-
getic difference between the initial-loop formation energy
E1 and the superhelix-formation energy E2 corresponds to
the area enclosed by the torque overshoot and the postbuck-
ling torque (shaded area in Fig. 4 D). Thus, the torsional
overshoot and correspondingly the abrupt buckling transition
are required to ensure the compensatory work for initial-loop
formation. With decreasing ionic strength the electrostatic
repulsion between the DNA strands in the plectoneme
increases, which is associated with an increase of the post-
buckling torque and correspondingly of E2 (Fig. 4 D). For
the initial loop, electrostatics plays supposedly a minor
role due to the larger DNA-DNA distance within the loop.
It should therefore change much less with the ionic strength.
Therefore, the difference between E1 and E2 becomes
smaller with decreasing ionic strength, which readily
explains the disappearance of the abrupt buckling.
Force dependence of the buckling transition
To further support the initial-loop model for abrupt buckling
we compared several parameters obtained from experiment
and theoretical prediction. Though we use only estimates
for E1 and E2, important trends, such as the scaling with
the molecule length, should be correctly predicted.
The jump size, Npb, and DNp
b were obtained as described in
Materials and Methods. The plectoneme formation energies
E1 and E2 were calculated from Npb and DNp
b according to the
following relations, which were derived from Eqs. 12
and 13:
E2 ¼Cs
Lð2pÞ2ðNp
b � DNpbÞ; (18)
E1 ¼1
2
Cs
Lð2pÞ2DNp2
b þ E2: (19)
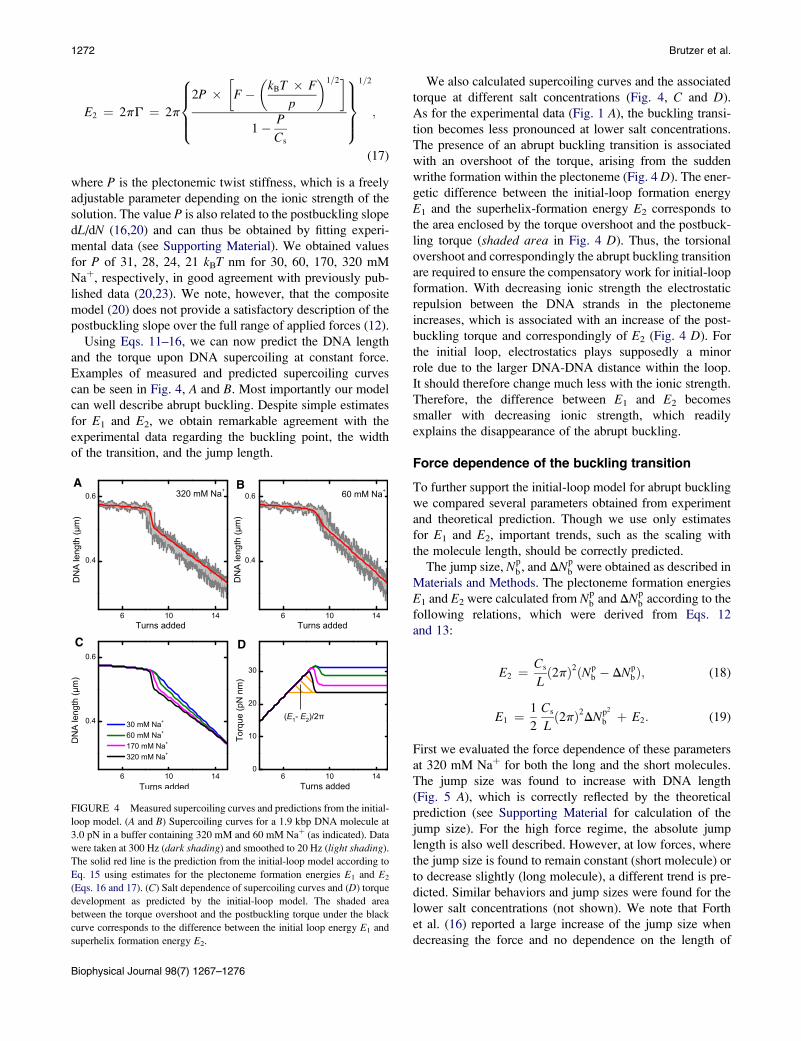
First we evaluated the force dependence of these parameters
at 320 mM Naþ for both the long and the short molecules.
The jump size was found to increase with DNA length
(Fig. 5 A), which is correctly reflected by the theoretical
prediction (see Supporting Material for calculation of the
jump size). For the high force regime, the absolute jump
length is also well described. However, at low forces, where
the jump size is found to remain constant (short molecule) or
to decrease slightly (long molecule), a different trend is pre-
dicted. Similar behaviors and jump sizes were found for the
lower salt concentrations (not shown). We note that Forth
et al. (16) reported a large increase of the jump size when
decreasing the force and no dependence on the length of
A B
C D
FIGURE 5 Force dependence of the buckling transition at 320 mM Naþ
for the 1.9 kbp (black) and the 10.9 kbp DNA molecule (blue). Experimental
values are shown as solid circles, predictions from the end-loop model as
solid lines. In the case of an overlap, only the black curve is depicted.
(A) Jump size at buckling equilibrium. (B) Position of the buckling equilib-
rium. To highlight the DNA length dependence, the right axis, correspond-
ing to the 10.9 kbp DNA molecule, was scaled linearly with DNA length
compared to the left axis corresponding to the 1.9 kbp DNA molecule.
(C) Change of twist transferred into writhe during buckling DNpb at buckling
equilibrium and corresponding torque change DGb ¼ 2pCs=L� DNpb .
The expected scaling of DNpb with the square root of the DNA length is high-
lighted by scaling the axes accordingly (Eq. 13). (D) (Top) Superhelix-
formation energy E2 and inferred postbuckling torque. (Bottom) Energy
difference between the initial-loop formation energy E1 and E2. Error bars
represent the statistical error of the data.
DNA Supercoiling Transition 1273
the DNA. In our measurements all jump sizes were directly
obtained from Gaussian fits to the DNA length distribution at
the buckling equilibrium, leaving very little room for ambi-
guity. Furthermore, the abrupt buckling was especially well
resolved for the long DNA molecule. The observed DNA
length dependence of the jump size agrees well with the
observed length dependence of DNpb (i.e., the writhe change
during buckling; see Fig. 2 C and below) because a longer
plectoneme should also contain more DNA. We currently
do not have an explanation for the discrepancy between
the different data. We note that small changes in the expres-
sion for E1 can remarkably change the force dependence of
the jump length, although retaining the trend for the other
parameters (21). Beyond simple estimates for E1, a more
elaborate theory is required to substantiate the observed
jump lengths.
For DNpb our model predicts a scaling with the square root
of the DNA length (Eq. 13). Therefore, Npb does not increase
linearly with DNA length but is slightly reduced. To high-
light this behavior, we scaled the data for the two DNA
lengths linearly in the case of Npb (Fig. 5 B) and with the
square root of the DNA length in the case of DNpb (Fig. 5 C).
Within error we can indeed confirm the prediction. The
general trend and magnitude for the two parameters with
increasing force are well described, though we somewhat
overestimate DNpb and the corresponding torque jump upon
buckling DGb.
For E2, which is directly related to the postbuckling tor-
que, the data is in agreement with the prediction from Marko
(20) (Fig. 5 D, top). Only a slight variation of the postbuck-
ling torque was observed for both DNA lengths, which
reflects the experimental error of the procedure. We note
that the absolute value of E2 depends directly on the torsional
modulus of the DNA, for which we take 100 kBT nm. Thus,
using a lower torsional modulus (for example, 94 kBT nm
(12)) will reduce the obtained values for E2 and the post-
buckling torque.
We also obtained the energy difference between E1 and
E2, which can be considered as a nucleation barrier for plec-
toneme formation. It amounts to several kBT at 320 mM Naþ
for the force range considered (Fig. 5 D, bottom), which
should strongly favor the existence of only a single plecto-
neme (see Discussion and Conclusions below). Similar to
DNpb, the energetic difference between E1 and E2 is also
slightly overestimated by the prediction, though the general
trend is well described.
Salt dependence of the buckling transition
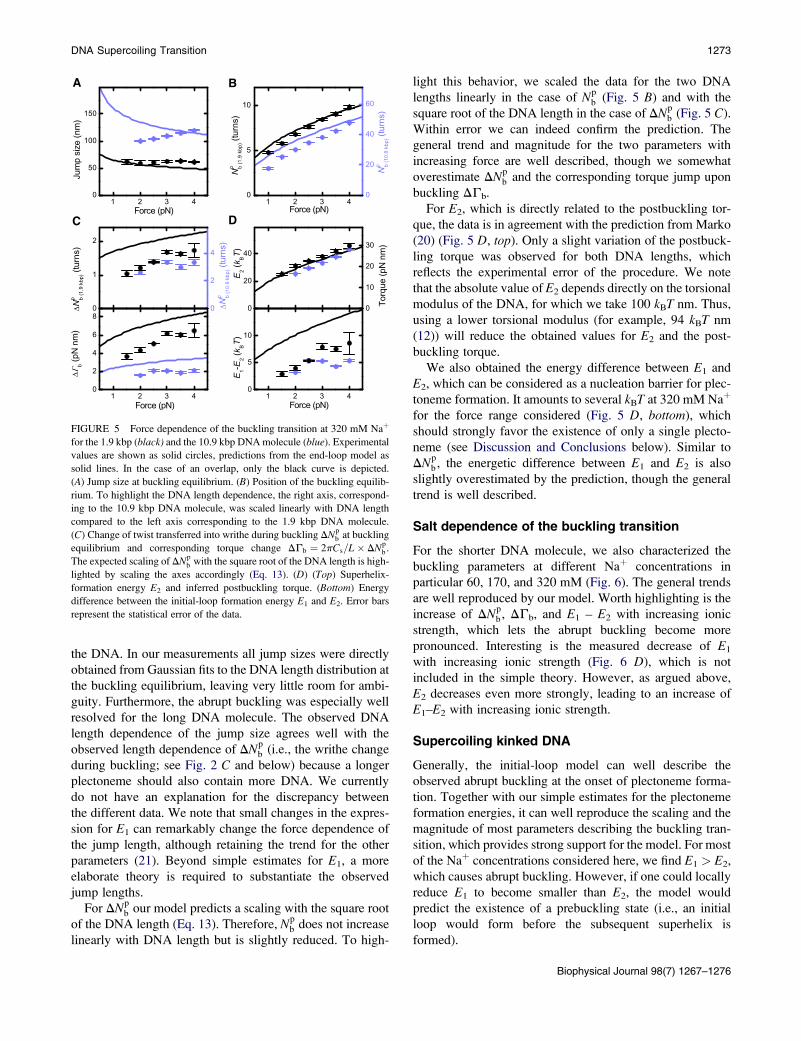
For the shorter DNA molecule, we also characterized the
buckling parameters at different Naþ concentrations in
particular 60, 170, and 320 mM (Fig. 6). The general trends
are well reproduced by our model. Worth highlighting is the
increase of DNpb, DGb, and E1 – E2 with increasing ionic
strength, which lets the abrupt buckling become more
pronounced. Interesting is the measured decrease of E1
with increasing ionic strength (Fig. 6 D), which is not
included in the simple theory. However, as argued above,
E2 decreases even more strongly, leading to an increase of
E1–E2 with increasing ionic strength.
Supercoiling kinked DNA
Generally, the initial-loop model can well describe the
observed abrupt buckling at the onset of plectoneme forma-
tion. Together with our simple estimates for the plectoneme
formation energies, it can well reproduce the scaling and the
magnitude of most parameters describing the buckling tran-
sition, which provides strong support for the model. For most
of the Naþ concentrations considered here, we find E1 > E2,
which causes abrupt buckling. However, if one could locally
reduce E1 to become smaller than E2, the model would
predict the existence of a prebuckling state (i.e., an initial
loop would form before the subsequent superhelix is
formed).
Biophysical Journal 98(7) 1267–1276
A B
C D
FIGURE 6 Salt dependence of the buckling transition parameters at
3.5 pN for the 1.9 kbp DNA molecule. Experimental values are shown as
circles. Predictions from the initial-loop model are shown as black lines.
(A) Jump size at buckling equilibrium. (B) Position of the buckling equilib-
rium. (C) Change of twist transferred into writhe during buckling DNpb at the
buckling equilibrium and corresponding torque change DGb. (D) Super-
helix-formation energy E2, inferred postbuckling torque (solid circles and
solid line), and initial-loop formation energy E1 (open circles and dashed
line). (Inset) Energy difference between E1 and E2.
1274 Brutzer et al.
To test the prediction, a DNA construct was prepared in
which a three-arm junction was incorporated (see Materials
and Methods). This junction introduces a kink of ~120�
(Fig. 7 A) and should significantly reduce the initial-loop
formation energy E1.
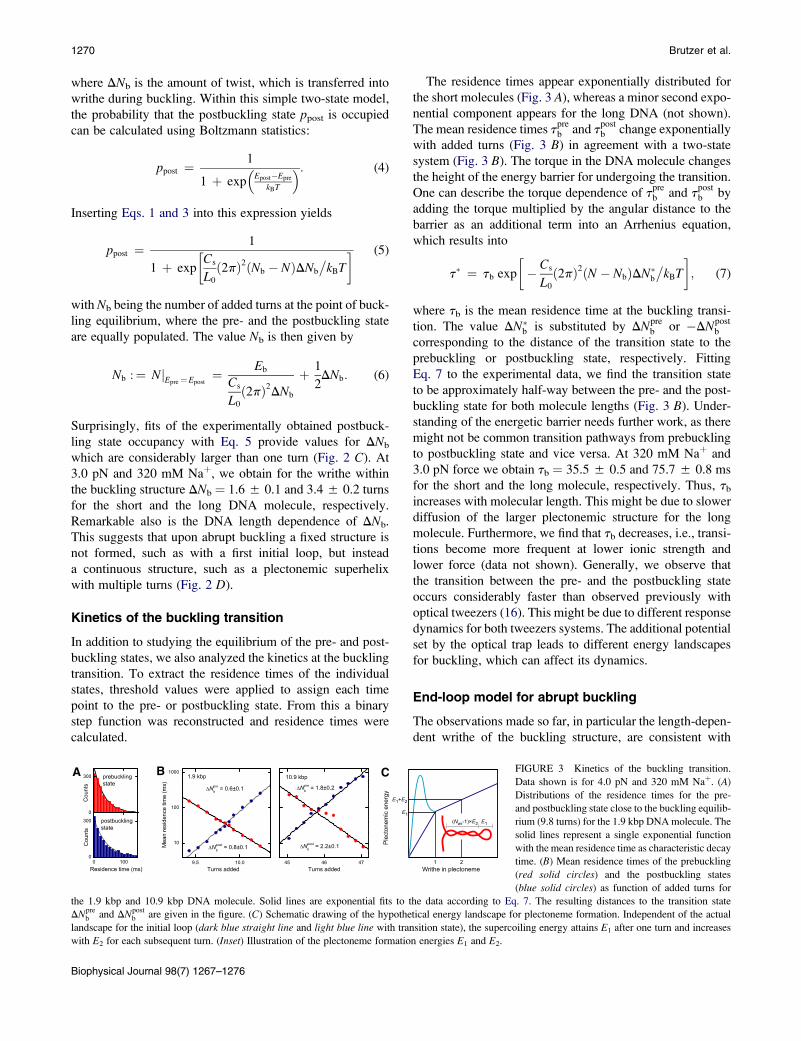
20 bp
120°
A B
12.5 kBT
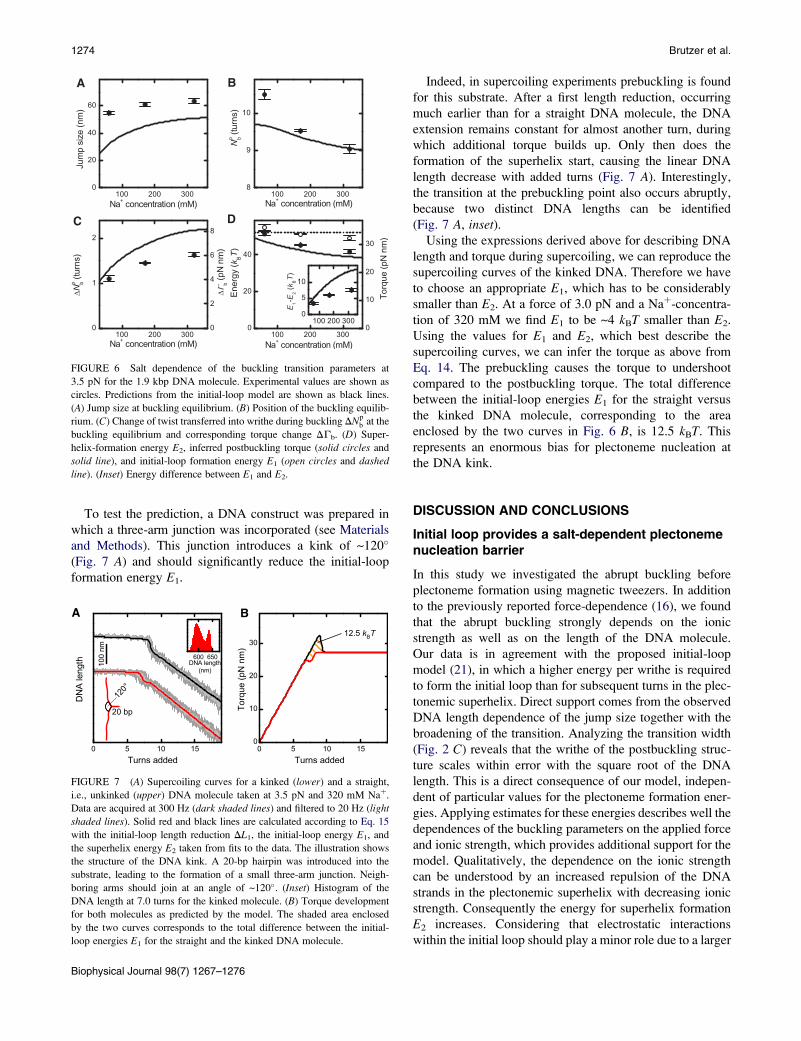
FIGURE 7 (A) Supercoiling curves for a kinked (lower) and a straight,
i.e., unkinked (upper) DNA molecule taken at 3.5 pN and 320 mM Naþ.
Data are acquired at 300 Hz (dark shaded lines) and filtered to 20 Hz (light
shaded lines). Solid red and black lines are calculated according to Eq. 15
with the initial-loop length reduction DL1, the initial-loop energy E1, and
the superhelix energy E2 taken from fits to the data. The illustration shows
the structure of the DNA kink. A 20-bp hairpin was introduced into the
substrate, leading to the formation of a small three-arm junction. Neigh-
boring arms should join at an angle of ~120�. (Inset) Histogram of the
DNA length at 7.0 turns for the kinked molecule. (B) Torque development
for both molecules as predicted by the model. The shaded area enclosed
by the two curves corresponds to the total difference between the initial-
loop energies E1 for the straight and the kinked DNA molecule.
Biophysical Journal 98(7) 1267–1276
Indeed, in supercoiling experiments prebuckling is found
for this substrate. After a first length reduction, occurring
much earlier than for a straight DNA molecule, the DNA
extension remains constant for almost another turn, during
which additional torque builds up. Only then does the
formation of the superhelix start, causing the linear DNA
length decrease with added turns (Fig. 7 A). Interestingly,
the transition at the prebuckling point also occurs abruptly,
because two distinct DNA lengths can be identified
(Fig. 7 A, inset).Using the expressions derived above for describing DNA
length and torque during supercoiling, we can reproduce the
supercoiling curves of the kinked DNA. Therefore we have
to choose an appropriate E1, which has to be considerably
smaller than E2. At a force of 3.0 pN and a Naþ-concentra-
tion of 320 mM we find E1 to be ~4 kBT smaller than E2.
Using the values for E1 and E2, which best describe the
supercoiling curves, we can infer the torque as above from
Eq. 14. The prebuckling causes the torque to undershoot
compared to the postbuckling torque. The total difference
between the initial-loop energies E1 for the straight versus
the kinked DNA molecule, corresponding to the area
enclosed by the two curves in Fig. 6 B, is 12.5 kBT. This
represents an enormous bias for plectoneme nucleation at
the DNA kink.
DISCUSSION AND CONCLUSIONS
Initial loop provides a salt-dependent plectonemenucleation barrier
In this study we investigated the abrupt buckling before
plectoneme formation using magnetic tweezers. In addition
to the previously reported force-dependence (16), we found
that the abrupt buckling strongly depends on the ionic
strength as well as on the length of the DNA molecule.
Our data is in agreement with the proposed initial-loop
model (21), in which a higher energy per writhe is required
to form the initial loop than for subsequent turns in the plec-
tonemic superhelix. Direct support comes from the observed
DNA length dependence of the jump size together with the
broadening of the transition. Analyzing the transition width
(Fig. 2 C) reveals that the writhe of the postbuckling struc-
ture scales within error with the square root of the DNA
length. This is a direct consequence of our model, indepen-
dent of particular values for the plectoneme formation ener-
gies. Applying estimates for these energies describes well the
dependences of the buckling parameters on the applied force
and ionic strength, which provides additional support for the
model. Qualitatively, the dependence on the ionic strength
can be understood by an increased repulsion of the DNA
strands in the plectonemic superhelix with decreasing ionic
strength. Consequently the energy for superhelix formation
E2 increases. Considering that electrostatic interactions
within the initial loop should play a minor role due to a larger
DNA Supercoiling Transition 1275
DNA-DNA distance, the difference between the initial loop
energy E1 and E2 decreases and the abrupt buckling becomes
less pronounced.
The formation of a second or further plectonemic struc-
tures is normally less favorable due to the large initial-loop
formation energy E1 compared to the smaller energy E2
required to extend the superhelix. Therefore, plectoneme
formation is nucleation-limited (i.e., for a sufficiently large
energetic difference, growth of an already existing plecto-
neme will be more likely than nucleation and maintenance
of an additional one). The obtained values for the energy
difference between E1 and E2 amount to several kBT for
Naþ concentrations R60 mM (Figs. 5 D and 6 D). There-
fore, under these conditions the presence of only a single
plectoneme is much more probable than predicted by a Boltz-
mann-like distribution for single and multiplectonemic
states. By contrast, at low ionic strength, E1 can be equal
to or smaller than E2, in agreement with the observed disap-
pearance of the abrupt buckling transition and the appear-
ance of a smooth and broad transition at 20 mM Naþ. In this
case, the presence of multiple plectonemes will be favored.
When E1 is considerably smaller than E2, exclusively initial
loops might form. This has been described previously in
Monte Carlo simulations of DNA supercoiling at 20 mM
monovalent salt, though the applied hard-wall potentials
for electrostatic interactions may not allow a quantitative
comparison (24). The existence of single, multiple, and
more complex plectonemic states needs to be carefully
considered for the interpretation of single molecule experi-
ments (13) and the application of theories at low salt concen-
trations (22,25).
A more quantitative understanding of abrupt buckling will
require rigorous theoretical work. Most importantly, the
energetics and shape of the initial loop, displaying a tear-
drop-like configuration (26), should be appropriately consid-
ered. Potential kinking of the sharply bent plectoneme tip, as
well as the salt dependency of the persistence length and the
initial loop energy, need additional attention.
Detecting DNA kinks: plectoneme pinningand energy of DNA bending
By introducing an ~120� kink into the DNA we were able to
achieve a prebuckling state, i.e., buckling that occurred
considerably earlier than the actual superhelix formation
(Fig. 7 A). This is a direct consequence of the initial-loop
model, considering that DNA kinking will reduce E1 to
become smaller than E2. Therefore it serves as an indepen-
dent support for the model. Preferential buckling at kinkable
regions and regions with discontinuous stiffness has been
predicted in static computational models (27) and is now
confirmed experimentally.
In contrast to a reduced E1 at low salt concentrations, the
kink acts only locally to favor plectoneme formation at its
position. The energetic bias for plectoneme formation at
the kink compared to DNA without an artificial kink can
reach values of ~10 kBT at elevated forces and ionic strength
(Fig. 7 B). Therefore we predict the plectoneme to be
pinned and to stay at the kink position, although this
idea still requires independent support. Being able to pin
the plectoneme position might be a useful tool, for exam-
ple, for controlled plectoneme extrusion in rotor bead
assays (10).
Generally, supercoiling should allow to measure the ener-
getic differences of bent, kinked, or other structured DNA
compared to nonkinked DNA. For example, it might be of
interest to see whether nucleosome positioning sequences
(28) support pinning of the plectoneme position. In addition,
the ability to detect a single kink on a DNA molecule can
potentially be used to detect enzymes that kink or bend
DNA upon binding to it.
SUPPORTING MATERIAL
One figure and seven equations are available at http://www.biophysj.org/
biophysj/supplemental/S0006-3495(09)06144-X.
This work was supported by Deutsche Forschungsgemeinschaft grant Nos.
SE 1646/1-1 and SE 1646/2-1.
Gero Wedemann and Robert Schopflin are gratefully acknowledged for
corrections on the manuscript.
REFERENCES
1. Harada, Y., O. Ohara, ., K. Kinosita, Jr. 2001. Direct observationof DNA rotation during transcription by Escherichia coli RNA poly-merase. Nature. 409:113–115.
2. Seidel, R., and C. Dekker. 2007. Single-molecule studies of nucleic acidmotors. Curr. Opin. Struct. Biol. 17:80–86.
3. Koster, D. A., K. Palle, ., N. H. Dekker. 2007. Antitumor drugsimpede DNA uncoiling by topoisomerase I. Nature. 448:213–217.
4. Kouzine, F., S. Sanford, ., D. Levens. 2008. The functional responseof upstream DNA to dynamic supercoiling in vivo. Nat. Struct. Mol.Biol. 15:146–154.
5. Strick, T. R., J. F. Allemand, ., V. Croquette. 1996. The elasticity ofa single supercoiled DNA molecule. Science. 271:1835–1837.
6. Strick, T. R., V. Croquette, and D. Bensimon. 1998. Homologouspairing in stretched supercoiled DNA. Proc. Natl. Acad. Sci. USA.95:10579–10583.
7. Allemand, J. F., D. Bensimon, ., V. Croquette. 1998. Stretched andoverwound DNA forms a Pauling-like structure with exposed bases.Proc. Natl. Acad. Sci. USA. 95:14152–14157.
8. Bryant, Z., M. D. Stone, ., C. Bustamante. 2003. Structural transitionsand elasticity from torque measurements on DNA. Nature. 424:338–341.
9. Lionnet, T., A. Dawid, ., V. Croquette. 2006. DNA mechanics asa tool to probe helicase and translocase activity. Nucleic Acids Res.34:4232–4244.
10. Gore, J., Z. Bryant, ., C. Bustamante. 2006. DNA overwinds whenstretched. Nature. 442:836–839.
11. Deufel, C., S. Forth, ., M. D. Wang. 2007. Nanofabricated quartzcylinders for angular trapping: DNA supercoiling torque detection.Nat. Methods. 4:223–225.
12. Mosconi, F., J. F. Allemand, ., V. Croquette. 2009. Measurementof the torque on a single stretched and twisted DNA using magnetictweezers. Phys. Rev. Lett. 102:078301.
Biophysical Journal 98(7) 1267–1276
1276 Brutzer et al.
13. Crut, A., D. A. Koster, ., N. H. Dekker. 2007. Fast dynamics ofsupercoiled DNA revealed by single-molecule experiments. Proc.Natl. Acad. Sci. USA. 104:11957–11962.
14. Strick, T. R., J. F. Allemand, ., V. Croquette. 1998. Behavior of super-coiled DNA. Biophys. J. 74:2016–2028.
15. Strick, T. R., M.-N. Dessinges, ., V. Croquette. 2003. Stretching ofmacromolecules and proteins. Rep. Prog. Phys. 66:1–45.
16. Forth, S., C. Deufel, ., M. D. Wang. 2008. Abrupt buckling transitionobserved during the plectoneme formation of individual DNA mole-cules. Phys. Rev. Lett. 100:148301.
17. Revyakin, A., R. H. Ebright, and T. R. Strick. 2005. Single-moleculeDNA nanomanipulation: improved resolution through use of shorterDNA fragments. Nat. Methods. 2:127–138.
18. Klaue, D., and R. Seidel. 2009. Torsional stiffness of single superpara-magnetic microspheres in an external magnetic field. Phys. Rev. Lett.102:028302.
19. Moroz, J. D., and P. Nelson. 1998. Entropic elasticity of twist-storingpolymers. Macromolecules. 31:6333–6347.
20. Marko, J. F. 2007. Torque and dynamics of linking number relaxation instretched supercoiled DNA. Phys. Rev. E Stat. Nonlin. Soft Matter Phys.76:021926.
Biophysical Journal 98(7) 1267–1276
21. Daniels, B. C., S. Forth, ., J. P. Sethna. 2009. Discontinuities at the
DNA supercoiling transition. Phys. Rev. E Stat. Nonlin. Soft Matter
Phys. 80:040901.
22. Clauvelin, N., B. Audoly, and S. Neukirch. 2009. Elasticity and electro-
statics of plectonemic DNA. Biophys. J. 96:3716–3723.
23. Klenin, K. V., A. V. Vologodskii, ., M. D. Frank-Kamenetskii. 1991.
Computer simulation of DNA supercoiling. J. Mol. Biol. 217:413–419.
24. Vologodskii, A. V., and J. F. Marko. 1997. Extension of torsionally
stressed DNA by external force. Biophys. J. 73:123–132.
25. Neukirch, S. 2004. Extracting DNA twist rigidity from experimental
supercoiling data. Phys. Rev. Lett. 93:198107.
26. Purohit, P. K. 2008. Plectoneme formation in twisted fluctuating rods.
J. Mech. Phys. Solids. 56:1715–1729.
27. Goyal, S., and N. C. Perkins. 2008. Looping mechanics of rods and
DNA with non-homogeneous and discontinuous stiffness. Int. J. Non-
linear Mech. 43:1121–1129.
28. Cloutier, T. E., and J. Widom. 2005. DNA twisting flexibility and the
formation of sharply looped protein-DNA complexes. Proc. Natl.
Acad. Sci. USA. 102:3645–3650.