enercom: the oil & gas conference
TRANSCRIPT

August 16, 2021
Enercom: The Oil & Gas ConferenceC H R I S W R I G H T, C E O & C H A I R M A N

2
Important Disclosures
FORWARD LOOKING STATEMENTS
The information in this presentation includes “forward-looking statements”. All statements, other than statements of historical fact included in this presentation regarding Liberty Oilfield Services Inc.’s (“Liberty” or the “Company”) expectations
regarding the expected financial condition and synergies expelled from the acquisition from Schlumberger as well as statements regarding strategy, future operations, financial position, estimated revenues and losses, projected costs, prospects,
plans and objectives of management are forward-looking statements. When used in this presentation, words such as “could”, “believe”, “anticipate”, “intend”, “estimate”, “expect”, “project”, “assume”, “outlook” and similar expressions are intended to
identify forward-looking statements, although not all forward-looking statements contain such identifying words. These forward-looking statements are based on management’s current expectations and assumptions about anticipated benefits of the
acquisition from Schlumberger and other future events and are based on currently available information as to the outcome and timing of future events. Except as otherwise required by applicable law, Liberty disclaims any duty to update any forward-
looking statements, all of which are expressly qualified by the statements in this section, to reflect events or circumstances after the date of this presentation. Liberty cautions you that these forward-looking statements are subject to all of the risks
and uncertainties incident to significant acquisitions as well as incidental to hydraulic fracturing services, most of which are difficult to predict and many of which are beyond its control. These risks include, but are not limited to, less than anticipated
synergies, difficulties, a decline in demand for the Company’s services, capital spending by the oil and natural gas industry , hydrocarbon price volatility, competition within the Company’s service industry, reliance on a limited number of suppliers,
environmental risks, regulatory changes, the inability to comply with the financial and other covenants and metrics in the Company’s credit facilities, cash flow and access to capital and the timing of capital expenditures. Should one or more of the
risks or uncertainties described in this presentation occur, or should underlying assumptions prove incorrect, Liberty’s actual results and plans could differ materially from those expressed in any forward-looking statements.
INDUSTRY AND MARKET DATA
This presentation has been prepared by Liberty and includes market data and other statistical information from sources believed by Liberty to be reliable, including independent industry publications, government publications or other published
independent sources. Some data are also based on Liberty’s good faith estimates, which are derived from its review of internal sources as well as the independent sources described above. Although Liberty believes these sources are reliable, it has
not independently verified the information and cannot guarantee its accuracy and completeness.
NON-GAAP FINANCIAL AND OPERATIONAL MEASURES
Liberty uses EBITDA, Adjusted EBITDA, Cash Return on Capital Invested (CROCI), Free Cash Flow (FCF) and Free Cash Flow Yield financial and operational measures that are not presented in accordance with U.S. generally accepted accounting
principles (“GAAP”), in this presentation. These financial and operational measures are used as supplemental non-GAAP financial measures by Liberty’s management and by external users of Liberty’s financial statements, such as industry analysts,
investors, lenders and rating agencies. Liberty believes these financial and operational measures are useful to external users of its consolidated and combined financial statements, such as industry analysts, investors, lenders and rating agencies
because it allows them to compare its operating performance on a consistent basis across periods by removing the effects of capital structure (such as varying levels of interest expense), asset base (such as depreciation and amortization) and other
items that impact the comparability of financial results from period to period. Liberty management believes these financial and operational measures provide useful information regarding the factors and trends affecting its business in addition to
measures calculated under GAAP. Liberty defines EBITDA as net income (loss) before interest expense, income taxes, depreciation and amortization. Liberty defines Adjusted EBITDA as EBITDA adjusted to eliminate the effects of items such as
non-cash stock based compensation expense, new fleet or new basin start-up costs, fleet lay-down costs, costs of asset acquisitions, gain or loss on the disposal of assets, asset impairment charges, bad debt reserves, and non-recurring expenses
that management does not consider in assessing ongoing performance. Liberty excludes the foregoing items from net income (loss) in arriving at Adjusted EBITDA because these amounts can vary substantially from company to company within its
industry depending upon accounting methods and book values of assets, capital structures and the method by which the assets were acquired. For periods prior to 2021, Liberty did not eliminate non-cash stock based compensation expense from
Adjusted EBITDA, but began to do so in 2021 in order to be more consistent with practices of other companies in Liberty’s industry. Certain items excluded from Adjusted EBITDA are significant components in understanding and assessing a
company’s financial performance, such as a company’s cost of capital and tax structure, as well as historic costs of depreciable assets, none of which are components of Adjusted EBITDA. Adjusted EBITDA is not a measure of net income (loss) or
net cash provided by operating activities as determined by GAAP. Adjusted EBITDA should not be considered an alternative to net income, net cash provided by operating activities or any other measure of financial performance or liquidity
presented in accordance with GAAP. You should not consider Adjusted EBITDA in isolation or as a substitute for an analysis of Liberty’s results as reported under GAAP. Because Adjusted EBITDA may be defined differently by other companies in
Liberty’s industry, Liberty’s computations of Adjusted EBITDA may not be comparable to other similarly titled measures of other companies, thereby diminishing its utility. Liberty defines Cash Return on Capital Invested as the ratio of Adjusted
EBITDA to average gross capital invested (total assets plus accumulated depreciation less non-interest bearing current liabilities). Liberty defines Free Cash Flow as Adjusted EBITDA less capital expenditures, excluding capex synergies from the
Schlumberger acquisition. Liberty defines Free Cash Flow Yield as Free Cash Flow divided by market capitalization. Future figures of Cash Return on Capital Invested and Free Cash Flow provided herein are models only and a quantitative
reconciliation between these non-GAAP measures to GAAP measures cannot be provided without unreasonable effort due to the varying nature of depreciation, interest expense, tax rate and similar financial and operational calculations included
therein. The significance of such unavailable information may substantially vary the future models provided herein.

3
A Decade of Liberty: Compelling Value Creation
Liberty: A Premier North American Completions Service Provider
(1) Cash Return on Capital Invested (CROCI) defined as the ratio of adjusted EBITDA to average Gross Capital Invested (Total Assets plus Accumulated Depreciation less Non-Interest Bearing Current Liabilities); CROCI of 24% represents the 2012-2020 average.
E S G : R AI S I N G T H E B A RRigorous design, analysis and implementation of next generation practices
and equipment coupled with automation advancements support operator
sustainable development and emission reduction goals
T E C H N O L O G YInnovative engineering and technology solutions and over 500 patents
together increase E&P operator efficiencies, improve E&P well costs per
BOE and increase Liberty returns
S U P E R I O R R E T U R N SLiberty’s proven performance across cycles with 24% average CROCI(1)
driven by accretive investment in downcycles and balance sheet strength,
with full exposure to upside
C U LT U R E & P R I N C I P L E SRelentless pursuit of excellence through innovation, individual empowerment
and a full suite of technology to drive efficiency and support deep customer
relationships

4
Energy is Transformative2020 ESG Report: Bettering Human Lives
BETTERING
HUMAN LIVES

5
The Energy, Poverty, & Climate Change NexusEnergy Access is Enlightening and Green
Ko
rea
n P
en
insula
: N
ort
h K
ore
a &
So
uth
Ko
rea
His
pa
no
lia: H
aiti (o
n left
) &
Dom
inic
an
Rep
ub
lic (
on
rig
ht)

6
U.S. Leadership in Delivering Natural Gas Liquids (NGLs) WorldwideThe World’s Largest Exporter of Liquid Petroleum Gas (LPG)
Sources: IEA & IHS Waterbourne
U.S. Global LPG Exports
U.S. responsible for virtually all
global LPG export growth,
increasing energy accessibility
LPG Addressing the
Challenges of Energy
Poverty & the Environment
Surging U.S. propane exports
increase availability and lower
overall energy costs
Transitioning from traditional
biomass fuels to LPG reduces
particulate matter pollution

7
Global Oil Demand by Region(1)
Worldwide Oil & Gas Demand: An Economic NecessityThe “Energy Transition” Narrative In Perspective
(1) Organization of Petroleum Exporting Countries (OPEC): 2020 World Oil Outlook 2045
(2) U.S. Energy Information Administration (EIA): Annual Energy Outlook 2021
100
91
104107 109 109 109
0
20
40
60
80
100
120
2019 2020 2025 2030 2035 2040 2045
Oil
Dem
an
d (
mb
/d)
OECD Other Non-OECD India China
U.S. Energy Consumption by Fuel(2)
(AEO2021 Reference Case)
0
20
40
60
80
100
120
1990 2000 2010 2020 2030 2040 2050
En
erg
y C
on
su
mp
tio
n (
qu
ad
rill
ion
BT
U)
Petroleum Natural Gas Renewables Coal Nuclear
History ProjectionsWorldwide Oil Demand
• Worldwide oil demand expected to
grow for the next 20 to 25 years at a
moderating pace
U.S. Oil and Gas Energy
Consumption
• U.S. oil and gas consumption
continue to rise even with expansion
in renewables energy demand
• In 2019, these sources represented
69% of total U.S. energy
consumption.
• By 2050, oil and gas is projected to
represent 70% of total U.S. energy
consumption
• U.S. oil and gas consumption to
expand at a 0.3% CAGR from 2019-
2050
O I L & N AT U R A L G A S
R E M A I N E S S E N T I A L
S O U R C E S O F E N E R G Y

8
0
5
10
15
20
25
30
Q1'0
3
Q4'0
3
Q3'0
4
Q2'0
5
Q1'0
6
Q4'0
6
Q3'0
7
Q2'0
8
Q1'0
9
Q4'0
9
Q3'1
0
Q2'1
1
Q1'1
2
Q4'1
2
Q3'1
3
Q2'1
4
Q1'1
5
Q4'1
5
Q3'1
6
Q2'1
7
Q1'1
8
Q4'1
8
Q3'1
9
Q2'2
0
Q1'2
1
Q4'2
1
Pro
du
cti
on
Ca
pa
cit
y (
mb
/d)
OPEC Spare Production Capacity
North American Oil & Gas Production in Global ContextA Competitive Industry in World Oil Markets
Sources: Organization of Petroleum Exporting Countries (OPEC) (global oil and natural gas liquids production) & U.S. Energy Information Administration (EIA) (North American oil and natural gas liquids production)
North America: A Significant
Global Supplier of Liquids
• 25% of global liquids production is from North
America
• North American liquids are significantly above
OPEC capacity levels
OPEC Spare Capacity as a
Percent of Global Oil Production
• 3% in 2019
• 2% - 4% average for the last 40 years
• 8% in Q2’21 (current)
• ~3%-4% estimated by year end 2021
25 mb/d Average
North America Liquids
Production
2 mb/d Average
OPEC Spare Production
Capacity 2003-2019

9
U.S. Field Production of Crude Oil
The Shale RevolutionFrom Growth to Capital Discipline
Source: U.S. Energy Information Administration (EIA)
0
2,000
4,000
6,000
8,000
10,000
12,000
14,000
1920 1930 1940 1950 1960 1970 1980 1990 2000 2010 2020
Th
ou
sa
nd
s b
/d
Shale Revolution
Shale revolution expands
from gas to oil in 2009
U.S. production more than
doubles in the next decade
Capital discipline arrives
2018 to 2021
Modest U.S. growth needed
to supply world demand

10
North American Demand from Public vs. Private Companies Shifts Over TimeLiberty Customer Base Commensurate with North American Activity Levels
0
500
1,000
1,500
2,000
Jan-14 Jan-15 Jan-16 Jan-17 Jan-18 Jan-19 Jan-20 Jan-21
No
rth
Am
eri
ca
n R
ig C
ou
nt
Large SMID Private
Source: Enverus: Rigs and Drilling Analytical Report (RADAR)
2014-2015
Public 63% | Private 37%
2016-2017
Public 56% | Private 44%
2018
Public 52% | Private 48%
2019-2020
Public 56% | Private 44%
YTD 2021
Public 45% | Private 55%

11
Supply, Demand and Next Generation
Market Dynamics
◼ Industry activity near standstill in Spring 2020; WTI oil prices were as low as $18 per barrel
□ 2021 frac activity priced while WTI oil was in the $40s per barrel
◼Now exiting historic Covid downturn; oil is near ~$70 per barrel
□ E&P customer business models severely stressed in 2020 now have improved
◼Service pricing improving slowly but typically lags commodity price rebound
Frac Supply
◼Q1 2020: ~325 frac fleets working in North America
◼May 2020 cyclical trough: dropped to ~30 frac fleets at the low
◼Q4 2021E: expect mid-200s fleets working
Frac Demand
◼Customer demand shifting toward next generation equipment
□ Market strengthening for next generation fleets
◼Profitability gap widening between next generation and legacy fleets
□ Price premium for next generation fleets tied to fuel cost savings and enhanced ESG performance
Frac Market Dynamics

12
A New Era of Leadership in a Structurally Changed Industry
An Unrivaled Completion Service Provider: Technology, Integration & Scale
Liberty
3rd
Largest North American
Oilfield Service Company
6%Net Debt to Capital(4)
50%Higher Average CROCI
Relative to S&P 500
~500Issued &
Pending Patents(3)
2nd
Largest North American
Completions Company 2.5 MM HHP + Wireline + Sand Mines
24%9-Year Average CROCI(1)
$37MMQ221 Adjusted EBITDA
$581MMQ221 Revenue
Liberty Basin
Operational Footprint
Northeast
Alberta, Canada
(1) Cash Return on Capital Invested (CROCI) defined as the ratio of adjusted EBITDA to
average Gross Capital Invested (Total Assets plus Accumulated Depreciation less Non-
Interest Bearing Current Liabilities); CROCI of 24% represents the 2012-2020 average.
(2) Available for Service horsepower requires immaterial capital expenditures for deployment.
Available for Service does not include Maintenance Support horsepower.
(3) Includes transferred and licensed patents.
(4) Net Debt to Capital as of June 30, 2021

13
Liberty Cash Return on Capital Invested(1) (CROCI)
47%
19%
29%
14%
(1%)
44% 44%
21%
3%
-5%
5%
15%
25%
35%
45%
2012 2013 2014 2015 2016 2017 2018 2019 2020
Proven Steward of Capital in the Energy Sector
Liberty’s Unmatched Track Record of Attractive Returns
Disciplined
Growth
High Rates of
Return
Balance Sheet
Strength
Unmatched
Innovation
Long-term
Partnerships
Strategic
Priorities
1
2
3
4
5
24% LBRT Average
16% S&P 500(2) Average
(1) Cash Return on Capital Invested (CROCI) is an operational measure defined as the ratio of Adjusted EBITDA to the average of the beginning and ending period Gross Capital Invested (Total Assets plus Accumulated Depreciation less Non-Interest Bearing Current Liabilities).
Please see slide 29 for a reconciliation of the non-GAAP measures EBITDA and Adjusted EBITDA to net income.
(2) S&P 500 average for the 2012-2020 period exclusive of Financials and Real Estate constituents. Source: Tudor Pickering & Holt & Bloomberg data as of March 31, 2021.
0%
9% OSX Average
Schlumberger OneStim®
AcquisitionSanjel Acquisition

14
Safety, Service Quality, Efficiency & Technology
A Culture of Collaboration Drives Results
Source: Kimberlite International Oilfield Research September 2019 Hydraulic Fracturing Supplier Performance Report
Kimberlite Frac Performance Perception
L I B E R T Y C U L T U R E
Innovation-Based
Culture
Common Sense
Safety Culture
Treat People RightHigh Expectations
Low Turnover
Empower
Employees
BETTER
HIG
H
WORSE SUPPLIER PERFORMANCE
PE
RC
EIV
ED
PR
ICIN
G
Premium Service
Provider
Value Disadvantaged
Provider
Discounted Service
Provider
Value Advantaged
Provider LO
W

15
S U B - S U R FA C E E N G I N E E R I N G
& W E L L D E S I G N
Raise well productivity and lower the cost of
bringing energy to the world
I N T E G R AT E D C L O U D
B A S E D B U S I N E S S
S Y S T E M S
Cost-effectively scale operations
E Q U I P M E N T D E S I G N &
O P E R AT I O N S
Improve design with engineering,
real-time automation,
and predictive analytics
T E C H N O L O G Y –
D R I V E N
E N V I R O N M E N TA L
I M P R O V E M E N T
Harness real data to drive technology that
significantly reduces environmental impact
Liberty’s Digital DNA: Pushing the Frontiers of Digital Technology in the Energy IndustryOptimize Operations & Elevate Productivity with Real Data

16
Sub-Surface Technology: Improving Customer $/BOE Drives Liberty ReturnsBig Data Analytics Guided by World Class Engineers
365-Day Production (oil/ft) on Water
Saturation Grid
Integrating Engineering & Economics to
Maximize Returns

17
◼We all work toward Happy Valley
◼Our customers benefit
How Liberty Is Different and Why That Matters to Our CustomersLowering the Bottom of Happy Valley in Every Basin Has Made Our Customers More Competitive
BO
$
WTI Spot in Cushing
Downhole Technology &
Operations Efficiency
◼Liberty benefits
◼We all win in Happy Valley
2+ years breakevens ~1 year breakevens

18
Data Monitoring
Issue Identification
EngineeringManufacturing
Surface Technology: Rapid Innovation CycleTechnology-Driven Operational and Environmental Improvement Drives Returns
Event / issue
identification through
data assessment
Engineer response
driven by real-time
data analysis
Fluid-end flow analysis
Engineering solution
integrated into earliest
manufacturing step
180K data points
captured per minute
per fleet

19
Project 1440
Tracking Every Minute of Every Day Since Inception
“Measurement is the first step that leads to control and
eventually to improvement.
If you can’t measure something, you can’t understand it.
If you can’t understand it, you can’t control it.
If you can’t control it, you can’t improve it.”
― H. James Harrington

20
Performance with Purpose: Business Strategy Advances Industry ESG Efforts
ESG: An Unrivaled Commitment to Environmental Progress
OneStim
2020
Schlumberger
OneStimProprietary
controls, novel
software, fleet
automation
2016
Quiet FleetTM
Liberty introduces
Quiet FleetTM
technology
2020
Next Gen
Frac Fleet
White PaperESG profile
quantified for
Next Gen fleets
2020
Tier IV DGBFleets deployed
2021
digiFracTM
Electric fleet launch
2013
Dual FuelLiberty’s first dual
fuel fleet reduces
emissions
2012
Slickwater
DesignIncreasing Bakken
oil productivity by
50%
2014
Containerized
SandReduces dust,
noise and truck
traffic
2015
SpiritFluid system
places proppant
cheaper and
cleaner
2018
Tier IV DGB
CAT Field Test
PartnershipStep change in
emissions reduction

21
The Liberty to Pursue Your Dreams
ESG: A Culture of Excellence
Liberty Family Residences Across the U.S. in 2020
Liberty families live in rural communities and big cities across the U.S. (and now in Canada!)
91%401(K) Employee
Participation
47%Women at
Corporate Headquarters
60Families Received
Financial Assistance with
Fertility Treatment in 2020
3Families Received
Adoption Assistance in 2020
82Liberty Babies Born in 2020
652Employee Owners in 2020
22
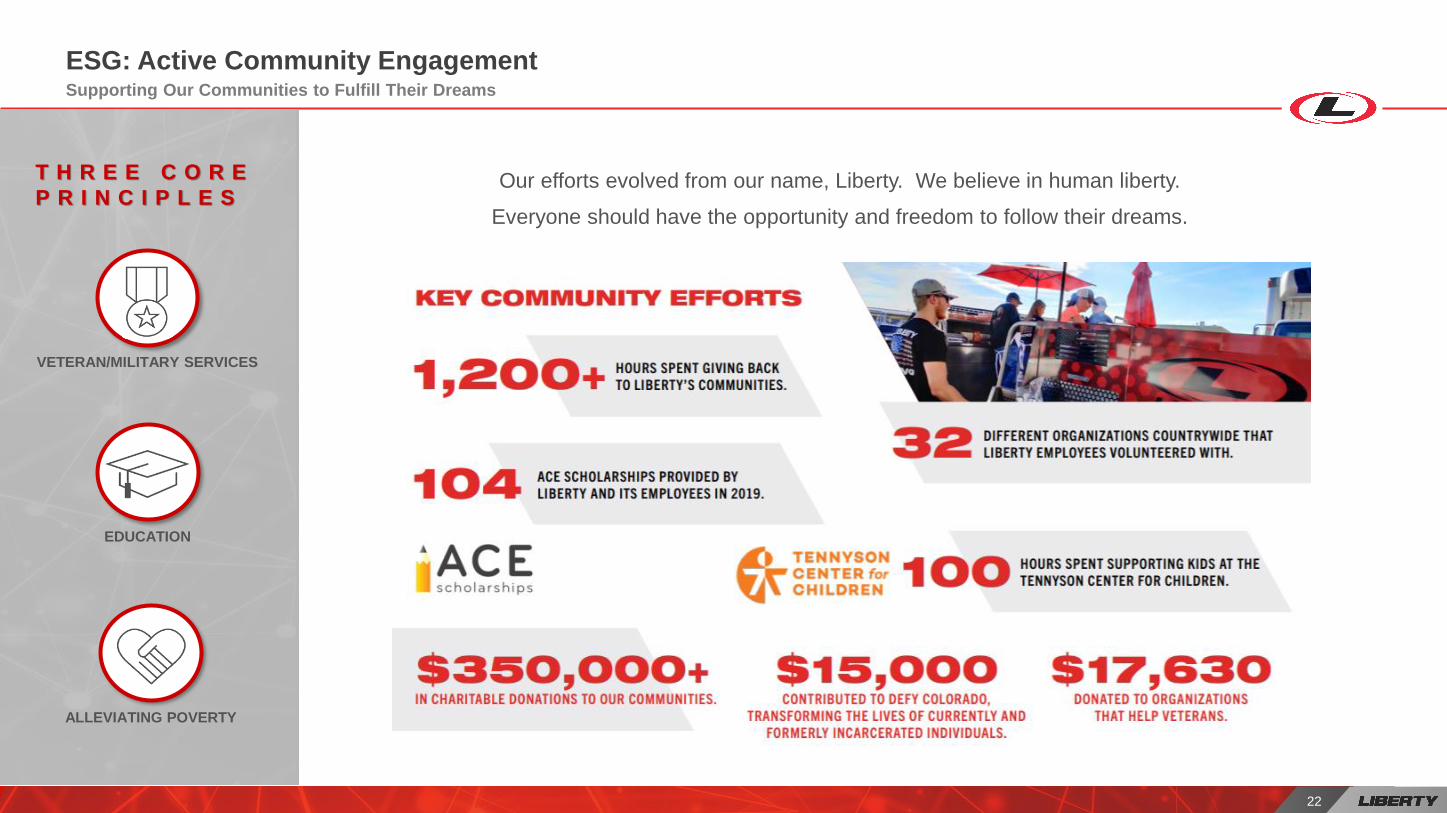
Supporting Our Communities to Fulfill Their Dreams
Our efforts evolved from our name, Liberty. We believe in human liberty.
Everyone should have the opportunity and freedom to follow their dreams.
ESG: Active Community Engagement
EDUCATION
ALLEVIATING POVERTY
VETERAN/MILITARY SERVICES
T H R E E C O R E
P R I N C I P L E S

23
Liberty Team Aligned with Shareholders Since its Founding
ESG: Governance in Focus
RO
BU
ST
IN
DE
PE
ND
EN
T B
OA
RD
OV
ER
SIG
HT
William KimbleFormer Managing Partner of KPMG
LBRT Lead Director
LBRT Audit Committee Chair
Gale NortonFormer U.S. Secretary of the Interior
Former Colorado Attorney General
LBRT Governance Committee Chair
Peter DeaChairman of Ovintiv
LBRT Compensation Committee Chair
Executive Team
Founders and Owners
=
Alignment
Independent Directors
7 / 9
Executive Compensation
Aligned with Shareholders
ROCE, EPS
Female Directors
2 / 9
Low Employee Turnover
Industry Leading Safety
Record

24
0%
47%
19%
29%
14%
(1%)
44% 44%
21%
3%
-5%
5%
15%
25%
35%
45%
2012 2013 2014 2015 2016 2017 2018 2019 2020
-5%
5%
15%
25%
35%
45%
2012 2013 2014 2015 2016 2017 2018 2019 2020
Managing the Cycle for Long Term Returns
Liberty’s Investment Philosophy
Build the
BDFC!
Small Amount of
Equity
Reinvest at High
Rates of Return
Return Cash to
Shareholders
Strategic
Acquisitions
How We Built
Liberty
1
2
3
4
5
I N V E S T
F O R
G R O W T H
M A I N TA I N
B A L A N C E S H E E T
S T R E N G T H
G E N E R AT E
F C F
(1) Cash Return on Capital Invested (CROCI) is an operational measure defined as the ratio of Adjusted EBITDA to the average of the beginning and ending period Gross Capital Invested (Total Assets plus Accumulated Depreciation less Non-Interest Bearing Current Liabilities).
Please see slide 29 for a reconciliation of the non-GAAP measures EBITDA and Adjusted EBITDA to net income.
Liberty Built
with Cash Flow
50%+ of Capital
Used Since
Inception

25
How We Create Value for Our Customers and Our Shareholders
Why We Invest in Technology
Sub-surface Technology: Focusing on What Makes our Customers
Successful
◼ Drives higher demand for Liberty services
◼ Creates stickiness of the relationship over years and through cycles
◼ Increases fleet utilization
◼ Increases throughput from understanding field operations effect of engineering
◼ Customers willing to pay a pricing premium because it is additive to their bottom line
Above Surface Technology: Focusing on What Makes Us Better
◼ Liberty’s operational excellence and leading-edge fleet technology drives higher demand
◼ Increases fleet throughput because on continual improvement cycle – Project 1440
◼ Reduces fleet operating expense:
□ Equipment automation
□ Equipment design
□ Integrated logistics and vertical integration
◼ Supplier partnerships reduces capital commitments and increase reliability
Utilization
Cost of Service
Price
Throughput
Profitability
x
x
-
=
T H E L I B E R T Y W A Y

26
0
2
4
6
8
10
12
14
16
18
Current Revenue Uplift TechnologyCost Synergies
Total Fixed CostLeverage
Total
The Road to Normalized EBITDA Levels Through Integration, Innovation and Execution
A Pathway to Mid-Cycle EBITDA
Net Service Pricing,
Utilization &
Throughput
Logistics, Materials
Handling &
Automation
PR
OF
IT
AB
IL
IT
Y
EX
PA
NS
IO
N
A Mid-Cycle
Framework
200 to 300 Fleets
Industry Demand at Flat to
Modest Production Growth(1)
> $55 per Barrel
WTI Crude Oil Price
Low 30s to Mid 40s
Liberty Active Fleets
$$$
Attractive Cash Generation
Opportunity
Ad
jus
ted
EB
ITD
A p
er
Fle
et
(1) Frac fleet demand in North America; assumes modest production growth with projected year end 2020 production exit rate.

27
Compelling Investment Rationale
Liberty: Creating Value Through the Next Decade
2 N D L A R G E S T N O R T H A M E R I C A N C O M P L E T I O N S C O M PA N Y
Advantaged Scale, Diversification & Vertical Integration
S I G N I F I C A N T F R E E C A S H F L O W P O T E N T I A L
Delivering Cash Flow Optionality
G R O W T H W I T H A S T R O N G B A L A N C E S H E E T
Maximizing Returns, Minimizing Financial Leverage
T E C H N O L O G Y L E A D E R S H I P
Rapid Technical Innovation Drives Returns
VA L U E C R E AT I O N
A Long-Term Investment Approach
I N D U S T R Y E S G L E A D E R S H I P
Executing on What Really Makes a Difference
S U S TA I N A B L E C O M P E T I T I V E A D VA N TA G E S

Appendix

29
Reconciliation and Calculation of Non-GAAP Financial Measurements
Year Ended Year Ended Year Ended Year Ended Year Ended Year Ended
31-Dec-20 31-Dec-19 31-Dec-18 31-Dec-17 31-Dec-16 31-Dec-15
Net Income (loss) ($161) $75 $249 $169 ($61) ($9)
Depreciation &
Amortization$180 $165 $125 $81 $41 $36
Interest Expense $15 $15 $17 $13 $6 $6
Income Tax (Benefit) Expense ($31) $14 $40 $0 $0 $0
EBITDA (1) (2) $3 $269 $431 $263 ($13) $33
Stock based compensation expense $17 $14 $6 $0 $0 $0
Fleet start-up costs $12 $4 $10 $14 $4 $1
Asset acquisition costs $9 $0 $1 $2 $5 $0
Loss (gain) on disposal
of assets$0 $3 ($4) $0 ($3) $0
Provision for credit losses $5 $1 $0 $0 $0 $6
Non-recurring payroll expense $2 $0 $0 $0 $0 $0
Advisory services fees $10 $0 $0 $2 $0 $0
Adjusted EBITDA (1) (2) $58 $291 $444 $281 ($6) $41
EBITDA and Adjusted EBITDA Reconciliation
(1) EBITDA and Adjusted EBITDA are financial measures not presented in accordance with GAAP
(2) Amounts above may not add up to total due to rounding