enea hybrid modelling: linking energy systems models with economic models
TRANSCRIPT
Linking the TIMES-Italy model with
macro-economic models:
Experiments with Social Accounting Matrices and G-E models
Maria Rosa Virdis - ENEA 66° Semi-annual IEA-ETSAP meeting – Copenhagen, 17-21 November 2014
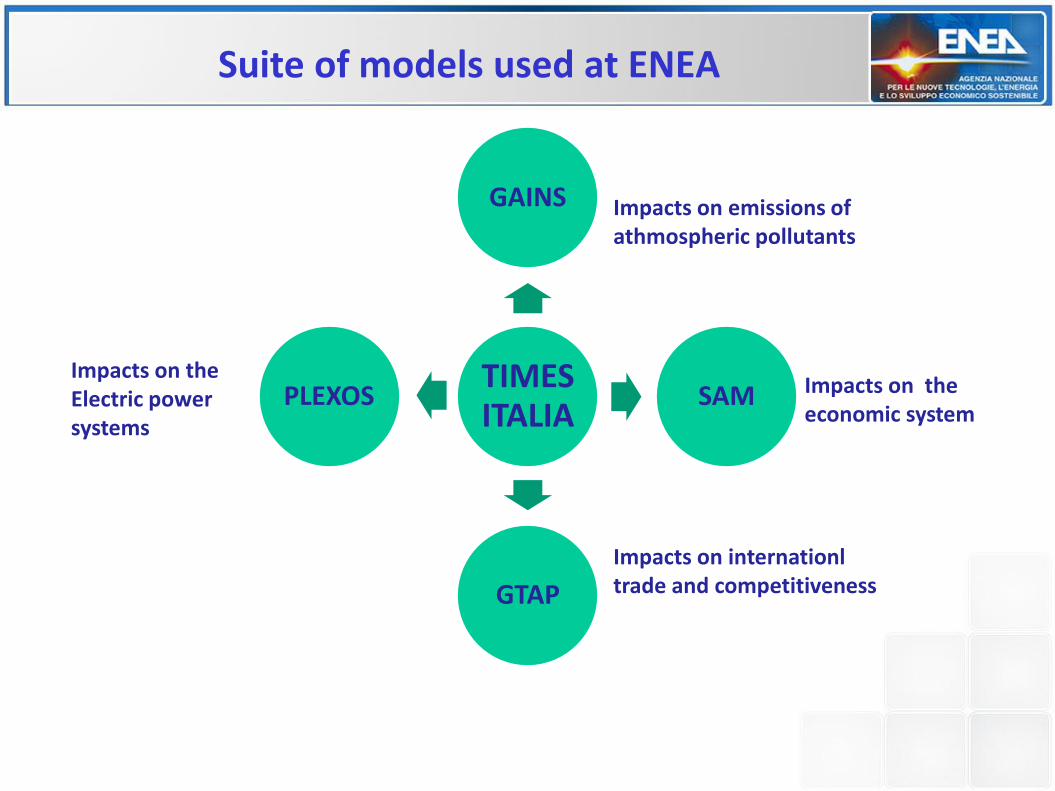
Suite of models used at ENEA
TIMES ITALIA
GAINS
SAM
GTAP
PLEXOS
Impacts on emissions of athmospheric pollutants
Impacts on the economic system
Impacts on internationl trade and competitiveness
Impacts on the Electric power systems
Model linkages for integrated assessment
The activity reported here is part of a project funded by the Italian Ministry of Economic Development, aimed at developing an integrated assessment tool that can be used both for impact assessment and for policy simulation and analysis.
The team involved in this project is composed by:
B. Baldissara, U. Ciorba, M. Gaeta, C. Martini,
M. Rao, C. Tommasino, M. Virdis and A. Antimiani
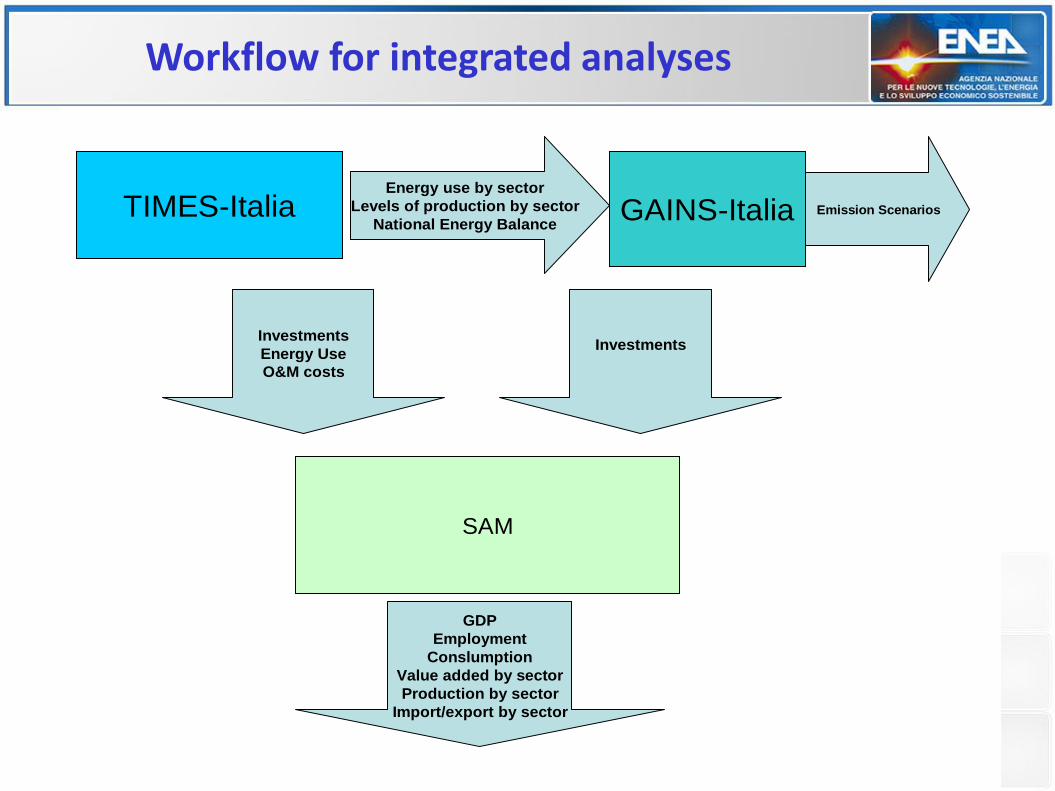
TIMES-Italia GAINS-ItaliaEnergy use by sector
Levels of production by sector
National Energy Balance
Investments
Energy Use
O&M costs
Investments
SAM
Emission Scenarios
GDP
Employment
Conslumption
Value added by sector
Production by sector
Import/export by sector
Workflow for integrated analyses
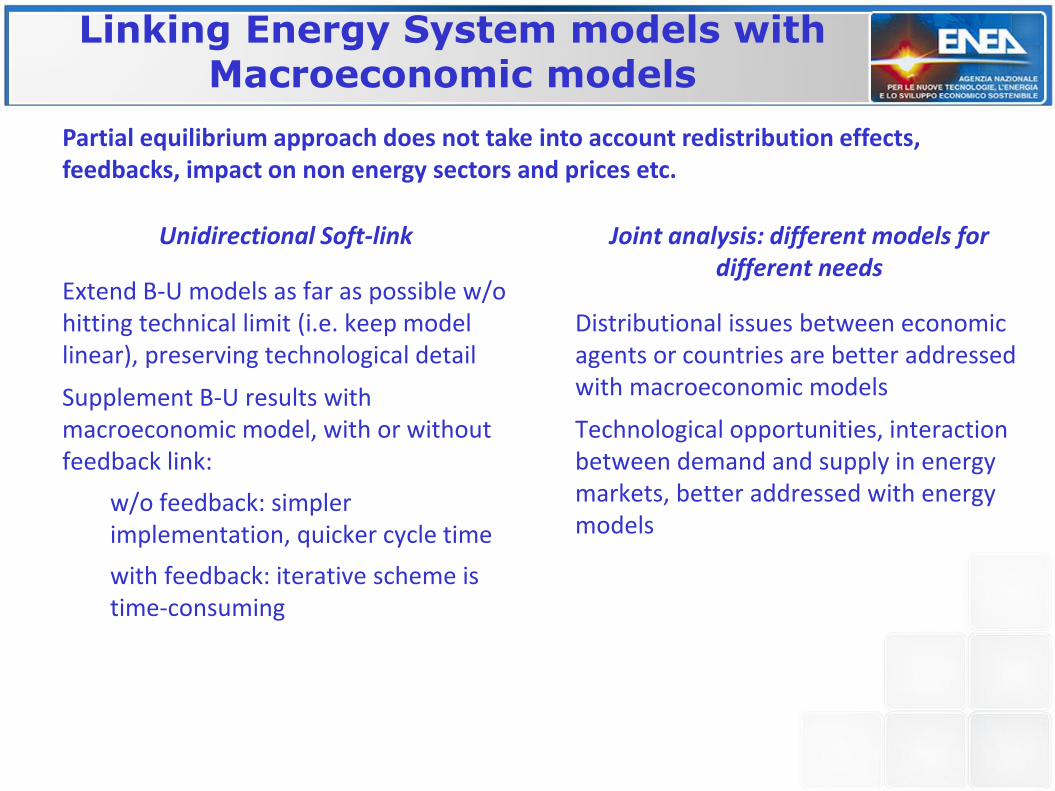
Linking Energy System models with Macroeconomic models
Unidirectional Soft-link
Extend B-U models as far as possible w/o hitting technical limit (i.e. keep model linear), preserving technological detail
Supplement B-U results with macroeconomic model, with or without feedback link:
w/o feedback: simpler implementation, quicker cycle time
with feedback: iterative scheme is time-consuming
Joint analysis: different models for different needs
Distributional issues between economic agents or countries are better addressed with macroeconomic models
Technological opportunities, interaction between demand and supply in energy markets, better addressed with energy models
Partial equilibrium approach does not take into account redistribution effects, feedbacks, impact on non energy sectors and prices etc.
Social Accounting Matrix (SAM)
A Social Accounting Matrix is an organized matrix representation of all transactions and transfers between different production activities, factors of production and institutions (like households, firms and government) within the economy and with respect to the rest of the world.
SAM is a comprehensive accounting framework within which the full circular flow of income from production to factor incomes, household income to household consumption and back to production is captured.
In a SAM all the transactions in the economy are presented in the form of a matrix.
Each row gives receipts of an account while the column gives the expenditure. The total of each row is equal to the total of each corresponding column.
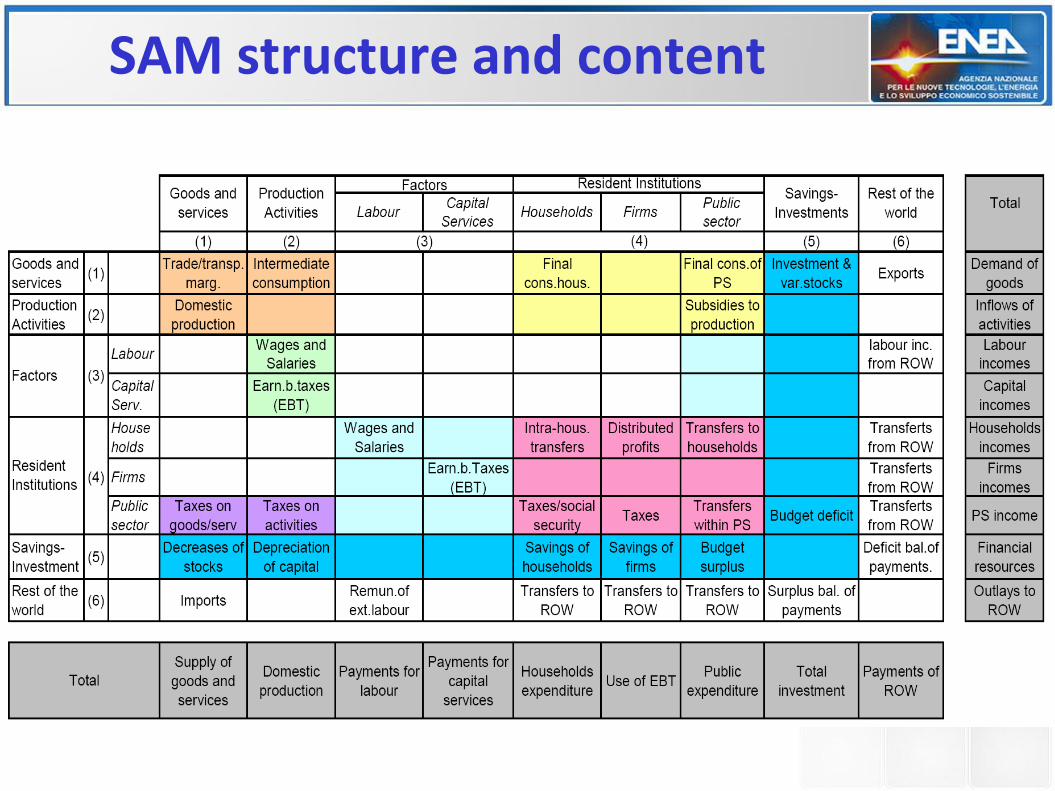
SAM structure and content
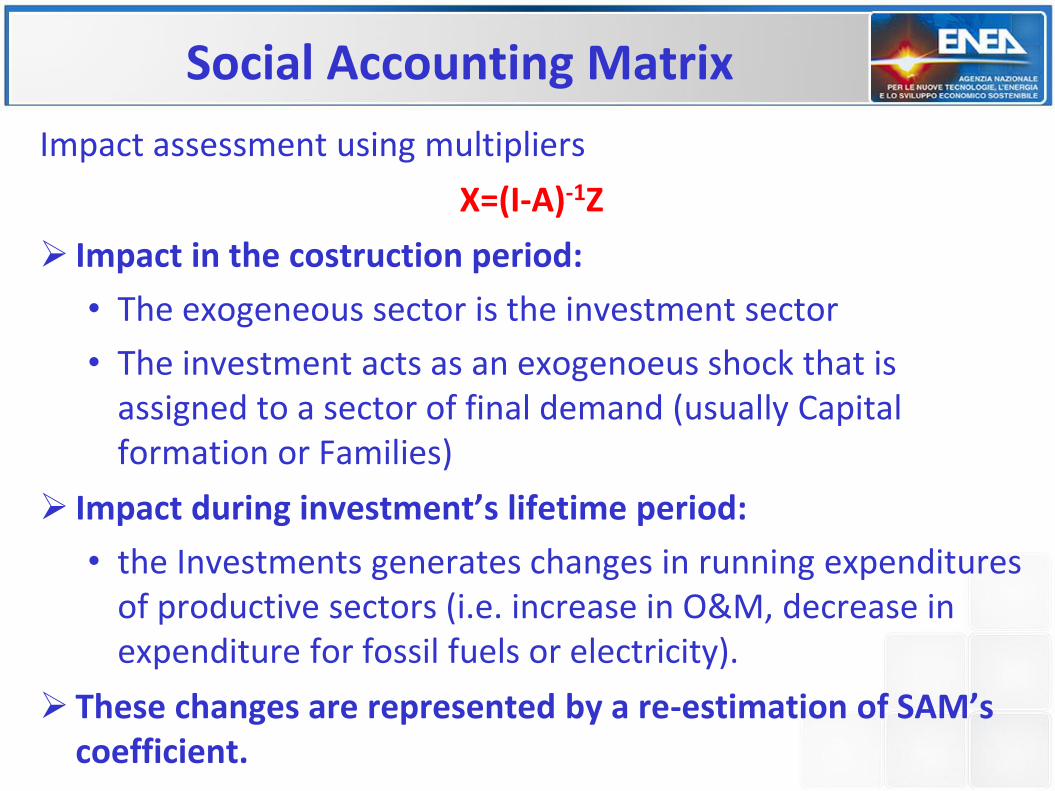
Social Accounting Matrix
Impact assessment using multipliers
X=(I-A)-1Z
Impact in the costruction period:
• The exogeneous sector is the investment sector
• The investment acts as an exogenoeus shock that is assigned to a sector of final demand (usually Capital formation or Families)
Impact during investment’s lifetime period:
• the Investments generates changes in running expenditures of productive sectors (i.e. increase in O&M, decrease in expenditure for fossil fuels or electricity).
These changes are represented by a re-estimation of SAM’s coefficient.
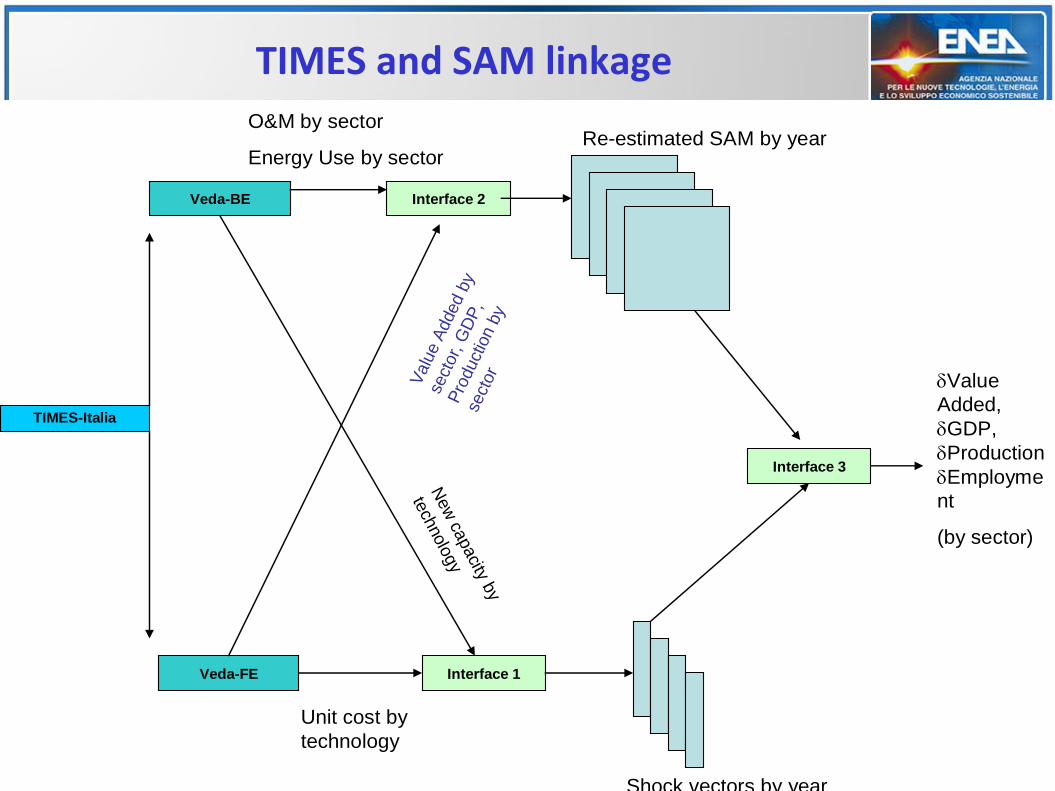
TIMES and SAM linkage
TIMES-Italia
Veda-BE
Veda-FE
New
capacity
by
tech
nolo
gy
Interface 1
Unit cost by
technology
Shock vectors by year
Interface 2
Valu
eA
dded
by
sect
or, G
DP
,
Pro
duct
ion b
y
sect
or
Re-estimated SAM by year
Interface 3
O&M by sector
Energy Use by sector
Value
Added,
GDP,
Production
Employme
nt
(by sector)
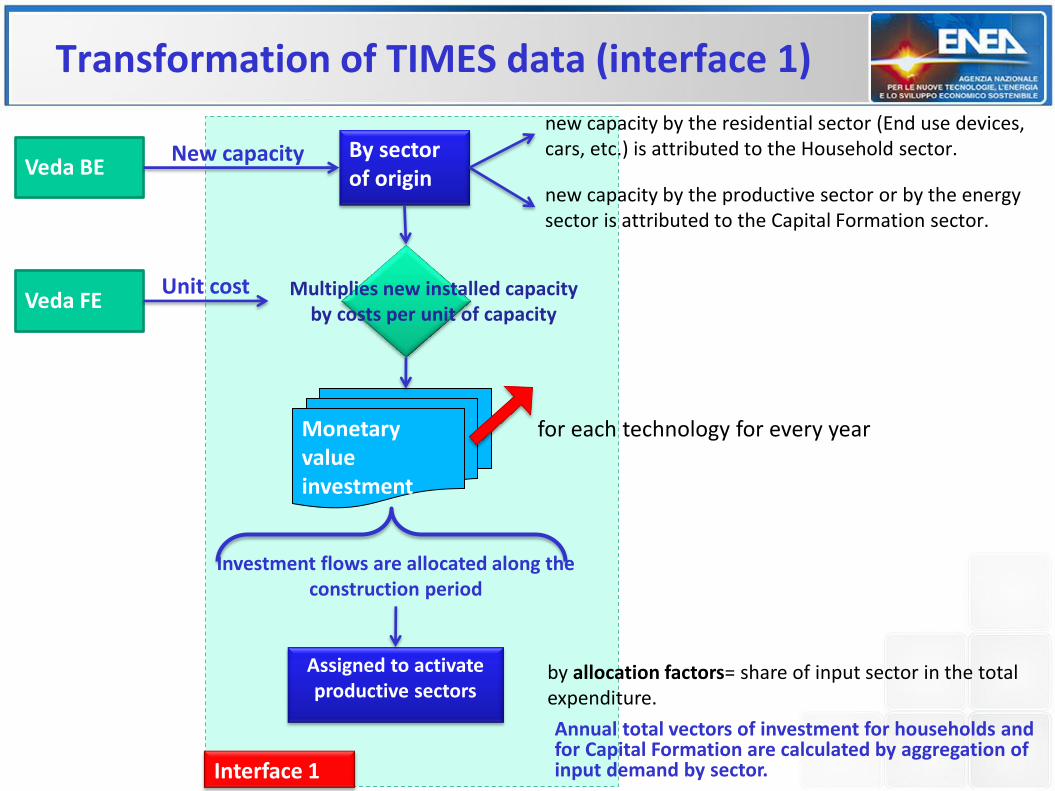
Transformation of TIMES data (interface 1)
Veda BE New capacity By sector
of origin
new capacity by the residential sector (End use devices, cars, etc.) is attributed to the Household sector.
new capacity by the productive sector or by the energy sector is attributed to the Capital Formation sector.
Monetary value investment
for each technology for every year
Investment flows are allocated along the construction period
Assigned to activate productive sectors
by allocation factors= share of input sector in the total expenditure.
Veda FE Unit cost Multiplies new installed capacity
by costs per unit of capacity
Annual total vectors of investment for households and for Capital Formation are calculated by aggregation of input demand by sector. Interface 1
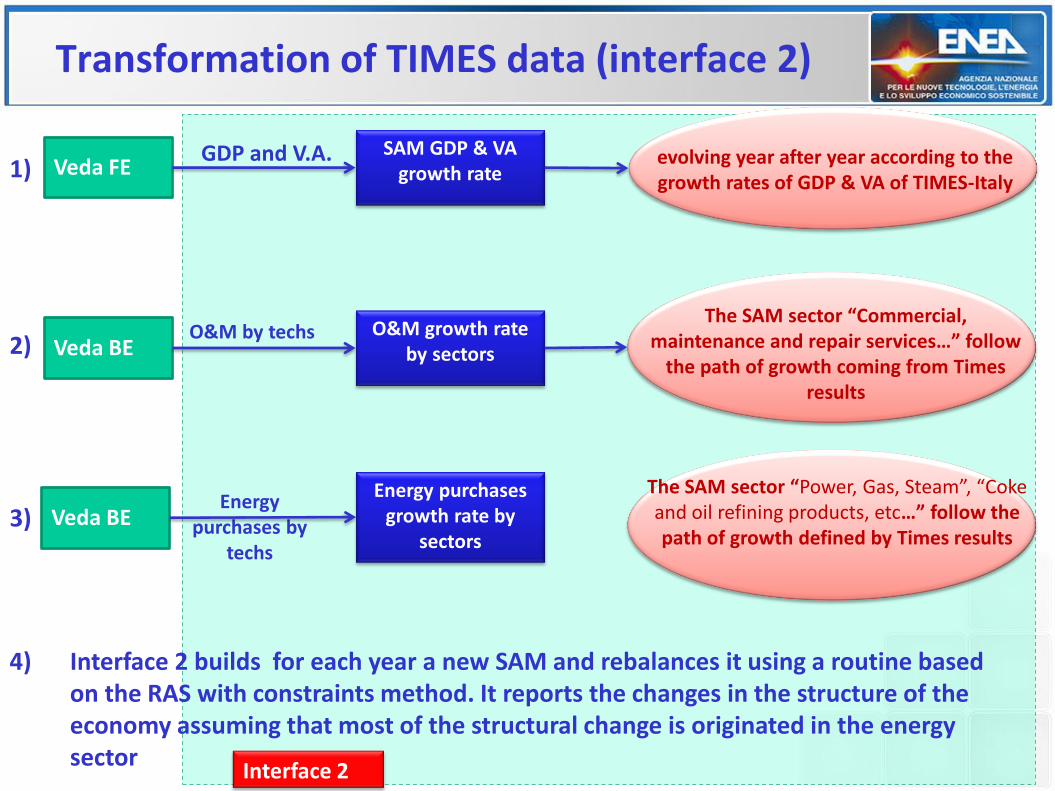
Transformation of TIMES data (interface 2)
Veda FE GDP and V.A. SAM GDP & VA
growth rate
Veda BE O&M by techs
Interface 2
evolving year after year according to the growth rates of GDP & VA of TIMES-Italy
1)
2) O&M growth rate
by sectors
3) Veda BE Energy
purchases by techs
Energy purchases growth rate by
sectors
The SAM sector “Commercial, maintenance and repair services…” follow
the path of growth coming from Times results
4) Interface 2 builds for each year a new SAM and rebalances it using a routine based on the RAS with constraints method. It reports the changes in the structure of the economy assuming that most of the structural change is originated in the energy sector
The SAM sector “Power, Gas, Steam”, “Coke and oil refining products, etc…” follow the path of growth defined by Times results
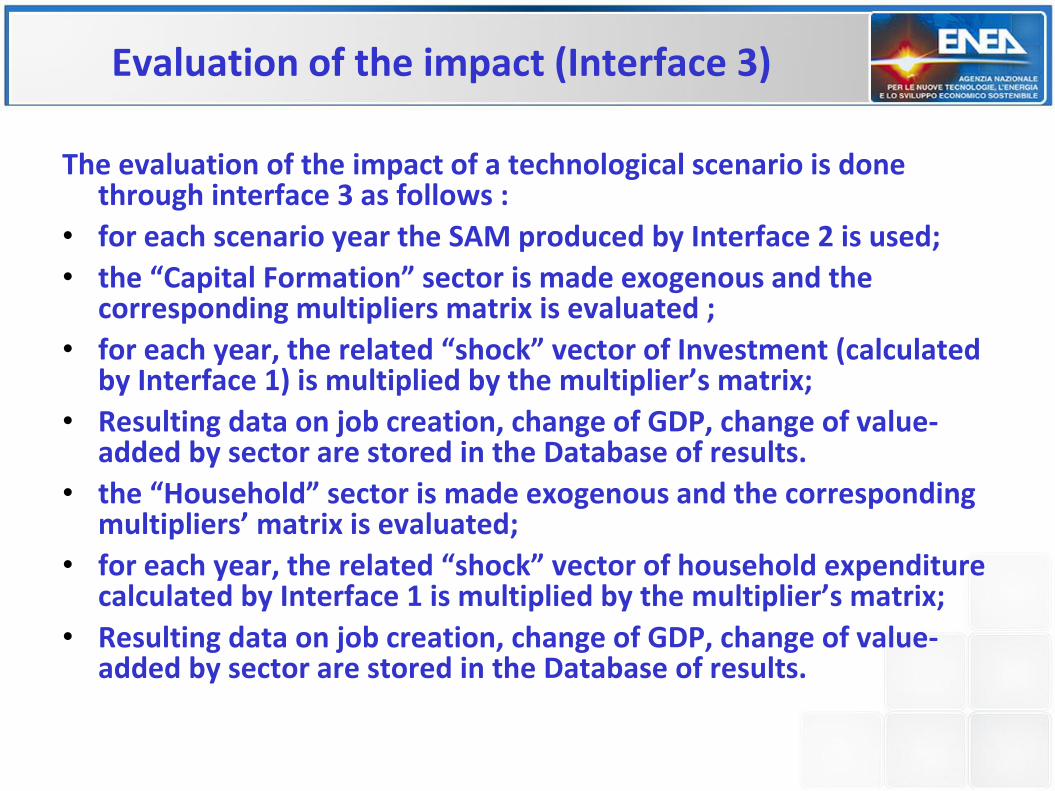
Evaluation of the impact (Interface 3)
The evaluation of the impact of a technological scenario is done through interface 3 as follows :
• for each scenario year the SAM produced by Interface 2 is used;
• the “Capital Formation” sector is made exogenous and the corresponding multipliers matrix is evaluated ;
• for each year, the related “shock” vector of Investment (calculated by Interface 1) is multiplied by the multiplier’s matrix;
• Resulting data on job creation, change of GDP, change of value-added by sector are stored in the Database of results.
• the “Household” sector is made exogenous and the corresponding multipliers’ matrix is evaluated;
• for each year, the related “shock” vector of household expenditure calculated by Interface 1 is multiplied by the multiplier’s matrix;
• Resulting data on job creation, change of GDP, change of value-added by sector are stored in the Database of results.
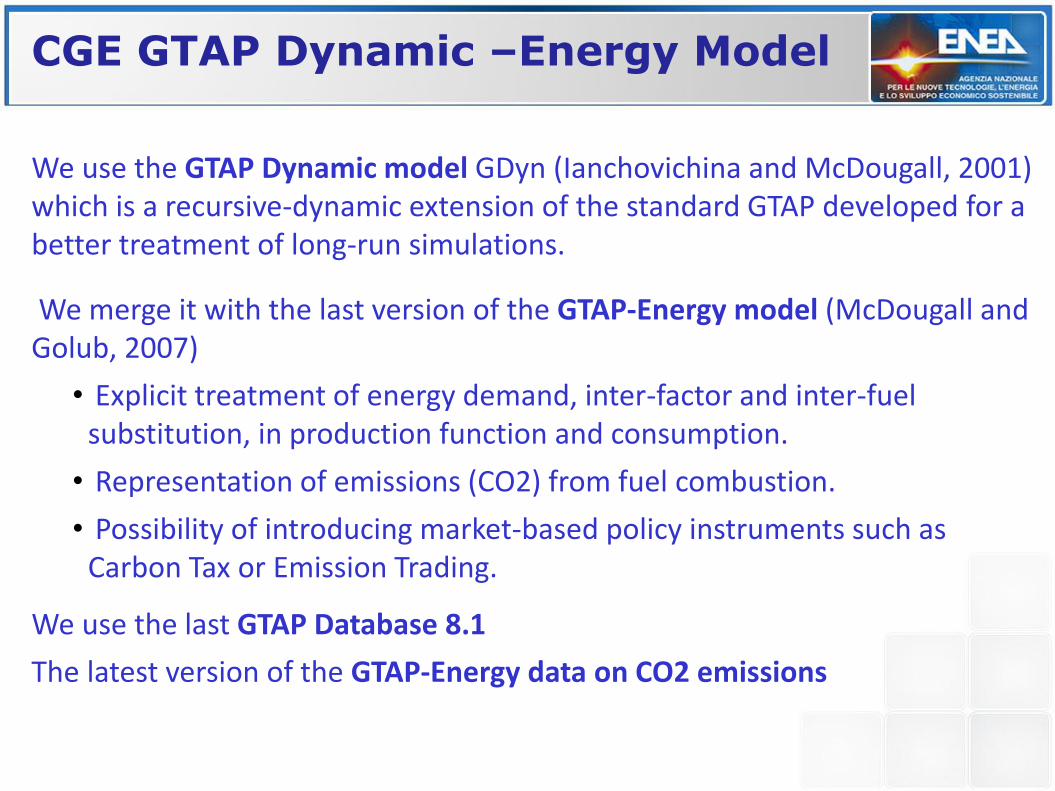
We use the GTAP Dynamic model GDyn (Ianchovichina and McDougall, 2001) which is a recursive-dynamic extension of the standard GTAP developed for a better treatment of long-run simulations.
We merge it with the last version of the GTAP-Energy model (McDougall and Golub, 2007)
• Explicit treatment of energy demand, inter-factor and inter-fuel substitution, in production function and consumption.
• Representation of emissions (CO2) from fuel combustion.
• Possibility of introducing market-based policy instruments such as Carbon Tax or Emission Trading.
We use the last GTAP Database 8.1
The latest version of the GTAP-Energy data on CO2 emissions
CGE GTAP Dynamic –Energy Model
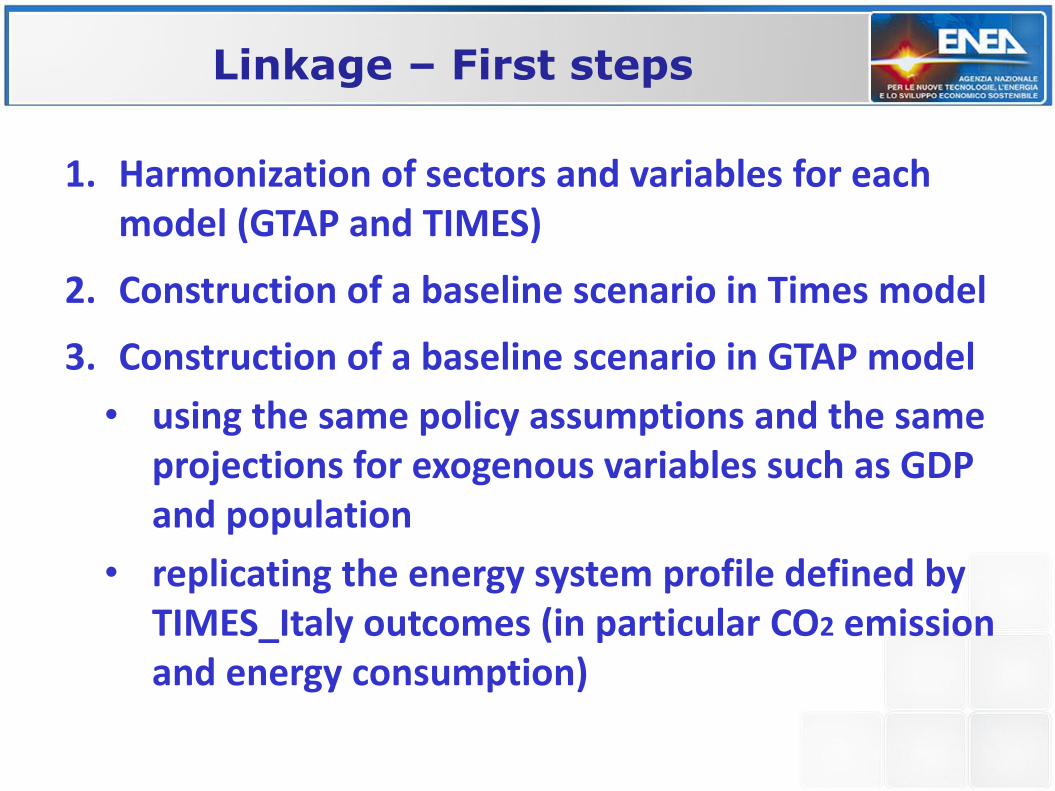
Linkage – First steps
1. Harmonization of sectors and variables for each model (GTAP and TIMES)
2. Construction of a baseline scenario in Times model
3. Construction of a baseline scenario in GTAP model
• using the same policy assumptions and the same projections for exogenous variables such as GDP and population
• replicating the energy system profile defined by TIMES_Italy outcomes (in particular CO2 emission and energy consumption)
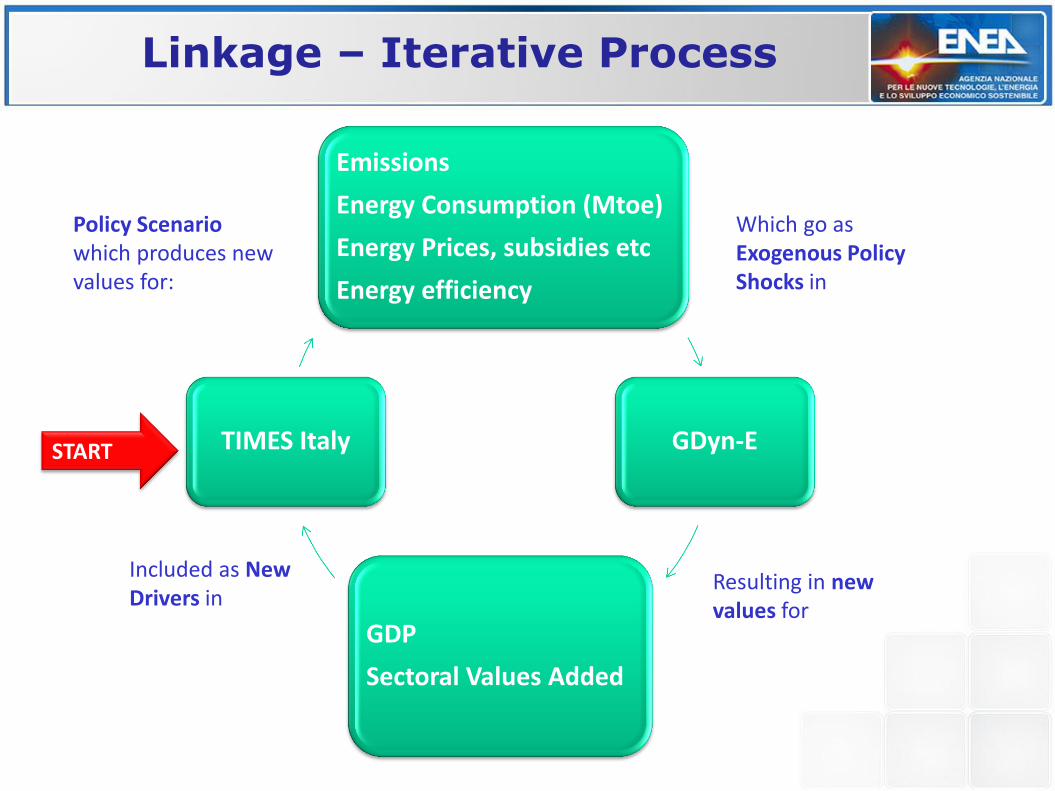
Emissions
Energy Consumption (Mtoe)
Energy Prices, subsidies etc
Energy efficiency
GDyn-E
GDP
Sectoral Values Added
TIMES Italy
Policy Scenario which produces new values for:
Which go as Exogenous Policy Shocks in
Resulting in new values for
Included as New Drivers in
START
Linkage – Iterative Process
References
Rao M., U. Ciorba, G. Trovato, C. Notaro, C. Ferrarese
“Costruzione di una Matrice di Contabilità Sociale Allargata al Settore Energetico” RT/2014/12/ENEA
http://openarchive.enea.it/bitstream/handle/10840/4940/RT-2014-12-ENEA.pdf
Baldissara, B., U. Ciorba, I. D’Elia, A. De Nicola, M. Gaeta, M. Rao
“ Sviluppo di metodologie innovative per l’analisi quantitativa dell’impatto sul sistema produttivo nazionale delle misure di riduzione delle emissioni di CO2”
Specifica Algoritmica – Rapporto ETS-SA-02. ENEA Giugno 2014.