endogenous biomarkers for renal transporters · endogenous biomarkers for renal transporters ....
TRANSCRIPT
Hiroyuki Kusuhara, Ph.D. Professor, Laboratory of Molecular Pharmacokinetics,
Graduate School of Pharmaceutical Sciences, the University of Tokyo
Endogenous biomarkers for Renal Transporters
International Transporter Consortium Workshop3 (ITCW3) March 13&14, 2017 Omni Shoreham Hotel, Washington DC, USA
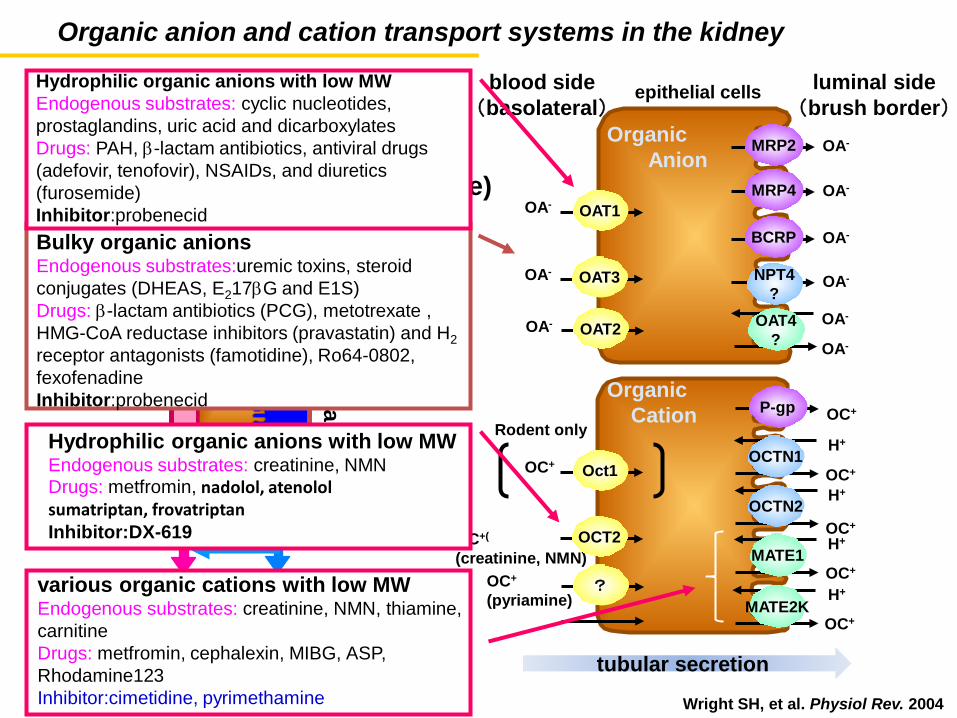
Organic anion and cation transport systems in the kidney
Wright SH, et al. Physiol Rev. 2004
proximal tubules
tubular secretion
fB・GFR (size selective)
CLsec
reabsorption
Oct1 OC+
MATE1 OC+(
(creatinine, NMN) OCT2
P-gp OC+
OC+
OC+
H+ MATE2K
OCTN2
OCTN1
H+
OC+
Rodent only
OC+ H+
H+
tubular secretion
epithelial cells
OAT1 OA-
blood side (basolateral)
luminal side (brush border)
OA- OAT3
MRP2 OA-
OAT4 ?
NPT4 ?
MRP4 OA-
BCRP OA-
OA-
OA-
OA-
Organic Anion
Organic Cation
Bulky organic anions Endogenous substrates:uremic toxins, steroid conjugates (DHEAS, E217βG and E1S) Drugs: β-lactam antibiotics (PCG), metotrexate , HMG-CoA reductase inhibitors (pravastatin) and H2 receptor antagonists (famotidine), Ro64-0802, fexofenadine Inhibitor:probenecid
Hydrophilic organic anions with low MW Endogenous substrates: cyclic nucleotides, prostaglandins, uric acid and dicarboxylates Drugs: PAH, β-lactam antibiotics, antiviral drugs (adefovir, tenofovir), NSAIDs, and diuretics (furosemide) Inhibitor:probenecid
OC+
(pyriamine) ?
Hydrophilic organic anions with low MW Endogenous substrates: creatinine, NMN Drugs: metfromin, nadolol, atenolol sumatriptan, frovatriptan Inhibitor:DX-619
various organic cations with low MW Endogenous substrates: creatinine, NMN, thiamine, carnitine Drugs: metfromin, cephalexin, MIBG, ASP, Rhodamine123 Inhibitor:cimetidine, pyrimethamine
OA- OAT2
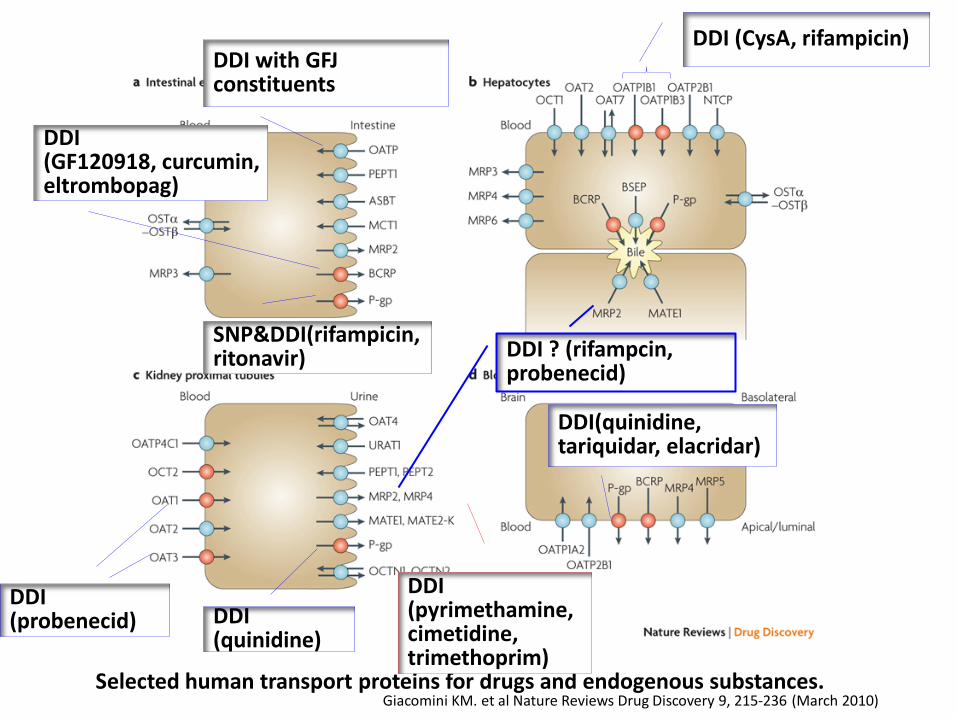
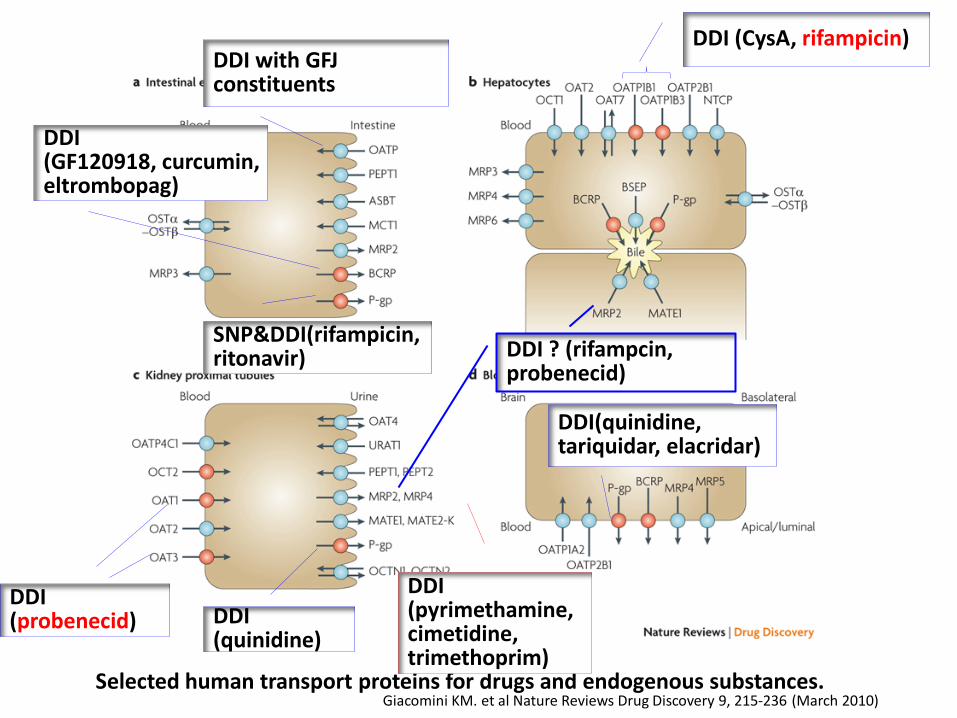
Selected human transport proteins for drugs and endogenous substances. Giacomini KM. et al Nature Reviews Drug Discovery 9, 215-236 (March 2010)
DDI (CysA, rifampicin)
DDI ? (rifampcin, probenecid)
DDI with GFJ constituents
SNP&DDI(rifampicin, ritonavir)
DDI (probenecid)
DDI (pyrimethamine,cimetidine, trimethoprim)
DDI(quinidine, tariquidar, elacridar)
DDI (GF120918, curcumin, eltrombopag)
DDI (quinidine)
Plas
ma
Conc
.
Time
Plas
ma
Conc
.
Time
Kidn
ey C
onc.
Time
Kidn
ey fu
nctio
n Time
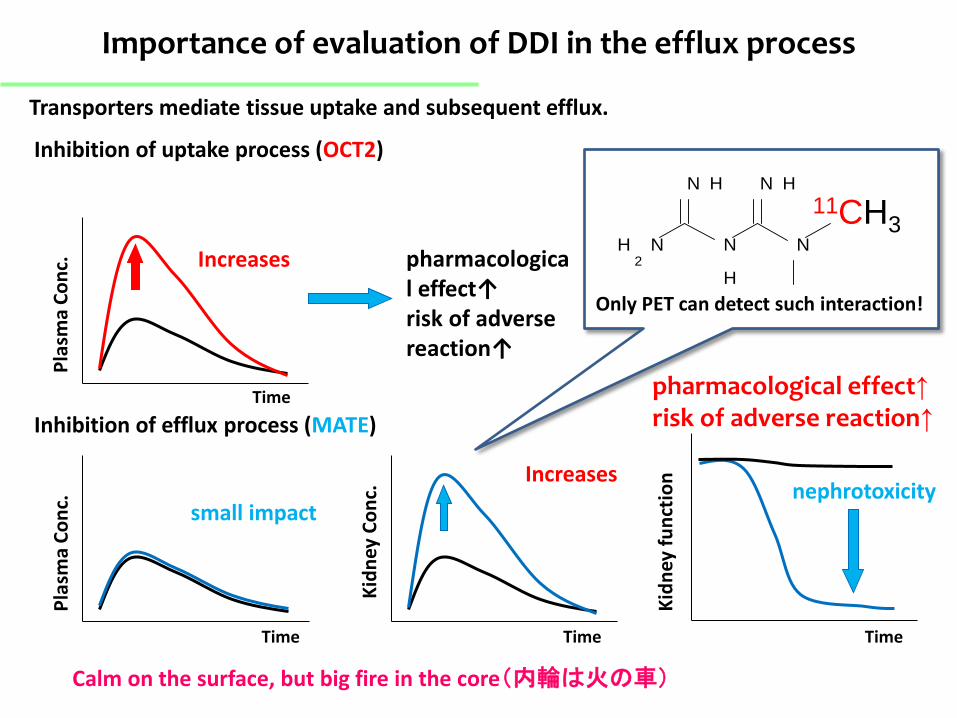
Increases
small impact
Inhibition of uptake process (OCT2)
Inhibition of efflux process (MATE)
nephrotoxicity
Importance of evaluation of DDI in the efflux process
Transporters mediate tissue uptake and subsequent efflux.
pharmacological effect↑ risk of adverse reaction↑
NH2
N H
N
H
N H
N
11CH3
Only PET can detect such interaction!
Increases
Calm on the surface, but big fire in the core(内輪は火の車)
pharmacological effect↑ risk of adverse reaction↑
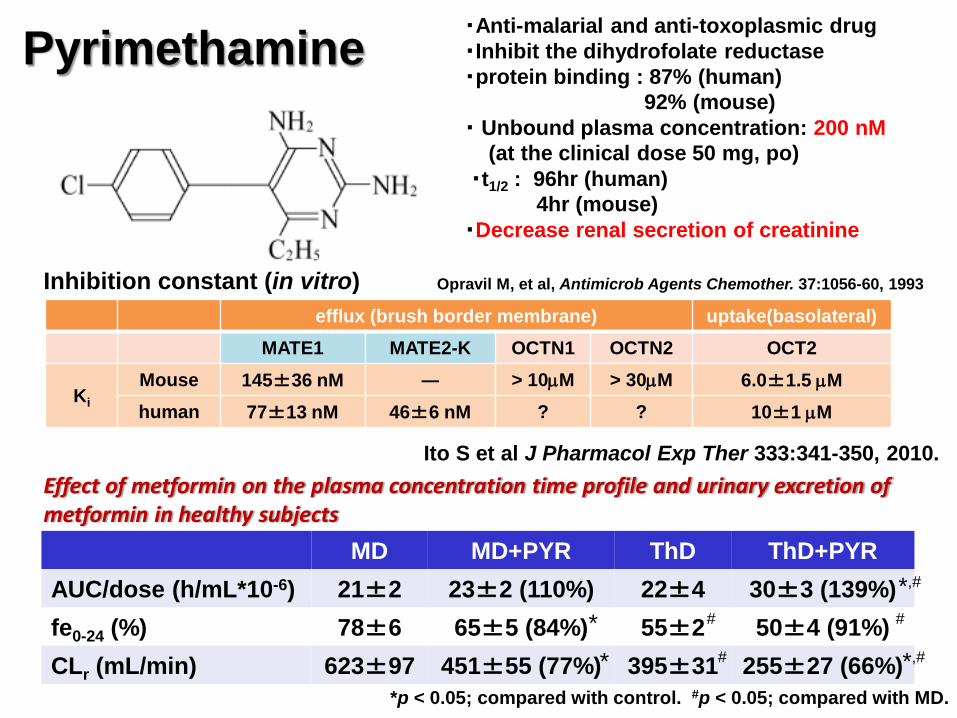
Pyrimethamine
Opravil M, et al, Antimicrob Agents Chemother. 37:1056-60, 1993
・Anti-malarial and anti-toxoplasmic drug ・Inhibit the dihydrofolate reductase ・protein binding : 87% (human) 92% (mouse) ・ Unbound plasma concentration: 200 nM (at the clinical dose 50 mg, po) ・t1/2 : 96hr (human) 4hr (mouse) ・Decrease renal secretion of creatinine
efflux (brush border membrane) uptake(basolateral) MATE1 MATE2-K OCTN1 OCTN2 OCT2
Ki Mouse 145±36 nM ― > 10µM > 30µM 6.0±1.5 µM human 77±13 nM 46±6 nM ? ? 10±1 µM
Inhibition constant (in vitro)
Ito S et al J Pharmacol Exp Ther 333:341-350, 2010.
MD MD+PYR ThD ThD+PYR AUC/dose (h/mL*10-6) 21±2 23±2 (110%) 22±4 30±3 (139%) fe0-24 (%) 78±6 65±5 (84%) 55±2 50±4 (91%) CLr (mL/min) 623±97 451±55 (77%) 395±31 255±27 (66%)
*,# * # # * # *,#
*p < 0.05; compared with control. #p < 0.05; compared with MD.
Effect of metformin on the plasma concentration time profile and urinary excretion of metformin in healthy subjects
T im e (m in )
%D
os
e/t
iss
ue
0 1 0 2 0 3 00
1 0
2 0
3 0
T im e (m in )
%D
os
e/g
tis
su
e
0 1 0 2 0 3 00
1 0
2 0
3 0
T im e (m in )%
Do
se
/g t
iss
ue
0 1 0 2 0 3 00
5 0
1 0 0
1 5 0
T im e (m in )%
Do
se
/g t
iss
ue
0 1 0 2 0 3 00
2
4
6
8
1 0
(B) Liver
(D) Corticomedulla region (E) Renal pelvis (C) Whole kidney
Coronal plane
RC LC
RP LP RWK LWK
Li
RC LC
RP LP RWK LWK
Li
Frame #6 [30sec]
Frame #20 [500sec]
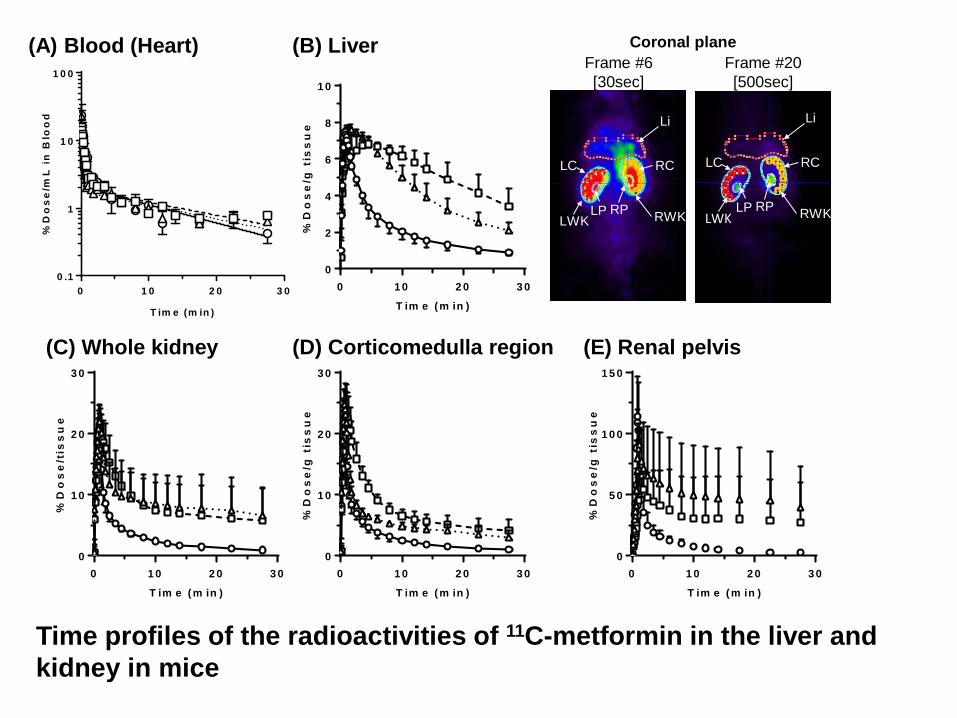
Time profiles of the radioactivities of 11C-metformin in the liver and kidney in mice
T im e (m in )
%D
os
e/m
L i
n B
loo
d
0 1 0 2 0 3 00 .1
1
1 0
1 0 0
(A) Blood (Heart)
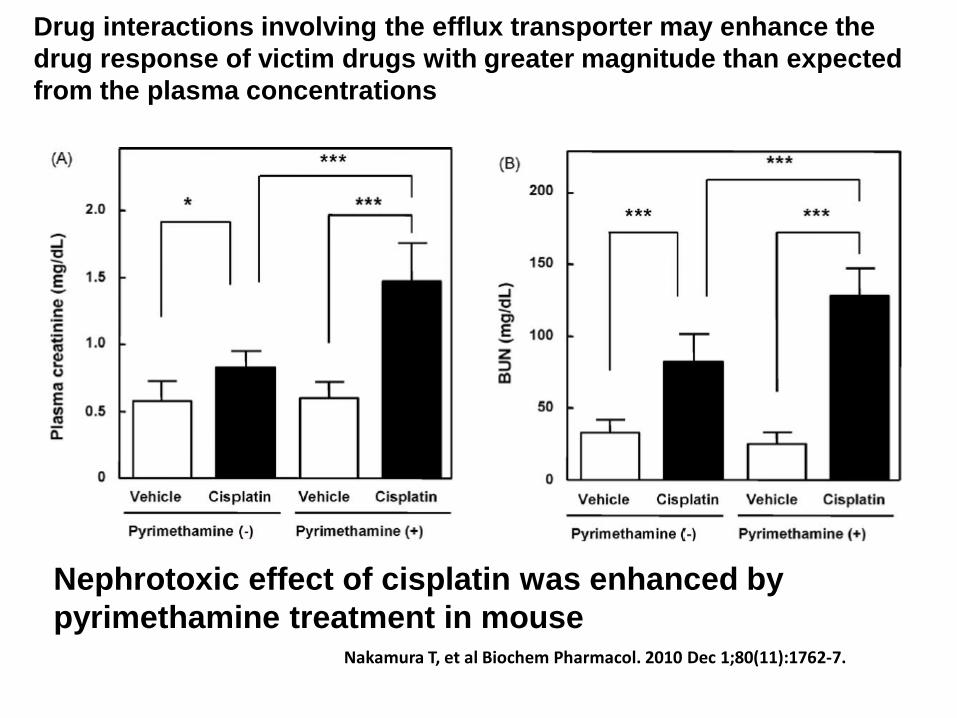
Nephrotoxic effect of cisplatin was enhanced by pyrimethamine treatment in mouse
Nakamura T, et al Biochem Pharmacol. 2010 Dec 1;80(11):1762-7.
Drug interactions involving the efflux transporter may enhance the drug response of victim drugs with greater magnitude than expected from the plasma concentrations
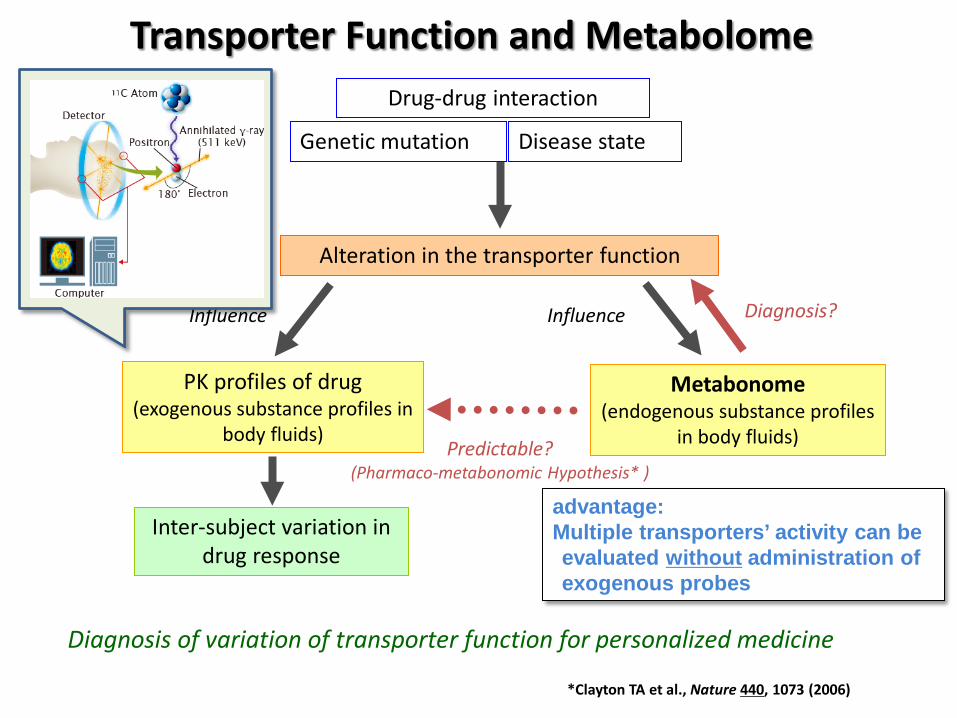
Transporter Function and Metabolome
*Clayton TA et al., Nature 440, 1073 (2006)
Drug-drug interaction
Alteration in the transporter function
PK profiles of drug (exogenous substance profiles in
body fluids)
Inter-subject variation in drug response
Influence
Diagnosis of variation of transporter function for personalized medicine
Genetic mutation Disease state
Influence
Predictable? (Pharmaco-metabonomic Hypothesis* )
Metabonome (endogenous substance profiles
in body fluids)
Diagnosis?
advantage: Multiple transporters’ activity can be evaluated without administration of exogenous probes
(C)
Plasma kin CLtot
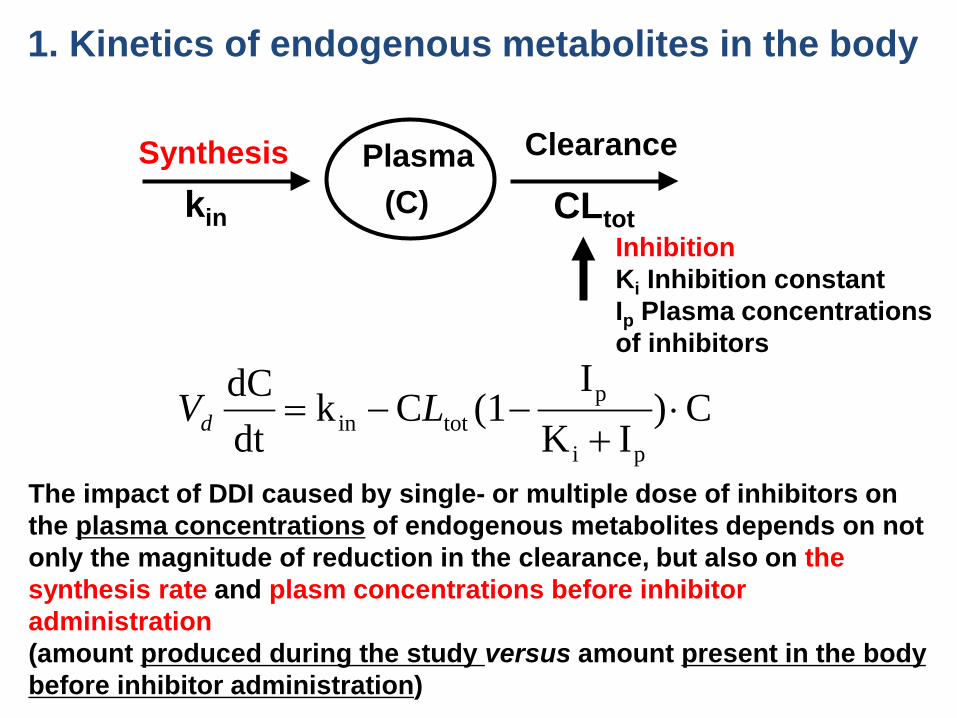
1. Kinetics of endogenous metabolites in the body
C)IK
I(1Ck
dtdC
pi
ptotin ⋅
+−−= LVd
The impact of DDI caused by single- or multiple dose of inhibitors on the plasma concentrations of endogenous metabolites depends on not only the magnitude of reduction in the clearance, but also on the synthesis rate and plasm concentrations before inhibitor administration (amount produced during the study versus amount present in the body before inhibitor administration)
Inhibition Ki Inhibition constant Ip Plasma concentrations of inhibitors
Synthesis Clearance
10
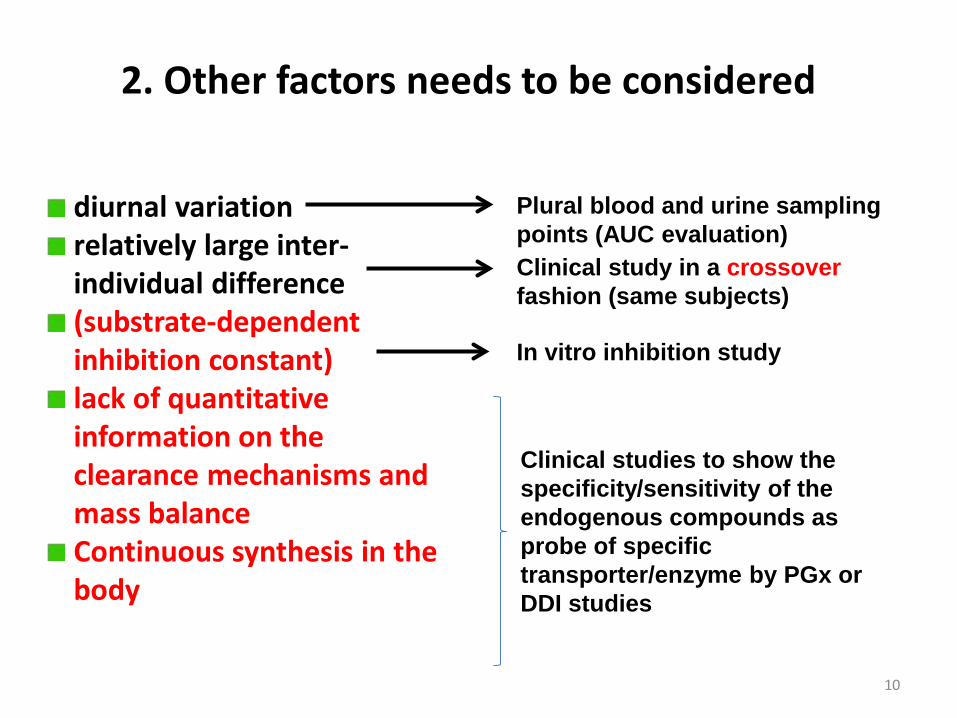
2. Other factors needs to be considered
diurnal variation relatively large inter-individual difference (substrate-dependent inhibition constant) lack of quantitative information on the clearance mechanisms and mass balance Continuous synthesis in the body
Plural blood and urine sampling points (AUC evaluation) Clinical study in a crossover fashion (same subjects)
In vitro inhibition study
Clinical studies to show the specificity/sensitivity of the endogenous compounds as probe of specific transporter/enzyme by PGx or DDI studies
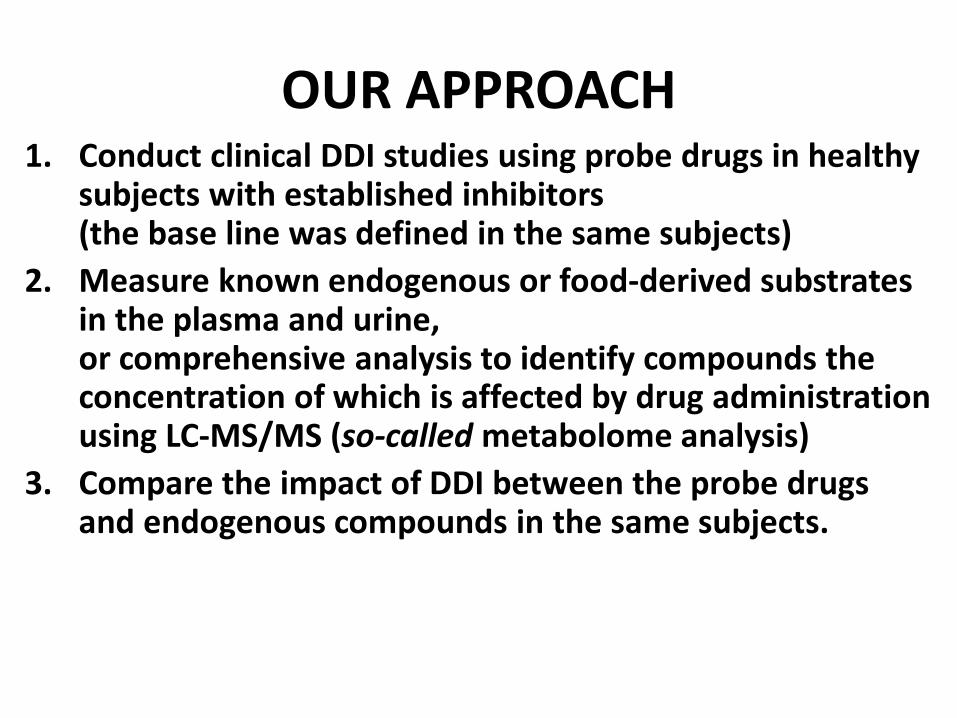
OUR APPROACH 1. Conduct clinical DDI studies using probe drugs in healthy
subjects with established inhibitors (the base line was defined in the same subjects)
2. Measure known endogenous or food-derived substrates in the plasma and urine, or comprehensive analysis to identify compounds the concentration of which is affected by drug administration using LC-MS/MS (so-called metabolome analysis)
3. Compare the impact of DDI between the probe drugs and endogenous compounds in the same subjects.
12
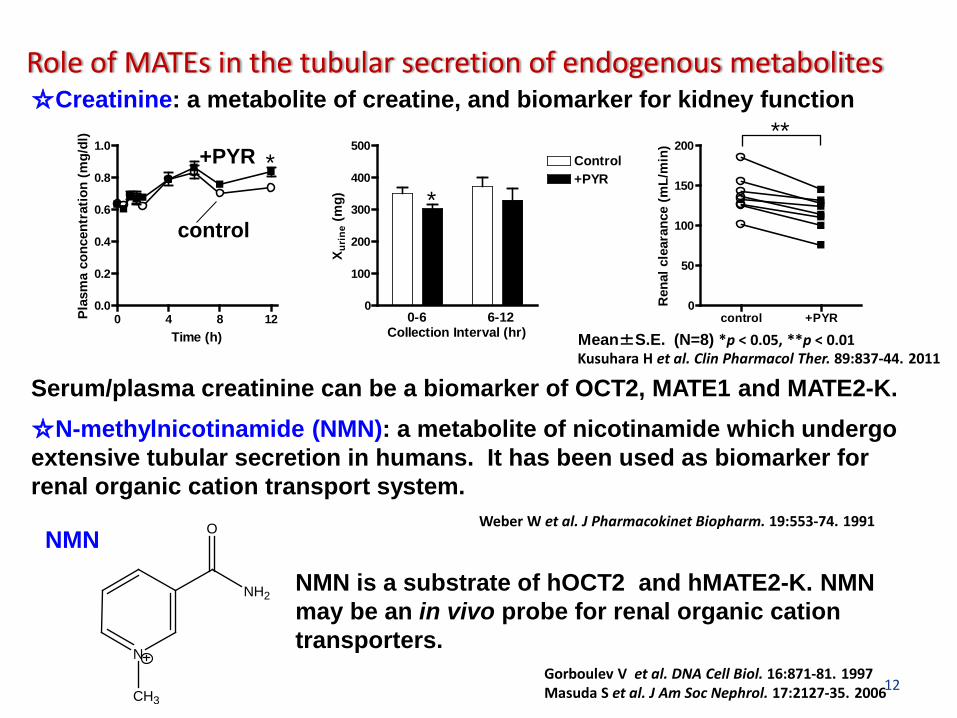
Role of MATEs in the tubular secretion of endogenous metabolites ☆Creatinine: a metabolite of creatine, and biomarker for kidney function
☆N-methylnicotinamide (NMN): a metabolite of nicotinamide which undergo extensive tubular secretion in humans. It has been used as biomarker for renal organic cation transport system.
NMN is a substrate of hOCT2 and hMATE2-K. NMN may be an in vivo probe for renal organic cation transporters.
Serum/plasma creatinine can be a biomarker of OCT2, MATE1 and MATE2-K.
0 4 8 120.0
0.2
0.4
0.6
0.8
1.0
Time (h)
Plas
ma
conc
entr
atio
n (m
g/dl
)
0
100
200
300
400
500
0-6 6-12
Control+PYR
Collection Interval (hr)X u
rine
(mg)
control +PYR0
50
100
150
200
Ren
al c
lear
ance
(mL/
min
)
* *
N
NH2
O
CH3
control
+PYR **
Weber W et al. J Pharmacokinet Biopharm. 19:553-74. 1991
Gorboulev V et al. DNA Cell Biol. 16:871-81. 1997 Masuda S et al. J Am Soc Nephrol. 17:2127-35. 2006
Kusuhara H et al. Clin Pharmacol Ther. 89:837-44. 2011
NMN
Mean±S.E. (N=8) *p < 0.05, **p < 0.01
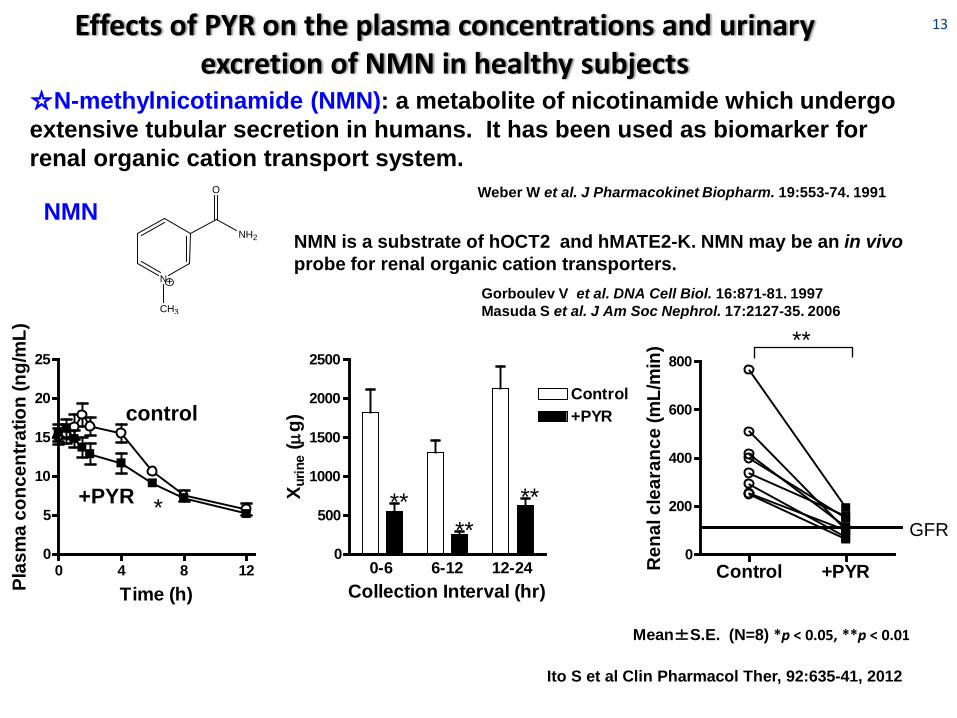
13 Effects of PYR on the plasma concentrations and urinary excretion of NMN in healthy subjects
0 4 8 120
5
10
15
20
25
Time (h)Plas
ma
conc
entra
tion
(ng/
mL)
0
500
1000
1500
2000
2500
0-6 6-12 12-24
Control+PYR
Collection Interval (hr)
X urin
e (µ
g)
Control +PYR0
200
400
600
800
GFR
Ren
al c
lear
ance
(mL/
min
)
** ** * **
**
control
+PYR
Mean±S.E. (N=8) *p < 0.05, **p < 0.01
☆N-methylnicotinamide (NMN): a metabolite of nicotinamide which undergo extensive tubular secretion in humans. It has been used as biomarker for renal organic cation transport system.
NMN is a substrate of hOCT2 and hMATE2-K. NMN may be an in vivo probe for renal organic cation transporters.
N
NH2
O
CH3
Weber W et al. J Pharmacokinet Biopharm. 19:553-74. 1991
Gorboulev V et al. DNA Cell Biol. 16:871-81. 1997 Masuda S et al. J Am Soc Nephrol. 17:2127-35. 2006
NMN
Ito S et al Clin Pharmacol Ther, 92:635-41, 2012
14
0
1
2
3
pHout(6.0)=pHin(6.0)pHout(8.0)>pHin(6.0)
PYR (nM) 0 100 1000
v/[N
MN
] (µ
L/30
s/m
g pr
otei
n)
0 500 1000 1500 2000 25000
1
2
3
[metformin] = 0[metformin] = 500 µM
v (pmol/30s/mg protein)
v/[N
MN
] (µ
L/30
s/m
g pr
otei
n)
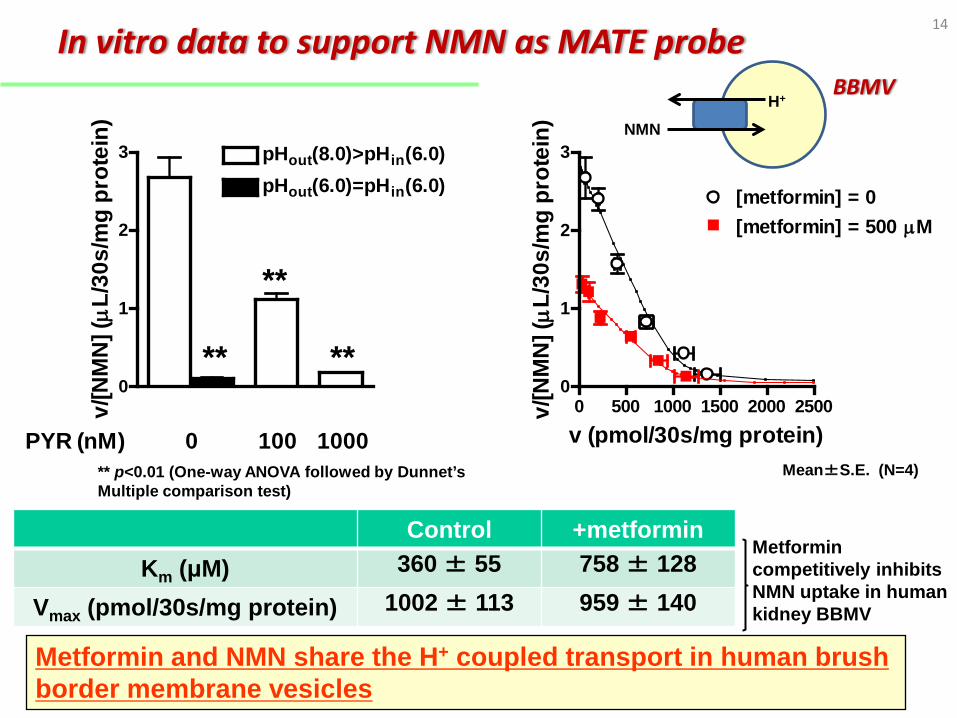
Metformin and NMN share the H+ coupled transport in human brush border membrane vesicles
Control +metformin Km (μM) 360 ± 55 758 ± 128
Vmax (pmol/30s/mg protein) 1002 ± 113 959 ± 140
Mean±S.E. (N=4)
**
**
**
** p<0.01 (One-way ANOVA followed by Dunnet’s Multiple comparison test)
In vitro data to support NMN as MATE probe H+
NMN
BBMV
Metformin competitively inhibits NMN uptake in human kidney BBMV
15/22
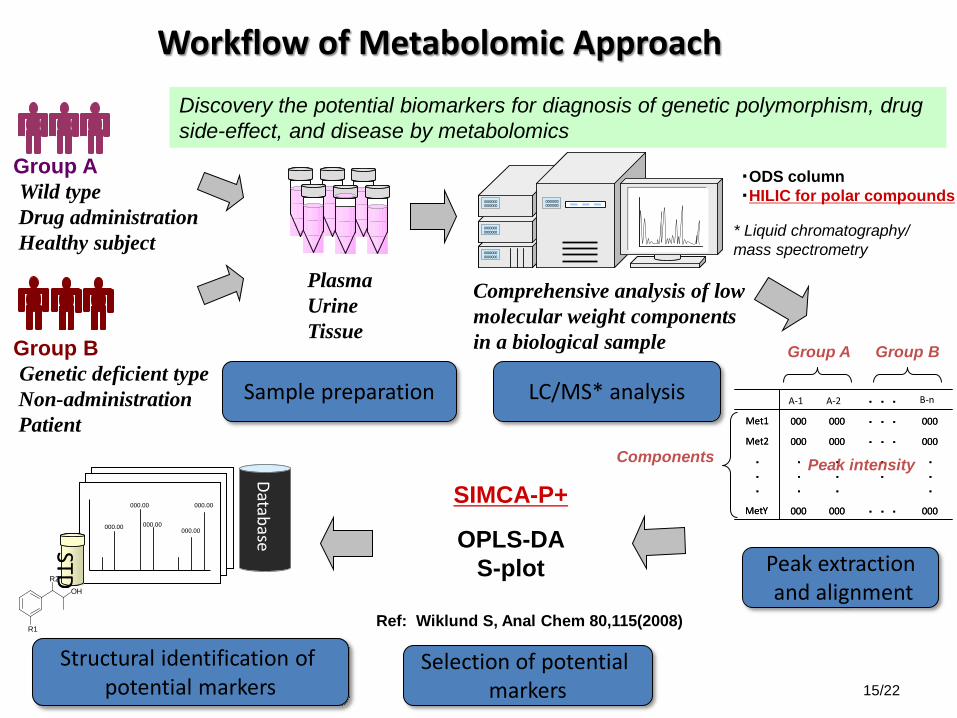
Workflow of Metabolomic Approach
Peak extraction and alignment
Sample preparation LC/MS* analysis
Selection of potential markers
Structural identification of potential markers
Group A Wild type Drug administration Healthy subject
Group B Genetic deficient type Non-administration Patient
Plasma Urine Tissue
0000000 0000000
0000000 0000000
0000000 0000000
0000000 0000000
0000000 0000000
0000000 0000000
0000000 0000000
0000000 0000000
000 ・ ・ ・ 000 000 Met2
・ ・ ・
・ ・
・ ・ ・
・ ・ ・
・ ・ ・
000
000
000 ・ ・ ・ 000 Met Y
000 ・ ・ ・ 000 Met1
・ ・ ・
000 ・ ・ ・ 000 000 Met2
・ ・ ・
・ ・
・ ・ ・
・ ・ ・
・ ・ ・
000
000
000 ・ ・ ・ 000 Met Y
000 ・ ・ ・ 000 Met1
B-n ・ ・ ・ A-2 A-1
000.00
000.00
000.00
000.00 000.00
000.00
000.00
000.00
000.00 000.00
STD STD
Database
Comprehensive analysis of low molecular weight components in a biological sample Group A Group B
Peak intensity Components
* Liquid chromatography/ mass spectrometry
Discovery the potential biomarkers for diagnosis of genetic polymorphism, drug side-effect, and disease by metabolomics
R2
R1
OH
SIMCA-P+
OPLS-DA S-plot
・ODS column ・HILIC for polar compounds
Ref: Wiklund S, Anal Chem 80,115(2008)
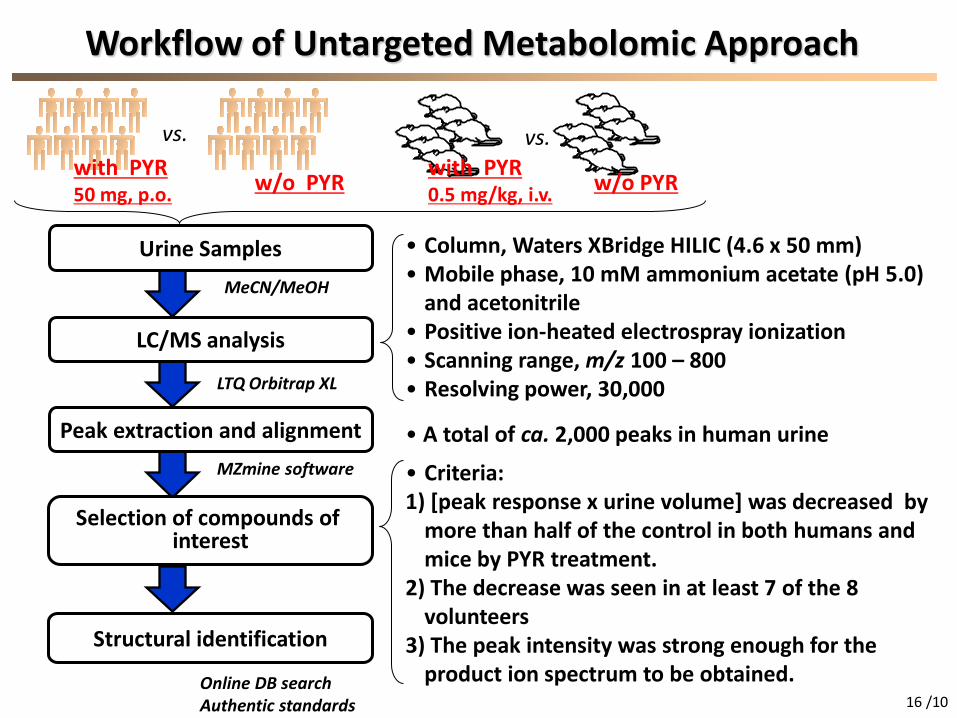
Workflow of Untargeted Metabolomic Approach
Peak extraction and alignment
Urine Samples
LC/MS analysis
Selection of compounds of interest
Structural identification
• A total of ca. 2,000 peaks in human urine
• Criteria: 1) [peak response x urine volume] was decreased by
more than half of the control in both humans and mice by PYR treatment.
2) The decrease was seen in at least 7 of the 8 volunteers
3) The peak intensity was strong enough for the product ion spectrum to be obtained.
• Column, Waters XBridge HILIC (4.6 x 50 mm) • Mobile phase, 10 mM ammonium acetate (pH 5.0)
and acetonitrile • Positive ion-heated electrospray ionization • Scanning range, m/z 100 – 800 • Resolving power, 30,000
16 /10
MeCN/MeOH
LTQ Orbitrap XL
MZmine software
Online DB search Authentic standards
w/o PYR with PYR 0.5 mg/kg, i.v. w/o PYR
vs. vs. with PYR 50 mg, p.o.
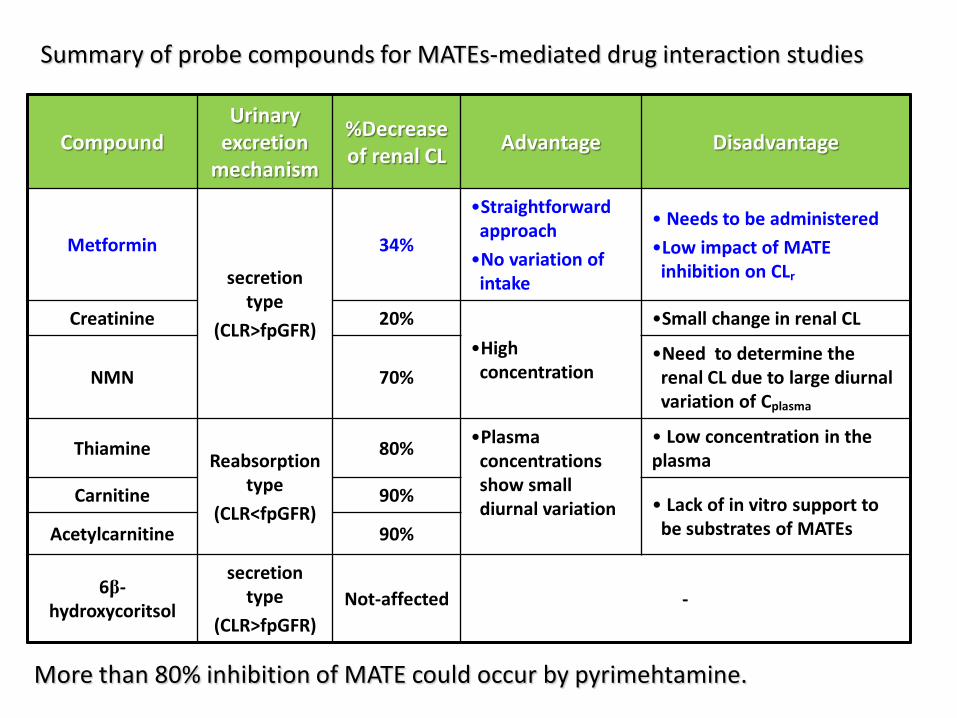
Summary of probe compounds for MATEs-mediated drug interaction studies
Compound Urinary
excretion mechanism
%Decrease of renal CL Advantage Disadvantage
Metformin
secretion type
(CLR>fpGFR)
34%
•Straightforward approach •No variation of
intake
• Needs to be administered •Low impact of MATE
inhibition on CLr
Creatinine 20% •High
concentration
•Small change in renal CL
NMN 70% •Need to determine the
renal CL due to large diurnal variation of Cplasma
Thiamine Reabsorption type
(CLR<fpGFR)
80% •Plasma concentrations show small diurnal variation
• Low concentration in the plasma
Carnitine 90% • Lack of in vitro support to be substrates of MATEs Acetylcarnitine 90%
6β-hydroxycoritsol
secretion type
(CLR>fpGFR) Not-affected -
More than 80% inhibition of MATE could occur by pyrimehtamine.
Selected human transport proteins for drugs and endogenous substances. Giacomini KM. et al Nature Reviews Drug Discovery 9, 215-236 (March 2010)
DDI (CysA, rifampicin)
DDI ? (rifampcin, probenecid)
DDI with GFJ constituents
SNP&DDI(rifampicin, ritonavir)
DDI (probenecid)
DDI (pyrimethamine,cimetidine, trimethoprim)
DDI(quinidine, tariquidar, elacridar)
DDI (GF120918, curcumin, eltrombopag)
DDI (quinidine)
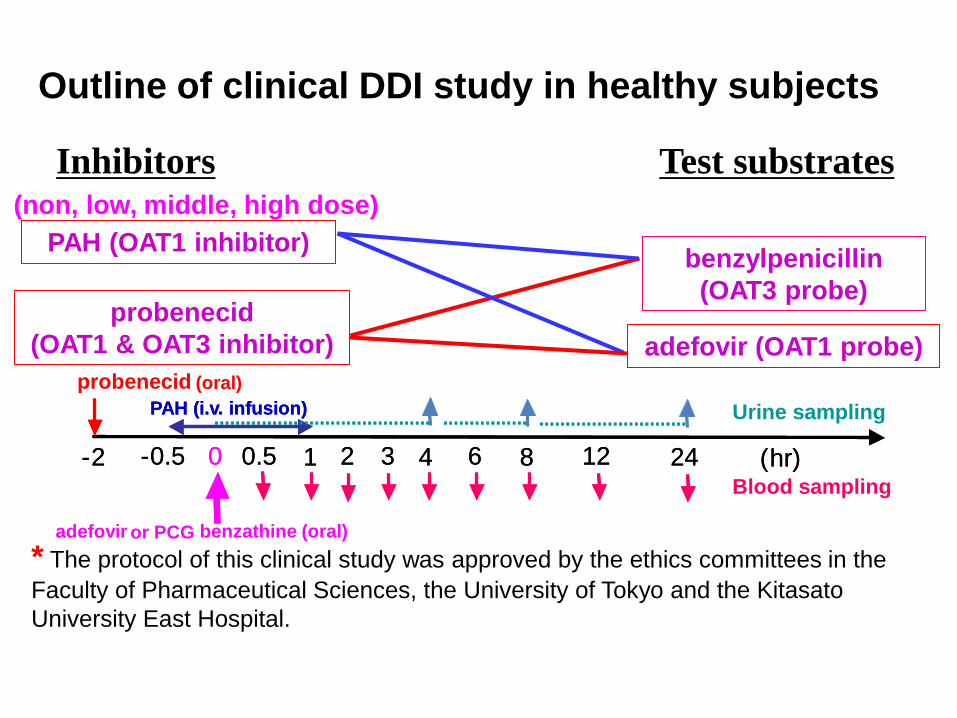
Outline of clinical DDI study in healthy subjects
benzylpenicillin (OAT3 probe)
adefovir (OAT1 probe)
Test substrates
PAH (OAT1 inhibitor)
probenecid (OAT1 & OAT3 inhibitor)
Inhibitors
probenecid (oral) PAH (i.v. infusion)
- 2 - 0.5 1 0 0.5 2 3 4 6 8 12 24
adefovir or PCG benzathine (oral)
Blood sampling
Urine sampling
( hr)
PAH (i.v. infusion)
- 2 - 0.5 1 0 0.5 2 3 4 6 8 12 24 ( hr)
* The protocol of this clinical study was approved by the ethics committees in the Faculty of Pharmaceutical Sciences, the University of Tokyo and the Kitasato University East Hospital.
(non, low, middle, high dose)
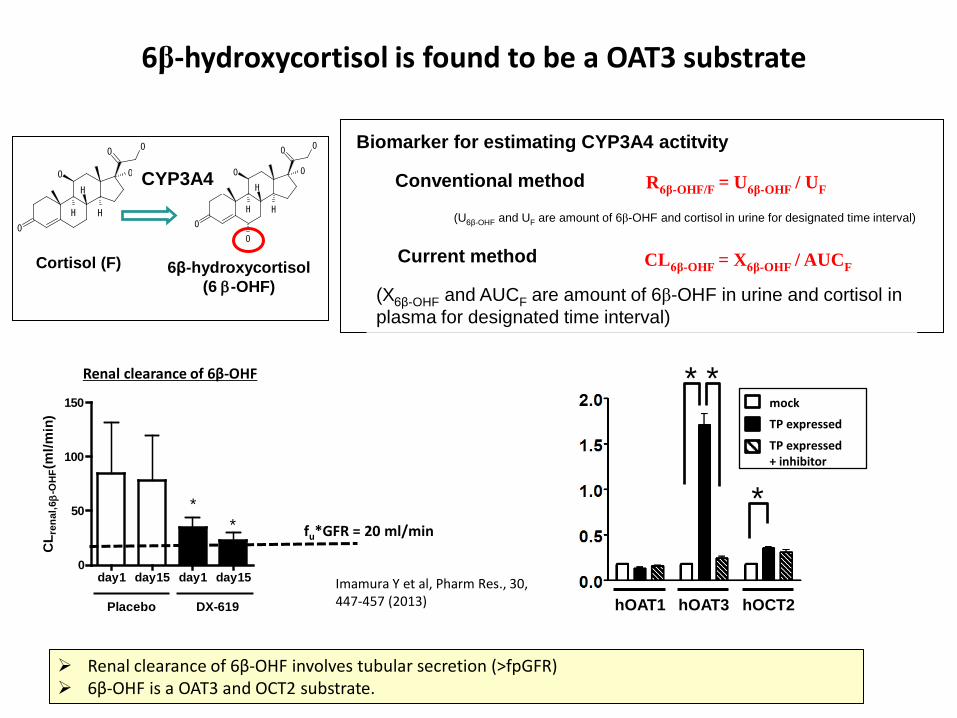
6β-hydroxycortisol is found to be a OAT3 substrate
day1 day15 day1 day150
50
100
150
CL r
enal
,6β
-OH
F(m
l/min
)
Placebo DX-619
** fu*GFR = 20 ml/min
Renal clearance of 6β-OHF involves tubular secretion (>fpGFR) 6β-OHF is a OAT3 and OCT2 substrate.
Renal clearance of 6β-OHF
Imamura Y et al, Pharm Res., 30, 447-457 (2013)
O
O
O
O
H H
H
O
O
O
O
O
H H
H
O
O
CYP3A4
Cortisol (F) 6β-hydroxycortisol (6 β-OHF)
Biomarker for estimating CYP3A4 actitvity
Conventional method
Current method
R6β-OHF/F = U6β-OHF / UF
CL6β-OHF = X6β-OHF / AUCF
(X6β-OHF and AUCF are amount of 6β-OHF in urine and cortisol in plasma for designated time interval)
(U6β-OHF and UF are amount of 6β-OHF and cortisol in urine for designated time interval)
hOAT1 hOAT3 hOCT2
* *
*
mock
TP expressed
TP expressed + inhibitor
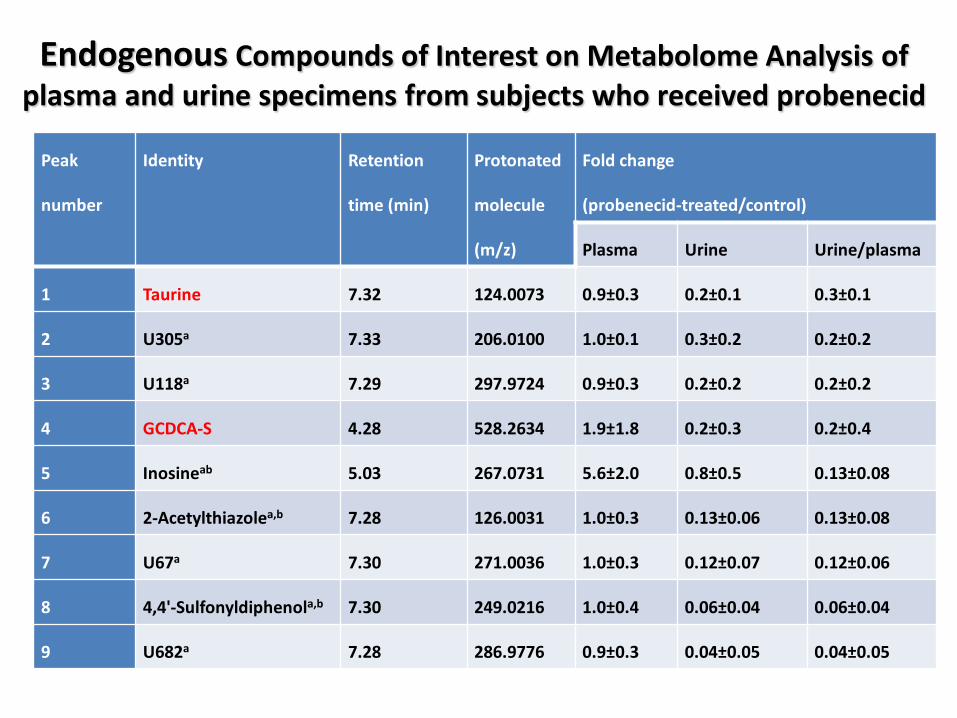
Endogenous Compounds of Interest on Metabolome Analysis of plasma and urine specimens from subjects who received probenecid
Peak
number
Identity Retention
time (min)
Protonated
molecule
(m/z)
Fold change
(probenecid-treated/control)
Plasma Urine Urine/plasma
1 Taurine 7.32 124.0073 0.9±0.3 0.2±0.1 0.3±0.1
2 U305a 7.33 206.0100 1.0±0.1 0.3±0.2 0.2±0.2
3 U118a 7.29 297.9724 0.9±0.3 0.2±0.2 0.2±0.2
4 GCDCA-S 4.28 528.2634 1.9±1.8 0.2±0.3 0.2±0.4
5 Inosineab 5.03 267.0731 5.6±2.0 0.8±0.5 0.13±0.08
6 2-Acetylthiazolea,b 7.28 126.0031 1.0±0.3 0.13±0.06 0.13±0.08
7 U67a 7.30 271.0036 1.0±0.3 0.12±0.07 0.12±0.06
8 4,4'-Sulfonyldiphenola,b 7.30 249.0216 1.0±0.4 0.06±0.04 0.06±0.04
9 U682a 7.28 286.9776 0.9±0.3 0.04±0.05 0.04±0.05
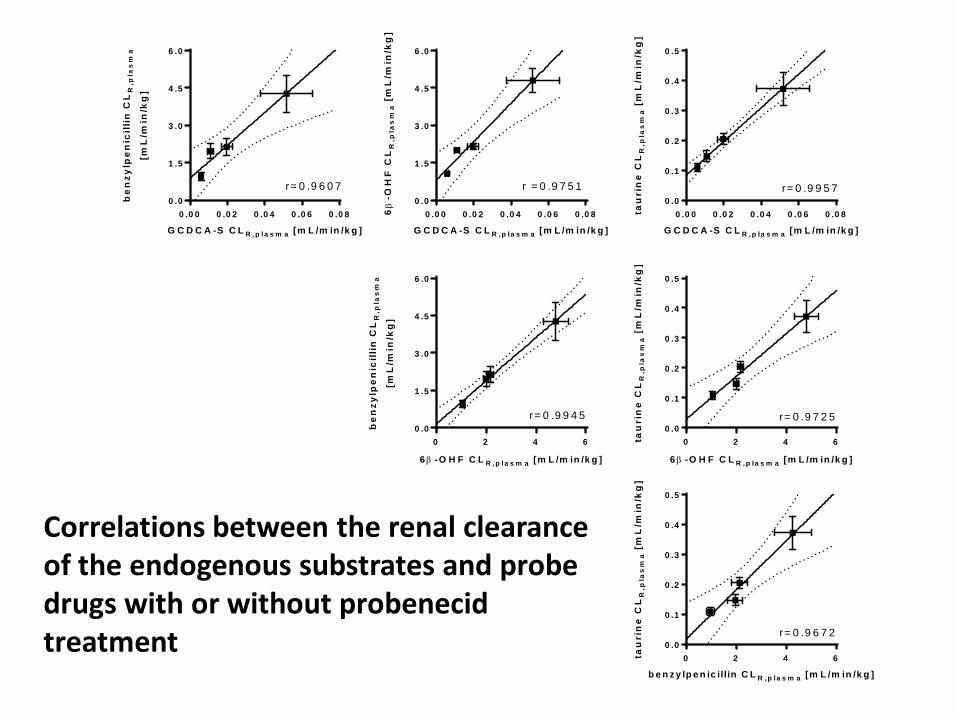
Correlations between the renal clearance of the endogenous substrates and probe drugs with or without probenecid treatment
0 .0 0 0 .0 2 0 .0 4 0 .0 6 0 .0 80 .0
0 .1
0 .2
0 .3
0 .4
0 .5
G C D C A -S C L R ,p la s m a [m L /m in /k g ]
tau
rin
e C
LR
,pla
sm
a [
mL
/min
/kg
]
r= 0 .9 9 5 7
0 2 4 60 .0
0 .1
0 .2
0 .3
0 .4
0 .5
b e n z y lp e n ic illin C L R ,p la s m a [m L /m in /k g ]
tau
rin
e C
LR
,pla
sm
a [
mL
/min
/kg
]r= 0 .9 6 7 2
0 2 4 60 .0
0 .1
0 .2
0 .3
0 .4
0 .5
6β -O H F C L R ,p la s m a [m L /m in /k g ]
tau
rin
e C
LR
,pla
sm
a [
mL
/min
/kg
]
r= 0 .9 7 2 5
0 .0 0 0 .0 2 0 .0 4 0 .0 6 0 .0 80 .0
1 .5
3 .0
4 .5
6 .0
G C D C A -S C L R ,p la s m a [m L /m in /k g ]
6β
-OH
FC
LR
,pla
sm
a [
mL
/min
/kg
]
r = 0 .9 7 5 1
0 2 4 60 .0
1 .5
3 .0
4 .5
6 .0
6β -O H F C L R , p la s m a [m L /m in /k g ]
be
nzy
lpe
nic
illi
n C
LR
,pla
sm
a
[mL
/min
/kg
]
r= 0 .9 9 4 5
0 .0 0 0 .0 2 0 .0 4 0 .0 6 0 .0 80 .0
1 .5
3 .0
4 .5
6 .0
G C D C A -S C L R , p la s m a [m L /m in /k g ]
be
nzy
lpe
nic
illi
n C
LR
,pla
sm
a
[mL
/min
/kg
]
r= 0 .9 6 0 7
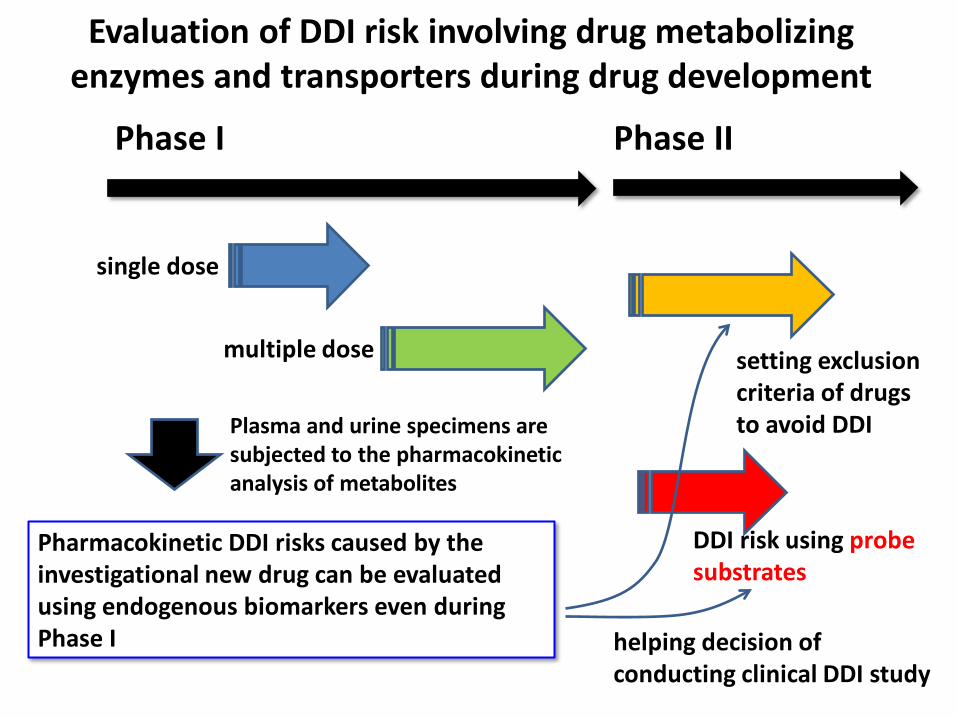
Evaluation of DDI risk involving drug metabolizing enzymes and transporters during drug development
single dose
multiple dose
DDI risk using probe substrates
Phase I Phase II
Pharmacokinetic DDI risks caused by the investigational new drug can be evaluated using endogenous biomarkers even during Phase I helping decision of
conducting clinical DDI study
Plasma and urine specimens are subjected to the pharmacokinetic analysis of metabolites
setting exclusion criteria of drugs to avoid DDI
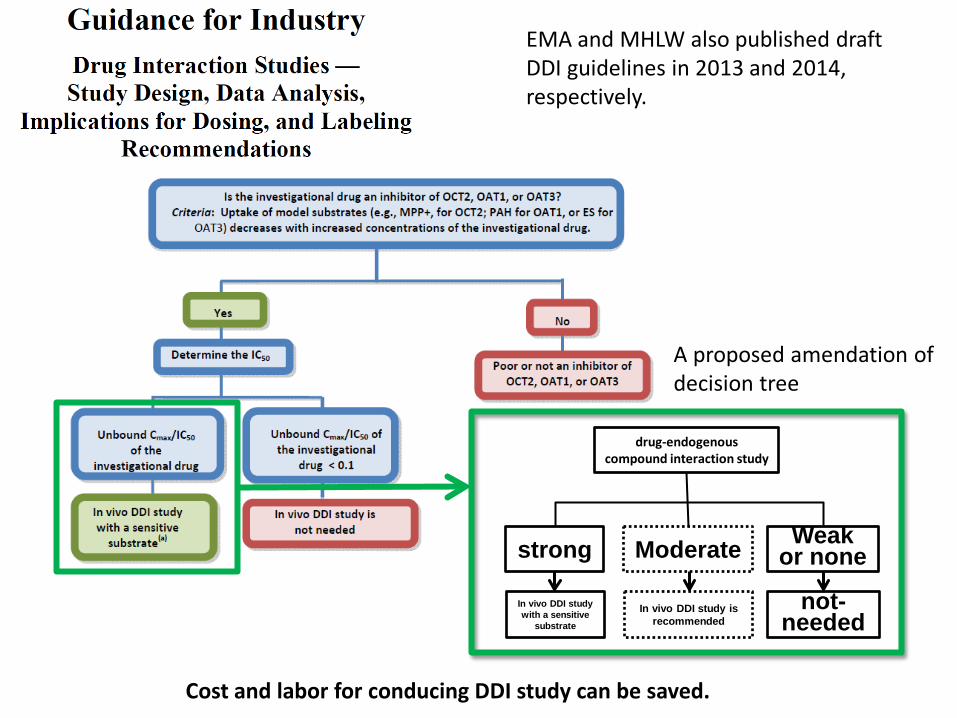
EMA and MHLW also published draft DDI guidelines in 2013 and 2014, respectively.
strong Moderate Weak or none
drug-endogenous compound interaction study
In vivo DDI study with a sensitive
substrate
In vivo DDI study is recommended
not-needed
A proposed amendation of decision tree
Cost and labor for conducing DDI study can be saved.
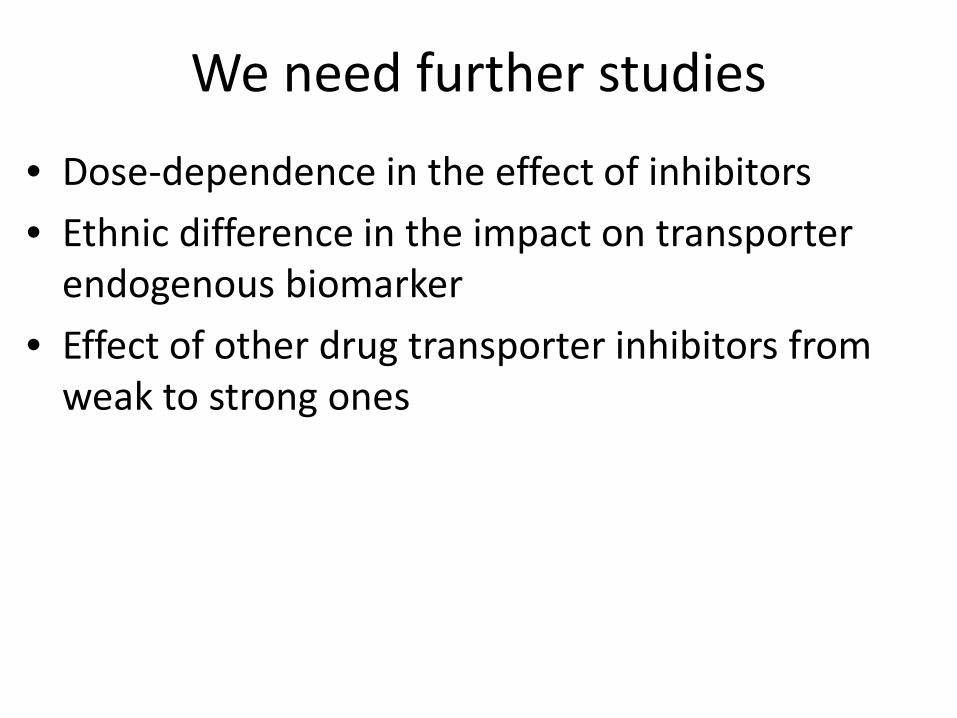
We need further studies
• Dose-dependence in the effect of inhibitors • Ethnic difference in the impact on transporter
endogenous biomarker • Effect of other drug transporter inhibitors from
weak to strong ones
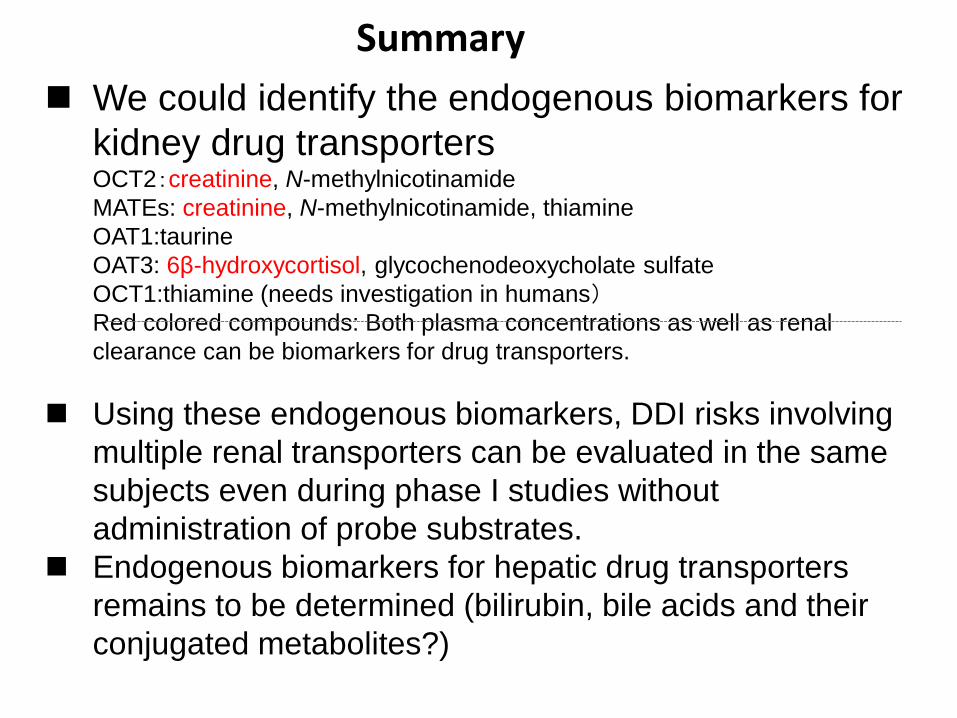
Summary We could identify the endogenous biomarkers for
kidney drug transporters OCT2:creatinine, N-methylnicotinamide MATEs: creatinine, N-methylnicotinamide, thiamine OAT1:taurine OAT3: 6β-hydroxycortisol, glycochenodeoxycholate sulfate OCT1:thiamine (needs investigation in humans) Red colored compounds: Both plasma concentrations as well as renal clearance can be biomarkers for drug transporters.
Using these endogenous biomarkers, DDI risks involving multiple renal transporters can be evaluated in the same subjects even during phase I studies without administration of probe substrates.
Endogenous biomarkers for hepatic drug transporters remains to be determined (bilirubin, bile acids and their conjugated metabolites?)
Acknowledgement: Dr. Yuichi Sugiyama (Professor emeritus, University of Tokyo, & Sugiyama laboratory,
RIKEN) •OCT2 and MATE study Sumito Ito, Yushun Kuroiwa, Chunyong Wu, Tomoko Kitoh (The University of Tokyo) Yuichiro Imamura, Takashi Izumi (Daiichi Sankyo, Tokyo, Japan) Yoshinori Moriyama, Ph.D. (PYR Okayama Univ) Katsuhisa Inoue, Ph.D., Hiroaki Yuasa, Ph.D. (MATE1-HEK, Nagoya City Univ.) Yuji Kumagai (Kitasato University East Hospital Tomoyoshi Shiroshita (Sekisui Medical Co.,Ltd.) •Probenecid study Yuri Tsuruya, Kazuya Maeda (The University of Tokyo) Yuji Kumagai (Kitasato University East Hospital •Rifampicin study Hanano Terashima, Takeshi Nakayama, Daiki Mori, Tadahaya Mizuno (University of Tokyo) Issei Takehara, Nobuaki Watanabe (Daiichi Sankyo) •Metabolome analysis Koji Kato (Taisho Pharmaceuticals)