ending homelessness in michigan - mcahmichigan continues to face the challenge of ending...
TRANSCRIPT
12018 Annual Report
Ending Homelessness in Michigan2018 Annual Report
Gretchen WhitmerGovernor of Michigan
Michigan continues to face the challenge of ending homelessness in our state. Together with our local partners, we are working to ensure homelessness is rare, brief and non-recurring. Initiatives to connect housing to health care, targeted responses to veteran homelessness, and a focus on youth experiencing homelessness have helped to generate new solutions and improve outcomes for some of the most vulnerable people in our state. Meanwhile, local communities tirelessly continue to respond to individuals and families accessing Michigan’s homeless response system -- but we must continue to do more.
As we work to put Michigan on the road to opportunity, now more than ever, we need to keep on implementing innovative approaches to ensure everyone in Michigan has a place to call home. Service providers across the state are leveraging best practices and forging new partnerships to create a coordinated system focused on the diverse needs of individuals and families faced with homelessness. The Michigan Homeless Policy Council is beginning the process of drafting a new action plan for 2020-2021, which will focus on strategies to improve the state’s homeless response system, enhance cross-system coordination and address some of the root causes of homelessness.
Ending homelessness in Michigan will take a collective effort. This report illustrates the latest data on homelessness and provides valuable insight about our neighbors who are searching for safe and stable housing. I encourage you to learn more about the efforts currently underway to address this issue and to find ways you can get involved.
Dear Friends and Colleagues,
32018 Annual Report
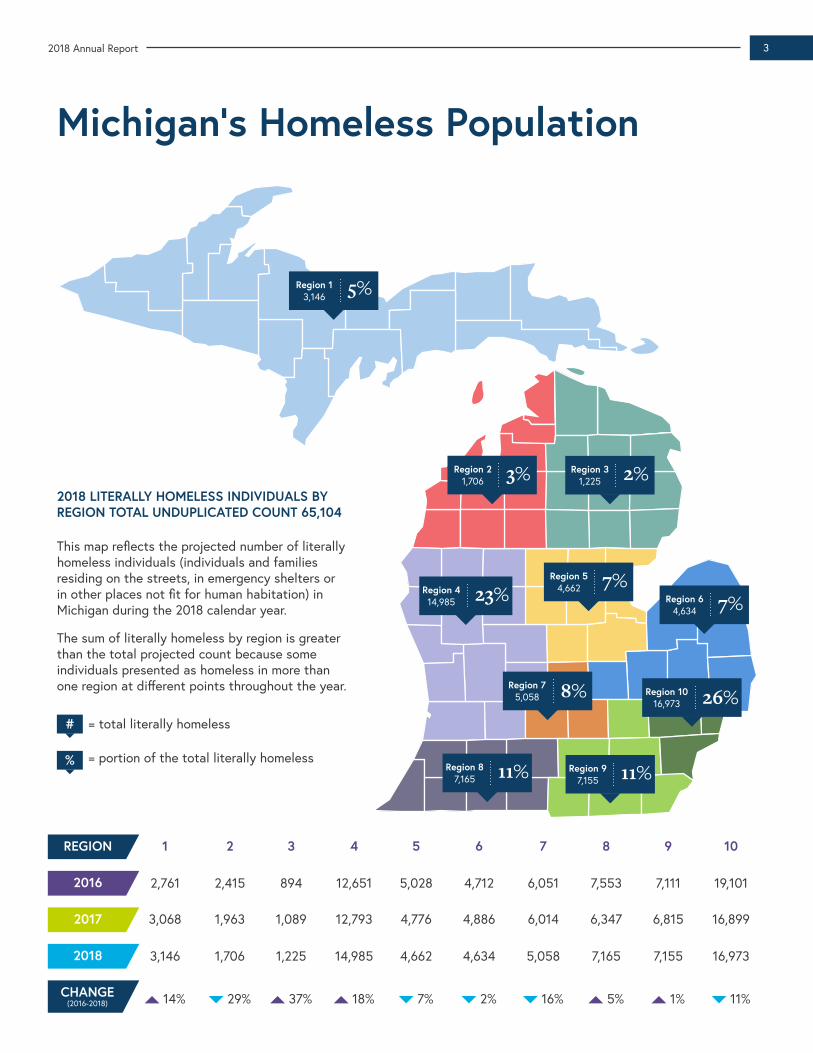
Michigan’s Homeless Population
2018 LITERALLY HOMELESS INDIVIDUALS BY REGION TOTAL UNDUPLICATED COUNT 65,104
This map reflects the projected number of literally homeless individuals (individuals and families residing on the streets, in emergency shelters or in other places not fit for human habitation) in Michigan during the 2018 calendar year.
The sum of literally homeless by region is greater than the total projected count because some individuals presented as homeless in more than one region at different points throughout the year.
894
1,225
6,051
5,058
4,712
4,634
19,101
16,973
1,089 6,0144,886 16,899
37% 16% 2% 11%
2,761
3,146
12,651
14,985
7,553
7,165
3,068 12,793 6,347
14% 18% 5%
2,415
1,706
5,028
4,662
7,111
7,155
1,963 4,776 6,815
29% 7% 1%
REGION
2016
2017
2018
CHANGE (2016-2018)
2 4 6 8 101 3 5 7 9
Region 21,706 3%
Region 414,985 23%
Region 54,662 7%
Region 64,634 7%
Region 75,058 8%
Region 87,165 11% Region 9
7,155 11%
Region 1016,973 26%
Region 31,225 2%
Region 13,146 5%
%
# = total literally homeless
= portion of the total literally homeless
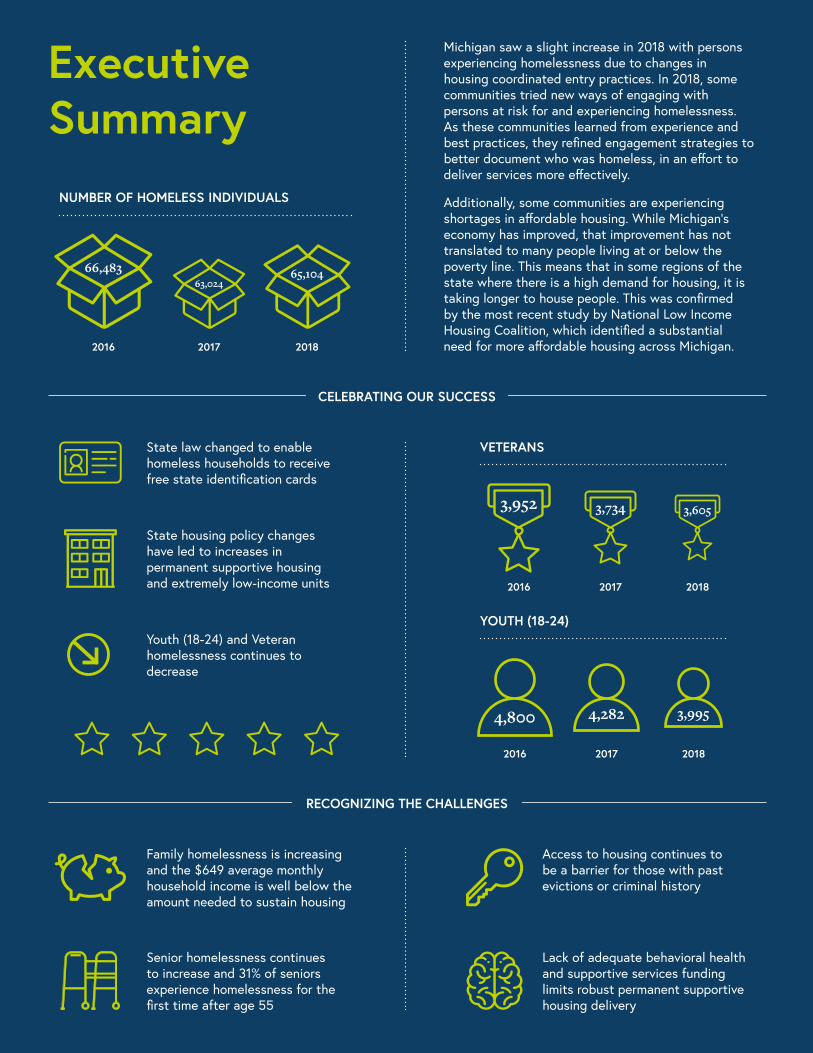
Executive Summary
Family homelessness is increasing and the $649 average monthly household income is well below the amount needed to sustain housing
Access to housing continues to be a barrier for those with past evictions or criminal history
Senior homelessness continues to increase and 31% of seniors experience homelessness for the first time after age 55
Lack of adequate behavioral health and supportive services funding limits robust permanent supportive housing delivery
State law changed to enable homeless households to receive free state identification cards
CELEBRATING OUR SUCCESS
VETERANS
NUMBER OF HOMELESS INDIVIDUALS
RECOGNIZING THE CHALLENGES
State housing policy changes have led to increases in permanent supportive housing and extremely low-income units
Youth (18-24) and Veteran homelessness continues to decrease
2016
2017
2017
2018
2018
3,6053,7343,952
3,9954,2824,800
2016
2016
YOUTH (18-24)
2018
65,104
2017
63,02466,483
Michigan saw a slight increase in 2018 with persons experiencing homelessness due to changes in housing coordinated entry practices. In 2018, some communities tried new ways of engaging with persons at risk for and experiencing homelessness. As these communities learned from experience and best practices, they refined engagement strategies to better document who was homeless, in an effort to deliver services more effectively.
Additionally, some communities are experiencing shortages in affordable housing. While Michigan’s economy has improved, that improvement has not translated to many people living at or below the poverty line. This means that in some regions of the state where there is a high demand for housing, it is taking longer to house people. This was confirmed by the most recent study by National Low Income Housing Coalition, which identified a substantial need for more affordable housing across Michigan.
52018 Annual Report
YOUTH HOMELESSNESS DEMONSTRATION PROJECT (YHDP)
The Greater Grand Traverse Area Continuum of Care (Antrim, Benzie, Grand Traverse, Kalkaska and Leelanau Counties) was awarded a major grant by the U.S. Department of Housing and Urban Development late in 2017.
Implementation for YHDP projects, who have seen success within the first quarter, kicked off on October 1, 2018 for: Coordinated Entry System for Youth/Young Adults, Youth/Young Adult Diversion, Youth/Young Adult Street Outreach, Rapid Rehousing for Youth/Young Adults, and Rapid Rehousing for Pregnant and Parenting Youth/Young Adults.
When the collaborative started thinking about true systems change, we were faced with many “what if” questions that we still reflect back on today like: “What if we were fully leveraging all community assets to ensure all young people are fully connected to the system and services to end their homelessness?”, “What if all providers and agencies involved in this work acted as one agency working to end youth homelessness?”, and “What if we are conscious of our adult biases and really listen to young people?” These questions are key leverage points that helped our communities move forward to make true systems change. The systems change our community has seen in the past year has been incredible and required multiple agencies leadership to work as one and examine how historical practices and policies might have been contributing to the problem. System change in our communities did not happen without trust, transparency and vulnerability. “The change I have seen, not only in our system, but within our leadership team working as one entity, has been incredible. We no longer blame each other for the system not working, but rather we ask young people with lived experience how we can improve.” –Ashley Halladay-Schmandt, Chair of the Northwest Michigan Coalition to End Homelessness.
The Youth Action Board (YAB) continues to be a critical part of the work to end youth homelessness throughout the Northwest Michigan Coalition to End Homelessness. The YAB is working to develop strategies around outreach and community awareness, in addition to providing real time feedback and development ideas with each HUD-funded project. YAB members hope that the community comes to realize that homelessness is not a choice young people make.
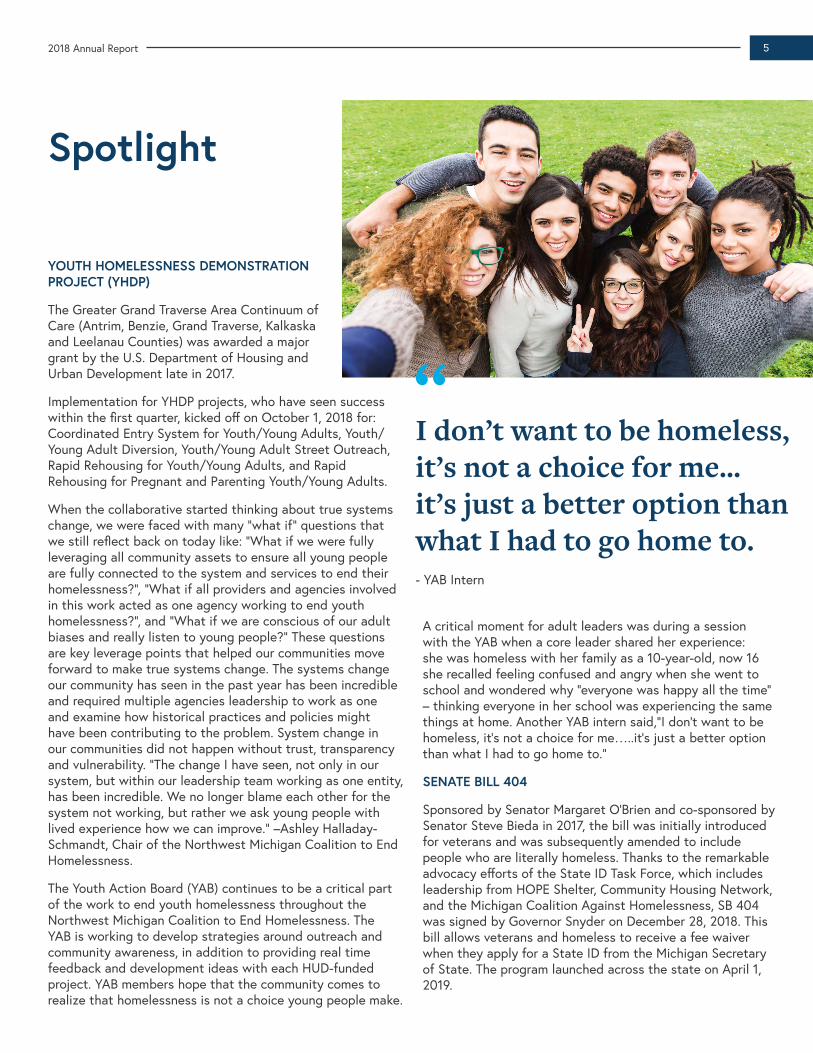
A critical moment for adult leaders was during a session with the YAB when a core leader shared her experience: she was homeless with her family as a 10-year-old, now 16 she recalled feeling confused and angry when she went to school and wondered why “everyone was happy all the time” – thinking everyone in her school was experiencing the same things at home. Another YAB intern said,“I don’t want to be homeless, it’s not a choice for me…..it’s just a better option than what I had to go home to.”
SENATE BILL 404
Sponsored by Senator Margaret O’Brien and co-sponsored by Senator Steve Bieda in 2017, the bill was initially introduced for veterans and was subsequently amended to include people who are literally homeless. Thanks to the remarkable advocacy efforts of the State ID Task Force, which includes leadership from HOPE Shelter, Community Housing Network, and the Michigan Coalition Against Homelessness, SB 404 was signed by Governor Snyder on December 28, 2018. This bill allows veterans and homeless to receive a fee waiver when they apply for a State ID from the Michigan Secretary of State. The program launched across the state on April 1, 2019.
Spotlight
I don’t want to be homeless, it’s not a choice for me…it’s just a better option than what I had to go home to.- YAB Intern
“
6 2018 Annual Report
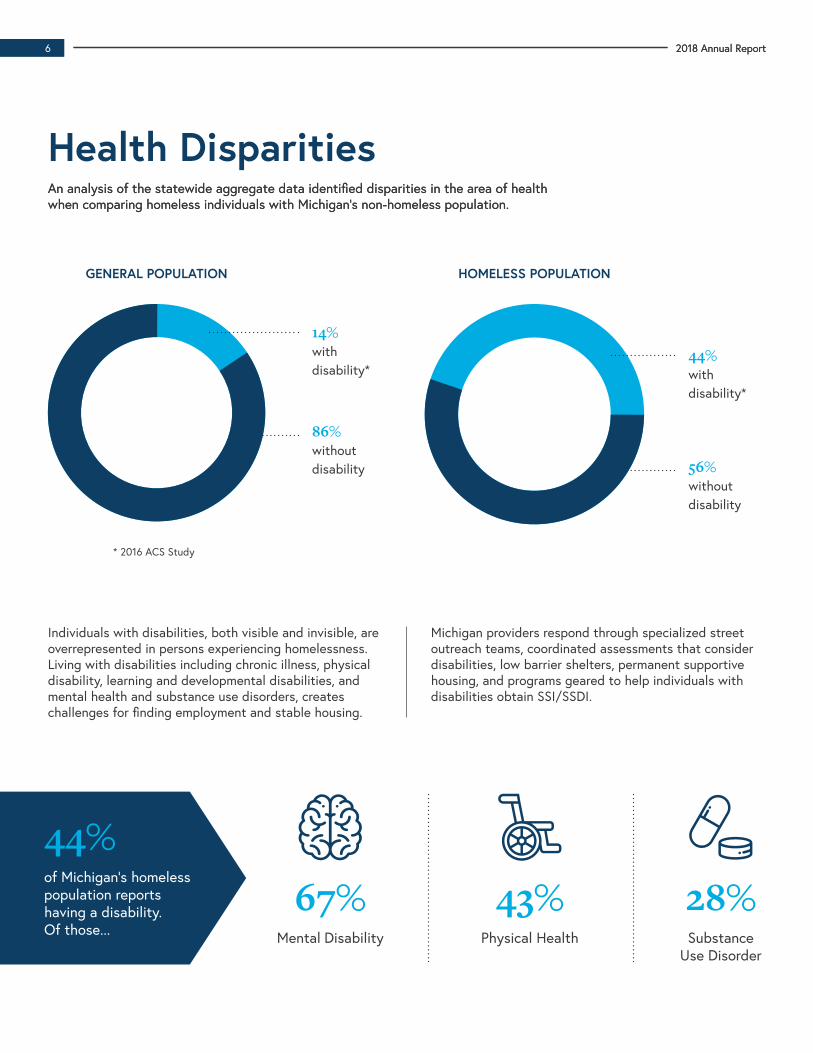
Health DisparitiesAn analysis of the statewide aggregate data identified disparities in the area of health when comparing homeless individuals with Michigan’s non-homeless population.An analysis of the statewide aggregate data identified disparities in the area of health when comparing homeless individuals with Michigan’s non-homeless population.
Individuals with disabilities, both visible and invisible, are overrepresented in persons experiencing homelessness. Living with disabilities including chronic illness, physical disability, learning and developmental disabilities, and mental health and substance use disorders, creates challenges for finding employment and stable housing.
Michigan providers respond through specialized street outreach teams, coordinated assessments that consider disabilities, low barrier shelters, permanent supportive housing, and programs geared to help individuals with disabilities obtain SSI/SSDI.
GENERAL POPULATION
14%with disability*
* 2016 ACS Study
86%without disability
HOMELESS POPULATION
44%with disability*
56%without disability
Substance Use Disorder
Physical HealthMental Disability
28%43%of Michigan’s homeless population reports having a disability. Of those...
44%67%
2018 Annual Report6
72018 Annual Report
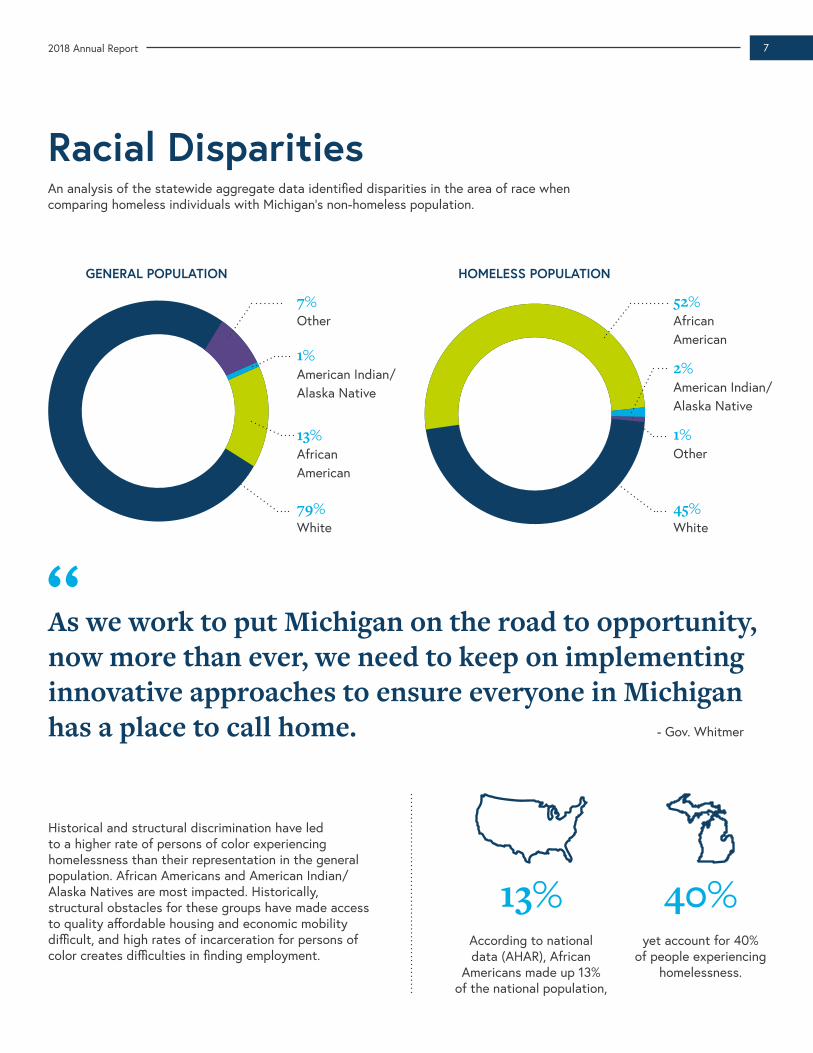
Historical and structural discrimination have led to a higher rate of persons of color experiencing homelessness than their representation in the general population. African Americans and American Indian/Alaska Natives are most impacted. Historically, structural obstacles for these groups have made access to quality affordable housing and economic mobility difficult, and high rates of incarceration for persons of color creates difficulties in finding employment.
Racial DisparitiesAn analysis of the statewide aggregate data identified disparities in the area of race when comparing homeless individuals with Michigan’s non-homeless population.
GENERAL POPULATION HOMELESS POPULATION
45%White
2%American Indian/Alaska Native
52%African American
1%Other
79%White
1%American Indian/Alaska Native
7%Other
13%African American
As we work to put Michigan on the road to opportunity, now more than ever, we need to keep on implementing innovative approaches to ensure everyone in Michigan has a place to call home.
“- Gov. Whitmer
According to national data (AHAR), African
Americans made up 13% of the national population,
yet account for 40% of people experiencing
homelessness.
13% 40%

Homeless Count by Subpopulations
Seniors (55+)
Youth (18-24)
Children in Families
Adults in Families
Unaccompanied Minors
(under 18)
Singles (25+)
Veterans
IN T
HO
USA
ND
S
Chronic0
5
10
15
20
25
30
35
Seniors (55+)YEAR Youth
(18-24)Children
in FamiliesAdults in Families
Unaccompanied Minors
(under 18)
Singles (25+)Veterans Chronic
2016
2017
2018
7,919
7,937
8,367
660
698
711
4,800
4,282
3,995
3,952
3,734
3,605
6,250
5,323
6,235
13,812
15,138
16,391
10,954
11,501
12,568
30,180
27,762
27,907
8 2018 Annual Report2018 Annual Report8
92018 Annual Report
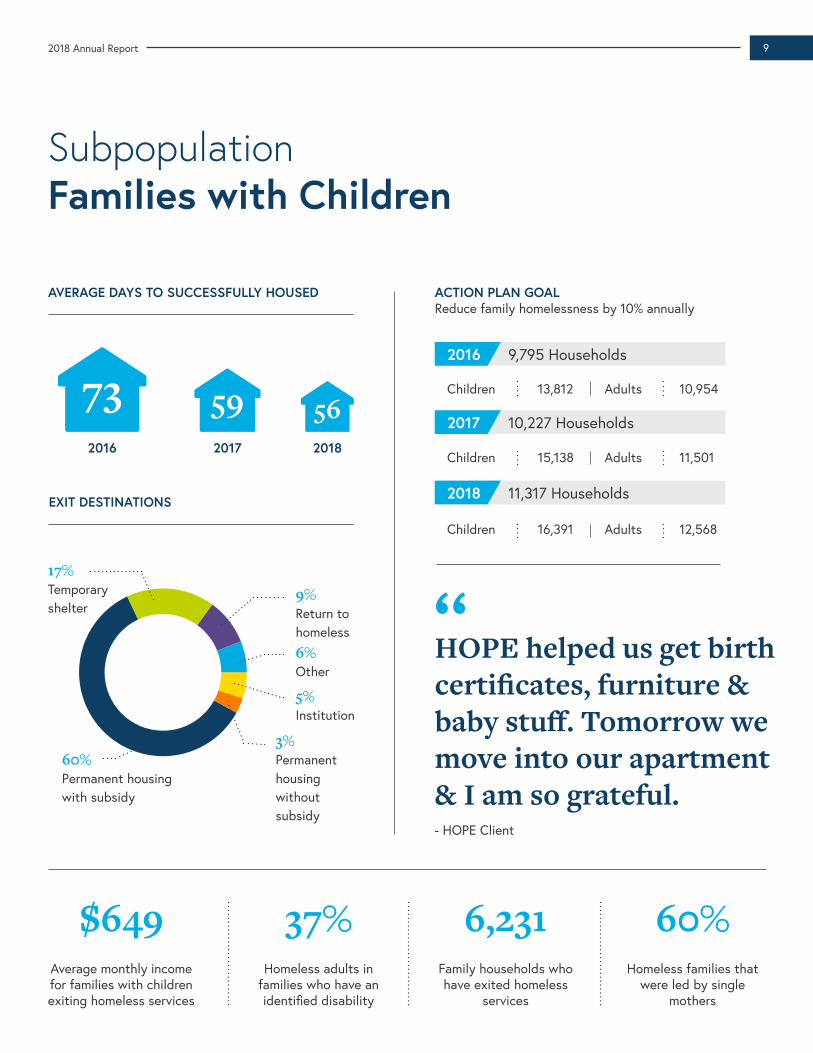
Subpopulation Families with Children
AVERAGE DAYS TO SUCCESSFULLY HOUSED
EXIT DESTINATIONS
ACTION PLAN GOAL Reduce family homelessness by 10% annually
2016
2016
Children 13,812 Adults 10,954
Adults 11,501
Adults 12,568
- HOPE Client
Children 15,138
Children 16,391
9,795 Households
10,227 Households
11,317 Households
732017
201759
2018
2018
56
Family households who have exited homeless
services
Homeless adults in families who have an identified disability
Average monthly income for families with children exiting homeless services
Homeless families that were led by single
mothers
6,23137%$649 60%
HOPE helped us get birth certificates, furniture & baby stuff. Tomorrow we move into our apartment & I am so grateful.
“17%Temporary shelter
9%Return to homeless
6%Other
5%Institution
3%Permanent housing without subsidy
60%Permanent housing with subsidy
10 2018 Annual Report
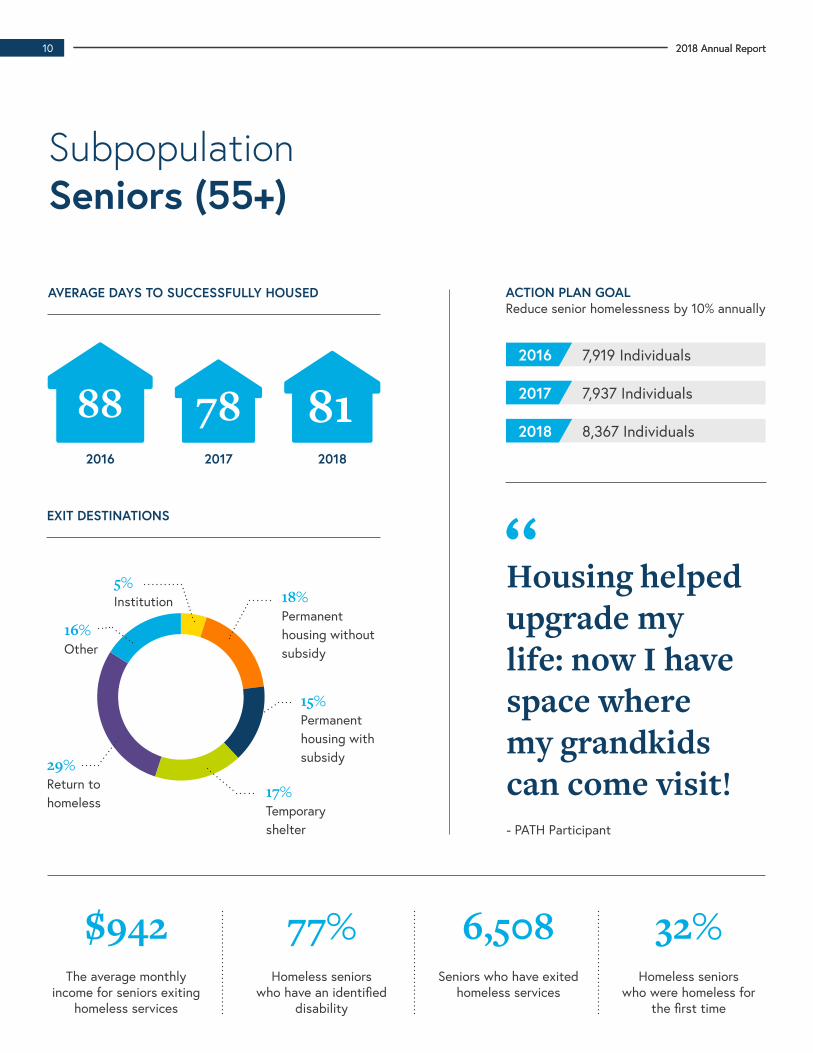
Subpopulation Seniors (55+)
Seniors who have exited homeless services
Homeless seniors who have an identified
disability
The average monthly income for seniors exiting
homeless services
Homeless seniors who were homeless for
the first time
6,50877%$942 32%
ACTION PLAN GOAL Reduce senior homelessness by 10% annually
2016 7,919 Individuals
7,937 Individuals
8,367 Individuals
2017
2018
AVERAGE DAYS TO SUCCESSFULLY HOUSED
EXIT DESTINATIONS
5%Institution
29%Return to homeless
17%Temporary shelter
16%Other
18%Permanent housing without subsidy
15%Permanent housing with subsidy
2016
882017
782018
81
Housing helped upgrade my life: now I have space where my grandkids can come visit!
“
2018 Annual Report
- PATH Participant
11
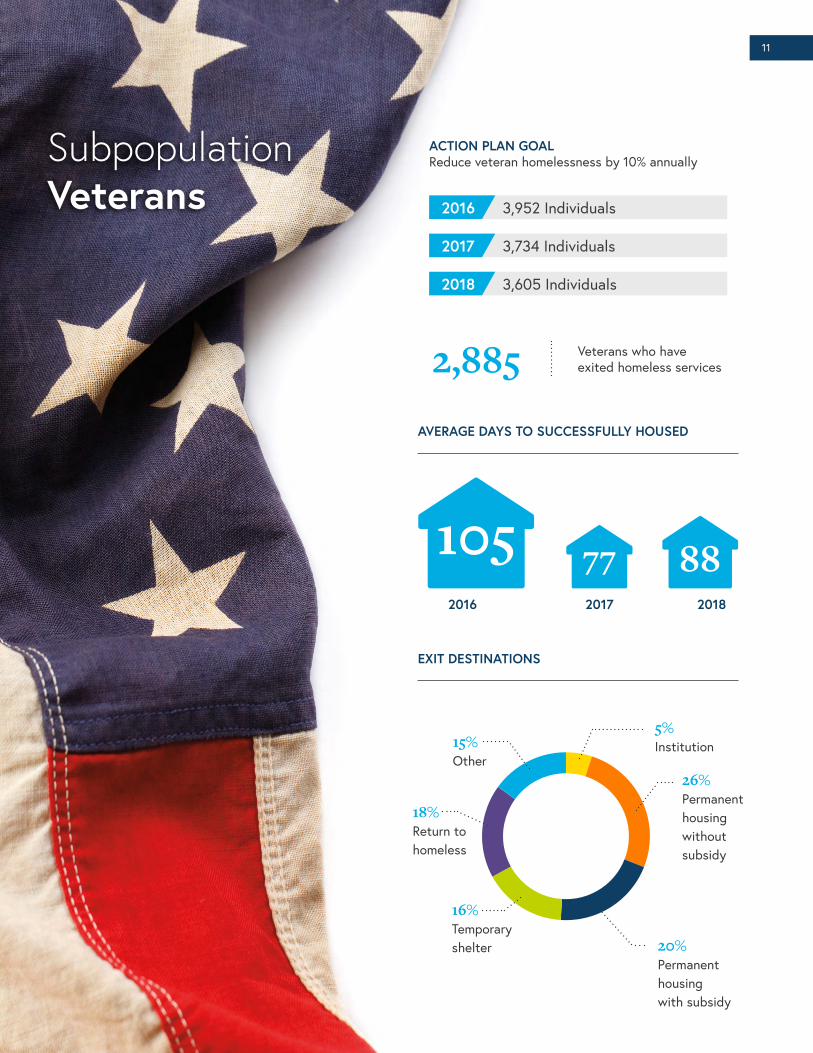
Subpopulation Veterans 2016 3,952 Individuals
3,734 Individuals
3,605 Individuals
2017
2018
AVERAGE DAYS TO SUCCESSFULLY HOUSED
EXIT DESTINATIONS
ACTION PLAN GOAL Reduce veteran homelessness by 10% annually
2016
1052017
772018
88
5%Institution
18%Return to homeless
15%Other
16%Temporary shelter
26%Permanent housing without subsidy
20%Permanent housing with subsidy
Veterans who have exited homeless services2,885
11
12
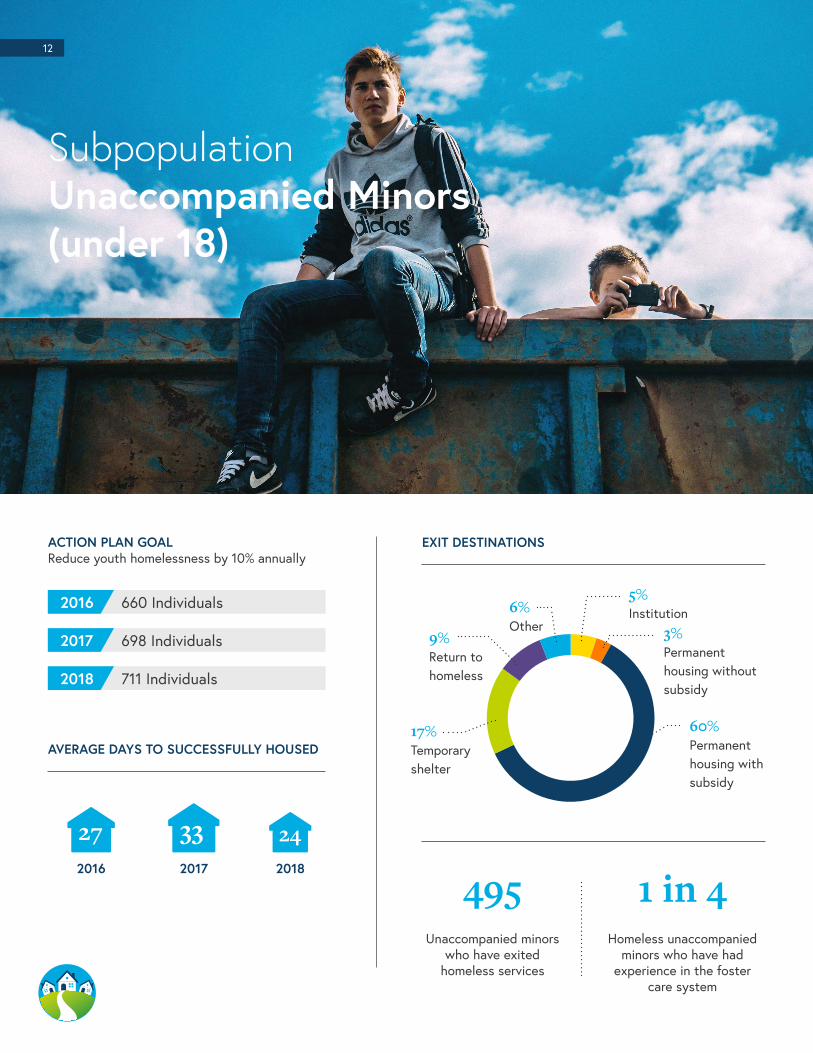
Subpopulation Unaccompanied Minors (under 18)
5%Institution
9%Return to homeless
17%Temporary shelter
6%Other 3%
Permanent housing without subsidy
60%Permanent housing with subsidy
EXIT DESTINATIONS
Unaccompanied minors who have exited
homeless services
Homeless unaccompanied minors who have had
experience in the foster care system
495 1 in 4
ACTION PLAN GOAL Reduce youth homelessness by 10% annually
2016 660 Individuals
698 Individuals
711 Individuals
2017
2018
AVERAGE DAYS TO SUCCESSFULLY HOUSED
201820172016
243327
132018 Annual Report
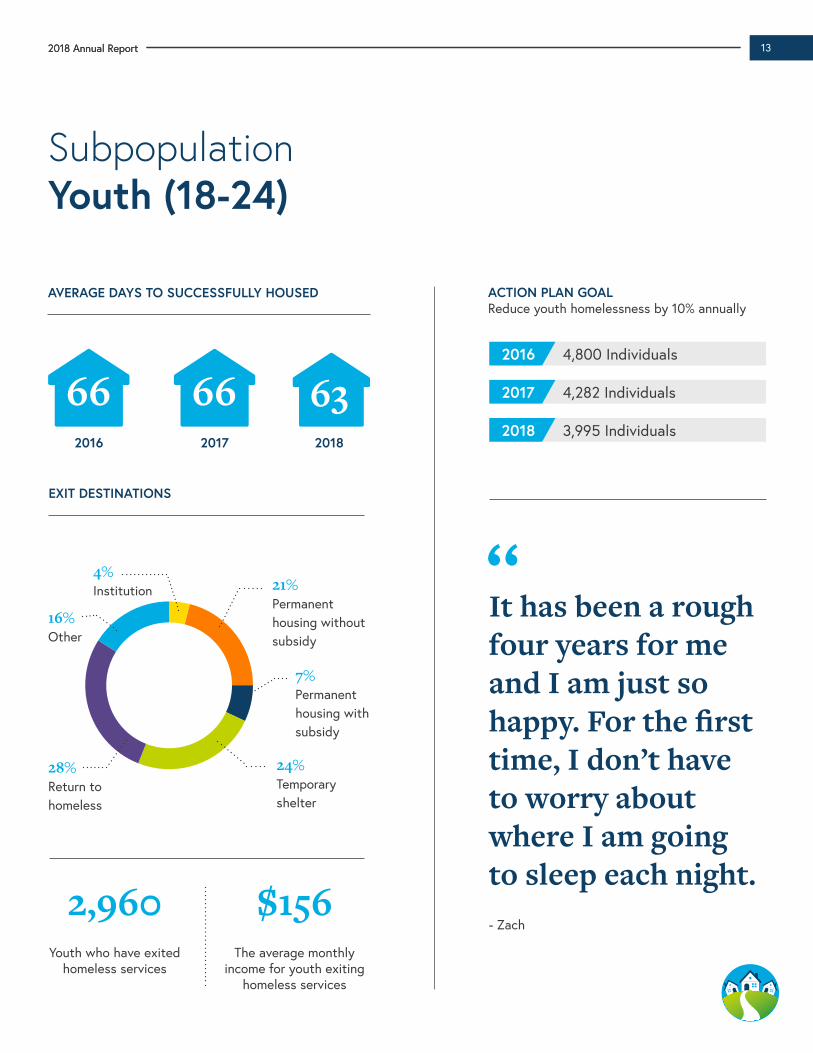
Subpopulation Youth (18-24)
Youth who have exited homeless services
The average monthly income for youth exiting
homeless services
2,960 $156
ACTION PLAN GOAL Reduce youth homelessness by 10% annually
2016 4,800 Individuals
4,282 Individuals
3,995 Individuals
2017
2018
AVERAGE DAYS TO SUCCESSFULLY HOUSED
EXIT DESTINATIONS
13
4%Institution
28%Return to homeless
24%Temporary shelter
16%Other
21%Permanent housing without subsidy
7%Permanent housing with subsidy
“It has been a rough four years for me and I am just so happy. For the first time, I don’t have to worry about where I am going to sleep each night.
2016 2017 2018
66 66 63
2018 Annual Report
- Zach
14 2018 Annual Report
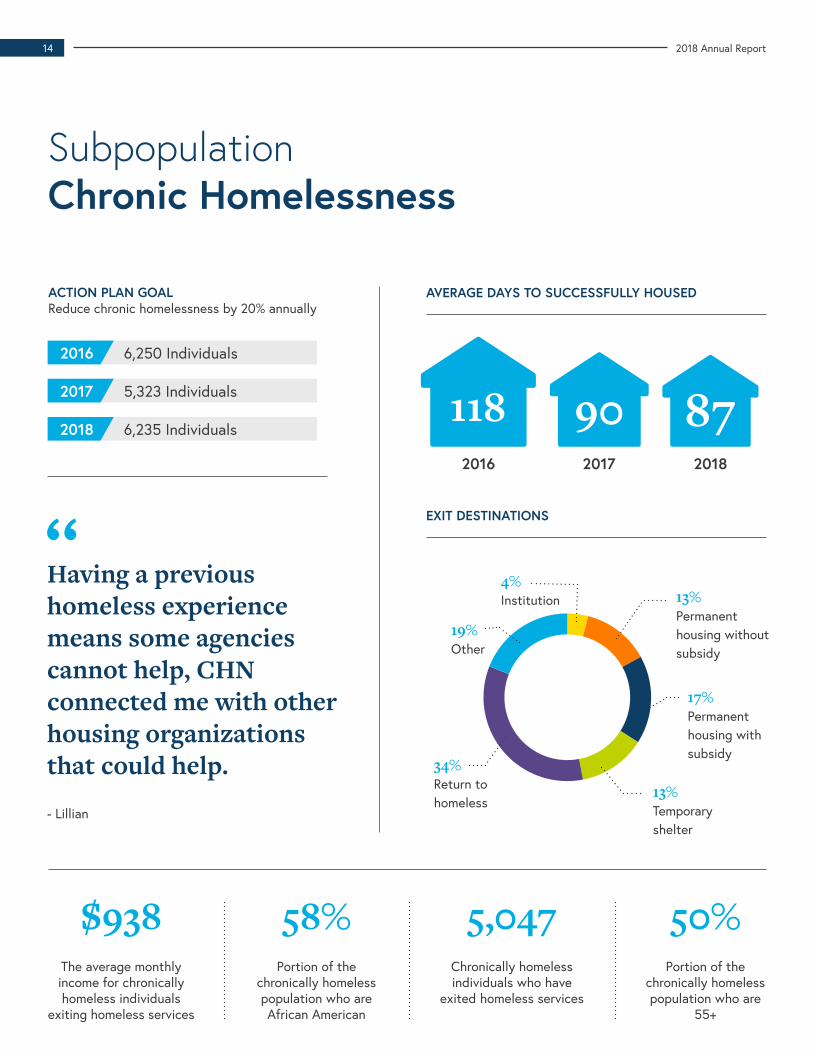
Subpopulation Chronic Homelessness
Chronically homeless individuals who have
exited homeless services
Portion of the chronically homeless population who are African American
The average monthly income for chronically homeless individuals
exiting homeless services
Portion of the chronically homeless population who are
55+
5,04758%$938 50%
ACTION PLAN GOAL Reduce chronic homelessness by 20% annually
2016 6,250 Individuals
5,323 Individuals
6,235 Individuals
2017
2018
AVERAGE DAYS TO SUCCESSFULLY HOUSED
EXIT DESTINATIONS
4%Institution
34%Return to homeless
13%Temporary shelter
19%Other
13%Permanent housing without subsidy
17%Permanent housing with subsidy
2016
1182017
902018
87
Having a previous homeless experience means some agencies cannot help, CHN connected me with other housing organizations that could help.
“
- Lillian
152018 Annual Report
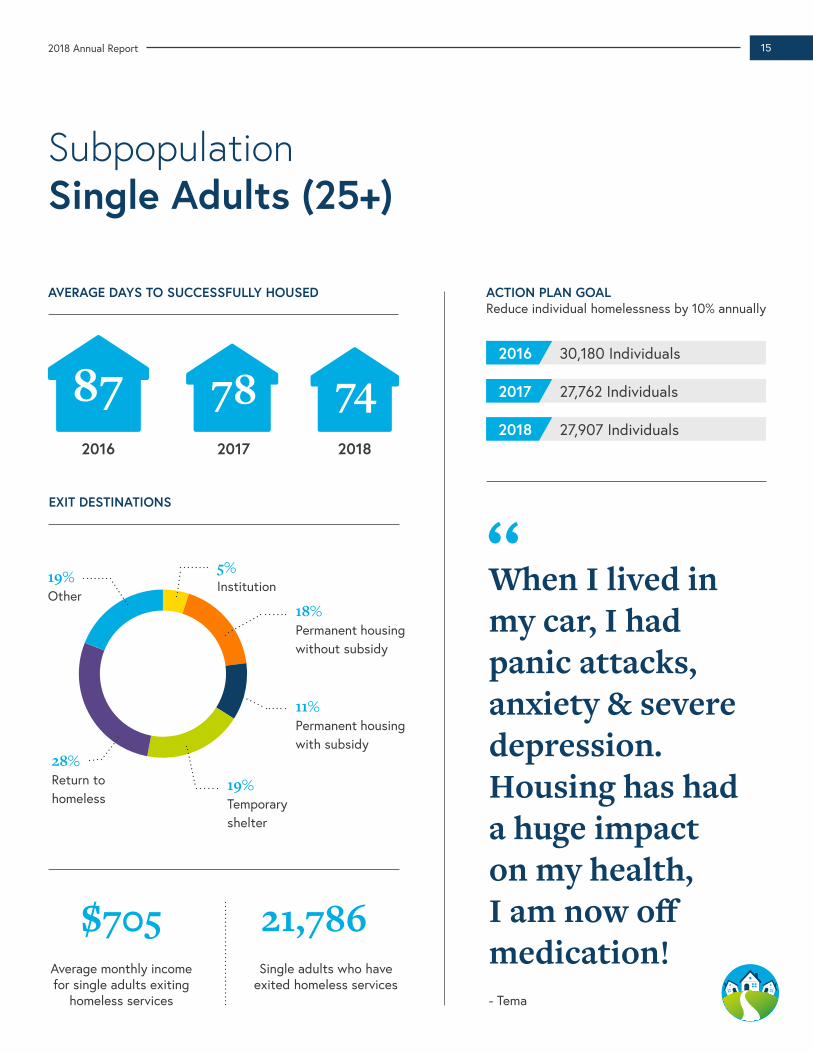
Subpopulation Single Adults (25+)
AVERAGE DAYS TO SUCCESSFULLY HOUSED
EXIT DESTINATIONS
ACTION PLAN GOAL Reduce individual homelessness by 10% annually
201820172016
747887
Single adults who have exited homeless services
Average monthly income for single adults exiting
homeless services
21,786$705
When I lived in my car, I had panic attacks, anxiety & severe depression. Housing has had a huge impact on my health, I am now off medication!
“19%Other
5%Institution
18%Permanent housing without subsidy
11%Permanent housing with subsidy
19%Temporary shelter
28%Return to homeless
2016 30,180 Individuals
27,762 Individuals
27,907 Individuals
2017
2018
- Tema
HOUSING CHANGE20182016HOUSING CHANGE2017 2018
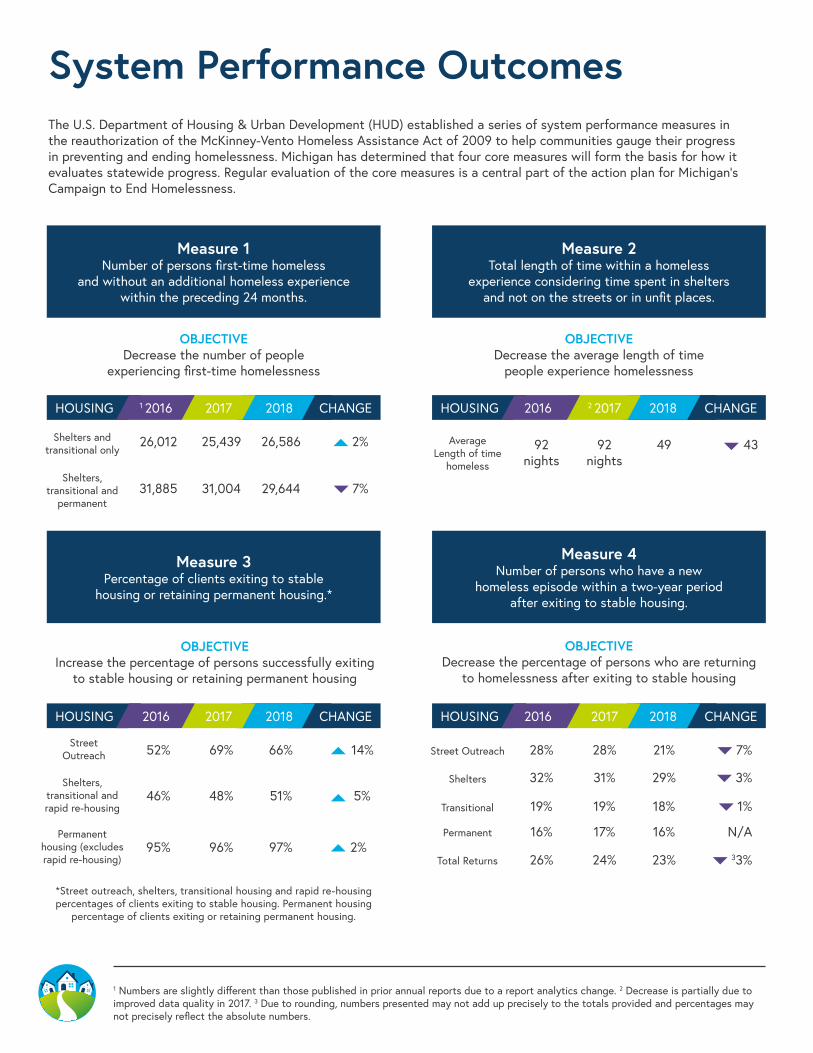
The U.S. Department of Housing & Urban Development (HUD) established a series of system performance measures in the reauthorization of the McKinney-Vento Homeless Assistance Act of 2009 to help communities gauge their progress in preventing and ending homelessness. Michigan has determined that four core measures will form the basis for how it evaluates statewide progress. Regular evaluation of the core measures is a central part of the action plan for Michigan’s Campaign to End Homelessness.
1 Numbers are slightly different than those published in prior annual reports due to a report analytics change. 2 Decrease is partially due to improved data quality in 2017. 3 Due to rounding, numbers presented may not add up precisely to the totals provided and percentages may not precisely reflect the absolute numbers.
OBJECTIVE Decrease the number of people
experiencing first-time homelessness
OBJECTIVE Increase the percentage of persons successfully exiting
to stable housing or retaining permanent housing
OBJECTIVE Decrease the average length of time
people experience homelessness
OBJECTIVE Decrease the percentage of persons who are returning
to homelessness after exiting to stable housing
2%
14% 7%
1%
43
7%
5% 3%
2% 33%
N/A
26,012
52% 28%
92 nights
92 nights
25,439 26,586
69% 66% 28% 21%
49
31,885
46%32%
16%95%
19%
26%
31,004 29,644
48% 51%31% 29%
17% 16%96% 97%
19% 18%
24% 23%
Measure 1 Number of persons first-time homeless
and without an additional homeless experience within the preceding 24 months.
Measure 3 Percentage of clients exiting to stable
housing or retaining permanent housing.*
Measure 2 Total length of time within a homeless
experience considering time spent in shelters and not on the streets or in unfit places.
Measure 4 Number of persons who have a new
homeless episode within a two-year period after exiting to stable housing.
HOUSING CHANGE2017 20182016HOUSING CHANGE2017 20182016
Shelters and transitional only
Street Outreach Street Outreach
Average Length of time
homelessShelters,
transitional and permanent
Shelters, transitional and rapid re-housing
Shelters
Transitional
Permanent housing (excludes rapid re-housing)
Permanent
Total Returns
System Performance Outcomes
*Street outreach, shelters, transitional housing and rapid re-housing percentages of clients exiting to stable housing. Permanent housing
percentage of clients exiting or retaining permanent housing.
2 20171 2016
172018 Annual Report
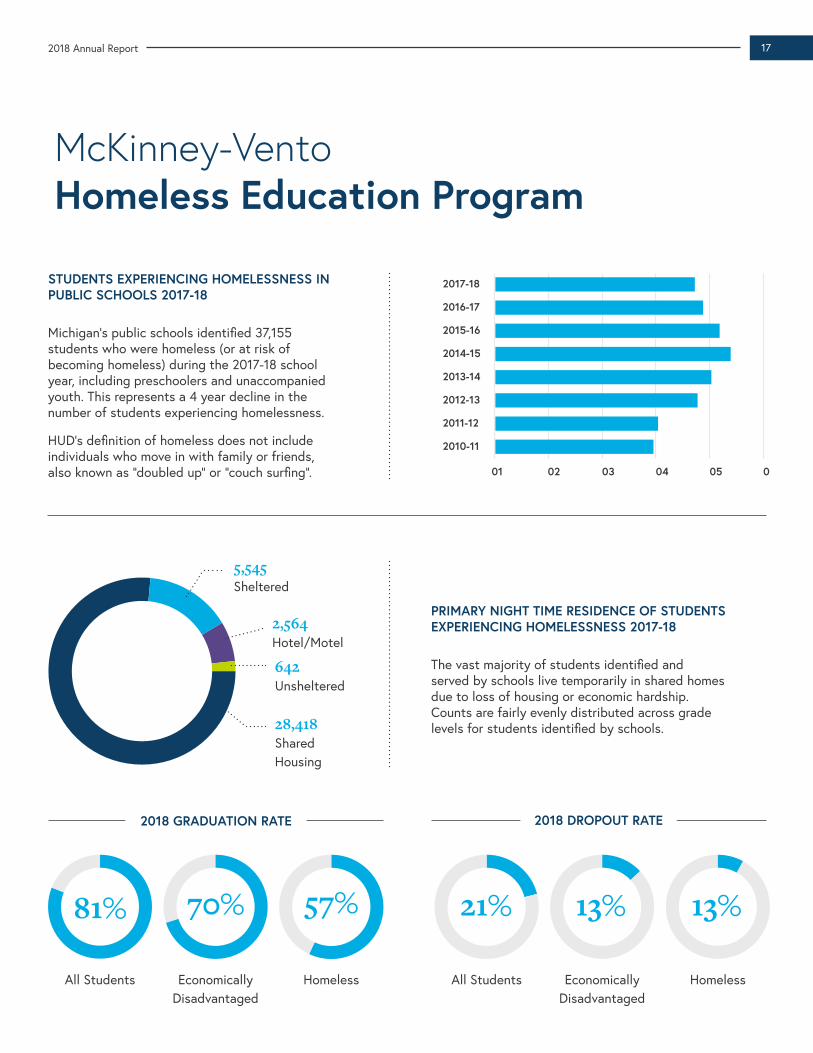
Michigan’s public schools identified 37,155 students who were homeless (or at risk of becoming homeless) during the 2017-18 school year, including preschoolers and unaccompanied youth. This represents a 4 year decline in the number of students experiencing homelessness.
HUD’s definition of homeless does not include individuals who move in with family or friends, also known as “doubled up” or “couch surfing”.
The vast majority of students identified and served by schools live temporarily in shared homes due to loss of housing or economic hardship. Counts are fairly evenly distributed across grade levels for students identified by schools.
All Students All StudentsEconomically Disadvantaged
Economically Disadvantaged
Homeless Homeless
McKinney-Vento Homeless Education Program
STUDENTS EXPERIENCING HOMELESSNESS IN PUBLIC SCHOOLS 2017-18
PRIMARY NIGHT TIME RESIDENCE OF STUDENTS EXPERIENCING HOMELESSNESS 2017-18
01 02 03 04 05 0
2010-11
2011-12
2012-13
2013-14
2014-15
2015-16
2016-17
2017-18
28,418Shared Housing
2,564Hotel/Motel
5,545Sheltered
642Unsheltered
81% 21% 13% 13%70% 57%
2018 GRADUATION RATE 2018 DROPOUT RATE
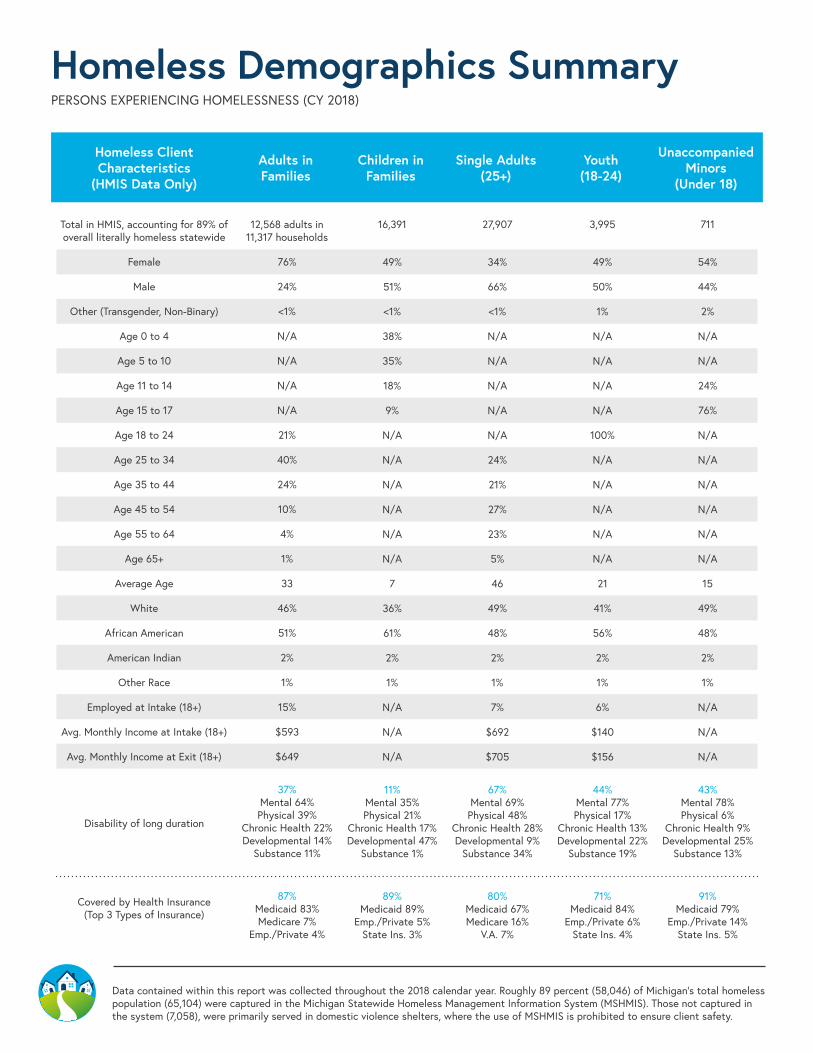
Homeless Demographics SummaryPERSONS EXPERIENCING HOMELESSNESS (CY 2018)
12,568 adults in 11,317 households
76%
24%
<1%
N/A
N/A
N/A
N/A
21%
40%
24%
10%
4%
1%
33
46%
51%
2%
1%
15%
$593
$649
37% Mental 64% Physical 39%
Chronic Health 22% Developmental 14%
Substance 11%
87% Medicaid 83% Medicare 7%
Emp./Private 4%
16,391
49%
51%
<1%
38%
35%
18%
9%
N/A
N/A
N/A
N/A
N/A
N/A
7
36%
61%
2%
1%
N/A
N/A
N/A
11% Mental 35% Physical 21%
Chronic Health 17% Developmental 47%
Substance 1%
89% Medicaid 89%
Emp./Private 5% State Ins. 3%
27,907
34%
66%
<1%
N/A
N/A
N/A
N/A
N/A
24%
21%
27%
23%
5%
46
49%
48%
2%
1%
7%
$692
$705
67% Mental 69% Physical 48%
Chronic Health 28% Developmental 9%
Substance 34%
80% Medicaid 67% Medicare 16%
V.A. 7%
3,995
49%
50%
1%
N/A
N/A
N/A
N/A
100%
N/A
N/A
N/A
N/A
N/A
21
41%
56%
2%
1%
6%
$140
$156
44% Mental 77% Physical 17%
Chronic Health 13% Developmental 22%
Substance 19%
71% Medicaid 84%
Emp./Private 6% State Ins. 4%
711
54%
44%
2%
N/A
N/A
24%
76%
N/A
N/A
N/A
N/A
N/A
N/A
15
49%
48%
2%
1%
N/A
N/A
N/A
43% Mental 78% Physical 6%
Chronic Health 9% Developmental 25%
Substance 13%
91% Medicaid 79%
Emp./Private 14% State Ins. 5%
Children in Families
Single Adults (25+)
Unaccompanied Minors
(Under 18)
Youth (18-24)
Homeless Client Characteristics
(HMIS Data Only)
Adults in Families
Total in HMIS, accounting for 89% of overall literally homeless statewide
Female
Male
Other (Transgender, Non-Binary)
Age 0 to 4
Age 5 to 10
Age 11 to 14
Age 15 to 17
Age 18 to 24
Age 25 to 34
Age 35 to 44
Age 45 to 54
Age 55 to 64
Age 65+
Average Age
White
African American
American Indian
Other Race
Employed at Intake (18+)
Avg. Monthly Income at Intake (18+)
Avg. Monthly Income at Exit (18+)
Disability of long duration
Covered by Health Insurance (Top 3 Types of Insurance)
Data contained within this report was collected throughout the 2018 calendar year. Roughly 89 percent (58,046) of Michigan’s total homeless population (65,104) were captured in the Michigan Statewide Homeless Management Information System (MSHMIS). Those not captured in the system (7,058), were primarily served in domestic violence shelters, where the use of MSHMIS is prohibited to ensure client safety.
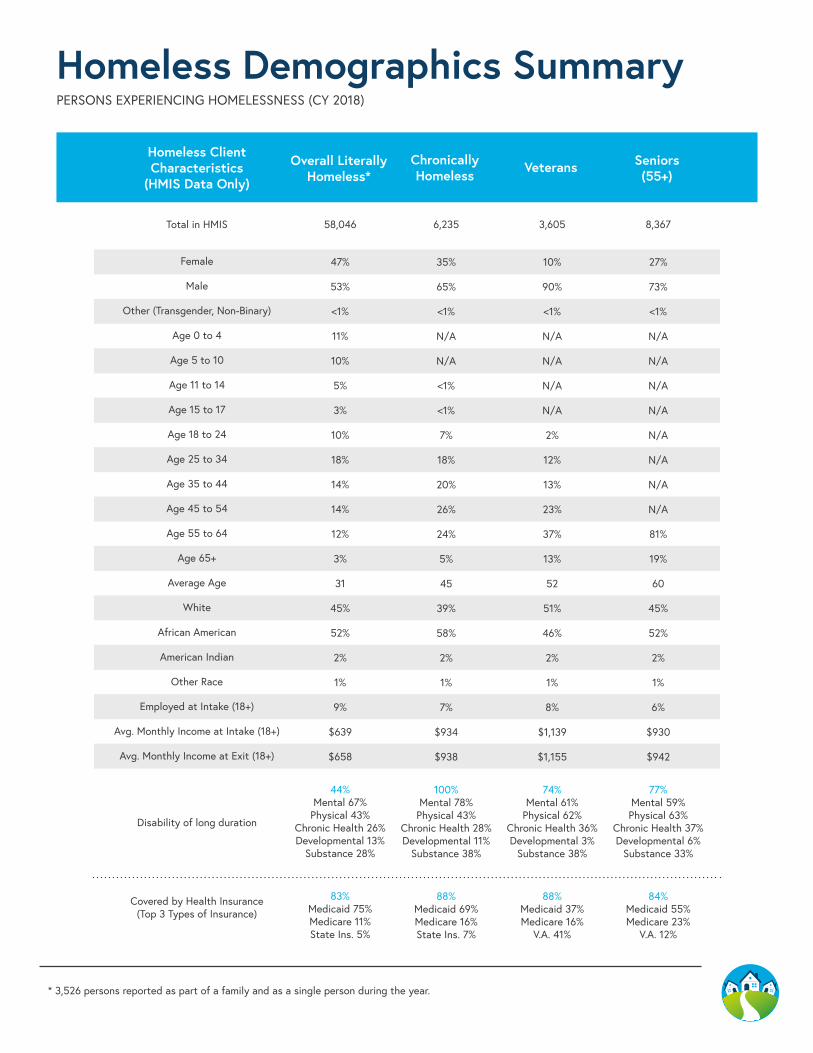
Homeless Demographics SummaryPERSONS EXPERIENCING HOMELESSNESS (CY 2018)
58,046
47%
53%
<1%
11%
10%
5%
3%
10%
18%
14%
14%
12%
3%
31
45%
52%
2%
1%
9%
$639
$658
44% Mental 67%
Physical 43% Chronic Health 26% Developmental 13%
Substance 28%
83% Medicaid 75% Medicare 11% State Ins. 5%
6,235
35%
65%
<1%
N/A
N/A
<1%
<1%
7%
18%
20%
26%
24%
5%
45
39%
58%
2%
1%
7%
$934
$938
100% Mental 78%
Physical 43% Chronic Health 28% Developmental 11%
Substance 38%
88% Medicaid 69% Medicare 16% State Ins. 7%
3,605
10%
90%
<1%
N/A
N/A
N/A
N/A
2%
12%
13%
23%
37%
13%
52
51%
46%
2%
1%
8%
$1,139
$1,155
74% Mental 61%
Physical 62% Chronic Health 36% Developmental 3%
Substance 38%
88% Medicaid 37% Medicare 16%
V.A. 41%
8,367
27%
73%
<1%
N/A
N/A
N/A
N/A
N/A
N/A
N/A
N/A
81%
19%
60
45%
52%
2%
1%
6%
$930
$942
77% Mental 59% Physical 63%
Chronic Health 37% Developmental 6%
Substance 33%
84% Medicaid 55% Medicare 23%
V.A. 12%
Chronically Homeless Veterans Seniors
(55+)
Homeless Client Characteristics
(HMIS Data Only)
Overall Literally Homeless*
Total in HMIS
Female
Male
Other (Transgender, Non-Binary)
Age 0 to 4
Age 5 to 10
Age 11 to 14
Age 15 to 17
Age 18 to 24
Age 25 to 34
Age 35 to 44
Age 45 to 54
Age 55 to 64
Age 65+
Average Age
White
African American
American Indian
Other Race
Employed at Intake (18+)
Avg. Monthly Income at Intake (18+)
Avg. Monthly Income at Exit (18+)
Disability of long duration
Covered by Health Insurance (Top 3 Types of Insurance)
* 3,526 persons reported as part of a family and as a single person during the year.
20 2018 Annual Report
Data is gathered from the Michigan Statewide Homeless Management Information System, except for the Michigan Department of Education data (page 17) which was gathered from the Michigan Student Date System by MDE’s Center for Education Performance and Information (CEPI)
CSH www.CSH.org
MICHIGAN ASSOCIATION OF UNITED WAYS www.UWMich.org
MICHIGAN COALITION AGAINST HOMELESSNESS www.MiHomeless.org
MICHIGAN COMMUNITY ACTION www.MCAC.MemberClicks.net
MICHIGAN DEPARTMENT OF CORRECTIONS www.Michigan.gov/Corrections
MICHIGAN DEPARTMENT OF EDUCATION www.Michigan.gov/MDE
MICHIGAN DEPARTMENT OF HEALTH AND HUMAN SERVICES www.Michigan.gov/MDHHS
MICHIGAN DEPARTMENT OF NATURAL RESOURCES www.Michigan.gov/DNR
MICHIGAN DEPARTMENT OF TECHNOLOGY, MANAGEMENT AND BUDGET www.Michigan.gov/DTMB
MICHIGAN LEAGUE FOR PUBLIC POLICY www.MLPP.org
MICHIGAN STATE HOUSING DEVELOPMENT AUTHORITY www.Michigan.gov/MSHDA
MICHIGAN VETERANS AFFAIRS AGENCY www.MichiganVeterans.com
U.S. DEPARTMENT OF VETERANS AFFAIRS www.VA.gov
STATE PARTNERS