encyclopedia of social measurement || network analysis
TRANSCRIPT
Network Analysis
Peter V. MarsdenHarvard University, Cambridge, Massachusetts, USA
Glossary
blockmodel Asummaryof the subgroupstructure in anetwork,consisting of an assignment of social units to positions andimages of the relationships among those positions.
centrality The prominence or importance of a given unit withina network as reflected in its relationships to other units.
clique A subgroup of mutually related units.cohesion The strength of the relationship between units;
a criterion for assigning units to subgroups.egocentric network The partial network surrounding a given
unit.mutuality Reciprocity within a relationship from one unit to
another.one-mode design A design focusing on relationships among
social units of a single type, for example, friendships amongchildren in a school classroom.
relational property A property of a unit defined byinformation on its relationships to other units ina collective or group.
structural equivalence A condition in which two units haveidentical relationships to and from all other units within acollective or group; a criterion for assigning units to subgroups.
structural property A property of a collective or groupdefined by information on relationships among the units itincludes.
transitivity The presence of a relationship from one unit toanother when both are related to a third unit, implyingclosure or clustering within a network.
two-mode design A design focusing on the relationshipsbetween social units of two distinct types, for example, thememberships of directors in corporate boards.
whole-network study The study of relationships among unitswithin a bounded social collective or group.
Network analysis identifies regularities in relationshipsamong social units, thereby measuring both relationalproperties of individual units and structural propertiesof collectives. Major subjects of network analysis include
connectedness, centrality, range, and social differentia-tion. Mathematical, graphical, and statistical techniquesare used to study network data.
Introduction
Network studies measure features of social structure byidentifying regularities and patterns in relationshipsamong social units. The properties of interest lie at severaldistinct levels. They include relational properties of indi-vidual social units, such as status, social integration, socialsupport, and social capital, as well as structural propertiesof entire groups or collectives, including vertical and hor-izontal differentiation, centralization, and social density.
The social units that compose networks are often in-dividuals, but networks are also made up of other unitsincluding families, organizations, or countries, amongothers. Both formally constituted groups (such asworkplaces or schools) and informally defined ones(such as scientific communities or policy domains) canbe studied using network analysis. Network studies exam-ine diverse relationships among units including interde-pendence, communication, membership, solidarity, andaffect. Network theories assert that social ties serve aschannels for the diffusion of cultural ideas and practices,infectious diseases, and information and as pathways of-fering access to information, opportunity, and resources.Locations in networks can be sources of power and signalsof a unit’s social standing. Network analyses are foundthroughout the social sciences, especially in anthropology,epidemiology, management and organization studies, andsociology.
This entry first covers major network study designs.It then introduces graph-theoretic representations ofnetwork data and visual representations. Next, it summa-rizes network approaches to the measurement of
Encyclopedia of Social Measurement, Volume 2 �2005, Elsevier Inc. All Rights Reserved. 819
centrality/prominence, network range, and social differ-entiation. Most of these techniques describe features ofthe particular networks under study. The entry then in-troduces some developing statistical approaches to net-work analysis that seek to draw inferences that extendbeyond the available data.
Social Network Data andResearch Designs
Beginning in the 1930s, studies of the sociometric mea-surement of interpersonal affect introduced quantitativemethods and tools that were important precursors to net-work analysis. Ethnographic fieldwork by social anthro-pologists in the 1950s and 1960s offered a set of concepts,ideas, and methods that informs the study of social net-works. Work of both kinds continues, but most con-temporary studies use quantitative data. The typicalnetwork study uses a nonexperimental design. Commonapproaches to data collection are surveys, questionnaires,and direct observation. Archival sources also offer richinformation on the relationships among certain socialunits. Designs for network studies are distinguished bywhether they assemble data on whole or partial net-works and by the number of types (modes) of socialunits studied.
Whole-network studies examine interrelated units thatare analyzed as a bounded social collective; the analyticalboundaries of the collectivemay be based on formalmem-bership criteria, density of interactions, or involvement ina set of events or activities. The most common one-modewhole-network design collects data on relationships link-ing a set of N social units of a single type. Examples arefriendships among students in a school and alliances
among businesses in an industry sector. One-mode net-work data can be represented as a square matrix X¼ {xij},where the element xij represents the strength of the re-lationship from unit i to unit j; relationships xii from unitsto themselves are usually undefined. A data matrix fora binary relationship in a 10-unit network appears inFig. 1A. A 1 indicates that there is a tie from the rowunit to the column unit, and a 0 indicates that thereis no such tie. One-mode designs can be extended byobserving a relationship at multiple time points, by mea-suring two or more relationships (e.g., antagonisms aswell as friendships) linking the social units, or byobtaining measurements on a single relationship frommultiple observers or sources. Each extension leadsto a three-way data matrix X¼ {xijk}, where the subscriptk indexes time points, types of relationship, or observers/sources.
In a two-mode whole-network design, basicrelationships link two distinct types of units. Data arerecorded in a rectangular matrix Y¼ {yij}, where the el-ement yij refers to the relationship between the ith unit ofthe first type and the jth unit of the second type. Studies ofinterlocking boards of directors exemplify the two-modedesign: individuals and corporations are the two types ofunits, and data elements indicate whether person i isa director of corporation j.
Egocentric network studies collect data on partial net-works consisting of a focal social unit i and the other unitsand relationships clustered in its locality. The social sup-port network surrounding a given person is one example.Egocentric networks are often delimited by includingother units that lie within the focal unit’s first-orderzone, those units directly linked with the focal unit.Unit i’s egocentric network, then, consists of thoseothers bearing some criterion relationship to i, and therelationships among them. In Fig. 1B, the egocentric
A
A B
– 1 1 0 0 0 1 0 0 0-- -- -- -- -- -- -- -- -- --A B1 B2 C D1 D2 E F1 F2 G
B1 1 – 1 0 0 0 0 0 0 0
B2 1 1 – 0 0 0 0 0 0 0
C 0 0 0 – 0 0 1 0 0 0
D1 0 0 0 0 – 0 1 0 0 0
D2 0 0 0 0 0 – 1 0 0 0
E 0 0 0 0 0 0 – 0 0 0
F1 0 0 0 1 0 0 0 – 0 0
F2 0 0 0 1 0 0 0 0 – 0
G 0 0 0 0 0 0 0 0 0 –
D2
B2 B1
D1 E
AG
C
F2
F1
Figure 1 (A) Data matrix and (B) directed graph for a 10-unit, one-mode network.
820 Network Analysis
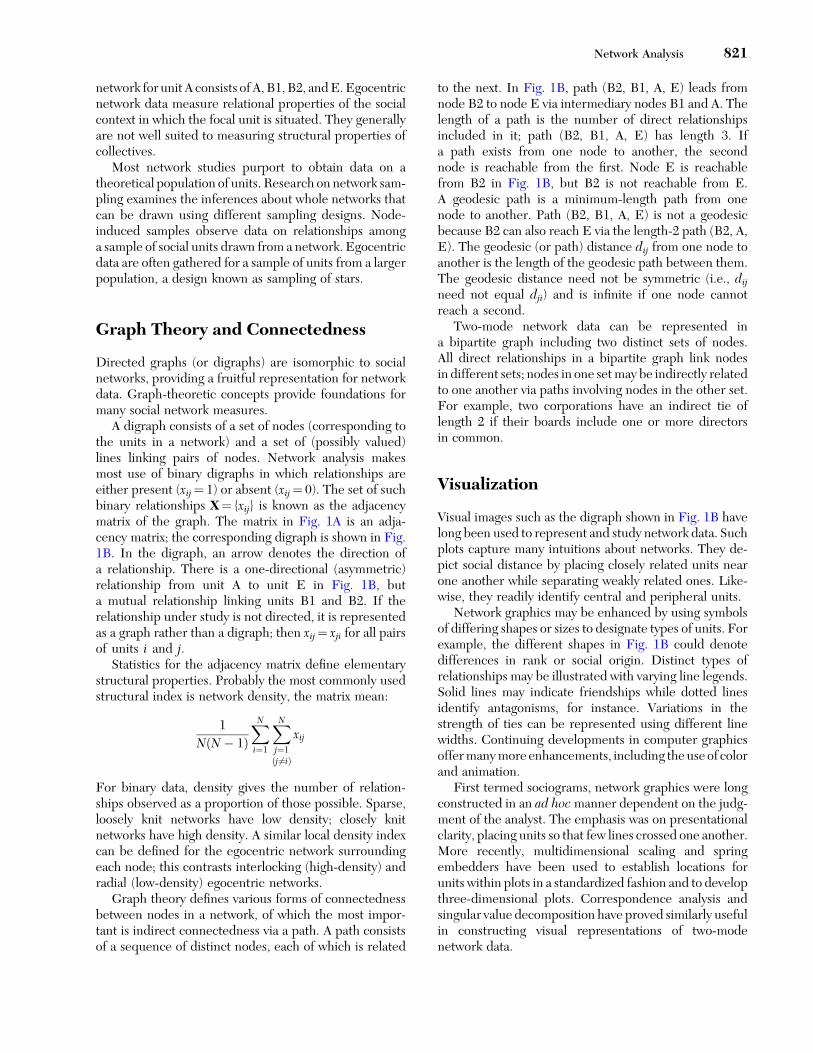
network for unit A consists of A, B1, B2, andE.Egocentricnetwork data measure relational properties of the socialcontext in which the focal unit is situated. They generallyare not well suited to measuring structural properties ofcollectives.
Most network studies purport to obtain data on atheoretical population of units. Research on network sam-pling examines the inferences about whole networks thatcan be drawn using different sampling designs. Node-induced samples observe data on relationships amonga sample of social units drawn from a network. Egocentricdata are often gathered for a sample of units from a largerpopulation, a design known as sampling of stars.
Graph Theory and Connectedness
Directed graphs (or digraphs) are isomorphic to socialnetworks, providing a fruitful representation for networkdata. Graph-theoretic concepts provide foundations formany social network measures.
A digraph consists of a set of nodes (corresponding tothe units in a network) and a set of (possibly valued)lines linking pairs of nodes. Network analysis makesmost use of binary digraphs in which relationships areeither present (xij¼ 1) or absent (xij¼ 0). The set of suchbinary relationships X¼ {xij} is known as the adjacencymatrix of the graph. The matrix in Fig. 1A is an adja-cency matrix; the corresponding digraph is shown in Fig.1B. In the digraph, an arrow denotes the direction ofa relationship. There is a one-directional (asymmetric)relationship from unit A to unit E in Fig. 1B, buta mutual relationship linking units B1 and B2. If therelationship under study is not directed, it is representedas a graph rather than a digraph; then xij¼ xji for all pairsof units i and j.
Statistics for the adjacency matrix define elementarystructural properties. Probably the most commonly usedstructural index is network density, the matrix mean:
1
NðN� 1ÞXNi¼1
XNj¼1ðj 6¼iÞ
xij
For binary data, density gives the number of relation-ships observed as a proportion of those possible. Sparse,loosely knit networks have low density; closely knitnetworks have high density. A similar local density indexcan be defined for the egocentric network surroundingeach node; this contrasts interlocking (high-density) andradial (low-density) egocentric networks.
Graph theory defines various forms of connectednessbetween nodes in a network, of which the most impor-tant is indirect connectedness via a path. A path consistsof a sequence of distinct nodes, each of which is related
to the next. In Fig. 1B, path (B2, B1, A, E) leads fromnode B2 to node E via intermediary nodes B1 and A. Thelength of a path is the number of direct relationshipsincluded in it; path (B2, B1, A, E) has length 3. Ifa path exists from one node to another, the secondnode is reachable from the first. Node E is reachablefrom B2 in Fig. 1B, but B2 is not reach able from E.A geodesic path is a minimum-length path from onenode to another. Path (B2, B1, A, E) is not a geodesicbecause B2 can also reach E via the length-2 path (B2, A,E). The geodesic (or path) distance dij from one node toanother is the length of the geodesic path between them.The geodesic distance need not be symmetric (i.e., dijneed not equal dji) and is infinite if one node cannotreach a second.
Two-mode network data can be represented ina bipartite graph including two distinct sets of nodes.All direct relationships in a bipartite graph link nodesin different sets; nodes in one setmay be indirectly relatedto one another via paths involving nodes in the other set.For example, two corporations have an indirect tie oflength 2 if their boards include one or more directorsin common.
Visualization
Visual image s such as the digra ph shown in Fig. 1B ha velong been used to represent and study network data. Suchplots capture many intuitions about networks. They de-pict social distance by placing closely related units nearone another while separating weakly related ones. Like-wise, they readily identify central and peripheral units.
Network graphics may be enhanced by using symbolsof differing shapes or sizes to designate types of units. Forexample, the different shapes in Fig. 1B could denotedifferences in rank or social origin. Distinct types ofrelationships may be illustrated with varying line legends.Solid lines may indicate friendships while dotted linesidentify antagonisms, for instance. Variations in thestrength of ties can be represented using different linewidths. Continuing developments in computer graphicsoffermanymore enhancements, including the use of colorand animation.
First termed sociograms, network graphics were longconstructed in an ad hocmanner dependent on the judg-ment of the analyst. The emphasis was on presentationalclarity, placing units so that few lines crossed one another.More recently, multidimensional scaling and springembedders have been used to establish locations forunits within plots in a standardized fashion and to developthree-dimensional plots. Correspondence analysis andsingular value decomposition have proved similarly usefulin constructing visual representations of two-modenetwork data.
Network Analysis 821
Centrality and Centralization
Centrality measures are among the most widely usedindices based on network data. They generally reflecta unit’s prominence; in different substantive settings,this may be its structural power, status, prestige, or visi-bility. Studies often use network-based centrality mea-sures in efforts to account for interunit differences inbehavior or attitudes.
Distinct centrality measures are sensitive to differentaspectsofafocalunit’s tiestootherunits.Several importantgraph-theoretic measures were first defined for binarysymmetric graphs. They have since been generalized toinclude valued and directed ties, but the illustrations inthis section assume binary symmetric measurements.A unit’s degree centrality CD(i) reflects its number ofrelationships:
CD ið Þ ¼XNj¼1ði 6¼jÞ
xij
Separate in- and out-degree measures are suitable fornonsymmetric data. In Fig. 1B, for example, unit E hasan in-degree centrality 4, but an out-degree centrality 0.
Other common graph-theoretic measures of centralityare based on indirect connectedness measured using geo-desic paths. A widely used measure CB(i) reflects unit i’s‘‘betweenness:’’
CB ið Þ ¼XNj¼1ð j 6¼iÞ
Xj�1
k¼1ðk 6¼iÞ
gjk ið Þgjk
where gjk is the number of geodesic paths linking units jand k, and gjk(i) is the number of those geodesics onwhich unit i occupies an intermediary location. Unit Clies between F1 and E in Fig. 1B, for example.Betweenness centrality can reflect a unit’s capacity tobroker or control social relations involving other units.
A closeness measure conceives of a unit as central tothe extent that it is related to other units via shortgeodesics:
CC ið Þ ¼ N�1PNj¼1 dij
Closeness centrality CC(i) is defined only for sets of unitsthat aremutually related via finite geodesic distances.Unitslinked to others via short geodesics have comparativelylittle need for intermediary (broker) units and thus possessrelative independence in managing their relationships.
Another useful centrality index defines a unit’s poweror prominence pi on the basis of the strength of itsrelationships to other powerful or prominent units:
pi ¼XNj¼1
pjrji
where rji is a normalized measure of the strength of therelationship from unit j to unit i. This index weights tiesto powerful units more heavily than those to lesspowerful ones. The vector of scores p¼ {pi} is aneigenvector of the normalized matrix of relationshipsR¼ {rij}, so p is known as an eigenvector measure ofcentrality.
The foregoing indices of centrality are relational mea-sures defined for individual social units. Correspondingto each one is a structural measure of centralizationdefined at the level of the group or collective. Centrali-zation is high if relationships are concentrated on a singleunit and low if they are distributed evenly across units.A normalized group-level measure of centralization basedon degree centrality is:
CD ¼XNi¼1
CD maxð Þ�CDðiÞN� 1ð Þ N� 2ð Þ
where CD(max) is the maximum degree centrality of anyunit within the network under study. Similar centralizationmeasures exist for other unit-level centrality measures.
Range and Composition
Social networks are key constituents of most concepts ofsocial capital. Social actors can gain competitive advan-tages by making use of resources, information, and op-portunities available through their social ties. Such socialcapital both substitutes for and augments individual ca-pacities or human capital. Social support flowing throughnetworks can improve individual well-being directly andalso buffer the impact of stressors on well-being.
The principal network indicators of social capital areindices that measure the range and composition of ego-centric networks. Range measures reflect the variety ofunits withwhich a focal unit is in direct or indirect contact.The ego units at the center of large, sparse networks arepositioned to obtain and synthesize nonredundant infor-mation that resides in diverse sectors of a group and thusto be first-movers and early innovators. By virtue of theirposition as intermediaries bridging structural holes thatseparate otherwise disconnected alters, such ego unitsaccrue opportunities to profit by exercising entre-preneurial control. In some settings, closely knit, denseegocentric networks also have advantages—they can con-vey stable social identities and establish well-defined per-formance expectations.
Basic measures of network range include egocentricnetwork size (degree centrality CD(i)), local density (aninverse indicator of range), and heterogeneity indexesreflecting the level of sociodemographic diversityamong those alters tied to a given ego. More refinedindicators take simultaneous account of these factors.
822 Network Analysis
Effective network size, for instance, is lower thanCD(i) tothe extent that the alter units in unit i’s egocentric networkare linked to one another and therefore redundant.A unit’s structural autonomy is high to the extent that ithas many alternative relationships with other units,whereas its transaction partners have comparatively few.
Most network range indicators capture features ofthe configuration of relationships surrounding a givenunit, positing that these features promote access to infor-mation and resources. Network composition indicatorsmeasure the accessibility of social resources more directly.The status composition of a focal unit’s egocentric network,for example, might be measured by the average status ofthe other units included in it, often weighted by thestrength of their relationships to the focal unit.
Social Differentiation: NetworkSubgroups
Network approaches to studying social differentiation reston the postulate that social relationships reflect salientsocial distinctions. Patterns of relationships, then, pointto subgroups and statuses within a group or collectivity.Analyses of differentiation seek to assign units to sub-groups and develop models of intersubgrouprelationships. Two major principles for assigning unitsto subgroups are extensively used. One defines subgroupsas sets of cohesive, densely interconnected units. Theother defines them as sets of units occupying commonsocial positions by virtue of their substitutable equivalentprofiles of relationships to other units.
Cohesive Subgroups
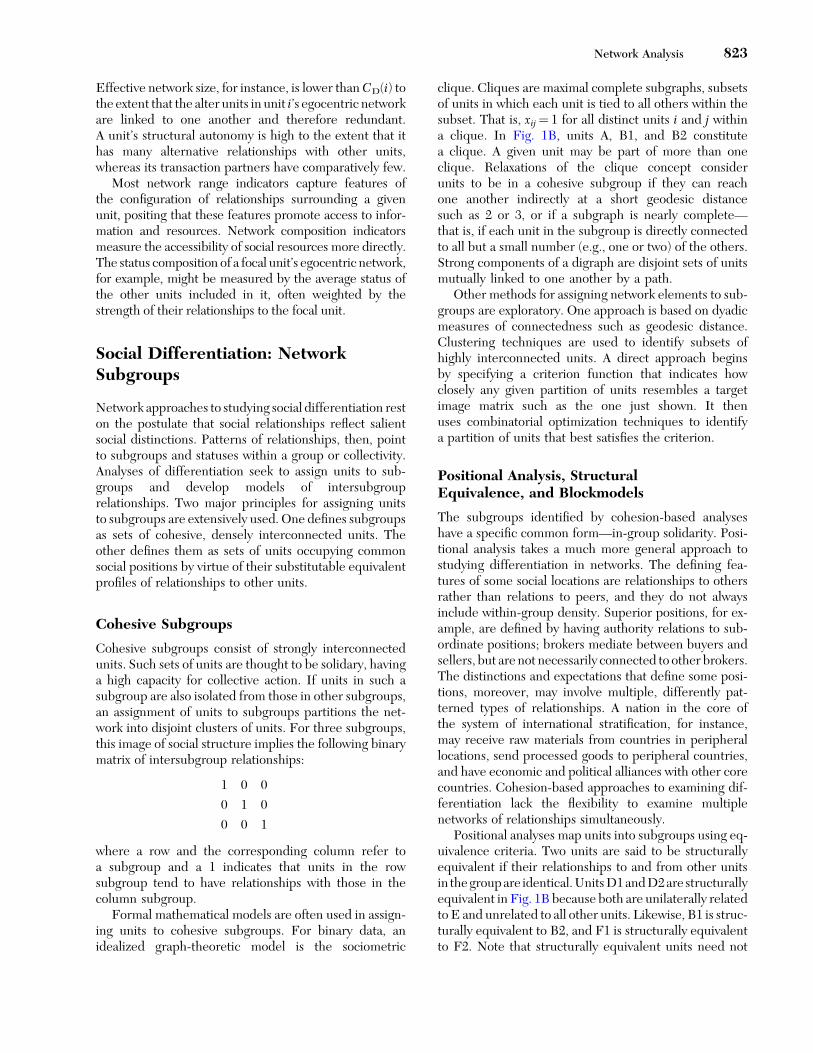
Cohesive subgroups consist of strongly interconnectedunits. Such sets of units are thought to be solidary, havinga high capacity for collective action. If units in such asubgroup are also isolated from those in other subgroups,an assignment of units to subgroups partitions the net-work into disjoint clusters of units. For three subgroups,this image of social structure implies the following binarymatrix of intersubgroup relationships:
1 0 0
0 1 0
0 0 1
where a row and the corresponding column refer toa subgroup and a 1 indicates that units in the rowsubgroup tend to have relationships with those in thecolumn subgroup.
Formal mathematical models are often used in assign-ing units to cohesive subgroups. For binary data, anidealized graph-theoretic model is the sociometric
clique. Cliques are maximal complete subgraphs, subsetsof units in which each unit is tied to all others within thesubset. That is, xij¼ 1 for all distinct units i and j withina clique. In Fig. 1B, units A, B1, and B2 constitutea clique. A given unit may be part of more than oneclique. Relaxations of the clique concept considerunits to be in a cohesive subgroup if they can reachone another indirectly at a short geodesic distancesuch as 2 or 3, or if a subgraph is nearly complete—that is, if each unit in the subgroup is directly connectedto all but a small number (e.g., one or two) of the others.Strong components of a digraph are disjoint sets of unitsmutually linked to one another by a path.
Other methods for assigning network elements to sub-groups are exploratory. One approach is based on dyadicmeasures of connectedness such as geodesic distance.Clustering techniques are used to identify subsets ofhighly interconnected units. A direct approach beginsby specifying a criterion function that indicates howclosely any given partition of units resembles a targetimage matrix such as the one just shown. It thenuses combinatorial optimization techniques to identifya partition of units that best satisfies the criterion.
Positional Analysis, StructuralEquivalence, and Blockmodels
The subgroups identified by cohesion-based analyseshave a specific common form—in-group solidarity. Posi-tional analysis takes a much more general approach tostudying differentiation in networks. The defining fea-tures of some social locations are relationships to othersrather than relations to peers, and they do not alwaysinclude within-group density. Superior positions, for ex-ample, are defined by having authority relations to sub-ordinate positions; brokers mediate between buyers andsellers, but are not necessarily connected to other brokers.The distinctions and expectations that define some posi-tions, moreover, may involve multiple, differently pat-terned types of relationships. A nation in the core ofthe system of international stratification, for instance,may receive raw materials from countries in peripherallocations, send processed goods to peripheral countries,and have economic and political alliances with other corecountries. Cohesion-based approaches to examining dif-ferentiation lack the flexibility to examine multiplenetworks of relationships simultaneously.
Positional analyses map units into subgroups using eq-uivalence criteria. Two units are said to be structurallyequivalent if their relationships to and from other unitsin thegroupare identical.UnitsD1andD2are structurallyequivalent in Fig. 1B because both are unilaterally relatedto E and unrelated to all other units. Likewise, B1 is struc-turally equivalent to B2, and F1 is structurally equivalentto F2. Note that structurally equivalent units need not
Network Analysis 823
have relationships with one another. Role equivalenceis a more general criterion that groups two units togetherif their profiles of relationships link themto similar, but notnecessarily identical, others. The entry-level employees indifferent bureaucratic organizations are role-equivalent inthat they are subject to the authority of first-line supervi-sors, but they are not structurally equivalent because theyare subordinate to different supervisors.
A blockmodel depicts the typical relationships amongunits grouped into equivalence-based subsets. It consistsof an assignment of units to subgroups, together with oneor more binary images of intersubgroup ties. The follow-ing images for a two-relation, three-subgroup blockmodelmight describe a workgroup:
Authority Friendship
0 1 1 1 0 1
0 0 0 0 1 0
0 0 0 1 0 0
In the first subgroup (or position) are those who exerciseauthority over others; they tend to be friendly with oneanother. The second position includes subordinates whoare solidary with one another, whereas the third consistsof subordinates who are not friendly with one another,but do maintain friendships with some of the super-visory actors.
The formal mathematical definitions of structural androle equivalence constitute rigorous standards for assign-ing units to common positions. Empirical studies usuallymust relax them. Often this begins with a dyadic similarityor dissimilarity measure of the extent to which tworelational profiles approach equivalence, such as theEuclidean distance edij:
edij ¼
ffiffiffiffiffiffiffiffiffiffiffiffiffiffiffiffiffiffiffiffiffiffiffiffiffiffiffiffiffiffiffiffiffiffiffiffiffiffiffiffiffiffiffiffiffiffiffiffiffiffiffiffiffiffiffiffiffiffiffiffiffiffiffiffiffiffiffiffiffiffiffiffiffiffiffiffiXNk¼1
XMm¼1
�xikm � xjkm� �2þ xkim � xkjm
� �2�vuut
where M is the number of types of relationship studied.Units i and j are structurally equivalent if edij¼ 0; to theextent that it exceeds 0, they occupy distinct positions orniches in social structure. Once such a measure ofrelational dissimilarity has been defined, cluster analysismethods are used to identify subsets of units havingrelatively homogenous profiles. Rather than using anintermediate dissimilarity measure, optimization meth-ods for the empirical construction of blockmodels takea direct approach by seeking a partition of units intoblocks that best satisfies a criterion function.
Statistical Network Analyses
By comparison with most other branches of quantitativesocial science, network analysis has given limited
attention to statistical issues. Most techniques and mea-sures examine the structure of specific data sets withoutaddressing sampling variation, measurement error, orother uncertainties. Such issues are complex because ofthe dependencies inherent in network data, but they arenow receiving increased study.
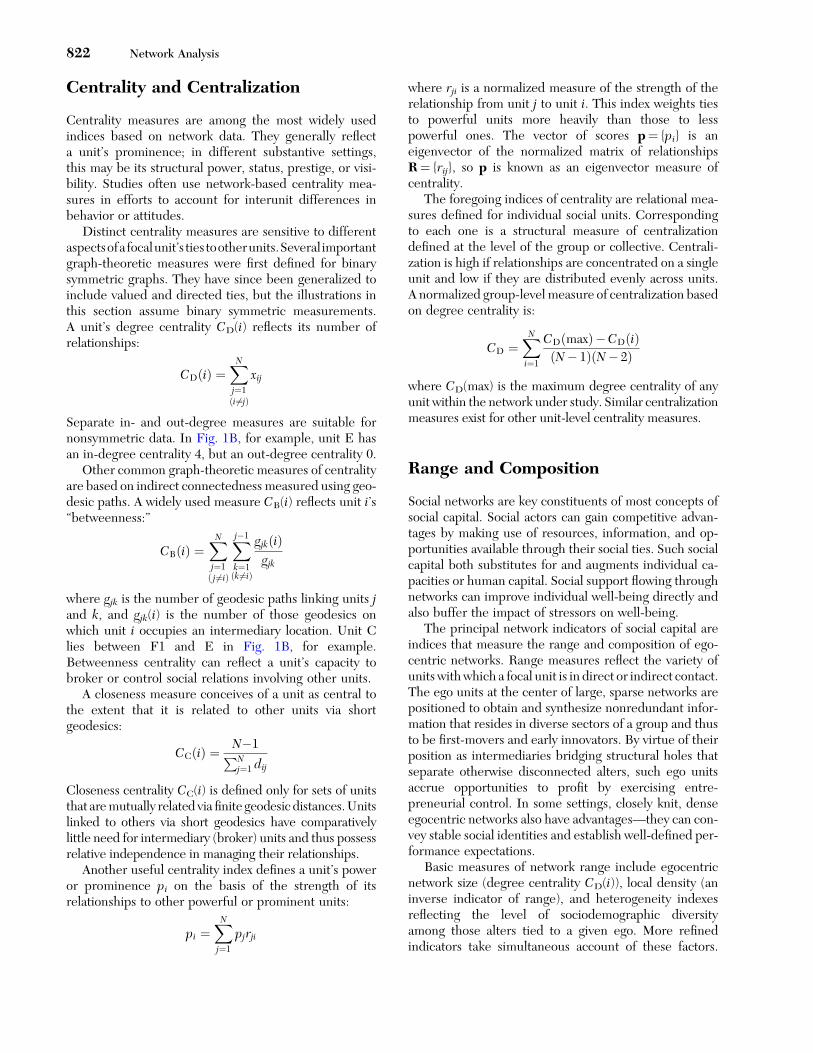
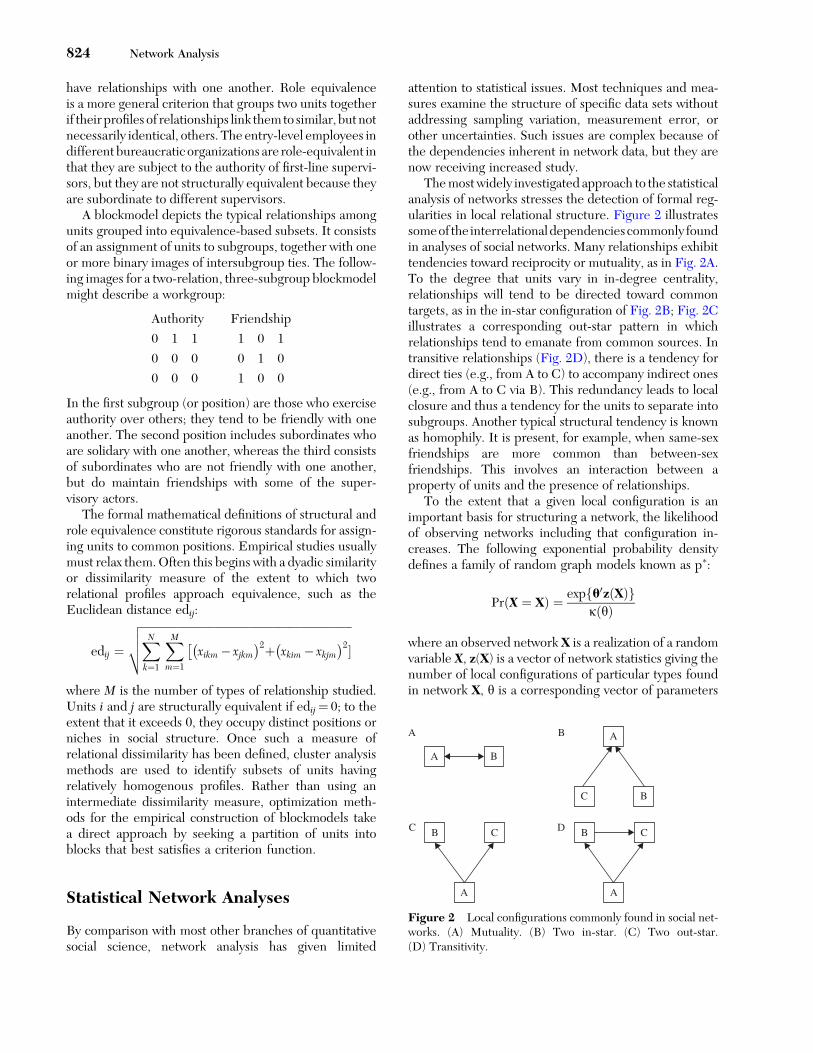
Themost widely investigated approach to the statisticalanalysis of networks stresses the detection of formal reg-ularities in local relational structure. Figure 2 illustratessomeof the interrelationaldependenciescommonly foundin analyses of social networks. Many relationships exhibittendencies toward reciprocity or mutuality, as in Fig. 2A.To the degree that units vary in in-degree centrality,relationships will tend to be directed toward commontargets, as in the in-star configuration of Fig. 2B; Fig. 2Cillustrates a corresponding out-star pattern in whichrelationships tend to emanate from common sources. Intransitive relationships (Fig. 2D), there is a tendency fordirect ties (e.g., from A to C) to accompany indirect ones(e.g., from A to C via B). This redundancy leads to localclosure and thus a tendency for the units to separate intosubgroups. Another typical structural tendency is knownas homophily. It is present, for example, when same-sexfriendships are more common than between-sexfriendships. This involves an interaction between aproperty of units and the presence of relationships.
To the extent that a given local configuration is animportant basis for structuring a network, the likelihoodof observing networks including that configuration in-creases. The following exponential probability densitydefines a family of random graph models known as p�:
Pr X ¼ Xð Þ ¼ exp u0z Xð Þf gk yð Þ
where an observed network X is a realization of a randomvariable X, z(X) is a vector of network statistics giving thenumber of local configurations of particular types foundin network X, y is a corresponding vector of parameters
A B
C B
A
B C
A
B C
A
A B
C D
Figure 2 Local configurations commonly found in social net-works. (A) Mutuality. (B) Two in-star. (C) Two out-star.(D) Transitivity.
824 Network Analysis
indicating the strength with which different localstructural tendencies operate, and k(y) is a normalizingconstant. The estimation of y is complicated by thedifficulty of evaluating k(y); to date most estimates havebeen obtained via pseudo-likelihood methods.
Thismodelingframeworkconsidersmultipleprinciplesunderlying social network structure simultaneously andidentifies those tendencies that are significant structuralpatterns. It marks a considerable step beyond previousprobability distributions formulated for network data,which included a restrictive specification of dyadicindependence. Many extensions and innovations in mod-eling and estimation methods are underway within thisframework.
The p� density was first formulated by spatial statisti-cians. Many statistical problems of interest in networkanalysis have parallels in spatial statistics, although net-work data are not usually referenced to fixed locations.Network analysts have used spatial regression and spatialautocorrelation techniques when studying processes ofinfluence and diffusion that operate by way of networkties. Other parallels between the analysis of network dataand spatial data remain to be explored.
See Also the Following Article
Graph Theory
Further Reading
Borgatti, S. P., and Everett, M. G. (1992). Notions of positionin social network analysis. In Sociological Methodology1992 (P. V. Marsden, ed.), pp. 1�35. Basil Blackwell,Oxford.
Borgatti, S. P., and Everett, M. G. (1997). Network analysis of2-mode data. Soc. Networks 19, 243�269.
Breiger, R. L. (1974). The duality of persons and groups. Soc.Forces 53, 181�190.
Burt, R. S. (1992). Structural Holes: The Social Structureof Competition. Harvard University Press, Cambridge, MA.
Frank, O. (1981). A survey of statistical methods forgraph analysis. In Sociological Methodology 1981(S. Leinhardt, ed.), pp. 110�155. Jossey-Bass, SanFrancisco, CA.
Freeman, L. C. (1979). Centrality in social networks, I:Conceptual clarification. Soc. Networks 1, 215�239.
Freeman, L. C. (2000). Visualizing social networks. J. So.Struct. 1. Available at http://www.heinz.cmu.edu/project/INSNA/joss/.
Harary, F., Norman, R. Z., and Cartwright, D. (1965).Structural Models: An Introduction to the Theory ofDirected Graphs. John Wiley & Sons, New York.
Lazarsfeld, P. F., and Menzel, H. (1980). On the relationbetween individual and collective properties. In A Socio-logical Reader on Complex Organizations (A. Etzioni andE. W. Lehman, eds.), 3rd Ed., pp. 508�521. Holt, Rinehartand Winston, New York.
Marsden, P. V. (1990). Network data and measurement. Ann.Rev. Sociol. 16, 435�463.
Mitchell, J. C. (1969). The concept and use of social networks.In Social Networks in Urban Situations: Analyses ofPersonal Relationships in Central African Towns(J. C. Mitchell, ed.), pp. 1�50. Manchester UniversityPress, Manchester, UK.
Scott, J. (2000). Social Network Analysis: A Handbook. 2ndedn. Sage, Thousand Oaks, CA.
Wasserman, S., and Faust, K. L. (1994). Social NetworkAnalysis: Methods and Applications. Cambridge UniversityPress, New York.
Wasserman, S., and Pattison, P. (1996). Logit models andlogistic regressions for social networks: I. An introduction toMarkov graphs and p�. Psychometrika 60, 401�426.
White, H. C., Boorman, S., and Breiger, R. L. (1976). Socialstructure from multiple networks, I: Blockmodels of rolesand positions. Am. J. Sociol. 81, 730�780.
Network Analysis 825