encyclopedia of marine mammals || swimming
TRANSCRIPT
Swimming1140
S
Swimming TERRIE M. WILLIAMS
I. Introduction
The primary mode of locomotion for marine mammals with the possible exception of polar bears ( Ursus maritimus ) is swimming. For dolphins, porpoises and whales, it is the
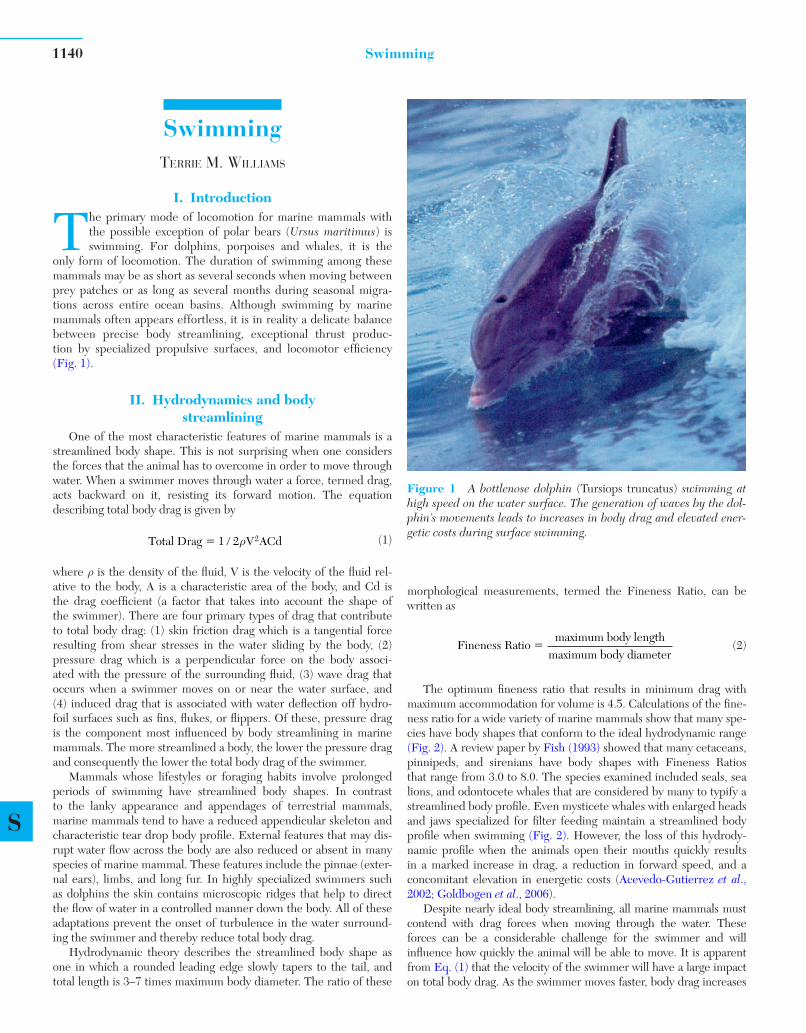
only form of locomotion. The duration of swimming among these mammals may be as short as several seconds when moving between prey patches or as long as several months during seasonal migra-tions across entire ocean basins. Although swimming by marine mammals often appears effortless, it is in reality a delicate balance between precise body streamlining, exceptional thrust produc-tion by specialized propulsive surfaces, and locomotor effi ciency ( Fig. 1 ).
II. Hydrodynamics and body streamlining
One of the most characteristic features of marine mammals is a streamlined body shape. This is not surprising when one considers the forces that the animal has to overcome in order to move through water. When a swimmer moves through water a force, termed drag, acts backward on it, resisting its forward motion. The equation describing total body drag is given by
Total Drag V ACd� 1 2 2/ ρ (1)
where ρ is the density of the fl uid, V is the velocity of the fl uid rel-ative to the body, A is a characteristic area of the body, and Cd is the drag coeffi cient (a factor that takes into account the shape of the swimmer). There are four primary types of drag that contribute to total body drag: (1) skin friction drag which is a tangential force resulting from shear stresses in the water sliding by the body, (2) pressure drag which is a perpendicular force on the body associ-ated with the pressure of the surrounding fl uid, (3) wave drag that occurs when a swimmer moves on or near the water surface, and (4) induced drag that is associated with water defl ection off hydro-foil surfaces such as fi ns, fl ukes, or fl ippers. Of these, pressure drag is the component most infl uenced by body streamlining in marine mammals. The more streamlined a body, the lower the pressure drag and consequently the lower the total body drag of the swimmer.
Mammals whose lifestyles or foraging habits involve prolonged periods of swimming have streamlined body shapes. In contrast to the lanky appearance and appendages of terrestrial mammals, marine mammals tend to have a reduced appendicular skeleton and characteristic tear drop body profi le. External features that may dis-rupt water fl ow across the body are also reduced or absent in many species of marine mammal. These features include the pinnae (exter-nal ears), limbs, and long fur. In highly specialized swimmers such as dolphins the skin contains microscopic ridges that help to direct the fl ow of water in a controlled manner down the body. All of these adaptations prevent the onset of turbulence in the water surround-ing the swimmer and thereby reduce total body drag.
Hydrodynamic theory describes the streamlined body shape as one in which a rounded leading edge slowly tapers to the tail, and total length is 3–7 times maximum body diameter. The ratio of these
morphological measurements, termed the Fineness Ratio, can be written as
Fineness Ratiomaximum body length
maximum body diameter� (2)
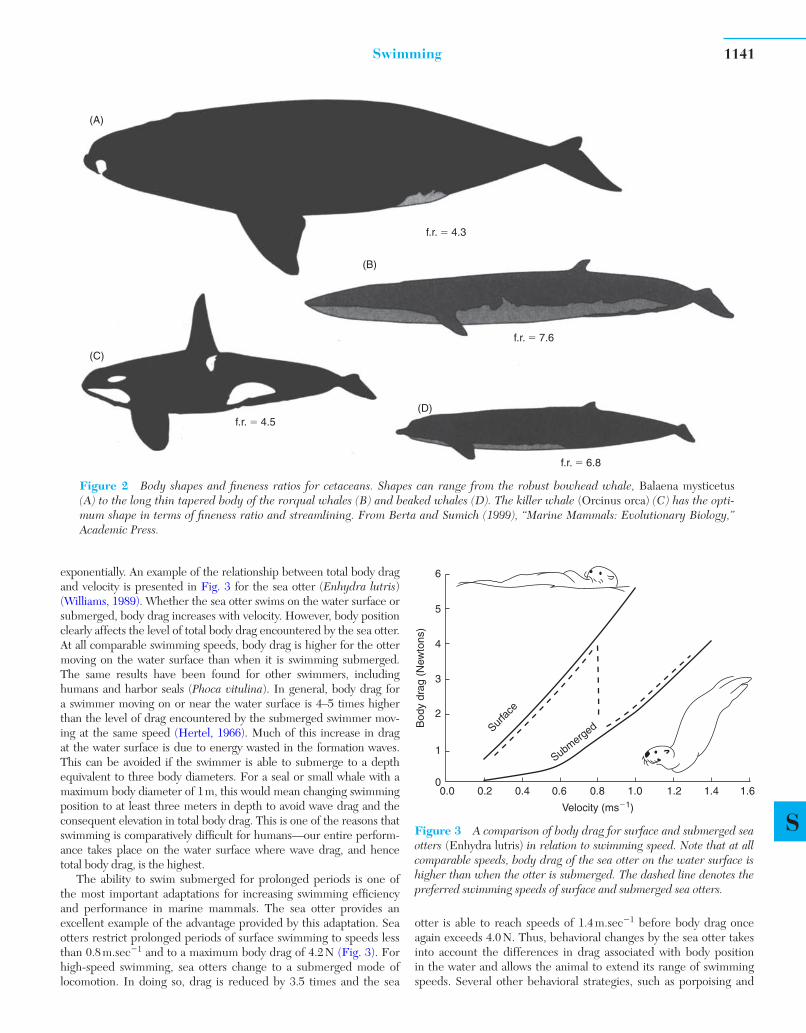
The optimum fi neness ratio that results in minimum drag with maximum accommodation for volume is 4.5. Calculations of the fi ne-ness ratio for a wide variety of marine mammals show that many spe-cies have body shapes that conform to the ideal hydrodynamic range ( Fig. 2 ). A review paper by Fish (1993) showed that many cetaceans, pinnipeds, and sirenians have body shapes with Fineness Ratios that range from 3.0 to 8.0. The species examined included seals, sea lions, and odontocete whales that are considered by many to typify a streamlined body profi le. Even mysticete whales with enlarged heads and jaws specialized for fi lter feeding maintain a streamlined body profi le when swimming ( Fig. 2 ). However, the loss of this hydrody-namic profi le when the animals open their mouths quickly results in a marked increase in drag, a reduction in forward speed, and a concomitant elevation in energetic costs ( Acevedo-Gutierrez et al.,2002 ; Goldbogen et al., 2006 ).
Despite nearly ideal body streamlining, all marine mammals must contend with drag forces when moving through the water. These forces can be a considerable challenge for the swimmer and will infl uence how quickly the animal will be able to move. It is apparent from Eq. (1) that the velocity of the swimmer will have a large impact on total body drag. As the swimmer moves faster, body drag increases
Figure 1 A bottlenose dolphin ( Tursiops truncatus ) swimming at high speed on the water surface. The generation of waves by the dol-phin’s movements leads to increases in body drag and elevated ener-getic costs during surface swimming.
Swimming 1141
S
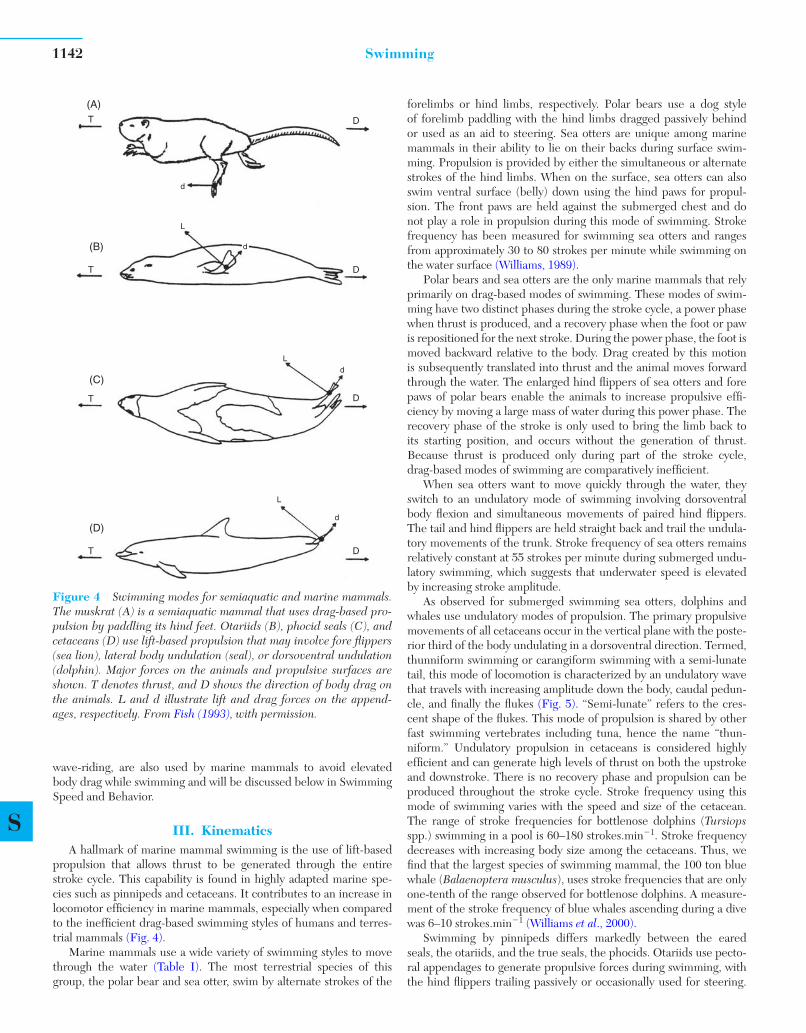
exponentially. An example of the relationship between total body drag and velocity is presented in Fig. 3 for the sea otter ( Enhydra lutris ) ( Williams, 1989 ). Whether the sea otter swims on the water surface or submerged, body drag increases with velocity. However, body position clearly affects the level of total body drag encountered by the sea otter. At all comparable swimming speeds, body drag is higher for the otter moving on the water surface than when it is swimming submerged. The same results have been found for other swimmers, including humans and harbor seals ( Phoca vitulina ). In general, body drag for a swimmer moving on or near the water surface is 4–5 times higher than the level of drag encountered by the submerged swimmer mov-ing at the same speed ( Hertel, 1966 ). Much of this increase in drag at the water surface is due to energy wasted in the formation waves. This can be avoided if the swimmer is able to submerge to a depth equivalent to three body diameters. For a seal or small whale with a maximum body diameter of 1 m, this would mean changing swimming position to at least three meters in depth to avoid wave drag and the consequent elevation in total body drag. This is one of the reasons that swimming is comparatively diffi cult for humans—our entire perform-ance takes place on the water surface where wave drag, and hence total body drag, is the highest.
The ability to swim submerged for prolonged periods is one of the most important adaptations for increasing swimming effi ciency and performance in marine mammals. The sea otter provides an excellent example of the advantage provided by this adaptation. Sea otters restrict prolonged periods of surface swimming to speeds less than 0.8 m.sec � 1 and to a maximum body drag of 4.2 N ( Fig. 3 ). For high-speed swimming, sea otters change to a submerged mode of locomotion. In doing so, drag is reduced by 3.5 times and the sea
otter is able to reach speeds of 1.4 m.sec � 1 before body drag once again exceeds 4.0 N. Thus, behavioral changes by the sea otter takes into account the differences in drag associated with body position in the water and allows the animal to extend its range of swimming speeds. Several other behavioral strategies, such as porpoising and
(B)
(A)
(C)
(D)
f.r. � 4.3
f.r. � 7.6
f.r. � 6.8
f.r. � 4.5
6
5
4
3
2
1
00.0 0.2 0.4 0.6 0.8 1.0 1.2 1.4 1.6
Velocity (ms�1)
Surfac
e
SubmergedBod
y dr
ag (
New
tons
)
Figure 2 Body shapes and fi neness ratios for cetaceans. Shapes can range from the robust bowhead whale, Balaena mysticetus(A) to the long thin tapered body of the rorqual whales (B) and beaked whales (D). The killer whale ( Orcinus orca ) (C) has the opti-mum shape in terms of fi neness ratio and streamlining. From Berta and Sumich (1999), “ Marine Mammals: Evolutionary Biology, ” Academic Press.
Figure 3 A comparison of body drag for surface and submerged sea otters ( Enhydra lutris ) in relation to swimming speed. Note that at all comparable speeds, body drag of the sea otter on the water surface is higher than when the otter is submerged. The dashed line denotes the preferred swimming speeds of surface and submerged sea otters.
Swimming1142
S
wave-riding, are also used by marine mammals to avoid elevated body drag while swimming and will be discussed below in Swimming Speed and Behavior.
III. Kinematics A hallmark of marine mammal swimming is the use of lift-based
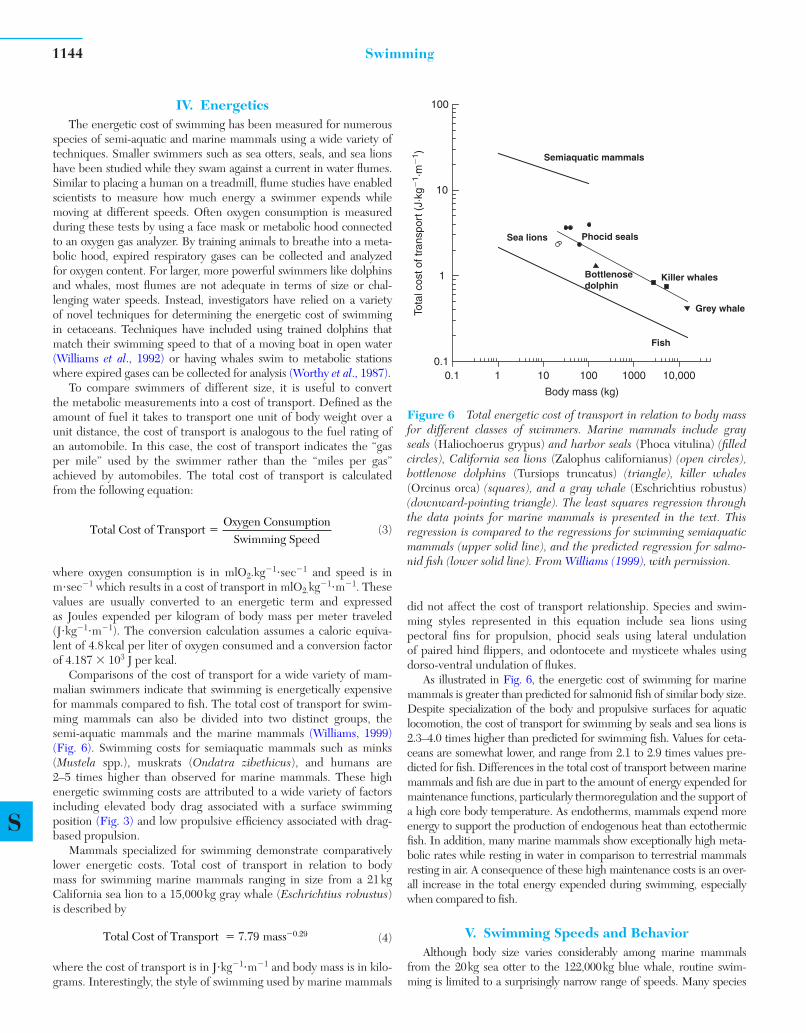
propulsion that allows thrust to be generated through the entire stroke cycle. This capability is found in highly adapted marine spe-cies such as pinnipeds and cetaceans. It contributes to an increase in locomotor effi ciency in marine mammals, especially when compared to the ineffi cient drag-based swimming styles of humans and terres-trial mammals ( Fig. 4 ).
Marine mammals use a wide variety of swimming styles to move through the water ( Table I ). The most terrestrial species of this group, the polar bear and sea otter, swim by alternate strokes of the
forelimbs or hind limbs, respectively. Polar bears use a dog style of forelimb paddling with the hind limbs dragged passively behind or used as an aid to steering. Sea otters are unique among marine mammals in their ability to lie on their backs during surface swim-ming. Propulsion is provided by either the simultaneous or alternate strokes of the hind limbs. When on the surface, sea otters can also swim ventral surface (belly) down using the hind paws for propul-sion. The front paws are held against the submerged chest and do not play a role in propulsion during this mode of swimming. Stroke frequency has been measured for swimming sea otters and ranges from approximately 30 to 80 strokes per minute while swimming on the water surface ( Williams, 1989 ).
Polar bears and sea otters are the only marine mammals that rely primarily on drag-based modes of swimming. These modes of swim-ming have two distinct phases during the stroke cycle, a power phase when thrust is produced, and a recovery phase when the foot or paw is repositioned for the next stroke. During the power phase, the foot is moved backward relative to the body. Drag created by this motion is subsequently translated into thrust and the animal moves forward through the water. The enlarged hind fl ippers of sea otters and fore paws of polar bears enable the animals to increase propulsive effi -ciency by moving a large mass of water during this power phase. The recovery phase of the stroke is only used to bring the limb back to its starting position, and occurs without the generation of thrust. Because thrust is produced only during part of the stroke cycle, drag-based modes of swimming are comparatively ineffi cient.
When sea otters want to move quickly through the water, they switch to an undulatory mode of swimming involving dorsoventral body fl exion and simultaneous movements of paired hind fl ippers. The tail and hind fl ippers are held straight back and trail the undula-tory movements of the trunk. Stroke frequency of sea otters remains relatively constant at 55 strokes per minute during submerged undu-latory swimming, which suggests that underwater speed is elevated by increasing stroke amplitude.
As observed for submerged swimming sea otters, dolphins and whales use undulatory modes of propulsion. The primary propulsive movements of all cetaceans occur in the vertical plane with the poste-rior third of the body undulating in a dorsoventral direction. Termed, thunniform swimming or carangiform swimming with a semi-lunate tail, this mode of locomotion is characterized by an undulatory wave that travels with increasing amplitude down the body, caudal pedun-cle, and fi nally the fl ukes ( Fig. 5 ). “ Semi-lunate ” refers to the cres-cent shape of the fl ukes. This mode of propulsion is shared by other fast swimming vertebrates including tuna, hence the name “ thun-niform. ” Undulatory propulsion in cetaceans is considered highly effi cient and can generate high levels of thrust on both the upstroke and downstroke. There is no recovery phase and propulsion can be produced throughout the stroke cycle. Stroke frequency using this mode of swimming varies with the speed and size of the cetacean. The range of stroke frequencies for bottlenose dolphins ( Tursiopsspp.) swimming in a pool is 60–180 strokes.min � 1 . Stroke frequency decreases with increasing body size among the cetaceans. Thus, we fi nd that the largest species of swimming mammal, the 100 ton blue whale ( Balaenoptera musculus ), uses stroke frequencies that are only one-tenth of the range observed for bottlenose dolphins. A measure-ment of the stroke frequency of blue whales ascending during a dive was 6–10 strokes.min � 1 ( Williams et al ., 2000 ).
Swimming by pinnipeds differs markedly between the eared seals, the otariids, and the true seals, the phocids. Otariids use pecto-ral appendages to generate propulsive forces during swimming, with the hind fl ippers trailing passively or occasionally used for steering.
(A)
(B)
(C)
(D)
T D
D
D
D
L
L
L
d
d
d
T
T
T
d
Figure 4 Swimming modes for semiaquatic and marine mammals. The muskrat (A) is a semiaquatic mammal that uses drag-based pro-pulsion by paddling its hind feet. Otariids (B), phocid seals (C), and cetaceans (D) use lift-based propulsion that may involve fore fl ippers (sea lion), lateral body undulation (seal), or dorsoventral undulation (dolphin). Major forces on the animals and propulsive surfaces are shown. T denotes thrust, and D shows the direction of body drag on the animals. L and d illustrate lift and drag forces on the append-ages, respectively. From Fish (1993), with permission.

Swimming 1143
S
In this way, sea lions and fur seals resemble penguins and sea turtles during swimming. Detailed kinematic analyses have been conducted for California sea lions ( Zalophus californianus ) swimming in a fl ume ( Feldkamp, 1987 ). These studies revealed three distinct phases to the stroke: (1) the power phase, (2) a paddle phase, and (3) a recov-ery phase. The majority of thrust is produced during the paddle phase when the fore fl ippers are quickly and forcibly moved from the water fl ow to the sides of the animal’s body. Stroke frequency for these sea lions increased with swimming speed, and ranged from 15 to 50 strokes.min � 1 as the animals increased speed from 0.5 to 3.0 m.sec� 1 . In addition to stroke frequency, sea lions increase the ampli-tude of the fore fl ipper stroke during high-speed swimming.
When viewed in cross section, the fore fl ipper of the sea lion resembles a hydrofoil. This specialized shape allows the fl ipper to pro-duce thrust during both the power and recovery phases of the stroke cycle. As found for cetaceans, the specialized fl ipper movements of otariids result in thrust production throughout the stroke cycle and contribute to overall locomotor effi ciency. Several other advantages are provided by fore fl ipper propulsion. These include stability at slow speeds and maneuverability at high speeds. Consequently, otariids are champion underwater acrobats and are capable of rapid changes in direction and acceleration.
Phocid seals and walruses ( Odobenus rosmarus ) differ from the ota-riids in terms of swimming style, and rely on alternate sweeps of the hind fl ippers for propulsion. In addition to the fl ippers, the posterior half of the body fl exes during each stroke, with the result that body fl ex-ion provides nearly 90% of the change in amplitude during the stroke cycle. In phocid seals both hind fl ippers are swept in the same direction as the posterior portion of the body during each half of the stroke cycle. The leading fl ipper remains closed and the trailing fl ipper maximally expands during the sweep to one side. Once the fl ippers have moved to the maximum lateral position, the fl ippers switch their open and closed positions in preparation for the reverse lateral sweep. By reversing the role of each fl ipper during lateral sweeps, one fl ipper is able to pro-vide thrust while the other fl ipper recovers. The result, once again, is the ability to produce propulsive thrust during the entire stroke cycle. Stroke frequency in phocids increases linearly with swimming speed. For harbor seals trained to swim at 1.0–1.4 m�sec� 1 in a water fl ume stroke frequency ranged from 60 to 78 strokes.min � 1 .
TABLE I A Comparison of Swimming Characteristics for Four Major Classes of Marine Mammals
Sea Otter Otariid Phocid Small Cetacean
Routine � 0.8 (surface) Speed (m/sec) � 1.4 (submerged) 2.0–3.0 1.2–2.0 2.0–4.0 sprints to 4.0 sprints to 10.0 Hydrodynamics Surface/Submerged Submerged Submerged Submerged Kinematics Mode Paddle, Row (surface) Pectoral Lateral Dorso-ventral
Undulate (submerged) Carangiform Thunniform Energetics ( COT measured ) 12.0 (surface) COT predicted 6.0 (submerged) 2.3–4.0 2.3–4.0 2.1–2.9
Note: The energetic Cost of Transport (COT) was measured for animals swimming in a fl ume or freely swimming in open water. The ratio of these values and the predicted values for fi sh of similar body mass are presented.
(A)
Fluke tip
Peduncle
Dorsal fin
Fluke hinge
Time (sec)
4.7
Pos
ition
(m
)
0.4
0.6
0.8
1.0
1.2
(B)
Dorsal fin
Peduncle
Fluke tip
Flukehinge
3.5 3.7 3.9 4.1 4.3 4.5
Figure 5 Video image (A) and range of movement (B) of four ana-tomical sites during a single stroke for a swimming bottlenose dol-phin ( Tursiops truncatus ). Colored squares in the picture correspond to the line colors illustrating the movements for each site. Note the traveling wave as it passes from the dorsal fi n (dark blue) to the peduncle (red), fl uke hinge (green) and fi nally the fl uke tip (pink). From Skrovan et al. (1999), with permission.
Swimming1144
S
IV. Energetics The energetic cost of swimming has been measured for numerous
species of semi-aquatic and marine mammals using a wide variety of techniques. Smaller swimmers such as sea otters, seals, and sea lions have been studied while they swam against a current in water fl umes. Similar to placing a human on a treadmill, fl ume studies have enabled scientists to measure how much energy a swimmer expends while moving at different speeds. Often oxygen consumption is measured during these tests by using a face mask or metabolic hood connected to an oxygen gas analyzer. By training animals to breathe into a meta-bolic hood, expired respiratory gases can be collected and analyzed for oxygen content. For larger, more powerful swimmers like dolphins and whales, most fl umes are not adequate in terms of size or chal-lenging water speeds. Instead, investigators have relied on a variety of novel techniques for determining the energetic cost of swimming in cetaceans. Techniques have included using trained dolphins that match their swimming speed to that of a moving boat in open water ( Williams et al ., 1992 ) or having whales swim to metabolic stations where expired gases can be collected for analysis ( Worthy et al ., 1987 ).
To compare swimmers of different size, it is useful to convert the metabolic measurements into a cost of transport. Defi ned as the amount of fuel it takes to transport one unit of body weight over a unit distance, the cost of transport is analogous to the fuel rating of an automobile. In this case, the cost of transport indicates the “ gas per mile ” used by the swimmer rather than the “ miles per gas ”achieved by automobiles. The total cost of transport is calculated from the following equation:
Total Cost of TransportOxygen Consumption
Swimming Speed� (3)
where oxygen consumption is in mlO 2 .kg � 1�sec� 1 and speed is in m�sec� 1 which results in a cost of transport in mlO 2. kg � 1�m� 1 . These values are usually converted to an energetic term and expressed as Joules expended per kilogram of body mass per meter traveled (J�kg� 1�m� 1 ). The conversion calculation assumes a caloric equiva-lent of 4.8 kcal per liter of oxygen consumed and a conversion factor of 4.187 10 3 J per kcal.
Comparisons of the cost of transport for a wide variety of mam-malian swimmers indicate that swimming is energetically expensive for mammals compared to fi sh. The total cost of transport for swim-ming mammals can also be divided into two distinct groups, the semi-aquatic mammals and the marine mammals ( Williams, 1999 )( Fig. 6 ). Swimming costs for semiaquatic mammals such as minks (Mustela spp.), muskrats ( Ondatra zibethicus ), and humans are 2–5 times higher than observed for marine mammals. These high energetic swimming costs are attributed to a wide variety of factors including elevated body drag associated with a surface swimming position ( Fig. 3 ) and low propulsive effi ciency associated with drag-based propulsion.
Mammals specialized for swimming demonstrate comparatively lower energetic costs. Total cost of transport in relation to body mass for swimming marine mammals ranging in size from a 21 kg California sea lion to a 15,000 kg gray whale ( Eschrichtius robustus ) is described by
Total Cost of Transport mass� �7 79 0 29. . (4)
where the cost of transport is in J�kg� 1�m� 1 and body mass is in kilo-grams. Interestingly, the style of swimming used by marine mammals
did not affect the cost of transport relationship. Species and swim-ming styles represented in this equation include sea lions using pectoral fi ns for propulsion, phocid seals using lateral undulation of paired hind fl ippers, and odontocete and mysticete whales using dorso-ventral undulation of fl ukes.
As illustrated in Fig. 6 , the energetic cost of swimming for marine mammals is greater than predicted for salmonid fi sh of similar body size. Despite specialization of the body and propulsive surfaces for aquatic locomotion, the cost of transport for swimming by seals and sea lions is 2.3–4.0 times higher than predicted for swimming fi sh. Values for ceta-ceans are somewhat lower, and range from 2.1 to 2.9 times values pre-dicted for fi sh. Differences in the total cost of transport between marine mammals and fi sh are due in part to the amount of energy expended for maintenance functions, particularly thermoregulation and the support of a high core body temperature. As endotherms, mammals expend more energy to support the production of endogenous heat than ectothermic fi sh. In addition, many marine mammals show exceptionally high meta-bolic rates while resting in water in comparison to terrestrial mammals resting in air. A consequence of these high maintenance costs is an over-all increase in the total energy expended during swimming, especially when compared to fi sh.
V. Swimming Speeds and Behavior Although body size varies considerably among marine mammals
from the 20 kg sea otter to the 122,000 kg blue whale, routine swim-ming is limited to a surprisingly narrow range of speeds. Many species
Body mass (kg)
0.1 1 10 100 1000 10,000
Tota
l cos
t of t
rans
port
(J·
kg�
1 ·m
�1 )
0.1
1
10
100
Semiaquatic mammals
Fish
Grey whale
Killer whales
Phocid sealsSea lions
Bottlenosedolphin
Figure 6 Total energetic cost of transport in relation to body mass for different classes of swimmers. Marine mammals include gray seals ( Haliochoerus grypus ) and harbor seals ( Phoca vitulina ) (fi lled circles), California sea lions ( Zalophus californianus ) (open circles), bottlenose dolphins ( Tursiops truncatus ) (triangle), killer whales ( Orcinus orca ) (squares), and a gray whale ( Eschrichtius robustus )(downward-pointing triangle). The least squares regression through the data points for marine mammals is presented in the text. This regression is compared to the regressions for swimming semiaquatic mammals (upper solid line), and the predicted regression for salmo-nid fi sh (lower solid line). From Williams (1999), with permission.

Swimming 1145
S
of marine mammal routinely swim between approximately 1.0 and 3.6 m�sec� 1 regardless of body size ( Fig. 7 ). Within this range, pinni-peds generally select slower routine traveling speeds than cetaceans, and mysticete whales swim slower than odontocetes. For example, aver-age swimming speeds for a wide variety of otariids and phocids range from 1.3 to 2.0 m�sec� 1 . The massive mysticete whales are only slightly faster; routine speeds for this group of marine mammals ranges from 2.1 to 2.6 m�sec� 1 . Although they are not the largest marine mam-mals, odontocetes tend to move the fastest during routine travel. The slowest of the odontocetes represented in Fig. 7 was the beluga whale (Delphinapterus leucas ) with a routine speed of 1.8 m�sec� 1 . In compar-ison, the killer whale ( Orcinus orca ) demonstrates the fastest routine speed of the marine mammals measured to date and averages 3.6 m.sec� 1 during casual swimming. These speeds are even more remarkable when compared to the efforts of humans. The routine speed of humans during freestyle swimming is approximately 1.0 m�sec� 1 , about the same speed as a sea otter swimming under water.
As would be expected, the sprinting speeds of marine mammals are considerably faster than routine speeds, and show much varia-tion among the species measured. Most of the information regarding sprint swimming performance in marine mammals is for cetaceans. However, the speed of adult Weddell seals ( Leptonychotes weddel-lii ) chasing fi sh beneath the Antarctic sea ice has been measured and was found to exceed 4.0 m�sec� 1 during the hunt. Among ceta-ceans, sprint speeds are even higher. The range of sprinting speeds measured for mysticete whales is 4.1–13.3 m�sec� 1 ( Fig. 7 ); sprint swimming by odontocetes is within the upper end of this range and averages 6.1–12.5 m�sec� 1 . Killer whales remain the fastest of the
odontocetes measured and can sprint at 12.5 m.sec � 1 . This is nearly six times faster than the maximum performance of human swimmers in Olympic sprint competition.
Because marine mammals must periodically surface to breathe, they are subject to high levels of drag associated with the effects of wave formation and splashing especially during high speed swim-ming. To help minimize body drag and energetic costs during these surface intervals, marine mammals have developed a number of unique behavioral strategies to accommodate breathing while swim-ming fast. Porpoising is one such highly visible behavioral strategy used by small cetaceans and some pinnipeds moving at high speed near the water surface ( Au and Weihs, 1980 ). Rather than stroke continuously, the animals leap into the air and simply avoid the ele-vated wave drag that occurs when swimming near the water surface to breathe. Theoretically, this behavior results in an energetic savings to the animal, although the cost of surface swimming versus leaping has yet to be measured. Wave-riding is another strategy that enables the swimmer to avoid the work of continuous stroking while mov-ing near the water surface. In a study involving bottlenose dolphins trained to swim freely or wave-ride next to a moving boat, investiga-tors found that heart rate, respiration rate and energetic cost were reduced for animals riding the bow wave of the boat ( Williams et al ., 1992 ). This behavior enabled the dolphins to nearly double their forward traveling speed with only a 13% increase in energetic cost. Consequently, it is not surprising that marine mammals rou-tinely ride waves generated by the wind, surf, the wake of boats and even large whales. What appears to be an amusing activity also pro-vides an energetic benefi t to the swimmer.
Sw
imm
ing
sp
eed
(m
/s)
0
2
4
6
8
10
12
14
Phocids Otariids Mysticetes Odontocetes
Wed
dell
Sea
l
Ele
phan
t Sea
lG
alap
agos
f.s.
Ant
arct
ic f.
s.
Hoo
ker s
.l.M
inke
Gre
yS
ei
Har
bor p
.
Bot
tleno
sed.
Bel
uga
Hum
an
Man-Made
AUVS
Kille
r wha
le
Fals
e k.
w.
Spot
ted
d.
Whi
te-s
ided
d.
Com
mon
d.
Blue
Bow
head
Hum
pbac
k
Bryd
e’s
Fin
Gal
apag
os s
.l..
Nor
hter
n f.s
Figure 7 Swimming speeds for marine mammals. Routine speeds of phocid seals, ota-riids, mysticetes, odontocetes, humans and autonomous underwater vehicles (AUVs) are shown by the bars. Filled circles above the bars denote the sprinting speeds recorded for each species. Note the similar range of routine speeds for these marine mammals regardless of body size.

Swimming1146
S
Although energetically advantageous when swimming near the water surface, both wave-riding and porpoising have been described for only a limited number of marine mammal species moving at high speeds. These locomotor strategies are not possible during slow tran-sit, in large marine mammals such as elephant seals ( Mirounga spp.) and whales, or in polar regions where ice covers the water surface. Instead, transit swimming is often accomplished by a sawtooth series of sequential dives that allows the animals to remain submerged except for brief surface intervals to breathe ( Davis et al ., 2001 ).
VI. The Special Case of Swimming at Depth Most of our information about swimming in marine mammals is
from animals moving near the water surface. However, the majority of swimming by these animals occurs at depth in conjunction with diving. When descending or ascending during a dive, marine mam-mals must contend with changes in buoyant forces, hydrostatic pres-sure, as well as body drag. As discussed above, drag forces resist both forward progression and limb movements of the swimmer. In con-trast, buoyant forces act in a vertical direction in the water column and result from the weight, volume, and compressibility of the tis-sues and air spaces of the animal’s body. Hydrostatic pressure results from the weight of the water column above the marine mammal.
The magnitude of buoyant forces and hydrostatic pressure on the swimming marine mammal will depend on where in the water col-umn activity takes place. Hydrostatic pressure progressively increases by 1 ATM for every 10.1 m an animal descends in the water column. This will have a profound effect on compressible spaces or tissues, and hence buoyancy of the animal, especially for marine mammals
that may descend and ascend hundreds of meters during the course of a dive. In addition, seasonal changes in blubber content, preg-nancy and lactation will have an effect on the overall buoyancy of the marine mammal.
A consequence of the interrelationships between depth, buoyancy, hydrostatic pressure and body drag is that the physical forces infl uenc-ing the animal swimming horizontally near the water surface are very different from those encountered by the diving animal moving verti-cally through the water column. Detailed studies on diving bottlenose dolphins and elephant seals have shown that the animals are positively buoyant near the water surface, and that buoyancy decreases as the animal descends during the dive. For example, the buoyancy of a bot-tlenose dolphin changes from positive when near the water surface to negative once the animal exceeds 70 m in depth ( Skrovan et al ., 1999 ).
These changes in buoyancy are associated with changes in lung com-pression due to the increase in hydrostatic pressure as marine mammals descend on a dive. Thus, as dolphins, whales and seals dive, hydrostatic pressure increases, the lungs progressively collapse with the result that overall buoyancy is changed. These marked changes in physical forces with depth affect both the locomotor behavior and energetics of the marine mammal as it descends and ascends during a dive ( Fig. 8 ).
Until recently, it was not possible to observe the swimming modes of marine mammals during deep dives. With the development of miniaturized video cameras and instrumentation worn by free-rang-ing marine mammals, new information about swimming at depth has been obtained ( Fig. 9 ). The videos revealed that bottlenose dol-phins, elephant seals, Weddell seals and blue whales switch between different modes of swimming during the dive, much like terrestrial mammals switch between gaits ( Williams et al ., 2000 ). Dive descents
0
100
200
300
400
500
0
50
100
150
200
250
300
350100 200 300 400 500 600 200 400 600 800 10000
100 200 300 400 500 60000
00
20
40
60
80
100
20
40
60
80
100
12020 40 60 80 100 120 140 160 180
Time (sec) Time (sec)
Div
e de
pth
(m)
(A) Weddell seal
(D) Bottlenose dolphin
(B) Elephant seal
(C) Blue whale
Figure 8 Swimming and gliding activity of four species of diving marine mammal. Representative deep dives are presented for the Weddell seal ( Leptonychotes weddellii ) (A),elephant seal ( Mirounga spp. ) (B), bottlenose dolphin ( Tursiops spp. ) (C), and blue whale ( Balaenoptera musculus ) (D). Each curve shows dive depth in relation to time elapsed during the dive. The color of the line corresponds to stroking (black) and gliding (red) periods. For each species the descent was characterized by prolonged periods of gliding. From Williams et al . (2000) , with permission.

Swimming 1147
S
usually began with a period of continuous stroking. Once the marine mammals reached 70–80 m in depth they changed to a passive glide for the remainder of the descent. For deep divers such as phocid seals, these gliding periods can be quite long. For example, pro-longed gliding periods exceeded 6 min for Northern elephant seals (Mirounga angustirostris ) traveling to nearly 400 m and Weddell seals descending to 540 m beneath the Antarctic sea ice. Nearly 80% of the descent of diving seals was spent passively gliding rather than actively swimming on dives exceeding 200 m in depth.
The ascent portion of a dive requires more effort by these marine mammals when compared to the descent. The beginning of the ascent represents the period of greatest swimming effort for many mammalian divers. During this period, many species of pinniped and cetacean use sequential, large amplitude strokes to begin mov-ing upward. As the ascent continues, the physical forces impacting the diver are once again altered as they move through the water col-umn. Hydrostatic pressure decreases on ascent. Consequently, the lungs are able to reinfl ate and the buoyancy of the marine mammal increases. Swimming behavior refl ects these changes with the result that the continuous stroking phase is followed by a stroke and glide mode of swimming, and fi nally a brief glide to the water surface.
An interesting contrast to the seals, dolphins, and blue whales is the right whale ( Eubalaena spp.). This species, considered the “ right ”whale to hunt because their carcasses tended to fl oat, are compara-tively buoyant. As a result, the right whale displays some of its most powerful fl uke strokes at the beginning of descent as it counteracts large positive buoyant forces at the start of a dive ( Nowacek et al ., 2001 ). The advantage of this positive buoyancy subsequently occurs during the ascent, when the animals are able to glide to the surface and reduce the number of energetically costly strokes.
By altering the mode of swimming to account for changes in the physical forces that occur during a dive, marine mammals are able to conserve limited oxygen reserves during submergence. Studies investigating the metabolic rates of Weddell seals diving from an ice hole found that the incorporation of prolonged glides enabled seals
to reduce the energetic cost of individual dives by 9–60 % ( Williams et al ., 2000, 2004 ). Such an energetic savings could make the differ-ence between completing the dive aerobically or anaerobically, and can increase the time available for hunting or avoiding predators.
In summary, these studies demonstrate that swimming can be ener-getically expensive for mammals. Marine adapted species including sea otters, pinnipeds, and cetaceans have undergone marked morpho-logical, physiological, and behavioral changes to increase their swim-ming effi ciency. An especially important adaptation that distinguishes marine mammals from semi-aquatic mammals is the ability to remain submerged for prolonged periods when swimming. However, pro-longed submergence also requires specialized physiological responses associated with oxygen loading and utilization as described in the chapter “ Diving. ” . A major benefi t of these adaptations is a capacity for aquatic performance by marine mammals that far exceeds those of semi-aquatic mammals and the best Olympic efforts of humans.
See Also the Following Articles Bow-riding ■ Diving Behavior ■ Energetics ■ Stream lining
References Acevedo-Gutierrez , A. , Croll , D. A. , and Tershy , B. R. ( 2002 ). High
feeding costs limit dive time in the largest whales . J. Exp. Biol. 205 , 1747 – 1753 .
Au , D. , and Weihs , D. ( 1980 ). At high speeds dolphins save energy by leaping . Nature 284 , 548 – 550 .
Davis , R. W. , Fuiman , L. A. , Williams , T. M. , and LeBoeuf , B. J. ( 2001 ). Three-dimensional movements and swimming activity of a northern elephant seal . Comp. Biochem. Physiol. A 129 , 759 – 770 .
Feldkamp , S. D. ( 1987 ). Forefl ipper propulsion in the California sea lion, Zalophus californianus . J. Zool. (Lond.) 212 ( 1 ) , 117 – 136 .
Fish , F. E. ( 1993 ). Infl uence of hydrodynamic design and propulsive mode on mammalian swimming energetics . Aust. J. Zool. 42 , 79 – 101 .
Goldbogen , J. A. , Calambokidis , J. , Shadwick , R. E. , Oleson , E. M. , McDonald , M. A. , and Hildebrand , J. A. ( 2006 ). Kinematics of foraging dives and lunge-feeding in fi n whales . J. Exp. Biol. 209 , 1231 – 1244 .
Hertel , H. ( 1966 ). “ Structure, Form and Movement . ” Reinhold Publishing Corporation , New York .
Nowacek , D. P. , Johnson , M. P. , Tyack , P. L. , Shorter , K. A. , McLellan , W. A. , and Pabst , D. A. ( 2001 ). Buoyant balaenids: the ups and downs of buoyancy in right whales . Proc. R. Soc. Lond. B 268 , 1811 – 1816 .
Skrovan , R. C. , Williams , T. M. , Berry , P. S. , Moore , P. W. , and Davis , R. W. ( 1999 ). The diving physiology of bottlenose dolphins ( Tursiops truncatus ) II. Biomechanics and changes in buoyancy at depth . J.Exp. Biol. 202 , 2749 – 2761 .
Williams , T. M. ( 1989 ). Swimming by sea otters: adaptations for low energetic cost locomotion . J. Comp. Physiol. A 164 , 815 – 824 .
Williams , T. M. ( 1999 ). The evolution of cost effi cient swimming in marine mammals: limits to energetic optimization . Philos. Trans. R. Soc. Lond. B 354 , 193 – 201 .
Williams , T. M. , et al . (8 authors) ( 2000 ). Sink or swim: strategies for cost-effi cient diving by marine mammals . Science 288 , 133 – 136 .
Williams , T. M. , Friedl , W. A. , Fong , M. L. , Yamada , R. M. , Sedivy , P. , and Haun , J. E. ( 1992 ). Travel at low energetic cost by swimming and wave-riding bottlenose dolphins . Nature 355 , 821 – 823 .
Williams , T. M. , Fuiman , L. A. , Horning , M. , and Davis , R. W. ( 2004 ). The cost of foraging by a marine predator, the Weddell seal Leptonychotes weddellii : pricing by the stroke . J. Exp. Biol. 207 , 973 – 982 .
Worthy, G., Innes, S., Braune, B., and Stewart, R. (1987). Rapid accli-mation of cetaceans to an open-system respirometer. In “ Approaches in Marine Mammal Energetics ” (A. Huntly, D. Costa, G. Worthy, and M. Castellini, eds.), pp. 115–126. Soc. Mar. Mammal. Special Publication 1. Society Marine Mammalogy, Lawrence.
Figure 9 A bottlenose dolphin ( Tursiops sp. ) carries a video cam-era to record its swimming movements during deep dives. (Courtesy of Kevin McDonnell.)