employer scan results - community college of...
TRANSCRIPT
Employer Scan Results For Community College Of Philadelphia January 2006
PREPARED BY:
CLARUS CORPORATION
212 Box Butte Avenue Alliance, NE 69301
308.762.2565 308.762.2836
www.claruscorporation.com
Community College of Philadelphia
Employer Scan Results
J a n u a r y 2 0 0 6

Employer Scan Results For Community College Of Philadelphia January 2006
Table Of Contents Study Design ........................................................................................................................................................... 1
Purpose.............................................................................................................................................................. 1 Research Questions ......................................................................................................................................... 1 Sampling Frame ............................................................................................................................................... 1 Reliability Estimation ...................................................................................................................................... 2 Instrument Design........................................................................................................................................... 2 Data Collection................................................................................................................................................. 3 Data Analysis .................................................................................................................................................... 3 Reporting........................................................................................................................................................... 3
Executive Summary ............................................................................................................................................... 5 Employee Availability...................................................................................................................................... 5 Employer Training Needs .............................................................................................................................. 5 Programming Needs........................................................................................................................................ 6 Relationship With Training Resources ......................................................................................................... 6 Employee Educational Participation............................................................................................................. 6 Image Analysis.................................................................................................................................................. 7
Employee Availability............................................................................................................................................ 8
Employer Training Needs ................................................................................................................................... 11
Programming Needs ............................................................................................................................................. 18
Relationships With Training Resources............................................................................................................ 21
Employee Educational Participation ................................................................................................................. 24
Image Analysis...................................................................................................................................................... 29
Business Characteristics ....................................................................................................................................... 31
Appendices ............................................................................................................................................................. 33 Appendix A. Sample Frame .......................................................................................................................A-1 Appendix B. Questionnaire ........................................................................................................................B-1 Appendix C. Tabular Results .....................................................................................................................C-1 Appendix D. Detailed Verbatim Responses ........................................................................................... D-1 Appendix E. Occupational Forecasts .......................................................................................................E-1
CLARUS CORPORATION 212 BOX BUTTE AVENUE
ALLIANCE, NE 69301 308.762.2565 308.762.2836
www.claruscorporation.com i
Employer Scan Results For Community College Of Philadelphia January 2006
Study Design Purpose Market conditions force employers to continue to change and update their technology as well as their workers’ skills. As technology changes, employers are forced to either hire employees with new skill sets or retrain current employees to remain competitive in today’s global environment. Much like the employers, community colleges that are to remain successful in today’s market must be keenly in tune to the changing needs of employers for new employees and new skill sets. The College must continue to examine their current programming for market currency and to assure that their programming meets the needs of local employers, as well as employers across the country in areas of high job demand.
To determine how Community College of Philadelphia can best meet the current and future needs of the employers in the market area, surveys were conducted with 400 of the larger employers in the market area. This report outlines the methodology for the project and summarizes the major findings of the Employer Scan.
Research Questions Specifically, the research questions for the survey of employers included:
• Whether the employers believe there is a workforce in the area that will meet their needs for qualified employees over the next few years, and if not, what skill sets they are missing
• Current and future training needs and whether those are conducted in-house or contracted out
• Definition of degrees offered on-site and need for new educational programming for employees, on-site or off-site
• Current usage of the Community College of Philadelphia and the likelihood of potential future use of the College
• Support of employee education and training
• Attitudes toward educational institutions in the market area
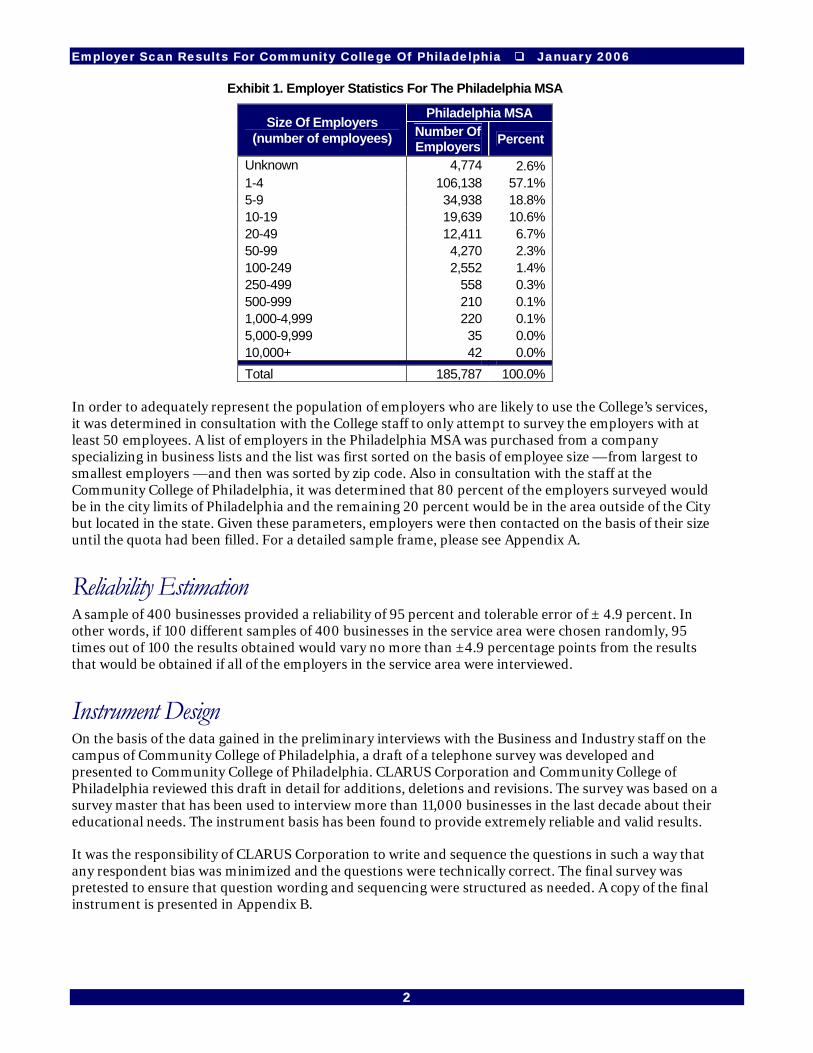
Sampling Frame The population of interest for this employer assessment was the larger employers located in the city of Philadelphia and the Philadelphia MSA (Metropolitan Statistical Area). The service area of the Community College of Philadelphia for the Business and Industry Training arm of the college is not only the city of Philadelphia, but the employers immediately outside of the City in Philadelphia’s MSA and in the state of Pennsylvania. Exhibit 1 presents the number of employers in the Philadelphia MSA (which includes those in the city of Philadelphia).
1
Employer Scan Results For Community College Of Philadelphia January 2006
Exhibit 1. Employer Statistics For The Philadelphia MSA
Philadelphia MSA Size Of Employers
(number of employees) Number Of Employers Percent
Unknown 4,774 2.6%1-4 106,138 57.1%5-9 34,938 18.8%10-19 19,639 10.6%20-49 12,411 6.7%50-99 4,270 2.3%100-249 2,552 1.4%250-499 558 0.3%500-999 210 0.1%1,000-4,999 220 0.1%5,000-9,999 35 0.0%10,000+ 42 0.0%Total 185,787 100.0%
In order to adequately represent the population of employers who are likely to use the College’s services, it was determined in consultation with the College staff to only attempt to survey the employers with at least 50 employees. A list of employers in the Philadelphia MSA was purchased from a company specializing in business lists and the list was first sorted on the basis of employee size — from largest to smallest employers — and then was sorted by zip code. Also in consultation with the staff at the Community College of Philadelphia, it was determined that 80 percent of the employers surveyed would be in the city limits of Philadelphia and the remaining 20 percent would be in the area outside of the City but located in the state. Given these parameters, employers were then contacted on the basis of their size until the quota had been filled. For a detailed sample frame, please see Appendix A.
Reliability Estimation A sample of 400 businesses provided a reliability of 95 percent and tolerable error of ± 4.9 percent. In other words, if 100 different samples of 400 businesses in the service area were chosen randomly, 95 times out of 100 the results obtained would vary no more than ±4.9 percentage points from the results that would be obtained if all of the employers in the service area were interviewed.
Instrument Design On the basis of the data gained in the preliminary interviews with the Business and Industry staff on the campus of Community College of Philadelphia, a draft of a telephone survey was developed and presented to Community College of Philadelphia. CLARUS Corporation and Community College of Philadelphia reviewed this draft in detail for additions, deletions and revisions. The survey was based on a survey master that has been used to interview more than 11,000 businesses in the last decade about their educational needs. The instrument basis has been found to provide extremely reliable and valid results.
It was the responsibility of CLARUS Corporation to write and sequence the questions in such a way that any respondent bias was minimized and the questions were technically correct. The final survey was pretested to ensure that question wording and sequencing were structured as needed. A copy of the final instrument is presented in Appendix B.
2
Employer Scan Results For Community College Of Philadelphia January 2006
Data Collection Telephone surveys were the primary method of data collection. Each telephone interview lasted approximately 15 to 20 minutes. Employers were first called, told the purpose of the survey and then asked to set a time convenient for the interview. The interviewers then called the employers back at the appointed time to complete the interview. If one of the employers refused to be interviewed, they were replaced with the next employer on the list until the quotas were filled. These interviews were conducted November 21 to December 19, 2005 by CLARUS Corporation interviewers who have previous experience in educational services interviewing with busy business owners and executives.
The interviewers conducting the telephone interviews were subjected to rigorous hiring and training procedures before making their first phone call. Before interviewing began, the interviewers went through a thorough question-by-question briefing of the questionnaire. During actual interviewing, each interviewer was monitored for one complete questionnaire and monitored randomly thereafter.
Data Analysis After the data were collected, verification of the data began. The data were examined to ensure that procedures were followed in data collection and checked for internal validity by cross-matching answers per respondent. The data were then coded for processing and analysis. SPSS (Statistical Package For The Social Sciences) was used to analyze the data and the data disks will be made available to Community College of Philadelphia for additional subset analyses. In addition, Community College of Philadelphia now has a database, formatted in Excel, which can be used for direct contact with businesses based on their stated needs.
Reporting The results of the data are organized into a graphic and narrative report, as well as detailed tabular results. This report focuses on the most meaningful findings of the research. The format used has the results summarized in a chart or graphic and pertinent comments below. The results have been cross-tabulated by the employers’ currently reported number of employees - employers with less than 100 employees and employers with 100 or more employees. The rationale for this classification was to assess whether there were any significant differences in the employers’ responses to the survey on the basis of their size. The two employer groups identified in the analysis by their number of employees and the percentage breakdown by size is presented in Exhibit 2.
3
Employer Scan Results For Community College Of Philadelphia January 2006
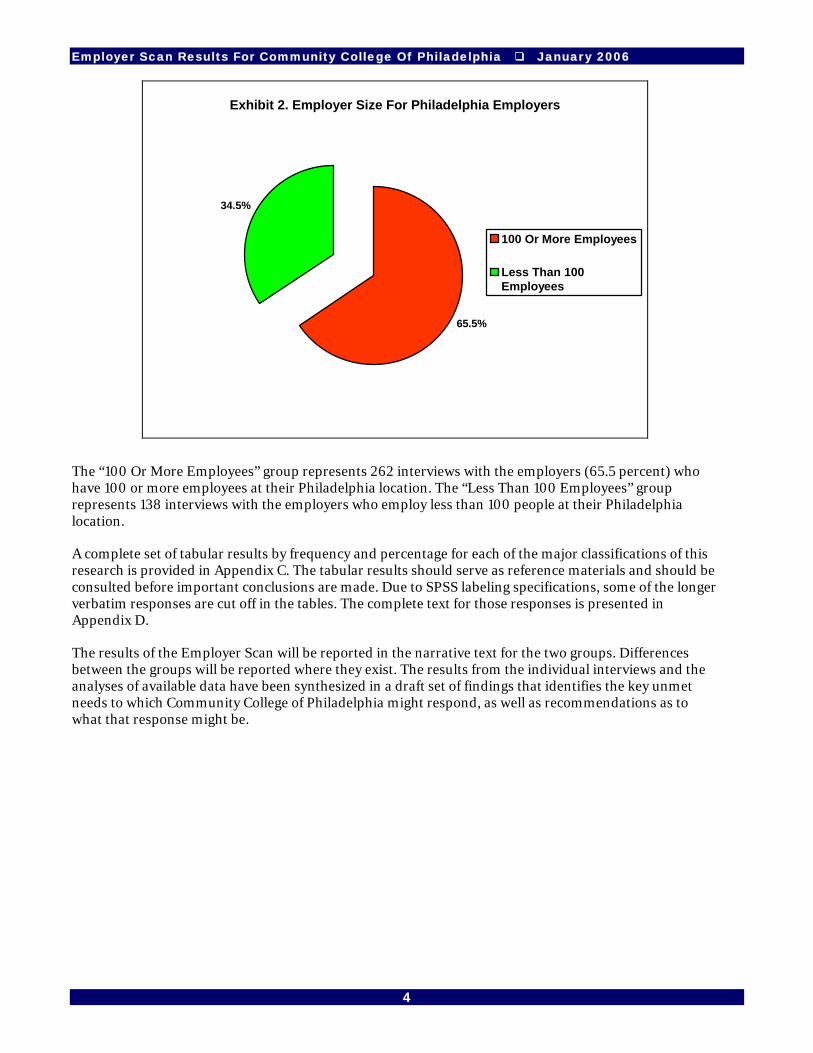
Exhibit 2. Employer Size For Philadelphia Employers
65.5%
34.5%
100 Or More Employees
Less Than 100Employees
The “100 Or More Employees” group represents 262 interviews with the employers (65.5 percent) who have 100 or more employees at their Philadelphia location. The “Less Than 100 Employees” group represents 138 interviews with the employers who employ less than 100 people at their Philadelphia location.
A complete set of tabular results by frequency and percentage for each of the major classifications of this research is provided in Appendix C. The tabular results should serve as reference materials and should be consulted before important conclusions are made. Due to SPSS labeling specifications, some of the longer verbatim responses are cut off in the tables. The complete text for those responses is presented in Appendix D.
The results of the Employer Scan will be reported in the narrative text for the two groups. Differences between the groups will be reported where they exist. The results from the individual interviews and the analyses of available data have been synthesized in a draft set of findings that identifies the key unmet needs to which Community College of Philadelphia might respond, as well as recommendations as to what that response might be.
4
Employer Scan Results For Community College Of Philadelphia January 2006
Executive Summary Employee Availability More than half of the employers in the Philadelphia market (55 percent) indicated they believe there is currently a shortage of qualified job applicants. Three-fourths of those employers noted that the shortage is due to a lack of applicants with the skill sets needed. The key areas in which employers noted that job applicants are missing skill sets include basic skills (reading, writing and math), work ethics, customer service, computers and communications.
Two-thirds of the employers are using newspaper ads to recruit employees. The larger employers are almost twice as likely as the smaller employers to use online searches and Web sites and colleges and universities to recruit employees. The smaller employers who use colleges to recruit employees are slightly more likely than the larger employees to have used the Community College of Philadelphia as a source of employees. The smaller employers are also more likely to use word of mouth and in-house signs to recruit employees. Unfortunately, the majority of the employers did not consider Community College of Philadelphia as a key source of employees. There needs to be a more active connection between the Job Placement Office at the Community College of Philadelphia and the employers in the City.
Employer Training Needs More than three-fourths of the employers in the service area conducted major training programs in-house for slightly more than 117,000 of their employees in the last year. Those training programs offered to employees in-house included safety, customer service, computers, CPR, cashiers, fire safety, infection control, orientation, management, leadership, sales, sexual harassment and supervisory training. Less than one-third of the employers paid an outside vendor to provide training for their employees. More than 38,000 employees were trained by outside vendors in the areas of management, leadership, CPR, sales, customer service, supervisory, sexual harassment, communications, first aid, diversity, electrical and alcohol training. However, the Community College of Philadelphia was not mentioned as an outside vendor used for training by the employers in the last year.
In the next year, almost one-third of the employers plan to provide training programs for more than 20,000 of their employees. Although the training areas run the gamut from specific job skills to soft skills to technical skills, the majority of the training programs planned are simply more of the programming that has been offered in the last year. Specifically, the training programs planned for employees for next year include: management, leadership, computers, customer service, diversity, safety, sales, supervisory, sexual harassment, team building, technology and time management. Almost one-fourth of the employers noted that they would consider contracting out a portion of the training in the next year. In addition, more than one-third of the employers also require employees to obtain CEU’s (continuing education units) for continued employment or licensing requirements. Given the large amount of employers in health care in the City, the major area mentioned for requirements for CEU’s is in nursing and health related fields. However, other key areas like insurance, law, education and finance require CEU’s for their employees.
The Business and Industry Division of the Community College of Philadelphia has a market opportunity as the need for soft skills training begins to once again increase in both the City and nationally. A majority of the training programs required by the employers already are offered by the Community College of Philadelphia, and the College needs to develop a catalog of their training services and programs which can be distributed to employers. In addition, the College needs to examine the curriculum areas and designate a formal program for development of CEU’s for those areas in which the College is a major provider of graduates – like nursing.
5

Employer Scan Results For Community College Of Philadelphia January 2006
Programming Needs Very few employers surveyed (less than 10 employers) are offering college courses and degrees on-site to their employees and a majority of the programs being offered are in nursing and health care. When asked if there was a need for current employees to obtain education and training, a portion of the employers in the market saw the advantage for their employees to work toward degree completion. Sixteen percent of the employers indicated a need for college courses for their current employees. Certificates were cited as needed by one-fourth of the employers and 12 percent of the employers indicated that associate degrees and bachelor’s degrees were needed for their current employees. Only 10 percent of the employers cited a need for graduate degrees for their current employees. By examining the areas in which employers reported a need for degree program, several educational ladders were found or areas in which the employers require educational opportunities for employees at all levels of the educational spectrum. Those program areas primarily included nursing, business, management, education and social services.
Almost one-fifth of the employers also noted a need for basic skills training for their current employees, specifically in the areas of ESL (English as a second language) and math. The College has an opportunity to work with employers to assist in their basic skills needs.
Relationship With Training Resources The greater the usage of an educational institution, the more likely an employer is to call the institution when an educational need arises. Only 10 percent of the employers surveyed indicated they have used the Community College of Philadelphia in the past as resource for education or training for their company’s employees. The majority of the employers who have used the College have simply sent employees to a class at the College and a few of the larger employers have contracted with the College for training for their employees. Many of the employers were simply not aware that the College could offer specialized training programs and more communication is needed with the employers to increase those awareness levels. When asked about future use of the College for education and training, a majority of the employers noted they would be likely to use the College as a source of employees (hiring graduates) and almost one-third would consider using the College for classes for employees, contracted training and would serve on an advisory committee.
Direct mail and e-mail are the two key ways mentioned by the employers for communicating with them about the programs and services offered by the College and the best way to keep them updated on new training programs being offered by the College. The Community College of Philadelphia needs to develop a contact management database for updating employers on a quarterly basis.
Employee Educational Participation The majority of the employers encourage their employees to participate in educational opportunities by offering tuition reimbursement programs. And a few of the employees eligible for the programs do participate but as noted by the employers, not as many participate as the employers would like to see. While almost two-thirds of the employers noted that they had employees taking college classes in the area, the actual numbers enrolled were small as a percentage of the total employees (less than 10 percent). Employers suggested that the Community College of Philadelphia could become more proactive in assisting them promote the tuition reimbursement programs on-site to employees. Employers typically allow use of the tuition reimbursement for credit courses, continuing education and now for online courses. There may be an opportunity for the Community College of Philadelphia to market to the employees the online courses to satisfy the continuing education requirements, as well as online degrees which offer more flexibility to employees.
6

Employer Scan Results For Community College Of Philadelphia January 2006
Image Analysis Overall, the employers in the market area have a positive image of the Community College of Philadelphia when thinking of the College as an educational provider for business needs and employee training opportunities. The characteristics attributed to community colleges by the employers included affordability, remedial and developmental skills, convenient class schedules, preparing the unemployed for work, convenient locations and career skills for the employed. Employers in the City view the Community College of Philadelphia and its programs and services as a key component of providing employees for the City – this is a market position which should be capitalized on by the College in its communications.
7
Employer Scan Results For Community College Of Philadelphia January 2006
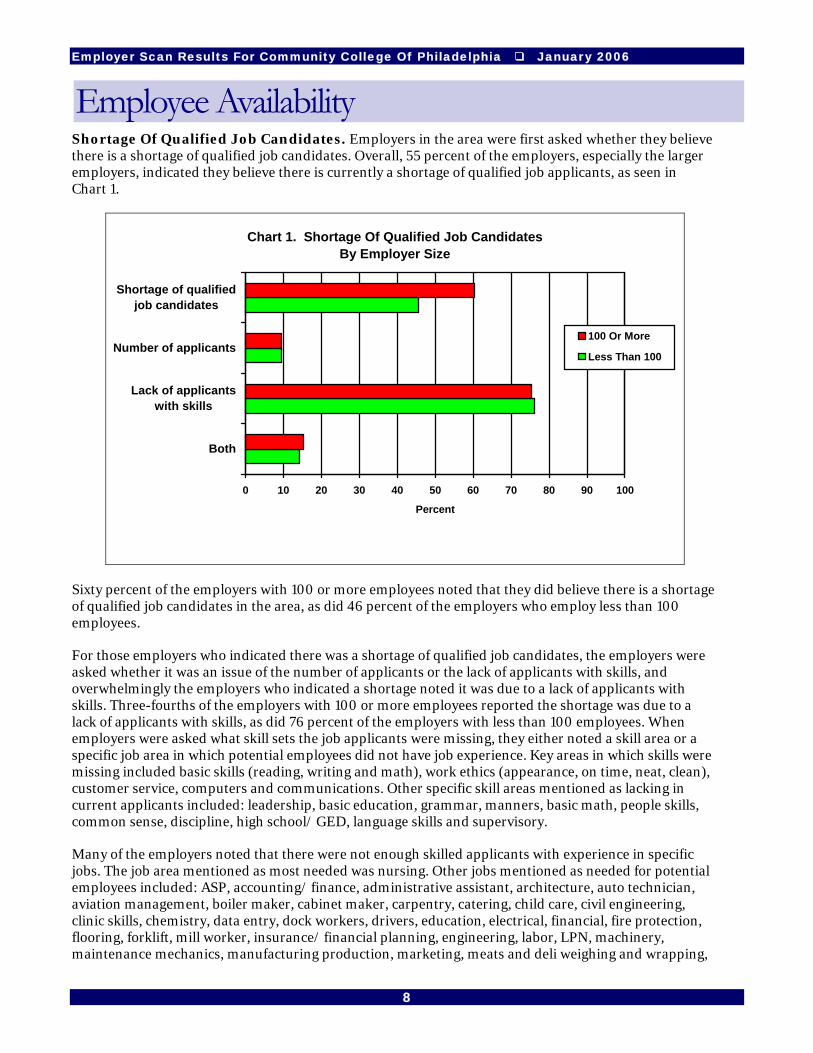
Employee Availability Shortage Of Qualified Job Candidates. Employers in the area were first asked whether they believe there is a shortage of qualified job candidates. Overall, 55 percent of the employers, especially the larger employers, indicated they believe there is currently a shortage of qualified job applicants, as seen in Chart 1.
Chart 1. Shortage Of Qualified Job Candidates By Employer Size
0 10 20 30 40 50 60 70 80 90 100
Both
Lack of applicantswith skills
Number of applicants
Shortage of qualifiedjob candidates
Percent
100 Or More
Less Than 100
Sixty percent of the employers with 100 or more employees noted that they did believe there is a shortage of qualified job candidates in the area, as did 46 percent of the employers who employ less than 100 employees.
For those employers who indicated there was a shortage of qualified job candidates, the employers were asked whether it was an issue of the number of applicants or the lack of applicants with skills, and overwhelmingly the employers who indicated a shortage noted it was due to a lack of applicants with skills. Three-fourths of the employers with 100 or more employees reported the shortage was due to a lack of applicants with skills, as did 76 percent of the employers with less than 100 employees. When employers were asked what skill sets the job applicants were missing, they either noted a skill area or a specific job area in which potential employees did not have job experience. Key areas in which skills were missing included basic skills (reading, writing and math), work ethics (appearance, on time, neat, clean), customer service, computers and communications. Other specific skill areas mentioned as lacking in current applicants included: leadership, basic education, grammar, manners, basic math, people skills, common sense, discipline, high school/ GED, language skills and supervisory.
Many of the employers noted that there were not enough skilled applicants with experience in specific jobs. The job area mentioned as most needed was nursing. Other jobs mentioned as needed for potential employees included: ASP, accounting/ finance, administrative assistant, architecture, auto technician, aviation management, boiler maker, cabinet maker, carpentry, catering, child care, civil engineering, clinic skills, chemistry, data entry, dock workers, drivers, education, electrical, financial, fire protection, flooring, forklift, mill worker, insurance/ financial planning, engineering, labor, LPN, machinery, maintenance mechanics, manufacturing production, marketing, meats and deli weighing and wrapping,
8
Employer Scan Results For Community College Of Philadelphia January 2006
mechanical, mechanics, medical, nursing, office skills, petro chemical, plumbers, receptionists, restaurant, retail, sales, social workers, speech therapists, technology skills, typist, urban skills design and warehouse.
Almost 10 percent of both the employers with 100 or more employees and those with less than 100 employees indicated that they viewed the applicant shortage as an issue of the number of applicants - they simply did not have enough applicants. Finally, there was also a group of employers who responded that the shortage of qualified job applicants was due to both a shortage of qualified applicants and a lack of applicants with skills. Fifteen percent of the employers with 100 or more employees noted this was the case, as did 14 percent of the employers with less than 100 employees.
Chart 2. Sources Used To Recruit Job Applicants By Employer Size
0 10 20 30 40 50 60 70 80 90 100
Other sources
Web site or onlinesearch
Colleges and/ oruniversities
Newspaper ads
Job serviceagency
Percent
100 Or More
Less Than 100
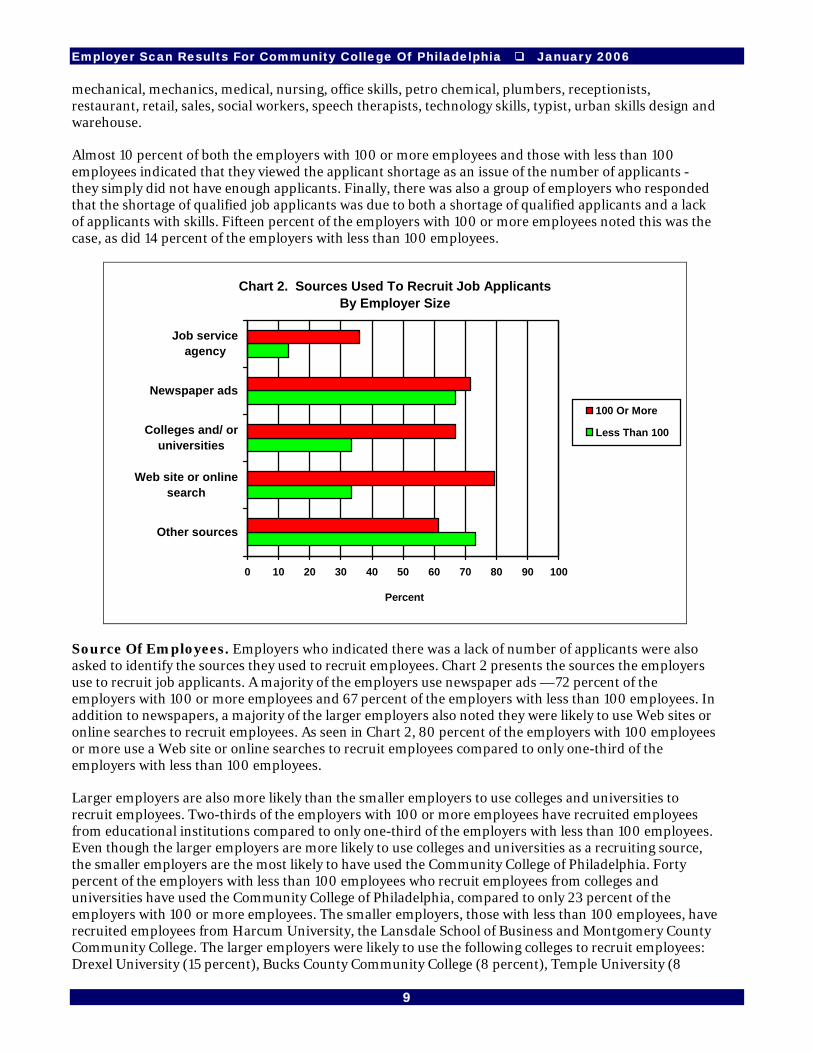
Source Of Employees. Employers who indicated there was a lack of number of applicants were also asked to identify the sources they used to recruit employees. Chart 2 presents the sources the employers use to recruit job applicants. A majority of the employers use newspaper ads — 72 percent of the employers with 100 or more employees and 67 percent of the employers with less than 100 employees. In addition to newspapers, a majority of the larger employers also noted they were likely to use Web sites or online searches to recruit employees. As seen in Chart 2, 80 percent of the employers with 100 employees or more use a Web site or online searches to recruit employees compared to only one-third of the employers with less than 100 employees.
Larger employers are also more likely than the smaller employers to use colleges and universities to recruit employees. Two-thirds of the employers with 100 or more employees have recruited employees from educational institutions compared to only one-third of the employers with less than 100 employees. Even though the larger employers are more likely to use colleges and universities as a recruiting source, the smaller employers are the most likely to have used the Community College of Philadelphia. Forty percent of the employers with less than 100 employees who recruit employees from colleges and universities have used the Community College of Philadelphia, compared to only 23 percent of the employers with 100 or more employees. The smaller employers, those with less than 100 employees, have recruited employees from Harcum University, the Lansdale School of Business and Montgomery County Community College. The larger employers were likely to use the following colleges to recruit employees: Drexel University (15 percent), Bucks County Community College (8 percent), Temple University (8
9
Employer Scan Results For Community College Of Philadelphia January 2006
percent), Abington College, Chestnut Hill University, Delaware County Community College, University of Delaware and University of Pennsylvania.
Job service agencies were used by 36 percent of the employers with 100 employees or more, but only 13 percent of the employers with less than 100 employees used them. More than 60 percent of the larger employers (those with 100 employees or more) used other sources to recruit employees, as did 73 percent of the smaller employers (those with less than 100 employees). The other sources used to recruit employees by the employers included: word of mouth, job fair, unions, walk-ins, internal/ in-house, civil service, employee referrals, high schools, in-store ads, nursing manager, postings, referrals, send letter, sign in window, statewide recruiter and temp services.
10

Employer Scan Results For Community College Of Philadelphia January 2006
Employer Training NeedsTraining By Outside Vendors. More than three-fourths of the employers have conducted major training programs for their employees in the last year and a marked difference is seen between the programs offered in-house and those who paid an outside vendor to provide the training.
Chart 3. Training Programs Offered For Employees In Last Year By Employer Size
0 10 20 30 40 50 60 70 80 90 100
Likely to contractout delivery of in-house programs
Conducted in-house
Paid an outsidevendor
Percent
100 Or More
Less Than 100
As seen in Chart 3, 34 percent of the employers with 100 or more employees and 28 percent of the employers with less than 100 employees paid an outside vendor to provide training to their employees. The larger employers trained 35,734 employees by using an outside vendor and the smaller employers trained 2,993 employees using an outside vendor. The most prevalent area in which the employers have provided training to their employees in the last 12 months by using an outside vendor included management, leadership, CPR, sales, customer service, supervisory, sexual harassment, communications, first aid, diversity, electrical and alcohol training.
Other areas in which the employers paid outside vendors to provide training to their employees in the last year included: accounting, advanced life support, advertising, air conditioning, airfield lighting maintenance, airport operations certificate, apprentice program, assessment testing, bereavement, bio-terrorism, brakes, business writing, CAD, case management skills for welfare workers, CDA, cerebral palsy, child abuse, children in successful community, CNA, coaching employees, code research, communication center certification, compliance, computer controls, computers, confidentiality, continuing education, counseling master's, creating a respectful workplace, creativity, crisis management, cultural, cultural awareness, depression in children, DeWalt tools, diagnostics, difficulty, disability topics, domestic violence, drug and alcohol counseling, EAP, editing, employment law management, engineering, equipment sales force, ESL, Excel, executive management, fall prevention, federal policies, fire safety, firefighting and first aid, first line supervision, forklift training, general management/ supervisory, GPS AutoCAD mapping, Greater Philadelphia Hotel Association, hazmat, health and safety, health care consulting issues, health care management, hearing certificate, HIPAA, HIV/ AIDS, hospice, human resources, human resources about labor laws, human services, HVAC, interior design, interpersonal management/ communications, IT classes/ MS office, job site productivity, labor relations, lean program, life skills in a placement setting, life support, liquor, listening, literacy, LPN, managing under pressure, marketing, math/ science, meal preparation and handling, mental health, Microsoft
11
Employer Scan Results For Community College Of Philadelphia January 2006
Office, new products, on-the-job training, online critical care, OSHA, Parkinson's disease, payroll, pension legislation, personal skills, personal trainer, personality orientation, phone communications, plumbing, presentations, project management, real estate, respiratory therapy, room arrangement, safety, safety technicians, safety/ forklift, serve safe, service maintenance, skilled trades, smart selling, software/ WordPerfect, Spanish, staff morale, standard soft skills, strategic staffing, stress management, successful communications, tact and finesse, teamwork, technical, technical software, TIPS alcohol training, title examination, title searching, trade courses/ plumbing and electrical, train the trainer, wound care, writing and youth development.
Employers were also asked to indicate what vendors provided the training to their employees. A complete list of the training provided by each vendor is presented in the tabular results in Appendix B, Table 2-C. Examining the list of vendors which provided training, the Community College of Philadelphia is not mentioned as a provider of training in the last year. Other colleges mentioned as providers of training for the employers in the last year included Bucks County Community College, Drexel University, Harrisburg Community College, LaSalle University, Montgomery County Community College, Penn State University, Temple University, University of Pennsylvania and Villanova University. Associations, like the American Association of Airport Executives and the Greater National Association of Work Development, also provided training for the employees of the employers surveyed. Private vendors in the city also provided training for the employers, such as Fred Pryor, Dale Carnegie, Wohr Associates and private consultants.
In-House Training Provided. Employers were most likely to provide in-house training to their employees, as seen in Chart 3. Eighty percent of the employers with 100 or more employees provided training to their employees in the last year, as did 69 percent of the employers with less than 100 employees. The major training programs offered in-house to employees in the last year included safety, customer service, computers, CPR, cashiers, fire safety, infection control, orientation, management, leadership, sales, sexual harassment and supervisory training. The employers with less than 100 employees provided in-house training for 11,919 employees in the last year and the larger employers (those with 100 or more employees) provided in-house training for 105,234 employees.
The other areas in which the employers provided training in-house in the last year for their employees included: abuse and neglect, Access, account executive/ ads, addiction, ads/ internet posting, adult CPR and first aid, advanced directive, advanced tax preparation, AED, aging, AIDS services, AIE documents, air brake quality testing, airfield lighting maintenance, airport operation certification, alcohol, alcohol awareness, Alzheimer's training, apprenticeship, arcading, assertive discipline, Associate curriculum, attorneys, back injury, bartenders, basic life support, bathroom sanitation, battery cables, behavior intervention/ modification, behavioral health topics, blood, blood borne pathogens, blueprint reading, body mechanics, boiler products, broker's class, bullying, business practices, CAD, cardiology, carpentry, case management, cashiers, catering, CDC, CEO, certified nurse's assistant training, charge entry/ accounts receivable, child protective service laws, children with stress, civil engineer program, code research, collections, communication courses/ meta messages, community center certification, competency nursing, convoy, cooks, cooperation, corporate compliance, corporate curriculum, cost complete, courier orientation, courtesy, CPA training in financial goods, CPH, CPI, first aid/ blood borne pathogens, CRC, crisis management, cultural competence, curriculum, customer service, customer service and sales, data, data management, defensive driving, dementia training, department plumbing, department training, diabetes in-service for nursing, diagnostic imaging, die setter, diesel mechanics, dietary, disaster, discipline, diversity, DNA counseling, driver training, drugs on the street, e-learning, EAP/ child development, educational technology, electrical knowledge, elite, emergency, employee compliance, employee discipline, EMT training, engineering, environmental, equipment aspect, ergonomics, ethics, executives, Famous Dave's, financial advisor development program, financial collection, fire grading, hazmat, first aid, first time supervisor, fitness training, five-day training, food safety, food service, forklift certification, front desk, front line leadership, gauge reading, GED, general office cleaning, global, government regulations, grant writing, graphics, grievance, guest relations, guest services, harassment, harassment prevention, health care consulting, health care/ all kinds of programs,
12
Employer Scan Results For Community College Of Philadelphia January 2006
health topics, Hilton Honors, HIPAA, holiday stress, housekeeping, how to do background check, how to do sales and services, how to fingerprint, how to run machines, how to test psychologically, how to train volunteers, human, human resources/ legal update, in-service/ abuse/ rights/ etc., information technology on architecture software, insurance 101/ basics of business and life insurance, integrity, interpersonal, interviewing, inventory, IT department/ computers, IV therapy, J.B. Hunt presentation, janitorial, job function, job performance, job skills, kitchen design, labor, law of contracts, lead, lead training/ environmental building certification, life saver, living wills, lockout/ tagout, logistics, LPN, machine operators/ cranes, maintenance, maintenance safety, make it happen, marketing, master security officer, medical administration, medical techniques, medical terminology, medications, membership, mental health, Microsoft/ Excel/ Office/ Word, mill training, modeling, monthly/ foreman safety policy, multilingual service customer, new AutoCAD, new clothing lines, new employee training, new hires, new policies and procedures about permanency, new software, new staff orientation, nursing, Oasis competency, office protocol, on-the-floor training, on-the-job trainings/ various for restaurant, one-on-one, ongoing, online training, opera procedure, operations, OSHA, our own vision software program, Outlook, packaging equipment, paint management, parts, patient safety fair, patrol training, pension legislation, pension planning, performance development, performance management, performance reviews, PGA training, phlebotomy, phone skills/ sales, phones, photography, plumbing, policy, policy orientation, positive approach, positive intervention, pre-retirement, presentations, preventive maintenance, procedures, processing equipment, produce knowledge, product knowledge, product management, products, progression, project management, public accounting, public speaking, punctuality, Pyxis medication system, quality management, quarterly reorientation, real estate classes, recap/ month to month pharmacy medication, recovery, recruitment, Red Cross, registration, regulated training, regulatory requirements, resident rights, resistance abuse, respect in the workplace, respiratory therapy, response training, responsible alcohol service, robot manufacturing for welding, room arrangement, rudimentary safety, rules and regulations, safety power equipment, sanitation, scheduling, Sears training for new employees, security, security officer basic training, selling for success, selling methods, sensitivity, serve safe, servers, service, service representative, signature training, Six Sigma, skilled nursing, social need, soft skills/ coaching/ interpersonal, Spanish language, specialized training, staff development and education/ in-service, stand down, star service, state case furniture, state software, stock training, stocking, stress management, stroke prevention, suicide prevention training, supporting mental health, system conversion, systems and technology, systems/ policies/ procedures, teaching job readiness, team building, teamwork, technical building, technical oil pipeline, technical skills/ auditing, technical skills/ taxes, tenant health/ online education system, textiles twisting, textiles winding, time management, TIPS alcohol training, Title VII, tool box, trade courses/ plumbing, training guidelines, two-day orientation, underwriting insurance claims, union environment, updated bank system, vending, video customers, violence in work, warehouse mechanical equipment, Web site update, wellness, wire harness, work policy and Yes You Can. In-House Programs Likely To Contract Out. Employers who provided in-house training for their employees were also asked if they would consider contracting out the delivery of any of the in-house training programs. As seen in Chart 3, only 19 percent of the employers with less than 100 employees and 15 percent of the employers with 100 or more employees would consider contracting out any of their in-house programs. The employers who would consider contracting out some of their in-house programs indicated that they would because they do not have the in-house expertise to offer the programs, they do not have the resources – time or manpower, and if they saw a cost savings opportunity. The employers who would not contract out any of their in-house training noted it would not be cost effective for them, they have in-house experts, corporate does it, not needed or we control the training ourselves.
The specific programs currently offered in-house that the employers would consider contracting out include: adult CPR and first aid, advanced directive, AIDS services, airfield lighting maintenance, airport operation certification, basic life support, behavior modification, behavioral health topics, blood, blood passage, blueprint reading, CAD, cashiers, CDC, child protective service laws, communications, community center certification, competency nursing, computers, CPA training in financial goods, CPH
13
Employer Scan Results For Community College Of Philadelphia January 2006
(social work), CPR, cultural competence, customer service, data, department training, diagnostic imaging, educational technology, fire safety, first aid, first time supervisor, food service, forklift, gauge reading, government regulations, guest relations, guest services, health care consulting, health topics, holiday stress, human, information technology on architecture software, insurance 101/ basics of business and life insurance, interviewing, IT department/ computers, job skills, lead, leadership, living wills, maintenance safety, management, membership, mental health, Microsoft Office, new policies and procedures about permanency, operating procedures, operations, orientation, packaging equipment, pension legislation, phone skills/ sales, policy orientation, pre-retirement, presentations, processing equipment, project management, public speaking, recovery, safety, sales, security, sexual harassment, soft skills, soft skills/ coaching/ interpersonal, software/ Excel/ Word, stand down, stress management, stroke prevention, supervisors, systems and technology, technical skills/ auditing, technical skills/ taxes, time management, trade courses/ plumbing, underwriting insurance claims, and work policy.
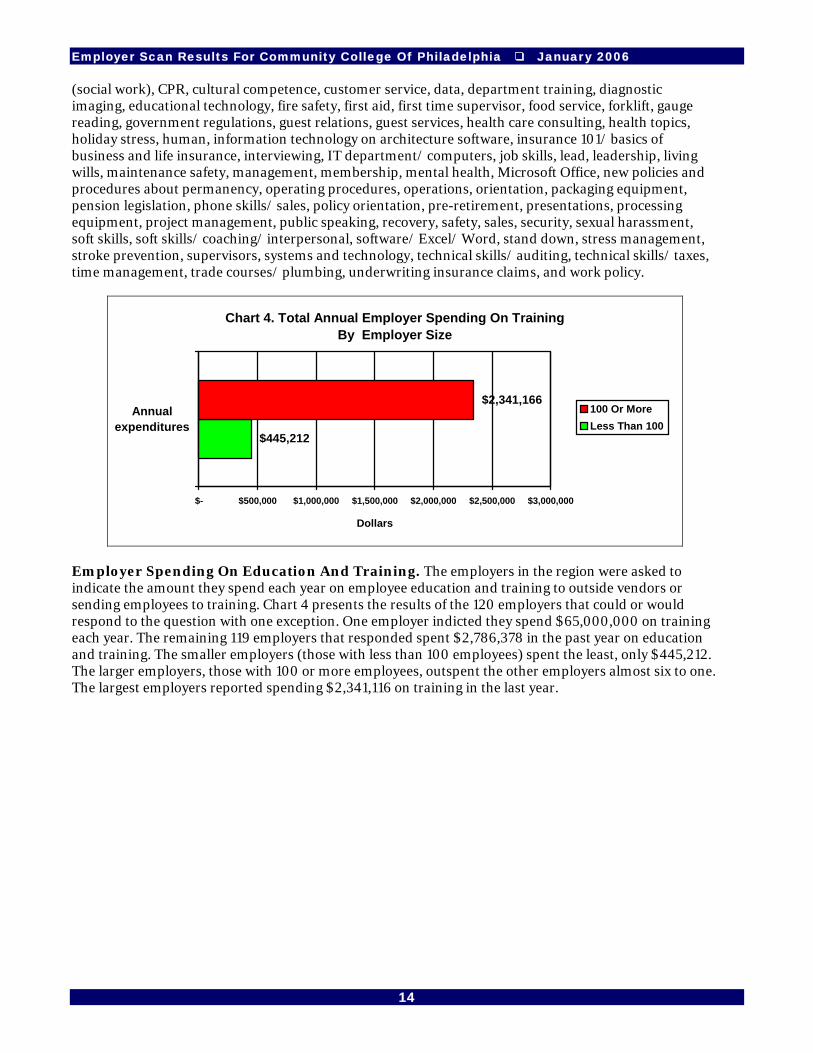
Chart 4. Total Annual Employer Spending On TrainingBy Employer Size
$445,212
$2,341,166
$- $500,000 $1,000,000 $1,500,000 $2,000,000 $2,500,000 $3,000,000
Annualexpenditures
Dollars
100 Or MoreLess Than 100
Employer Spending On Education And Training. The employers in the region were asked to indicate the amount they spend each year on employee education and training to outside vendors or sending employees to training. Chart 4 presents the results of the 120 employers that could or would respond to the question with one exception. One employer indicted they spend $65,000,000 on training each year. The remaining 119 employers that responded spent $2,786,378 in the past year on education and training. The smaller employers (those with less than 100 employees) spent the least, only $445,212. The larger employers, those with 100 or more employees, outspent the other employers almost six to one. The largest employers reported spending $2,341,116 on training in the last year.
14
Employer Scan Results For Community College Of Philadelphia January 2006
Chart 5. Future Training Programs Planned For Employees By Employer Size
0 10 20 30 40 50 60 70 80 90 100
Will contract out
None
Training programsanticipated in next
year
Percent
100 Or More
Less Than 100
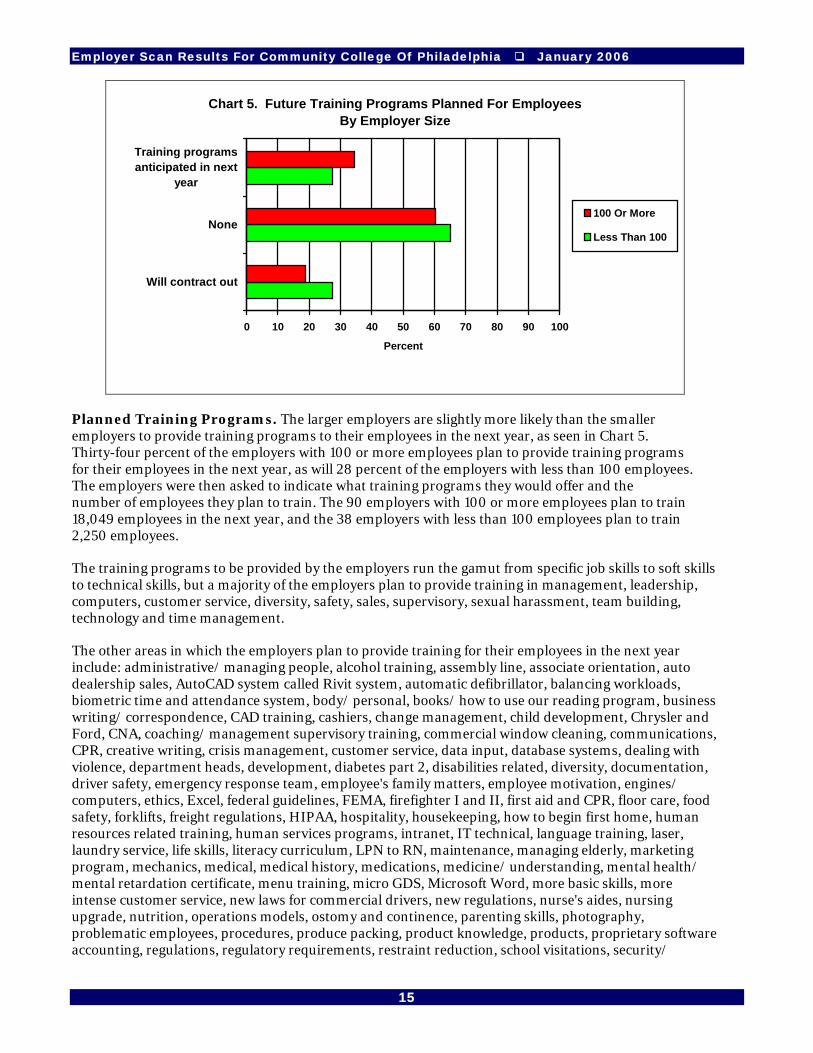
Planned Training Programs. The larger employers are slightly more likely than the smaller employers to provide training programs to their employees in the next year, as seen in Chart 5. Thirty-four percent of the employers with 100 or more employees plan to provide training programs for their employees in the next year, as will 28 percent of the employers with less than 100 employees. The employers were then asked to indicate what training programs they would offer and the number of employees they plan to train. The 90 employers with 100 or more employees plan to train 18,049 employees in the next year, and the 38 employers with less than 100 employees plan to train 2,250 employees.
The training programs to be provided by the employers run the gamut from specific job skills to soft skills to technical skills, but a majority of the employers plan to provide training in management, leadership, computers, customer service, diversity, safety, sales, supervisory, sexual harassment, team building, technology and time management.
The other areas in which the employers plan to provide training for their employees in the next year include: administrative/ managing people, alcohol training, assembly line, associate orientation, auto dealership sales, AutoCAD system called Rivit system, automatic defibrillator, balancing workloads, biometric time and attendance system, body/ personal, books/ how to use our reading program, business writing/ correspondence, CAD training, cashiers, change management, child development, Chrysler and Ford, CNA, coaching/ management supervisory training, commercial window cleaning, communications, CPR, creative writing, crisis management, customer service, data input, database systems, dealing with violence, department heads, development, diabetes part 2, disabilities related, diversity, documentation, driver safety, emergency response team, employee's family matters, employee motivation, engines/ computers, ethics, Excel, federal guidelines, FEMA, firefighter I and II, first aid and CPR, floor care, food safety, forklifts, freight regulations, HIPAA, hospitality, housekeeping, how to begin first home, human resources related training, human services programs, intranet, IT technical, language training, laser, laundry service, life skills, literacy curriculum, LPN to RN, maintenance, managing elderly, marketing program, mechanics, medical, medical history, medications, medicine/ understanding, mental health/ mental retardation certificate, menu training, micro GDS, Microsoft Word, more basic skills, more intense customer service, new laws for commercial drivers, new regulations, nurse's aides, nursing upgrade, nutrition, operations models, ostomy and continence, parenting skills, photography, problematic employees, procedures, produce packing, product knowledge, products, proprietary software accounting, regulations, regulatory requirements, restraint reduction, school visitations, security/
15
Employer Scan Results For Community College Of Philadelphia January 2006
removing the revolving door, sensitivity, services/ called warm thank you, settlement of property refinancing, sign language, soft skills, software/ Access, Spanish for health care workers, specialized training, system enhancement, system update, system updates/ computers, technology, teenage minds, temporary service training, train the trainer, training for alcohol awareness, urbanonics, use of Internet for surveys, we need a route sales program, Web site training, Word, work/ life balance, workforce program, wound care and writing.
For each topic mentioned, the employers were asked if they would provide the training in-house or if they would contract out the training. As seen in Chart 5, the employers with less than 100 employees would consider contracting out 27 percent of the training topics and the employers with 100 or more employees would consider contracting out 19 percent of the topics. The main areas in which the employers would consider contracting out training for employees include computers, CPR, customer service, leadership, management, safety, sales, sexual harassment, team building and time management. Overall the employers would consider contracting out training for 3,449 employees.
The other areas in which the employers would consider contracting out future training include: administrative managing people, alcohol training, assembly line, associate orientation, auto dealership sales, AutoCAD system called Rivit system, automatic defibrillator, balancing workloads, biometric time and attendance system, body/ personal, books/ how to use our reading program, business writing/ correspondence, CAD training, change management, child development, Chrysler and Ford, CNA, coaching/ management supervisory training, commercial window cleaning, communications, continued soft skills training, creative writing, crisis management, data input, database systems, dealing with violence, department heads, development, diabetes, diversity, diversity training, documentation, emergency response team, employee motivation, employee's family matters, engines/ computers, ethics, Excel, federal guidelines, firefighter I and II, first aid, floor care, food safety, forklifts, HIPPA, hospitality, housekeeping, how to begin first home, how to manage, human resources related training, human services programs, IT technical, language training, laser, laundry service, life skills, literacy curriculum, LPN to RN, maintenance, managing elderly, marketing program, mechanics, medical, medical history, medications, medicine/ understanding, mental health/ mental retardation certificate, menu training, micro GDS, Microsoft Word, more basic skills, more intense customer service, new laws for commercial drivers, new regulations, nurse's aides, nursing upgrade, nutrition, operations models, ostomy and continence, parenting skills, performance management, photography, problematic employees, procedures, produce packing, product knowledge, products, proprietary software accounting, registers, regulations, regulatory requirements, restraint reduction, school visitations, security/ removing the revolving door, sensitivity, services/ called warm thank you, settlement of property refinancing, sign language, software/ access, Spanish for health care workers, system enhancement, system update, technology, teenage minds, temporary service training, train the trainer, training for alcohol awareness, training managers, training that corporate determines, update computers, updated training, urbanonics, use of Internet for surveys, we need a route sales program, Web site training, Word, workforce program, work-life balance, wound care management and writing.
16
Employer Scan Results For Community College Of Philadelphia January 2006
Chart 6. Continuing Education Required For EmployeesBy Employer Size
0 10 20 30 40 50 60 70 80 90 100
Continuingeducation or CEU's
as a jobrequirement
Percent
100 Or MoreLess Than 100
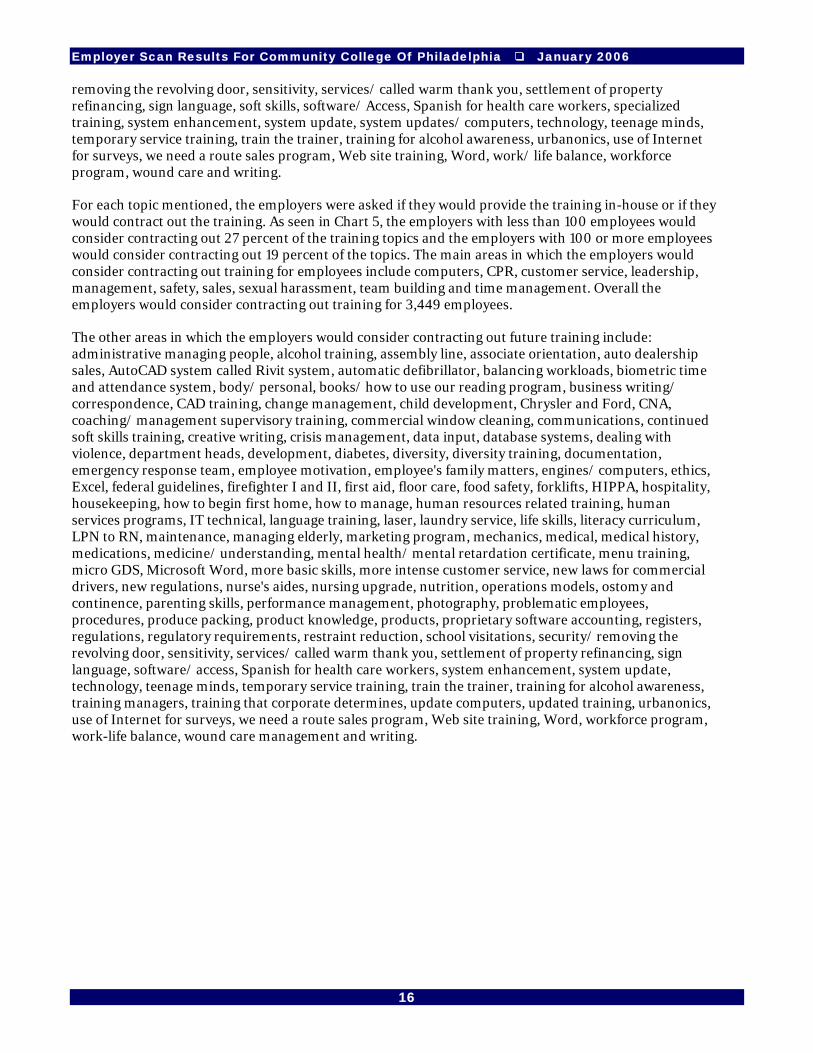
Required CEU’s. Overall, 35 percent of the employers require their employees to participate in continuing education programs or obtain CEU’s (continuing education units) as a job requirement. Employers with 100 or more employees as a resource are almost twice as likely to require their employees to participate in continuing education or obtain CEU’s, as seen in Chart 6. Forty-one percent of the employers with 100 or more employees require their employees to obtain CEU’s, compared to only 25 percent of the employers with less than 100 employees. The major area mentioned by the employers in which the employees have to obtain CEU’s is in health care (nursing).
Other areas mentioned for CEU requirements included accounting (CPA’s), administration, alcohol TIPS, architects, attorneys/ paralegals/ law, audio visual and human resources, auditing taxes, brokers, certification for forklift, certified nurse’s assistants, certified rehabilitation, chemists/ lab techs, child care license, child services, childhood development, Chrysler mechanical and sales department, clinical areas, Coast Guard documentation for advancement, communications/ executives, computer software, cooking, court reporting, customer service management, driving/ ADA, drug and alcohol/ counseling/ social work/ psychiatry, early childhood, education department, emergency services department instructors, EMS/ EMT/ firefighters, engineering, entry-level trainers and hazmat, finance/ accounting, financial planning/ licensing for life insurance agents, fitness, food servers and catering, foster parents and social workers, group exercise/ instructors/ personal trainers, health professionals/ CPR, hospitality/ tourism/ language skills, insurance, journalism and upper management, laboratory employees, lifeguard, logistics/ analysis, management, medical, nurses and administrators, physical therapists, optometric technician, pension legislation/ business skills, pharmacy and front end people/ managers and assistant managers, physical therapists/ trainers, probation officers, professional engineers and architects, psychologist/ physical therapist/ occupational therapist, PT and OT, registered nurses/ therapists, sanitation, security, social services, social work, special education, teachers and speech therapists and water treatment.
17
Employer Scan Results For Community College Of Philadelphia January 2006
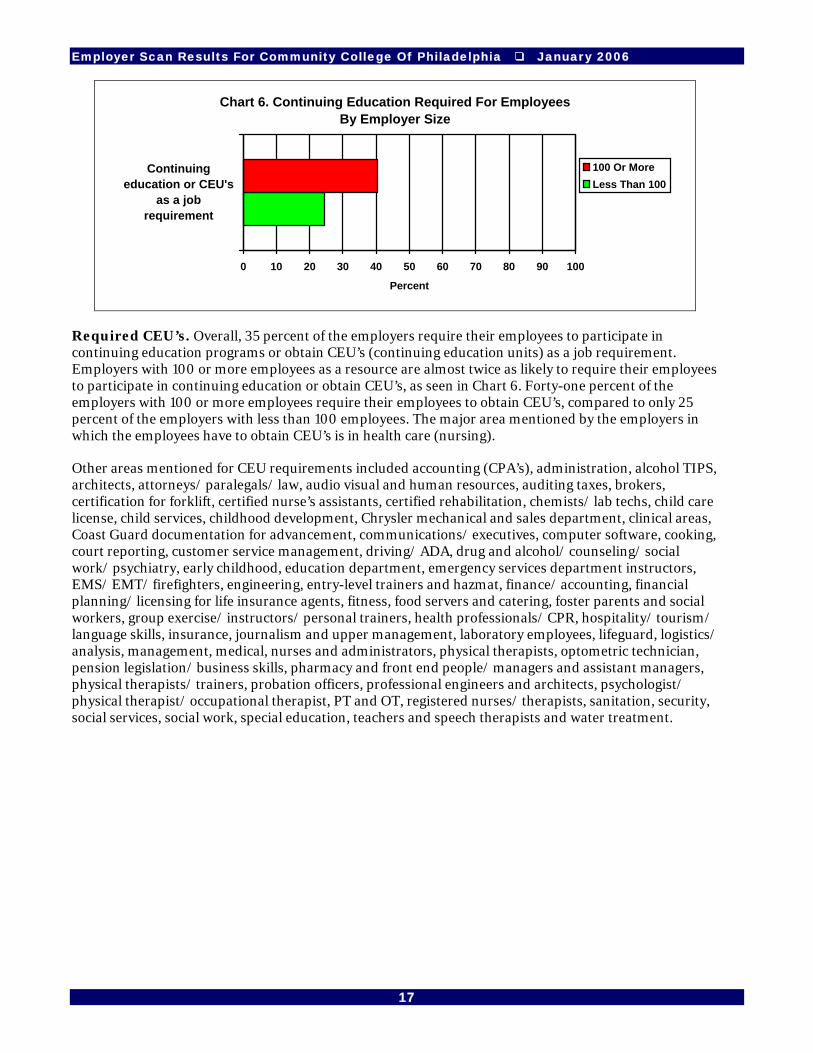
Programming Needs It is important to know what current educational opportunities employers are offering to their employees and what their future educational needs are for their employees. First, employers were asked whether they were currently offering any college courses or degrees to their employees on-site at their place of business and the results are presented in Chart 7. Second, employers were asked if they needed any educational opportunities offered to their employees that were not currently available and those results are presented in Chart 8.
Chart 7. Academic Degree Programs Currently Offered By Employers On-Site By Employer Size
0 10 20 30 40 50 60 70 80 90 100
None
College coursesand degrees
College degrees
College courses
Percent Needed
100 Or MoreLess Than 100
Academic Programs On-Site. Only three percent of the employers with 100 or more employees are offering college courses on-site at their place of business for their employees, as seen in Chart 7. The areas in which college classes are being offered on-site at the seven employers include behavioral, BSN, business, nursing BA, education course, English/ math, LPN, Master's level, nursing and RN to BSN. The Community College of Philadelphia is offering 24 percent of the college courses being offered in behavioral health, English/ math and nursing. The other educational institutions which are providing college courses to the employees on-site include Immaculata University, Montgomery County Community College and Saint Joseph's University.
Only four employers are offering college degrees to their employees at their place of business. Less than one percent of the employers with 100 or more employees and 1.4 percent of the employers with less than 100 employees are offering college degrees to their employees on-site, as seen in Chart 7. The curriculum areas in which degrees are being offered on-site include behavioral, business, dynamic leadership, education, health, Master's in counseling, Master's, nursing and RN to BSN. The Community College of Philadelphia is offering nine percent of the college degrees. Other colleges offering college degrees on-site at the employers’ place of business include Drexel University, Immaculata University, Montgomery County Community College, Philadelphia University, Rosemont, Saint Joseph's University, Strayer University and the University of Medicine and Dentistry of New Jersey.
18

Employer Scan Results For Community College Of Philadelphia January 2006
Chart 8. Programs Cited As Needed For Current EmployeesBy Employer Size
0 10 20 30 40 50 60 70 80 90 100
Graduate degrees
Bachelor's degrees
Associate degrees
Certificate programs (one year or less)
College courses
Employee basic skills training
Percent Needed
100 Or MoreLess Than 100
Employee Basic Skills. Almost one-fifth (18 percent) of the employers surveyed noted a need for training for their employees in the area of employee basic skills, as noted in Chart 8. Twenty-one percent of the employers with 100 or more employees and 13 percent of the employers with less than 100 employees indicated a need for training for current employees in basic skills. Of the 73 employers which cited a need for basic skills training for their employees, 38 of the employers (52 percent) prefer to have the training offered on-site at their business location. Twenty-four percent of the employers cited ESL (English as a Second Language) as a key basic skill for training and 16 percent noted training in math was needed. The other skill sets cited as needed as a first mention include all basics, ancillary/ nursing assistants, basic computers, basic writing, computers, direct service, English, food and nutrition, GED, in-store/ management, job skills, language, managerial/ supervisory, reading, reading and writing updates, school at work program, social workers, Spanish, support only for basics, work ethics, writing and writing e-mail.
College Courses Needed. Sixteen percent of the employers overall cited a need for college courses to be offered for their employees, as seen in Chart 8. Of those 64 employers who cited a need for college courses for their employees, 31 percent of the employers (13 employers with 100 or more employees and seven employers with less than 100 employees) prefer to have the courses offered on-site at their business location. The primary areas of interest for the college courses for the employees include nursing, business, management, engineering, social work and child care. Other key program areas as first mentions in which college courses are needed include: accounting, all areas, business finance, business writing, computers, early childhood education, EMS, English, humanitarian classes, legal and law courses, LPN, LPN to RN, health curriculum, marketing, math, nursing/ perioperative, organizational classes, social service, Spanish and writing.
Certificate Programs. Almost one-fourth of the employers with 100 or more employees reported a need for certificate programs (one year or less) for their current employees, as did 20 percent of the employers with less than 100 employees, as seen in Chart 8. Of those 93 employers who prefer to have certificate programs offered for their employees, 43 of the employers prefer to have the certificate
19
Employer Scan Results For Community College Of Philadelphia January 2006
programs offered on-site at their location (34 of the employers with 100 or more employees and 14 employers with less than 100 employees). The primary areas in which the employers cited a need for certificates include certified nurse’s assistant (nursing), business, behavioral health, food and beverage/ food handling/ safety, IT/ computers, safety and social work. Other areas cited as first mentions for needed certificates included accounting, administration, architecture, asbestos training, behavioral health, certified government programs, child and youth/ child services, Chrysler specifics, clinical, coding, CPR, critical care, customer service, data entry, diagnostic imaging, dietary, early childhood education, effective writing, electrical heavy equipment, EMS/ EMT, English, firefighting, fitness, food services, forklift, GED, health care, health center, human resources, industrial maintenance certifications, IV certificate, leadership/ management/ supervisory, medical assistants, Microsoft certified, nursing, optometric, paralegal, pharmacy tech, project management, real estate, refrigeration, resident assistant, forklift, sanitation, social work, technical and mechanical, textiles and trainers.
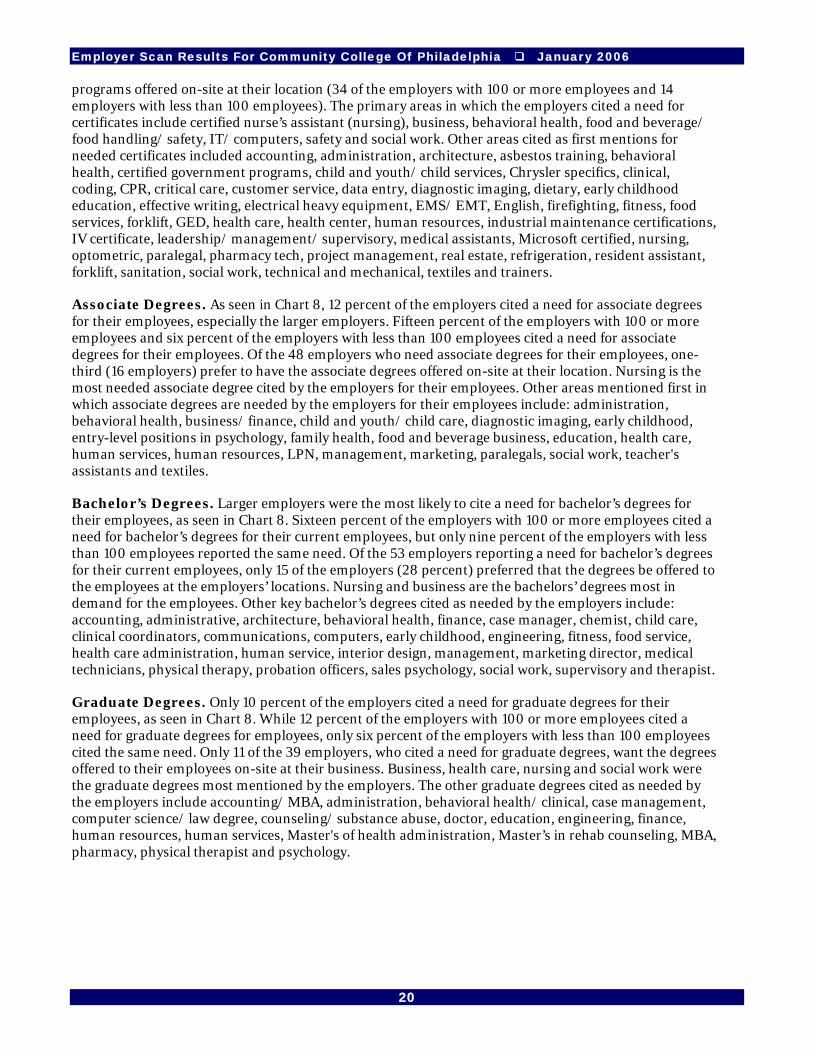
Associate Degrees. As seen in Chart 8, 12 percent of the employers cited a need for associate degrees for their employees, especially the larger employers. Fifteen percent of the employers with 100 or more employees and six percent of the employers with less than 100 employees cited a need for associate degrees for their employees. Of the 48 employers who need associate degrees for their employees, one-third (16 employers) prefer to have the associate degrees offered on-site at their location. Nursing is the most needed associate degree cited by the employers for their employees. Other areas mentioned first in which associate degrees are needed by the employers for their employees include: administration, behavioral health, business/ finance, child and youth/ child care, diagnostic imaging, early childhood, entry-level positions in psychology, family health, food and beverage business, education, health care, human services, human resources, LPN, management, marketing, paralegals, social work, teacher's assistants and textiles.
Bachelor’s Degrees. Larger employers were the most likely to cite a need for bachelor’s degrees for their employees, as seen in Chart 8. Sixteen percent of the employers with 100 or more employees cited a need for bachelor’s degrees for their current employees, but only nine percent of the employers with less than 100 employees reported the same need. Of the 53 employers reporting a need for bachelor’s degrees for their current employees, only 15 of the employers (28 percent) preferred that the degrees be offered to the employees at the employers’ locations. Nursing and business are the bachelors’ degrees most in demand for the employees. Other key bachelor’s degrees cited as needed by the employers include: accounting, administrative, architecture, behavioral health, finance, case manager, chemist, child care, clinical coordinators, communications, computers, early childhood, engineering, fitness, food service, health care administration, human service, interior design, management, marketing director, medical technicians, physical therapy, probation officers, sales psychology, social work, supervisory and therapist.
Graduate Degrees. Only 10 percent of the employers cited a need for graduate degrees for their employees, as seen in Chart 8. While 12 percent of the employers with 100 or more employees cited a need for graduate degrees for employees, only six percent of the employers with less than 100 employees cited the same need. Only 11 of the 39 employers, who cited a need for graduate degrees, want the degrees offered to their employees on-site at their business. Business, health care, nursing and social work were the graduate degrees most mentioned by the employers. The other graduate degrees cited as needed by the employers include accounting/ MBA, administration, behavioral health/ clinical, case management, computer science/ law degree, counseling/ substance abuse, doctor, education, engineering, finance, human resources, human services, Master's of health administration, Master’s in rehab counseling, MBA, pharmacy, physical therapist and psychology.
20
Employer Scan Results For Community College Of Philadelphia January 2006
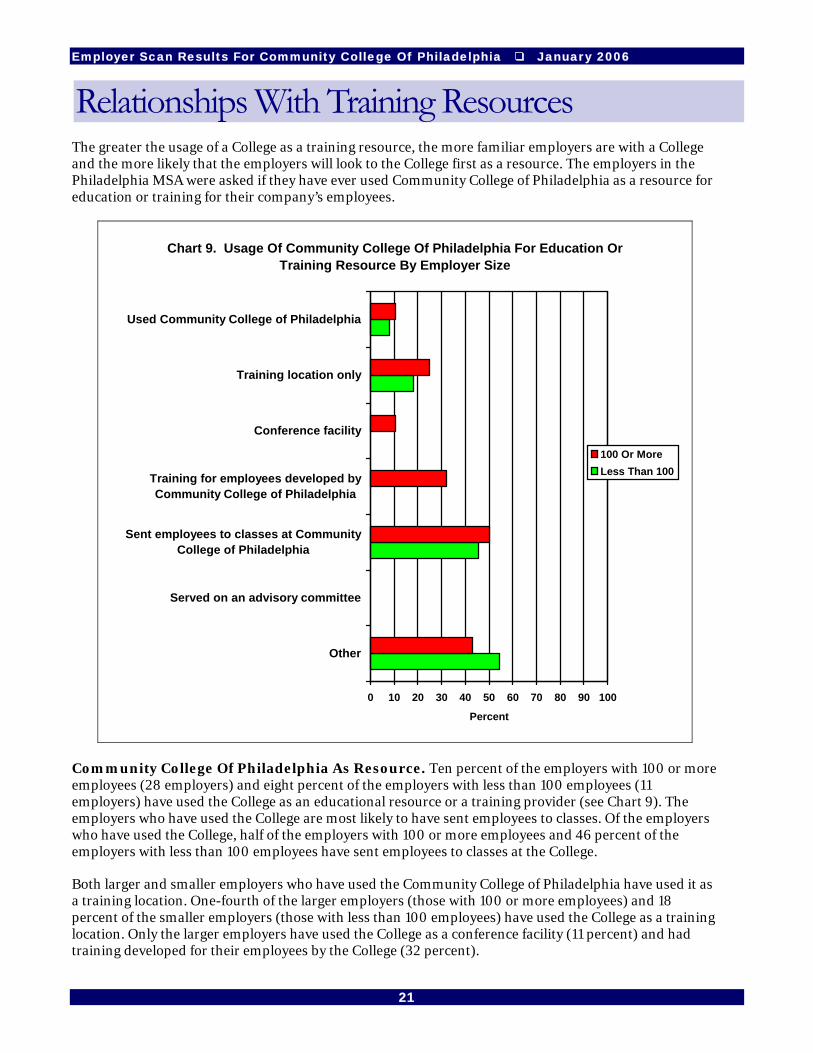
Relationships With Training Resources The greater the usage of a College as a training resource, the more familiar employers are with a College and the more likely that the employers will look to the College first as a resource. The employers in the Philadelphia MSA were asked if they have ever used Community College of Philadelphia as a resource for education or training for their company’s employees.
Chart 9. Usage Of Community College Of Philadelphia For Education Or Training Resource By Employer Size
0 10 20 30 40 50 60 70 80 90 100
Other
Served on an advisory committee
Sent employees to classes at CommunityCollege of Philadelphia
Training for employees developed byCommunity College of Philadelphia
Conference facility
Training location only
Used Community College of Philadelphia
Percent
100 Or MoreLess Than 100
Community College Of Philadelphia As Resource. Ten percent of the employers with 100 or more employees (28 employers) and eight percent of the employers with less than 100 employees (11 employers) have used the College as an educational resource or a training provider (see Chart 9). The employers who have used the College are most likely to have sent employees to classes. Of the employers who have used the College, half of the employers with 100 or more employees and 46 percent of the employers with less than 100 employees have sent employees to classes at the College.
Both larger and smaller employers who have used the Community College of Philadelphia have used it as a training location. One-fourth of the larger employers (those with 100 or more employees) and 18 percent of the smaller employers (those with less than 100 employees) have used the College as a training location. Only the larger employers have used the College as a conference facility (11 percent) and had training developed for their employees by the College (32 percent).
21

Employer Scan Results For Community College Of Philadelphia January 2006
None of the employers surveyed has served on an advisory committee for the Community College of Philadelphia. But of those who have used the College, 43 percent of the employers with 100 or more employees and 54 percent of those with less than 100 employees did cite other uses of the College. Those uses included assistance with nursing program, emissions licenses, employees elected to do DNA class, employees went there on their own, English as a second language, for temporaries to fill in, hire interns, hired people from Community College of Philadelphia, internships, job fair, new hires, off-site language, on-site LPN to RN, posted positions there, recruiting, they came and provided courses here and Web net program.
The 341 employers who responded they had not used the services of the Community College of Philadelphia were asked why. Key reasons cited for not using the Community College of Philadelphia included: services were not needed, corporate provides the training for employees and the company trains in-house. Other reasons cited for not using Community College of Philadelphia included: don’t know about them, they do not offer what we need, never came up, another provider used and not aware of it or what is offered.
Chart 10. Likelihood Of Using Community College Of Philadelphia In Future By Employer Size
0 10 20 30 40 50 60 70 80 90 100
Other
Source of employees (hiring graduates)
Serving on an advisory committee
Community College of Philadelphiaproviding college degree programs on-
site at your business
Community College of Philadelphiaproviding college credit courses on-site at
your business
Sending employees to credit classes atCommunity College of Philadelphia
Training for employees developed byCommunity College of Philadelphia
Conference facility
Training location
Percent Likely
100 Or MoreLess Than 100
22

Employer Scan Results For Community College Of Philadelphia January 2006
Future Usage Of Community College of Philadelphia. The majority of the employers see the best future use of the Community College of Philadelphia as a source of employees. As seen in Chart 10, 80 percent of the employers with 100 or more employees and 73 percent of those employers with less than 100 employees are likely to use the Community College of Philadelphia as a source of employees and hire its graduates. Slightly more than one-third (36 percent) of the employers with 100 or more employees would be likely to send employees to college credit classes at the Community College of Philadelphia, as would 30 percent of the employers with less than 100 employees.
One-third of the employers with 100 or more employees would be likely to either serve on an advisory committee or have an employee serve on an advisory committee for the Community College of Philadelphia. Twenty-eight percent of the employers with less than 100 employees would be likely to serve or have an employee serve on an advisory committee for the College. Both the larger and the smaller employers would be likely to use the Community College of Philadelphia as a training location in the future – 30 percent of the employers with 100 or more employees and 29 percent of the employers with less than 100 employees.
Twenty seven percent of the employers, regardless of number of employees, would be likely to have the Community College of Philadelphia develop training programs for their employees. Only 18 percent of the larger employers (with 100 or more employees) and 16 percent of the smaller employers (less than 100 employees) would be likely to use the Community College of Philadelphia as a conference facility. Less than one-fifth of the employers (16 percent of the larger employers and 15 percent of the smaller employers) would be likely to have the Community College of Philadelphia provide college degree programs on-site for their employees. Slightly more than seven percent of the employers would be likely to use the Community College of Philadelphia for another use, specifically for internships, job fairs or for job postings. Other suggested uses of the Community College of Philadelphia by the employers included campus recruiting, center or satellite closer to us, class teaching techniques/ truck and auto mechanics, client/ advanced education, clients go there, come to open house meeting here, contact person for posting, course for beginning managers/ trade staff to supervision, ESL and computer classes, food service program, future employees, locations, offer law school classes at Northeast Campus, post notices to get employees, prepare for a four-year college, research for information, source for summer employees, special purpose seminars, suggest they pursue a relationship with local union 274, training for skills for adolescents, we're looking at recruitment at the time and work through Philly school district/ food service management.
Preferred Method of Receiving Training Information. The employers in the Philadelphia MSA and the city were asked what would be the best methods of keeping them informed of the training programs offered by the Community College of Philadelphia. The employers noted that mailings (45 percent) and e-mail (41 percent) were the best methods for keeping them informed about upcoming programs and trainings. Slightly more than half (52 percent) of the employers with less than 100 employees preferred mailings, as did 42 percent of the employers with 100 or more employees. The larger employers were more likely to prefer using e-mail, with 46 percent of the employers with 100 or more employees preferring e-mail, compared to only 30 percent of the employers with less than 100 employees.
Twenty-nine percent of the employers prefer to receive information about the Community College of Philadelphia on a quarterly basis, and 20 percent indicated that monthly updates would be sufficient. Another group of employers would like updates as new programming is developed and available. The key is to provide information to the employers regularly, while still updating them in a consistent and timely manner when new programming is developed.
23
Employer Scan Results For Community College Of Philadelphia January 2006
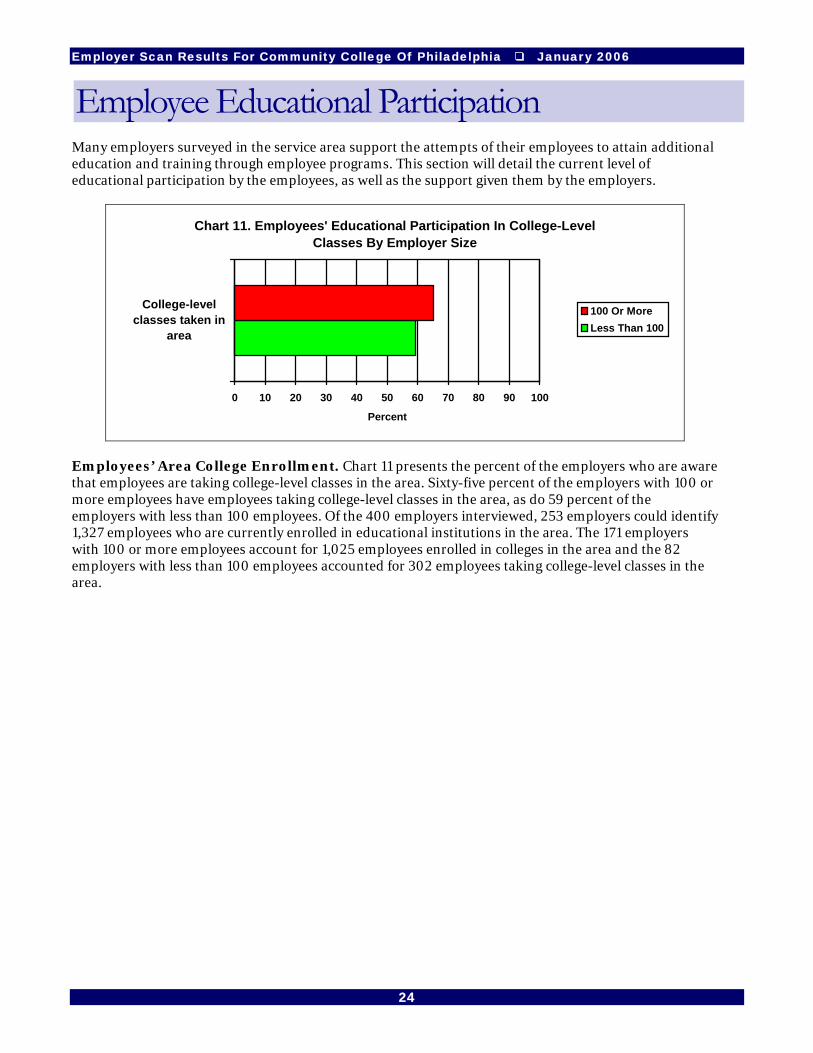
Employee Educational Participation Many employers surveyed in the service area support the attempts of their employees to attain additional education and training through employee programs. This section will detail the current level of educational participation by the employees, as well as the support given them by the employers.
Chart 11. Employees' Educational Participation In College-Level Classes By Employer Size
0 10 20 30 40 50 60 70 80 90 100
College-levelclasses taken in
area
Percent
100 Or MoreLess Than 100
Employees’ Area College Enrollment. Chart 11 presents the percent of the employers who are aware that employees are taking college-level classes in the area. Sixty-five percent of the employers with 100 or more employees have employees taking college-level classes in the area, as do 59 percent of the employers with less than 100 employees. Of the 400 employers interviewed, 253 employers could identify 1,327 employees who are currently enrolled in educational institutions in the area. The 171 employers with 100 or more employees account for 1,025 employees enrolled in colleges in the area and the 82 employers with less than 100 employees accounted for 302 employees taking college-level classes in the area.
24
Employer Scan Results For Community College Of Philadelphia January 2006
Chart 12. Employees' Enrollment In Area Colleges By Employer SIze
9
1
72
3
2
3
9
2
9
24
4
84
0
0
41
8
167
15
23
23
13
46
15
30
86
121
10
10
0 50 100 150 200
Villanova University
University of Pennsylvania
Temple University
Saint Joseph's University
Penn State
Peirce College
Montgomery County Community College
LaSalle University
Holy Family University
Drexel University
Delaware County Community College
Community College of Philadelphia
Cabrini University
Avington Hospital
Number Of Employees Enrolled
100 Or MoreLess Than 100
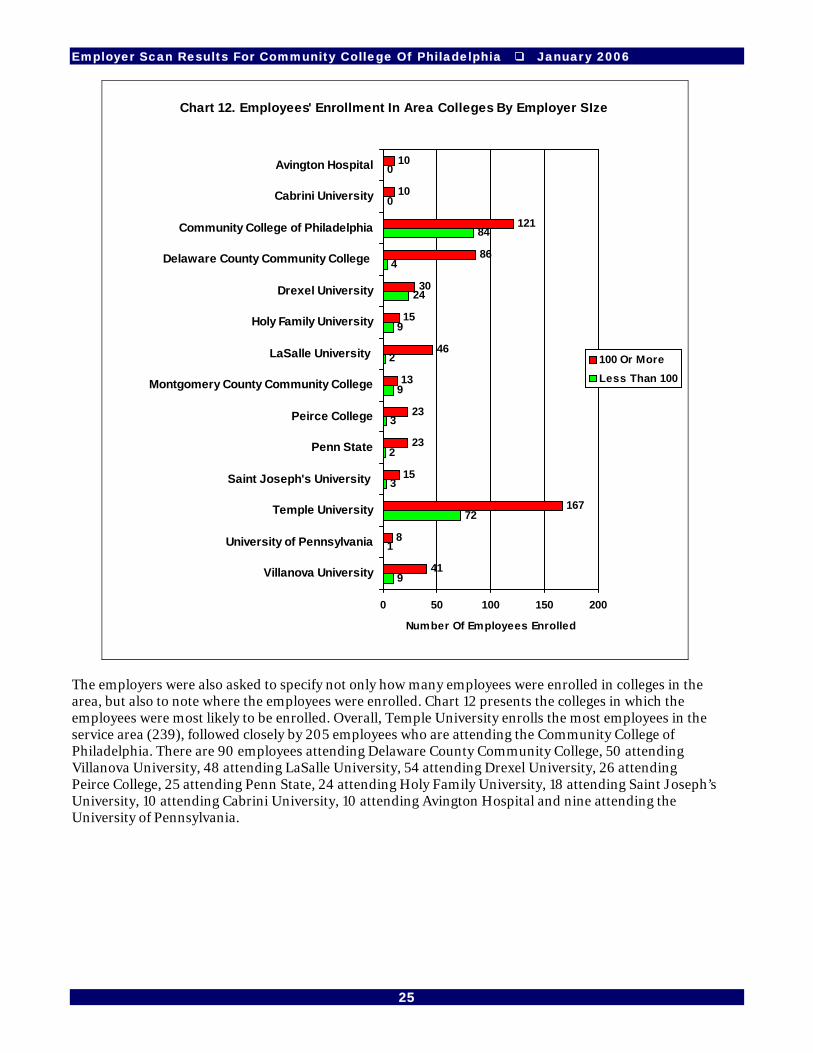
The employers were also asked to specify not only how many employees were enrolled in colleges in the area, but also to note where the employees were enrolled. Chart 12 presents the colleges in which the employees were most likely to be enrolled. Overall, Temple University enrolls the most employees in the service area (239), followed closely by 205 employees who are attending the Community College of Philadelphia. There are 90 employees attending Delaware County Community College, 50 attending Villanova University, 48 attending LaSalle University, 54 attending Drexel University, 26 attending Peirce College, 25 attending Penn State, 24 attending Holy Family University, 18 attending Saint Joseph’s University, 10 attending Cabrini University, 10 attending Avington Hospital and nine attending the University of Pennsylvania.
25
Employer Scan Results For Community College Of Philadelphia January 2006
Chart 13. Tuition Reimbursement Offered To Current Employees By Employer Size
0 10 20 30 40 50 60 70 80 90 100
Percentage ofemployees
participating
Offer tuitionreimbursement
Percent
100 Or MoreLess Than 100
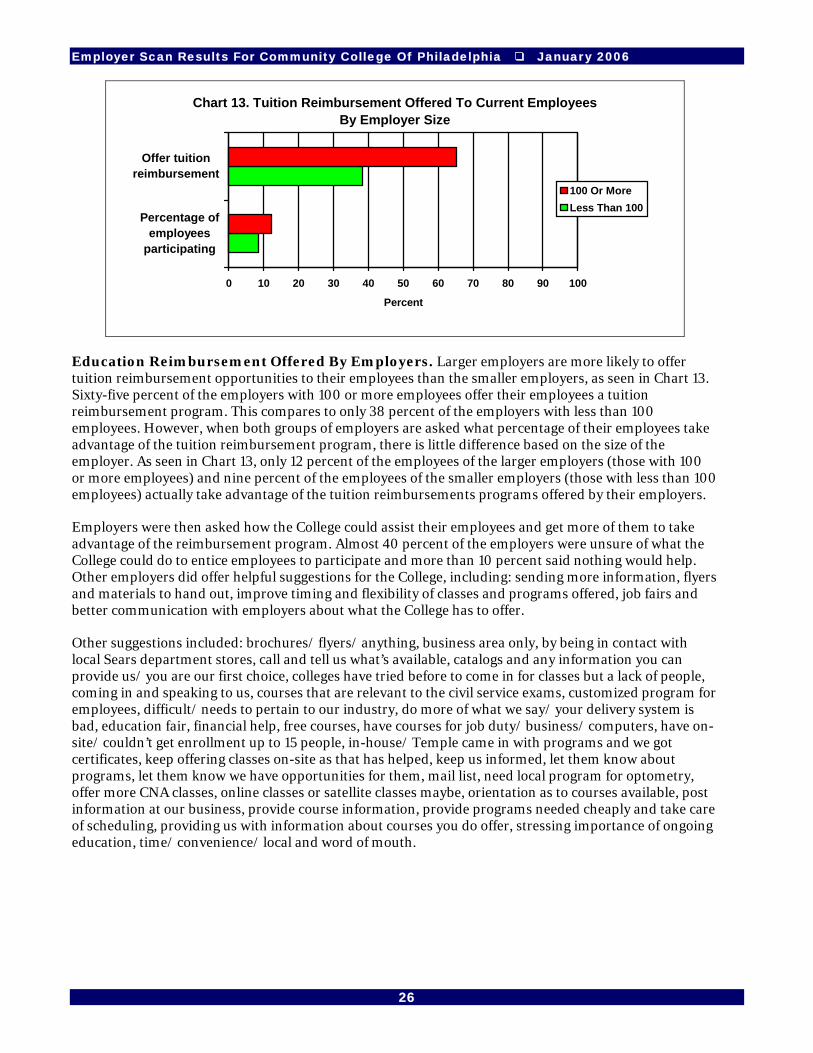
Education Reimbursement Offered By Employers. Larger employers are more likely to offer tuition reimbursement opportunities to their employees than the smaller employers, as seen in Chart 13. Sixty-five percent of the employers with 100 or more employees offer their employees a tuition reimbursement program. This compares to only 38 percent of the employers with less than 100 employees. However, when both groups of employers are asked what percentage of their employees take advantage of the tuition reimbursement program, there is little difference based on the size of the employer. As seen in Chart 13, only 12 percent of the employees of the larger employers (those with 100 or more employees) and nine percent of the employees of the smaller employers (those with less than 100 employees) actually take advantage of the tuition reimbursements programs offered by their employers.
Employers were then asked how the College could assist their employees and get more of them to take advantage of the reimbursement program. Almost 40 percent of the employers were unsure of what the College could do to entice employees to participate and more than 10 percent said nothing would help. Other employers did offer helpful suggestions for the College, including: sending more information, flyers and materials to hand out, improve timing and flexibility of classes and programs offered, job fairs and better communication with employers about what the College has to offer.
Other suggestions included: brochures/ flyers/ anything, business area only, by being in contact with local Sears department stores, call and tell us what’s available, catalogs and any information you can provide us/ you are our first choice, colleges have tried before to come in for classes but a lack of people, coming in and speaking to us, courses that are relevant to the civil service exams, customized program for employees, difficult/ needs to pertain to our industry, do more of what we say/ your delivery system is bad, education fair, financial help, free courses, have courses for job duty/ business/ computers, have on-site/ couldn’t get enrollment up to 15 people, in-house/ Temple came in with programs and we got certificates, keep offering classes on-site as that has helped, keep us informed, let them know about programs, let them know we have opportunities for them, mail list, need local program for optometry, offer more CNA classes, online classes or satellite classes maybe, orientation as to courses available, post information at our business, provide course information, provide programs needed cheaply and take care of scheduling, providing us with information about courses you do offer, stressing importance of ongoing education, time/ convenience/ local and word of mouth.
26

Employer Scan Results For Community College Of Philadelphia January 2006
Chart 14. Permitted Employee Uses Of Tuition Reimbursement Funds By Employer Size
0 10 20 30 40 50 60 70 80 90 100
Online courses
Books
Fees
Continuingeducation
Credit classes orcollege degrees
Percent
100 Or More
Less Than 100
As seen in Chart 14, 92 percent of the employers with 100 or more employees who offer tuition reimbursement allow employees to use the reimbursement for credit classes or college degrees, as do 91 percent of the employers with less than 100 employees. While 86 percent of the employers with 100 or more employees allow employees to use the reimbursement for continuing education, 96 percent of the employers with less than 100 employees allow use of it to fund continuing education. Smaller employers (those with less than 100 employees) are more likely to allow employees to use tuition reimbursement for fees (72 percent), books (58 percent) and online courses (66 percent). Only 44 percent of the larger employers (those with 100 or more employees) allow employees to use tuition reimbursement for fees, 35 percent allow its use for books and 67 percent allow its use for online classes.
Chart 15. Timing Of Tuition Reimbursement Payment By Employer Size
0 10 20 30 40 50 60 70 80 90 100
Other
Up front
Upon completion
Percent
100 Or MoreLess Than 100
For the employees taking advantage of the tuition reimbursement offered by the employers, more than three-fourths are reimbursed upon completion (82 percent of the employers with 100 or more employees
27
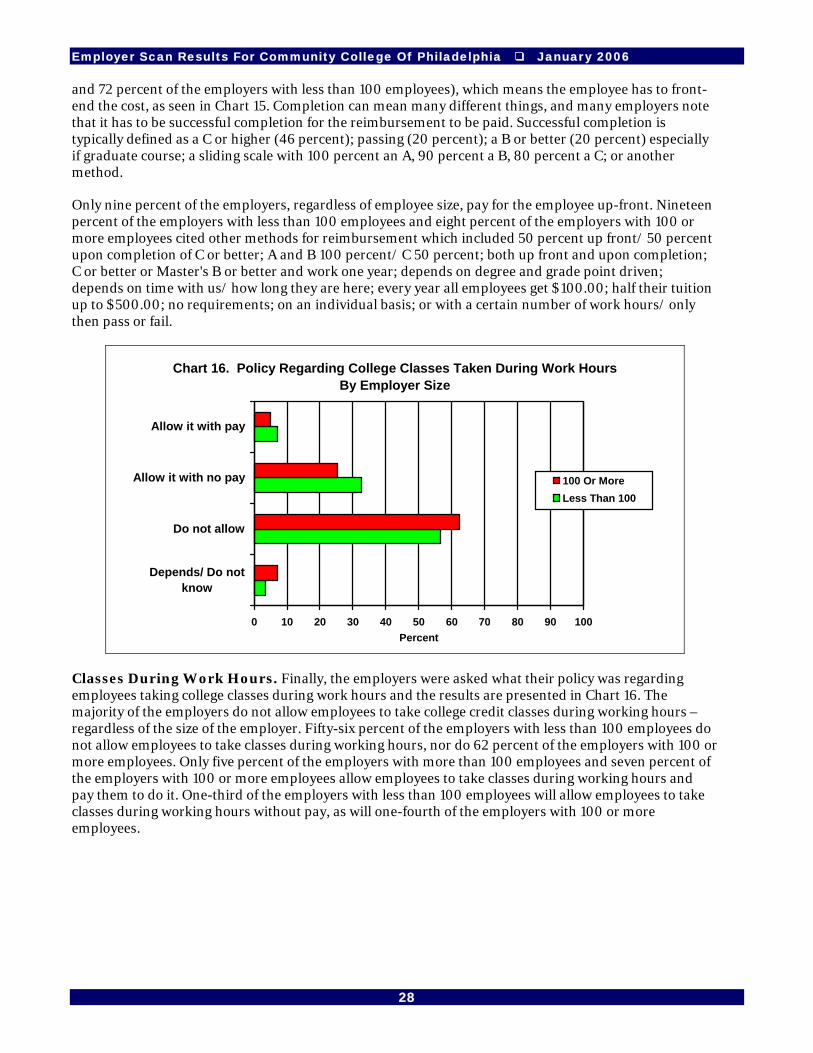
Employer Scan Results For Community College Of Philadelphia January 2006
and 72 percent of the employers with less than 100 employees), which means the employee has to front-end the cost, as seen in Chart 15. Completion can mean many different things, and many employers note that it has to be successful completion for the reimbursement to be paid. Successful completion is typically defined as a C or higher (46 percent); passing (20 percent); a B or better (20 percent) especially if graduate course; a sliding scale with 100 percent an A, 90 percent a B, 80 percent a C; or another method.
Only nine percent of the employers, regardless of employee size, pay for the employee up-front. Nineteen percent of the employers with less than 100 employees and eight percent of the employers with 100 or more employees cited other methods for reimbursement which included 50 percent up front/ 50 percent upon completion of C or better; A and B 100 percent/ C 50 percent; both up front and upon completion; C or better or Master's B or better and work one year; depends on degree and grade point driven; depends on time with us/ how long they are here; every year all employees get $100.00; half their tuition up to $500.00; no requirements; on an individual basis; or with a certain number of work hours/ only then pass or fail.
Chart 16. Policy Regarding College Classes Taken During Work Hours By Employer Size
0 10 20 30 40 50 60 70 80 90 100
Depends/ Do notknow
Do not allow
Allow it with no pay
Allow it with pay
Percent
100 Or MoreLess Than 100
Classes During Work Hours. Finally, the employers were asked what their policy was regarding employees taking college classes during work hours and the results are presented in Chart 16. The majority of the employers do not allow employees to take college credit classes during working hours – regardless of the size of the employer. Fifty-six percent of the employers with less than 100 employees do not allow employees to take classes during working hours, nor do 62 percent of the employers with 100 or more employees. Only five percent of the employers with more than 100 employees and seven percent of the employers with 100 or more employees allow employees to take classes during working hours and pay them to do it. One-third of the employers with less than 100 employees will allow employees to take classes during working hours without pay, as will one-fourth of the employers with 100 or more employees.
28
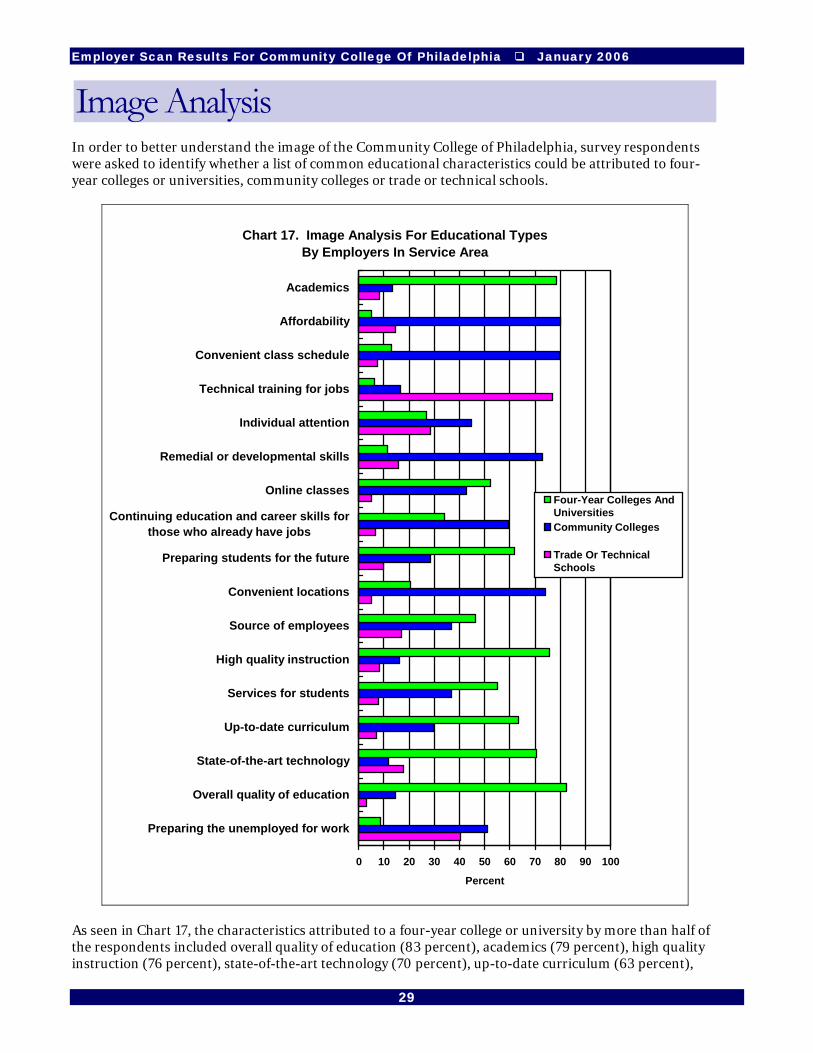
Employer Scan Results For Community College Of Philadelphia January 2006
Image Analysis In order to better understand the image of the Community College of Philadelphia, survey respondents were asked to identify whether a list of common educational characteristics could be attributed to four-year colleges or universities, community colleges or trade or technical schools.
Chart 17. Image Analysis For Educational Types By Employers In Service Area
0 10 20 30 40 50 60 70 80 90 100
Preparing the unemployed for work
Overall quality of education
State-of-the-art technology
Up-to-date curriculum
Services for students
High quality instruction
Source of employees
Convenient locations
Preparing students for the future
Continuing education and career skills forthose who already have jobs
Online classes
Remedial or developmental skills
Individual attention
Technical training for jobs
Convenient class schedule
Affordability
Academics
Percent
Four-Year Colleges AndUniversitiesCommunity Colleges
Trade Or TechnicalSchools
As seen in Chart 17, the characteristics attributed to a four-year college or university by more than half of the respondents included overall quality of education (83 percent), academics (79 percent), high quality instruction (76 percent), state-of-the-art technology (70 percent), up-to-date curriculum (63 percent),
29
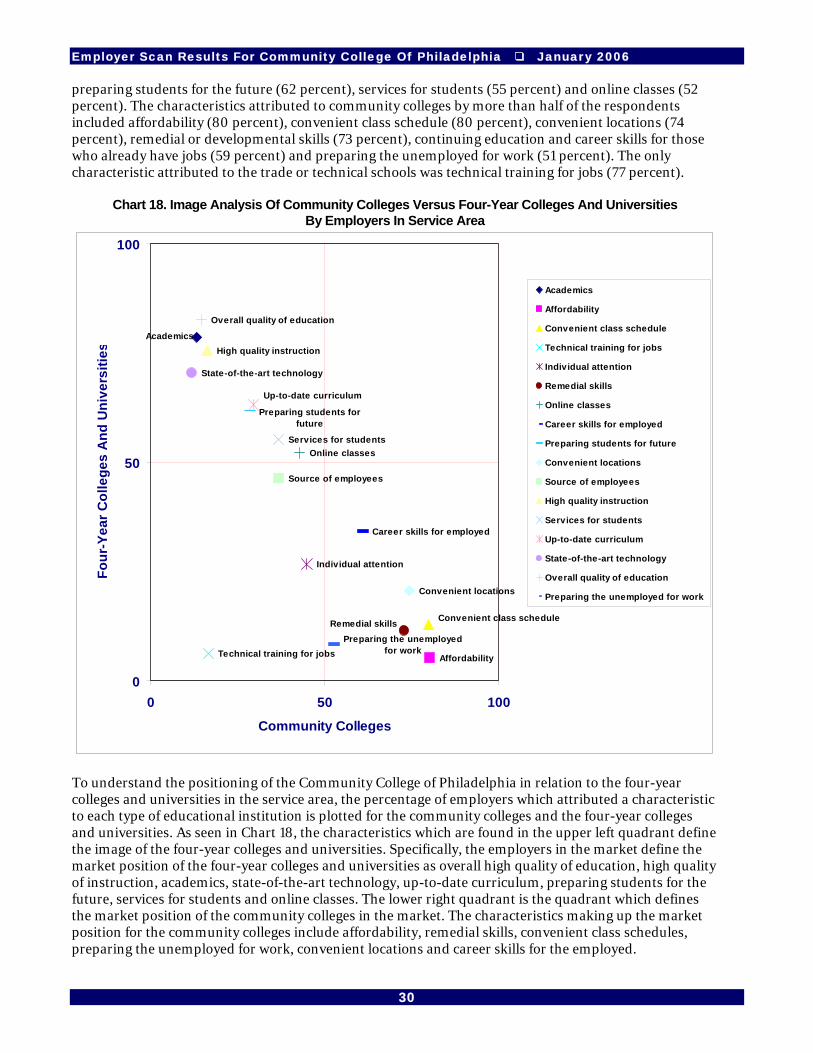
Employer Scan Results For Community College Of Philadelphia January 2006
preparing students for the future (62 percent), services for students (55 percent) and online classes (52 percent). The characteristics attributed to community colleges by more than half of the respondents included affordability (80 percent), convenient class schedule (80 percent), convenient locations (74 percent), remedial or developmental skills (73 percent), continuing education and career skills for those who already have jobs (59 percent) and preparing the unemployed for work (51 percent). The only characteristic attributed to the trade or technical schools was technical training for jobs (77 percent).
Chart 18. Image Analysis Of Community Colleges Versus Four-Year Colleges And Universities By Employers In Service Area
Affordability
Individual attention
Online classes
Career skills for employed
Convenient locations
Source of employees
High quality instruction
Services for students
State-of-the-art technology
Overall quality of education
Preparing the unemployed for work
Academics
Convenient class schedule
Technical training for jobs
Remedial skills
Preparing students for future
Up-to-date curriculum
0
50
100
0 50 100
Community Colleges
Four
-Yea
r Col
lege
s A
nd U
nive
rsiti
es
Academics
Affordability
Convenient class schedule
Technical training for jobs
Individual attention
Remedial skills
Online classes
Career skills for employed
Preparing students for future
Convenient locations
Source of employees
High quality instruction
Services for students
Up-to-date curriculum
State-of-the-art technology
Overall quality of education
Preparing the unemployed for work
To understand the positioning of the Community College of Philadelphia in relation to the four-year colleges and universities in the service area, the percentage of employers which attributed a characteristic to each type of educational institution is plotted for the community colleges and the four-year colleges and universities. As seen in Chart 18, the characteristics which are found in the upper left quadrant define the image of the four-year colleges and universities. Specifically, the employers in the market define the market position of the four-year colleges and universities as overall high quality of education, high quality of instruction, academics, state-of-the-art technology, up-to-date curriculum, preparing students for the future, services for students and online classes. The lower right quadrant is the quadrant which defines the market position of the community colleges in the market. The characteristics making up the market position for the community colleges include affordability, remedial skills, convenient class schedules, preparing the unemployed for work, convenient locations and career skills for the employed.
30
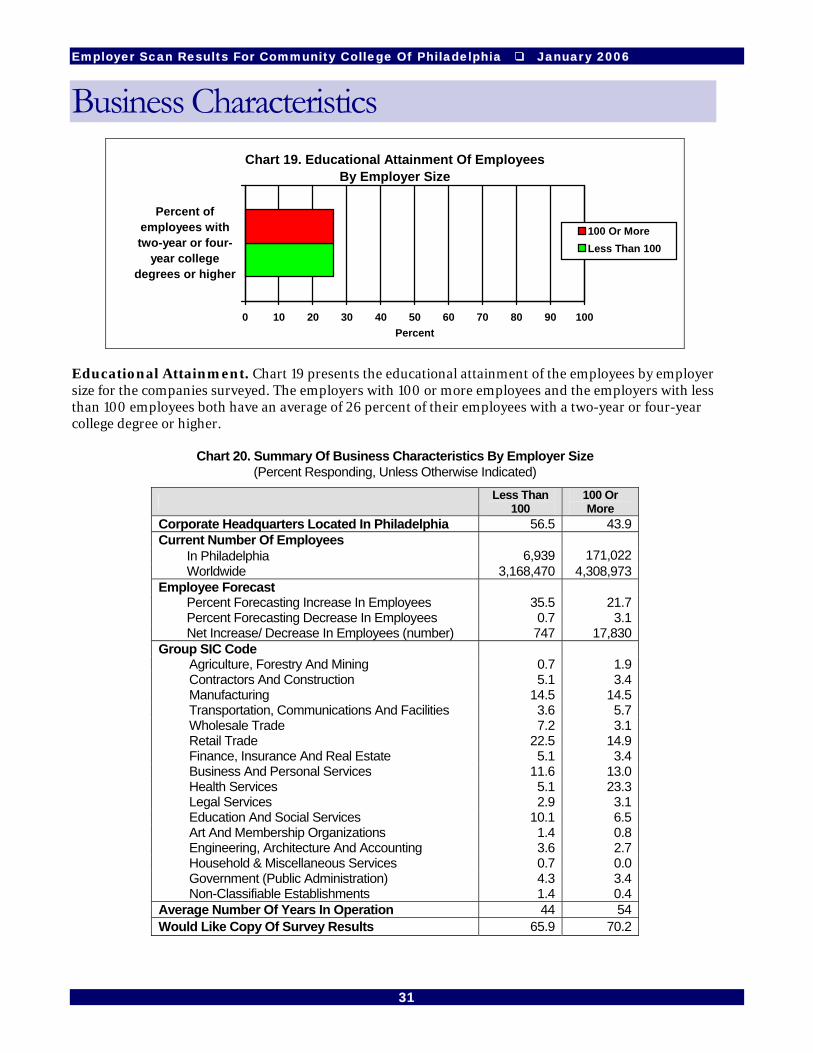
Employer Scan Results For Community College Of Philadelphia January 2006
Business Characteristics Chart 19. Educational Attainment Of Employees
By Employer Size
0 10 20 30 40 50 60 70 80 90 100
Percent ofemployees withtwo-year or four-
year collegedegrees or higher
Percent
100 Or MoreLess Than 100
Educational Attainment. Chart 19 presents the educational attainment of the employees by employer size for the companies surveyed. The employers with 100 or more employees and the employers with less than 100 employees both have an average of 26 percent of their employees with a two-year or four-year college degree or higher.
Chart 20. Summary Of Business Characteristics By Employer Size (Percent Responding, Unless Otherwise Indicated)
Less Than 100
100 Or More
Corporate Headquarters Located In Philadelphia 56.5 43.9 Current Number Of Employees In Philadelphia 6,939 171,022 Worldwide 3,168,470 4,308,973 Employee Forecast Percent Forecasting Increase In Employees 35.5 21.7 Percent Forecasting Decrease In Employees 0.7 3.1 Net Increase/ Decrease In Employees (number) 747 17,830 Group SIC Code Agriculture, Forestry And Mining 0.7 1.9 Contractors And Construction 5.1 3.4 Manufacturing 14.5 14.5 Transportation, Communications And Facilities 3.6 5.7 Wholesale Trade 7.2 3.1 Retail Trade 22.5 14.9 Finance, Insurance And Real Estate 5.1 3.4 Business And Personal Services 11.6 13.0 Health Services 5.1 23.3 Legal Services 2.9 3.1 Education And Social Services 10.1 6.5 Art And Membership Organizations 1.4 0.8 Engineering, Architecture And Accounting 3.6 2.7 Household & Miscellaneous Services 0.7 0.0 Government (Public Administration) 4.3 3.4 Non-Classifiable Establishments 1.4 0.4 Average Number Of Years In Operation 44 54 Would Like Copy Of Survey Results 65.9 70.2
31
Employer Scan Results For Community College Of Philadelphia January 2006
Business Characteristics. More than half (56 percent) of the employers with less than 100 employees have their corporate headquarters in Philadelphia, compared to 44 percent of the employers with 100 or more employees, as seen in Chart 20. The employers with less than 100 employees account for 6,939 employees in Philadelphia and more than 3.1 million employees worldwide. The employers with 100 or more employees account for 171,022 employees in Philadelphia and 4.3 million employees worldwide. Thirty-five percent of the employers with less than 100 employees forecast an increase in employment in the next year and less than one percent forecasts a decrease, which will result in a net increase of 747 new employees. Only 22 percent of the larger employers, those with 100 or more employees, forecast an increase in employment and three percent forecast a decrease in employment; the increase will result in a net gain of 17,830 employees.
While 14.5 percent of the employers were manufacturers, differences did exist in the business classification by the size of the employer, as seen in Chart 20. Slightly more than one-fifth of the employers with less than 100 employees were in retail, 12 percent were business and personal services, 10 percent were education and social services, and five percent were either health services, contractors and construction or finance, insurance and real estate. Of the larger employers, those with 100 or more employees, 23 percent were health services, 15 percent retail trade, 13 percent business and personal services, six percent education and social services, six percent transportation, communications and facilities. All areas of the SIC grouping were represented but several areas, like agriculture, forestry and mining, wholesale trade, art and membership organizations, engineering, architecture and accounting, household & miscellaneous services and government (public administration) had a smaller representation, as would be expected in the City.
Overall, the employers have been in business for more than 44 years. The average length of operation for the employers with 100 or more employees is 54 years and for the employers with less than 100 employees the average years of operation are 44 years. Two-thirds of the employers with less than 100 employees would like a summarized copy of the survey, as would 70 percent of the employers with 100 or more employees. This provides the College a perfect opportunity to provide feedback to the employers who responded to the survey.
32

Employer Scan Results For Community College Of Philadelphia January 2006
Appendices
33

Employer Scan Results For Community College Of Philadelphia January 2006
Appendix A. Sample Frame
A-1
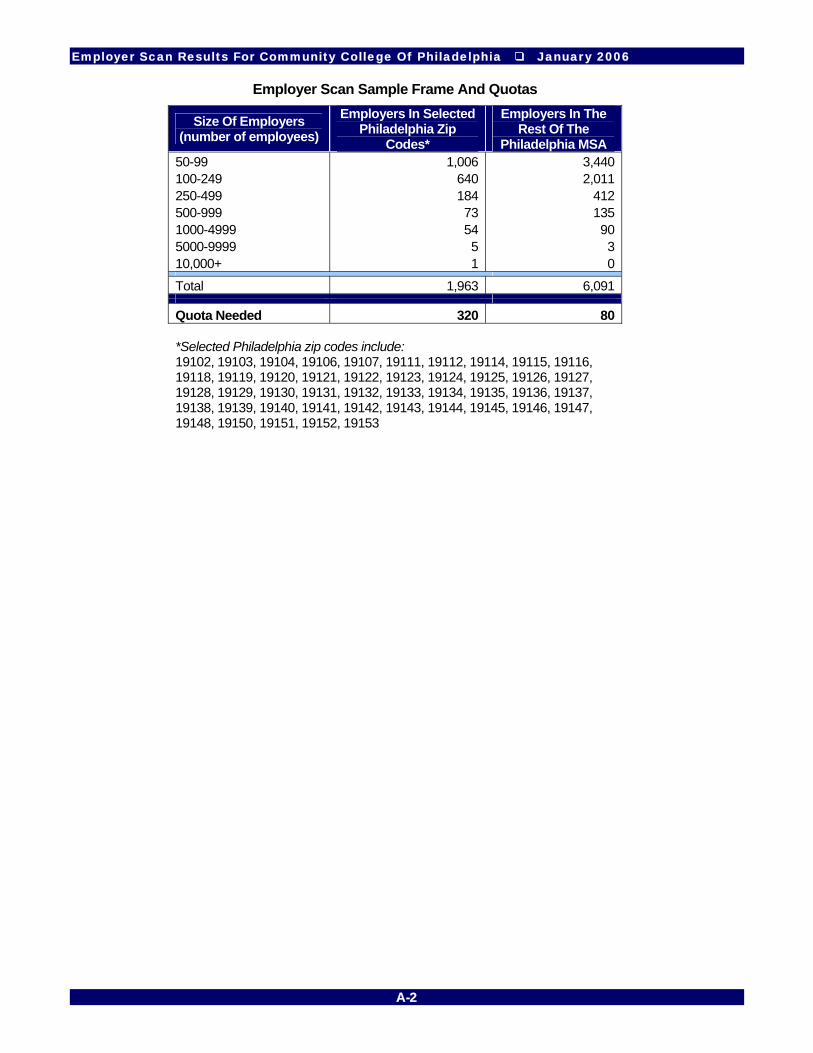
Employer Scan Results For Community College Of Philadelphia January 2006
Employer Scan Sample Frame And Quotas
Size Of Employers (number of employees)
Employers In Selected Philadelphia Zip
Codes*
Employers In The Rest Of The
Philadelphia MSA 50-99 1,006 3,440 100-249 640 2,011 250-499 184 412 500-999 73 135 1000-4999 54 90 5000-9999 5 3 10,000+ 1 0
Total 1,963 6,091
Quota Needed 320 80 *Selected Philadelphia zip codes include: 19102, 19103, 19104, 19106, 19107, 19111, 19112, 19114, 19115, 19116, 19118, 19119, 19120, 19121, 19122, 19123, 19124, 19125, 19126, 19127, 19128, 19129, 19130, 19131, 19132, 19133, 19134, 19135, 19136, 19137, 19138, 19139, 19140, 19141, 19142, 19143, 19144, 19145, 19146, 19147, 19148, 19150, 19151, 19152, 19153
A-2

Employer Scan Results For Community College Of Philadelphia January 2006
Appendix B. Questionnaire
B-1

Employer Scan Results For Community College Of Philadelphia January 2006
Appendix C. Tabular Results
C-1

Employer Scan Results For Community College Of Philadelphia January 2006
Appendix D. Detailed Verbatim Responses
D-1

Employer Scan Results For Community College Of Philadelphia January 2006
Appendix E. Occupational Forecasts
E-1