employee engagement, satisfaction, and business-unit-level ... · employee engagement,...
TRANSCRIPT

1
Employee Engagement, Satisfaction, and Business-Unit-Level Outcomes:
A Meta-Analysis
Prepared by
James K. Harter, Ph.D. The Gallup Organization
Frank L. Schmidt, Ph.D. University of Iowa
Emily A. Killham The Gallup Organization
THE GALLUP ORGANIZATION 1001 Gallup Drive Omaha, NE 68102
July 2003

1
COPYRIGHT STANDARDS This document contains proprietary research, copyrighted materials, and literary property of The Gallup Organization. It is not to be copied, quoted, published, or divulged to others outside of your organization. Gallup® and Q12® are trademarks of The Gallup Organization, Princeton, NJ. All other trademarks are the property of their respective owners. This document is of great value to both your organization and The Gallup Organization. Accordingly, international and domestic laws and penalties guaranteeing patent, copyright, trademark, and trade secret protection protect the ideas, concepts, and recommendations related within this document. No changes may be made to this document without the express written permission of The Gallup Organization.
Copyright © 2003 The Gallup Organization, Princeton, NJ. All rights reserved.

2
TABLE OF CONTENTS
SECTION Page Introduction..................................................................................................1 Background Behind the GWA.....................................................................4 Meta-Analysis ..............................................................................................9 Hypothesis and Study Characteristics .......................................................10 Meta-Analytic Methods Used....................................................................15 Results ........................................................................................................22 Overall Satisfaction and Composite “Employee Engagement” ................34 Utility Analysis: Practicality of the Effects ...............................................40 Discussion..................................................................................................44 References..................................................................................................47 Appendices.................................................................................................52
Copyright © 2003 The Gallup Organization, Princeton, NJ. All rights reserved.

3
The authors thank the numerous Gallup researchers who contributed research studies, data sets,
and their various forms of expertise to studies that have been included in this meta-analysis.
In particular, we thank Jim Asplund for conducting and submitting numerous studies. We also
thank Donald O. Clifton for his pioneering work in positive psychology and development of Q12.
Copyright © 2003 The Gallup Organization, Princeton, NJ. All rights reserved.

1
Introduction The quality of an organization’s human resources is perhaps the leading indicator of its growth
and sustainability. The attainment of a workplace with high-caliber employees starts with the
selection of the right people for the right jobs. Numerous studies have documented the utility of
valid selection instruments and systems in the selection of the right people (Hunter & Schmidt,
1983; Huselid, 1995; Schmidt, Hunter, McKenzie, & Muldrow, 1979; Schmidt & Rader, 1999).
After employees have been selected, they make decisions and take actions every day that impact
the success of their organizations. Many of these decisions and actions are influenced by their
own internal motivations and drives. One can also hypothesize that the way employees are
treated and the way they treat one another can positively affect their actions — or can place their
organizations at risk. For example, researchers have found positive relationships between general
workplace attitudes and service intentions, customer perceptions (Schmit & Allscheid, 1995),
and individual performance outcomes (Iaffaldano & Muchinsky, 1985). An updated meta-
analysis has revealed a substantial relationship between individual job satisfaction and individual
performance (Judge, Thoresen, Bono, & Patton, 2001). Questions about the direction of causality
in relationships between job satisfaction and performance have not been completely resolved,
however. To date, the vast majority of job satisfaction research and subsequent meta-analyses
have collected and studied data at the individual employee level.
There is also evidence at the workgroup or business-unit level that employee satisfaction, pride
in service, and customer orientation relate to customer perceptions of service and other
organizational outcomes (Ostroff, 1992; Reynierse & Harker, 1992; Schneider, 1991; Schneider,
Copyright © 2003 The Gallup Organization, Princeton, NJ. All rights reserved.

2
Ashworth, Higgs, & Carr, 1996; Schneider & Bowen, 1992; Schneider, White, & Paul, 1998;
Ulrich, Halbrook, Meder, Stuchlik, & Thorpe, 1991; Wiley, 1991). Mayer and Schoorman
(1992) found that measures of trust correlate negatively with turnover and positively with
performance. Convergently, The Gallup Organization (Gallup) has produced a journal (Fleming,
2000) highlighting numerous case studies that illustrate links between attitudinal variables and
business outcomes. The units of measure for these analyses are both the individual and the
business unit.
Even though it has been much more common to study employee opinion data at the individual
level, studying data at the business-unit or workgroup level is critical, because that is where the
data are typically reported (due to anonymity concerns, employee surveys are reported at a
broader business-unit or workgroup level). In addition, business-unit-level research usually
provides opportunities to establish links to outcomes that are directly relevant to most
businesses — outcomes like customer loyalty, profitability, productivity, employee turnover, and
safety variables that are often aggregated and reported at the business-unit level. Another
advantage to reporting and studying data at the business-unit or workgroup level is that
instrument item scores are as reliable as dimension scores are in individual-level analysis. This is
because at the business-unit or workgroup level, each item score is an average of many
individuals’ scores. This means employee surveys reported at a business-unit or workgroup level
can be more efficient, i.e., less dependent on length because item-level measurement error is less
of a concern.
Copyright © 2003 The Gallup Organization, Princeton, NJ. All rights reserved.

3
One potential problem with such business-unit-level studies is limited data, due to a limited
number of business units (the number of business units becomes the sample size), or limited
access to outcome measures that one can compare across business units. For this reason, many of
these studies are limited in statistical power, and as such, results from individual studies may
appear to conflict with one another. Meta-analysis techniques provide the opportunity to pool
such studies together to get more precise estimates of the strength of effects and
their generalizability.
This paper’s purpose is to present the results of an updated meta-analysis of the relationship
between employee workplace perceptions and business-unit outcomes, based on currently
available data collected with Gallup clients. The focus of this study is on the thirteen (13)
statements included in the Gallup Workplace Audit (GWA, i.e., the Q12 and Overall
Satisfaction). These 13 items — which were selected because of their importance at the
business-unit or workgroup level — measure employee perceptions of the quality of people-
related management practices in their business units. This report provides an update of previous
research reported by Harter and Schmidt (2000), Harter, Schmidt, and Hayes (2002), and Harter
and Schmidt (2002).
Copyright © 2003 The Gallup Organization, Princeton, NJ. All rights reserved.

4
Background Behind the GWA The history of the research and conceptual background of the GWA (Q12) instrument is detailed
in Harter and Schmidt (2000) and Harter et al. (2002). In short, the GWA (Q12) was developed
based on over 30 years of accumulated quantitative and qualitative research. Its reliability,
convergent validity, and criterion-related validity have been extensively studied. It is an
instrument validated through the above psychometric studies as well as practical considerations
regarding its usefulness for managers in creating change in the workplace.
In designing the items included in the GWA, researchers took into account that, from an
actionability standpoint, there are two broad categories of employee survey items: those that
measure attitudinal outcomes (satisfaction, loyalty, pride, customer service intent, and intent to
stay with the company) and those that measure actionable issues that drive the above outcomes.
In our standard set of GWA items, we have included one outcome item (satisfaction with one’s
company) that can be seen as an overall measure of “satisfaction.” Following the satisfaction
item are 12 items measuring issues we have found to be actionable at the supervisor or manager
level in the company — items measuring the extent to which employees are “engaged” in
their work.
Copyright © 2003 The Gallup Organization, Princeton, NJ. All rights reserved.

5
The 13 GWA statements are as follows:
Q00. (Overall Satisfaction) On a five-point scale, where “5” is extremely satisfied and “1” is extremely dissatisfied, how satisfied are you with (name of company) as a place to work?
Q01. I know what is expected of me at work.
Q02. I have the materials and equipment I need to do my work right.
Q03. At work, I have the opportunity to do what I do best every day.
Q04. In the last seven days, I have received recognition or praise for doing good
work.
Q05. My supervisor, or someone at work, seems to care about me as a person.
Q06. There is someone at work who encourages my development.
Q07. At work, my opinions seem to count.
Q08. The mission or purpose of my company makes me feel my job is important.
Q09. My associates or fellow employees are committed to doing quality work.
Q10. I have a best friend at work.
Q11. In the last six months, someone at work has talked to me about my progress.
Q12. This last year, I have had opportunities at work to learn and grow.
These statements (Q00-Q12) are proprietary and copyrighted by The Gallup Organization. They cannot be reprinted or reproduced in any manner without
Copyright © 2003 The Gallup Organization, Princeton, NJ. All rights reserved.

6
the written consent of The Gallup Organization. Copyright © 1992-1999, The Gallup Organization, Princeton, NJ. All rights reserved.
The current standard is to ask each employee to rate the above statements (a census
survey — median participation rate is 83%) using six response options (from 5=strongly agree to
1=strongly disagree; the sixth response option — don’t know/does not apply — is unscored).
Because it is a satisfaction item, the first item is scored on a satisfaction scale rather than on an
agreement scale.
The reader will notice that, while these items measure issues that the manager or supervisor can
influence, only one item contains the word “supervisor.” This is because it is realistic to assume
that numerous people in the workplace can influence whether someone’s expectations are clear,
whether he or she feels cared about, and so on. The manager’s or supervisor’s position, however,
allows the manager or supervisor to take the lead in establishing a culture that values behaviors
that support these perceptions. The following is a brief discussion of the conceptual relevancy of
each of the 13 items:
Q00. Overall Satisfaction. The first item on the survey measures an overall attitudinal outcome: satisfaction with one’s company. One could argue that in and of itself, it is difficult to act on the results of this item. Other issues, like those measured in the following 12 items, explain why people are satisfied, and why they become engaged and affect outcomes. Q01. Expectations. Defining and clarifying the outcomes that are to be achieved are perhaps the most basic of all employee needs and manager responsibilities. How these outcomes are defined and acted upon will vary from business unit to business unit, depending on the goals of the business unit. Q02. Materials and equipment. Getting people what they need to do their work is important in maximizing efficiency, in demonstrating to employees that their work is valued, and in showing that the company is supporting them in what they are asked to do. Great managers keep this perception objective by helping
Copyright © 2003 The Gallup Organization, Princeton, NJ. All rights reserved.
7
employees see how their requests for materials and equipment connect to important outcomes. The Q12 items are protected by copyright of The Gallup Organization, 1992-1999.
Q03. Opportunity to do what I do best. Helping people get into roles where they can most fully use their natural abilities — their talents — is the ongoing work of great managers. Learning about individual differences through experience and assessment can help managers position people efficiently, within and across roles. Q04. Recognition for good work. When managers ask employees who are performing at a high level whether they are suffering from too much recognition, they rarely, if ever, get affirmative responses. Another ongoing management challenge is to understand how each person prefers to be recognized, to make it objective and real by basing it on performance, and to do it frequently. Q05. Someone at work cares about me. For each person, feeling “cared about” may mean something different. The best managers listen to individuals, and respond to their unique needs. In addition, they find the connection between the needs of the individual and those of the organization. Q06. Encourages my development. How employees are coached can influence how they perceive their future. If the manager is helping the employee improve as an individual by providing opportunities that are in sync with the employee’s talents and strengths, both the employee and the company will profit. Q07. Opinions count. Asking for the employee’s input, and considering that input as decisions are made, can often lead to better decisions. This is because employees are often closer than the manager is to individuals and variables that affect the overall system. In addition, when employees feel they are involved in decisions, they take greater ownership of the outcomes. Q08. Mission/Purpose. Great managers often help people see not only the purpose of their work, but also how each person’s work influences and relates to the purpose of the organization and its outcomes. Reminding employees of the big-picture impact of what they do each day is important, whether it is how their work influences the customer, safety, or the public. Q09. Associates committed to quality. Managers can influence the extent to which employees respect one another by selecting conscientious employees, providing some common goals and metrics around quality, and increasing associates’ frequency of opportunity for interaction. Q10. Best friend. Managers vary in the extent to which they create opportunities for people at work to get to know one another, and in whether they value the importance of close, trusting relationships at work. The best managers do not subscribe to the idea that there should be no close friendships at work; instead,
Copyright © 2003 The Gallup Organization, Princeton, NJ. All rights reserved.
8
they free people to get to know one another, which is a basic human need. This, then, can influence communication, trust, and other outcomes.
The Q12 items are protected by copyright of The Gallup Organization, 1992-1999.
Q11. Progress. Providing a structured time to discuss each employee’s progress, achievements, goals, and so on, is important for both managers and employees. Great managers regularly meet with individuals, both to learn from them and to give them guidance. This give-and-take helps both managers and employees make better decisions. Q12. Learn and grow. In addition to having a need to be recognized for good work, most employees have a need to know they are improving and have chances to improve themselves. Great managers pick training that will benefit the individual and the organization. The Q12 items are protected by copyright of The Gallup Organization, 1992-1999.
As a total instrument (sum or mean of items 01-12), the GWA has a Cronbach’s alpha of .91 at the
business-unit level. The meta-analytic convergent validity of the equally weighted mean (or sum)
of items 01-12 (GrandMean) to the equally weighted mean (or sum) of additional items in longer
surveys (measuring all known facets of job satisfaction and engagement) is .91. This provides
evidence that the GWA, as a composite measure, captures the general factor in longer employee
surveys. Individual items correlate to their broader dimension true-score values, on average, at .69.
As mentioned, Harter et al. (2002) conducted an earlier version of this business-unit-level meta-
analysis. The current meta-analysis includes a larger number of studies, business units, and
industries represented. This meta-analysis also includes a much larger number of studies with
safety as a dependent variable, and more studies from companies outside the United States (11
studies outside the U.S., including studies from the United Kingdom, Canada, Australia, Hong
Kong, and Korea). This meta-analysis also includes updated estimates of reliabilities across
Copyright © 2003 The Gallup Organization, Princeton, NJ. All rights reserved.

9
business units and includes all available Gallup studies (whether published or unpublished) and
has no risk of publication bias.
Copyright © 2003 The Gallup Organization, Princeton, NJ. All rights reserved.
10
Meta-Analysis
A meta-analysis is a statistical integration of data accumulated across many different studies. As
such, it provides uniquely powerful information, because it controls for measurement and
sampling errors and other idiosyncrasies that distort the results of individual studies. A meta-
analysis eliminates biases and provides an estimate of true validity or true relationship between
two or more variables. Statistics typically calculated during meta-analyses also allow the
researcher to explore the presence, or lack thereof, of moderators of relationships. More than
1,000 meta-analyses have been conducted in the psychological, educational, behavioral, medical,
and personnel selection fields. The research literature in the behavioral and social sciences
includes a multitude of individual studies with apparently conflicting conclusions. Meta-
analysis, however, allows the researcher to estimate the mean relationship between variables and
make corrections for artifactual sources of variation in findings across studies. It provides a
method by which researchers can determine whether validities and relationships generalize
across various situations (e.g., across firms or geographical locations).
This paper will not provide a full review of meta-analysis. Rather, the authors encourage readers
to consult the following sources for both background information and detailed descriptions of the
more recent meta-analytic methods: Schmidt (1992); Hunter and Schmidt (1990); Lipsey and
Wilson (1993); Bangert-Drowns (1986); and Schmidt, Hunter, Pearlman, and
Rothstein-Hirsh (1985).
Copyright © 2003 The Gallup Organization, Princeton, NJ. All rights reserved.
11
Hypothesis and Study Characteristics
The hypotheses examined for this meta-analysis are as follows:
Hypothesis 1: Business-unit-level employee satisfaction and engagement will have positive average correlations with the business-unit outcomes of customer loyalty, productivity, profitability, employee retention, and employee safety.
Hypothesis 2: The correlations between employee satisfaction and engagement and business-unit outcomes will generalize across organizations for all business-unit outcomes. That is, these correlations will not vary substantially across organizations, and in particular, there will be few if any organizations with zero or negative correlations.
A total of one hundred seven (107) studies for 82 independent companies are included in
Gallup's inferential database — studies conducted as proprietary research for various
organizations. In each GWA, one or more of the GWA items were used (as a part of standard
policy, starting in 1997, all items were included in all studies), and data were aggregated at the
business-unit level and correlated with the following aggregate business-unit
performance measures:
• Customer metrics (referred to as customer loyalty) • Profitability • Productivity • Turnover • Safety
That is, in these analyses the unit of analysis was the business unit, not the individual employee.
Pearson correlations were calculated, estimating the relationship between business-unit average
measures of employee perceptions and each of these five general business outcomes.
Correlations were calculated across business units within each company, and these correlation
coefficients were entered into a database for each of the 13 items. The researchers then
Copyright © 2003 The Gallup Organization, Princeton, NJ. All rights reserved.

12
calculated mean validities, standard deviations of validities, and validity generalization statistics
for each item for each of the five business-unit outcome measures.
Studies for the current meta-analysis were selected so that each company was represented once
in each analysis. For several companies, multiple studies were conducted. In order to include the
best possible information for each company represented in the study, some basic rules were used.
If two concurrent studies were conducted for the same client (where GWA and outcome data
were collected concurrently, i.e., in the same year), then the weighted average effect sizes across
the multiple studies were entered as the value for that company. If a company had both a
concurrent and a predictive study (where the GWA was collected in Year 1 and outcomes were
tracked in Year 2), then the effect sizes from the predictive study were entered. If a company had
multiple predictive studies, then the mean of the correlations in these studies was entered.
• For thirty-three (33) companies, there were studies that examined the relationship between business-unit employee perceptions and customer perceptions. Customer perceptions included customer metrics, patient metrics, and student ratings of teachers. These metrics included measures of loyalty, satisfaction, and engagement. The largest representation of studies included loyalty metrics (i.e., likelihood to recommend or repeat business), so we refer to customer metrics as customer loyalty in this study. Instruments varied from study to study. The general index of customer loyalty was an average score of the items included in each measure.
• Profitability studies were available for forty-four (44) companies. Definition of profitability typically was a percentage profit of revenue (sales). In several companies, the researchers used — as the best measure of profit — a difference score from the prior year or a difference from a budgeted amount, because it represented a more accurate measure of each unit's relative performance. As such, a control for opportunity was used when profitability figures were deemed less comparable from one unit to the next. For example, a difference variable involved dividing profit by revenue for a business unit and then subtracting a budgeted percentage from this percentage. In every case, profitability variables were measures of margin, and productivity variables (which follow) were measures of amount produced.
Copyright © 2003 The Gallup Organization, Princeton, NJ. All rights reserved.

13
• Productivity studies were available for fifty (50) companies. Measures of
business-unit productivity consisted of one of the following: financials (i.e., revenue/sales dollars per person or patient), quality (i.e., managerial evaluation of all available productivity measures), quantity produced, or student achievement scores. In a few cases, this was a dichotomous variable (top-performing business units = 2, less successful units = 1). As with profitability, in many cases it was necessary for the researchers to control the financial metrics for opportunity by comparing results to a performance goal or prior-year figure.
• Turnover data were available for thirty-eight (38) companies. The turnover
measure was the annualized percentage of employee turnover for each business unit.
• Safety data were available for seventeen (17) companies. Safety measures
included lost workday/time incident rate, percentage of workdays lost due to incidents or worker's compensation claims, number of incidents, or incident rates.
The overall study involved 410,225 independent employee responses to surveys and
13,751 independent business units in 82 companies, an average of 30 employees per business
unit and 168 business units per company. One hundred seven (107) research studies were
conducted across the 82 companies.
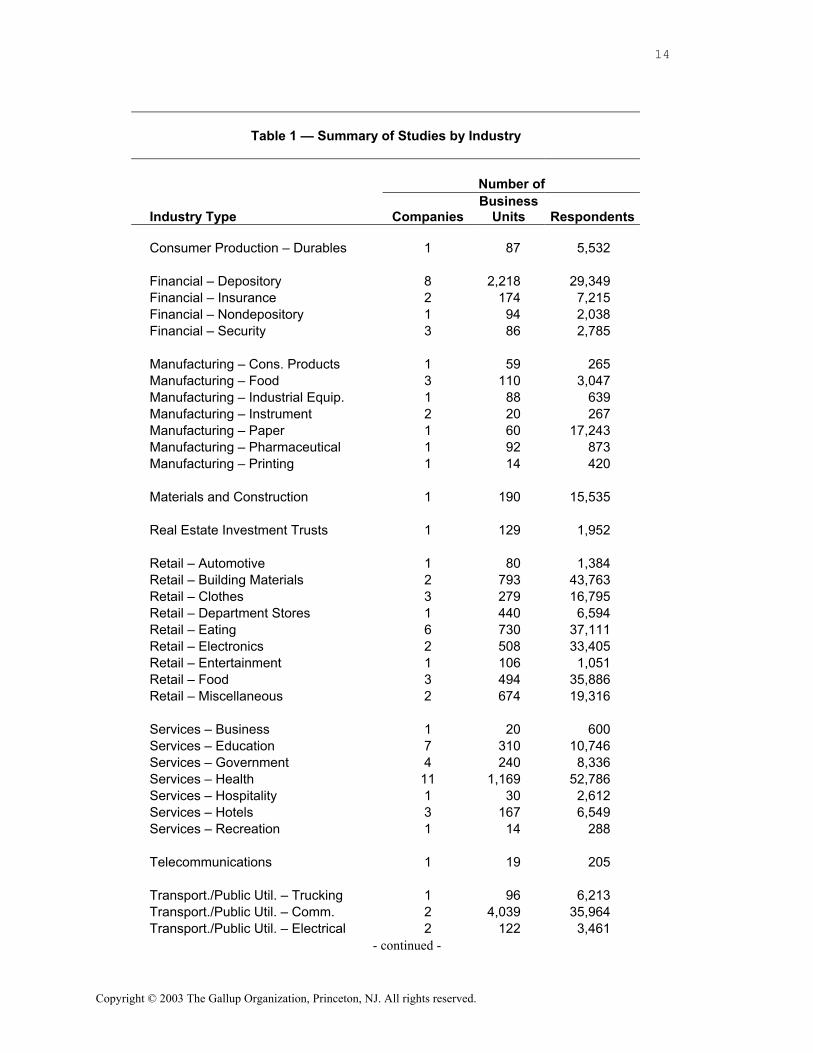
Table 1, which follows, provides a summary of studies (per company) sorted by industry type. It
is evident that there is considerable variation in the industry types represented, as companies
from 34 industries provided studies. Each of the general government industry classifications (via
SIC codes) is represented, with the largest number of companies represented in services and
retail industries. The largest number of business units is in transportation and public utilities, and
retail. Of the specific industry classifications, Services – Health, Financial – Depository, and
Services – Education are of highest frequency.
Copyright © 2003 The Gallup Organization, Princeton, NJ. All rights reserved.
14
Table 1 — Summary of Studies by Industry
Number of
Industry Type
Companies Business
Units
Respondents
Consumer Production – Durables 1 87 5,532 Financial – Depository 8 2,218 29,349 Financial – Insurance 2 174 7,215 Financial – Nondepository 1 94 2,038 Financial – Security 3 86 2,785 Manufacturing – Cons. Products 1 59 265 Manufacturing – Food 3 110 3,047 Manufacturing – Industrial Equip. 1 88 639 Manufacturing – Instrument 2 20 267 Manufacturing – Paper 1 60 17,243 Manufacturing – Pharmaceutical 1 92 873 Manufacturing – Printing 1 14 420 Materials and Construction 1 190 15,535 Real Estate Investment Trusts 1 129 1,952 Retail – Automotive 1 80 1,384 Retail – Building Materials 2 793 43,763 Retail – Clothes 3 279 16,795 Retail – Department Stores 1 440 6,594 Retail – Eating 6 730 37,111 Retail – Electronics 2 508 33,405 Retail – Entertainment 1 106 1,051 Retail – Food 3 494 35,886 Retail – Miscellaneous 2 674 19,316 Services – Business 1 20 600 Services – Education 7 310 10,746 Services – Government 4 240 8,336 Services – Health 11 1,169 52,786 Services – Hospitality 1 30 2,612 Services – Hotels 3 167 6,549 Services – Recreation 1 14 288 Telecommunications 1 19 205 Transport./Public Util. – Trucking 1 96 6,213 Transport./Public Util. – Comm. 2 4,039 35,964 Transport./Public Util. – Electrical 2 122 3,461
- continued -
Copyright © 2003 The Gallup Organization, Princeton, NJ. All rights reserved.

15
Table 1—Summary of Studies by Industry (continued)
Number of
Industry Type
Companies Business
Units
Respondents
Total Consumer Production 1 87 5,532 Total Financial 14 2,572 41,387 Total Manufacturing 10 443 22,754 Total Materials & Construction 1 190 15,535 Total Real Estate Investment Trusts 1 129 1,952 Total Retail 21 4,104 195,305 Total Services 28 1,950 81,917 Total Telecommunications 1 19 205 Total Transportation/Public Util. 5 4,257 45,638
Total 82 13,751 410,225
Table 2 provides a summary of studies (per company) sorted by business or operational unit
type. There is also considerable variation in type of business unit, ranging from stores to
plants/mills to departments to schools. Overall, 17 different types of business units are
represented; the largest number of companies had studies of workgroups, stores, or bank
branches. Likewise, workgroups, stores, and bank branches have the highest proportional
representation of business/operating units.
Table 2 — Summary of Business/Operating-Unit Types
Business/Operating- Number of Unit Type Companies Business Units Respondents
Bank Branch 10 2,446 32,396 Call Center 1 17 179 Call Center Department 2 52 2,024 City Center Office 3 64 2,612 Dealership 1 80 1,384
- continued -
Copyright © 2003 The Gallup Organization, Princeton, NJ. All rights reserved.

16
Table 2 — Summary of Business/Operating-Unit Types (continued)
Business/Operating- Number of Unit Type Companies Business Units Respondents
Dental Office 1 134 675 Distribution Center 1 7 2,353 Division 3 69 11,296 Hospital 2 220 25,903 Hotel 2 66 5,736 Plant/Mill 2 72 19,805 Region 1 96 6,213 Restaurant 5 367 21,103 Sales Team 3 123 1,256 School 6 296 10,496 Store 14 3,298 164,510 Workgroup 25 6,344 102,284
Total 82 13,751 410,225
Meta-Analytic Methods Used
Analyses included weighted average estimates of true validity, estimates of standard deviation of
validities, and corrections made for sampling error, measurement error in the dependent variables,
and range variation and restriction in the independent variable (GWA) for these validities. An
additional analysis was conducted, correcting for independent-variable measurement error. The
most basic form of meta-analysis corrects variance estimates only for sampling error. Other
corrections recommended by Hunter and Schmidt (1990) include correction for measurement and
statistical artifacts, such as range restriction and measurement error in the performance variables
gathered. The definitions of the above procedures are provided in the sections that follow.
Copyright © 2003 The Gallup Organization, Princeton, NJ. All rights reserved.

17
Gallup researchers gathered performance-variable data for multiple time periods to calculate the
reliabilities of the business performance measures. Because these multiple measures were not
available for each study, the researchers used artifact distributions meta-analysis methods
(Hunter & Schmidt, 1990, pp. 158-197) to correct for measurement error in the performance
variables. The artifact distributions developed were based on test-retest reliabilities, where they
were available, from various studies. The procedure followed for calculation of business-unit
outcome-measure reliabilities was consistent with Scenario 23 in Schmidt and Hunter (1996). To
take into account that some change in outcomes (stability) is a function of real change, test-retest
reliabilities were calculated using the following formula:
(r12 x r23)/r13
Where r12 is the correlation of the outcome measured at time 1 with the same outcome measured at time 2; r23 is the correlation of the outcome measured at time 2 with the outcome measured at time 3; and r13 is the correlation of the outcome measured at time 1 with the outcome measured at time 3.
The above formula factors out real change (which is more likely to occur from time period 1-3
than from time period 1-2 or 2-3) from random changes in business-unit results caused by
measurement error, data-collection errors, sampling errors (primarily in customer measures), and
uncontrollable fluctuations in outcome measures. Some estimates were available for quarterly
data, some for semiannual data, and others for annual data. See Appendix A for a listing of the
reliabilities used in the corrections for measurement error. Artifact distributions for reliability
were collected for all dependent variables.
To adequately correct for item-level independent-variable measurement error, test-retest
reliabilities (with a short time interval) would be necessary. Such estimates were unavailable at
Copyright © 2003 The Gallup Organization, Princeton, NJ. All rights reserved.
18
the time of this study. It could be argued that, because the independent variable is used in
practice to predict outcomes, the practitioner must live with the reliability of the instrument
he/she is using. However, correcting for measurement error in the independent variable answers
the theoretical question of how the actual constructs (true scores) relate to each other. Such
corrections were not made for individual items, but were made for the composite indices of
employee engagement and overall satisfaction. Appendix B presents the distributions of
reliabilities for the two composite measures. These values were computed in the same manner as
were those for the business-unit outcomes.
In correcting for range variation and range restriction, there are fundamental, theoretical
questions that need to be considered relating to whether such correction is necessary. In
personnel selection, validities are routinely corrected for range restriction because, in selecting
applicants for jobs, those scoring highest on the predictor are typically selected. This results in
explicit range restriction that biases observed correlations downward (i.e., attenuation). In the
employee satisfaction and engagement arena, one could argue that there is no explicit range
restriction because we are studying results as they exist in the workplace. Work units are not
selected based on scores on the predictor (GWA scores). However, in studying companies, we
have observed that there is variation across companies in standard deviations of indices across
business units. There is also variation in mean scores across companies. One hypothesis for why
this variation occurs is that companies vary in how they encourage employee satisfaction and
engagement initiatives and in how they have or have not developed a common set of values and
a common culture. Therefore, the standard deviation of the population of business units across
organizations studied will be greater than the standard deviation within the typical company.
Copyright © 2003 The Gallup Organization, Princeton, NJ. All rights reserved.

19
This variation in standard deviations across companies can be thought of as indirect range
restriction (as opposed to direct range restriction). Improved indirect-range restriction
corrections have been incorporated into this meta-analysis (Hunter, Schmidt, & Le, 2002).
In the past 3 years, Gallup has collected descriptive data on more than 3 million respondents,
285,314 business units or workgroups, and 290 companies. This accumulation of data indicates
that the standard deviation within a given company is, on average, 75% of the standard deviation
in the population of all business units. In addition, the ratio of standard deviation for a given
company relative to the population value varies from company to company. Therefore, if one
goal is to estimate the effect size in the population of all business units (arguably a theoretically
important issue), then correction should be made based on such available data. In the observed
data, correlations are attenuated for companies with less variability across business units than the
population average, and vice versa. As such, variability in standard deviations across companies
will create variability in observed correlations and is therefore an artifact that can be corrected
for in interpreting the generalizability of validities. Appendices in Harter and Schmidt (2000)
provided artifact distributions for range-restriction/variation corrections used for meta-analysis.
These artifact distributions have since been updated substantially. Due to the increased size of
these tables, they are not included in this report. They resemble those reported in the earlier
study, but with a larger number of entries.
The following excerpt provides an overview of meta-analysis conducted using
artifact distributions:
Copyright © 2003 The Gallup Organization, Princeton, NJ. All rights reserved.

20
In any given meta-analysis, there may be several artifacts for which artifact information is only sporadically available. For example, suppose measurement error and range restriction are the only relevant artifacts beyond sampling error. In such a case, the typical artifact distribution-based meta-analysis is conducted in three stages:
• First, information is compiled on four distributions: the distribution of
the observed correlations, the distribution of the reliability of the independent variable, the distribution of the reliability of the dependent variable, and the distribution of the range departure. There are then four means and four variances compiled from the set of studies, with each study providing whatever information it contains.
• Second, the distribution of observed correlations is corrected for
sampling error. • Third, the distribution corrected for sampling error is then corrected
for error of measurement and range variation (Hunter & Schmidt, 1990, pp. 158-159).
In this study, statistics are calculated and reported at each level of analysis, starting with the
observed correlations and then correcting for sampling error, measurement error, and, finally,
range variation. While within-company range-variation corrections are provided (to correct
validity generalization estimates) in all analyses (items and overall indices), between-company
range-restriction corrections were made only when studying overall indices (overall satisfaction
and employee engagement, i.e., GrandMean of items 01-12). Again, range-restriction corrections
may not be needed for understanding and applying item-level results within a single company.
But these corrections are relevant in understanding how satisfaction and engagement relate to
performance across the business units of all companies. As alluded to, we have applied the
indirect range-restriction correction procedure to this meta-analysis (Hunter et al., 2002). As
noted earlier, corrections were made for measurement error in the independent variable for
overall composite indices (as an additional analysis).
Copyright © 2003 The Gallup Organization, Princeton, NJ. All rights reserved.

21
The meta-analysis for each item and each performance variable includes an estimate of the mean
sample-size-weighted validity and the variance across the correlations — again weighting each
validity by its sample size. The amount of variance predicted for weighted correlations on the
basis of sampling error was also computed. The following is the formula to calculate variance
expected from sampling error in "bare bones" meta-analyses, using the Hunter/Schmidt
technique referred to on the previous page:
s 2 = (1 - r 2)2 / (N - 1)e-
Residual standard deviations were calculated by subtracting the amount of variance due to
sampling error, the amount of variance due to study differences in measurement error in the
dependent variable, and the amount of variance due to study differences in range variation from
the observed variance. To estimate the true validity standard deviations, the residual standard
deviation was adjusted for bias due to mean unreliability and mean range restriction. The amount
of variance due to sampling error, measurement error, and range variation was divided by the
observed variance to calculate the total percentage variance accounted for. One rule of thumb
adopted from the literature is that, if over 75% of variance in validities across studies is due to
sampling error and other artifacts, the validity is assumed generalizable.
As in Harter et al. (2002), we calculated the correlation of overall satisfaction and engagement to
composite performance. This calculation assumes managers are managing toward multiple
outcomes simultaneously and that each outcome occupies some space in the overall evaluation of
performance. To calculate the correlation to the composite index of performance, we used the
Copyright © 2003 The Gallup Organization, Princeton, NJ. All rights reserved.

22
Mosier (1943) formula to determine the reliability of the composite measure (as described in
Harter et al. 2002), with updated reliability distributions and updated intercorrelations of the
outcome measures. In addition, given a large increase in number of studies with safety as an
outcome, and estimates of the correlation of safety to other outcomes, we added safety to the
composite performance definition. The reliability of the composite metric is .94. Composite
performance was measured as the equally weighted sum of customer loyalty, turnover (reverse
scored as retention), safety (accidents reverse scored), and financials (with profitability and
productivity equally weighted). We also calculated composite performance as the equally
weighted sum of the most direct outcomes of engagement — customer loyalty, turnover (reverse
scored as retention), and safety (accidents reverse scored). The reliability of this composite
variable is .69.
Copyright © 2003 The Gallup Organization, Princeton, NJ. All rights reserved.

23
Results
The results of the item-level meta-analyses for the 12 actionable GWA items (Q01-Q12) are
provided in Tables 3-7. Meta-analyses for overall and composite indices (overall satisfaction and
the GrandMean of the 12 GWA items) are provided in Table 9. Tables 10 and 11 provide
correlations and d values (differences in standard score units between high- and low-scoring
business units on engagement and satisfaction) for composite indices in relation to
composite performance.
Table 3 provides a meta-analysis for each of the 12 actionable items with regard to customer
loyalty criteria. Statistics presented include the number of business units contained in the
analysis, the number of correlations, the weighted mean observed correlation, the observed
standard deviation, the true validity correlation, the true validity standard deviation (subtracting
out variance due to sampling error, measurement error in the performance variables, and range
variation), the percentage variance due to sampling error, the percentage variance accounted for,
and the 90% credibility value (the point above which 90% of the true validities fall).
Results indicate that, across all 12 items, true validity estimates are in the positive direction.
True validity estimates range from a low of .15 to a high of .22. If an item has a positive 90%
credibility value, it is considered generalizable in the sense that we are confident the true validity
is positive (in the hypothesized direction). Items in which over 75% of the variance in validities
was accounted for are considered generalizable in the sense that the validity does not vary (or if
it does vary, the variance is very slight) across studies. All 12 items have positive 90%
Copyright © 2003 The Gallup Organization, Princeton, NJ. All rights reserved.

24
credibility values and 11 have over 75% of the variance in validities accounted for due to
artifacts. As such,
Copyright © 2003 The Gallup Organization, Princeton, NJ. All rights reserved.

25
the relationship of the 12 GWA items to customer loyalty criteria is widely generalizable
across organizations.
Interestingly, for three items ("I have a best friend at work," "I know what is expected of me at
work," and "At work, my opinions seem to count"), the calculations indicate that, respectively,
160%, 148%, and 132% of the variance in validities across studies is due to sampling error and
other artifacts. The interpretation of this is as follows: By chance there is less variability across
studies in this data set in the observed correlations than was predicted from random sampling
error and other artifacts. Five other items also have over 100% of variance accounted for due to
sampling error and other artifacts.
When multiple generalizability estimates are derived, second-order sampling error can slightly
influence results. To compute the mean percentage variance accounted for, the following
formula (Hunter & Schmidt, 1990, p. 421) was used:
%Variance acct for = 1/(Σ (1/%Var))/K
On average, 103.54% of the variance is accounted for due to all observable artifacts. Therefore,
effect sizes across companies appear to be identical after correcting for second-order sampling
error. Although 103.54% is still larger than 100%, the numerical difference between 103.54%
and 100% of variance is very small, as expected.
The Q12 items are protected by copyright of The Gallup Organization, 1992-1999. Copyright © 2003 The Gallup Organization, Princeton, NJ. All rights reserved.

26
Table 3 Meta-Analysis and Validity Generalization Statistics
for 12 CORE GWA ITEMS—Correlations to Customer Loyalty Criteria
____ % Variance_ ___
Item
No. of Business
Units
No. of
__r’s__
Mean Observ. __r’s__
Observ. __SD__
True Validity __r__
True Validity __SD__
Sampling __Error__
Accounted __for__
90%
__CV__
1) Know what is expected 4,337 32 .13 .09 .16 .00 100 148 .16 2) Materials and equipment 4,374 33 .18 .11 .22 .00 64 110 .22 3) Opp. to do what I do best 4,337 32 .16 .10 .19 .00 74 119 .19 4) Recognition/praise 4,374 33 .12 .10 .15 .03 73 96 .11 5) Cares about me 4,345 32 .15 .10 .18 .00 69 106 .18 6) Encourages development 4,337 32 .15 .09 .19 .00 82 118 .19 7) Opinions count 4,337 32 .12 .08 .15 .00 102 132 .15 8) Mission/purpose 4,261 30 .15 .12 .19 .07 51 78 .11 9) Committed — quality 4,337 32 .16 .14 .20 .11 39 59 .06 10) Best friend 4,374 33 .13 .08 .16 .00 113 160 .16 11) Talked about progress 4,337 32 .12 .10 .15 .02 76 98 .12 12) Opps. to learn and grow 4,337 32 .14 .10 .18 .00 76 105 .18
Mean: 70.7 103.54
The Q12 items are protected by copyright of The Gallup Organization, 1992-1999.
Copyright © 2003 The Gallup Organization, Princeton, NJ. All rights reserved.

27
Table 4 provides the same analysis for each item with regard to its relationship to profitability
criteria. Eleven (11) of the 12 items have positive 90% credibility values, and it is possible to
account for over 75% of the variance in validities for 10 items. The mean percentage variance
accounted for across items is 93.72% when all available artifacts are corrected for. Again, effect
sizes appear to be consistent across organizations. True validity values range from .06 to .12,
smaller values than the correlations to customer loyalty criteria. One possible reason for this is
that profitability may be a more indirect result of “employee engagement” than is customer
loyalty. That is, employee attitudes and behaviors directly influence customer reactions and,
hence, affect customer loyalty. But employee attitudes affect profitability more indirectly. Also,
profitability is affected by a larger number of causes (e.g., economic conditions, interest rates)
than is customer loyalty. The causal ordering of the variables in this study has been explored,
indicating direct causal paths from employee engagement to customer loyalty and turnover and
direct and indirect paths from employee engagement to financials (Harter, Schmidt, Asplund, &
Killham, 2003).
Copyright © 2003 The Gallup Organization, Princeton, NJ. All rights reserved.

28
Table 4
Meta-Analysis and Validity Generalization Statistics for 12 CORE GWA ITEMS—Correlations to Profitability Criteria
___% Variance____
Item
No. of Business
Units
No. of _r’s_
Mean Observ.
_r’s_
Observ.
_SD_
True Validity __r__
True Validity _SD_
Sampling Error
Accounted __for__
90% _CV_
1) Know what is expected 5,969 43 .08 .11 .09 .07 55 65 -.01 2) Materials and equipment 5,900 43 .11 .12 .12 .07 54 69 .03 3) Opp. to do what I do best 5,889 42 .10 .09 .11 .00 81 102 .11 4) Recognition/praise 5,900 43 .06 .09 .06 .00 102 109 .06 5) Cares about me 5,976 43 .07 .09 .07 .02 88 97 .05 6) Encourages development 5,863 42 .08 .08 .08 .00 108 120 .08 7) Opinions count 5,863 42 .09 .08 .10 .00 104 121 .10 8) Mission/purpose 5,571 38 .10 .09 .11 .02 78 94 .08 9) Committed — quality 5,863 42 .11 .10 .12 .01 79 99 .11 10) Best friend 5,296 43 .06 .09 .06 .02 87 94 .03 11) Talked about progress 5,863 42 .09 .10 .09 .04 73 83 .04 12) Opps. to learn and grow 5,863
42 .09 .09 .10 .00 98 113 .10
Mean: 80.02 93.72
The Q12 items are protected by copyright of The Gallup Organization, 1992-1999.
Copyright © 2003 The Gallup Organization, Princeton, NJ. All rights reserved.

29
Table 5 provides the meta-analytic and validity generalization statistics for the 12 actionable
GWA items relative to productivity criteria. Again, true validities are all positive, ranging from
.06 to .15. Eleven (11) of the 12 items have positive 90% credibility values, and over 75% of the
variance in validities is accounted for in the same 11 items. The mean percentage variance
accounted for across items is 107.83% (for all available artifacts), suggesting no room for
possible moderators within items at the company level. There is slight variation across items,
however, in the magnitude of true validity and 90% credibility value estimates.
Copyright © 2003 The Gallup Organization, Princeton, NJ. All rights reserved.

30
Table 5
Meta-Analysis and Validity Generalization Statistics for 12 CORE GWA ITEMS—Correlations to Productivity Criteria
__ _% Variance_ ____
Item
No. of Business _Units_
No. of _r’s_
Mean Observ.
_r’s_
Observ.
_SD_
True Validity
_ r_
True Validity _SD_
Sampling _Error_
Accounted __for__
90%
_ CV__
1) Know what is expected 5,582 47 .13 .10 .14 .00 81 114 .14 2) Materials and equipment 5,597 46 .12 .11 .13 .04 69 90 .08 3) Opp. to do what I do best 5,574 46 .14 .10 .15 .00 84 118 .15 4) Recognition/praise 5,597 46 .11 .09 .12 .00 95 117 .12 5) Cares about me 5,619 48 .11 .08 .12 .00 131 164 .12 6) Encourages development 5,574 46 .12 .08 .12 .00 115 138 .12 7) Opinions count 5,560 45 .13 .09 .14 .00 110 144 .14 8) Mission/purpose 5,344 42 .14 .10 .14 .00 86 113 .14 9) Committed — quality 5,678 46 .12 .11 .13 .05 64 81 .07 10) Best friend 5,611 47 .06 .11 .06 .06 65 70 -.02 11) Talked about progress 5,574 46 .11 .10 .12 .02 80 96 .09 12) Opps. to learn and grow 5,560
45 .12 .09 .13 .00 98 122 .13
Mean: 85.70 107.83
The Q12 items are protected by copyright of The Gallup Organization, 1992-1999.
Copyright © 2003 The Gallup Organization, Princeton, NJ. All rights reserved.
31
Table 6 includes the meta-analytic and validity generalization statistics for each item as they
relate to turnover. All twelve (12) items have negative true validity values (higher scores
associated with lower turnover) and all 12 have zero or negative 90% credibility values.
Therefore, for all items, we can be quite certain the direction of the relationship is negative (as
hypothesized for turnover) across the organizations we have studied. That is, higher employee
engagement scores predict lower turnover levels. We are able to account for over 75% of the
variance in validities for 10 items. The mean percentage variance accounted for across items is
99.70% (for all available artifacts), again suggesting generalizable effects across companies and
no room for moderators.
Copyright © 2003 The Gallup Organization, Princeton, NJ. All rights reserved.

32
Table 6 Meta-Analysis and Validity Generalization Statistics
for 12 CORE GWA ITEMS—Correlations to Turnover Criteria
__ _% Variable____
Item
No. of Business _Units_
No. of _r’s_
Mean Observ.
_r’s_
Observ.
_SD_
True Validity
_ r_
True Validity _SD_
Sampling _Error_
Accounted __for__
90%
__CV__
1) Know what is expected
9,099 35 -.10 .07 -.15 .00 81 137 -.15 2) Materials and equipment 9,414 36 -.11 .07 -.16 .00 73 125 -.16 3) Opp. to do what I do best 9,419 36 -.13 .06 -.18 .00 101 199 -.18 4) Recognition/praise 9,414 36 -.06 .08 -.09 .07 56 68 .00 5) Cares about me 9,310 34 -.10 .07 -.15 .00 69 114 -.15 6) Encourages development 9,414 36 -.09 .08 -.13 .05 58 80 -.06 7) Opinions count 9,414 36 -.10 .08 -.14 .03 62 93 -.10 8) Mission/purpose 9,202 33 -.10 .07 -.14 .01 65 99 -.13 9) Committed — quality 9,414 36 -.12 .07 -.18 .00 76 133 -.18 10) Best friend 9,414 36 -.07 .09 -.11 .08 47 63 -.01 11) Talked about progress 9,414 36 -.09 .08 -.13 .05 58 81 -.0612) Opps. to learn and grow 9,414 36 -.11
.07 -.16 .00 81 134 -.16
Mean: 66.43 99.70
The Q12 items are protected by copyright of The Gallup Organization, 1992-1999.
Copyright © 2003 The Gallup Organization, Princeton, NJ. All rights reserved.

33
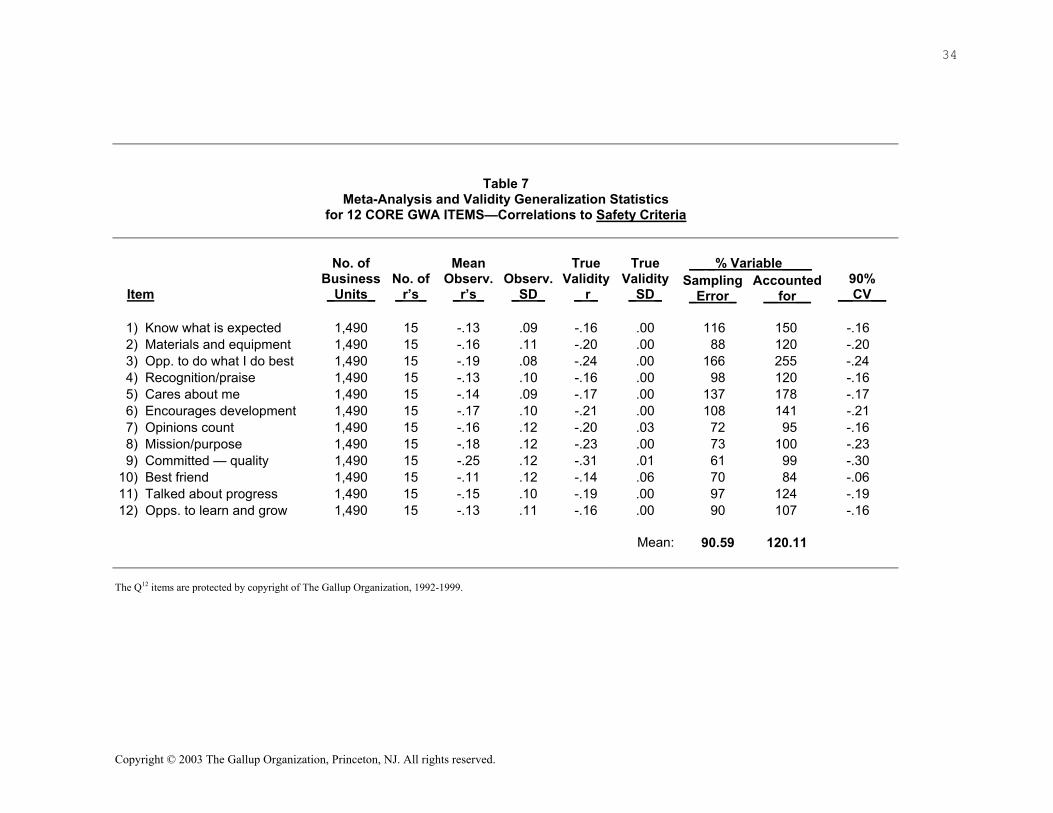
Table 7 presents meta-analytic and validity generalization statistics for the safety variable, which
is particularly relevant to industrial and manufacturing companies. Safety, as defined by lost
workdays due to injury and injury rate, was available for 15 studies and 1,490 business units.
This represents a substantial increase from the previous research reported by Harter et al. (2002).
All items show negative true validities (higher scores associated with lower number of incidents
and days missed as a result of these incidents) and all 12 have negative 90% credibility values.
True validities range from -.14 to -.31. Therefore, we can again be certain of a negative
relationship (as hypothesized for safety) for all items. We are able to account for 75% of the
variance in validities for all 12 items. The mean percentage variance accounted for across items
is 120.11% when we correct for all available artifacts.
Copyright © 2003 The Gallup Organization, Princeton, NJ. All rights reserved.
34
Table 7 Meta-Analysis and Validity Generalization Statistics
for 12 CORE GWA ITEMS—Correlations to Safety Criteria
__ _% Variable____
Item
No. of Business _Units_
No. of _r’s_
Mean Observ.
_r’s_
Observ.
_SD_
True Validity
_ r_
True Validity _SD_
Sampling _Error_
Accounted __for__
90%
__CV__
1) Know what is expected 1,490 15 -.13 .09 -.16 .00 116 150 -.16 2) Materials and equipment 1,490 15 -.16 .11 -.20 .00 88 120 -.20 3) Opp. to do what I do best 1,490 15 -.19 .08 -.24 .00 166 255 -.24 4) Recognition/praise 1,490 15 -.13 .10 -.16 .00 98 120 -.16 5) Cares about me 1,490 15 -.14 .09 -.17 .00 137 178 -.17 6) Encourages development 1,490 15 -.17 .10 -.21 .00 108 141 -.21 7) Opinions count 1,490 15 -.16 .12 -.20 .03 72 95 -.16 8) Mission/purpose 1,490 15 -.18 .12 -.23 .00 73 100 -.23 9) Committed — quality 1,490 15 -.25 .12 -.31 .01 61 99 -.30 10) Best friend 1,490 15 -.11 .12 -.14 .06 70 84 -.06 11) Talked about progress 1,490 15 -.15 .10 -.19 .00 97 124 -.19 12) Opps. to learn and grow 1,490
15 -.13 .11 -.16 .00 90 107 -.16
Mean: 90.59 120.11
The Q12 items are protected by copyright of The Gallup Organization, 1992-1999.
Copyright © 2003 The Gallup Organization, Princeton, NJ. All rights reserved.

35
Table 8 provides a summary of the items that have positive 90% credibility values (zero or
negative for the turnover and safety measures) and in which over 75% of the variance in
validities is accounted for. As is shown in Tables 1-7, all items have relationships to all
outcomes that are in the hypothesized direction. As is shown in Table 8, nearly all of these
relationships are generalizable. In fact, 90% of the effects studied in the item-level meta-analysis
meet generalizability criteria. It is possible that those that do not are merely a function of second-
order sampling error, because second-order sampling error analyses indicate high
generalizability.
Table 8
Items With Meta-Analytic r's That Are Generalizable Across Organizations
Item Customer Profitability Productivity Turnover Safety
1) Know what is expected x x x x 2) Materials and equipment x x x x 3) Opp. to do what I do best x x x x x 4) Recognition/praise x x x x 5) Cares about me x x x x x 6) Encourages development x x x x x 7) Opinions count x x x x x 8) Mission/purpose x x x x x 9) Committed — quality x x x x 10) Best friend x x x 11) Talked about progress x x x x x 12) Opps. to learn and grow x x x x x
The Q12 items are protected by copyright of The Gallup Organization, 1992-1999.
Copyright © 2003 The Gallup Organization, Princeton, NJ. All rights reserved.

36
Overall Satisfaction and Composite “Employee Engagement”
For purposes of overall evaluation of business units and for general theory building, it is useful to
study composite measures of the satisfaction/engagement facets. That is, one general, global
perception studied is “overall satisfaction with one’s company” (defined by one item) and another is
“overall employee engagement in one’s work” (which is defined as the GrandMean of the GWA
items 01-12). Table 9 provides meta-analytic and validity generalization statistics for both of these
“overall” indices, overall satisfaction (OS) and the GrandMean (GM) of items 01-12, the latter of
which is a composite measure of employee engagement.
Because these “overall” indices lend themselves to general, theoretical inquiry, an additional
correction for range restriction in the independent variable across companies was made to meta-
analytic estimates. Estimates that include this range-restriction correction apply to interpretations of
effects in business units across companies, as opposed to effects expected within a given company.
Because there is more variation in business units across companies than there is within the average
company, effect sizes are higher when true validity estimates are calculated for business units across
companies.
For instance, observe the estimates relative to the customer loyalty criteria. Without the between-
company range-restriction correction (which is relevant to the effect within the typical company),
the true validity value of overall satisfaction is .22 with a 90% CV of .18. With the between-
company range-restriction correction (which is relevant to business units across companies), the true
validity value of overall satisfaction is .31 with a 90% CV of .26. For employee engagement, the true
validity is the same as the 90% CV, which is .22 within a given company and .32 for business units
Copyright © 2003 The Gallup Organization, Princeton, NJ. All rights reserved.

37
across companies. Both OS and GM show generalizability across companies in their relationship to
customer loyalty metrics, profitability, productivity, employee turnover, and safety outcomes. For all
variables except safety, GM demonstrates slightly more generalizability across companies than does
OS. Average effect sizes are of similar magnitude for these two
“overall” measures.
In summary, for the overall measures of engagement shown in Table 9, the strongest effects are
found relative to customer loyalty metrics, employee turnover, and safety. Correlations are
positive and generalizable relative to profitability and productivity (often defined as sales)
criteria, but of lower magnitude. This may be because profitability and other financial variables
are influenced indirectly by employee engagement and more directly by the customer, employee
turnover, and safety. The next section will explore the practical utility of the
observed relationships.
Copyright © 2003 The Gallup Organization, Princeton, NJ. All rights reserved.

38
Table 9 Composite Indices (Overall Sat. and GWA GrandMean) — Meta-Analysis
_ Customer_ Profitability Productivity _Turnover_ __Safety__ OS GM OS GM OS GM OS GM OS GM
Number of Bus. Units 4169 4697 5658 6006 5300 5717 9135 9836 1490 1609 Number of r's 30 33 39 44 42 50 33 38 15 17 Mean Observed r .17 .19 .13 .11 .15 .15 -.15 -.13 -.20 -.19 Observed SD .11 .09 .10 .09 .11 .10 .09 .07 .10 .10 True Validity1 .22 .22 .14 .12 .16 .16 -.21 -.20 -.26 -.24 True Validity SD1 .03 .00 .05 .00 .03 .00 .05 .00 .00 .00 True Validity2 .31 .32 .20 .17 .24 .23 -.30 -.27 -.36 -.34 True Validity SD2 .04 .00 .06 .00 .04 .00 .06 .00 .00 .00
% Variance Acct'ed For-- Sampling error 58 86 63 98 66 87 40 79 91 94
%Variance Acct'ed For1 94 133 83 116 94 112 87 138 135 125 % Variance Acct'ed For2 94 133 84 116 94 112 87 138 135 125
90% CV1 .18 .22 .08 .12 .13 .16 -.15 -.20 -.26 -.24 90% CV2 .26 .32 .11 .17 .19 .23 -.22 -.27 -.36 -.34
OS = Overall Satisfaction GM = GrandMean of GWA items 01-12 (employee engagement) SD = Standard Deviation
1 Includes correction for range variation within companies and dependent-variable measurement error 2 Includes correction for range restriction across population of business units and dependent-variable
measurement error
As in Harter et al. (2002), we calculated the correlation of overall satisfaction and employee
engagement to composite performance. As defined earlier, Table 10 provides the correlations
and d-values for four analyses: the observed correlations, correction for dependent-variable
measurement error, correction for dependent-variable measurement error and range restriction
Copyright © 2003 The Gallup Organization, Princeton, NJ. All rights reserved.

39
across companies, and correction for dependent-variable measurement error, range restriction,
and independent-variable measurement error (true score correlation).
The effect sizes presented in Table 10 indicate very similar correlations of overall satisfaction
and employee engagement to composite performance. Regression analyses (Harter et al., 2002)
indicate that employee engagement accounts for nearly all of the performance-related variance
(composite performance) accounted for by the overall satisfaction measure.
Table 10
Correlation of Employee Satisfaction and Engagement to Composite Business-Unit Performance
Analysis Satisfaction Engagement Observed r .27 .26 D .46 .43 r corrected for dependent-variable
measurement error
.28
.27 D .46 .44 r corrected for dependent-variable
measurement error and range restriction across companies
.38
.38 D .64 .64 ρ corrected for dependent-variable
measurement error, range restriction, and independent-variable measurement error
.43
.43 δ .73 .73
Business units in the top half on engagement within companies have over .4 standard deviation
units’ higher composite performance in comparison to those in the bottom half on engagement.
Copyright © 2003 The Gallup Organization, Princeton, NJ. All rights reserved.

40
Across companies, business units in the top half on engagement have over .6 standard deviation
units’ higher composite performance in comparison to those in the bottom half on engagement.
Theoretically, after correcting for all available study artifacts, business units in the top half on
employee engagement have over .7 standard deviation units’ higher composite performance in
comparison to those in the bottom half on engagement. This is the true score effect expected over
time, across all business units.
As alluded to, some outcomes are the direct consequence of employee engagement (i.e.,
employee turnover, customer loyalty, and safety), and other outcomes are a more downstream
result of intermediary outcomes (i.e., sales and profit). For this reason, we have also calculated
the composite correlation to short-term outcomes. Table 11 again indicates similar relationships
of satisfaction and engagement to composite performance. Observed correlations and d-values
are of the same magnitude as those reported in Table 10, but corrected correlations are higher.
Business units in the top half on engagement within companies have one-half standard deviation
higher performance on direct outcomes in comparison to those in the bottom half. Across
companies, the difference is approximately three-fourths of a standard deviation. After
correcting for all available artifacts, the difference is .87 standard deviation units.
Copyright © 2003 The Gallup Organization, Princeton, NJ. All rights reserved.

41
Table 11
Correlation of Employee Satisfaction and Engagement to Composite Business-Unit Performance —
Direct Outcomes (Turnover, Customer, Safety) Analysis Satisfaction Engagement Observed r .26 .26 d .43 .43 r corrected for dependent-variable
measurement error .31 .31 d .51 .51 r corrected for dependent-variable
measurement error and range restriction across companies .43 .45
d .73 .77 ρ corrected for dependent-variable
measurement error, range restriction, and independent-variable measurement error .50 .50
δ .87 .87
Copyright © 2003 The Gallup Organization, Princeton, NJ. All rights reserved.

42
Utility Analysis: Practicality of the Effects In the past, studies of job satisfaction’s relationship to performance have had limited analysis of
the utility of the reported relationships. Correlations have often been discounted as trivial
without an effort to understand the potential utility, in practice, of the relationships. The GWA
includes items Gallup researchers have found to be influenceable by the local manager. As such,
understanding the practical utility of potential changes is critical.
In examining the practical utility of the relationships observed in this study, we remind the reader
that item-level correlations presented in this paper are underestimates of true score relationships
because two psychometric measurement artifacts have not yet been corrected for (i.e., independent-
variable reliability and between-company range restriction). For overall satisfaction (OS) and
employee engagement (GM composite), which have more theoretical appeal, additional corrections
were made for range restriction and independent-variable measurement error (as seen in Table 10).
The research literature includes a great deal of evidence that numerically small or moderate
effects often translate into large practical effects (Abelson, 1985; Carver, 1975; Lipsey, 1990;
Rosenthal & Rubin, 1982; Sechrest & Yeaton, 1982). As shown in Table 12, this is, in fact, the
case here. Effect sizes referenced in this study are consistent with or above other practical effect
sizes referenced in other reviews (Lipsey & Wilson, 1993).
A more intuitive method of displaying the practical value of an effect is that of binomial effect size displays,
or BESDs (Grissom, 1994; Rosenthal & Rubin, 1982). BESDs typically depict the success rate of a
treatment versus a control group as a percentage above the median on the outcome variable of interest.
Copyright © 2003 The Gallup Organization, Princeton, NJ. All rights reserved.

43
BESDs can be applied to results of this study. Table 12 provides the percentage of business units
above the median on the outcomes of interest for high- and low-scoring business units on the
employee engagement (GM) composite measure. True validity estimates (correcting for
measurement error only in the dependent variable) were used for analysis of business units both
within companies and across companies.
Table 12
BESDs for GWA Dimensions Sum of the 12 Items
Business Units
Within Company Business Units
Across Companies
Employee Measure % Above Median on Customer Loyalty Metrics
Top Half 61% 65% Bottom Half 39% 35%
% Above Median on Profitability Top Half 56% 59% Bottom Half 44% 41%
% Above Median on Productivity Top Half 58% 62% Bottom Half 42% 38%
% Below Median on Turnover Top Half 60% 64% Bottom Half 40% 36%
% Below Median on Safety Incidents Top Half 62% 67% Bottom Half 38% 33%
% Above Median on Composite Performance (Total) Top Half 64% 69% Bottom Half 36 31%
% Above Median on Composite Performance (Direct Outcomes)
Top Half 66% 73% Bottom Half 34 27%
Copyright © 2003 The Gallup Organization, Princeton, NJ. All rights reserved.

44
One can see from Table 12 that there are meaningful differences between the top and bottom
halves; again, the top half is defined as the average of business units scoring in the highest 50%
on the GM, and business units scoring in the bottom half comprise the lowest 50%. It is clear
from Table 12 that management would learn a great deal more about success if it studied what
was going on within top-half business units rather than bottom-half units. Within companies,
business units in the top half on employee engagement had, on average, a 56% higher success
rate on customer loyalty metrics [i.e., (61% – 39%)/39% = 56.4%], a 50% higher success rate on
turnover (lower probability of turnover), a 38% higher success rate on productivity outcomes,
and a 27% higher success rate on profitability. For the safety variable, business units in the top
half on employee engagement had, on average, a 63% higher success rate (lower probability of
injuries or lost workdays). For business units across companies, those in the top half on
employee engagement had, on average, an 86% higher success rate on customer metrics, a 78%
higher success rate on turnover (lower probability of turnover), a 63% higher success rate on
productivity outcomes, a 44% higher success rate on profitability outcomes, and a 103% higher
success rate on safety (lower probability of injuries or lost workdays).
Other forms of expressing the practical meaning behind the effects from this study include utility
analysis methods (Schmidt & Rauschenberger, 1986). Formulas have been derived for estimating
the dollar-value increases in output as a result of improved employee selection. These formulas
can be used in estimating the difference in performance outcomes at different levels in the
distribution of GWA scores. Previous studies (Harter & Schmidt, 2000 and Harter et al., 2002)
provided utility analysis examples, comparing differences in outcomes between the top and
bottom quartiles on the 12-item overall GWA composite (GM). For companies included in this
Copyright © 2003 The Gallup Organization, Princeton, NJ. All rights reserved.

45
meta-analysis, it is typical to see differences between top and bottom engagement quartiles of 2-
4 points on customer loyalty, 1-4 points on profitability, hundreds of thousands of dollars on
productivity figures per month, and 4-10 points in turnover for low-turnover companies and 15-
50 points for high-turnover companies. Such differences and their utility in dollar terms should
be calculated for each company, given the company’s unique metrics, situation, and distribution
of outcomes across business units.
One can see that the above relationships are nontrivial if the business has many business units.
The point of the utility analysis, consistent with literature that has taken a serious look at utility,
is that the relationship between employee engagement and business outcomes, even
conservatively expressed, is meaningful from a practical perspective.
Copyright © 2003 The Gallup Organization, Princeton, NJ. All rights reserved.

46
Discussion
Findings reported in this updated meta-analysis provide cross-validation to prior meta-analyses
conducted on the GWA instrument. The relationship between engagement and performance (at
the business-unit level) is substantial. There is evidence from this and other studies to suggest
direction of causality. The studies in this updated meta-analysis include predictive data, with
performance outcomes trailing the GWA measurement. Across studies, correlations of GWA
items and overall indices with outcomes were widely generalizable, with variance in correlations
attributable to sampling error and other artifacts. Consequently, the design of the study
(predictive versus concurrent) was not considered as a moderator of the effect sizes. Evidence of
directionality (through multiple time periods and path analysis) can be seen in individual case
studies provided in The Gallup Research Journal (Fleming, 2000) and more recently, in a path
analysis study of meta-analytic cross-lag effects (Harter et al., 2003). These studies have
indicated a directional relationship from employee engagement to outcomes such as employee
retention and customer loyalty/engagement, and a directional and somewhat reciprocal
relationship between engagement and financials. We would expect that in most healthy business
units, a reciprocal relationship would exist, in which engagement fuels better management and
better management fuels ownership and engagement (involvement
and enthusiasm).
The most convincing causal evidence comes, not from one study, but from a body of research
and a multitude of types of evidence, including qualitative analysis of high-performing business
units, path analysis, predictive studies, and studies of change over time. Such individual studies
are a part of Gallup’s past and ongoing workplace management research practice.
Copyright © 2003 The Gallup Organization, Princeton, NJ. All rights reserved.

47
It is also worth noting that, as Gallup consultants have educated managers and partnered with
companies on change initiatives, companies have experienced (between the first and second
years), on average, one-half standard deviation growth on employee engagement, and often a full
standard deviation growth and more after 3 or more years. A very important element in the utility
of any applied instrument and improvement process is the extent to which the variable under
study can be changed. Our current evidence is that employee engagement is changeable, and
varies widely by business unit or workgroup.
In addition, work has been done showing that, at the individual level, employee satisfaction is at
least somewhat trait related (Arvey, Bouchard, Segal, & Abraham, 1989; Bouchard, 1997). In the
present analysis, for business units, we have averaged the independent variable across
individuals, which makes our measure more a measure of business-unit performance-related
culture rather than of individual employee traits or trait-related satisfaction. In averaging across
individuals, we average out trait-related variations, producing a score that reflects the culture of
the business unit.
Studies — both completed and in progress at Gallup — examining the relationship between
changes in GWA scores and changes in business outcomes add to the causal evidence of the
relationship between business-unit-level satisfaction/engagement and business-unit results.
The authors conclude from this study, as with prior Gallup studies, that employee perceptions, as
measured by GWA items, relate to meaningful business outcomes, and that these relationships
Copyright © 2003 The Gallup Organization, Princeton, NJ. All rights reserved.

48
can be generalized across companies. The relationships observed are in the directions
hypothesized and make psychological sense. Inferences of causality will depend on various
pieces of evidence (outlined above) that are collected on an ongoing basis by Gallup researchers
and client partner researchers. In addition, future research published in academic journals may
help to shed additional light on the question of causality. Clearly, there are differences across
business units in the way employees perceive their work environments, and these differences
relate to differences in performance. Such differences represent substantial utility to businesses
and other organizations.
Copyright © 2003 The Gallup Organization, Princeton, NJ. All rights reserved.
49
References
Abelson, R. P. (1985). A variance explanation paradox: When a little is a lot.
Psychological Bulletin, 97, 129-133.
Arvey, R. D., Bouchard, T. J., Jr., Segal, N. L., & Abraham, L. M. (1989). Job satisfaction:
Environmental and genetic components. Journal of Applied Psychology, 74, 187-192.
Bangert-Drowns, R. L. (1986). Review of developments in meta-analytic method.
Psychological Bulletin, 99(3), 388-399.
Bouchard, T. J., Jr. (1997). Genetic influence on mental abilities, personality, vocational
interests, and work attitudes. Chapter 9 in Internal Review of Industrial and Organizational
Psychology, 12, 373-395. John Wiley & Sons Ltd.
Carver, R. P. (1975). The Coleman Report: Using inappropriately designed achievement
tests. American Educational Research Journal, 12, 77-86.
Fleming, J. H. (Ed.). Linkage analysis [Special issue]. (2000). The Gallup Research
Journal, 3(1).
The Gallup Organization (1992-1999). Gallup Workplace Audit (Copyright Registration
Certificate TX-5 080 066). Washington, DC: U.S. Copyright Office.
Grissom, R. J. (1994). Probability of the superior outcome of one treatment over another.
Journal of Applied Psychology, 79(2), 314-316.
Harter, J. K., & Schmidt, F. L. (2000). Validation of a performance-related and actionable
management tool: A meta-analysis and utility analysis. Technical paper, The Gallup
Organization, Lincoln, NE.
Harter, J. K., & Schmidt, F. L. (2002). Employee engagement, satisfaction, and business-
unit-level outcomes: A meta-analysis. Technical paper, The Gallup Organization, Lincoln, NE.
Copyright © 2003 The Gallup Organization, Princeton, NJ. All rights reserved.

50
Harter, J. K., Schmidt, F. L., & Hayes, T. L. (2002). Business-unit-level relationship
between employee satisfaction, employee engagement, and business outcomes: A meta-analysis.
Journal of Applied Psychology, 87, 2.
Harter, J. K., & Schmidt, F. L., Asplund, J., & Killham, E. A. (2003). Employee
engagement and business unit performance: A study of directionality. Technical paper, The
Gallup Organization, Omaha, NE.
Hunter, J. E., & Schmidt, F. L. (1983). Quantifying the effects of psychological
interventions on employee job performance and work-force productivity. American Psychologist,
38(4), 473-478.
Hunter, J. E., & Schmidt, F. L. (1990). Methods of meta-analysis: Correcting error and
bias in research findings. Newbury Park, CA: Sage.
Hunter, J. E., Schmidt, F. L., & Le, H. (2002). Implications of Direct and Indirect Range
Restriction for Meta-Analysis Methods and Findings. Technical Paper. Michigan State
University.
Huselid, M. A. (1995). The impact of human resource management practices on turnover,
productivity and corporate financial performance. Academy of Management Journal, 38(3), 635-
672.
Iaffaldano, M. T., & Muchinsky, P. M. (1985). Job satisfaction and job performance: A
meta-analysis. Psychological Bulletin, 97(2), 251-273.
Judge, T. A., Thoresen, C. J., Bono, J. E., & Patton, G. K. (2001). The job satisfaction —
job performance relationship: A qualitative and quantitative review. Psychological Bulletin, 127,
376-407.
Copyright © 2003 The Gallup Organization, Princeton, NJ. All rights reserved.

51
Lipsey, M. W. (1990). Design sensitivity: Statistical power for experimental research.
Newbury Park, CA: Sage.
Lipsey, M. W., & Wilson, D. B. (1993). The efficacy of psychological, educational, and
behavioral treatment. American Psychologist, 48(12), 1181-1209.
Mayer, R. C., & Schoorman, F. D. (1992). Predicting participation and production
outcomes through a two-dimensional model of organizational commitment. Academy of
Management Journal, 35(3), 671-684.
Mosier, C. I. (1943). On the reliability of a weighted composite. Psychometrika, 8, 161-
168.
National Technical Information Services. (1987). Standard Industrial Classification
manual. Washington, DC: Executive Office of the President, Office of Management and Budget.
Ostroff, C. (1992). The relationship between satisfaction, attitudes, and performance: An
organizational level analysis. Journal of Applied Psychology, 77(6), 963-974.
Reynierse, J. H., & Harker, J. B. (1992). Employee and customer perceptions of service in
banks: Teller and customer service representative ratings. Human Resource Planning, 15(4), 31-
46.
Rosenthal, R., & Rubin, D. B. (1982). A simple, general purpose display of magnitude of
experimental effect. Journal of Educational Psychology, 74, 166-169.
Schmidt, F. L. (1992). What do data really mean? Research findings, meta-analysis, and
cumulative knowledge in psychology. American Psychologist, 47, 1173-1181.
Schmidt, F. L., & Hunter, J. E. (1996). Measurement error in psychological research:
Lessons from 26 research scenarios. Psychological Methods, 1, 199-223.
Copyright © 2003 The Gallup Organization, Princeton, NJ. All rights reserved.

52
Schmidt, F. L., Hunter, J. E., McKenzie, R. C., & Muldrow, T. W. (1979). Impact of valid
selection procedures on work-force productivity. Journal of Applied Psychology, 64(6), 609-626.
Schmidt, F. L., Hunter, J. E., Pearlman, K., & Rothstein-Hirsh, H. (1985). Forty questions
about validity generalization and meta-analysis. Personnel Psychology, 38, 697-798.
Schmidt, F. L., & Rader (1999). Exploring the boundary conditions for interview validity:
Meta-analytic validity findings for a new interview type. Personnel Psychology, 52, 445-464.
Schmidt, F. L., & Rauschenberger, J. (1986, April). Utility analysis for practitioners. Paper
presented at the First Annual Conference of The Society for Industrial and Organizational
Psychology, Chicago.
Schmit, M. J., & Allscheid, S. P. (1995). Employee attitudes and customer satisfaction:
Making a theoretical and empirical connection. Paper presented at the 1995 Society for
Industrial and Organizational Psychology Meeting, Chicago.
Schneider, B. (1991). Service quality and profits: Can you have your cake and eat it too?
Human Resource Planning, 14(2), 151-157.
Schneider, B., Ashworth, S., Higgs, C., & Carr, L. (1996). Design, validity, and use of
strategically focused employee attitude surveys. Personnel Psychology, 49(3), 695-705.
Schneider, B., & Bowen, D. E. (1992). The service organization: Human resources
management is crucial. Organizational Dynamics, 39-52.
Schneider, B., White, S., & Paul, M. (1998). Linking service climate and customer
perceptions of service quality: Test of a causal model. Journal of Applied Psychology, 83(2),
150-163.
Sechrest, L., & Yeaton, W. H. (1982). Magnitudes of experimental effects in social science
research. Evaluation Review, 6, 579-600.
Copyright © 2003 The Gallup Organization, Princeton, NJ. All rights reserved.

53
Ulrich, D., Halbrook, R., Meder, D., Stuchlik, M., & Thorpe, S. (1991). Employee and
customer attachment: Synergies for competitive advantage. Human Resource Planning, 14(2),
89-103.
Wiley, J. W. (1991). Customer satisfaction: A supportive work environment and its
financial cost. Human Resource Planning, 14(2), 117-127.
Copyright © 2003 The Gallup Organization, Princeton, NJ. All rights reserved.
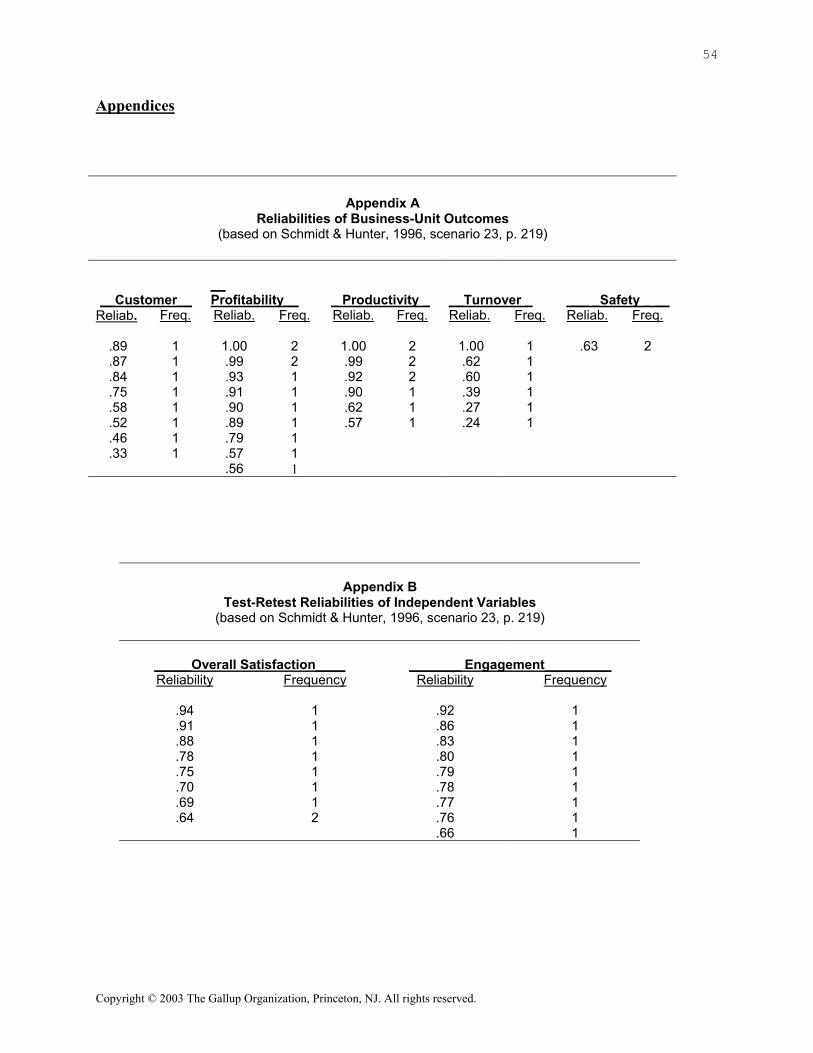
54
Appendices
Appendix A Reliabilities of Business-Unit Outcomes
(based on Schmidt & Hunter, 1996, scenario 23, p. 219)
__Customer__ __ Profitability__ _ Productivity _ __Turnover _ ___ _Safety _ __
Reliab. Freq. Reliab. Freq. Reliab. Freq. Reliab. Freq. Reliab. Freq.
.89 1 1.00 2 1.00 2 1.00 1 .63 2
.87 1 .99 2 .99 2 .62 1
.84 1 .93 1 .92 2 .60 1
.75 1 .91 1 .90 1 .39 1
.58 1 .90 1 .62 1 .27 1
.52 1 .89 1 .57 1 .24 1
.46 1 .79 1
.33 1 .57 1 .56 1
Appendix B
Test-Retest Reliabilities of Independent Variables (based on Schmidt & Hunter, 1996, scenario 23, p. 219)
_____Overall Satisfaction____ _______ Engagement_________ Reliability Frequency Reliability Frequency
.94 1 .92 1 .91 1 .86 1 .88 1 .83 1 .78 1 .80 1 .75 1 .79 1 .70 1 .78 1 .69 1 .77 1 .64 2 .76 1
.66 1
Copyright © 2003 The Gallup Organization, Princeton, NJ. All rights reserved.