emerging trends and challenges in electric power · pdf fileemerging trends and challenges in...
TRANSCRIPT

Emerging Trends and Challenges in Electric Power Systems
Dr. Bharat Singh Rajpurohit

Objective
• Introduction to Indian power systems and emerging trends.
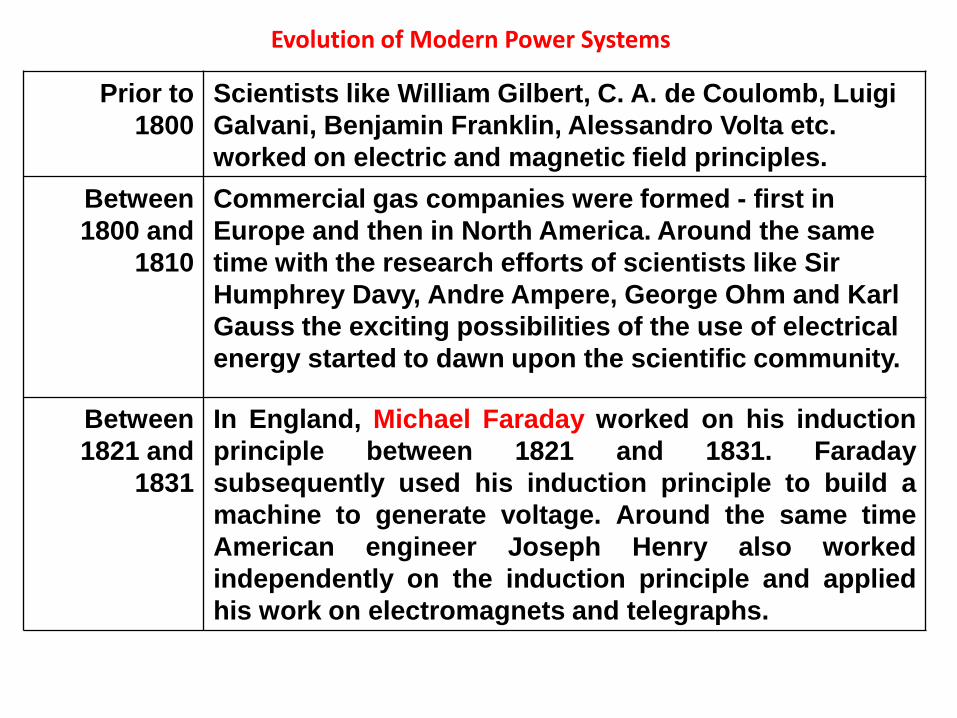
Evolution of Modern Power Systems
Prior to
1800
Scientists like William Gilbert, C. A. de Coulomb, Luigi
Galvani, Benjamin Franklin, Alessandro Volta etc.
worked on electric and magnetic field principles.
Between
1800 and
1810
Commercial gas companies were formed - first in
Europe and then in North America. Around the same
time with the research efforts of scientists like Sir
Humphrey Davy, Andre Ampere, George Ohm and Karl
Gauss the exciting possibilities of the use of electrical
energy started to dawn upon the scientific community.
Between
1821 and
1831
In England, Michael Faraday worked on his induction
principle between 1821 and 1831. Faraday
subsequently used his induction principle to build a
machine to generate voltage. Around the same time
American engineer Joseph Henry also worked
independently on the induction principle and applied
his work on electromagnets and telegraphs.

Evolution of Modern Power Systems
Between 1840
and 1870
Engineers like Charles Wheatstone, Alfred Varley, Siemens
brothers Werner and Carl etc. built primitive generators using
the induction principle. It was also observed around the same
time that when current carrying carbon electrodes were
drawn apart, brilliant electric arcs were formed. The
commercialization of arc lighting took place in the decade of
1870s. The arc lamps were used in lighthouses and streets
and rarely indoor due to high intensity of these lights. Gas
was still used for domestic lighting.
1879 From early 1800 it was noted that a current carrying
conductor could be heated to the point of incandescent.
Therefore the idea of using this principle was very tempting
and attracted attention.
However the incandescent materials burnt very quickly to be
of any use.
To prevent them from burning they were fitted inside either
vacuum globes or globes filled with inert gas. In October
1879 Thomas Alva Edison lighted a glass bulb with a
carbonized cotton thread filament in a vacuum enclosed
space. This was the first electric bulb that glowed for 44
hours before burning out.

Evolution of Modern Power Systems
Late 1870s Commercial use of electricity
1882
First Electric power system ( Gen., cable, fuse,
load) by Thomas Edison at Pearl Street Station in
NY.
- DC system, 59 customers, 1.5 km in radius
- 110 V load, underground cable, incandescent
Lamps
1884
1886
1889
Motors were developed by Frank Sprague
Limitation of DC become apparent
- High losses and voltage drop.
- Transformation of voltage required.
Transformers and AC distribution (150 lamps)
developed by William Stanley of Westinghouse
First ac transmission system in USA between
Willamette Falls and Portland, Oregon.
- 1- phase, 4000 V, over 21 km

Evolution of Modern Power Systems (Contd.)
1888 N. Tesla developed poly-phase systems and
had patents of gen., motors, transformers, trans.
Lines.
Westinghouse bought it.
1890s Controversy on whether industry should
standardize AC or DC. Edison advocated DC
and Westinghouse AC.
- Voltage increase, simpler & cheaper gen. and
motors
1893 First 3-phase line, 2300 V, 12 km in California.
ac was chosen at Niagara Falls ( 30 km)

1922
1923
1935
1953
1965
1966
1969
19902
000s
Early Voltage (Highest)
165 kV
220 kV
287 kV
330 kV
500 kV
735 kV
765 kV
1100 kV
1200 kV
Standards are 115, 138, 161, 230 kV – HV
345, 400, 500 kV - EHV
765, 1100 1200 kV - UHV
The motivation for these voltage changes is to minimize transmission line cost for a given power level.
Earlier Frequencies were
25, 50, 60, 125 and 133 Hz; USA - 60 Hz and some
countries - 50 Hz

1950s
1954
HVDC Transmission System
Mercury arc valve
First HVDC transmission between Sweden and
Got land island by cable
Limitations of HVAC Transmission
1. Reactive Power Loss
2. Stability
3. Current Carrying Capacity
4. Ferranti Effect
5. No smooth control of power flow

Recent Trends in Technologies
• Power electronics application to power systems • Good signal processing techniques for design & control
• Increased rating of semiconductor devices
• Development in materials: machines, conductors, insulators, cooling
• Superconducting Electric Machines/Transmission Lines
• Development of cheap digital signal processing controllers
• Small asynchronous generation
• Design of systems using CAD and validation through FEM.
• New applications from electric vehicles.
• Awareness for renewable energy
• Micro-grid, DC and AC
• Smart Grids
•Maintaining Security, Reliability and Resilience of Large Interconnected System
•Maintaining Quality of Supply and IT Enabled Services in Distribution Sector
• Regulatory Changes in the Electricity Sector

Interconnected
transmission
and
transformation
400kv
220kv
132kv
(GT)(GS)(GT)11KV
(GS)
Sub transmission system
66kv
(GT)
Small generating unit
Primary distribution
33kv,25kv,11kv
Secondary distribution
400v
THE LINE
THE LINE
Structure of Power System in India

Introduction
• The world needs energy innovation • Problem : Security of supply, climate change and sustainability
• Solution : Transitions to clean, reliable and affordable energy
• Methods : Renewable energy, energy savings and clean use of fossil fuels
• Wind power/Solar power • Proved as a potential source for generation of electricity
• Minimal environmental impact
• Fastest-growing source and expected to remain in future
• Modern wind/solar farms • Can capture several MWs of power (7 MW largest wind turbine)
• Can supplement the base power

Installed Generation Capacity
Installed Power Generation
Capacity (Jan. 2014)
229 GW Total
156-Thermal power
40-Hydro
4.8-Nuclear
30-Renewable
Renewable Energy Sources (Jan. 2014)
30 GW
20-Wind
7.6-Small-hydro (< 25 MW)
1.3- Biomass Power & Gasification nuclear
2.5- Baggasse cogeneration
2.2-Solar power


Key Drivers
Towards Sustainability in Electric Energy
Renewable Purchase Obligation (RPO) -Solar & non-solar
-Issued by States (SERC & CERC)
-Obligated by power utilities
*RPO is the minimum amount of renewable energy to be purchased by the
States in order to meet the mandatory electric energy requirement.

Conventional power plants Large synchronous machines
Provides primary & secondary control
Meet the specific grid connection requirements (GCR)
With increased penetration of wind/solar power Mostly converter interfaced small asynchronous generators/ generations,
Poses new challenges in maintaining reliability and stability of electricity supply,
Advanced GCR are required to be developed for efficient, stable and secure operation
of grid ,
Loss of generation cannot be tolerable,
Need to perform suitable studies to analyze the interaction of wind/solar power with
existing grid,
Need to develop several solutions to improve and mitigate negative consequences on
the existing grid, if any.
Intermittency (reliability, stability etc.) and High Cost
With high penetration of RES

ALL INDIA
INSTALLED CAPACITY
NORTH :- 53.9 GW
EAST :- 26.3 GW
SOUTH :- 52.7 GW
WEST :- 64.4 GW
NORTH-EAST :- 2.4 GW
TOTAL :- 200 GW
REGIONAL GRIDS
Total 3,287,263 sq. km area More than 1 Billion people
SOUTHERN
REGION
WESTERN
REGION
EASTERN
REGION
NORTHERN
REGION NORTH-EASTERN REGION
REGIONAL GRIDS Area : 1010,000 SQ KMS
Population : 369 Million Peak Demand : 37 GW
Max energy Consumption: 873 MU
Area : 951470 SQ KMS Population : 273 Million Peak Demand : 37 GW
Max energy consumption : 832 MU
Area : 636280 SQ KMS Population : 252 Million Peak Demand : 30 GW
Max energy consumption : 726 MU
Area : 433680 SQ KMS Population : 271 Million Peak Demand : 14 GW
Max energy consumption: 294 MU
Area : 255,090 SQ KMS Population : 44 Million Peak Demand : 1.7GW
Max energy consumption : 33 MU
Total 3,287,263 sq. km area
More than 1.2 Billion people As on 31st March 2012

Inter-regional links – At present
CHANDRAPUR
U.SILERU
NAGJHARI
SR
KOLHAPUR
PONDA
BELGAUM
MW1000
GAZUWAKA
RAIPUR
VINDHYACHAL
GORAKHPUR
WR
GWALIOR
UJJAIN
MALANPUR
AGRA
KOTA
AURAIYA
NR
BIRPARA
ER
MALDA
PURI
BALIMELA
KORBA
ROURKELA
TALCHER
DEHRI
SAHU
BALIAMUZAFFARPUR
PATNA
BARH
NERBONGAIGAON
SALAKATI
1000MW
500MW
BUDHIPADAR
SASARAM
Inter-regional capacity : 14,600MW

Peculiarities of Regional Grids in India
SOUTHERN
REGION
WESTERN
REGION
EASTERN
REGION
NORTHERN
REGION NORTH-
EASTERN
REGION
REGIONAL GRIDS
Deficit Region
Snow fed – run-of –the –river hydro
Highly weather sensitive load
Adverse weather conditions: Fog & Dust
Storm
Very low load
High hydro potential
Evacuation problems
Industrial load and agricultural load
Low load
High coal reserves
Pit head base load plants
High load (40% agricultural load)
Monsoon dependent hydro

12/27/2014 NLDC - POSOCO 19
NEW Grid
South Grid
South
West
North
East
Northeast
Five Regional Grids
Five Frequencies
October 1991
East and Northeast
synchronized
March 2003
West synchronized
With East & Northeast
August 2006
North synchronized With Central Grid
Central Grid
Five Regional Grids
Two Frequencies
MERGING OF MARKETS
Renewables: 24 GW
Installed Capacity: 201 GW
SR Synch By 2013-14
Inter – Regional
Capacity:
25 GW
Evolution of the Grid
12/27/2014 NLDC - POSOCO 20 NLDC 20
ROURKELA
RAIPURHIRMA
TALCHER
JAIPUR
NER
ER
WR
NR
SR
B'SHARIF
ALLAHABAD
SIPAT
GAZUWAKA
JEYPORECHANDRAPUR
SINGRAULI
VINDHYA-
2000
MW
2000MW
2500MW
1000MW
500MW
LUCKNOW
DIHANG
CHICKEN NECK
TEESTA
TIPAIMUKH
BADARPUR
MISA
DAMWE
KATHAL-GURI
LEGEND
765 KV LINES
400 KV LINES
HVDC B/B
HVDC BIPOLE
EXISTING/ X PLAN NATIONAL
ZERDA
HISSAR
BONGAIGAON
DEVELOPMENT OF NATIONAL GRID
KOLHAPUR
NARENDRA
KAIGA
PONDA
IX PLAN
MARIANI
NORTH
KAHALGAON
RANGANADI
SEONI
CHEGAON
BHANDARA
DEHGAM
KARAD
LONIKAND
VAPI
GANDHAR/
TALA
BANGLA
BALLABGARH A'PUR(DELHI RING)
BANGALORE
KOZHIKODE
COCHIN
KAYAMKULAM
TRIVANDRUM
PUGALUR
KAYATHAR
KARAIKUDI
CUDDALORE
SOUTH CHENNAI
KRISHNAPATNAM
CHITTOOR
VIJAYAWADA
SINGARPET
PIPAVAV
LIMBDI
KISHENPUR
DULHASTI
WAGOORA
MOGA
URI
BHUTAN
RAMAGUNDAM
SATLUJRAVI
JULLANDHAR
DESH
VARANASI/UNNAO
M'BAD
PURNEA
KORBA
NAGDA
SILIGURI/BIRPARA
LAK
SH
AD
WE
EP
TEHRI
MEERUT
BHIWADI
BINA
SATNA
MALANPURSHIROHI
KAWAS
AMRAVATI
AKOLA
AGRA
SIRSI
CHAL
JETPURAMRELI
BOISARTARAPUR
PADGHE
DHABOL
KOYNA
BARH
G'PUR
HOSURMYSORE
KUDANKULAM
M'PUR
KARANPURA
MAITHON
JAMSHEDPUR
PARLI
WARDA
BEARILLY
SALEM GRID
XI PLAN
765 KV LINES IN X PLAN. TO BE CHARGED AT 400KV INITIALLY
TO BE CHARGED AT 765 KV UNDER NATIONAL GRID
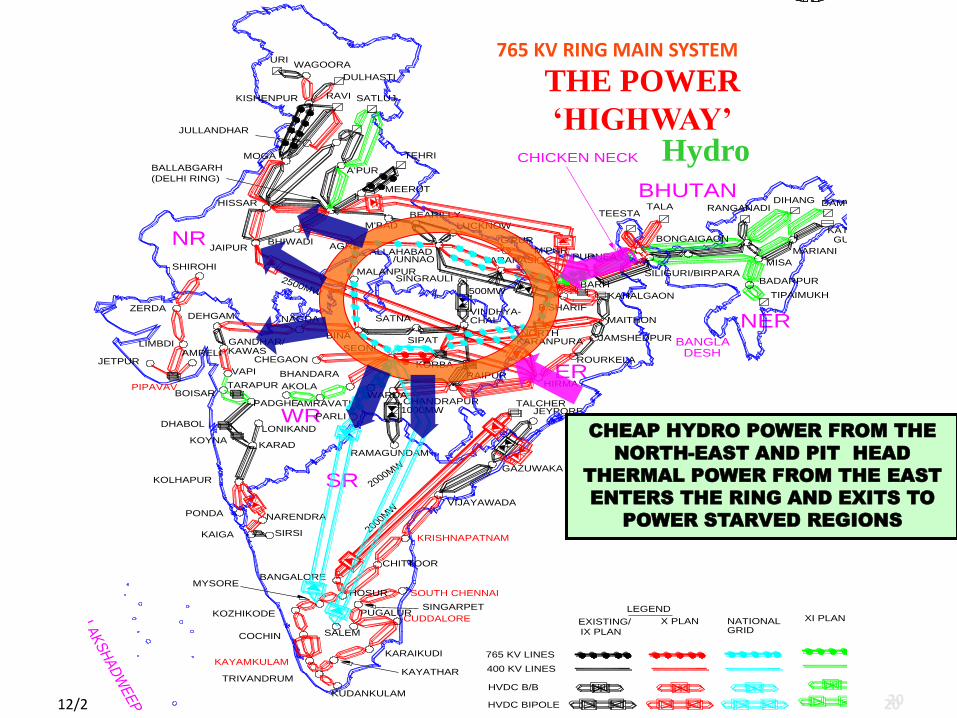
765 KV RING MAIN SYSTEM
THE POWER
‘HIGHWAY’
CHEAP HYDRO POWER FROM THE
NORTH-EAST AND PIT HEAD
THERMAL POWER FROM THE EAST
ENTERS THE RING AND EXITS TO
POWER STARVED REGIONS
Hydro

New Transmission Technologies
• High Voltage Overhead Transmission
– Voltage up to 1200 kV
– High EM radiation and noise
– High corona loss
– More ROW clearance
• Gas Insulated Cables/Transmission lines
• HVDC-Light
• Flexible AC Transmission Systems (FACTS)

• Developments in Generation side
– Powerformer Energy System
– Distributed/Renewable Generations
• Wind Power
• Fuel Cells
• Solar
• Biomass etc.
– Combined Cycle Power Plants
– DC Distribution System
– Smart grid

Powerformer Energy System
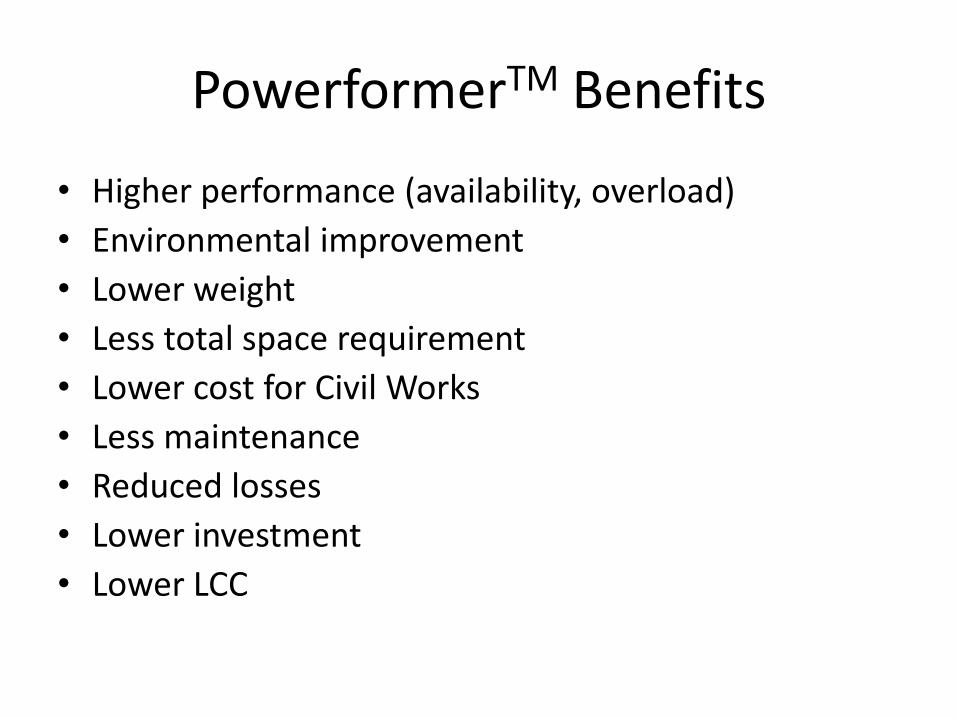
PowerformerTM Benefits
• Higher performance (availability, overload)
• Environmental improvement
• Lower weight
• Less total space requirement
• Lower cost for Civil Works
• Less maintenance
• Reduced losses
• Lower investment
• Lower LCC
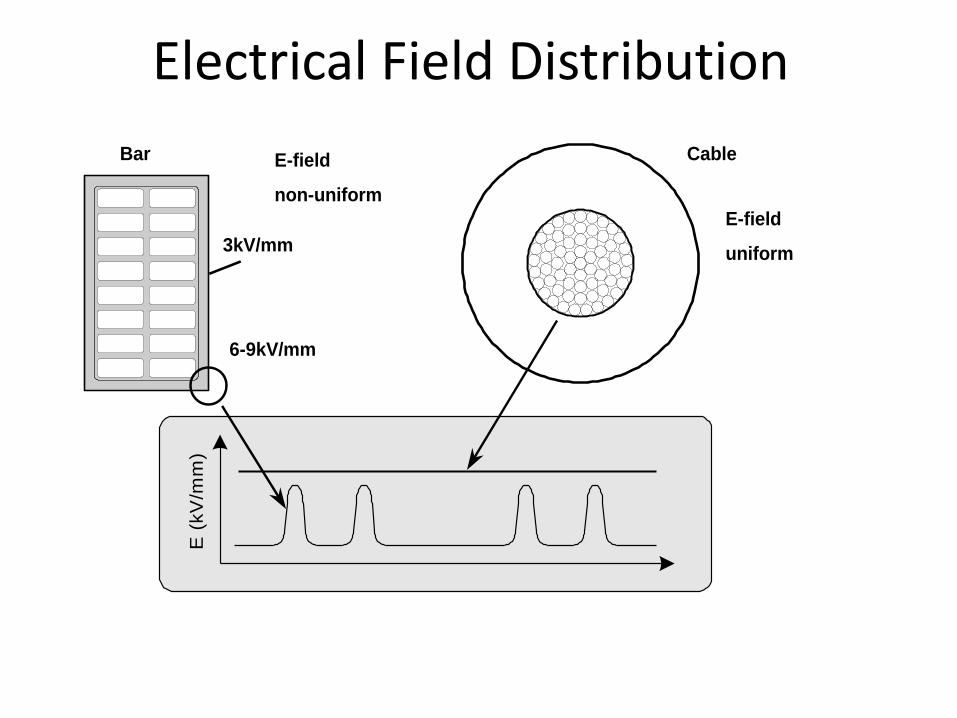
E (
kV
/mm
)
3kV/mm
6-9kV/mm
E-field
non-uniform
E-field
uniform
Bar Cable
Electrical Field Distribution

DG “Wins” Not Because It is Efficient, But Because It Avoids T&D Costs
Proximity is often more important than efficiency
Why use DG units, if they are not most efficient or the lowest cost? The reason is that they are closer to the customer. They only have
to be more economical than the central station generation and its associated T&D system. A T&D system represents a significant cost in initial capital and continuing O&M.
By avoiding T&D costs and those reliability problems, DG can provide better service at lower cost, at least in some cases. For example, in situations where an existing distribution system is near capacity, so that it must be reinforced in order to serve new or additional electrical demand, the capital cost/kW for T&D expansion alone can exceed that for DG units.

• Power System Restructuring (Privatization or Deregulation) – But not only Privatization
• Deregulation is also known as
– Competitive power market – Re-regulated market – Open Power Market – Vertically unbundled power system – Open access

Transmission
Business
Distribution
Business
Generation
Business
Vertical separation
Horizontal separation or Vertical cut
Horizontal separation or Vertical cut

• Why Restructuring of Electric Supply Industries? – Better experience of other restructured market
such as communication, banking, oil and gas, airlines, etc.
– Competition among energy suppliers and wide choice for electric customers.
• Why was the electric utility industry regulated? – Regulation originally reduced risk, as it was
perceived by both business and government.
– Several important benefits: • It legitimized the electric utility business.
• Forces behind the Restructuring are – High tariffs and over staffing
– Global economic crisis
– Regulatory failure
– Political and ideological changes
– Managerial inefficiency
– Lack of public resources for the future development
– Technological advancement
– Rise of environmentalism
– Pressure of Financial institutions
– Rise in public awareness
– Some more …….

Intelligent Grid - WAMS
Leader not a follower

• What is Smart Grid?
• Is the present grid not smart?
• Why Smart Grid?
• Smart or Intelligent ???

Merging Two Technologies
Electrical
Infrastructure
Information Infrastructure
The integration of two infrastructures… securely…
Source: EPRI® Intelligrid at http://intelligrid.epri.com

Some of the Recent Concerns • Limited expansion of transmission network as compared
to the generation addition. – Most of the generation, T&D systems have become old.
• Efficiency: Increased transmission and distribution losses.
• Lack of dynamic data for health monitoring and control.
• Reliability & Security: Increased concern towards vulnerability and resilience of the system under natural and man made disasters.
• Growing environmental concerns including the global warming.
• Poor power quality, limited customer focus and their participation in energy Management.
• Meeting the ever increasing electricity demand.
• Affordability:

Present and Future Power System
Present Power System - Heavily Relying on Fossil Fuels - Generation follows load - Limited ICT use
Future Power System - More use of RES, clean coal,
nuclear power - Load follows Generation - More ICT & Smart meter use

Today’s Electricity …
Power park
Hydrogen Storage
Industrial DG
Tomorrow’s Choices …
Combined Heat and Power
Fuel Cell e -
e -
Wind Farms
Rooftop Photovoltaics
Remote Loads
Load as a resource
SMES
Smart Substation
Fuel Cell

What a Smart Grid would look like? Green, Environment friendly
Source: European Technology Platform SmartGrids

Micro Grid (DC or AC ?)
• Micro-grids are independently controlled (small) electric
networks, powered by local units (distributed generation).
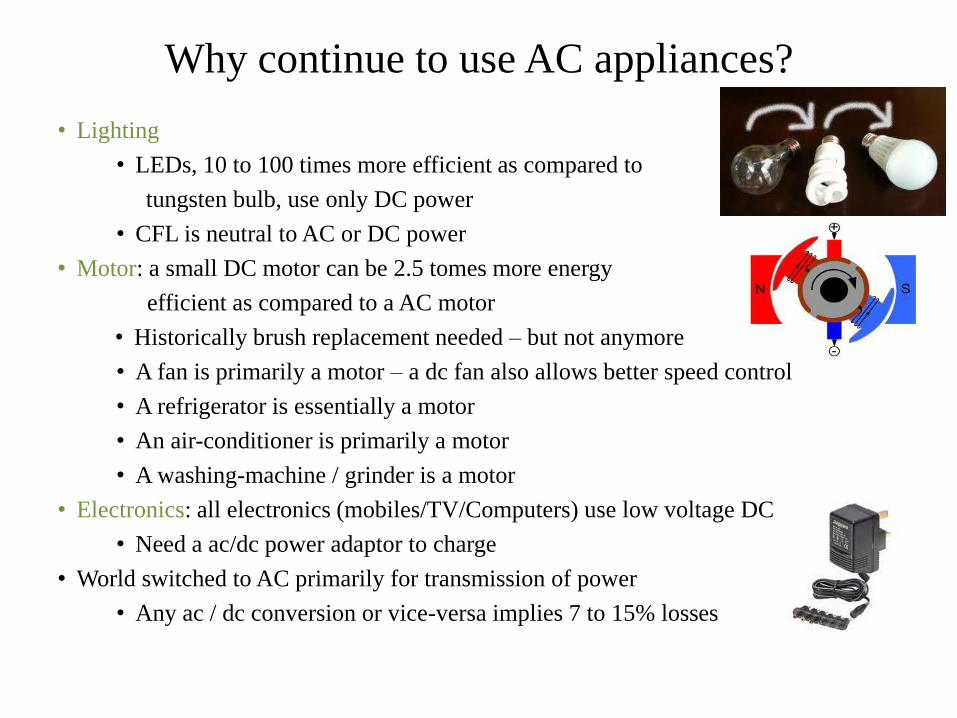
Why continue to use AC appliances?
• Lighting
• LEDs, 10 to 100 times more efficient as compared to
tungsten bulb, use only DC power
• CFL is neutral to AC or DC power
• Motor: a small DC motor can be 2.5 tomes more energy
efficient as compared to a AC motor
• Historically brush replacement needed – but not anymore
• A fan is primarily a motor – a dc fan also allows better speed control
• A refrigerator is essentially a motor
• An air-conditioner is primarily a motor
• A washing-machine / grinder is a motor
• Electronics: all electronics (mobiles/TV/Computers) use low voltage DC
• Need a ac/dc power adaptor to charge
• World switched to AC primarily for transmission of power
• Any ac / dc conversion or vice-versa implies 7 to 15% losses
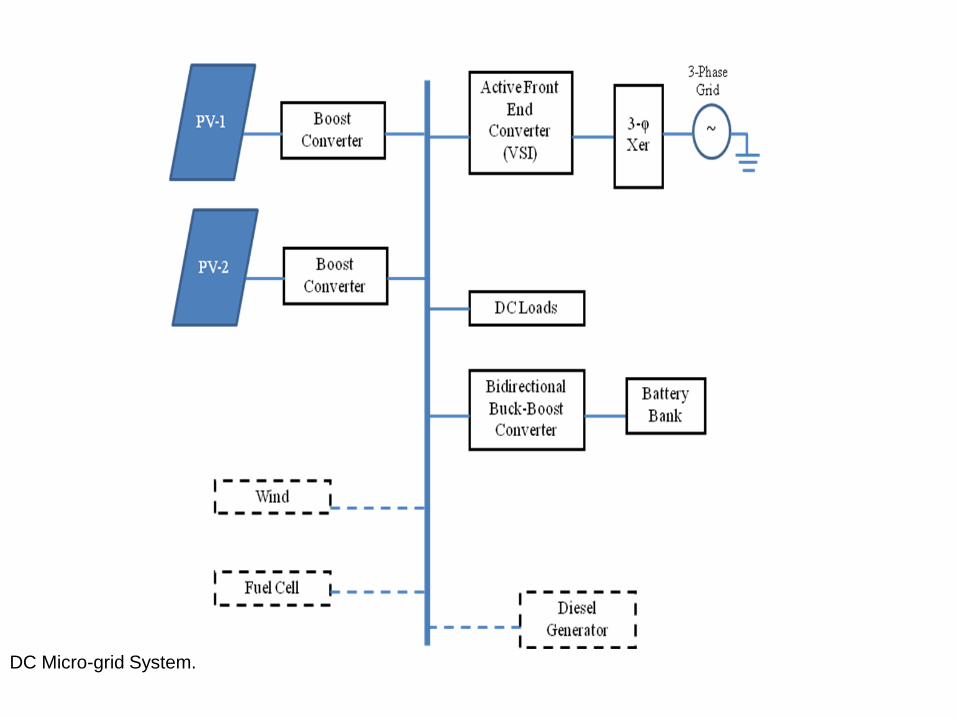
DC Micro-grid System.

Hybrid AC/DC Microgrid

AC vs. DC Micro Grid
Some of the issues with Edison’s dc system:
Voltage-transformation complexities
Incompatibility with induction (AC) motors
Power electronics help to overcome difficulties
Also introduces other benefits – DC micro-grids
DC micro-grids
Help eliminate long AC transmission and distribution paths
Most modern loads are DC – modernized conventional loads too!
No need for frequency and phase control – stability issues?

AC vs. DC Micro Grid
Cabling in DC distribution
Greater current carrying capacity with DC system over AC
Therefore smaller and cheaper distribution cables for a
given power
Interconnection into HVDC schemes
Lower reacatance as large transformers & filters AC can be
removed at offshore platform
Less components provides higher availability and less
maintenance
DC transformer less, & filter less generation can provide
efficiency improvements

Challenges to DC systems
Technology
Lack of DC on-load circuit breakers.
– Converteam’s Foldback Technology provides a solution
Can we generate in DC effectively?
Standards
Real need for open standards if ideas such as Multi-
terminal HVDC schemes, i.e. Supergrid, are to be realised
– Best achieved at pre-competitive stage
Supply chain partnering
To be ready and on time
Fantastic opportunities for innovation
Great challenges for Universities and R&D teams

Thank You and Questions
Energy Management System for DC Micro Grid
Presented By : Rajeev Kumar Chauhan
School of Computing & Electrical Engineering
Indian Institute of Technology Mandi, India

29-12-2014 R.K. Chauhan, IIT Mandi, India

India is running shortage of 11% peak demand.
Power losses in transmission and distribution
system are more than 24% [2].
The energy consumption in commercial and
residential is increased by 20% and 40% in
developed countries [3].
29-12-2014 R.K. Chauhan, IIT Mandi, India

Generation
Conventional Power Plant
Renewable Energy Source (RES)
Line Losses
Transmission and Distribution System
Conversion Losses
Energy Efficient Buildings
Demand Management
29-12-2014 R.K. Chauhan, IIT Mandi, India
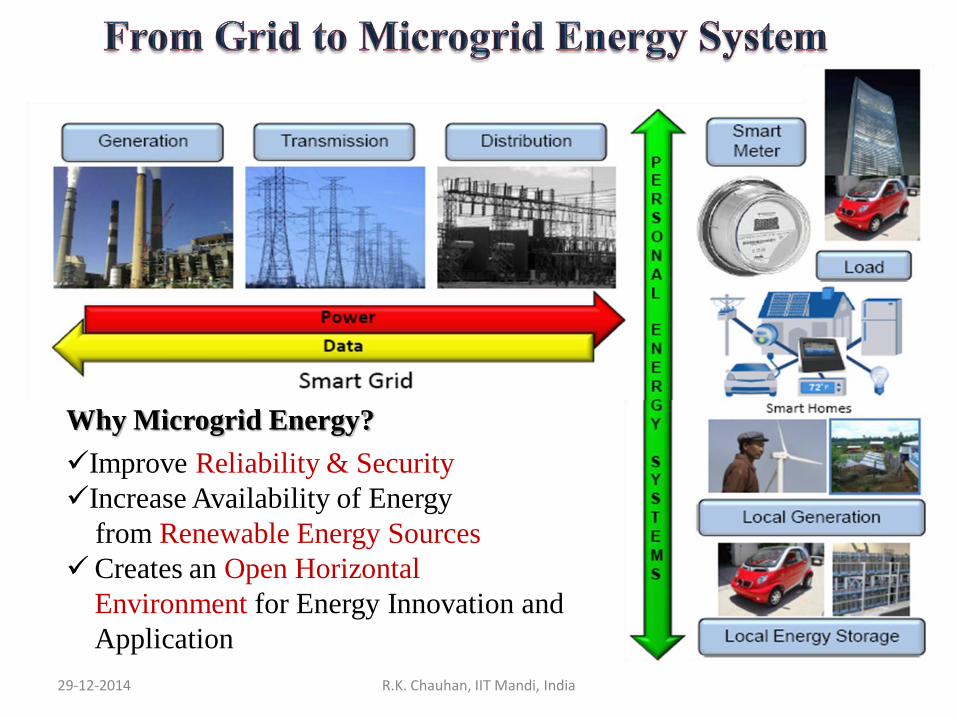
Why Microgrid Energy?
Improve Reliability & Security
Increase Availability of Energy
from Renewable Energy Sources
Creates an Open Horizontal
Environment for Energy Innovation and
Application
29-12-2014 R.K. Chauhan, IIT Mandi, India
• Nano- Grid
An electrical power system as described in the two universal
points of agreement that serves a defined space in one building.
• Micro- Grid
A micro-grid consists of interconnected distributed energy
resources capable of providing sufficient and continuous energy
to a significant portion of internal load demand.
Or
An electrical power system as described in the two universal
points of agreement that serves one building
• Mini-Grid
An electrical power system as described in the two universal
points of agreement that serves more than one building.
29-12-2014 R.K. Chauhan, IIT Mandi, India

29-12-2014 R.K. Chauhan, IIT Mandi, India

29-12-2014 R.K. Chauhan, IIT Mandi, India

Energy Storage
Battery
Electrical Vehicles
Renewable Energy Sources
Solar Photovoltaic
Wind
Small Hydro Power Plant
DC Energy Sources
Lighting
LEDs, 10 to 100 times more efficient as compared to
tungsten bulb, use only DC power
CFL is neutral to AC or DC power
Motor
The micro-grid applications utilizes BLDCs
Conventional DC machines need brush replacement
– but not anymore
DC Appliances
29-12-2014 R.K. Chauhan, IIT Mandi, India
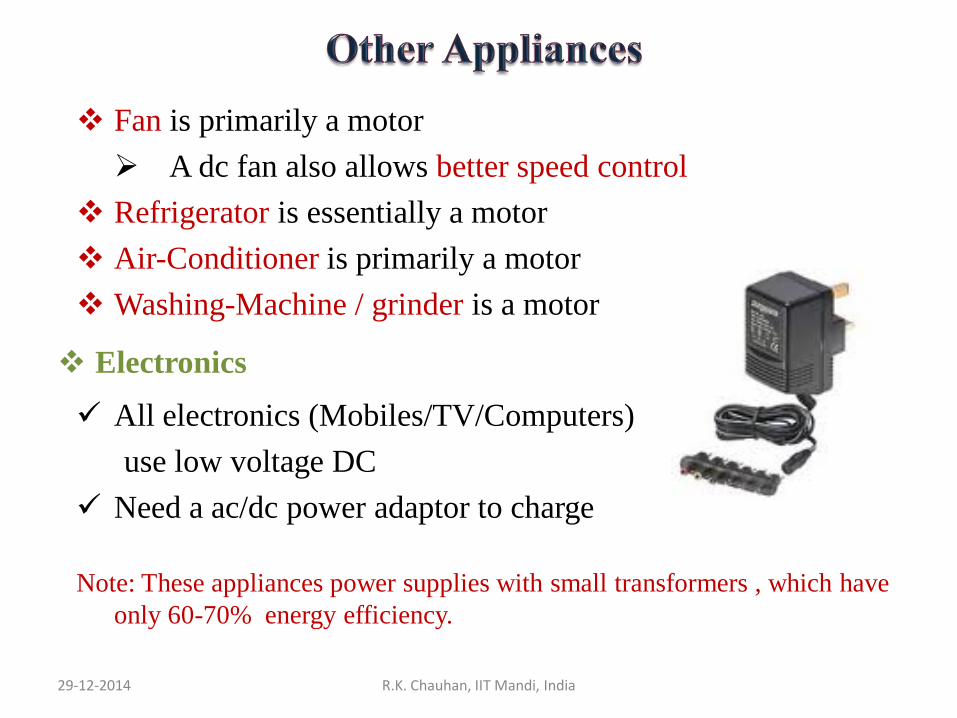
Fan is primarily a motor
A dc fan also allows better speed control
Refrigerator is essentially a motor
Air-Conditioner is primarily a motor
Washing-Machine / grinder is a motor
Electronics
All electronics (Mobiles/TV/Computers)
use low voltage DC
Need a ac/dc power adaptor to charge
Note: These appliances power supplies with small transformers , which have
only 60-70% energy efficiency.
29-12-2014 R.K. Chauhan, IIT Mandi, India

• A DC system requires only two conductors as compared to
three for AC system.
• A DC system has no inductance as a result the voltage drop in
DC system is less than that of AC system for same load and
hence a better voltage regulation.
• A DC system has no skin effect so we can utilize entire cross
section area of the line conductor.
• A DC system requires less insulation than an AC system
because of less potential stress for same working voltage.
29-12-2014 R.K. Chauhan, IIT Mandi, India
29-12-2014 R.K. Chauhan, IIT Mandi, India
Absence of capacitance in DC system leads to less power loss
because there is no need for charge and discharge of
capacitance.
DC system reduces the amount of resistance in the line.
Use of non-conventional energy like wind and solar reduce
the carbon emission in the atmosphere.
The Power Quality is not a issue.

• It is easier to enhance the capacity of the system by adding
additional DC power generating sources like PV, fuel cell, wind
turbine and the integration is much easier than the integration in
AC bus.
• System reliability is higher. In AC bus system, if any power
generating source like an alternator fails, there is a good chance
of circulating current to flow though the alternator and there is a
big impact on the system.
• DER ability to inject fault current contributions and power into
the utility system, a dc approach is an interesting way to prevent
such injections.
29-12-2014 R.K. Chauhan, IIT Mandi, India

• However, in common DC bus, every power-generating source
can be isolated using diodes and they are able to share the
power independently.
• The dc approach is able to avoid almost all of the key
complications of interconnection because they isolate the
generation from the grid.
• The blocking diode prevents power injection into the ac
system during both steady state and transient system
conditions.
• No fault contributions, or reverse power injection from the dc
system into the ac power system.
• Ripple management can be accomplished by adding more
capacitors in the DC bus. 29-12-2014 R.K. Chauhan, IIT Mandi, India

V = 2×Vacdc
3 3V = Vpdc
Single phase system: Volt
Three phase system: Volt
PI=V
Current Ampere
= Line resistance; = Power transfer; = peak value of the phase (line to neutral) input voltages
2p=I R Power Loss Watt
P
Vdc
R
Where = DC system voltage, = AC System Voltage; = System Current ; Vac
pV29-12-2014
I
DC Voltage AC Voltage Reduction in Current Rating Reduction Power losses
325 230 29.24% 50.07%
325 110 66.15% 88.54%
R.K. Chauhan, IIT Mandi, India
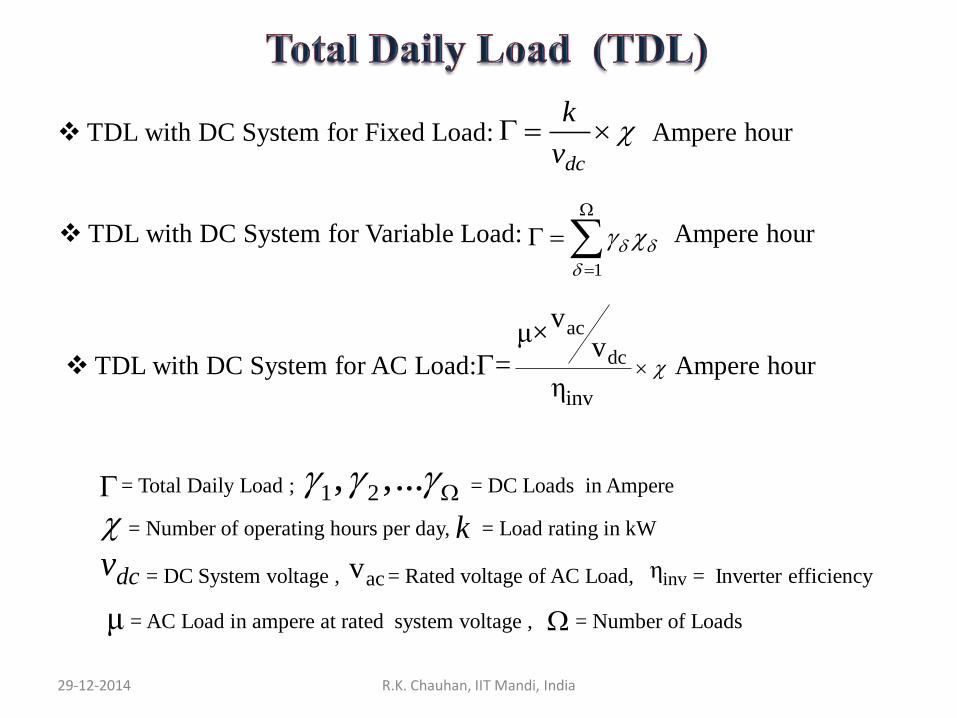
TDL with DC System for Fixed Load: Ampere hour
TDL with DC System for AC Load: Ampere hour
= Number of operating hours per day, = Load rating in kW
29-12-2014
dc
k
v
TDL with DC System for Variable Load: Ampere hour
1
ac
dc
inv
vμ×
v=
η
k
dcv
μ
acv invη = DC System voltage , = Rated voltage of AC Load, = Inverter efficiency
= AC Load in ampere at rated system voltage , = Number of Loads
R.K. Chauhan, IIT Mandi, India
1 2, ,... = Total Daily Load ; = DC Loads in Ampere

29-12-2014
S.N
Load
Load Power
Rating (kW)
Inverter
Efficiency
Total Daily
Load (Ah) AC DC
1. - 24 2.4 - 2400
2. - 48 2.4 - 1200
3. 120 V - 2.4 92% 2608.7
4. 220 - 2.4 92% 2608.7
5. 110 - 2.4 95% 2526.32
R.K. Chauhan, IIT Mandi, India

29-12-2014 R.K. Chauhan, IIT Mandi, India
29-12-2014
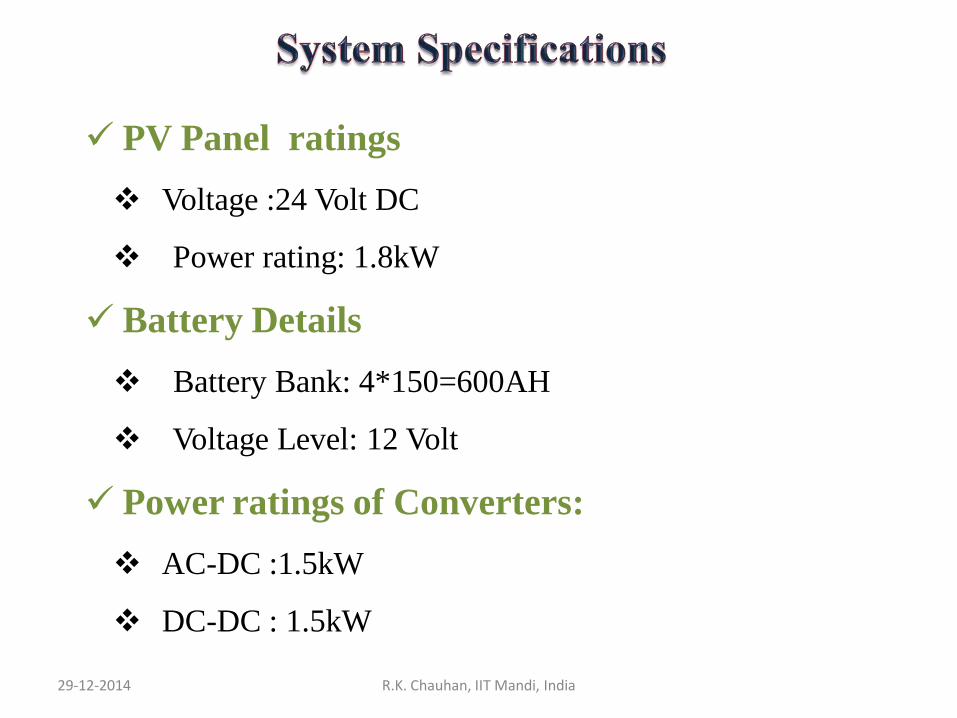
PV Panel ratings
Voltage :24 Volt DC
Power rating: 1.8kW
Battery Details
Battery Bank: 4*150=600AH
Voltage Level: 12 Volt
Power ratings of Converters:
AC-DC :1.5kW
DC-DC : 1.5kW
R.K. Chauhan, IIT Mandi, India

29-12-2014 R.K. Chauhan, IIT Mandi, India

29-12-2014 R.K. Chauhan, IIT Mandi, India

29-12-2014 R.K. Chauhan, IIT Mandi, India

29-12-2014 R.K. Chauhan, IIT Mandi, India
29-12-2014 R.K. Chauhan, IIT Mandi, India
29-12-2014 R.K. Chauhan, IIT Mandi, India

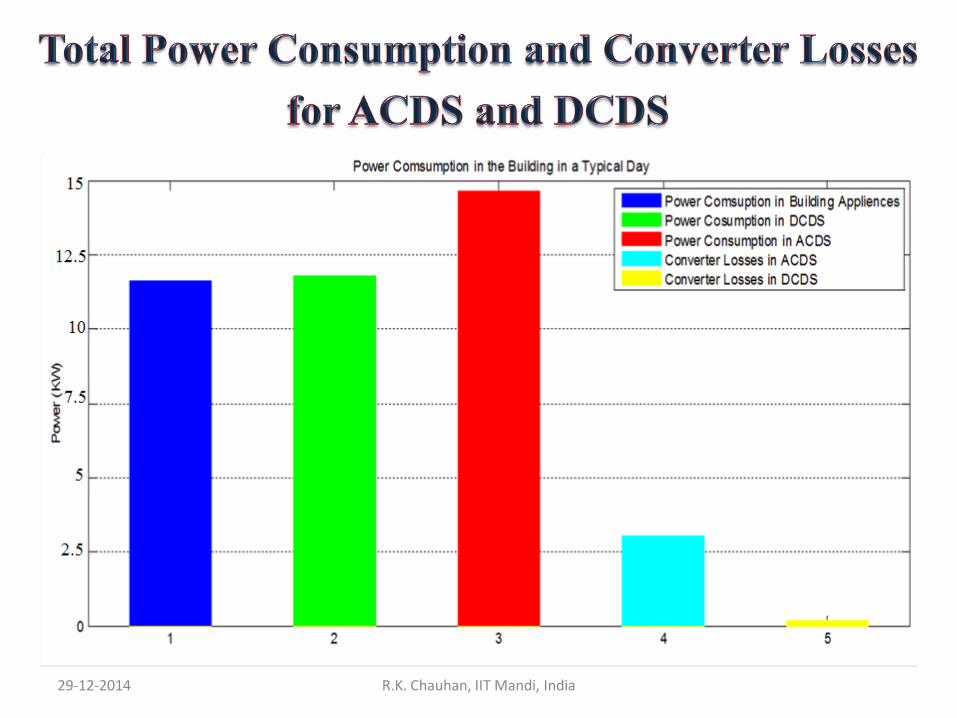
Number of conversion stages becomes less in DCDS
over ACDS.
The power consumption in DCDS is less over ACDS.
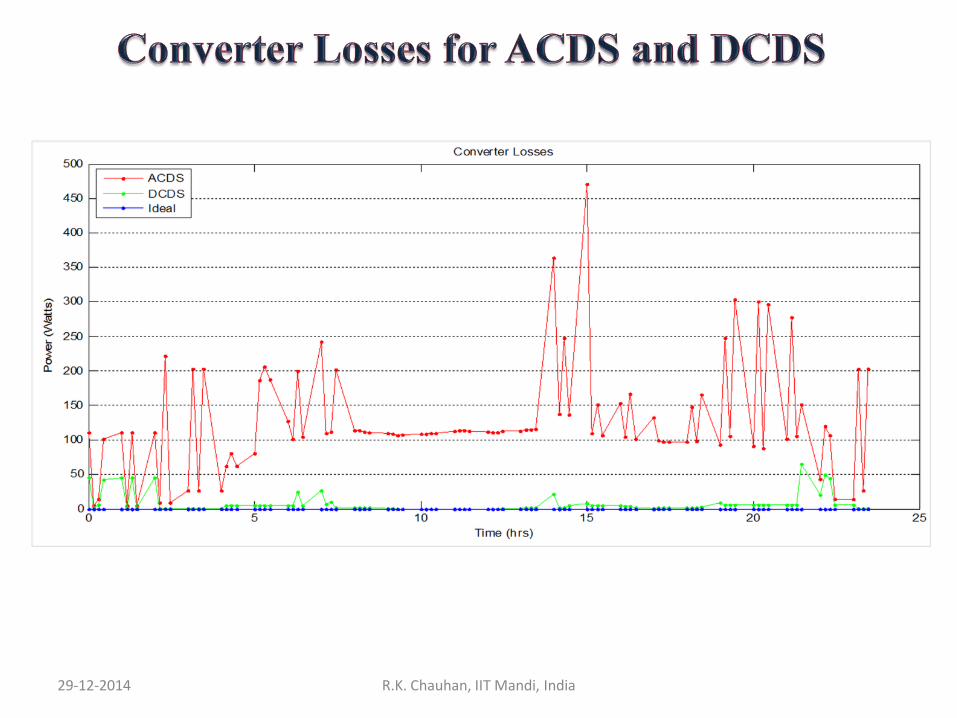
The converter losses in ACDS are approximately 6
times higher than DCDS.
DCDS required small size of PV panel and Battery
Bank than ACDS.
29-12-2014 R.K. Chauhan, IIT Mandi, India
• K. W. E. Cheng: Overview of the DC Power Conversion and Distribution,” Asian Power Electronics
Journal, Vol. 2, No. 2 (2008), p. 75-82
• T. Gruzs: Powering Telecom and Info Technology Systems, Power Quality Assurance (2001), p. 22–29
• J. Ciezki and R. Ashton: Selection and Stability Issues Associated with a Navy Shipboard DC Zonal Electric
Distribution System, IEEE Trans. Power Delivery, Vol. 15, No. 2 (2000), p. 665–669
• R. Hill: Electric Railway Traction Part 3 Traction Power Supplies, Power Engineering Journal, Vol. 8
(1994), p. 275–286.
• P. Savage, R. R. Nordhaus, and S. P. Jamieson: DC microgrids: Benefits andbarriers, in REIL (Ed.) From
Silos to Systems: Issues in Clean Energy and Climate Change, New Haven, CT: Yale Publications (2010).
• D. J. Hammerstrom: AC versus DC Distribution Systems. Did We Get it Right, IEEE Power Engineering
Society General Meeting (2007), p. 1-5
• P. Paajanen, T. Kaipia, and J. Partanen: DC Supply of Low-Voltage Electricity Appliances in Residential
Buildings, 20th International Conference and Exhibition on Electricity Distribution (2009), p.1-4
• P. W. Lee, Y. Z. Lee, and B. T. Lin: Power Distribution Systems for Future Homes, IEEE International
Conference on Power Electronics and Drive Systems, Vol. 2 (2009), p. 1140-1146Z. Gershony, PE, and T.
McCalmont: Optimal DC Cable Selection in PV Designs, Solarpro (2012), p. 64-73. Information on http://
www.solarprofessional.com
• K. Engelen, E. L. Shun, P. Vermeyen, I. Pardon, R. D. Hulst, J. Driesen, and R Belmans: The Feasibility of
Small-Scale Residential DC Distribution Systems”, IEEE Conference on Industrial Electronics (2006), p.
2618-2623
29-12-2014 R.K. Chauhan, IIT Mandi, India

Thanks!
29-12-2014 R.K. Chauhan, IIT Mandi, India