emergency planning and visualization: the case of miami ... · emergency planning and...
TRANSCRIPT
Emergency planning and visualization: the case of Miami-Dade County’s Emergency Operations Center
A. Castellanos, A. Castillo, A. Gudi & R. Lee Department of Decision Sciences and Information Systems, Florida International University, USA
Abstract
Relief efforts for previous disasters such as the 9/11 attacks in New York, hurricane Katrina in New Orleans, and the earthquake in Haiti, illustrate the need for emergency management agencies to have a comprehensive emergency management plan in place. Miami-Dade County’s (MDC) Emergency Operating Center (EOC) is one of the leading centers in hurricane emergency management in the U.S., which makes them the ideal starting point for understanding how technology helps them to address the challenges that are unique to them. The goal of this paper is to share with emergency response teams across the globe the tools that the EOC uses to excel in preparedness for disasters. We focus on the way decision-making factors are incorporated into their technology as well as demonstrate how they use Geographical Information System (GIS) driven applications to maximize the effectiveness of their decision makers and response teams. Keywords: disaster management, emergency management (EM), visualization, preparedness, risk assessment, natural disasters, knowledge management, geographical information systems (GIS).
1 Introduction
Emergency management (EM) is “the managerial function charged with creating the framework within which communities reduce vulnerability to hazards and cope with disasters” (FEMA [1]). It is a closed-loop cycle that is composed of four different phases: Preparedness, Mitigation, Recovery, and Response. Preparedness is the risk assessment of threat likelihood and the planning for
Disaster Management and Human Health Risk III 171
www.witpress.com, ISSN 1743-3509 (on-line) WIT Transactions on The Built Environment, Vol 133, © 2013 WIT Press
doi:10.2495/DMAN130161
those threats that pose the highest risk; Responses are the actions taken when the threat is being experienced in order to save lives or prevent property damage; Recovery is the action taken following the experienced threat in order to return to normal; and mitigation is the act of preventing, or minimizing, the risk or damage in an emergency. Although they may seem isolated they each build upon the previous step and feed the subsequent step. Learned information helps project current and future impact of the disaster in its different stages (Jain and McLean [2]). For example, recovery allows the effort to switch from a reactive response to a proactive one for future incidents through mitigation, while steps taken in mitigation minimize the requirements for preparedness. Local governments are responsible, with limited resources, to cope with disasters through their emergency management agencies. These agencies need to efficiently coordinate the use of personnel, resource inventory, and infrastructure –including roads, evacuation routes, shelters, etc. (Gunes and Kovel [3]). Miami-Dade County has more experience (hence, equipment, training, and planning) with hurricanes than any other county in the United States due to their South Florida location, which is directly in the Atlantic hurricane path. The operations are directed by the Miami-Dade County (MDC) Emergency Operations Center (EOC), which is a center comprised of public, private, and non-profit organizations that is activated by the Mayor’s Office of Emergency Management to respond to diverse types of emergencies. The EOC is the core for efforts following a disaster and has six responsibilities: coordination, policy-making, operations management, information gathering, public information, and hosting visitors and allows for interpersonal communication and decision-making (Quarantelli [4] and Kendra and Wachtendorf [5]). Knowledge management during emergency response and preparation is a very difficult task due to the exponential communication paths ((N × (N-1))/2) developed during coordination. This is why visualization tools are critical in helping emergency planners and responders receive ubiquitous situational awareness and enable real-time response during critical emergency operations. This paper is intended to show how emerging information and communication technologies (ICTs) have helped Miami-Dade County’s EOC become a model for the nation in hurricane response with the hope that it stimulates further discussion, which ultimately will result in the improvement of the life-saving processes that all citizens rely on. The decision making drivers (logistics, resources, knowledge, and politics) and preparedness cycle in Emergency Management present challenges that need to be overcome, such as: risk assessment, timing and uncertainty, data convergence and quality, and resource allocation (for more information see Castellanos et al. [6]). The following section discusses how the case study, Miami-Dade County’s EOC, has addressed these challenges through their use of technology and visualization tools. The paper covers some of the lessons learned at the EOC and points to some future directions that will aid the emergency management community in preparedness for future events.
172 Disaster Management and Human Health Risk III
www.witpress.com, ISSN 1743-3509 (on-line) WIT Transactions on The Built Environment, Vol 133, © 2013 WIT Press
2 Miami-Dade County Emergency Operations Center
The EOC is responsible for preparing for, and responding to, emergency situations that can affect Miami-Dade County. The emergency situations do not necessarily have to be natural disasters as Miami has many factors that make it very unique from many other places. South Florida is a peninsula at the southern-most point of eastern United States. The Atlantic location provides the conditions to allow for the largest freight airport, the title of “cruise ship capital of the world” (MDC [8]), and the seventh most populous county in the United States, Census [9]. In order to provide power for so many people Miami-Dade County has the sixth largest power plant (nuclear), Turkey Point, USEI [10]. Although hurricanes are the highest threat in terms of likelihood, these conditions all present the potential for other non-natural disasters when assessing threats.
2.1 Logistics and planning
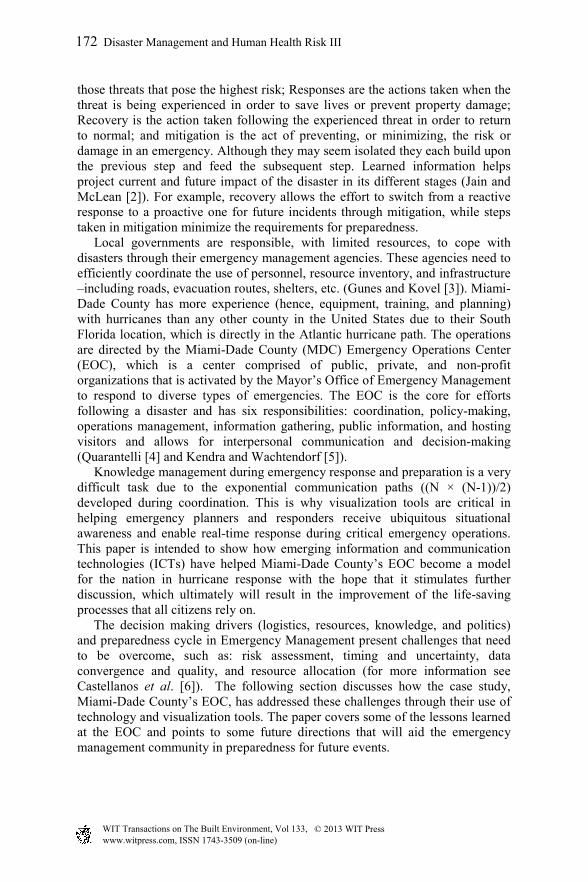
The EOC takes all the factors about Miami-Dade County into consideration in order to evaluate the total threat to the community. The result is a high priority for hurricanes, wildfires, flood, and a nuclear incident. Although the likelihood of a nuclear incident is found to be low, once omitting the federal governmental responsibility of outside threat mitigation, the magnitude of the potential impact makes it rank high. Unfortunately, there is not much warning of a nuclear incident and for severe radiation leaks there is not much that can be done for close-radius residents so most of the emphasis is placed on mitigation through safety policies, structure, training, and plant recertification procedures. For the population within range to still be affected by cross winds the procedure followed is very similar to that for hurricanes, but with shorter logistic timeframes. The development of the comprehensive emergency management plan for the EOC has been an iterative process of experience and lessons learned throughout the years. The experience combined with technological advances in early warning systems, such as the Doppler radar systems, has allowed them to accurately generate a “laundry list” of tasks with timing. The system that allows them to do that is called SALT (storm action lead time). Providing parameters of an approaching tropical storm (such as evacuation zone, storm heading, forward speed, max sustained wind, diameter, etc.) allows the application to calculate all the pre-arrival logistics involved along with estimated lead times for each so that they are put in chronological order of execution (see Figure 1). Notice that the lead-time for “Irene” in order to begin the preparations is for 84 hours (which is 5 hours from the time of program execution). Without proper planning and coordination, if the EOC were to be activated with representatives of every area and every department/organization in the county to respond to an emergency, it could get pretty haphazard and quickly drown out even the most vocal type person in the room. The EOC created Divisional Municipalities, which aggregates several areas into larger groups with one representative for each to create seven in total. This is a compromise
Disaster Management and Human Health Risk III 173
www.witpress.com, ISSN 1743-3509 (on-line) WIT Transactions on The Built Environment, Vol 133, © 2013 WIT Press
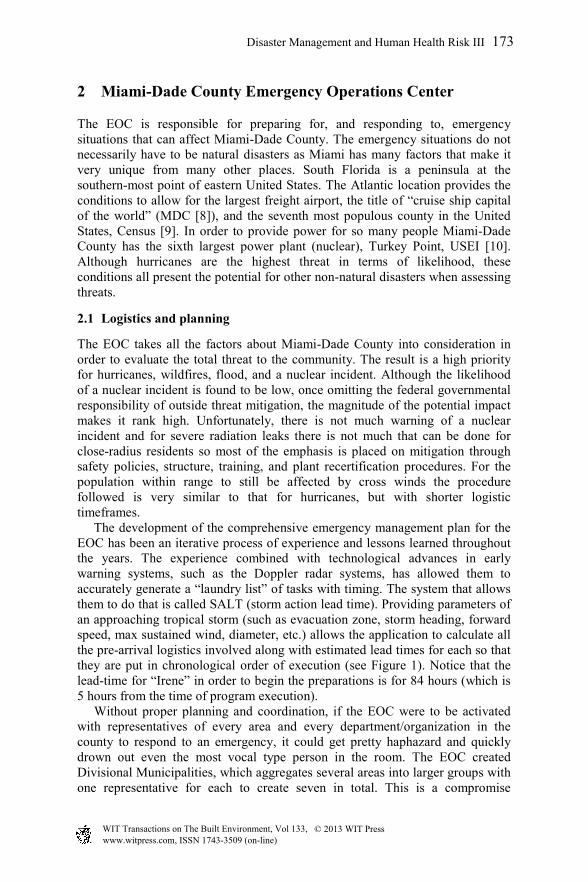
between avoiding inefficiencies from having too many networking points yet being inclusive. To have resources and status updates from other areas (federal organizations, utilities, etc.) and divide the responsibility, the representatives from various areas are also included when the EOC activates (see Figure 2).
Figure 1: SALT example (from Miami-Dade County).
Figure 2: EOC floor-plan layout (from Becerra-Fernandez et al. [11]).
174 Disaster Management and Human Health Risk III
www.witpress.com, ISSN 1743-3509 (on-line) WIT Transactions on The Built Environment, Vol 133, © 2013 WIT Press
2.2 Static data
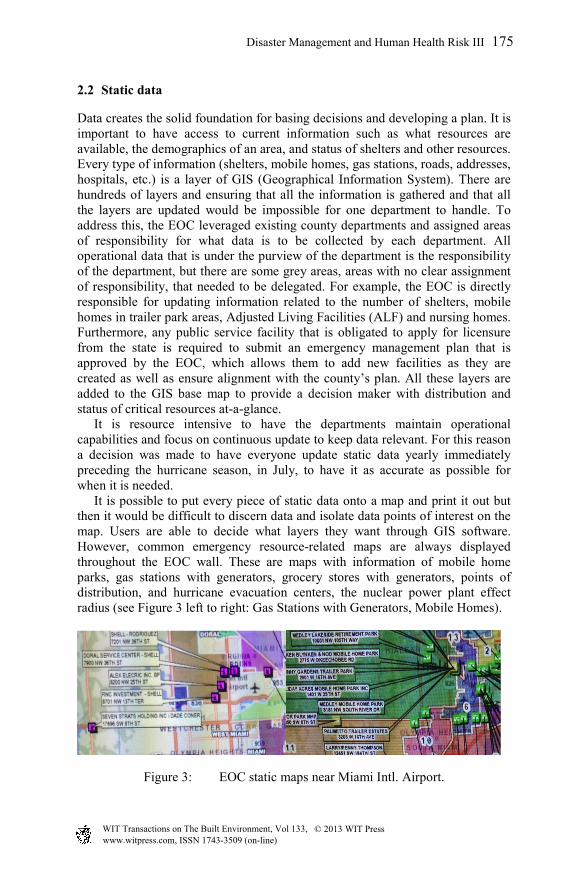
Data creates the solid foundation for basing decisions and developing a plan. It is important to have access to current information such as what resources are available, the demographics of an area, and status of shelters and other resources. Every type of information (shelters, mobile homes, gas stations, roads, addresses, hospitals, etc.) is a layer of GIS (Geographical Information System). There are hundreds of layers and ensuring that all the information is gathered and that all the layers are updated would be impossible for one department to handle. To address this, the EOC leveraged existing county departments and assigned areas of responsibility for what data is to be collected by each department. All operational data that is under the purview of the department is the responsibility of the department, but there are some grey areas, areas with no clear assignment of responsibility, that needed to be delegated. For example, the EOC is directly responsible for updating information related to the number of shelters, mobile homes in trailer park areas, Adjusted Living Facilities (ALF) and nursing homes. Furthermore, any public service facility that is obligated to apply for licensure from the state is required to submit an emergency management plan that is approved by the EOC, which allows them to add new facilities as they are created as well as ensure alignment with the county’s plan. All these layers are added to the GIS base map to provide a decision maker with distribution and status of critical resources at-a-glance. It is resource intensive to have the departments maintain operational capabilities and focus on continuous update to keep data relevant. For this reason a decision was made to have everyone update static data yearly immediately preceding the hurricane season, in July, to have it as accurate as possible for when it is needed. It is possible to put every piece of static data onto a map and print it out but then it would be difficult to discern data and isolate data points of interest on the map. Users are able to decide what layers they want through GIS software. However, common emergency resource-related maps are always displayed throughout the EOC wall. These are maps with information of mobile home parks, gas stations with generators, grocery stores with generators, points of distribution, and hurricane evacuation centers, the nuclear power plant effect radius (see Figure 3 left to right: Gas Stations with Generators, Mobile Homes).
Figure 3: EOC static maps near Miami Intl. Airport.
Disaster Management and Human Health Risk III 175
www.witpress.com, ISSN 1743-3509 (on-line) WIT Transactions on The Built Environment, Vol 133, © 2013 WIT Press
2.3 Real-time data
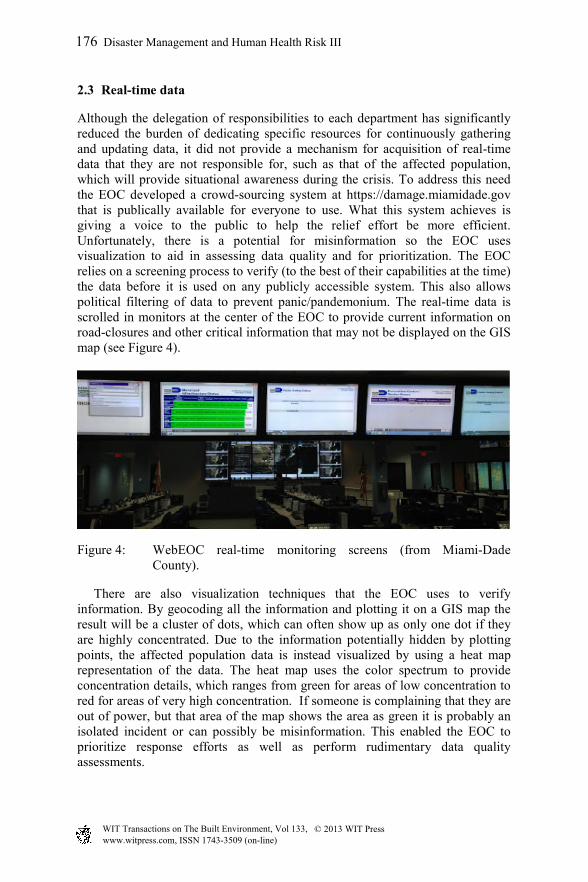
Although the delegation of responsibilities to each department has significantly reduced the burden of dedicating specific resources for continuously gathering and updating data, it did not provide a mechanism for acquisition of real-time data that they are not responsible for, such as that of the affected population, which will provide situational awareness during the crisis. To address this need the EOC developed a crowd-sourcing system at https://damage.miamidade.gov that is publically available for everyone to use. What this system achieves is giving a voice to the public to help the relief effort be more efficient. Unfortunately, there is a potential for misinformation so the EOC uses visualization to aid in assessing data quality and for prioritization. The EOC relies on a screening process to verify (to the best of their capabilities at the time) the data before it is used on any publicly accessible system. This also allows political filtering of data to prevent panic/pandemonium. The real-time data is scrolled in monitors at the center of the EOC to provide current information on road-closures and other critical information that may not be displayed on the GIS map (see Figure 4).
Figure 4: WebEOC real-time monitoring screens (from Miami-Dade County).
There are also visualization techniques that the EOC uses to verify information. By geocoding all the information and plotting it on a GIS map the result will be a cluster of dots, which can often show up as only one dot if they are highly concentrated. Due to the information potentially hidden by plotting points, the affected population data is instead visualized by using a heat map representation of the data. The heat map uses the color spectrum to provide concentration details, which ranges from green for areas of low concentration to red for areas of very high concentration. If someone is complaining that they are out of power, but that area of the map shows the area as green it is probably an isolated incident or can possibly be misinformation. This enabled the EOC to prioritize response efforts as well as perform rudimentary data quality assessments.
176 Disaster Management and Human Health Risk III
www.witpress.com, ISSN 1743-3509 (on-line) WIT Transactions on The Built Environment, Vol 133, © 2013 WIT Press
2.4 Graphical information system
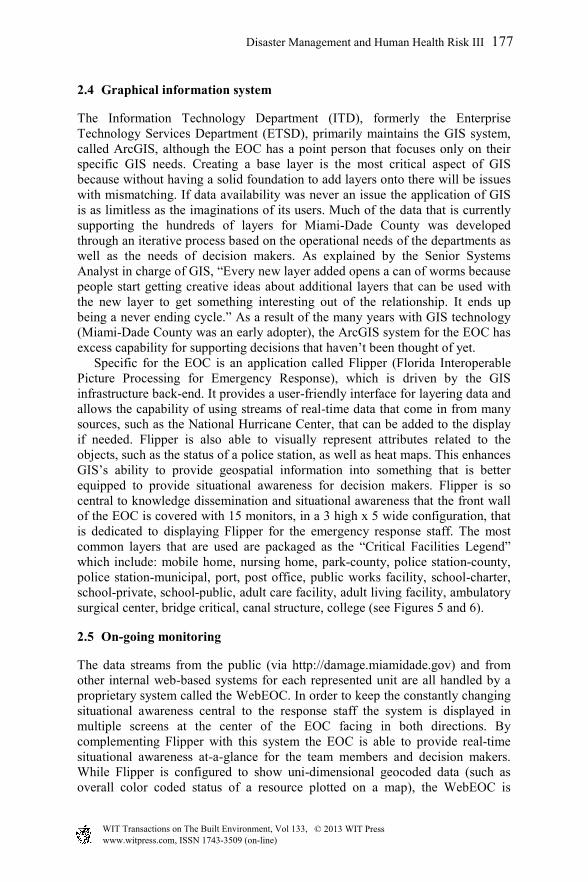
The Information Technology Department (ITD), formerly the Enterprise Technology Services Department (ETSD), primarily maintains the GIS system, called ArcGIS, although the EOC has a point person that focuses only on their specific GIS needs. Creating a base layer is the most critical aspect of GIS because without having a solid foundation to add layers onto there will be issues with mismatching. If data availability was never an issue the application of GIS is as limitless as the imaginations of its users. Much of the data that is currently supporting the hundreds of layers for Miami-Dade County was developed through an iterative process based on the operational needs of the departments as well as the needs of decision makers. As explained by the Senior Systems Analyst in charge of GIS, “Every new layer added opens a can of worms because people start getting creative ideas about additional layers that can be used with the new layer to get something interesting out of the relationship. It ends up being a never ending cycle.” As a result of the many years with GIS technology (Miami-Dade County was an early adopter), the ArcGIS system for the EOC has excess capability for supporting decisions that haven’t been thought of yet. Specific for the EOC is an application called Flipper (Florida Interoperable Picture Processing for Emergency Response), which is driven by the GIS infrastructure back-end. It provides a user-friendly interface for layering data and allows the capability of using streams of real-time data that come in from many sources, such as the National Hurricane Center, that can be added to the display if needed. Flipper is also able to visually represent attributes related to the objects, such as the status of a police station, as well as heat maps. This enhances GIS’s ability to provide geospatial information into something that is better equipped to provide situational awareness for decision makers. Flipper is so central to knowledge dissemination and situational awareness that the front wall of the EOC is covered with 15 monitors, in a 3 high x 5 wide configuration, that is dedicated to displaying Flipper for the emergency response staff. The most common layers that are used are packaged as the “Critical Facilities Legend” which include: mobile home, nursing home, park-county, police station-county, police station-municipal, port, post office, public works facility, school-charter, school-private, school-public, adult care facility, adult living facility, ambulatory surgical center, bridge critical, canal structure, college (see Figures 5 and 6).
2.5 On-going monitoring
The data streams from the public (via http://damage.miamidade.gov) and from other internal web-based systems for each represented unit are all handled by a proprietary system called the WebEOC. In order to keep the constantly changing situational awareness central to the response staff the system is displayed in multiple screens at the center of the EOC facing in both directions. By complementing Flipper with this system the EOC is able to provide real-time situational awareness at-a-glance for the team members and decision makers. While Flipper is configured to show uni-dimensional geocoded data (such as overall color coded status of a resource plotted on a map), the WebEOC is
Disaster Management and Human Health Risk III 177
www.witpress.com, ISSN 1743-3509 (on-line) WIT Transactions on The Built Environment, Vol 133, © 2013 WIT Press
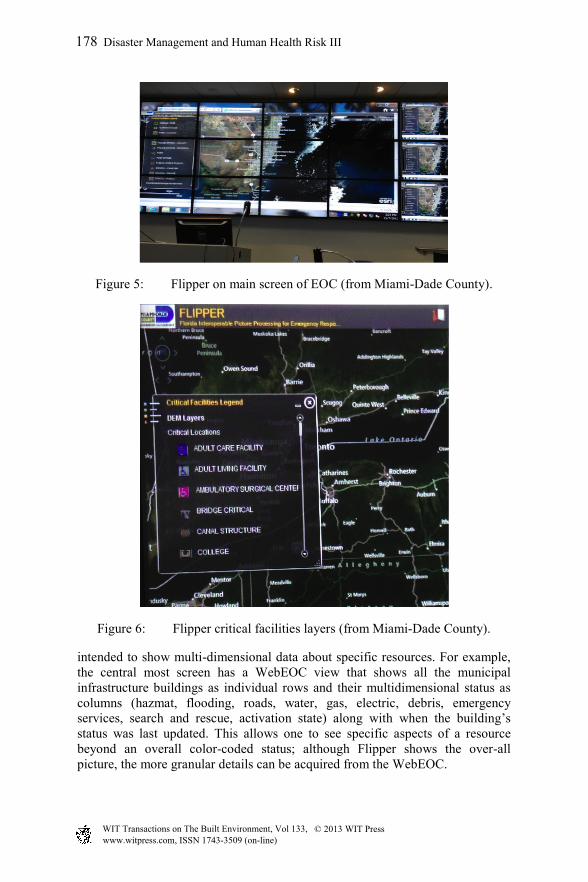
Figure 5: Flipper on main screen of EOC (from Miami-Dade County).
Figure 6: Flipper critical facilities layers (from Miami-Dade County).
intended to show multi-dimensional data about specific resources. For example, the central most screen has a WebEOC view that shows all the municipal infrastructure buildings as individual rows and their multidimensional status as columns (hazmat, flooding, roads, water, gas, electric, debris, emergency services, search and rescue, activation state) along with when the building’s status was last updated. This allows one to see specific aspects of a resource beyond an overall color-coded status; although Flipper shows the over-all picture, the more granular details can be acquired from the WebEOC.
178 Disaster Management and Human Health Risk III
www.witpress.com, ISSN 1743-3509 (on-line) WIT Transactions on The Built Environment, Vol 133, © 2013 WIT Press
Due to the variety of resource types and areas of responsibility for the different members in the EOC it is important for the system to have views created with the resource information specific to each group’s requirements. Apart from preventing flooding users with information it also allows for some level of quality control. The data requirements that most teams have in common are presented in the monitors at the center of the EOC. These screens include: Municipal Infrastructure Status (hazmat, flooding, roads, water, gas, electric, debris, emergency services, search and rescue, activation state), Public Safety Status (populated by Search and Rescue Teams), Evacuation Center/Shelter Status (name, status, general population, pet friendly, special needs, capacity, occupancy, availability), Road Closures (status, location, start date, end date, impact, address, detour, reason for closure), Disaster Assistance Centers (location, status, hours of operation), and Utilities Infrastructure Status (status along with percentages of customers impacted without electricity, water, etc.). For some of these views, such as road closures, the number of entries can quickly become more than what can be scrolled in a few seconds. These views are allocated additional monitors to minimize the time before an item of interest is scrolled for response staff. To achieve this the data is staggered so that one monitor starts at the first entry while the other starts at the twentieth entry, for example.
2.6 Current work
As GIS technology is now a very mature and integral component to Miami-Dade County it has become very easy for the EOC to find new useful layers. The challenge is that each layer that gets added needs to have an accompanying update plan that schedules updates every year prior to the commencement of the hurricane season. This puts a theoretical limitation on how many layers are possible due to limited resources. However, as more departments find a need for GIS software the processes used in updating this information becomes an integral part of the departments’ operations and more resources are dedicated to that task for a double pay-off; it helps the departments collect GIS data that runs their operations, which the EOC can also use for emergency management purposes. Therefore, the EOC’s biggest challenges come from the data related to the unpredictable public, which has become the target for more recent work. In order to adequately model evacuation procedures it is necessary to understand just how many people plan to evacuate. This type of data is not easy to acquire, yet it is critical for planning. Knowing how many people plan to evacuate helps to appropriately stagger evacuations of areas depending on road capacity, have adequate Search and Rescue Teams and other resources, plan shelter capacity and locations, and minimize a lot of the guess work involved in capacity planning for emergencies. Slack resources are great to have in projects, but in emergency response situations it means that one area has too much at the expense of another area having too little. They are currently working on a research project to assess and quantify how many people would plan on evacuating, going to a shelter, or weathering the storm at home.
Disaster Management and Human Health Risk III 179
www.witpress.com, ISSN 1743-3509 (on-line) WIT Transactions on The Built Environment, Vol 133, © 2013 WIT Press
Also, the demographic information contained in census data is updated every 10 years, which is useful for macro-level government planning but not very useful for the more detailed EOC requirements in one of the most dynamic counties of the country. It does not take into account the constant fluctuations of people present due to tourism, a large source of economic stimulus for Miami-Dade County, and the timing of those fluctuations. For this the county relies on inferences based on taxes, registrations, and travel data to have a better estimate of what the affected population is beyond the census data and allow them to plan better. This is constantly being done and improved upon as more data sources become available to base these inferences on.
3 Discussion and future research
Miami-Dade County’s EOC illustrates how a carefully thought out knowledge management strategy can be extremely beneficial for an organization that is developing their emergency management plan. By consolidating areas of responsibility they were able to both significantly reduce the number of communication handshake points present at the EOC when it is activated for emergency response as well as substantially reduce the requirements for ensuring that data is updated on schedule with the hurricane season by assigning areas of responsibility. The championing of the EOC by the state also allows for ensuring that any new public service business conforms with their policies when applying for licensure. Crowd-sourcing efforts have shown that there are benefits and drawbacks to empowering the public to provide affected population data. Although the website (http://damage.miamidade.gov) allows for leveraging the power of crowd-sourcing it can suffer from the data quality issues inherent in crowd-sourcing. The EOC was able to alleviate this by implementing an approval process with dedicated staff as well as incorporating heatmaps into their visualization tools to show concentrations of the affected population. The heatmaps help to differentiate between potentially erroneous individual incidents and incidents that can affect a large population. Through an iterative learning process the EOC has also been able to model a logistical plan that has been incorporated into the SALT application, which is generated once the required parameters are input. Although this software may be unique to Miami-Dade County’s characteristics for planning (which zones to evacuate first, how to stagger evacuation areas, etc.) this software would still serve as a starting point for helping others understand what is involved logistically in adequately responding to a hurricane well in advance of its arrival. The EOC also shows how GIS-enabled visualization tools, such as Flipper and the WebEOC, allow for ubiquitous situational awareness of response staff as well as for immediate dissemination of state changes related to critical resources and the affected populations. The information that is common to all is being displayed on large screens for all to see, but there are also views created which are specific to groups and their delegated responsibilities that can be accessed at their respective stations. The critical facilities along with their color-coded status
180 Disaster Management and Human Health Risk III
www.witpress.com, ISSN 1743-3509 (on-line) WIT Transactions on The Built Environment, Vol 133, © 2013 WIT Press
are presented in a large geographical map at the front of the room while the real-time data for roads, service centers, public service notices, and details of the critical facilities are scrolled in monitors at the center of the room. The most common GIS resource layers, and operational data used by the various team members was presented in this paper, which should be similar to what most organizations will also find are common, however, we have not specifically gone into more granularity as those requirements are driven by each group’s areas of responsibility. The more specific views are dependent on how the responsibilities were delegated, which will be different for any outside agency trying to mimic what the EOC has. For this reason a study that groups all the data requirements for each team into more general functional areas that can be delegated out would prove beneficial for the emergency management community. Another future research direction could be in extrapolating out of all the resource requirements for the various types of disasters (natural and non-natural) the commonalities found regardless of the disaster type. No organization prepares entire teams specific to one type of emergency. With the exception of a few specialists with expertise and equipment for a specific type of threat, the rest of the response teams in general have much of their composition in common. This research would provide a rich source of information for organizations that wish to create mobilized emergency management groups to reallocate for areas in need. Although the United Nations and FEMA both have humanitarian response teams that are used in times of crisis neither has been able to provide seamless aid for any of the relief efforts (Crowley and Chan [12]). Analysing what the most experienced agencies at each category (California for earthquakes, Miami-Dade for hurricanes, etc.) utilize to help them overcome emergency management challenges could help other organizations advance in their relief efforts.
Acknowledgements
We would like to thank the amazing staff at Miami-Dade County Information Technology Department and Emergency Operations Center that volunteered their time to help us understand their complex emergency management process and tools, specifically Soheila Ajabshir and Karen Grassi. Finally, we would like to thank the FEMA trainer, Wayne Gurnee, for the guidance and vast experience shared with us in dealing with EM from a management perspective.
References
[1] FEMA, Fundamentals of Emergency Management, 2012, IS-230.b. [2] Jain, S. and McLean, C., Simulation for emergency response: a framework
for modeling and simulation for emergency response, Proc. of the 35th
Conference on Winter Simulation: Driving Innovation, 2003, Winter Simulation Conference: New Orleans, Louisiana. p. 1068-1076.
Disaster Management and Human Health Risk III 181
www.witpress.com, ISSN 1743-3509 (on-line) WIT Transactions on The Built Environment, Vol 133, © 2013 WIT Press
[3] Gunes, A.E. and J.P. Kovel, Using GIS in emergency management operations. Journal of Urban Planning and Development, 2000, 126(3): p. 136-149.
[4] Quarantelli, E.L., Uses and Problems of Local EOCs in Disasters. 1978. [5] Kendra, J.M. and T. Wachtendorf, Elements of Resilience after the World
Trade Center Disaster: Reconstituting New York City’s Emergency Operations Centre. Disasters, 2003, 27(1): p. 37-53.
[6] Castellanos, Arturo, Castillo, Alfred, Gudi, Arvind and Lee, Ronald Marlin, Decision Making Drivers and Preparedness in Emergency Planning: A Case Study (April 22, 2013). Available at SSRN: http://ssrn.com/abstract=2255271.
[7] Zhang, D., L. Zhou, and J.F. Nunamaker Jr, A Knowledge Management Framework for the Support of Decision Making in Humanitarian Assistance/Disaster Relief. Knowledge and Information Systems, 2002, 4(3): p. 370-385.
[8] MDC, (February 24, 2012). About Miami-Dade County: History. retrieved December 10 2012, from Miami-Dade County – Information about Miami-Dade County: History Web Site: http://www.miamidade.gov/info /about_miami-dade_history.asp
[9] The World Almanac, List of US Census Bureau MSA Estimates. 2011: p. 611.
[10] U.S. Energy Information Administration, (2013, February, 13). Electricity Explained – Electricity in the United States. retrieved December 10 2012, from Electricity in the United States - Energy Explained, Your Guide To Understanding Energy – Energy Information Administration Web Site: http://beta.eia.gov/energyexplained/index.cfm?page=electricity_in_the_united_states.
[11] Becerra-Fernandez, I., Xia, W., Gudi, A., Rocha J., Emergency management task complexity and knowledge-sharing strategies. Cutter IT Journal, 2011, 24(1): p. 20.
[12] Crowley, J. and J. Chan, DISASTER RELIEF 2.0: The Future of Information Sharing in Humanitarian Emergencies. Harvard Humanitarian Initiative and UN Foundation-Vodafone Foundation-UNOCHA, 2011.
182 Disaster Management and Human Health Risk III
www.witpress.com, ISSN 1743-3509 (on-line) WIT Transactions on The Built Environment, Vol 133, © 2013 WIT Press