eliminating phospholipids in drug discovery extractions ... · eliminating phospholipids in drug...
TRANSCRIPT
1
AP PLICAT ION BENEFITSn Simple, universal sample prep protocol
n Speeds up workflow through direct
injection of eluates
n Eliminates the vast majority (>99%)
of plasma phospholipids
n Reduces sample variability, eliminating
a major source of suppression
n Facilitates use of shorter runtimes,
improving throughput
WAT ErS SOLuT IONSn ACQUITY UltraPerformance LC® technology
n Xevo® TQ MS system
n Ostro™ sample preparation products
n IntelliStart™ software
k Ey WOrdSPhospholipid removal, LC/MS/MS, Ostro, matrix
effects, drug discovery, screening
Eliminating Phospholipids in Drug Discovery Extractions Using a Fast, Generic Sample Clean-up MethodJessalynn P. Wheaton, Erin E. Chambers, John Martin and Kenneth J. Fountain
INT rOduCT IONDrug discovery is a vital segment of pharmaceutical research where vast numbers
of compounds are screened to determine therapeutic efficacy, activity, and ADME
properties. This process helps identify the handful of drug candidates that will
progress further. Many closely related drug compounds must be rapidly analyzed
and quick decisions must be made as to which drugs will continue into development
and eventually clinical trials. During the drug discovery stage, speed, time, ease of
use, and high throughput are key aspects of everyday work. There is little time for
method development, making simple and universal sample prep methods such as
protein precipitation (PPT) an attractive choice. Crude techniques such as PPT are
often quite efficient in terms of generating high analyte recovery but result in
relatively dirty samples. In particular, PPT does little to eliminate phospholipids
(PLs), a major source of concern in bioanalysis. PLs build up in LC/MS/MS systems
and are one of the major sources of matrix effects in plasma-based assays. Amongst
other problems, matrix effects also alter mass spectrometry response in an unpre-
dictable manner, decrease method robustness, and add to method variability. In this
publication, Ostro™ 96-well sample preparation plates are used to eliminate both
proteins and the vast majority of PLs while maintaining high analyte recovery, all
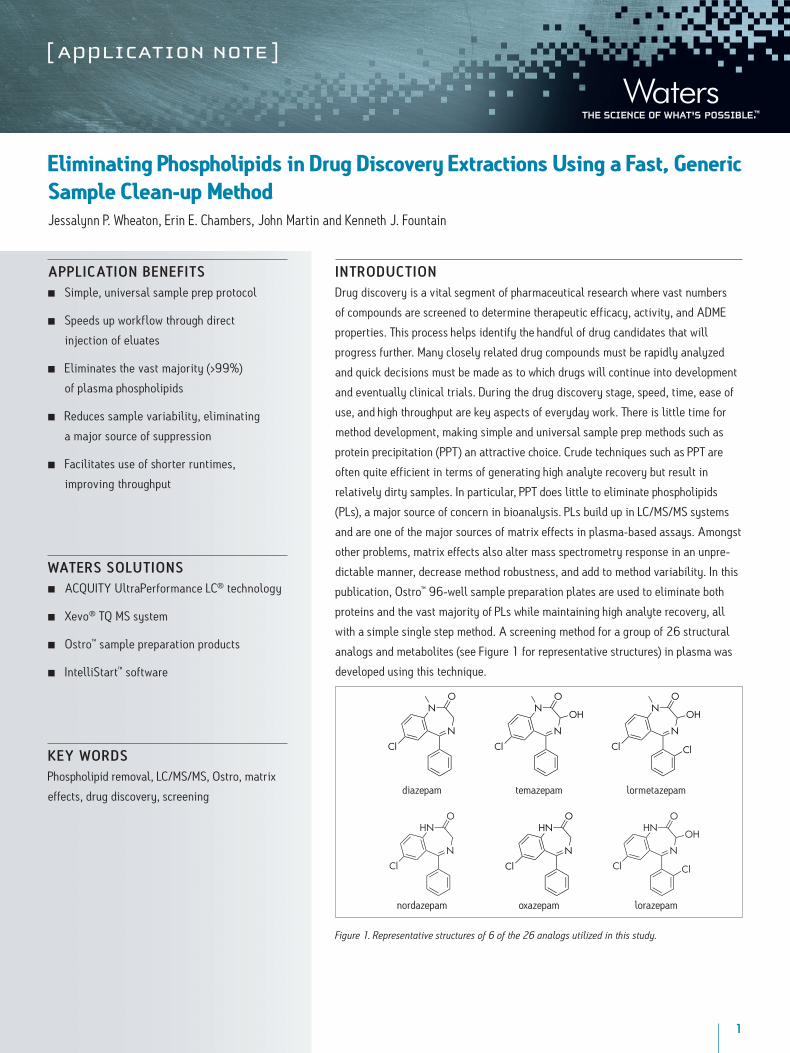
with a simple single step method. A screening method for a group of 26 structural
analogs and metabolites (see Figure 1 for representative structures) in plasma was
developed using this technique.
N
NO
Cl
N
HNO
Cl
diazepam
nordazepam
N
NO
Cl
OH
N
HNO
Cl
temazepam
oxazepam
N
NO
Cl
OH
Cl
N
HNO
Cl
OH
Cl
lormetazepam
lorazepam
Figure 1. Representative structures of 6 of the 26 analogs utilized in this study.
2 Eliminating Phospholipids in Drug Discovery Extractions Using a Fast, Generic Sample Clean-up Method
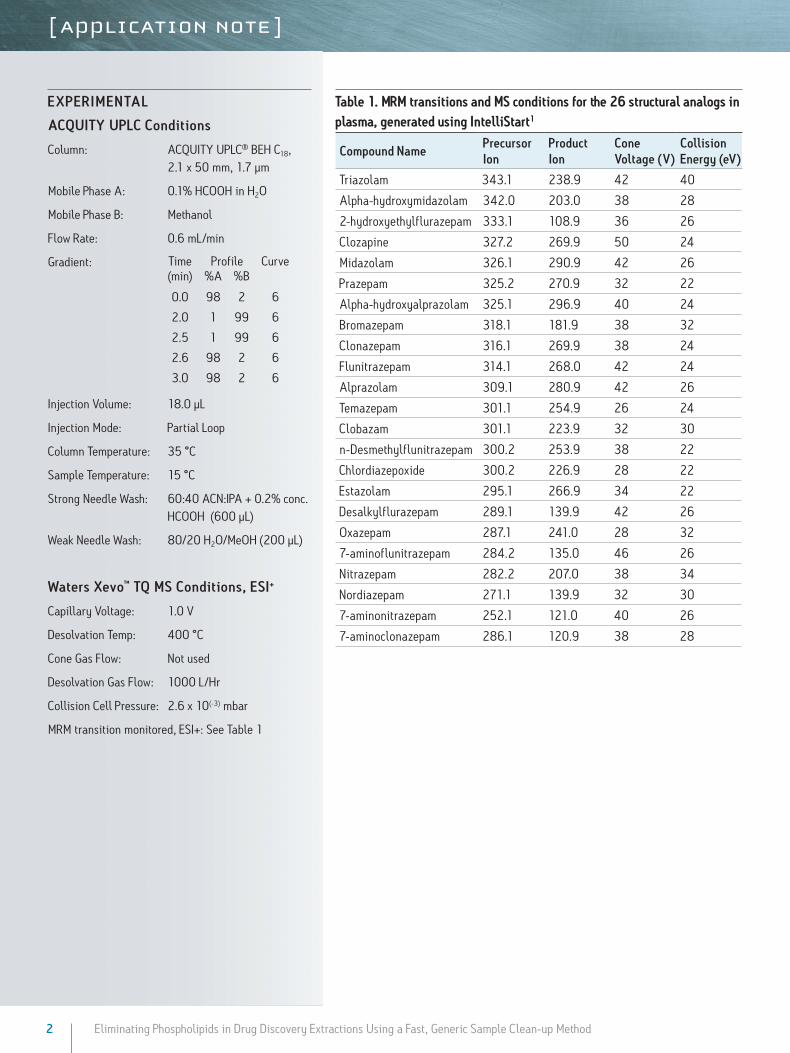
Table 1. MRM transitions and MS conditions for the 26 structural analogs in plasma, generated using IntelliStart1
Compound NamePrecursor Ion
Product Ion
Cone Voltage (V)
Collision Energy (eV)
Triazolam 343.1 238.9 42 40
Alpha-hydroxymidazolam 342.0 203.0 38 28
2-hydroxyethylflurazepam 333.1 108.9 36 26
Clozapine 327.2 269.9 50 24
Midazolam 326.1 290.9 42 26
Prazepam 325.2 270.9 32 22
Alpha-hydroxyalprazolam 325.1 296.9 40 24
Bromazepam 318.1 181.9 38 32
Clonazepam 316.1 269.9 38 24
Flunitrazepam 314.1 268.0 42 24
Alprazolam 309.1 280.9 42 26
Temazepam 301.1 254.9 26 24
Clobazam 301.1 223.9 32 30
n-Desmethylflunitrazepam 300.2 253.9 38 22
Chlordiazepoxide 300.2 226.9 28 22
Estazolam 295.1 266.9 34 22
Desalkylflurazepam 289.1 139.9 42 26
Oxazepam 287.1 241.0 28 32
7-aminoflunitrazepam 284.2 135.0 46 26
Nitrazepam 282.2 207.0 38 34
Nordiazepam 271.1 139.9 32 30
7-aminonitrazepam 252.1 121.0 40 26
7-aminoclonazepam 286.1 120.9 38 28
EX PErIMENTAL
ACQuITy uPLC Conditions
Column: ACQUITY UPLC® BEH C18, 2.1 x 50 mm, 1.7 µm
Mobile Phase A: 0.1% HCOOH in H2O
Mobile Phase B: Methanol
Flow Rate: 0.6 mL/min
Gradient:
Injection Volume: 18.0 µL
Injection Mode: Partial Loop
Column Temperature: 35 °C
Sample Temperature: 15 °C
Strong Needle Wash: 60:40 ACN:IPA + 0.2% conc. HCOOH (600 µL)
Weak Needle Wash: 80/20 H2O/MeOH (200 µL)
Waters Xevo™ TQ MS Conditions, ESI+
Capillary Voltage: 1.0 V
Desolvation Temp: 400 °C
Cone Gas Flow: Not used
Desolvation Gas Flow: 1000 L/Hr
Collision Cell Pressure: 2.6 x 10(-3) mbar
MRM transition monitored, ESI+: See Table 1
Time Profile Curve(min) %A %B
0.0 98 2 6
2.0 1 99 6
2.5 1 99 6
2.6 98 2 6
3.0 98 2 6
3Eliminating Phospholipids in Drug Discovery Extractions Using a Fast, Generic Sample Clean-up Method
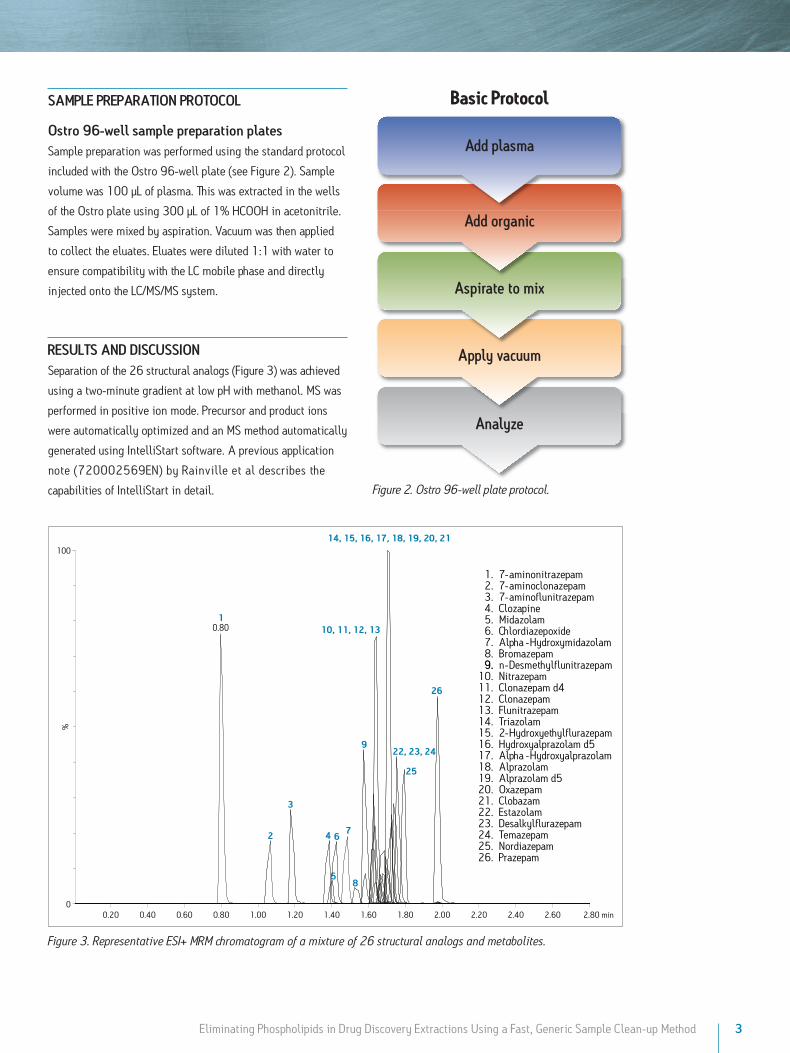
SAMPLE PrEPArATION PrOTOCOL
Ostro 96-well sample preparation platesSample preparation was performed using the standard protocol
included with the Ostro 96-well plate (see Figure 2). Sample
volume was 100 µL of plasma. This was extracted in the wells
of the Ostro plate using 300 µL of 1% HCOOH in acetonitrile.
Samples were mixed by aspiration. Vacuum was then applied
to collect the eluates. Eluates were diluted 1:1 with water to
ensure compatibility with the LC mobile phase and directly
injected onto the LC/MS/MS system.
rESuLTS ANd dISCuSSIONSeparation of the 26 structural analogs (Figure 3) was achieved
using a two-minute gradient at low pH with methanol. MS was
performed in positive ion mode. Precursor and product ions
were automatically optimized and an MS method automatically
generated using IntelliStart software. A previous application
note (720002569EN) by Rainville et al describes the
capabilities of IntelliStart in detail.
1. 7-aminonitrazepam2. 7-aminoclonazepam3. 7-aminoflunitrazepam4. Clozapine5. Midazolam6. Chlordiazepoxide7. Alpha -Hydroxymidazolam8. Bromazepam9. n-Desmethylflunitrazepam
10. Nitrazepam11. Clonazepam d412. Clonazepam13. Flunitrazepam14. Triazolam15. 2-Hydroxyethylflurazepam16. Hydroxyalprazolam d517. Alpha -Hydroxyalprazolam18. Alprazolam19. Alprazolam d520. Oxazepam21. Clobazam22. Estazolam23. Desalkylflurazepam24. Temazepam25. Nordiazepam
Prazepam26.
9.
1
2
3
4 6
5
7
8
9
10, 11, 12, 13
14, 15, 16, 17, 18, 19, 20, 21
22, 23, 24
25
26
1.20 1.40 1.60 1.80 2.00 2.20 2.40 2.60 2.80 min0.20 0.40 0.60 0.80 1.00
%
0
100
0.80
Figure 3. Representative ESI+ MRM chromatogram of a mixture of 26 structural analogs and metabolites.
Basic Protocol
Add plasma
Add organic
Aspirate to mix
Apply vacuum
Analyze
Figure 2. Ostro 96-well plate protocol.
4 Eliminating Phospholipids in Drug Discovery Extractions Using a Fast, Generic Sample Clean-up Method
The Ostro 96-well plate was used to remove residual
PLs prior to LC/MS/MS analysis. Utilizing the generic,
simple protocol provided by the manufacturer (Figure
2), a group of analogous compounds were extracted.
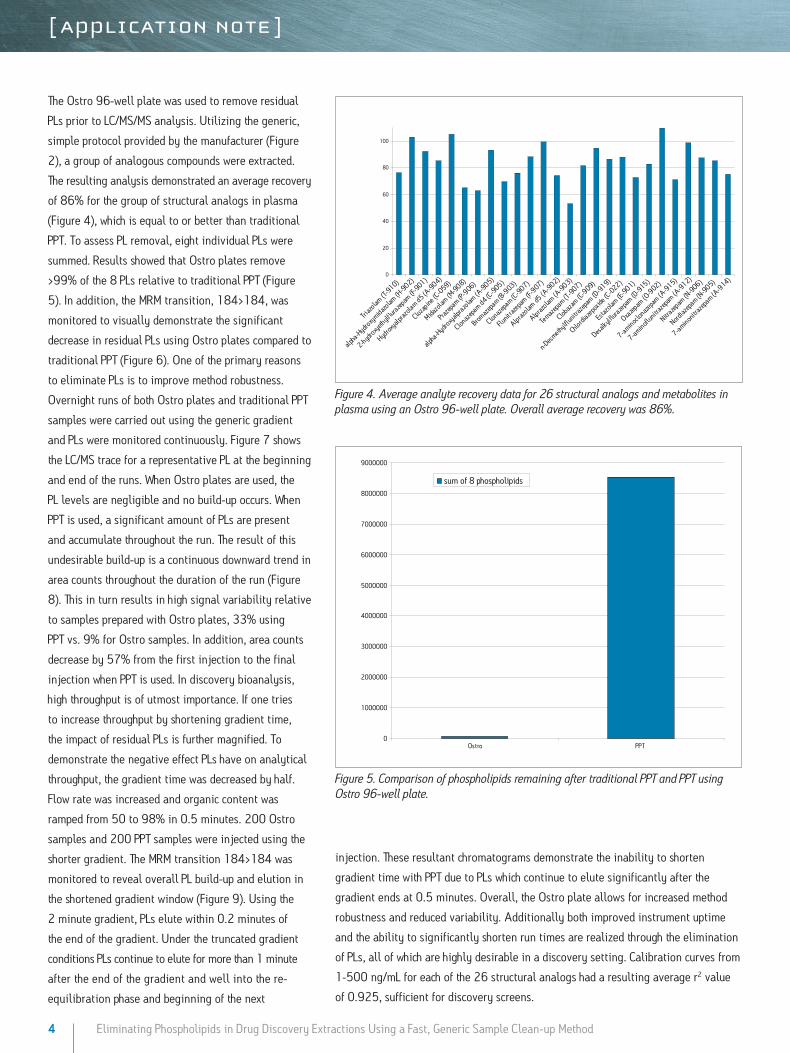
The resulting analysis demonstrated an average recovery
of 86% for the group of structural analogs in plasma
(Figure 4), which is equal to or better than traditional
PPT. To assess PL removal, eight individual PLs were
summed. Results showed that Ostro plates remove
>99% of the 8 PLs relative to traditional PPT (Figure
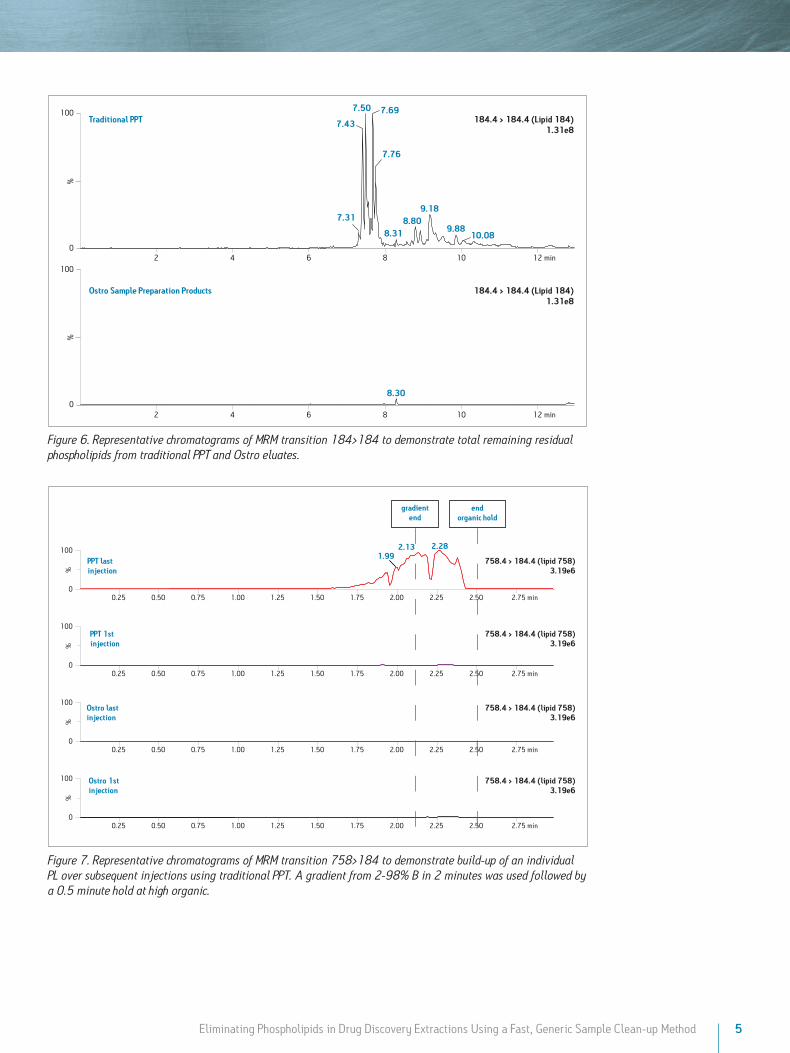
5). In addition, the MRM transition, 184>184, was
monitored to visually demonstrate the significant
decrease in residual PLs using Ostro plates compared to
traditional PPT (Figure 6). One of the primary reasons
to eliminate PLs is to improve method robustness.
Overnight runs of both Ostro plates and traditional PPT
samples were carried out using the generic gradient
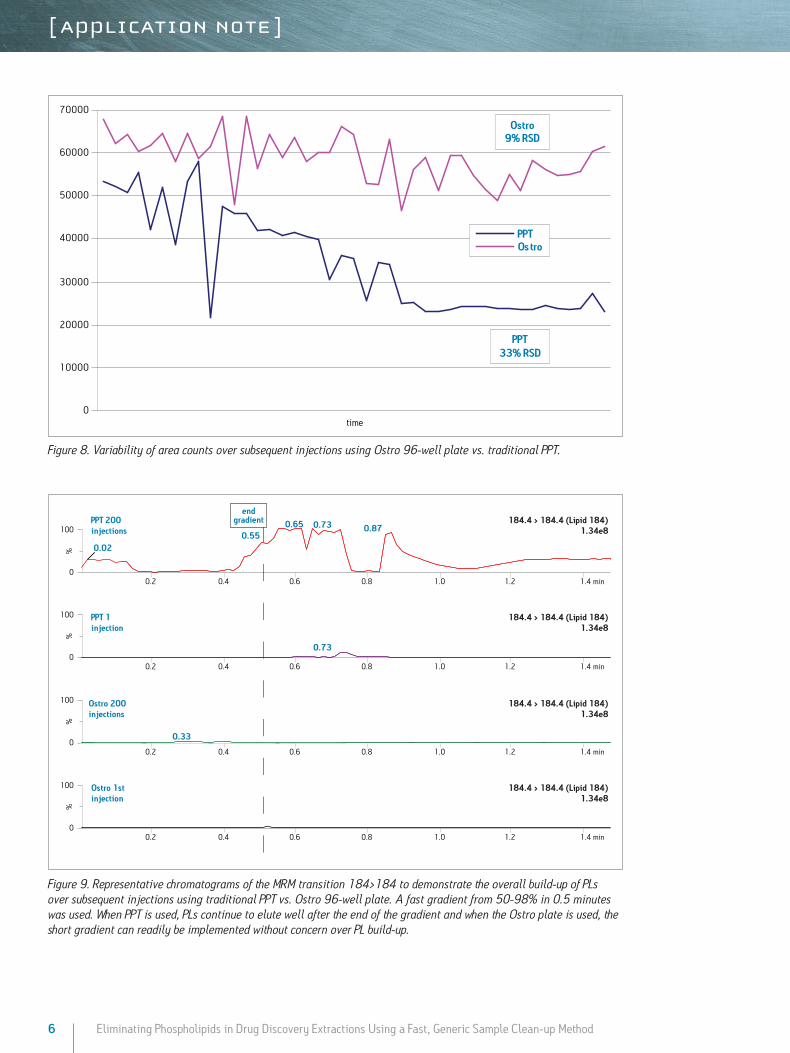
and PLs were monitored continuously. Figure 7 shows
the LC/MS trace for a representative PL at the beginning
and end of the runs. When Ostro plates are used, the
PL levels are negligible and no build-up occurs. When
PPT is used, a significant amount of PLs are present
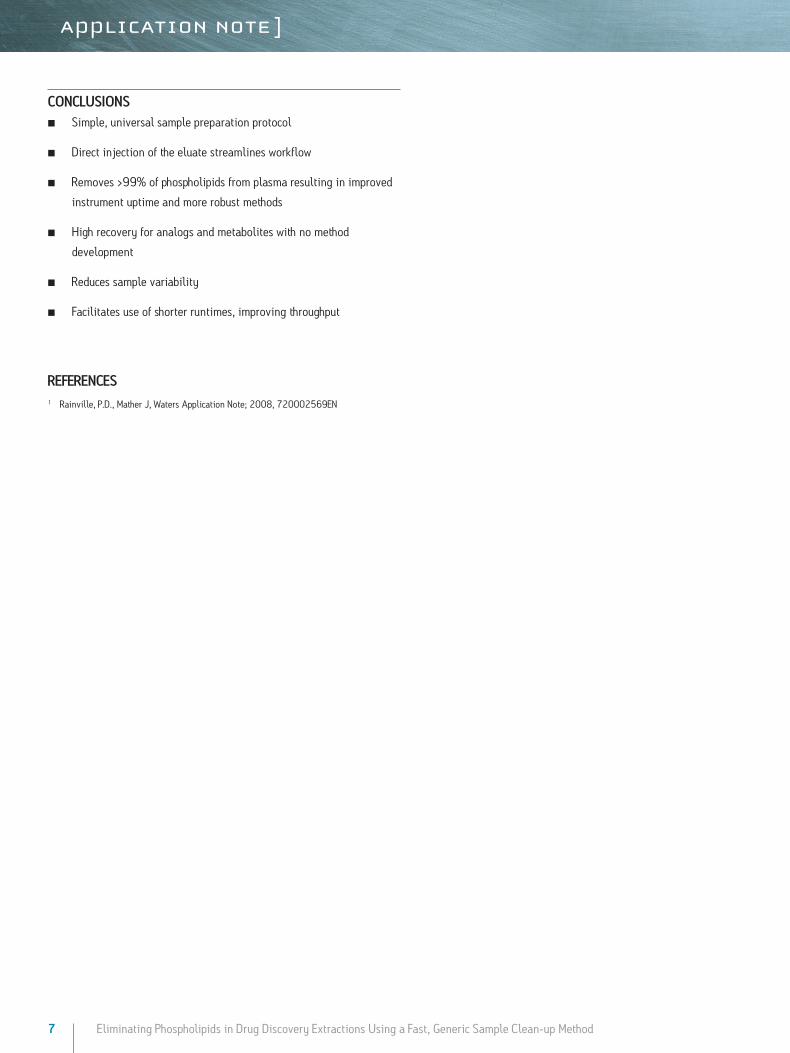
and accumulate throughout the run. The result of this
undesirable build-up is a continuous downward trend in
area counts throughout the duration of the run (Figure
8). This in turn results in high signal variability relative
to samples prepared with Ostro plates, 33% using
PPT vs. 9% for Ostro samples. In addition, area counts
decrease by 57% from the first injection to the final
injection when PPT is used. In discovery bioanalysis,
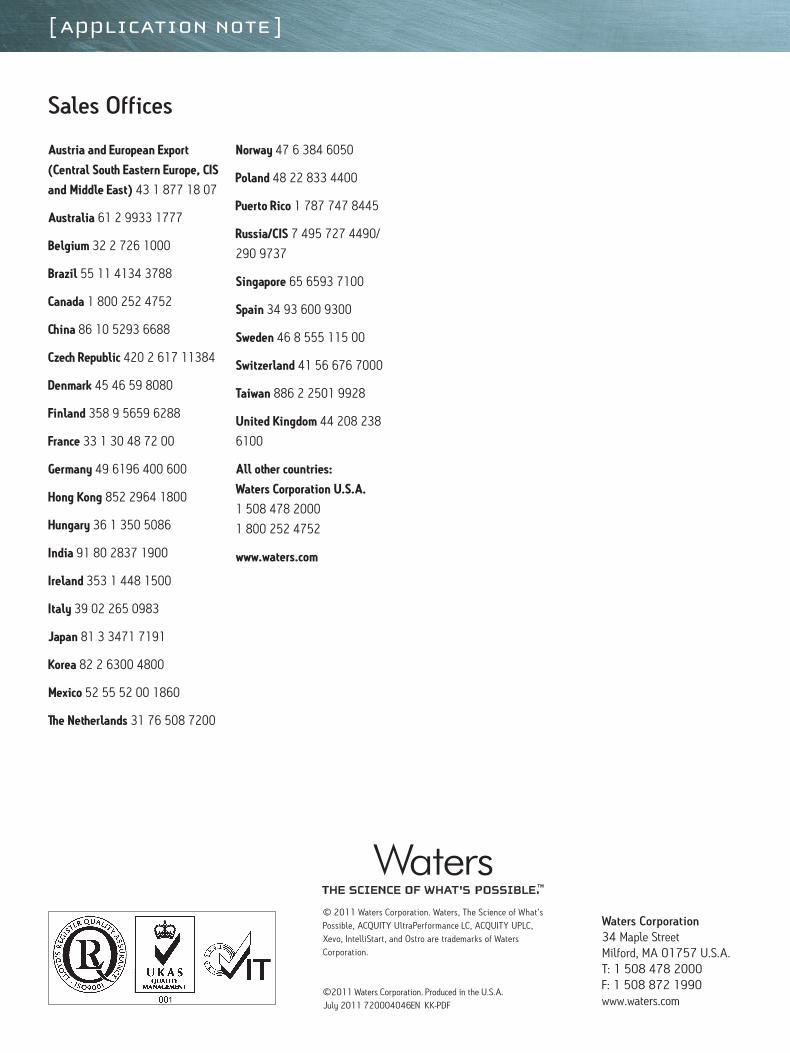
high throughput is of utmost importance. If one tries
to increase throughput by shortening gradient time,
the impact of residual PLs is further magnified. To
demonstrate the negative effect PLs have on analytical
throughput, the gradient time was decreased by half.
Flow rate was increased and organic content was
ramped from 50 to 98% in 0.5 minutes. 200 Ostro
samples and 200 PPT samples were injected using the
shorter gradient. The MRM transition 184>184 was
monitored to reveal overall PL build-up and elution in
the shortened gradient window (Figure 9). Using the
2 minute gradient, PLs elute within 0.2 minutes of
the end of the gradient. Under the truncated gradient
conditions PLs continue to elute for more than 1 minute
after the end of the gradient and well into the re-
equilibration phase and beginning of the next
injection. These resultant chromatograms demonstrate the inability to shorten
gradient time with PPT due to PLs which continue to elute significantly after the
gradient ends at 0.5 minutes. Overall, the Ostro plate allows for increased method
robustness and reduced variability. Additionally both improved instrument uptime
and the ability to significantly shorten run times are realized through the elimination
of PLs, all of which are highly desirable in a discovery setting. Calibration curves from
1-500 ng/mL for each of the 26 structural analogs had a resulting average r2 value
of 0.925, sufficient for discovery screens.
Triazo
lam (T
-910)
alpha
-Hydro
xymida
zolam
(H-9
02)
2-hydro
xyeth
ylflur
azep
am (F
-901)
Hydrox
yalpr
azola
m d5 (A
-904)
Cloza
pine (
C-059)
Midazo
lam (M
-908)
Praze
pam (P
-906)
alpha
-Hydro
xyalp
razola
m (A-9
05)
Clonaz
epam d4
(C-9
05)
Bromaz
epam (B
-903)
Clonaz
epam (C
-907)
Flunit
razep
am (F
-907)
Alprazo
lam d5
(A-9
02)
Alprazo
lam (A
-903)
Temaz
epam (T
-907)
Cloba
zam (C
-909)
n-Desm
ethylf
lunitr
azepa
m (D-9
19)
Chlor
diaze
poxid
e (C-0
22)
Estaz
olam (E
-901)
Desalky
lflura
zepam
(D-9
15)
Oxazep
am (O
-902)
7-aminoc
lonaze
pam (A
-915)
7-aminofl
unitr
azepa
m (A-9
12)
Nitrazep
am (N
-906)
Nordiaz
epam (N
-905)
7-aminon
itraz
epam (A
-914)
0
20
40
60
80
100
Figure 4. Average analyte recovery data for 26 structural analogs and metabolites in plasma using an Ostro 96-well plate. Overall average recovery was 86%.
0
1000000
2000000
3000000
4000000
5000000
6000000
7000000
8000000
9000000
Ostro PPT
sum of 8 phospholipids
Figure 5. Comparison of phospholipids remaining after traditional PPT and PPT using Ostro 96-well plate.
5Eliminating Phospholipids in Drug Discovery Extractions Using a Fast, Generic Sample Clean-up Method
0
100
%%
7.50
7.43
7.31
7.69
7.76
9.188.80
8.31 9.8810.08
Traditional PPT
2 4 6 8 10 12 min0
100
8.30
Ostro Sample Preparation Products
2 4 6 8 10 12 min
184.4 > 184.4 (Lipid 184)1.31e8
184.4 > 184.4 (Lipid 184)1.31e8
Figure 6. Representative chromatograms of MRM transition 184>184 to demonstrate total remaining residual phospholipids from traditional PPT and Ostro eluates.
2.282.131.99
PPT lastinjection
PPT 1st injection
Ostro lastinjection
Ostro 1stinjection
gradientend
endorganic hold
%
0
100
0.25 0.50 0.75 1.00 1.25 1.50 1.75 2.00 2.25 2.50 2.75 min
%
0
100
0.25 0.50 0.75 1.00 1.25 1.50 1.75 2.00 2.25 2.50 2.75 min
%
0
100
0.25 0.50 0.75 1.00 1.25 1.50 1.75 2.00 2.25 2.50 2.75 min
%
0
100
0.25 0.50 0.75 1.00 1.25 1.50 1.75 2.00 2.25 2.50 2.75 min
758.4 > 184.4 (lipid 758)3.19e6
758.4 > 184.4 (lipid 758)3.19e6
758.4 > 184.4 (lipid 758)3.19e6
758.4 > 184.4 (lipid 758)3.19e6
Figure 7. Representative chromatograms of MRM transition 758>184 to demonstrate build-up of an individual PL over subsequent injections using traditional PPT. A gradient from 2-98% B in 2 minutes was used followed by a 0.5 minute hold at high organic.
6 Eliminating Phospholipids in Drug Discovery Extractions Using a Fast, Generic Sample Clean-up Method
0
10000
20000
30000
40000
50000
60000
70000
Ostro9% RSD
PPT33% RSD
time
PPTOstro
Figure 8. Variability of area counts over subsequent injections using Ostro 96-well plate vs. traditional PPT.
0.02
Ostro 200injections
endgradient
Ostro 1stinjection
%
0
100
0.2 0.4 0.6 0.8 1.0 1.2 1.4 min
PPT 1 injection
%
0
100
0.2 0.4 0.6 0.8 1.0 1.2 1.4 min
%
0
100
0.2 0.4 0.6 0.8 1.0 1.2 1.4 min
0.65 0.73 0.87
0.73
0.33
0.55
PPT 200 injections
%
0
100
0.2 0.4 0.6 0.8 1.0 1.2 1.4 min
184.4 > 184.4 (Lipid 184)1.34e8
184.4 > 184.4 (Lipid 184)1.34e8
184.4 > 184.4 (Lipid 184)1.34e8
184.4 > 184.4 (Lipid 184)1.34e8
Figure 9. Representative chromatograms of the MRM transition 184>184 to demonstrate the overall build-up of PLs over subsequent injections using traditional PPT vs. Ostro 96-well plate. A fast gradient from 50-98% in 0.5 minutes was used. When PPT is used, PLs continue to elute well after the end of the gradient and when the Ostro plate is used, the short gradient can readily be implemented without concern over PL build-up.
7 Eliminating Phospholipids in Drug Discovery Extractions Using a Fast, Generic Sample Clean-up Method
CONCLuSIONSn Simple, universal sample preparation protocol
n Direct injection of the eluate streamlines workflow
n Removes >99% of phospholipids from plasma resulting in improved
instrument uptime and more robust methods
n High recovery for analogs and metabolites with no method
development
n Reduces sample variability
n Facilitates use of shorter runtimes, improving throughput
rEFErENCES1 Rainville, P.D., Mather J, Waters Application Note; 2008, 720002569EN
Waters Corporation 34 Maple Street Milford, MA 01757 U.S.A. T: 1 508 478 2000 F: 1 508 872 1990 www.waters.com
© 2011 Waters Corporation. Waters, T he Science of W hat’s Possible, ACQUITY UltraPerformance LC, ACQUITY UPLC, Xevo, IntelliStart, and Ostro are trademarks of Waters Corporation.
©2011 Waters Corporation. Produced in the U.S.A.July 2011 720004046EN KK-PDF
Austria and European Export (Central South Eastern Europe, CIS and Middle East) 43 1 877 18 07
Australia 61 2 9933 1777
Belgium 32 2 726 1000
Brazil 55 11 4134 3788
Canada 1 800 252 4752
China 86 10 5293 6688
Czech Republic 420 2 617 11384
Denmark 45 46 59 8080
Finland 358 9 5659 6288
France 33 1 30 48 72 00
Germany 49 6196 400 600
Hong Kong 852 2964 1800
Hungary 36 1 350 5086
India 91 80 2837 1900
Ireland 353 1 448 1500
Italy 39 02 265 0983
Japan 81 3 3471 7191
Korea 82 2 6300 4800
Mexico 52 55 52 00 1860
The Netherlands 31 76 508 7200
Norway 47 6 384 6050
Poland 48 22 833 4400
Puerto Rico 1 787 747 8445
Russia/CIS 7 495 727 4490/
290 9737
Singapore 65 6593 7100
Spain 34 93 600 9300
Sweden 46 8 555 115 00
Switzerland 41 56 676 7000
Taiwan 886 2 2501 9928
United Kingdom 44 208 238
6100
All other countries: Waters Corporation U.S.A. 1 508 478 2000
1 800 252 4752
www.waters.com
Sales Offices