electrophysiological correlates of individual differences ... · electrophysiological correlates of...
TRANSCRIPT
Neuropsychologia 86 (2016) 119–130
Contents lists available at ScienceDirect
Neuropsychologia
http://d0028-39
n CorrPurdue2038, U
E-m
journal homepage: www.elsevier.com/locate/neuropsychologia
Electrophysiological correlates of individual differences in perceptionof audiovisual temporal asynchrony
Natalya Kaganovich a,b,n, Jennifer Schumaker a
a Department of Speech, Language, and Hearing Sciences, Purdue University, 715 Clinic Drive, West Lafayette, IN 47907-2038, United Statesb Department of Psychological Sciences, Purdue University, 703 Third Street, West Lafayette, IN 47907-2038, United States
a r t i c l e i n f o
Article history:Received 13 November 2015Received in revised form14 April 2016Accepted 15 April 2016Available online 16 April 2016
Keywords:Temporal binding windowAudiovisual temporal processingSimultaneity judgment taskERPsIndividual differences
x.doi.org/10.1016/j.neuropsychologia.2016.04.032/& 2016 Elsevier Ltd. All rights reserved.
espondence to: Department of Speech, LangUniversity, Lyles Porter Hall, 715 Clinic Drivnited States.ail address: [email protected] (N. Kagano
a b s t r a c t
Sensitivity to the temporal relationship between auditory and visual stimuli is key to efficient audiovisualintegration. However, even adults vary greatly in their ability to detect audiovisual temporal asynchrony.What underlies this variability is currently unknown. We recorded event-related potentials (ERPs) whileparticipants performed a simultaneity judgment task on a range of audiovisual (AV) and visual-auditory(VA) stimulus onset asynchronies (SOAs) and compared ERP responses in good and poor performers tothe 200 ms SOA, which showed the largest individual variability in the number of synchronous per-ceptions. Analysis of ERPs to the VA200 stimulus yielded no significant results. However, those in-dividuals who were more sensitive to the AV200 SOA had significantly more positive voltage between210 and 270 ms following the sound onset. In a follow-up analysis, we showed that the mean voltagewithin this window predicted approximately 36% of variability in sensitivity to AV temporal asynchronyin a larger group of participants. The relationship between the ERP measure in the 210–270 ms windowand accuracy on the simultaneity judgment task also held for two other AV SOAs with significant in-dividual variability �100 and 300 ms. Because the identified window was time-locked to the onset ofsound in the AV stimulus, we conclude that sensitivity to AV temporal asynchrony is shaped to a largeextent by the efficiency in the neural encoding of sound onsets.
& 2016 Elsevier Ltd. All rights reserved.
1. Introduction
Temporal proximity is one of the determining factors for in-tegrating multisensory, and more specifically audiovisual, stimuliinto a coherent percept (Stein and Meredith, 1993). Importantly, aconsistent finding in research on audiovisual integration is that theperception of multisensory temporal synchrony does not requirethat auditory and visual stimuli occur at exactly the same time.Instead, we perceive audiovisual information as synchronous aslong as the onsets of the two modalities fall within a certaintemporal distance from each other, termed the temporal bindingwindow (TBW) (for reviews, see Keetels and Vroomen, 2012; Va-takis and Spence, 2010; Vroomen and Keetels, 2010).
Arguably, one of the key features of the TBW is that its size isnot constant and is influenced by many factors. It is typically largerfor visual-auditory (VA) sequences of stimuli compared to audi-tory-visual (AV) ones (Bushara et al., 2001; Dixon and Spitz, 1980;Grant et al., 2004; Lewkowicz, 1996; van Wassenhove et al., 2007);
15
uage, and Hearing Sciences,e, West Lafayette, IN 47907-
vich).
it is larger for speech and other complex stimuli compared tosimpler non-speech stimuli (Vatakis and Spence, 2010; Vroomenand Stekelenburg, 2011); it can be reduced through perceptualtraining (Powers III et al., 2009; Stevenson et al., 2013); it dependson one's expertise with specific audiovisual stimuli (e.g., Petriniet al., 2009); and it is affected by the task used to measure it(Stevenson and Wallace, 2013; van Eijk et al., 2008).
In most studies, the size of the TBW is evaluated at a grouplevel. Significantly less research has been conducted on individualvariability in sensitivity to audiovisual temporal asynchrony andits causes. The significance of individual variability in TBW is un-derlined by a number of findings. First, impairment in the ability todetect audiovisual temporal correspondences (and, as a result, amuch broader than typical TBW) has been reported for multipleneurodevelopmental disorders (for a comprehensive review, seeWallace and Stevenson, 2014), such as dyslexia (Hairston et al.,2005), specific language impairment (SLI) (Grondin et al., 2007;Kaganovich et al., 2014), and autism (Foss-Feig et al., 2010; Kwakyeet al., 2011; Stevenson et al., 2014). Importantly, at least in some ofthese studies, precision with which participants perceive audio-visual asynchrony predicted the degree of language and othercognitive impairments. For example, Donohue and colleagues(Donohue et al., 2012) examined a correlation between the degree
N. Kaganovich, J. Schumaker / Neuropsychologia 86 (2016) 119–130120
of self-reported symptoms of autism in general population and thetemporal relationship between auditory and visual stimuli thatleads to the most salient perception of synchrony. They found thatindividuals with the greater number of autism traits consistentlyreported as simultaneous those stimuli in which the auditorymodality slightly preceded the visual one – the pattern that isopposite to the one seen in individuals with fewer autism traits. Inan earlier study from our laboratory (Kaganovich et al., 2014),those children with a history of SLI who were worse at detectingasynchrony at long stimulus-onset asynchronies (SOAs) (400–500 ms) also had lower core language scores as determined by theClinical Evaluation of Language Fundamentals (CELF-4; Semelet al., 2003). Second, in healthy adults, the smaller size of the TBWwas linked to greater susceptibility to the McGurk illusion (Ste-venson et al., 2012) and to better comprehension of degradedaudiovisual speech (Conrey and Pisoni, 2006). The relationshipbetween the TBW and susceptibility to the McGurk illusion hasalso been replicated in children with autism (Stevenson et al.,2014). Together, these findings suggest that sensitivity to audio-visual temporal relationships may contribute to successful devel-opment of at least some cognitive and linguistic skills.
The TBW is typically measured in a simultaneity judgment task(SJT), in which audiovisual stimuli are presented in a range ofSOAs, and participants have to identify each stimulus presentationas audiovisually synchronous or asynchronous. The number ofsynchronous perceptions is then plotted as a function of SOA, andthe results are fitted to a sigmoid function, separately for AV andVA SOAs. The TBW is determined as an estimated SOA at whichparticipants detect asynchrony with a specific degree of certainty(typically on 50–75% of trials, depending on the study). The TBWthus provides a single measure of sensitivity to audiovisual asyn-chrony and is a succinct description of individuals' performance onthe SJT. However, the synergistic nature of this measure may alsobe its weakness under some circumstances. More specifically, theshape of the sigmoid function (and, as a consequence, the size ofthe TBW) may be determined to a greater degree by some SOAsthan by others. Yet, this information is, for the most part, lost in asingle TBW measure. Careful examination of published work andresearch in our own laboratory show that while at short(e.g.,100 ms or less) and long1 (e.g., 400 ms or more) SOAs adultslargely agree in their simultaneity judgment, medium-sized SOAslead to significant individual variability.
Several neuroimaging studies have examined the neural cor-relates of sensitivity to audiovisual temporal synchrony/asyn-chrony at a group level and reported activations in a network ofregions that include both well-established multisensory areas,such as parts of the superior temporal cortex, as well as auditoryand visual sensory cortices (Macaluso et al., 2004; Powers III et al.,2012; Stevenson et al., 2010) and the right insula (Bushara et al.,2001). In an insightful addition to this literature, Powers and col-leagues (Powers III et al., 2012, 2009) have demonstrated that thereduction in the size of TBW following perceptual training leads todecreased activation in the key elements of the network, such asposterior superior temporal sulcus and auditory and visual cor-tices, as well as enhanced connectivity among them. This line ofresearch reveals the complexity of the neural mechanisms en-gaged during audiovisual temporal processing and suggests thatindividual variability in any number of neural functions – fromearly sensory encoding to actual multisensory integrative me-chanisms – may potentially contribute to observed individualdifferences in sensitivity to audiovisual temporal asynchrony.
1 The length of what may be considered “short” and “long” SOAs will of coursedepend to some degree on the stimuli used. The numbers given are not meant to beabsolute values but serve as an example based on our own work with non-speechstimuli.
One other aspect of audiovisual temporal processing deserves aspecial mention because of its relevance to the findings of thecurrent study – namely, neural activity underlying temporalaudiovisual processing can be modified not only by the physicalproperties of stimuli (e.g., whether the auditory and visual com-ponents of a stimulus in fact occurred at the same time) but alsoby the subjective perception of such properties (e.g., whetheraudiovisual stimuli were perceived as synchronous or asynchro-nous). This distinction was clearly demonstrated by the study ofStevenson and colleagues (Stevenson et al., 2011), who presentedtheir participants with ambiguous audiovisual stimuli, which wereperceived as synchronous in approximately half of all trials andasynchronous in another half. They identified two distinct areas ofthe multisensory superior temporal cortex (mSTC) that respondeddifferently to physical synchronicity and to perceptual fusion – thesynchrony-defined mSTC was activated by true audiovisual syn-chrony regardless of how it was perceived, while the bimodalmSTC responded significantly only to subjective perception ofsynchrony, regardless of whether the stimulus that elicited theperceptual fusion was synchronous or asynchronous.
In the current study, we combined the SJT with event-relatedpotential recordings (ERPs) in order to focus on the timing of theneural processes engaged during the detection of audiovisualtemporal asynchrony. More specifically, we asked at which pointin time brain responses of individuals who are better detectors ofasynchrony (i.e., good performers) differ from brain responses ofthose individuals who are worse detectors of asynchrony (i.e., poorperformers), with the expectation that the outcome of this com-parison would be informative as to the perceptual and cognitiveprocesses that underlie individual variability in sensitivity totemporal asynchrony. Earlier ERP studies of audiovisual integra-tion reported the attenuation of the auditory N1 and/or P2 com-ponent to audiovisual as compared to the sum of auditory only andvisual only stimuli (Baart et al., 2014; Besle et al., 2004; Kagano-vich and Schumaker, 2014; Knowland et al., 2014; Stekelenburgand Vroomen, 2007; van Wassenhove et al., 2005). However, givensignificant design differences between the SJT and the above stu-dies, focusing on just N1 and P2 in our analyses was not justifiable.Instead, in an approach similar to the region of interest analysesused in fMRI research, we first defined our temporal windows ofinterest based on ERPs elicited by auditory only (a pure tone) andvisual only (a flash of light) stimuli. These windows included allvisible ERP components elicited by the onset of the stimuli. Wethen used these windows to analyze ERPs to an audiovisuallyasynchronous presentation of the same stimuli at the SOA that ledto the largest variability in synchronous perceptions (200 ms). Wecompared ERPs elicited in good and poor performers in a series oft-tests conducted on each consecutive measurement point withinthe window of interest and used the false discovery rate (FDR)correction to control for type I error due to multiple comparisons.Following this initial step, we extended our analyses in two ways.First, in order to determine that the identified ERP differencesbetween good and poor performers did in fact relate to theirability to detect asynchrony on a SJT, we conducted a linear re-gression analysis on a larger group of participants with the ERPmeasure as a predictor and the number of synchronous percep-tions at a 200 ms SOA as an outcome. Second, to ascertain that ourfinding can be generalized to other SOAs with substantial in-dividual variability, we conducted similar regression analyses be-tween ERP measures and the number of synchronous perceptionsfor the 100 and 300 ms SOAs.
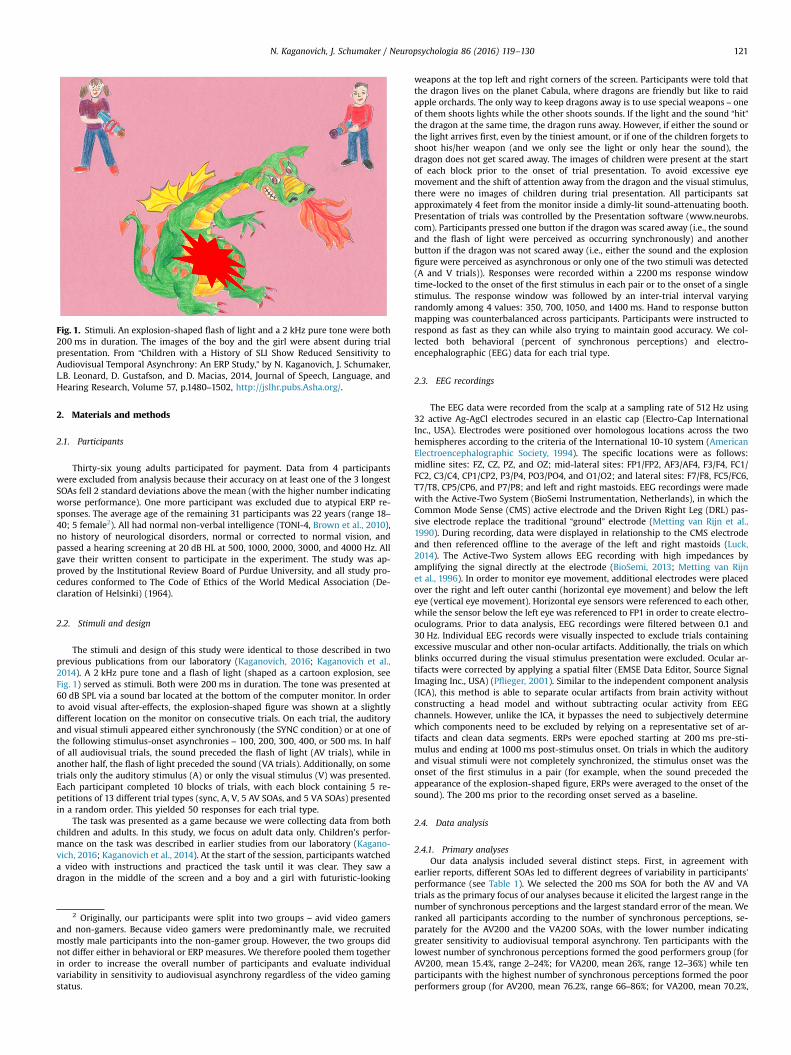
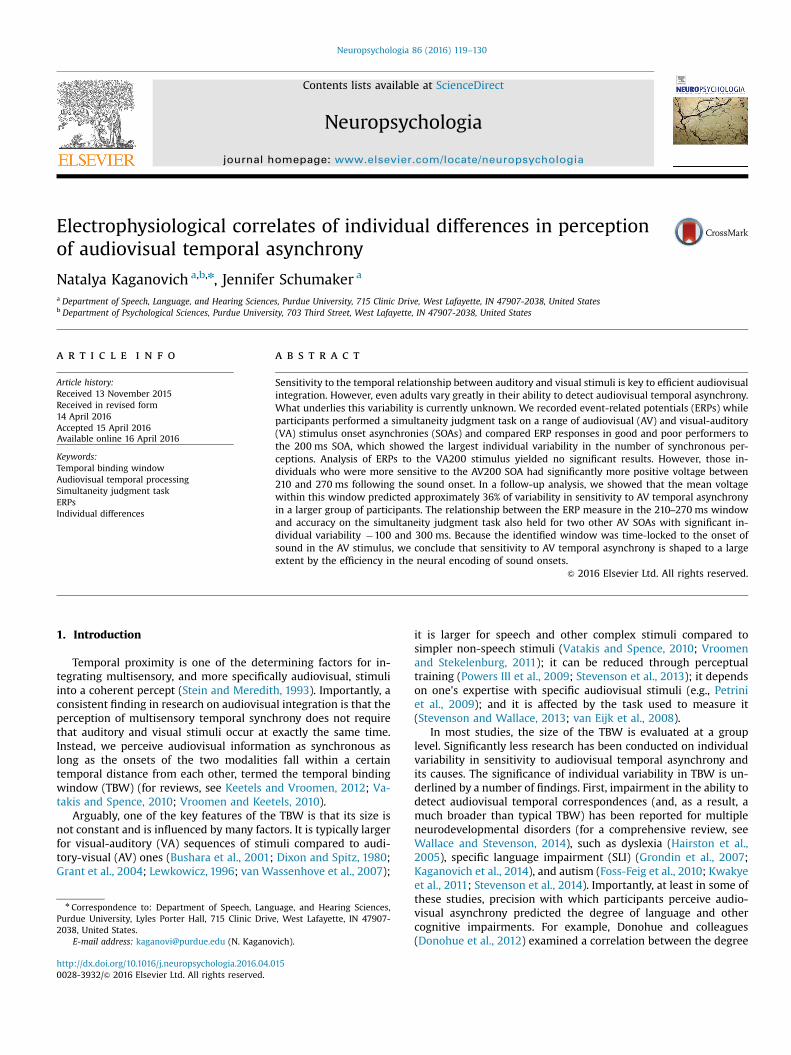
Fig. 1. Stimuli. An explosion-shaped flash of light and a 2 kHz pure tone were both200 ms in duration. The images of the boy and the girl were absent during trialpresentation. From “Children with a History of SLI Show Reduced Sensitivity toAudiovisual Temporal Asynchrony: An ERP Study,” by N. Kaganovich, J. Schumaker,L.B. Leonard, D. Gustafson, and D. Macias, 2014, Journal of Speech, Language, andHearing Research, Volume 57, p.1480–1502, http://jslhr.pubs.Asha.org/.
N. Kaganovich, J. Schumaker / Neuropsychologia 86 (2016) 119–130 121
2. Materials and methods
2.1. Participants
Thirty-six young adults participated for payment. Data from 4 participantswere excluded from analysis because their accuracy on at least one of the 3 longestSOAs fell 2 standard deviations above the mean (with the higher number indicatingworse performance). One more participant was excluded due to atypical ERP re-sponses. The average age of the remaining 31 participants was 22 years (range 18–40; 5 female2). All had normal non-verbal intelligence (TONI-4, Brown et al., 2010),no history of neurological disorders, normal or corrected to normal vision, andpassed a hearing screening at 20 dB HL at 500, 1000, 2000, 3000, and 4000 Hz. Allgave their written consent to participate in the experiment. The study was ap-proved by the Institutional Review Board of Purdue University, and all study pro-cedures conformed to The Code of Ethics of the World Medical Association (De-claration of Helsinki) (1964).
2.2. Stimuli and design
The stimuli and design of this study were identical to those described in twoprevious publications from our laboratory (Kaganovich, 2016; Kaganovich et al.,2014). A 2 kHz pure tone and a flash of light (shaped as a cartoon explosion, seeFig. 1) served as stimuli. Both were 200 ms in duration. The tone was presented at60 dB SPL via a sound bar located at the bottom of the computer monitor. In orderto avoid visual after-effects, the explosion-shaped figure was shown at a slightlydifferent location on the monitor on consecutive trials. On each trial, the auditoryand visual stimuli appeared either synchronously (the SYNC condition) or at one ofthe following stimulus-onset asynchronies – 100, 200, 300, 400, or 500 ms. In halfof all audiovisual trials, the sound preceded the flash of light (AV trials), while inanother half, the flash of light preceded the sound (VA trials). Additionally, on sometrials only the auditory stimulus (A) or only the visual stimulus (V) was presented.Each participant completed 10 blocks of trials, with each block containing 5 re-petitions of 13 different trial types (sync, A, V, 5 AV SOAs, and 5 VA SOAs) presentedin a random order. This yielded 50 responses for each trial type.
The task was presented as a game because we were collecting data from bothchildren and adults. In this study, we focus on adult data only. Children's perfor-mance on the task was described in earlier studies from our laboratory (Kagano-vich, 2016; Kaganovich et al., 2014). At the start of the session, participants watcheda video with instructions and practiced the task until it was clear. They saw adragon in the middle of the screen and a boy and a girl with futuristic-looking
2 Originally, our participants were split into two groups – avid video gamersand non-gamers. Because video gamers were predominantly male, we recruitedmostly male participants into the non-gamer group. However, the two groups didnot differ either in behavioral or ERP measures. We therefore pooled them togetherin order to increase the overall number of participants and evaluate individualvariability in sensitivity to audiovisual asynchrony regardless of the video gamingstatus.
weapons at the top left and right corners of the screen. Participants were told thatthe dragon lives on the planet Cabula, where dragons are friendly but like to raidapple orchards. The only way to keep dragons away is to use special weapons – oneof them shoots lights while the other shoots sounds. If the light and the sound “hit”the dragon at the same time, the dragon runs away. However, if either the sound orthe light arrives first, even by the tiniest amount, or if one of the children forgets toshoot his/her weapon (and we only see the light or only hear the sound), thedragon does not get scared away. The images of children were present at the startof each block prior to the onset of trial presentation. To avoid excessive eyemovement and the shift of attention away from the dragon and the visual stimulus,there were no images of children during trial presentation. All participants satapproximately 4 feet from the monitor inside a dimly-lit sound-attenuating booth.Presentation of trials was controlled by the Presentation software (www.neurobs.com). Participants pressed one button if the dragon was scared away (i.e., the soundand the flash of light were perceived as occurring synchronously) and anotherbutton if the dragon was not scared away (i.e., either the sound and the explosionfigure were perceived as asynchronous or only one of the two stimuli was detected(A and V trials)). Responses were recorded within a 2200 ms response windowtime-locked to the onset of the first stimulus in each pair or to the onset of a singlestimulus. The response window was followed by an inter-trial interval varyingrandomly among 4 values: 350, 700, 1050, and 1400 ms. Hand to response buttonmapping was counterbalanced across participants. Participants were instructed torespond as fast as they can while also trying to maintain good accuracy. We col-lected both behavioral (percent of synchronous perceptions) and electro-encephalographic (EEG) data for each trial type.
2.3. EEG recordings
The EEG data were recorded from the scalp at a sampling rate of 512 Hz using32 active Ag-AgCl electrodes secured in an elastic cap (Electro-Cap InternationalInc., USA). Electrodes were positioned over homologous locations across the twohemispheres according to the criteria of the International 10-10 system (AmericanElectroencephalographic Society, 1994). The specific locations were as follows:midline sites: FZ, CZ, PZ, and OZ; mid-lateral sites: FP1/FP2, AF3/AF4, F3/F4, FC1/FC2, C3/C4, CP1/CP2, P3/P4, PO3/PO4, and O1/O2; and lateral sites: F7/F8, FC5/FC6,T7/T8, CP5/CP6, and P7/P8; and left and right mastoids. EEG recordings were madewith the Active-Two System (BioSemi Instrumentation, Netherlands), in which theCommon Mode Sense (CMS) active electrode and the Driven Right Leg (DRL) pas-sive electrode replace the traditional “ground” electrode (Metting van Rijn et al.,1990). During recording, data were displayed in relationship to the CMS electrodeand then referenced offline to the average of the left and right mastoids (Luck,2014). The Active-Two System allows EEG recording with high impedances byamplifying the signal directly at the electrode (BioSemi, 2013; Metting van Rijnet al., 1996). In order to monitor eye movement, additional electrodes were placedover the right and left outer canthi (horizontal eye movement) and below the lefteye (vertical eye movement). Horizontal eye sensors were referenced to each other,while the sensor below the left eye was referenced to FP1 in order to create electro-oculograms. Prior to data analysis, EEG recordings were filtered between 0.1 and30 Hz. Individual EEG records were visually inspected to exclude trials containingexcessive muscular and other non-ocular artifacts. Additionally, the trials on whichblinks occurred during the visual stimulus presentation were excluded. Ocular ar-tifacts were corrected by applying a spatial filter (EMSE Data Editor, Source SignalImaging Inc., USA) (Pflieger, 2001). Similar to the independent component analysis(ICA), this method is able to separate ocular artifacts from brain activity withoutconstructing a head model and without subtracting ocular activity from EEGchannels. However, unlike the ICA, it bypasses the need to subjectively determinewhich components need to be excluded by relying on a representative set of ar-tifacts and clean data segments. ERPs were epoched starting at 200 ms pre-sti-mulus and ending at 1000 ms post-stimulus onset. On trials in which the auditoryand visual stimuli were not completely synchronized, the stimulus onset was theonset of the first stimulus in a pair (for example, when the sound preceded theappearance of the explosion-shaped figure, ERPs were averaged to the onset of thesound). The 200 ms prior to the recording onset served as a baseline.
2.4. Data analysis
2.4.1. Primary analysesOur data analysis included several distinct steps. First, in agreement with
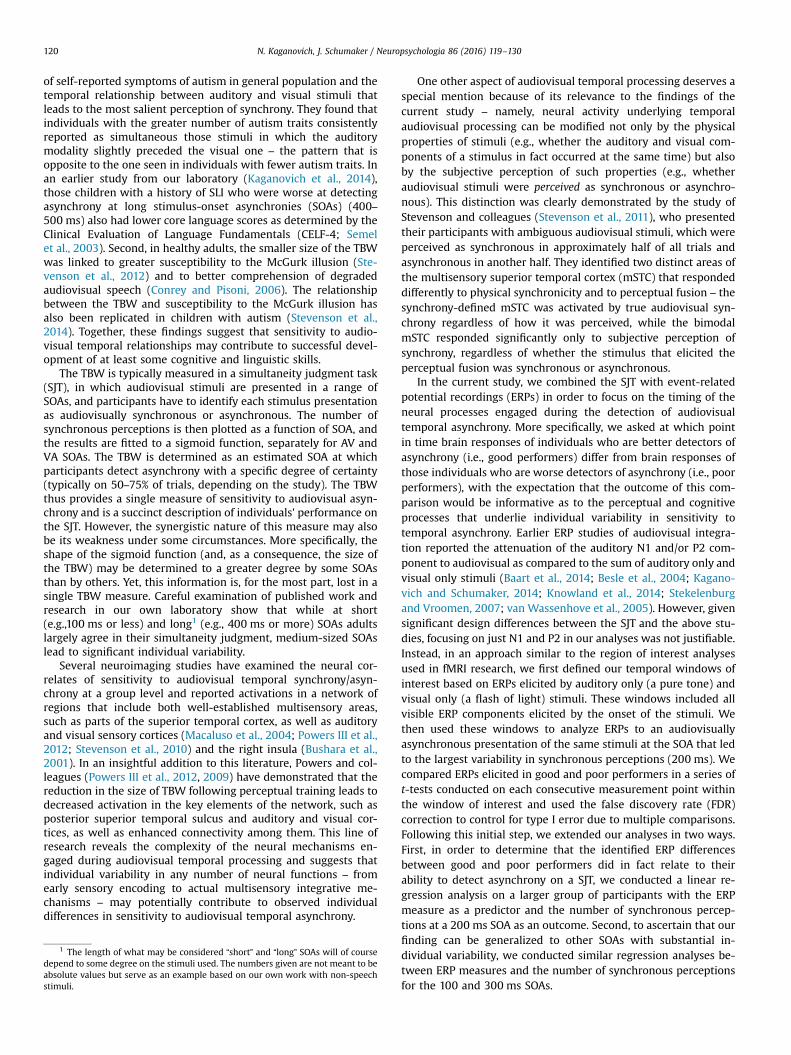
earlier reports, different SOAs led to different degrees of variability in participants’performance (see Table 1). We selected the 200 ms SOA for both the AV and VAtrials as the primary focus of our analyses because it elicited the largest range in thenumber of synchronous perceptions and the largest standard error of the mean. Weranked all participants according to the number of synchronous perceptions, se-parately for the AV200 and the VA200 SOAs, with the lower number indicatinggreater sensitivity to audiovisual temporal asynchrony. Ten participants with thelowest number of synchronous perceptions formed the good performers group (forAV200, mean 15.4%, range 2–24%; for VA200, mean 26%, range 12–36%) while tenparticipants with the highest number of synchronous perceptions formed the poorperformers group (for AV200, mean 76.2%, range 66–86%; for VA200, mean 70.2%,
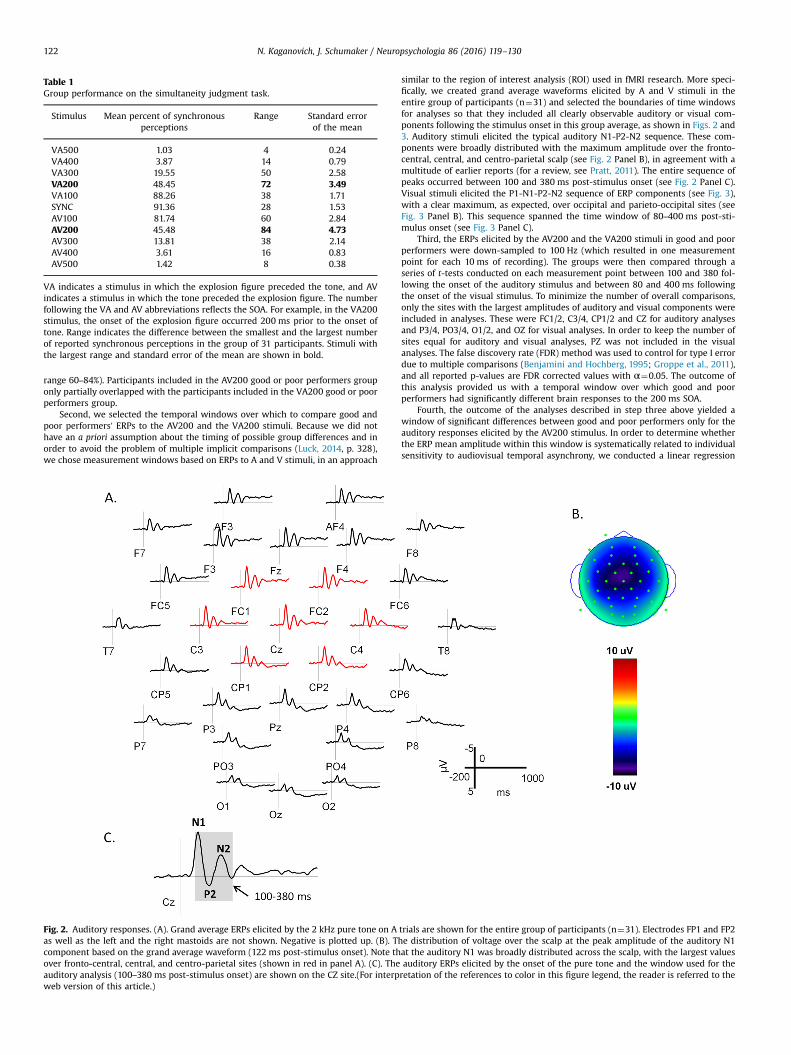
Table 1Group performance on the simultaneity judgment task.
Stimulus Mean percent of synchronousperceptions
Range Standard errorof the mean
VA500 1.03 4 0.24VA400 3.87 14 0.79VA300 19.55 50 2.58VA200 48.45 72 3.49VA100 88.26 38 1.71SYNC 91.36 28 1.53AV100 81.74 60 2.84AV200 45.48 84 4.73AV300 13.81 38 2.14AV400 3.61 16 0.83AV500 1.42 8 0.38
VA indicates a stimulus in which the explosion figure preceded the tone, and AVindicates a stimulus in which the tone preceded the explosion figure. The numberfollowing the VA and AV abbreviations reflects the SOA. For example, in the VA200stimulus, the onset of the explosion figure occurred 200 ms prior to the onset oftone. Range indicates the difference between the smallest and the largest numberof reported synchronous perceptions in the group of 31 participants. Stimuli withthe largest range and standard error of the mean are shown in bold.
N. Kaganovich, J. Schumaker / Neuropsychologia 86 (2016) 119–130122
range 60–84%). Participants included in the AV200 good or poor performers grouponly partially overlapped with the participants included in the VA200 good or poorperformers group.
Second, we selected the temporal windows over which to compare good andpoor performers’ ERPs to the AV200 and the VA200 stimuli. Because we did nothave an a priori assumption about the timing of possible group differences and inorder to avoid the problem of multiple implicit comparisons (Luck, 2014, p. 328),we chose measurement windows based on ERPs to A and V stimuli, in an approach
Fig. 2. Auditory responses. (A). Grand average ERPs elicited by the 2 kHz pure tone on Aas well as the left and the right mastoids are not shown. Negative is plotted up. (B). Tcomponent based on the grand average waveform (122 ms post-stimulus onset). Note thover fronto-central, central, and centro-parietal sites (shown in red in panel A). (C). Theauditory analysis (100–380 ms post-stimulus onset) are shown on the CZ site.(For interpweb version of this article.)
similar to the region of interest analysis (ROI) used in fMRI research. More speci-fically, we created grand average waveforms elicited by A and V stimuli in theentire group of participants (n¼31) and selected the boundaries of time windowsfor analyses so that they included all clearly observable auditory or visual com-ponents following the stimulus onset in this group average, as shown in Figs. 2 and3. Auditory stimuli elicited the typical auditory N1-P2-N2 sequence. These com-ponents were broadly distributed with the maximum amplitude over the fronto-central, central, and centro-parietal scalp (see Fig. 2 Panel B), in agreement with amultitude of earlier reports (for a review, see Pratt, 2011). The entire sequence ofpeaks occurred between 100 and 380 ms post-stimulus onset (see Fig. 2 Panel C).Visual stimuli elicited the P1-N1-P2-N2 sequence of ERP components (see Fig. 3),with a clear maximum, as expected, over occipital and parieto-occipital sites (seeFig. 3 Panel B). This sequence spanned the time window of 80–400 ms post-sti-mulus onset (see Fig. 3 Panel C).
Third, the ERPs elicited by the AV200 and the VA200 stimuli in good and poorperformers were down-sampled to 100 Hz (which resulted in one measurementpoint for each 10 ms of recording). The groups were then compared through aseries of t-tests conducted on each measurement point between 100 and 380 fol-lowing the onset of the auditory stimulus and between 80 and 400 ms followingthe onset of the visual stimulus. To minimize the number of overall comparisons,only the sites with the largest amplitudes of auditory and visual components wereincluded in analyses. These were FC1/2, C3/4, CP1/2 and CZ for auditory analysesand P3/4, PO3/4, O1/2, and OZ for visual analyses. In order to keep the number ofsites equal for auditory and visual analyses, PZ was not included in the visualanalyses. The false discovery rate (FDR) method was used to control for type I errordue to multiple comparisons (Benjamini and Hochberg, 1995; Groppe et al., 2011),and all reported p-values are FDR corrected values with α¼0.05. The outcome ofthis analysis provided us with a temporal window over which good and poorperformers had significantly different brain responses to the 200 ms SOA.
Fourth, the outcome of the analyses described in step three above yielded awindow of significant differences between good and poor performers only for theauditory responses elicited by the AV200 stimulus. In order to determine whetherthe ERP mean amplitude within this window is systematically related to individualsensitivity to audiovisual temporal asynchrony, we conducted a linear regression
trials are shown for the entire group of participants (n¼31). Electrodes FP1 and FP2he distribution of voltage over the scalp at the peak amplitude of the auditory N1at the auditory N1 was broadly distributed across the scalp, with the largest valuesauditory ERPs elicited by the onset of the pure tone and the window used for theretation of the references to color in this figure legend, the reader is referred to the
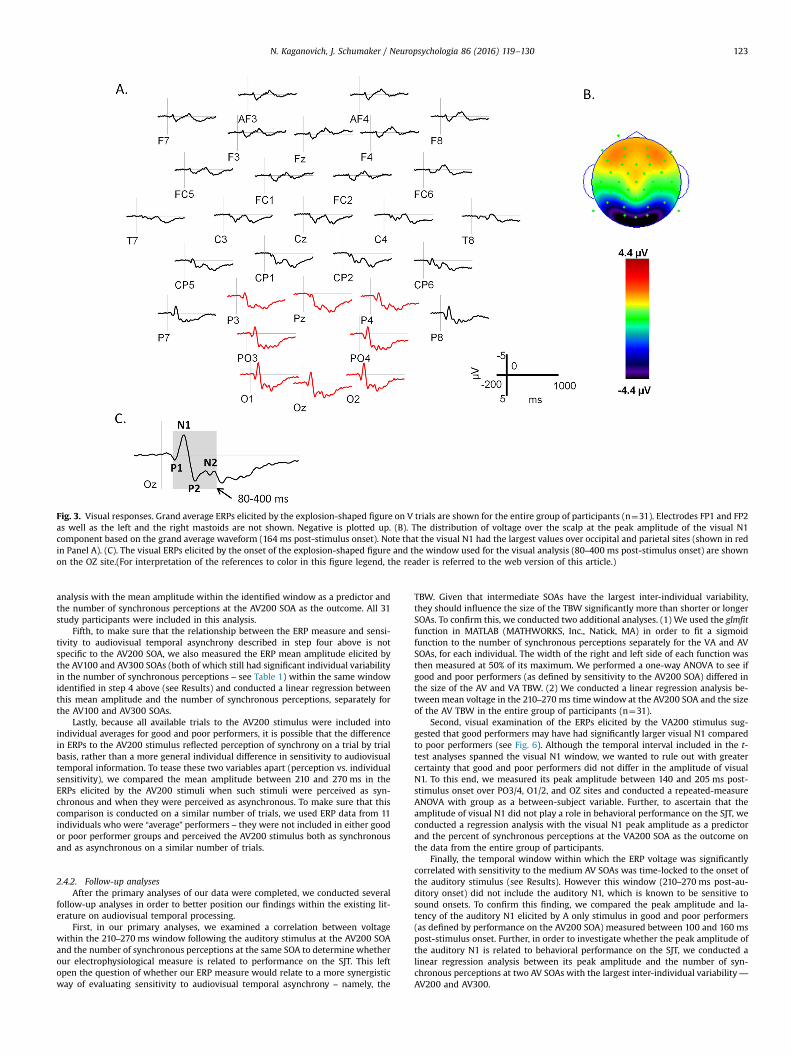
Fig. 3. Visual responses. Grand average ERPs elicited by the explosion-shaped figure on V trials are shown for the entire group of participants (n¼31). Electrodes FP1 and FP2as well as the left and the right mastoids are not shown. Negative is plotted up. (B). The distribution of voltage over the scalp at the peak amplitude of the visual N1component based on the grand average waveform (164 ms post-stimulus onset). Note that the visual N1 had the largest values over occipital and parietal sites (shown in redin Panel A). (C). The visual ERPs elicited by the onset of the explosion-shaped figure and the window used for the visual analysis (80–400 ms post-stimulus onset) are shownon the OZ site.(For interpretation of the references to color in this figure legend, the reader is referred to the web version of this article.)
N. Kaganovich, J. Schumaker / Neuropsychologia 86 (2016) 119–130 123
analysis with the mean amplitude within the identified window as a predictor andthe number of synchronous perceptions at the AV200 SOA as the outcome. All 31study participants were included in this analysis.
Fifth, to make sure that the relationship between the ERP measure and sensi-tivity to audiovisual temporal asynchrony described in step four above is notspecific to the AV200 SOA, we also measured the ERP mean amplitude elicited bythe AV100 and AV300 SOAs (both of which still had significant individual variabilityin the number of synchronous perceptions – see Table 1) within the same windowidentified in step 4 above (see Results) and conducted a linear regression betweenthis mean amplitude and the number of synchronous perceptions, separately forthe AV100 and AV300 SOAs.
Lastly, because all available trials to the AV200 stimulus were included intoindividual averages for good and poor performers, it is possible that the differencein ERPs to the AV200 stimulus reflected perception of synchrony on a trial by trialbasis, rather than a more general individual difference in sensitivity to audiovisualtemporal information. To tease these two variables apart (perception vs. individualsensitivity), we compared the mean amplitude between 210 and 270 ms in theERPs elicited by the AV200 stimuli when such stimuli were perceived as syn-chronous and when they were perceived as asynchronous. To make sure that thiscomparison is conducted on a similar number of trials, we used ERP data from 11individuals who were “average” performers – they were not included in either goodor poor performer groups and perceived the AV200 stimulus both as synchronousand as asynchronous on a similar number of trials.
2.4.2. Follow-up analysesAfter the primary analyses of our data were completed, we conducted several
follow-up analyses in order to better position our findings within the existing lit-erature on audiovisual temporal processing.
First, in our primary analyses, we examined a correlation between voltagewithin the 210–270 ms window following the auditory stimulus at the AV200 SOAand the number of synchronous perceptions at the same SOA to determine whetherour electrophysiological measure is related to performance on the SJT. This leftopen the question of whether our ERP measure would relate to a more synergisticway of evaluating sensitivity to audiovisual temporal asynchrony – namely, the
TBW. Given that intermediate SOAs have the largest inter-individual variability,they should influence the size of the TBW significantly more than shorter or longerSOAs. To confirm this, we conducted two additional analyses. (1) We used the glmfitfunction in MATLAB (MATHWORKS, Inc., Natick, MA) in order to fit a sigmoidfunction to the number of synchronous perceptions separately for the VA and AVSOAs, for each individual. The width of the right and left side of each function wasthen measured at 50% of its maximum. We performed a one-way ANOVA to see ifgood and poor performers (as defined by sensitivity to the AV200 SOA) differed inthe size of the AV and VA TBW. (2) We conducted a linear regression analysis be-tween mean voltage in the 210–270 ms time window at the AV200 SOA and the sizeof the AV TBW in the entire group of participants (n¼31).
Second, visual examination of the ERPs elicited by the VA200 stimulus sug-gested that good performers may have had significantly larger visual N1 comparedto poor performers (see Fig. 6). Although the temporal interval included in the t-test analyses spanned the visual N1 window, we wanted to rule out with greatercertainty that good and poor performers did not differ in the amplitude of visualN1. To this end, we measured its peak amplitude between 140 and 205 ms post-stimulus onset over PO3/4, O1/2, and OZ sites and conducted a repeated-measureANOVA with group as a between-subject variable. Further, to ascertain that theamplitude of visual N1 did not play a role in behavioral performance on the SJT, weconducted a regression analysis with the visual N1 peak amplitude as a predictorand the percent of synchronous perceptions at the VA200 SOA as the outcome onthe data from the entire group of participants.
Finally, the temporal window within which the ERP voltage was significantlycorrelated with sensitivity to the medium AV SOAs was time-locked to the onset ofthe auditory stimulus (see Results). However this window (210–270 ms post-au-ditory onset) did not include the auditory N1, which is known to be sensitive tosound onsets. To confirm this finding, we compared the peak amplitude and la-tency of the auditory N1 elicited by A only stimulus in good and poor performers(as defined by performance on the AV200 SOA) measured between 100 and 160 mspost-stimulus onset. Further, in order to investigate whether the peak amplitude ofthe auditory N1 is related to behavioral performance on the SJT, we conducted alinear regression analysis between its peak amplitude and the number of syn-chronous perceptions at two AV SOAs with the largest inter-individual variability —
AV200 and AV300.
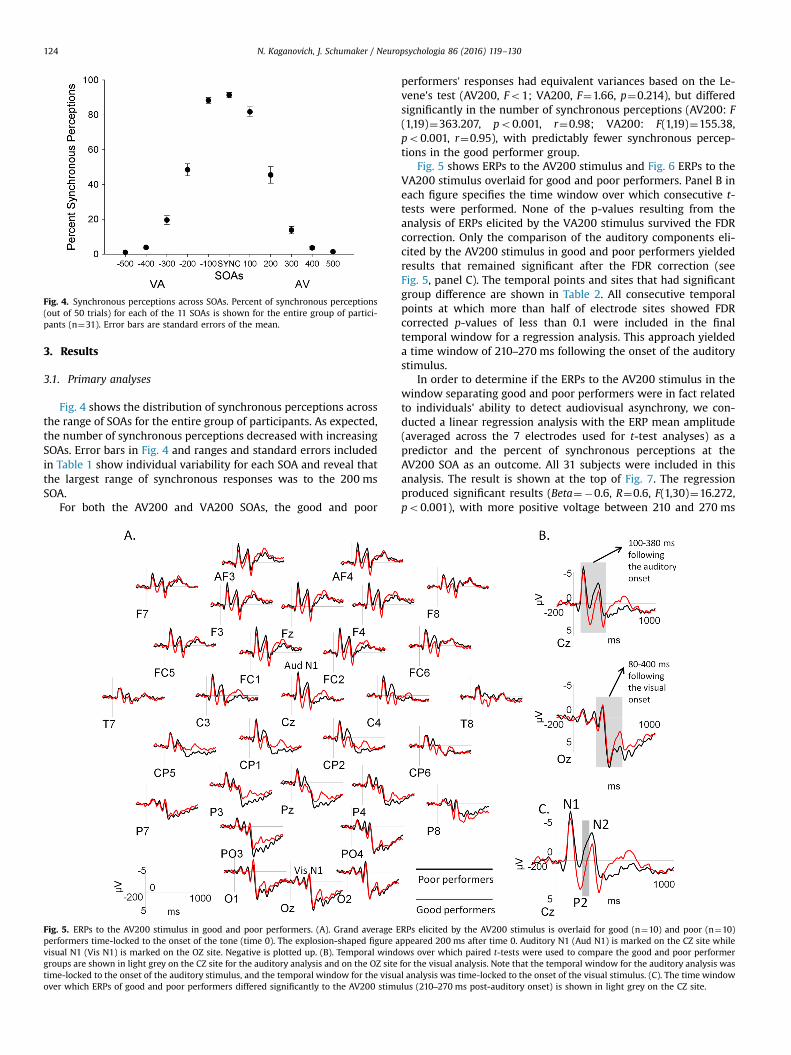
Fig. 4. Synchronous perceptions across SOAs. Percent of synchronous perceptions(out of 50 trials) for each of the 11 SOAs is shown for the entire group of partici-pants (n¼31). Error bars are standard errors of the mean.
N. Kaganovich, J. Schumaker / Neuropsychologia 86 (2016) 119–130124
3. Results
3.1. Primary analyses
Fig. 4 shows the distribution of synchronous perceptions acrossthe range of SOAs for the entire group of participants. As expected,the number of synchronous perceptions decreased with increasingSOAs. Error bars in Fig. 4 and ranges and standard errors includedin Table 1 show individual variability for each SOA and reveal thatthe largest range of synchronous responses was to the 200 msSOA.
For both the AV200 and VA200 SOAs, the good and poor
Fig. 5. ERPs to the AV200 stimulus in good and poor performers. (A). Grand average Eperformers time-locked to the onset of the tone (time 0). The explosion-shaped figure avisual N1 (Vis N1) is marked on the OZ site. Negative is plotted up. (B). Temporal windgroups are shown in light grey on the CZ site for the auditory analysis and on the OZ sitetime-locked to the onset of the auditory stimulus, and the temporal window for the visuaover which ERPs of good and poor performers differed significantly to the AV200 stimu
performers’ responses had equivalent variances based on the Le-vene's test (AV200, Fo1; VA200, F¼1.66, p¼0.214), but differedsignificantly in the number of synchronous perceptions (AV200: F(1,19)¼363.207, po0.001, r¼0.98; VA200: F(1,19)¼155.38,po0.001, r¼0.95), with predictably fewer synchronous percep-tions in the good performer group.
Fig. 5 shows ERPs to the AV200 stimulus and Fig. 6 ERPs to theVA200 stimulus overlaid for good and poor performers. Panel B ineach figure specifies the time window over which consecutive t-tests were performed. None of the p-values resulting from theanalysis of ERPs elicited by the VA200 stimulus survived the FDRcorrection. Only the comparison of the auditory components eli-cited by the AV200 stimulus in good and poor performers yieldedresults that remained significant after the FDR correction (seeFig. 5, panel C). The temporal points and sites that had significantgroup difference are shown in Table 2. All consecutive temporalpoints at which more than half of electrode sites showed FDRcorrected p-values of less than 0.1 were included in the finaltemporal window for a regression analysis. This approach yieldeda time window of 210–270 ms following the onset of the auditorystimulus.
In order to determine if the ERPs to the AV200 stimulus in thewindow separating good and poor performers were in fact relatedto individuals' ability to detect audiovisual asynchrony, we con-ducted a linear regression analysis with the ERP mean amplitude(averaged across the 7 electrodes used for t-test analyses) as apredictor and the percent of synchronous perceptions at theAV200 SOA as an outcome. All 31 subjects were included in thisanalysis. The result is shown at the top of Fig. 7. The regressionproduced significant results (Beta¼�0.6, R¼0.6, F(1,30)¼16.272,po0.001), with more positive voltage between 210 and 270 ms
RPs elicited by the AV200 stimulus is overlaid for good (n¼10) and poor (n¼10)ppeared 200 ms after time 0. Auditory N1 (Aud N1) is marked on the CZ site whileows over which paired t-tests were used to compare the good and poor performerfor the visual analysis. Note that the temporal window for the auditory analysis wasl analysis was time-locked to the onset of the visual stimulus. (C). The time windowlus (210–270 ms post-auditory onset) is shown in light grey on the CZ site.
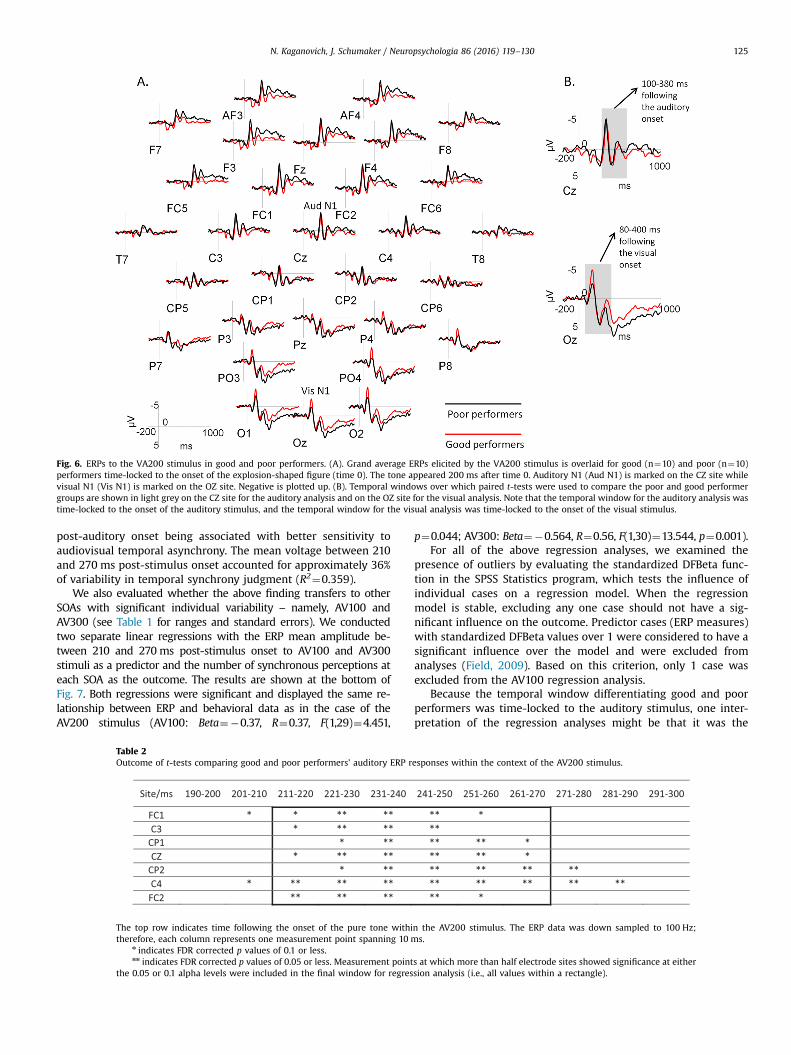
Fig. 6. ERPs to the VA200 stimulus in good and poor performers. (A). Grand average ERPs elicited by the VA200 stimulus is overlaid for good (n¼10) and poor (n¼10)performers time-locked to the onset of the explosion-shaped figure (time 0). The tone appeared 200 ms after time 0. Auditory N1 (Aud N1) is marked on the CZ site whilevisual N1 (Vis N1) is marked on the OZ site. Negative is plotted up. (B). Temporal windows over which paired t-tests were used to compare the poor and good performergroups are shown in light grey on the CZ site for the auditory analysis and on the OZ site for the visual analysis. Note that the temporal window for the auditory analysis wastime-locked to the onset of the auditory stimulus, and the temporal window for the visual analysis was time-locked to the onset of the visual stimulus.
N. Kaganovich, J. Schumaker / Neuropsychologia 86 (2016) 119–130 125
post-auditory onset being associated with better sensitivity toaudiovisual temporal asynchrony. The mean voltage between 210and 270 ms post-stimulus onset accounted for approximately 36%of variability in temporal synchrony judgment (R2¼0.359).
We also evaluated whether the above finding transfers to otherSOAs with significant individual variability – namely, AV100 andAV300 (see Table 1 for ranges and standard errors). We conductedtwo separate linear regressions with the ERP mean amplitude be-tween 210 and 270 ms post-stimulus onset to AV100 and AV300stimuli as a predictor and the number of synchronous perceptions ateach SOA as the outcome. The results are shown at the bottom ofFig. 7. Both regressions were significant and displayed the same re-lationship between ERP and behavioral data as in the case of theAV200 stimulus (AV100: Beta¼�0.37, R¼0.37, F(1,29)¼4.451,
Table 2Outcome of t-tests comparing good and poor performers' auditory ERP r
The top row indicates time following the onset of the pure tone withitherefore, each column represents one measurement point spanning 10 m
n indicates FDR corrected p values of 0.1 or less.nn indicates FDR corrected p values of 0.05 or less. Measurement point
the 0.05 or 0.1 alpha levels were included in the final window for regres
p¼0.044; AV300: Beta¼�0.564, R¼0.56, F(1,30)¼13.544, p¼0.001).For all of the above regression analyses, we examined the
presence of outliers by evaluating the standardized DFBeta func-tion in the SPSS Statistics program, which tests the influence ofindividual cases on a regression model. When the regressionmodel is stable, excluding any one case should not have a sig-nificant influence on the outcome. Predictor cases (ERP measures)with standardized DFBeta values over 1 were considered to have asignificant influence over the model and were excluded fromanalyses (Field, 2009). Based on this criterion, only 1 case wasexcluded from the AV100 regression analysis.
Because the temporal window differentiating good and poorperformers was time-locked to the auditory stimulus, one inter-pretation of the regression analyses might be that it was the
esponses within the context of the AV200 stimulus.
n the AV200 stimulus. The ERP data was down sampled to 100 Hz;s.
s at which more than half electrode sites showed significance at eithersion analysis (i.e., all values within a rectangle).
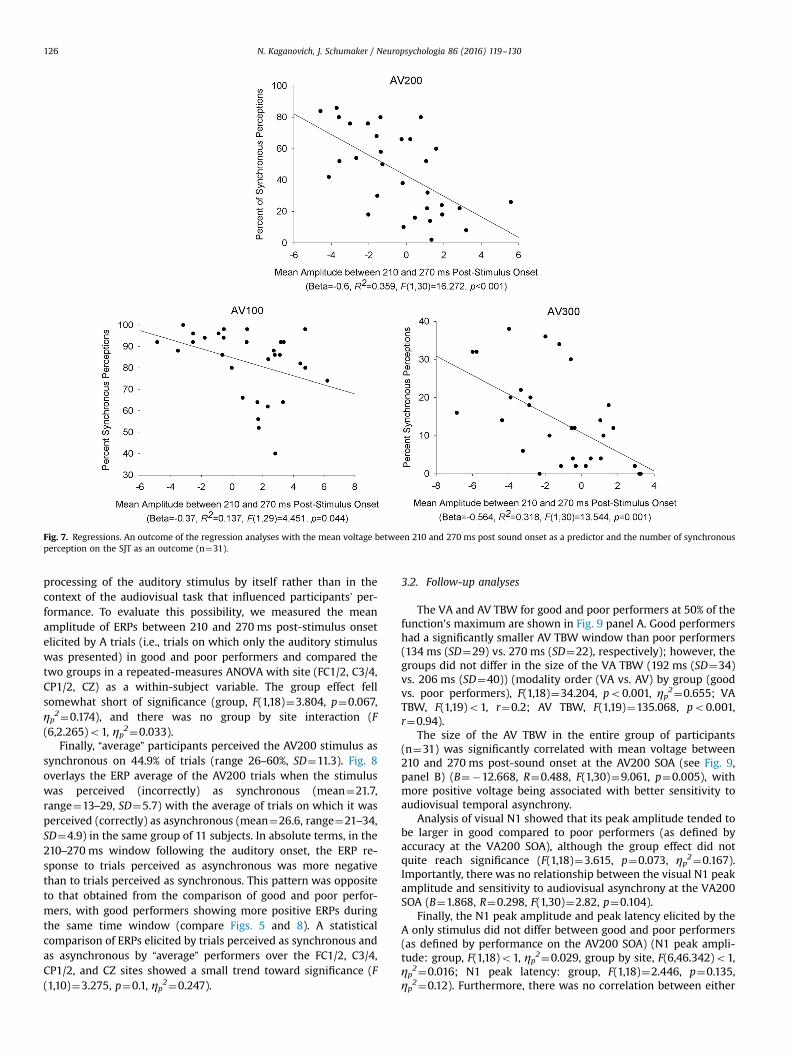
Fig. 7. Regressions. An outcome of the regression analyses with the mean voltage between 210 and 270 ms post sound onset as a predictor and the number of synchronousperception on the SJT as an outcome (n¼31).
N. Kaganovich, J. Schumaker / Neuropsychologia 86 (2016) 119–130126
processing of the auditory stimulus by itself rather than in thecontext of the audiovisual task that influenced participants’ per-formance. To evaluate this possibility, we measured the meanamplitude of ERPs between 210 and 270 ms post-stimulus onsetelicited by A trials (i.e., trials on which only the auditory stimuluswas presented) in good and poor performers and compared thetwo groups in a repeated-measures ANOVA with site (FC1/2, C3/4,CP1/2, CZ) as a within-subject variable. The group effect fellsomewhat short of significance (group, F(1,18)¼3.804, p¼0.067,ηp2¼0.174), and there was no group by site interaction (F(6,2.265)o1, ηp2¼0.033).
Finally, “average” participants perceived the AV200 stimulus assynchronous on 44.9% of trials (range 26–60%, SD¼11.3). Fig. 8overlays the ERP average of the AV200 trials when the stimuluswas perceived (incorrectly) as synchronous (mean¼21.7,range¼13–29, SD¼5.7) with the average of trials on which it wasperceived (correctly) as asynchronous (mean¼26.6, range¼21–34,SD¼4.9) in the same group of 11 subjects. In absolute terms, in the210–270 ms window following the auditory onset, the ERP re-sponse to trials perceived as asynchronous was more negativethan to trials perceived as synchronous. This pattern was oppositeto that obtained from the comparison of good and poor perfor-mers, with good performers showing more positive ERPs duringthe same time window (compare Figs. 5 and 8). A statisticalcomparison of ERPs elicited by trials perceived as synchronous andas asynchronous by “average” performers over the FC1/2, C3/4,CP1/2, and CZ sites showed a small trend toward significance (F(1,10)¼3.275, p¼0.1, ηp2¼0.247).
3.2. Follow-up analyses
The VA and AV TBW for good and poor performers at 50% of thefunction's maximum are shown in Fig. 9 panel A. Good performershad a significantly smaller AV TBW window than poor performers(134 ms (SD¼29) vs. 270 ms (SD¼22), respectively); however, thegroups did not differ in the size of the VA TBW (192 ms (SD¼34)vs. 206 ms (SD¼40)) (modality order (VA vs. AV) by group (goodvs. poor performers), F(1,18)¼34.204, po0.001, ηp2¼0.655; VATBW, F(1,19)o1, r¼0.2; AV TBW, F(1,19)¼135.068, po0.001,r¼0.94).
The size of the AV TBW in the entire group of participants(n¼31) was significantly correlated with mean voltage between210 and 270 ms post-sound onset at the AV200 SOA (see Fig. 9,panel B) (B¼�12.668, R¼0.488, F(1,30)¼9.061, p¼0.005), withmore positive voltage being associated with better sensitivity toaudiovisual temporal asynchrony.
Analysis of visual N1 showed that its peak amplitude tended tobe larger in good compared to poor performers (as defined byaccuracy at the VA200 SOA), although the group effect did notquite reach significance (F(1,18)¼3.615, p¼0.073, ηp2¼0.167).Importantly, there was no relationship between the visual N1 peakamplitude and sensitivity to audiovisual asynchrony at the VA200SOA (B¼1.868, R¼0.298, F(1,30)¼2.82, p¼0.104).
Finally, the N1 peak amplitude and peak latency elicited by theA only stimulus did not differ between good and poor performers(as defined by performance on the AV200 SOA) (N1 peak ampli-tude: group, F(1,18)o1, ηp2¼0.029, group by site, F(6,46.342)o1,ηp2¼0.016; N1 peak latency: group, F(1,18)¼2.446, p¼0.135,ηp2¼0.12). Furthermore, there was no correlation between either
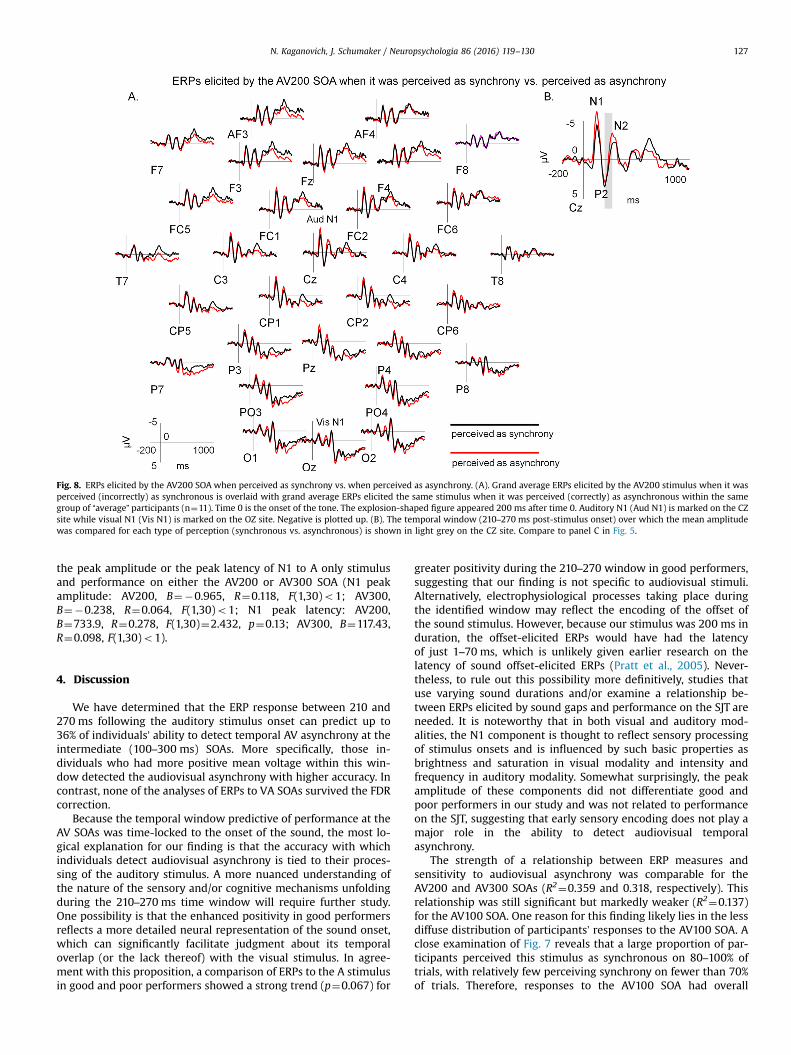
Fig. 8. ERPs elicited by the AV200 SOA when perceived as synchrony vs. when perceived as asynchrony. (A). Grand average ERPs elicited by the AV200 stimulus when it wasperceived (incorrectly) as synchronous is overlaid with grand average ERPs elicited the same stimulus when it was perceived (correctly) as asynchronous within the samegroup of “average” participants (n¼11). Time 0 is the onset of the tone. The explosion-shaped figure appeared 200 ms after time 0. Auditory N1 (Aud N1) is marked on the CZsite while visual N1 (Vis N1) is marked on the OZ site. Negative is plotted up. (B). The temporal window (210–270 ms post-stimulus onset) over which the mean amplitudewas compared for each type of perception (synchronous vs. asynchronous) is shown in light grey on the CZ site. Compare to panel C in Fig. 5.
N. Kaganovich, J. Schumaker / Neuropsychologia 86 (2016) 119–130 127
the peak amplitude or the peak latency of N1 to A only stimulusand performance on either the AV200 or AV300 SOA (N1 peakamplitude: AV200, B¼�0.965, R¼0.118, F(1,30)o1; AV300,B¼�0.238, R¼0.064, F(1,30)o1; N1 peak latency: AV200,B¼733.9, R¼0.278, F(1,30)¼2.432, p¼0.13; AV300, B¼117.43,R¼0.098, F(1,30)o1).
4. Discussion
We have determined that the ERP response between 210 and270 ms following the auditory stimulus onset can predict up to36% of individuals’ ability to detect temporal AV asynchrony at theintermediate (100–300 ms) SOAs. More specifically, those in-dividuals who had more positive mean voltage within this win-dow detected the audiovisual asynchrony with higher accuracy. Incontrast, none of the analyses of ERPs to VA SOAs survived the FDRcorrection.
Because the temporal window predictive of performance at theAV SOAs was time-locked to the onset of the sound, the most lo-gical explanation for our finding is that the accuracy with whichindividuals detect audiovisual asynchrony is tied to their proces-sing of the auditory stimulus. A more nuanced understanding ofthe nature of the sensory and/or cognitive mechanisms unfoldingduring the 210–270 ms time window will require further study.One possibility is that the enhanced positivity in good performersreflects a more detailed neural representation of the sound onset,which can significantly facilitate judgment about its temporaloverlap (or the lack thereof) with the visual stimulus. In agree-ment with this proposition, a comparison of ERPs to the A stimulusin good and poor performers showed a strong trend (p¼0.067) for
greater positivity during the 210–270 window in good performers,suggesting that our finding is not specific to audiovisual stimuli.Alternatively, electrophysiological processes taking place duringthe identified window may reflect the encoding of the offset ofthe sound stimulus. However, because our stimulus was 200 ms induration, the offset-elicited ERPs would have had the latencyof just 1–70 ms, which is unlikely given earlier research on thelatency of sound offset-elicited ERPs (Pratt et al., 2005). Never-theless, to rule out this possibility more definitively, studies thatuse varying sound durations and/or examine a relationship be-tween ERPs elicited by sound gaps and performance on the SJT areneeded. It is noteworthy that in both visual and auditory mod-alities, the N1 component is thought to reflect sensory processingof stimulus onsets and is influenced by such basic properties asbrightness and saturation in visual modality and intensity andfrequency in auditory modality. Somewhat surprisingly, the peakamplitude of these components did not differentiate good andpoor performers in our study and was not related to performanceon the SJT, suggesting that early sensory encoding does not play amajor role in the ability to detect audiovisual temporalasynchrony.
The strength of a relationship between ERP measures andsensitivity to audiovisual asynchrony was comparable for theAV200 and AV300 SOAs (R2¼0.359 and 0.318, respectively). Thisrelationship was still significant but markedly weaker (R2¼0.137)for the AV100 SOA. One reason for this finding likely lies in the lessdiffuse distribution of participants’ responses to the AV100 SOA. Aclose examination of Fig. 7 reveals that a large proportion of par-ticipants perceived this stimulus as synchronous on 80–100% oftrials, with relatively few perceiving synchrony on fewer than 70%of trials. Therefore, responses to the AV100 SOA had overall
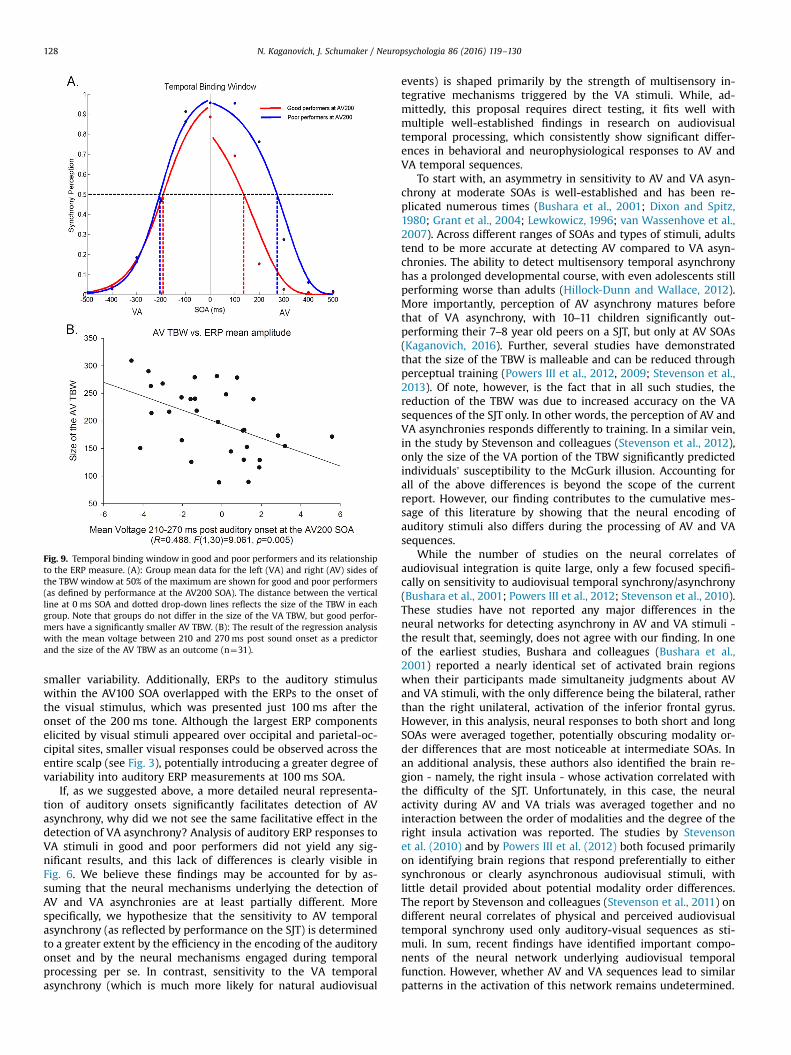
Fig. 9. Temporal binding window in good and poor performers and its relationshipto the ERP measure. (A): Group mean data for the left (VA) and right (AV) sides ofthe TBW window at 50% of the maximum are shown for good and poor performers(as defined by performance at the AV200 SOA). The distance between the verticalline at 0 ms SOA and dotted drop-down lines reflects the size of the TBW in eachgroup. Note that groups do not differ in the size of the VA TBW, but good perfor-mers have a significantly smaller AV TBW. (B): The result of the regression analysiswith the mean voltage between 210 and 270 ms post sound onset as a predictorand the size of the AV TBW as an outcome (n¼31).
N. Kaganovich, J. Schumaker / Neuropsychologia 86 (2016) 119–130128
smaller variability. Additionally, ERPs to the auditory stimuluswithin the AV100 SOA overlapped with the ERPs to the onset ofthe visual stimulus, which was presented just 100 ms after theonset of the 200 ms tone. Although the largest ERP componentselicited by visual stimuli appeared over occipital and parietal-oc-cipital sites, smaller visual responses could be observed across theentire scalp (see Fig. 3), potentially introducing a greater degree ofvariability into auditory ERP measurements at 100 ms SOA.
If, as we suggested above, a more detailed neural representa-tion of auditory onsets significantly facilitates detection of AVasynchrony, why did we not see the same facilitative effect in thedetection of VA asynchrony? Analysis of auditory ERP responses toVA stimuli in good and poor performers did not yield any sig-nificant results, and this lack of differences is clearly visible inFig. 6. We believe these findings may be accounted for by as-suming that the neural mechanisms underlying the detection ofAV and VA asynchronies are at least partially different. Morespecifically, we hypothesize that the sensitivity to AV temporalasynchrony (as reflected by performance on the SJT) is determinedto a greater extent by the efficiency in the encoding of the auditoryonset and by the neural mechanisms engaged during temporalprocessing per se. In contrast, sensitivity to the VA temporalasynchrony (which is much more likely for natural audiovisual
events) is shaped primarily by the strength of multisensory in-tegrative mechanisms triggered by the VA stimuli. While, ad-mittedly, this proposal requires direct testing, it fits well withmultiple well-established findings in research on audiovisualtemporal processing, which consistently show significant differ-ences in behavioral and neurophysiological responses to AV andVA temporal sequences.
To start with, an asymmetry in sensitivity to AV and VA asyn-chrony at moderate SOAs is well-established and has been re-plicated numerous times (Bushara et al., 2001; Dixon and Spitz,1980; Grant et al., 2004; Lewkowicz, 1996; van Wassenhove et al.,2007). Across different ranges of SOAs and types of stimuli, adultstend to be more accurate at detecting AV compared to VA asyn-chronies. The ability to detect multisensory temporal asynchronyhas a prolonged developmental course, with even adolescents stillperforming worse than adults (Hillock-Dunn and Wallace, 2012).More importantly, perception of AV asynchrony matures beforethat of VA asynchrony, with 10–11 children significantly out-performing their 7–8 year old peers on a SJT, but only at AV SOAs(Kaganovich, 2016). Further, several studies have demonstratedthat the size of the TBW is malleable and can be reduced throughperceptual training (Powers III et al., 2012, 2009; Stevenson et al.,2013). Of note, however, is the fact that in all such studies, thereduction of the TBW was due to increased accuracy on the VAsequences of the SJT only. In other words, the perception of AV andVA asynchronies responds differently to training. In a similar vein,in the study by Stevenson and colleagues (Stevenson et al., 2012),only the size of the VA portion of the TBW significantly predictedindividuals’ susceptibility to the McGurk illusion. Accounting forall of the above differences is beyond the scope of the currentreport. However, our finding contributes to the cumulative mes-sage of this literature by showing that the neural encoding ofauditory stimuli also differs during the processing of AV and VAsequences.
While the number of studies on the neural correlates ofaudiovisual integration is quite large, only a few focused specifi-cally on sensitivity to audiovisual temporal synchrony/asynchrony(Bushara et al., 2001; Powers III et al., 2012; Stevenson et al., 2010).These studies have not reported any major differences in theneural networks for detecting asynchrony in AV and VA stimuli -the result that, seemingly, does not agree with our finding. In oneof the earliest studies, Bushara and colleagues (Bushara et al.,2001) reported a nearly identical set of activated brain regionswhen their participants made simultaneity judgments about AVand VA stimuli, with the only difference being the bilateral, ratherthan the right unilateral, activation of the inferior frontal gyrus.However, in this analysis, neural responses to both short and longSOAs were averaged together, potentially obscuring modality or-der differences that are most noticeable at intermediate SOAs. Inan additional analysis, these authors also identified the brain re-gion - namely, the right insula - whose activation correlated withthe difficulty of the SJT. Unfortunately, in this case, the neuralactivity during AV and VA trials was averaged together and nointeraction between the order of modalities and the degree of theright insula activation was reported. The studies by Stevensonet al. (2010) and by Powers III et al. (2012) both focused primarilyon identifying brain regions that respond preferentially to eithersynchronous or clearly asynchronous audiovisual stimuli, withlittle detail provided about potential modality order differences.The report by Stevenson and colleagues (Stevenson et al., 2011) ondifferent neural correlates of physical and perceived audiovisualtemporal synchrony used only auditory-visual sequences as sti-muli. In sum, recent findings have identified important compo-nents of the neural network underlying audiovisual temporalfunction. However, whether AV and VA sequences lead to similarpatterns in the activation of this network remains undetermined.
N. Kaganovich, J. Schumaker / Neuropsychologia 86 (2016) 119–130 129
When evaluating ERPs elicited by AV200 and VA200 stimuli ingood and poor performers, we included all trials – the ones thatwere perceived as synchronous and the ones that were perceivedas asynchronous – in our averages. Since good performers hadmore trials on which they subjectively perceived asynchrony,could the ERP differences we found for the AV200 SOA reflect thesubjective perception of asynchrony rather than better encoding ofthe auditory stimulus as suggested above? A comparison of ERPsto the AV200 stimulus when it was perceived (incorrectly) assynchronous and when it was perceived (correctly) as asynchro-nous in the group of “average” performers helped us address thisissue. Although this analysis did not reach significance at the alphalevel of 0.05, its effect size was quite large (ηp2¼0.247). Becausethe perception-driven analysis was based on a relatively smallnumber of trials and included only 11 participants, it is likely thatit lacked sufficient power. Yet, its outcome is suggestive, especiallybecause it yielded a pattern of results that was opposite in polarityto that seen in the analyses based on overall performance. Morespecifically, while good performers at the AV200 SOA had morepositive voltage 210–270 ms post-auditory onset compared to poorperformers, the correct perception of asynchrony at the AV200SOA was associated with more negative voltage in the same win-dow (compare Figs. 5 and 8). This finding suggests that the ERPindices of efficient encoding of stimulus onsets within multi-sensory contexts may dissociate from the ERP indices of subjectiveperception of audiovisual asynchrony, perhaps in a manner similarto that reported by Stevenson and colleagues for fMRI measures(Stevenson et al., 2011). However, more studies that carefullymanipulate perception of audiovisual asynchrony across partici-pants are needed to make more definitive conclusions about dif-ferences or similarities in the ERP correlates of objective vs. sub-jective audiovisual temporal synchrony.
Lastly, as all studies, our report has its limitations. The auditorystimuli used in the current paradigm were pure tones with a shortrise and fall time. We know that sound complexity and its“speechness” can significantly affect both the amplitude and la-tency of auditory ERP components (e.g., Čeponienė et al., 2005). Animportant empirical question to address in future work is whetherthe time window identified in our study remains constant acrossdifferent auditory stimulus types. Additionally, because our stimuliwere 200 ms in duration, the amount of overlap between auditoryand visual modalities varied for different SOAs. At longer SOAs(300–500 ms), the processing of both the onset and the offset ofthe first stimulus in a pair might have been completed prior to theonset of the second stimulus, potentially facilitating decisionmaking at longer SOAs. Most of the earlier studies used sig-nificantly shorter stimuli in similar paradigms (5–10 ms) (e.g.,Grondin et al., 2007; Hillock-Dunn and Wallace, 2012). However,since many audiovisual events in real life last more than 10 ms, webelieve our results are informative. Nevertheless, replicating ourfindings with shorter stimuli would help rule out modalities’overlap as a contributing factor to audiovisual temporal sensitivity.
To conclude, we examined electrophysiological correlates ofindividual variability in sensitivity to audiovisual temporal asyn-chrony in a SJT. We reported that good and poor performers hadsignificantly different ERPs to the AV200 stimulus 210–270 msfollowing the sound onset, with greater positivity in good per-formers. Furthermore, the mean amplitude of voltage in thiswindow accounted for a significant amount of variability in per-formance not only at the AV200 SOA but also at the AV100 andAV300 SOAs in a larger group of participants. We suggested thatthe ability to detect temporal asynchrony in AV sequences de-pends, to a large extent, on the efficient encoding of auditoryonsets.
Acknowledgements
This research was supported in part by grants P30DC010745and R03DC013151 from the National Institute on Deafness andOther Communicative Disorders, National Institutes of Health. Thecontent is solely the responsibility of the author and does notnecessarily represent the official view of the National Institute onDeafness and Other Communicative Disorders or the National In-stitutes of Health. We are thankful to James Hengenius, KevinBarlow, Amanda Hampton Wray, Caryn Herring, Courtney Row-land, Jessica Huemmer, Kelly Sievert, and Casey Spelman for theirassistance with different stages of this project.
References
American Electroencephalographic Society,1994. Guideline Thirteen: Guidelines forStandard Electrode Placement Nomenclature. Retrieved From.
Baart, M., Stekelenburg, J.J., Vroomen, J., 2014. Electrophysiological evidence forspeech-specific audiovisual integration. Neuropsychologia 53, 115–121.
Benjamini, Y., Hochberg, Y., 1995. Controlling the false discovery rate: a practicaland powerful approach to multiple testing. J. R. Stat. Soc. Ser. B (Methodol.) 57,289–300.
Besle, J., Fort, A., Delpuech, C., Giard, M.-H., 2004. Bimodal speech: early suppres-sive visual effects in human auditory cortex. Eur. J. Neurosci. 20, 2225–2234.
BioSemi, 2013. Active Electrodes. Retrieved from ⟨http://www.biosemi.com/active_electrode.htm⟩.
Brown, L., Sherbenou, R.J., Johnsen, S.K., 2010. Test of Nonverbal Intelligence, 4th ed.Pro-Ed: An International Pubilsher, Austin, Texas.
Bushara, K.O., Grafman, J., Hallett, M., 2001. Neural correlates of auditory-visualstimulus onset asynchrony detection. J. Neurosci. 21 (1).
Čeponienė, R., Alku, P., Westerfield, M., Torki, M., Townsend, J., 2005. ERPs differ-entiate syllable and nonphonetic sound processing in children and adults.Psychophysiology 42, 391–406.
Conrey, B., Pisoni, D.B., 2006. Auditory-visual speech perception and synchronydetection for speech and non-speech signals. J. Acoust. Soc. Am. 119 (6),4065–4073. http://dx.doi.org/10.1121/1.2195091.
Dixon, N.F., Spitz, L., 1980. The detection of auditory visual desynchrony. Perception9, 719–721.
Donohue, S.E., Darling, E.F., Mitroff, S.R., 2012. Links between multisensory pro-cessing and autism. Exp. Brain Res. 222, 377–387.
Field, A., 2009. Discovering Statistics Using SPSS, 3 ed. Sage, Washington, DC.Foss-Feig, J.H., Kwakye, L.D., Cascio, C.J., Burnette, C.P., Kadivar, H., Stone, W.L.,
Wallace, M.T., 2010. An extended multisensory temporal binding window inautism spectrum disorders. Exp. Brain Res. 203, 381–389. http://dx.doi.org/10.1007/s00221-010-2240-4.
Grant, K.W., van Wassenhove, V., Poeppel, D., 2004. Detection of auditory (cross-spectral) and auditory-visual (cross-modal) synchrony. Speech Commun. 44,43–53.
Grondin, S., Dionne, G., Malenfant, N., Plourde, M., Cloutier, M., Jean, C., 2007.Temporal processing skills of children with and without specific language im-pairment. Can. J. Speech-Lang. Pathol. Audiol. 31 (1), 38–46.
Groppe, D.M., Urbach, T.P., Kutas, M., 2011. Mass univariate analysis of event-relatedbrain potentials/fields I: a critical tutorial review. Psychophysiology 48,1711–1725. http://dx.doi.org/10.1111/j.1469-8986.2011.01273.x.
Hairston, W.D., Burdette, J.H., Flowers, D.L., Wood, F.B., Wallace, M.T., 2005. Alteredtemporal profile of visual-auditory multisensory interactions in dyslexia. Exp.Brain Res. 166, 474–480. http://dx.doi.org/10.1007/s00221-005-2387-6.
Hillock-Dunn, A., Wallace, M.T., 2012. Developmental changes in the multisensorytemporal binding window persist into adolescence. Dev. Sci. 15 (5), 688–696.http://dx.doi.org/10.1111/j.1467-7687.2012.01171.x.
Kaganovich, N., 2016. Development of sensitivity to audiovisual temporal asyn-chrony during mid-childhood. Dev. Psychol. 52 (2), 232–241.
Kaganovich, N., Schumaker, J., 2014. Audiovisual integration for speech during mid-childhood: electrophysiological evidence. Brain Lang. 139, 36–48.
Kaganovich, N., Schumaker, J., Leonard, L.B., Gustafson, D., Macias, D., 2014. Chil-dren with a history of SLI show reduced sensitivity to audiovisual temporalasynchrony: an ERP study. J. Speech Lang. Hear. Res. 57, 1480–1502. http://dx.doi.org/10.1044/2014_JSLHR-L-13-0192.
Keetels, M., Vroomen, J., 2012. Perception of synchrony between the senses. In:Murray, M.M., Wallace, M.T. (Eds.), The Neural Bases of Multisensory Processes.CRC Press, New York, pp. 147–177.
Knowland, V.C.P., Mercure, E., Karmiloff-Smith, A., Dick, F., Thomas, M.S.C., 2014.Audio-visual speech perception: a developmental ERP investigation. Dev. Sci. 17(1), 110–124.
Kwakye, L.D., Foss-Feig, J.H., Cascio, C.J., Stone, W.L., Wallace, M.T., 2011. Alteredauditory and multisensory temporal processing in autism spectrum disorders.Front. Integr. Neurosci. 4 (129). http://dx.doi.org/10.3389/fnint.2010.00129.
Lewkowicz, D.J., 1996. Perception of auditory-visual temporal synchrony in humaninfants. J. Exp. Psychology: Hum. Percept. Perform. 22 (5), 1094–1106.
Luck, S.J., 2014. An Introduction to the Event-Related Potential Technique, second

N. Kaganovich, J. Schumaker / Neuropsychologia 86 (2016) 119–130130
ed. The MIT Press, Cambridge, MA.Macaluso, E., George, N., Dolan, R., Spence, C., Driver, J., 2004. Spatial and temporal
factors during processing of audiovisual speech: a PET study. NeuroImage 21,725–732.
Metting van Rijn, A.C., Kuiper, A.P., Dankers, T.E., Grimbergen, C.A., 1996. Low-costactive electrode improves the resolution in biopotential recordings. Paperpresented at the 18th Annual International Conference of the IEEE Engineeringin Medicine and Biology Society, Amsterdam, The Netherlands.
Metting van Rijn, A.C., Peper, A., Grimbergen, C.A., 1990. High-quality recording ofbioelectric events. Part 1: interference reduction, theory and practice. Med. Biol.Eng. Comput. 28, 389–397.
Petrini, K., Dahl, S., Rocchesso, D., Waadeland, C.H., Avanzini, D., Puce, A., Pollick, F.E., 2009. Multisensory integration of drumming actions: musical expertise af-fects perceived audiovisual asynchrony. Exp. Brain Res. 198, 339–352. http://dx.doi.org/10.1007/s00221-009-1817-2.
Pflieger, M.E., 2001. Theory of a spatial filter for removing ocular artifacts withpreservation of EEG. Paper presented at the EMSE Workshop, Princeton Uni-versity ⟨http://www.sourcesignal.com/SpFilt_Ocular_Artifact.pdf⟩.
Powers III, A.R., Hevey, M.A., Wallace, M.T., 2012. Neural correlates of multisensoryperceptual learning. J. Neurosci. 32 (18), 6263–6274.
Powers III, A.R., Hillock, A.R., Wallace, M.T., 2009. Perceptual training narrows thetemporal window of multisensory binding. J. Neurosci. 29 (39), 12265–12274.http://dx.doi.org/10.1523/JNEUROSCI.3501-09.2009.
Pratt, H., 2011. Sensory ERP components. In: Luck, S.J., Kappenman, E.S. (Eds.), TheOxford Handbook of Event-Related Potential Components. Oxford UniversityPress, Oxford, pp. 89–114.
Pratt, H., Bleich, N., Mittelman, N., 2005. The composite N1 component to gaps innoise. Clin. Neurophysiol. 116, 2648–2663.
Semel, E., Wiig, E.H., Secord, W.A., 2003. CELF4: Clinical Evaluation of LanguageFundamentals, 4th ed. Pearson Clinical Assessment, San Antonio, TX.
Stein, B.E., Meredith, M.A., 1993. The Merging of the Senses. The MIT Press, Cam-bridge, Massachusetts.
Stekelenburg, J.J., Vroomen, J., 2007. Neural correlates of multisensory integrationof ecologically valid audiovisual events. J. Cognit. Neurosci. 19 (12), 1964–1973.
Stevenson, R.A., Altieri, N., Kim, S., Pisoni, D.B., James, T.W., 2010. Neural processingof asynchronous audiovisual speech perception. NeuroImage 49, 3308–3318.
Stevenson, R.A., Siemann, J.K., Schneider, B.C., Eberly, H.E., Woynaroski, T.G., Ca-marata, S.M., Wallace, M.T., 2014. Multisensory temporal integration in autismspectrum disorders. J. Neurosci. 34 (3), 691–697. http://dx.doi.org/10.1523/JNEUROSCI.3615-13.2014.
Stevenson, R.A., VanDerKlok, R.M., Pisoni, D.B., James, T.W., 2011. Discrete neuralsubstrates underlie complementary audivoisual speech integration processes.NeuroImage 55, 1339–1345.
Stevenson, R.A., Wallace, M.T., 2013. Multisensory temporal integration: task andstimulus dependencies. Exp. Brain Res. 227, 249–261. http://dx.doi.org/10.1007/s00221-013-3507-3.
Stevenson, R.A., Wilson, M.M., Powers, A.R., Wallace, M.T., 2013. The effects of visualtraining on multisensory temporal processing. Exp. Brain Res. 225, 479–489.http://dx.doi.org/10.1007/s00221-012-3387-y.
Stevenson, R.A., Zemtsov, R.K., Wallace, M.T., 2012. Individual differences in themultisensory temporal binding window predict susceptibility to audiovisualillusions. J. Exp. Psychology: Hum. Percept. Perform. 38 (6), 1517–1529. http://dx.doi.org/10.1037/a0027339.
van Eijk, R., Kohlrausch, A., Juola, J., van de Par, S., 2008. Audiovisual synchrony andtemporal order judgments: effects of experimental method and stimulus type.Percept. Psychophys. 70 (6), 955–968. http://dx.doi.org/10.3758/PP.70.6.955.
van Wassenhove, V., Grant, K.W., Poeppel, D., 2005. Visual speech speeds up theneural processing of auditory speech. Proc. Natl. Acad. Sci. 102 (4), 1181–1186.
van Wassenhove, V., Grant, K.W., Poeppel, D., 2007. Temporal window of integra-tion in auditory-visual speech perception. Neuropsychologia 45, 598–607.
Vatakis, A., Spence, C., 2010. Audiovisual temporal integration for complex speech,object-ation, animal call, and musical stimuli. In: Naumer, M.J., Kaiser, J. (Eds.),Multisensory Object Perception in the Primate Brain. Springer, New York.
Vroomen, J., Keetels, M., 2010. Perception of intersensory synchrony: a tutorialreview. Atten. Percept. Psychophys. 72 (4), 871–884. http://dx.doi.org/10.3758/APP.72.4.871.
Vroomen, J., Stekelenburg, J.J., 2011. Perception of intersensory synchrony inaudiovisual speech: not that special. Cognition 118 (1), 75–83. http://dx.doi.org/10.1016/j.cognition.2010.10.002.
Wallace, M.T., Stevenson, R.A., 2014. The construct of the multisensory temporalbinding window and its dysregulation in developmental disabilities. Neu-ropsychologia 64, 105–123.