electronic supplementary informationhydrolysis curve was subtracted off from the corresponding...
TRANSCRIPT
i
Electronic supplementary information
for the paper entitled
Fluorescence solvatochromism and modulated anticholinergic activity of novel
coumarin compounds sequestered in human serum albumin nanocavities
Mostofa Ataur Rohman, Prayasee Baruah, Deboshika Bhattacharjee, B. Myrboh, and
Sivaprasad Mitra*
Centre for Advanced Studies in Chemistry, North-Eastern Hill University, Shillong – 793 022,
India
to be published in
New Journal of Chemistry (2019)
Electronic Supplementary Material (ESI) for New Journal of Chemistry.This journal is © The Royal Society of Chemistry and the Centre National de la Recherche Scientifique 2019

ii
Contents
Sr. No. Item Item description Page No.
01 Table 1S List of solvents used in the present study along with the
characteristic parameters listed in terms of different scales
iii
02 ST1 Estimation of anticholinergic activity of the investigated
systems
iv-vi
03 Fig. 1S Steady state absorption spectra of MHC (a) and MHCB (b) in
different solvents. Solvent abbreviations: 1,4-dioxane (DIO),
ethyl acetate (EAC), dimethyl sulfoxide (DMSO), acetonitrile
(ACN), methyl alcohol (MeOH)
vii
04 Fig. 2S Time-resolved fluorescence decay traces of MHC (a) and
MHCB (b) in some selected solvents collected by exciting the
sample with 295 nm LED. The emission was monitored at the
maximum of the respective fluorescence emission spectrum
viii
05 Table 2S Time-resolved decay parameters for MHC in different
solvents. The values of reduced chi-square (χR2) and Durbin-
Watson parameter (DW) for each decay fitting are also listed
ix
06 Fig. 3S Modulation in MHC emission spectral behavior in
DMSO/Methanol (a) and acetonitrile/water (b) mixtures. Inset
shows then variation in fluorescence intensity at 385 and 404
nm in (a) and (b), respectively. Time-resolved fluorescence
decay traces of MHC (c) and MHCB (d) with varying water
content in DMSO/water mixtures
x
07 Table 3S Time-resolved decay parameters for MHC and MHCB in
DMSO-water (variant) binary mixtures
xi
08 Table 4S Estimated KT parameters for solvatochromism of MHC and
MHCB
xii
09 Table 5S Estimated Catalán parameters for solvatochromism of MHC
and MHCB
xiii
10 Table 6S Time-resolved fluorescence decay parameters of MHC and
MHCB with increasing concentration of β-cyclodextrin (β-
CDx)
xiv
11 Fig. 4S Fluorescence quenching of HSA in presence of MHC (a) and
MHCB (b) at some representative temperatures
xv
12 Fig. 5S Double log plots of MHC with HSA at some representative
temperatures.
xvi

iii
Table 1S: List of solvents used in the present study along with the characteristic parameters
listed in terms of different scales.
No Solvent Δf(ε,n)a ET(30)b c c c SAd SBd SdPd SPd
1 Cyclohexane 0.00 49.7 0.00 0.00 0.00 0.000 0.073 0.000 0.683
2 Toluene 0.02 33.9 0.00 0.11 0.54 0.000 0.128 0.284 0.782
3 1,4-dioxane 0.03 36.0 0.00 0.37 0.55 0.000 0.444 0.312 0.737
4 Acetonitrile 0.3 45.6 0.19 0.40 0.75 0.044 0.286 0.974 0.645
5 Methanol 0.31 55.4 0.98 0.66 0.60 0.044 0.286 0.974 0.645
6 Tetrahydrofuran 0.21 37.4 0.00 0.55 0.58 0.000 0.590 0.634 0.714
7 Dimethyl sulfoxide 0.26 45.1 0.00 0.76 0.10 0.072 0.647 1.000 0.830
8 Water 0.32 63.1 1.17 0.47 1.09 1.062 0.025 0.997 0.681
9 Ethyl acetate 0.19 38.1 0.00 0.45 0.55 0.000 0.542 0.603 0.656
10 n-Butanol 0.26 49.7 0.84 0.84 0.47 0.341 0.809 0.655 0.674
aPolarity parameter (=(ε - 1)/(2ε + 1) - (n2 - 1)/(2n2 + 1)), where the solvent dielectric constant and refractive
indices are represented by ε and n, respectively. bReichardt solvent parameter. cKamlet-Taft solvent
parameters; d Catalán solvent parameter

iv
ST1: Estimation of anticholinergic activity of the investigated systems.
Both the investigated systems act as acetylcholinesterase (AChE) inhibitor, modelled on
the cholinergic hypothesis of Alzheimer’s disease (AD). This hypothesis states that decline in
levels of acetylcholine (ACh) in the brain, whose breakdown is the primary function of the
enzyme AChE, is the principal reason for the cause and progression of AD [1]. Therefore,
cholinesterase inhibitors impede the activity of AChE and consequently results in an increase in
ACh levels in forebrain regions, thus facilitating neurotransmission. Hence, AChE inhibitors
have been utilized as therapeutic avenues for AD.
Scheme ST1: Mechanistic representation of normal and inhibited enzymatic activity of
AChE.
Modified version of Ellman method [2] was used for assaying the activity of AChE in
phosphate buffer of pH = 8.0 (0.1 M) at 298 K and its kinetic characterization [3,4]. The basis of
the enzyme kinetics data interpretation is shown in Scheme ST1. Data analysis and evaluation of
the kinetic parameters was done using the Microcal Origin 2017 software. The non-enzymatic
hydrolysis curve was subtracted off from the corresponding enzymatic hydrolysis curve in each
case and the initial linear portion of the progress curve was considered for calculating the initial
velocity (ν0) of the reaction (Eq. ST1).

v
ν0 (moles l-1 s-1) = Slope (absorbance s−1)
є× l (ST1)
Here ε represents the absorption coefficient of the yellow anion, l is the path length (= 0.442 cm).
Non-linear regression analysis of (ν0) against [S0] gave the values of the Michaelis-
Menten (MM) constant, Km and maximum hydrolysis rate, Vmax in the normal and enzyme
inhibition cases using Eq. ST2a and ST2b, respectively.
ν0 = Vmax[S0 ]
Km+ [S0] (ST2a)
ν0 = Vmax′[S0 ]
Km′ + [S0]
(ST2b)
Here, Vmax'= 𝑉𝑚𝑎𝑥
𝛼′, Km' =
𝛼
𝛼′ × Km, or, Km' = α ×Km (representing only inhibition path A);
α = 1 + [𝐸𝐼]
[𝐸] and α' = 1+
[𝐼𝐸𝑆]
[𝐸𝑆] (representing both paths A and B).
The characteristic IC50 parameter for inhibition in both the media were obtained from the
modified Hill relation (Eq. ST3).
∆𝑉
∆𝑉𝑚𝑎𝑥=
[𝐼]𝑛𝐻
𝐾0.5𝑛𝐻+[𝐼]𝑛𝐻
(ST3)
Here ∆V is the initial rate decrease observed in presence of a definite concentration of inhibitor
[I], ∆Vmax represents maximal initial velocity decrease, K0.5, which is pharmacologically
equivalent to IC50, i.e., the inhibitor concentration to induce half-maximal change in the initial
velocity. The term nH represents the Hill coefficient.

vi
References:
1. P. T. Francis, A. M. Palmer, M. Snape, G. K. Wilcock, J. Neurol. Neurosurg. Psychiatry
1999, 66, 137–147.
2. G. L. Ellman, K. D. Courtney, V. Andres, R. M. Featherstone,Biochem. Pharmacol.
1961,7, 88–95.
3. M. M. Islam, A. B. Gurung, A. Bhatacharjee, K. Aguan, S. Mitra, Chem.
Biol. Interact.2016, 249, 1 – 9
4. P. Baruah, G. Basumatary, S. O. Yesylevskyy, K. Aguan, G. Bez, S. Mitra, J. Biomol
Struct Dyn. 2019, 37, 1750 - 1765.

vii
Fig. 1S: Steady state absorption spectra of MHC (a) and MHCB (b) in different solvents. Solvent
abbreviations: 1,4-dioxane (DIO), ethyl acetate (EAC), dimethyl sulfoxide (DMSO), acetonitrile
(ACN), methyl alcohol (MeOH).

viii
Fig. 2S: Time-resolved fluorescence decay traces of MHC (a) and MHCB (b) in some selected
solvents collected by exciting the sample with 295 nm LED. The emission was monitored at the
maximum of the respective fluorescence emission spectrum.

ix
Table 2S: Time-resolved decay parameters for MHC in different solvents. The values of reduced
chi-square (χR2) and Durbin-Watson parameter (DW) for each decay fitting are also listed.
Solvent a1 (%) τ1 / ns a2 (%) τ2 / ns a3 (%) τ3 / ns χR2 DW
For MHC
Cyclohexane 64.15 1.83 25.17 5.49 10.68 16.11 1.24 2.22
Toluene 49.73 0.97 26.99 4.439 23.27 12.43 1.07 2.30
1,4-dioxane 100 0.39 - - - - 1.13 2.31
Acetonitrile 74.13 0.94 25.87 3.449 - - 1.33 2.36
Methanol 79.64 0.904 20.36 3.85 - - 1.14 2.88
Tetrahydrofuran 100 0.64 - - - - 1.17 2.31
DMSO 93.43 0.54 6.57 3.23 - - 1.17 2.01
Water 100 0.84 - - - - 1.86 1.51
Ethyl acetate 100 0.51 - - - - 1.05 1.86
n-Butanol 83.32 0.664 16.68 4.213 - - 1.08 2.01
For MHCB
Cyclohexane 74.48 2.61 25.16 13.50 - - 1.17 2.00
Toluene 70.33 1.19 29.67 9.60 - - 1.16 2.01
1,4-dioxane 100 0.72 - - - - 1.09 1.51
Acetonitrile 100 0.51 - - - - 1.02 1.59
Methanol 100 1.34 - - - - 1.06 1.83
Tetrahydrofuran 100 1.19 - - - - 1.03 1.82
DMSO 100 0.57 - - - - 1.01 1.87
Water 100 0.47 - - - - 1.28 2.27
Ethyl acetate 100 0.91 - - - - 1.07 1.98
n-Butanol 100 0.62 - - - - 1.27 2.13
x
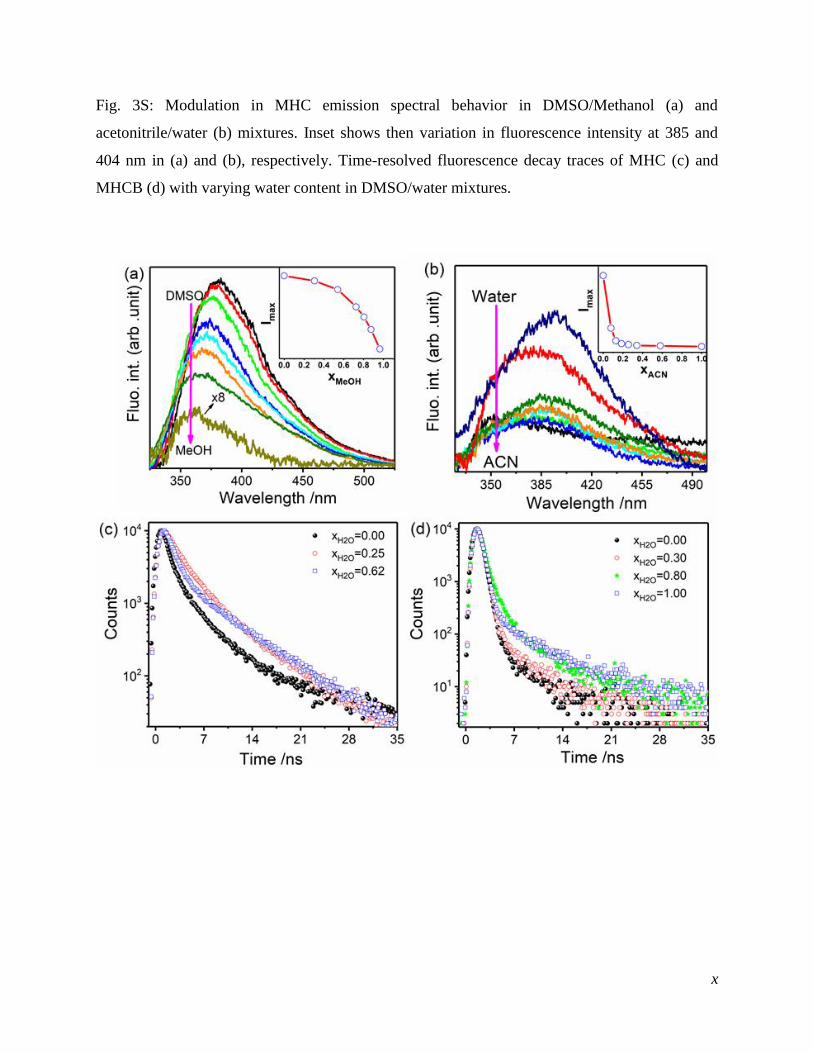
Fig. 3S: Modulation in MHC emission spectral behavior in DMSO/Methanol (a) and
acetonitrile/water (b) mixtures. Inset shows then variation in fluorescence intensity at 385 and
404 nm in (a) and (b), respectively. Time-resolved fluorescence decay traces of MHC (c) and
MHCB (d) with varying water content in DMSO/water mixtures.

xi
Table 3S: Time-resolved decay parameters for MHC and MHCB in DMSO-water (variant)
binary mixtures.
Sl. No xwater a1 (%) τ1 /
ns
a2 (%) τ2 /
ns
av
/ns
χR2 DW
MHC
1 0 93.43 0.5 6.57 3.2 1.34 1.17 2.01
2 0.17 71.40 1.1 28.60 3.7 2.59 1.19 2.65
3 0.35 65.52 1.4 34.48 4.0 2.94 1.27 2.67
4 0.57 82.06 2.3 17.94 6.7 4.02 1.21 2.22
5 0.80 80.76 1.8 19.24 6.9 4.22 1.28 1.89
6 0.87 82.95 1.3 17.05 6.9 4.18 1.05 1.71
7 0.92 82.70 1.0 17.30 6.6 4.32 1.10 2.24
8 0.98 81.06 0.8 18.94 5.9 4.10 1.00 1.69
9 1.00 100 0.84 - - 1.50 1.86 1.51
MHCB: Emission monitored at 385 nm
1 0 87.74 0.87 12.25 4.77 9.69 1.17 2.15
2 0.17 83.53 0.89 16.46 4.85 10.94 1.15 2.0
3 0.30 75.55 0.89 24.45 4.50 8.91 1.2 2.01
4 0.57 58.07 1.39 41.92 4.09 7.23 1.16 2.27
5 0.80 85.53 0.83 14.47 2.03 1.82 1.14 2.41
6 0.92 99.67 0.50 0.33 6.43 0.74 1.29 2.21
7 1.00 99.91 0.40 0.09 6.09 0.48 1.04 3.2
MHCB: Emission monitored at 485 nm
1 0 100 0.57 - - 0.57 1.25 2.04
2 0.17 99.76 0.45 0.24 5.16 0.57 1.09 2.19
3 0.30 99.66 0.46 0.34 5.16 0.63 1.01 2.00
4 0.57 98.87 0.45 1.13 4.19 0.81 1.06 2.89
5 0.80 98.9 0.77 1.09 4.98 1.05 1.34 1.71
6 0.92 99.14 0.64 0.86 7.45 1.26 1.07 2.18
7 1.00 100 0.47 - - 0.47 1.32 2.62

xii
Table 4S: Estimated KT parameters for solvatochromism of MHC and MHCB.a
Sl.No P0 a b S % of a % of b % of s
For MHC
νabs 34838.59 605.96 -1084.73 -1651.04 18.13 -32.46 -49.41
νem 29316.24 -116.07 -1645.61 -1870.91 -3.19 -45.30 -51.51
ΔνSS 5522.35 722.02 560.88 219.86 48.05 37.32 14.63
ϕf 0.01 0.02 -0.03 0.02 35.29 -41.22 23.49
τav 9.84 5.49 -3.80 -9.19 29.71 -20.57 -49.72
r 6.83×10⁻⁴ 4.00×10⁻³ -0.014 0.028 8.52 -30.15 61.33
nr 0.13 -0.66 0.17 0.95 -36.85 9.73 53.41
For MHCB
νabs 30627.30 1086.02 -1597.94 -395.64 35.26 -51.88 -12.85
νem 17471.22 447.48 2086.46 4441.31 6.42 29.91 63.67
ΔνSS 13156.08 638.55 -3684.41 -4836.94 6.97 -40.22 -52.80
ϕf 5.15×10⁻⁴ -8.36×10⁻⁴ 0.002 2.99×10⁻⁶ -31.68 68.21 0.11
τav 10.18 3.09 -11.55 -6.48 14.67 -54.67 -30.65
r 1.83×10⁻⁴ -1.41×10⁻³ 3.81×10⁻³ -2.72×10⁻⁴ -25.67 69.37 -4.95
nr -0.06018 -0.65349 1.95756 0.81 -19.09 57.18 23.73 a Absorption/emission maxima (denoted by abs and em, respectively) and Stokes-shift (SS) are
expressed in cm-1; average lifetime (av) in ns; radiative (r) and total non-radiative (nr) decay
rate constants are in ns-1.

xiii
Table 5S: Estimated Catalán parameters for solvatochromism of MHC and MHCB.a
Sl.No P0 SA SB SdP SP % of SA % of
SB
% of
Sdp
% of SP
For MHC
νabs 283.09 0.01 -0.13 7.36 13.22 0.06 -0.65 35.49 63.80
νem 276.11 32.43 -4.22 23.01 98.52 20.50 -2.67 14.55 62.28
ΔνSS 1315.62 2216.09 -210.72 893.65 5632.9 24.75 -2.35 9.98 62.91
ϕf -0.01 0.06 -0.02 -0.009 0.04 46.35 -12.97 -6.98 33.70
τav 13.99 1.34 3.36 -5.049 -10.25 6.69 16.82 -25.24 -51.24
r -0.02 0.04 -0.004 -0.01 0.05 35.92 -4.56 -12.17 47.34
nr -0.51 0.33 0.35 -0.57 1.69 11.23 11.89 -19.51 57.37
For MHCB
νabs 333.60 -8.43 12.45 2.91063 -8.26 -26.29 38.84 9.08 -25.79
νem 450.16 -95.25 -46.59 -29.89 120.18 -32.63 -15.96 -10.24 41.17
ΔνSS 8203.26 -4110.66 -2527.54 -1390.47 4871.1 -31.87 -19.59 -10.78 37.76
ϕf -0.003 7.26×10⁻⁴ 0.002 -3.42×10⁻⁴ 0.01 9.19 23.14 -4.32 63.35
τav 3.81 -1.58 -6.71 -5.2054 6.81 -7.79 -33.02 -25.62 33.57
r -0.01 7.95×10⁻⁴ 0.003 3.43×10⁻⁴ 0.01 5.79 22.14 2.50 69.56
nr -0.04747 0.30647 1.23983 0.80972 0.0869 12.55 50.75 33.15 3.56 aAbsorption/emission maxima (denoted by abs and em, respectively) and Stokes-shift (SS) are
expressed in cm-1; average lifetime (av) in ns; radiative (r) and total non-radiative (nr) decay
rate constants are in ns-1.

xiv
Table 6S: Time-resolved fluorescence decay parameters of MHC and MHCB with increasing concentration
of β-cyclodextrin (β-CDx).
[β-CDx]
/mM
a1
(%)
τ1
/ ns
a2
(%)
τ2
/ ns
av
/ns
χR2 DW
MHC: Emission monitored at 440 nm
0.00 100.00 0.84 - - 0.84 1.18 2.11
7.20 68.52 1.06 31.47 4.64 3.45 1.25 2.14
13.70 72.25 1.12 27.76 4.87 3.46 1.15 2.26
19.60 74.25 1.00 25.76 4.98 3.52 1.04 2.45
24.40 75.26 1.11 24.74 5.19 3.58 1.17 2.20
29.10 74.65 1.12 25.13 5.17 3.58 1.09 2.01
33.60 75.93 1.06 24.07 5.12 3.52 1.16 2.24
MHCB: Emission monitored at 440 nm
1.40 67.20 6.99 32.80 2.16 6.36 1.35 2.09
2.00 77.46 7.17 22.57 2.99 6.72 1.26 2.00
2.72 76.24 7.27 23.76 3.14 6.78 1.26 2.4
3.56 77.60 7.34 22.37 2.48 6.91 1.28 2.02
4.76 74.28 7.78 25.72 2.94 7.03 1.19 2.28

xv
Fig. 4S: Fluorescence quenching of HSA in presence of MHC (a) and MHCB (b) at some
representative temperatures.
xvi
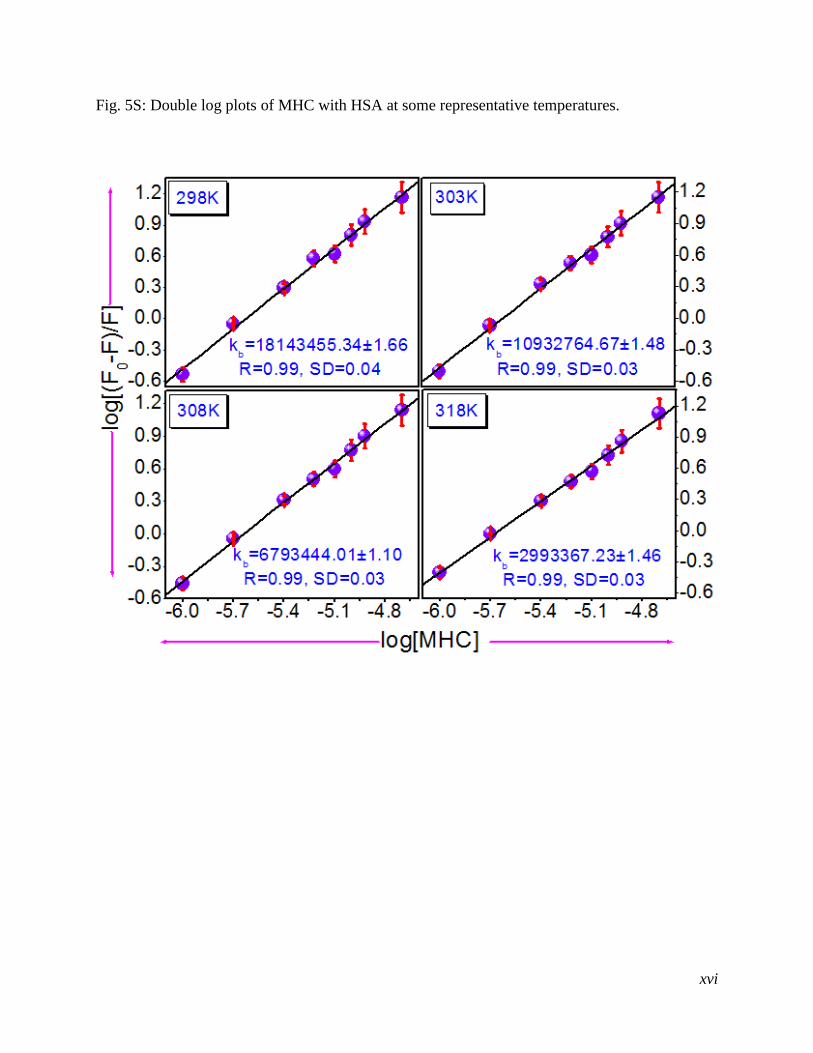
Fig. 5S: Double log plots of MHC with HSA at some representative temperatures.