electronic field data collection pilot study final report · electronic field data collection pilot...
TRANSCRIPT
Electronic Field Data Collection Pilot Study
Final Report
By
StreamNet Partner Agencies
Pacific States Marine Fisheries Commission Columbia River Inter-Tribal Fish Commission
Confederated Tribes of the Colville Reservation Idaho Department of Fish and Game
Montana Fish, Wildlife & Parks Oregon Department of Fish and Wildlife
U.S. Fish and Wildlife Service Washington Department of Fish and Wildlife
For
Bonneville Power Administration
August 5, 2015
Summary
"Tablet computers" or simply "tablets" are portable miniaturized computers with a touch-screen user interface, circuitry, and battery in a single unit. Many people have envisioned using these devices during research and monitoring field data collection activities to speed overall data acquisition and delivery, and to improve data quality. Potentially there are both positive and negative aspects to performing data entry during field work rather than relying on paper in the field. The Bonneville Power Administration was interested in exploring the positive and negative aspects of using tablet computers for field data entry, and asked StreamNet to conduct a pilot study to evaluate tablet field use. We created questionnaires to gather the reactions of fisheries field staff to various aspects of using tablet computers for data collection. Field personnel participating in our tests generally found the hardware to be robust, usable, and portable, but difficulties were encountered with 1) the speed of data entry while using a touch-screen interface, 2) acceptance of the operating systems by state agencies, and 3) the data entry forms created by the specific platform we chose to test ("Fulcrum" mobile data collection platform http://www.fulcrumapp.com by Spatial Networks of St. Petersburg, FL; http://spatialnetworks.com). Fulcrum was selected as the software platform for testing because it provided the possibility that a single programmer or small team could service many projects with minimal effort, but we found that the effort required on the programming side was much higher than anticipated. A broader survey of current field data technology users found more enthusiasm for technology adoption than our targeted tests did, most likely because it sampled a population of people who had already decided to use, selected, and succeeded in employing such technologies. We suggest that the use of tablet computers for field data collection is feasible for fisheries work. However concerns remain about both hardware and software. Participants in our trials would prefer lightweight and rugged models that run under the Microsoft Windows operating system, where robust event-driven data entry applications can be used.
Introduction "Tablet computers" or simply "tablets" are portable miniaturized computers with a touch-screen user interface, circuitry, and battery in a single unit. Cellular "smart" telephones are small tablet computers with telephone functions included as a major advertised feature, but the term "tablet computer" is generally used to refer to larger devices. With the advent of affordable tablet computers (and cellular smart telephones) many people have envisioned using these devices during research and monitoring field data collection activities to speed overall data acquisition and delivery, and to improve data quality. Many field workers are interested in exploring whether time savings may result from data entry in the field directly into tablet computers, thus reducing or eliminating the data entry and QC steps needed when data are first collected on paper data sheets in the field and later entered into a computer data system. Some people have also conjectured that data quality may improve if data entry is done in real time during data collection because computer systems can be made to enforce complex data quality rules such as required pieces of information, ranges of acceptable
values, and rules for one column of data that vary according to the value in other columns, and questions raised can be answered while still in the field. Data entry during data collection can potentially avoid other common data quality and data loss issues such as undecipherable handwriting, data that are incorrectly entered, and lost data sheets. In addition to the immediate potential for the individual researcher, data entry in the field can help to speed integration of data into larger agency data systems, which may be important in certain management situations. There are also potential negative aspects to performing data entry during field work rather than relying on paper in the field. Theft, loss, damage, or failure of a unit can result in significant data loss and delays if backups are not frequently performed; and "frequently" can mean several times each hour for some types of work. Slow data entry can interfere with field work if a data entry interface is not well designed. Tablet computers can be heavier and are more fragile than a clipboard and paper, and must have charged batteries and backup power options. Because paper and clipboard may continue to be used in the near future as a backup should the technology fail, tablet computers are likely to be an additional piece of equipment for field staff to carry. The cost of data systems and electronic data entry form development, maintenance, integration, and troubleshooting may outweigh the savings of data entry technicians' time, nullifying some or all of the anticipated cost savings. Finally, electronic data entry can minimize, but likely won't eliminate, problems resulting from human error. The Bonneville Power Administration (BPA) was interested in exploring these potential positive and negative aspects of using tablet computers for field data entry, and asked StreamNet to conduct a pilot study to evaluate their use by working with BPA-funded fisheries researchers in their real-world data collection activities. BPA wanted an evaluation of whether such systems justified the costs before investing in hardware purchases and software development. Recognizing that hardware costs were relatively low, one-time expenditures, while development and maintenance costs could be much higher and on-going, we researched approaches that showed promise of minimizing development and maintenance costs. We chose to explore the "Fulcrum" mobile data collection platform (http://www.fulcrumapp.com) by Spatial Networks (360 Central Avenue, Suite 200, St. Petersburg, FL 33701; http://spatialnetworks.com) as the system we would test because it held the promise of allowing a single programmer or small team to rapidly develop, deploy, and manage multiple data entry forms and data systems, update systems without major redeployment efforts, and transfer data back to the end users in multiple ways. These tests were not meant to answer all the above questions definitively, but rather to represent the broader world of options available and to give some insight into specific aspects of the hardware and software currently available. Because the experience of end users ultimately determines the success or failure of a data entry system, we created questionnaires to gather the reactions of field people to the various aspects of using tablet computers for data collection. We provided several different hardware platforms to test, and asked questions related to the hardware, the software interface, and the usability, durability, and reliability of the systems tested. The responses to these questionnaires, found in the Results and Discussion section, form the bulk of this report. We also created data delivery mechanisms and asked about the success of data delivery to their systems. The participating projects collected different data types under many different conditions, which allowed testing in a variety of situations.
After the field tests, we cohosted an "Emerging Technologies" workshop on November 18, 2014 where biologists and others who had used various technologies discussed the strengths and weaknesses of a variety of electronic data collection techniques they had employed in their field work. A survey of such biologists (herein the "emerging technologies survey" or "ETS") was conducted before the workshop, and the results were presented at the workshop. The results of that survey, which asked questions very similar to those in our questionnaires, are also discussed in this report and compared with the results from our questionnaires.
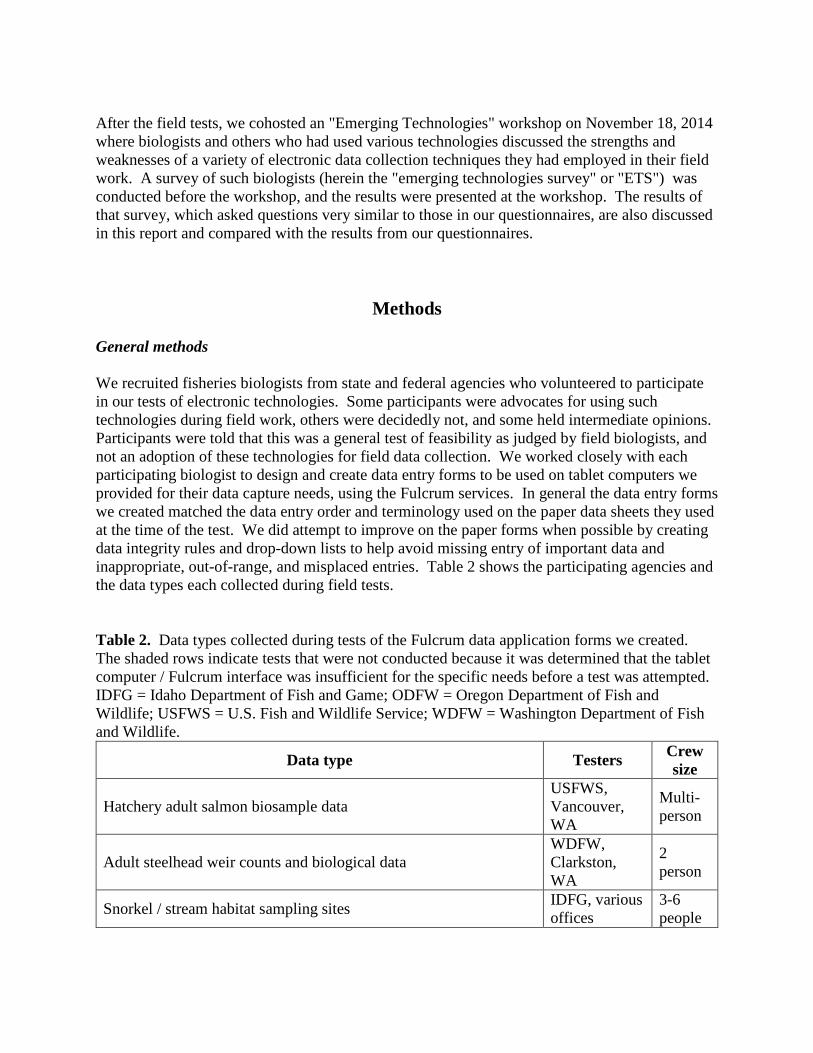
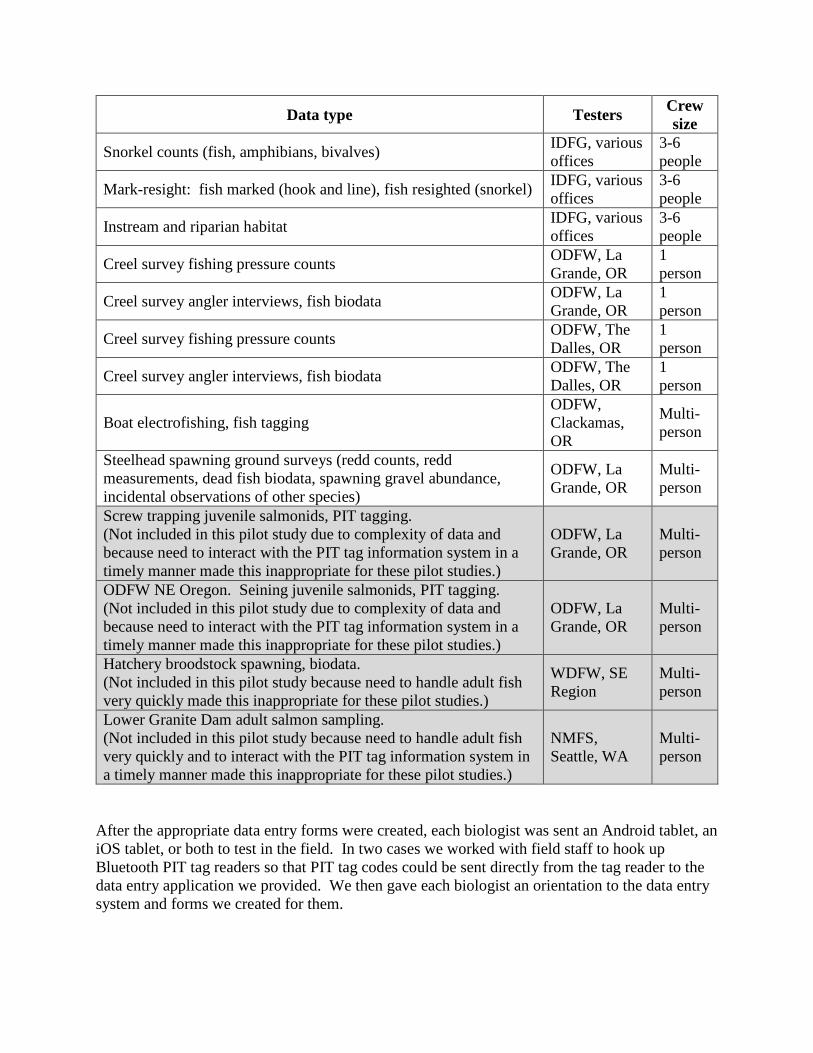
Methods General methods We recruited fisheries biologists from state and federal agencies who volunteered to participate in our tests of electronic technologies. Some participants were advocates for using such technologies during field work, others were decidedly not, and some held intermediate opinions. Participants were told that this was a general test of feasibility as judged by field biologists, and not an adoption of these technologies for field data collection. We worked closely with each participating biologist to design and create data entry forms to be used on tablet computers we provided for their data capture needs, using the Fulcrum services. In general the data entry forms we created matched the data entry order and terminology used on the paper data sheets they used at the time of the test. We did attempt to improve on the paper forms when possible by creating data integrity rules and drop-down lists to help avoid missing entry of important data and inappropriate, out-of-range, and misplaced entries. Table 2 shows the participating agencies and the data types each collected during field tests. Table 2. Data types collected during tests of the Fulcrum data application forms we created. The shaded rows indicate tests that were not conducted because it was determined that the tablet computer / Fulcrum interface was insufficient for the specific needs before a test was attempted. IDFG = Idaho Department of Fish and Game; ODFW = Oregon Department of Fish and Wildlife; USFWS = U.S. Fish and Wildlife Service; WDFW = Washington Department of Fish and Wildlife.
Data type Testers Crew size
Hatchery adult salmon biosample data USFWS, Vancouver, WA
Multi-person
Adult steelhead weir counts and biological data WDFW, Clarkston, WA
2 person
Snorkel / stream habitat sampling sites IDFG, various offices
3-6 people
Data type Testers Crew size
Snorkel counts (fish, amphibians, bivalves) IDFG, various offices
3-6 people
Mark-resight: fish marked (hook and line), fish resighted (snorkel) IDFG, various offices
3-6 people
Instream and riparian habitat IDFG, various offices
3-6 people
Creel survey fishing pressure counts ODFW, La Grande, OR
1 person
Creel survey angler interviews, fish biodata ODFW, La Grande, OR
1 person
Creel survey fishing pressure counts ODFW, The Dalles, OR
1 person
Creel survey angler interviews, fish biodata ODFW, The Dalles, OR
1 person
Boat electrofishing, fish tagging ODFW, Clackamas, OR
Multi-person
Steelhead spawning ground surveys (redd counts, redd measurements, dead fish biodata, spawning gravel abundance, incidental observations of other species)
ODFW, La Grande, OR
Multi-person
Screw trapping juvenile salmonids, PIT tagging. (Not included in this pilot study due to complexity of data and because need to interact with the PIT tag information system in a timely manner made this inappropriate for these pilot studies.)
ODFW, La Grande, OR
Multi-person
ODFW NE Oregon. Seining juvenile salmonids, PIT tagging. (Not included in this pilot study due to complexity of data and because need to interact with the PIT tag information system in a timely manner made this inappropriate for these pilot studies.)
ODFW, La Grande, OR
Multi-person
Hatchery broodstock spawning, biodata. (Not included in this pilot study because need to handle adult fish very quickly made this inappropriate for these pilot studies.)
WDFW, SE Region
Multi-person
Lower Granite Dam adult salmon sampling. (Not included in this pilot study because need to handle adult fish very quickly and to interact with the PIT tag information system in a timely manner made this inappropriate for these pilot studies.)
NMFS, Seattle, WA
Multi-person
After the appropriate data entry forms were created, each biologist was sent an Android tablet, an iOS tablet, or both to test in the field. In two cases we worked with field staff to hook up Bluetooth PIT tag readers so that PIT tag codes could be sent directly from the tag reader to the data entry application we provided. We then gave each biologist an orientation to the data entry system and forms we created for them.
We also coordinated with each biologist on how data would be moved from the tablets to their destination database. In all but one case the biologists opted for us to write a small Visual Basic for Applications program within a Microsoft Access database that would call a web service to obtain new and updated data. The web services were written to provide data from the Pacific States Marine Fisheries Commission (PSMFC) database that we created as a backup and staging area for these data sets. Idaho Department of Fish and Game opted to download their data directly from the Fulcrum web site in the form of Microsoft Excel spreadsheets rather than use web services. After data were entered on the tablets using the Fulcrum software, the users "synced" their systems to send their new and updated data to the Fulcrum servers at Spatial Networks. Syncing occurred by using a wireless network (at an agency office, local business, public library, or at home), or by connecting to the agency network via a network cable (where an IP address could be obtained and the Internet accessed, though the other network resources were unavailable to the tablet computers). To get the data back to the users' regular computers, we created database tables at PSMFC into which we imported the data from Spatial Networks in real time as the field biologists synced their systems. We built web services that could be called to fetch any new or updated data. For each biologist we created a Visual Basic for Applications (VBA) program within Microsoft Access that would call the web services we created, thus copying the data to the biologist's computer and completing the process. The web services used the http protocol and thus as long as an Internet connection was available no special permissions or software were needed to make the system function. The data flow was as follows:
1. Data entry onto tablet computer using custom Fulcrum application. 2. Copying the data from the tablet computers to the Spatial Networks Fulcrum servers by
"syncing" the Fulcrum application. Data remained on the tablet computer. 3. Copying the data from the Spatial Networks Fulcrum servers to the PSMFC servers.
Data remained on the Spatial Networks servers. 4. Copying the data from the PSMFC servers to the end user database. Data remained on
the PSMFC servers. The redundancy shown in the 4 above steps was intentional and provided data security and an opportunity to rerun the process in case any link in the chain failed. For each project we created one or more back end database tables to capture the data at PSMFC, wrote and tested programming code to fetch the data from Spatial Networks to the PSMFC tables, wrote and tested programming code to create one or more web services to make the data available to the end user's database, and wrote and tested programming code in VBA in Microsoft Access to call the appropriate web services and insert the new and updated data into the final user database. Tablet computers and any accompanying hardware was provided to the testers, and a training session was conducted to teach them how to use the tablet computers and the system we had programmed for data entry and retrieval. Training sessions were over the telephone except for USFWS personnel from Vancouver, WA and ODFW personnel from The Dalles, OR. Phone-
based and in-person training sessions appeared equally successful. To compare hardware platforms we provided an Apple tablet and an Android tablet to most testers. After the initial training session we asked all the individual testers to fill out a questionnaire regarding how well they thought the system would work, and what aspects of the specific piece of hardware and software they were to use they thought might be problematic (Appendix 1A). This questionnaire was to be filled out by each tester after orientation/training for each specific model of tablet computer, but before actually using it in the field. A second questionnaire was to be filled out by each tester for each specific model of tablet computer after using it in the field (Appendix 1B). The questions on the second questionnaire addressed specific topics about the user's experience with that particular tablet computer. Custom aerial imagery for use by Idaho Department of Fish and Game testers The Idaho Department of Fish and Game's (IDFG) field work included navigating to remote areas and selecting the correct point on a stream to begin snorkeling. Finding the correct sampling site while in the field can be difficult due to lack of significant local landmarks. For this reason, to assist with finding sites and to help improve existing location data we created two custom sets of base maps and GIS layers for use in the Fulcrum Apps used by the IDFG field staff. These were as follows:
1. USGS 1:24,000 topographic maps with shaded relief option. 2. Custom base maps that included ...
• 0.5 meter resolution aerial imagery from the National Agriculture Imagery Program (NAIP)
• sampling sites • landownership boundaries • watershed boundaries • state boundaries • roads • trails • towns • hydrography (streams and lakes).
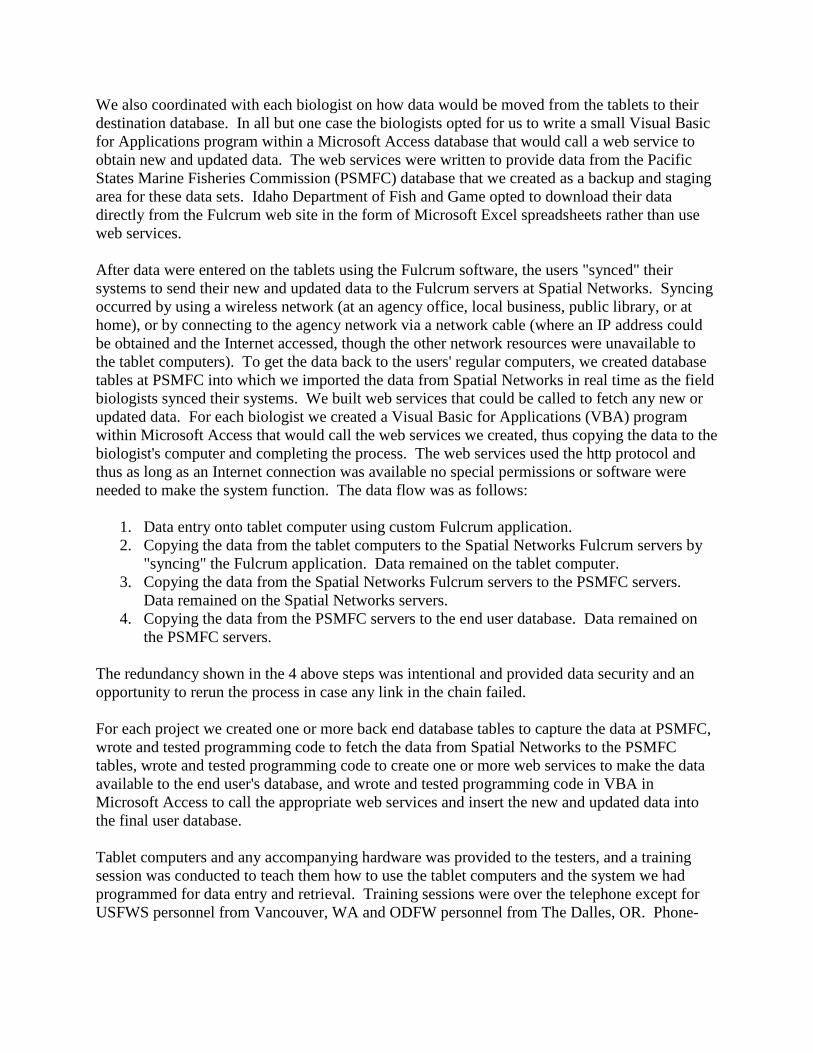
Full details of the custom mapping products created for IDFG can be found in Holycross 2014. (Appendix 2.) Field personnel used these maps in conjunction with the tablet computers' GPS systems to precisely locate sampling sites and to correct site information that was inaccurate. Specific hardware tested We tested 4 different tablet computers. The tablets and their a priori known potential shortcomings were as shown in Table 2.
Table 2. Specific tablet computer models tested and their a priori known potential shortcomings. Tablet computer Potential shortcoming(s)
Apple iPad 4 with Wi-Fi, Bluetooth, and camera, running Apple's iOS operating system, inside a rugged waterproof case.
• Narrow operating temperature range (40° - 85°F).
• Battery cannot be replaced. Thus, once a battery fails the unit can no longer be used.
• Greatly reduced number of peripherals that can be used due to Apple's strict control of their operating system.
• Heavy, bulky.
Apple iPad Mini 2 with Wi-Fi, Bluetooth, and camera, running Apple's iOS operating system, inside a rugged waterproof case.
• Narrow operating temperature range (40° - 85°F).
• Battery cannot be replaced. Thus, once a battery fails the unit can no longer be used.
• Greatly reduced number of peripherals that can be used due to Apple's strict control of their operating system.
• Small size makes it easier to carry and handle, but perhaps also harder to read.
Panasonic Toughpad model FZ-A1 tablet computer with Wi-Fi, Bluetooth, camera, and GPS, running Google's Android operating system.
• Heavy, bulky.
Sony "Xperia 1" tablet computer with Wi-Fi, Bluetooth, camera, and GPS, running Google's Android operating system.
• More susceptible to damage than other tablets tested due to no rugged and waterproofing of unit and no rugged/waterproof case.
Auxiliary hardware used by some projects included an external GPS unit for use with the Apple tablets (BadElf "BE-GPS-2200" external Bluetooth-enabled GPS units (http://bad-elf.com). Battery life was expected to be an issue for all tablet models, but it was possible for most testers to recharge a unit's battery daily at a building or in a vehicle. However one project required a way to recharge a unit's batteries while away from services and vehicle. For that project "Astro ES" external backup batteries and "14W" 14 watt foldable solar panel rechargers from Anker (http://www.ianker.com) were used and tested. Specific tests conducted Data entry forms were created for each test using the Fulcrum mobile data collection platform. For applications where collection of PIT tag codes was needed we used SerialMagic Gears (https://serialio.com/support/SerialMagic/Android/SMG_Android_install.php) to permit Android tablet computers to communicate directly with Bluetooth-enabled PIT tag readers so that tag codes could be directly entered into the Fulcrum applications. Apple tablets were not capable of

communicating with the PIT tag readers and thus were not tested with those devices. We created, and field crews tested, forms specific to the data types and testers listed in Table 2.
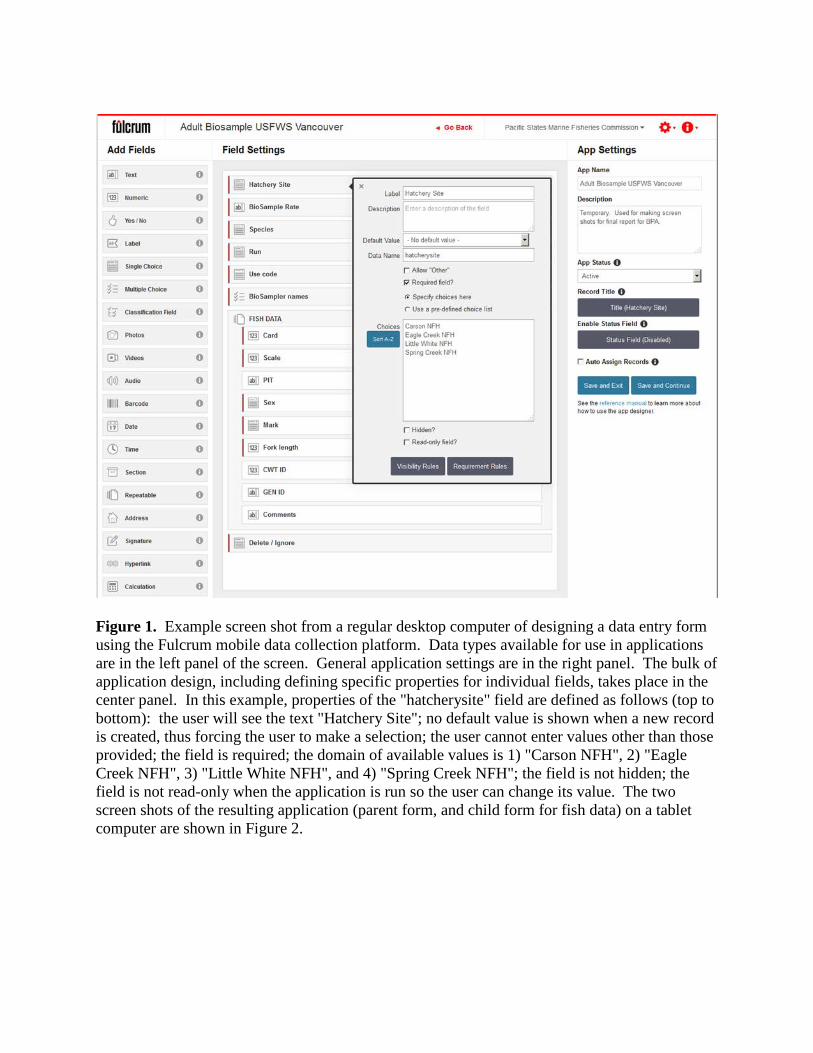
Figure 1. Example screen shot from a regular desktop computer of designing a data entry form using the Fulcrum mobile data collection platform. Data types available for use in applications are in the left panel of the screen. General application settings are in the right panel. The bulk of application design, including defining specific properties for individual fields, takes place in the center panel. In this example, properties of the "hatcherysite" field are defined as follows (top to bottom): the user will see the text "Hatchery Site"; no default value is shown when a new record is created, thus forcing the user to make a selection; the user cannot enter values other than those provided; the field is required; the domain of available values is 1) "Carson NFH", 2) "Eagle Creek NFH", 3) "Little White NFH", and 4) "Spring Creek NFH"; the field is not hidden; the field is not read-only when the application is run so the user can change its value. The two screen shots of the resulting application (parent form, and child form for fish data) on a tablet computer are shown in Figure 2.
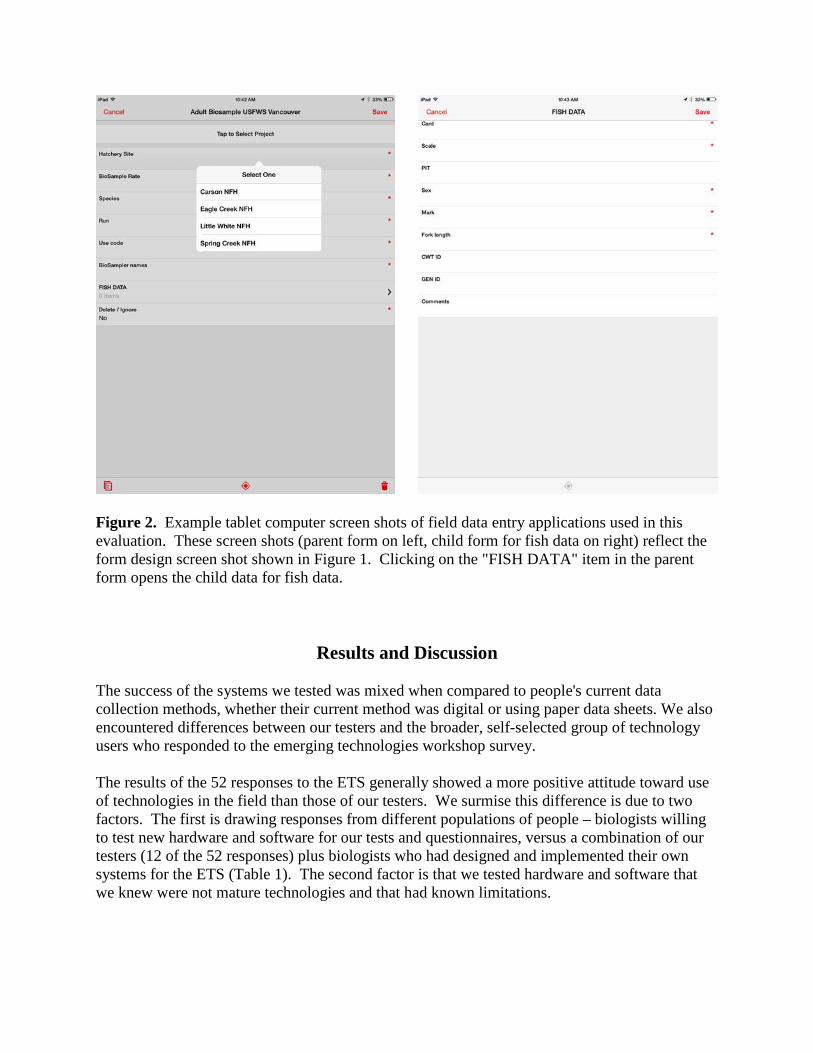
Figure 2. Example tablet computer screen shots of field data entry applications used in this evaluation. These screen shots (parent form on left, child form for fish data on right) reflect the form design screen shot shown in Figure 1. Clicking on the "FISH DATA" item in the parent form opens the child data for fish data.
Results and Discussion The success of the systems we tested was mixed when compared to people's current data collection methods, whether their current method was digital or using paper data sheets. We also encountered differences between our testers and the broader, self-selected group of technology users who responded to the emerging technologies workshop survey. The results of the 52 responses to the ETS generally showed a more positive attitude toward use of technologies in the field than those of our testers. We surmise this difference is due to two factors. The first is drawing responses from different populations of people – biologists willing to test new hardware and software for our tests and questionnaires, versus a combination of our testers (12 of the 52 responses) plus biologists who had designed and implemented their own systems for the ETS (Table 1). The second factor is that we tested hardware and software that we knew were not mature technologies and that had known limitations.
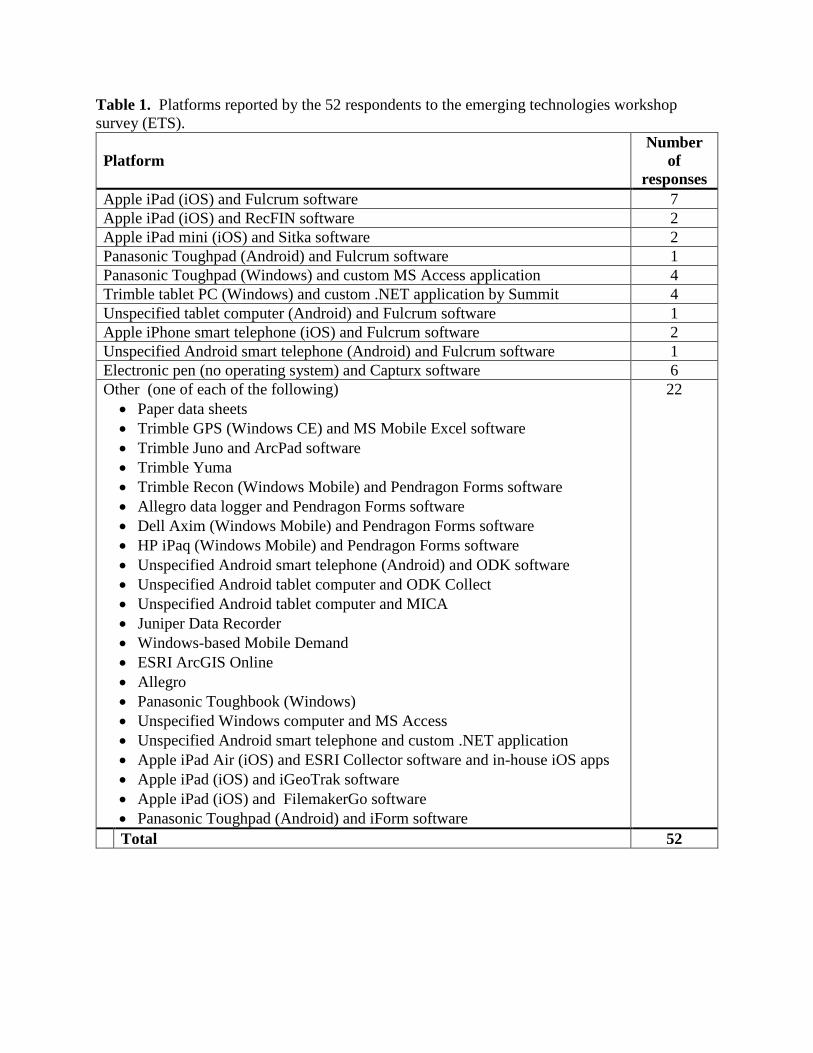
Table 1. Platforms reported by the 52 respondents to the emerging technologies workshop survey (ETS).
Platform Number
of responses
Apple iPad (iOS) and Fulcrum software 7 Apple iPad (iOS) and RecFIN software 2 Apple iPad mini (iOS) and Sitka software 2 Panasonic Toughpad (Android) and Fulcrum software 1 Panasonic Toughpad (Windows) and custom MS Access application 4 Trimble tablet PC (Windows) and custom .NET application by Summit 4 Unspecified tablet computer (Android) and Fulcrum software 1 Apple iPhone smart telephone (iOS) and Fulcrum software 2 Unspecified Android smart telephone (Android) and Fulcrum software 1 Electronic pen (no operating system) and Capturx software 6 Other (one of each of the following) • Paper data sheets • Trimble GPS (Windows CE) and MS Mobile Excel software • Trimble Juno and ArcPad software • Trimble Yuma • Trimble Recon (Windows Mobile) and Pendragon Forms software • Allegro data logger and Pendragon Forms software • Dell Axim (Windows Mobile) and Pendragon Forms software • HP iPaq (Windows Mobile) and Pendragon Forms software • Unspecified Android smart telephone (Android) and ODK software • Unspecified Android tablet computer and ODK Collect • Unspecified Android tablet computer and MICA • Juniper Data Recorder • Windows-based Mobile Demand • ESRI ArcGIS Online • Allegro • Panasonic Toughbook (Windows) • Unspecified Windows computer and MS Access • Unspecified Android smart telephone and custom .NET application • Apple iPad Air (iOS) and ESRI Collector software and in-house iOS apps • Apple iPad (iOS) and iGeoTrak software • Apple iPad (iOS) and FilemakerGo software • Panasonic Toughpad (Android) and iForm software
22
Total 52
Questionnaire #1 Responses to questionnaire #1, which was given after orientation to each particular tablet computer but before using it in the field, were as follows. The purpose of these questions was to gauge initial reactions so that these could be compared to the responses given after actually using a device. Questionnaire #1, question 1. Does this type of field work require or benefit from the ability to interface with peripheral equipment (PIT tag reader, scale, etc.)?
• No = 34 • Yes = 25 (42%) • No answer = 1
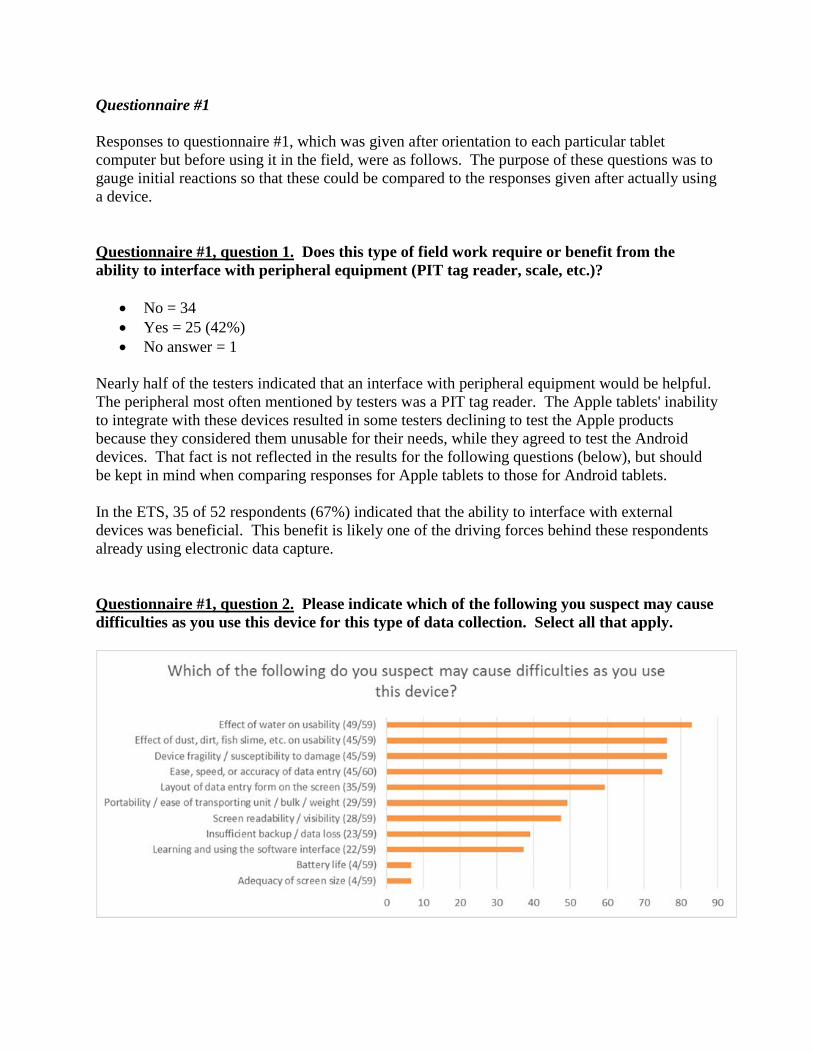
Nearly half of the testers indicated that an interface with peripheral equipment would be helpful. The peripheral most often mentioned by testers was a PIT tag reader. The Apple tablets' inability to integrate with these devices resulted in some testers declining to test the Apple products because they considered them unusable for their needs, while they agreed to test the Android devices. That fact is not reflected in the results for the following questions (below), but should be kept in mind when comparing responses for Apple tablets to those for Android tablets. In the ETS, 35 of 52 respondents (67%) indicated that the ability to interface with external devices was beneficial. This benefit is likely one of the driving forces behind these respondents already using electronic data capture. Questionnaire #1, question 2. Please indicate which of the following you suspect may cause difficulties as you use this device for this type of data collection. Select all that apply.
After orientation to the tablet computers but before using them in the field, there was widespread skepticism among the testers that the tablet computers and software interface would be useful in the field. Concerns regarding the effect of water and dirt affecting the function of the touchscreen, device fragility, and ability to do data entry were reported by 75% or more of the testers. Also commonly of concern were the data entry form's layout, portability of the units, screen readability, potential for data loss, and learning to use the data entry interface. Few people thought battery life or screen size would be significant issues. Questionnaire #2 Responses to questionnaire #2, which was given after each particular tablet was used in the field, are shown below. These responses represent the testers' reactions to actually using the tablet computers for data entry in their real world situations, and form the major findings of this report. In all the bar charts below, negative responses for that question are shown on the left side, neutral in the middle, and positive responses on the right. Responses to the various tablet computers are shown in different colors. In most of the charts the responses to the Apple iPad and the Apple iPad Mini are pooled because of their similarities of use and the similarities of testers' responses. The iPad Mini is shown separately where more appropriate to do so.
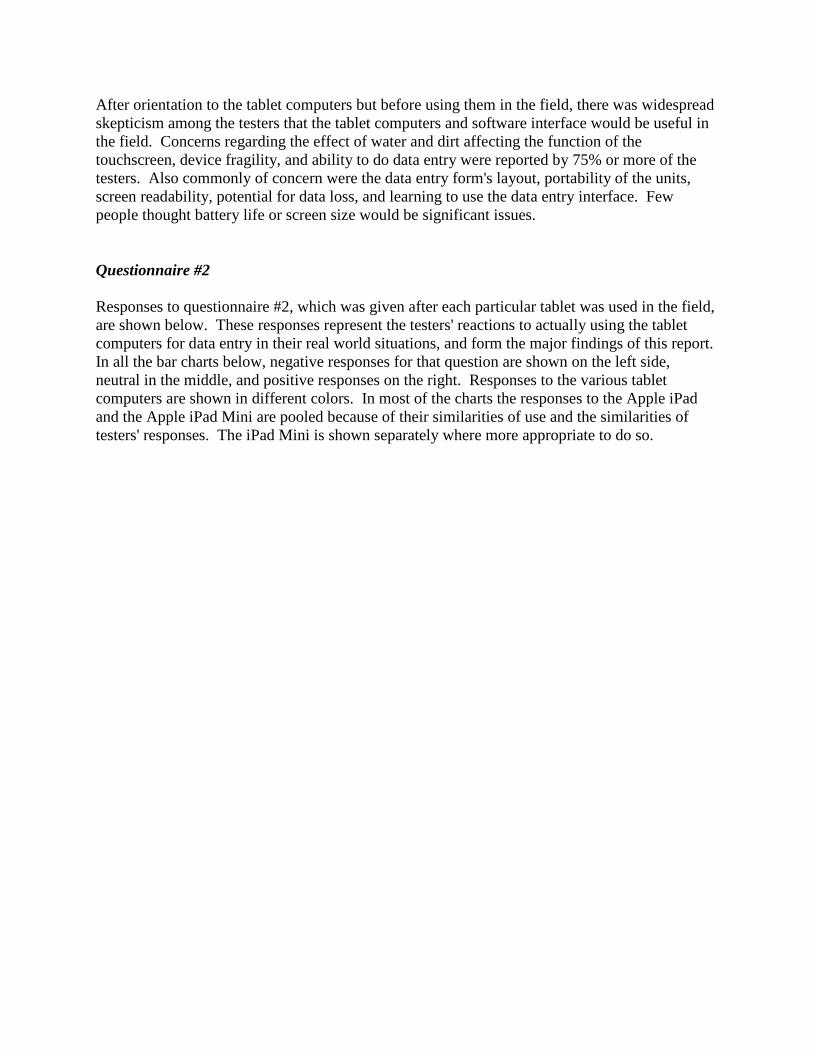
Questionnaire #2, question 1. How successful was data capture using this device?
In general the testers thought data capture using the tablet computers with the Fulcrum mobile data collection platform software was reasonably successful, with roughly 60% rating it as "Good" and another 20% as "Neutral". None considered it "Very good". At roughly 20%, the proportion of people who thought the success was "Bad" or 'Very bad" was substantial. The negative ratings were somewhat higher for the Apple products. We suspect this relatively higher proportion of negative rating was the result of units shutting down in hot weather (see Questionnaire #2, question 15 below), because other aspects of the Apple tablets garnered higher ratings and conversations with testers indicated the Apple products' more polished functionality was preferred over the Android units' slightly less elegant interface and implementations.
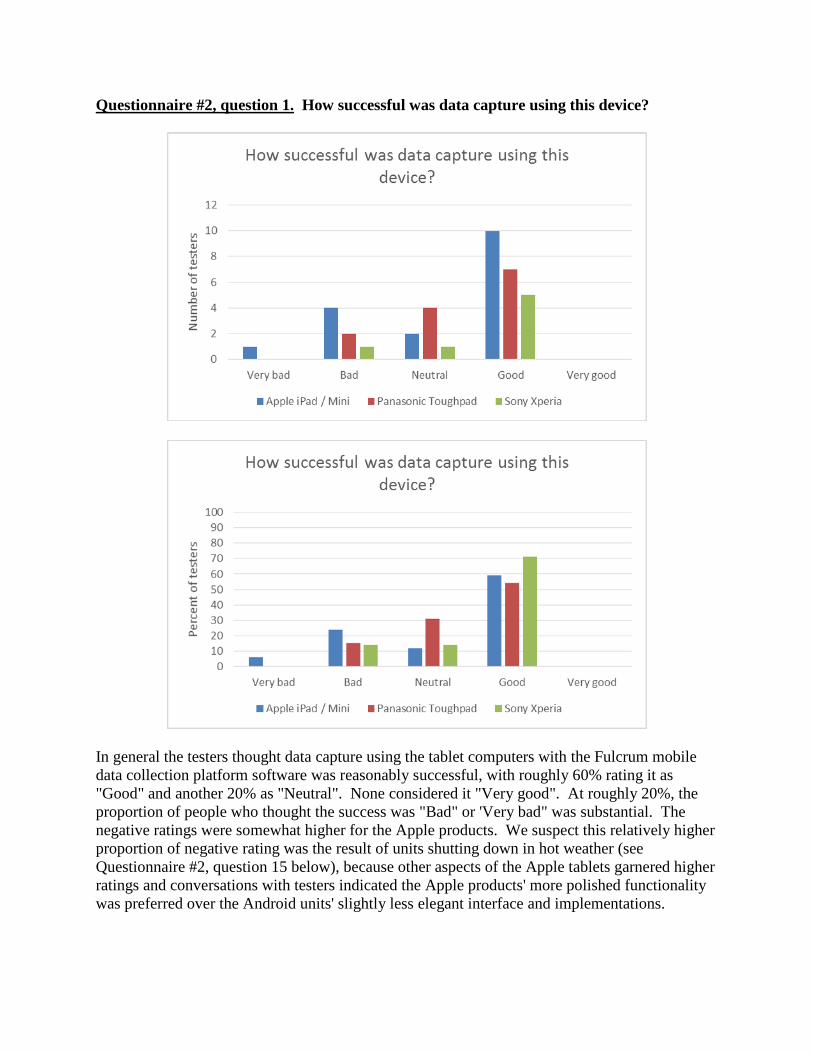
Questionnaire #2, question 2. Overall ease of use.
Only about 10% of testers found the systems to be difficult to use. The user interfaces we created using the Fulcrum mobile data collection platform were easy to see, easy to understand, and logical to use.
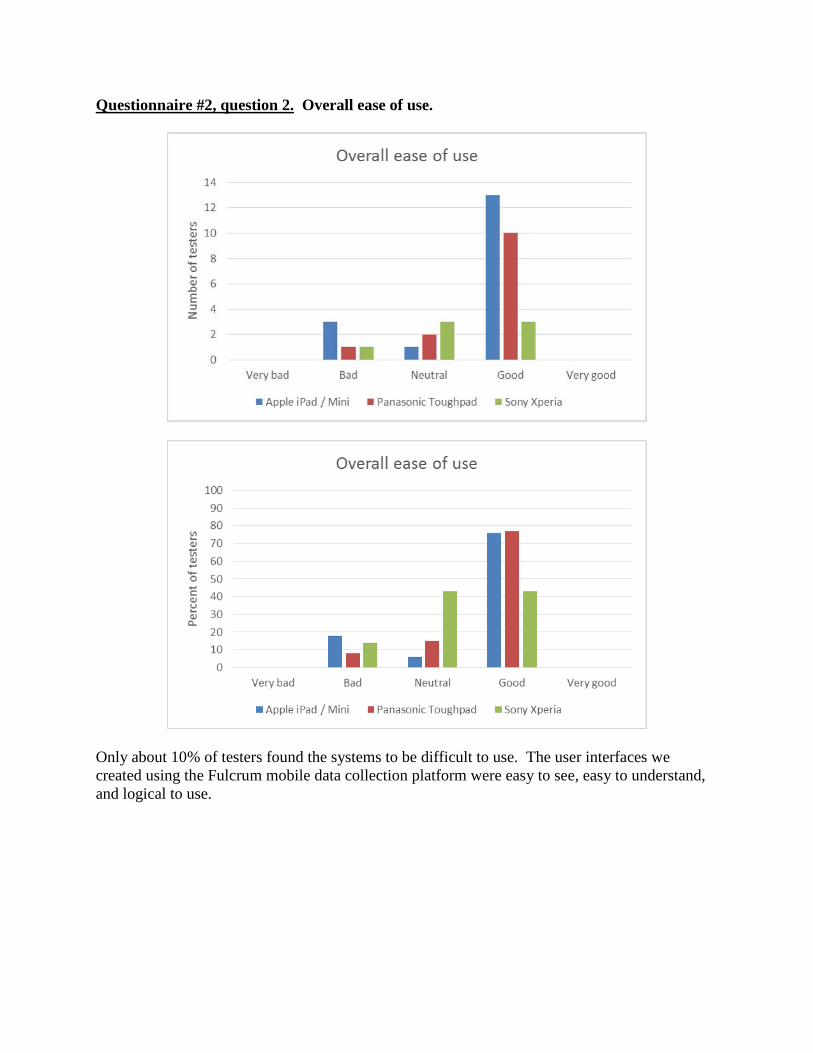
Questionnaire #2, question 3. Portability / ease of transporting unit / bulkiness / weight. (Apple iPad and iPad Mini are listed separately for this question.)
Roughly 80% of testers found the portability of the units to be neutral to very good, with the Apple iPad Mini gaining a 100% rating. This is better than was predicted by the testers in question 2 of Questionnaire #1, where half the testers thought portability would be a problem. The full size Apple iPad's better rating than the Panasonic Toughpad, though the two units were nearly identical in size and weight, was due to the lack of carrying straps available for the Toughpad. The lack of "neutral" ratings for the Sony Xperia's is interesting, and may be due to that unit's very light and slim construction garnering the positive ratings, while it's large screen size and relative fragility as compared to the other units responsible for the negative ratings.
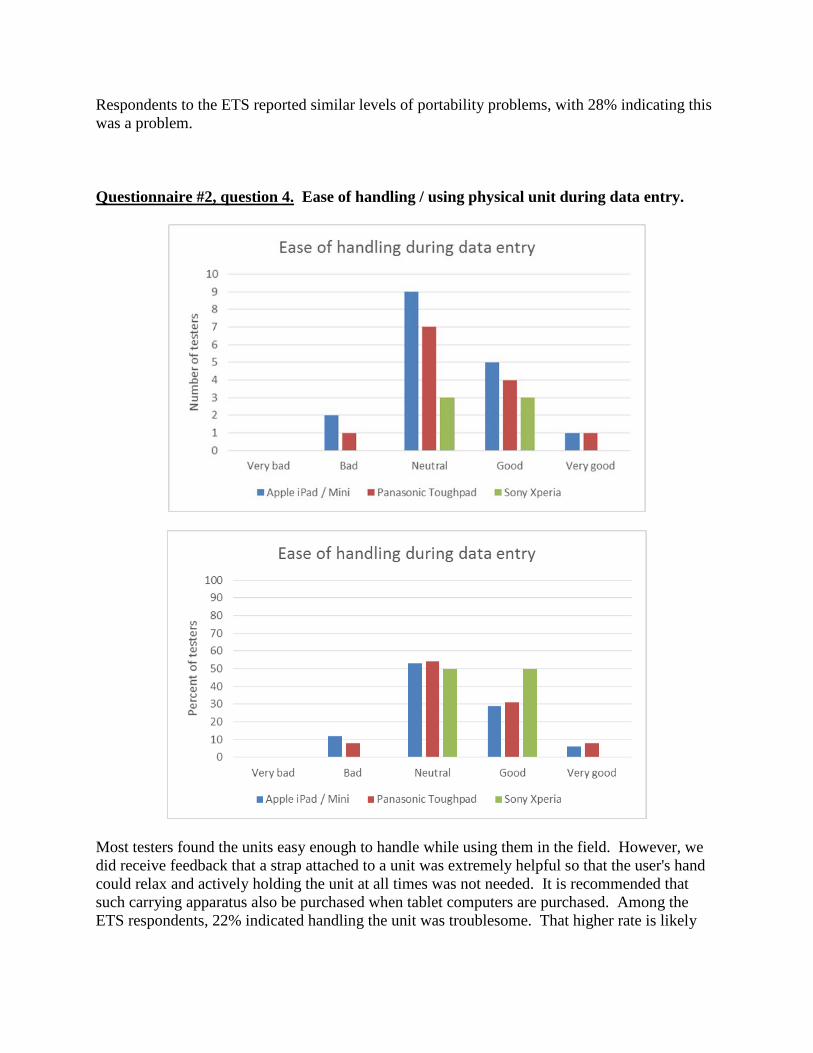
Respondents to the ETS reported similar levels of portability problems, with 28% indicating this was a problem. Questionnaire #2, question 4. Ease of handling / using physical unit during data entry.
Most testers found the units easy enough to handle while using them in the field. However, we did receive feedback that a strap attached to a unit was extremely helpful so that the user's hand could relax and actively holding the unit at all times was not needed. It is recommended that such carrying apparatus also be purchased when tablet computers are purchased. Among the ETS respondents, 22% indicated handling the unit was troublesome. That higher rate is likely
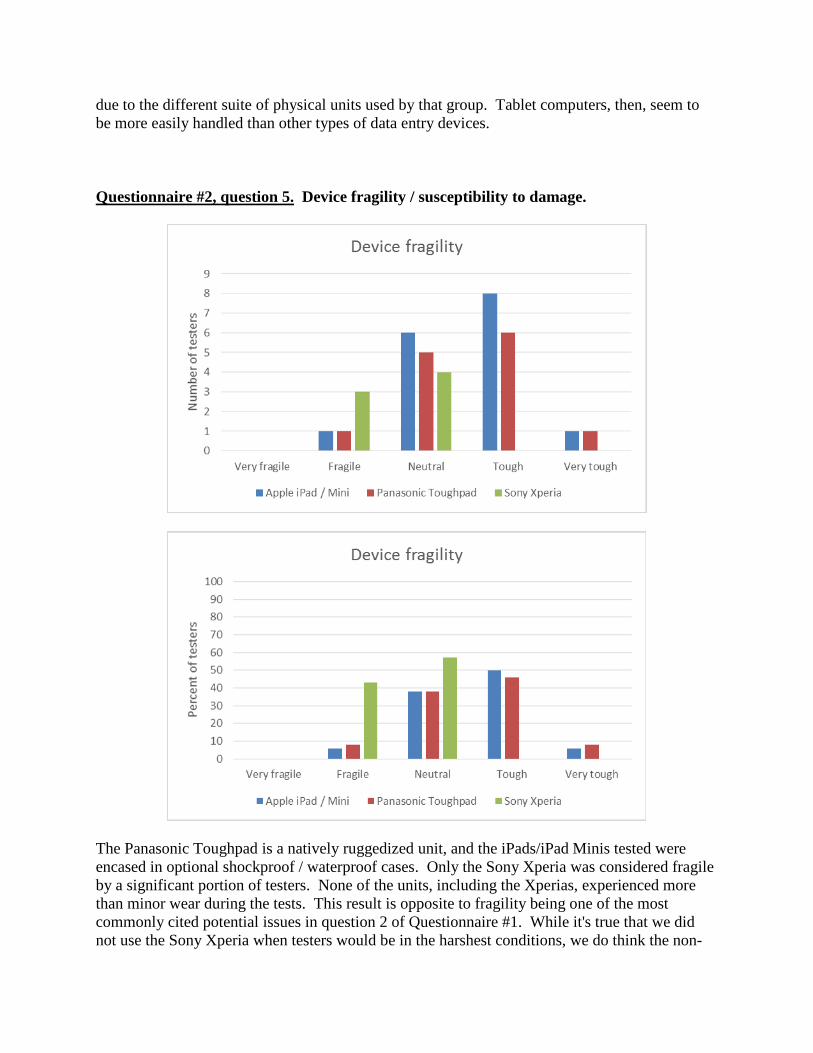
due to the different suite of physical units used by that group. Tablet computers, then, seem to be more easily handled than other types of data entry devices. Questionnaire #2, question 5. Device fragility / susceptibility to damage.
The Panasonic Toughpad is a natively ruggedized unit, and the iPads/iPad Minis tested were encased in optional shockproof / waterproof cases. Only the Sony Xperia was considered fragile by a significant portion of testers. None of the units, including the Xperias, experienced more than minor wear during the tests. This result is opposite to fragility being one of the most commonly cited potential issues in question 2 of Questionnaire #1. While it's true that we did not use the Sony Xperia when testers would be in the harshest conditions, we do think the non-
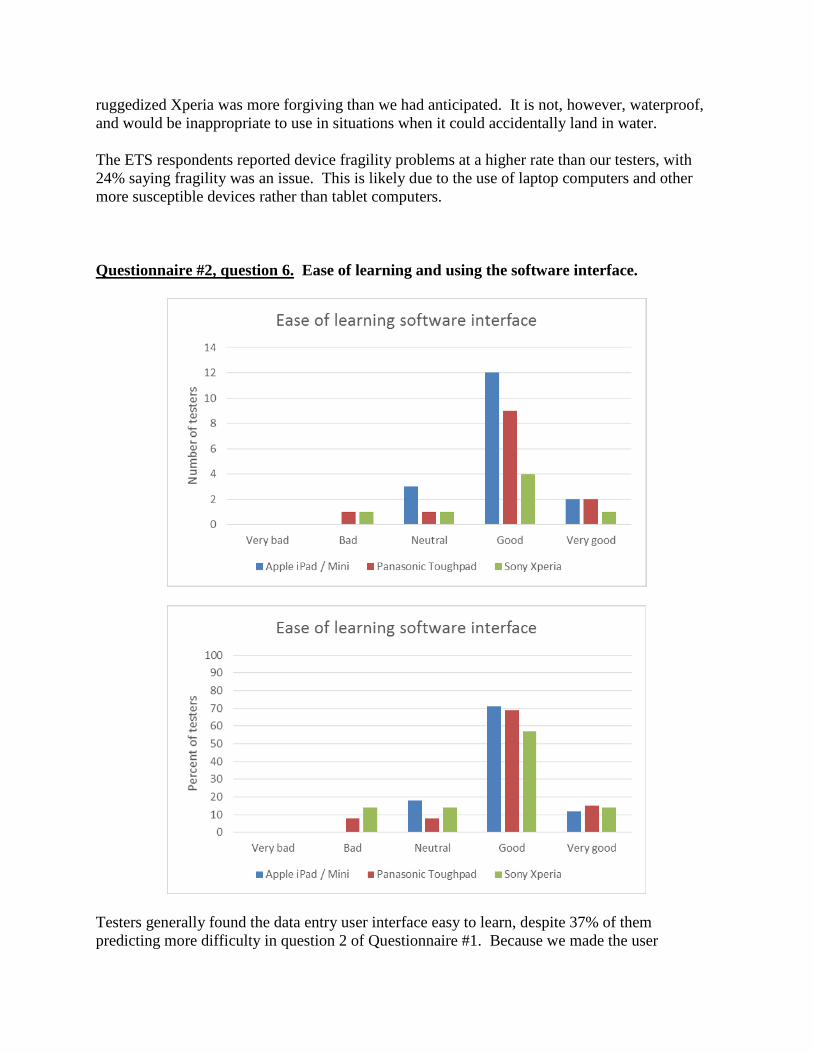
ruggedized Xperia was more forgiving than we had anticipated. It is not, however, waterproof, and would be inappropriate to use in situations when it could accidentally land in water. The ETS respondents reported device fragility problems at a higher rate than our testers, with 24% saying fragility was an issue. This is likely due to the use of laptop computers and other more susceptible devices rather than tablet computers. Questionnaire #2, question 6. Ease of learning and using the software interface.
Testers generally found the data entry user interface easy to learn, despite 37% of them predicting more difficulty in question 2 of Questionnaire #1. Because we made the user
interfaces use the same data entry order as the paper data sheets they were accustomed to whenever possible, they could easily find what they were looking for. Also, the data entry controls (text boxes, check boxes, drop-down boxes, etc.) were straight-forward and easy to use, with the appropriate input mechanism (numeric keypad, text keypad, drop-down list, etc.) being presented to the user for each item. On the down side, the Fulcrum paradigm for child records in one-to-many relationships was brand new when we used it and had not been implemented as well as it could have been. It was confusing at times to know how to add child records, and this may explain the "Bad" and "Neutral" ratings given by some testers on this question. Among the ETS respondents, 32% reported trouble learning the software interface. The difference is likely due to 1) many of the ETS respondents creating their own systems rather than working with programmers, and 2) creating systems that do more and thus are inherently more complex than the systems we created for our tests.
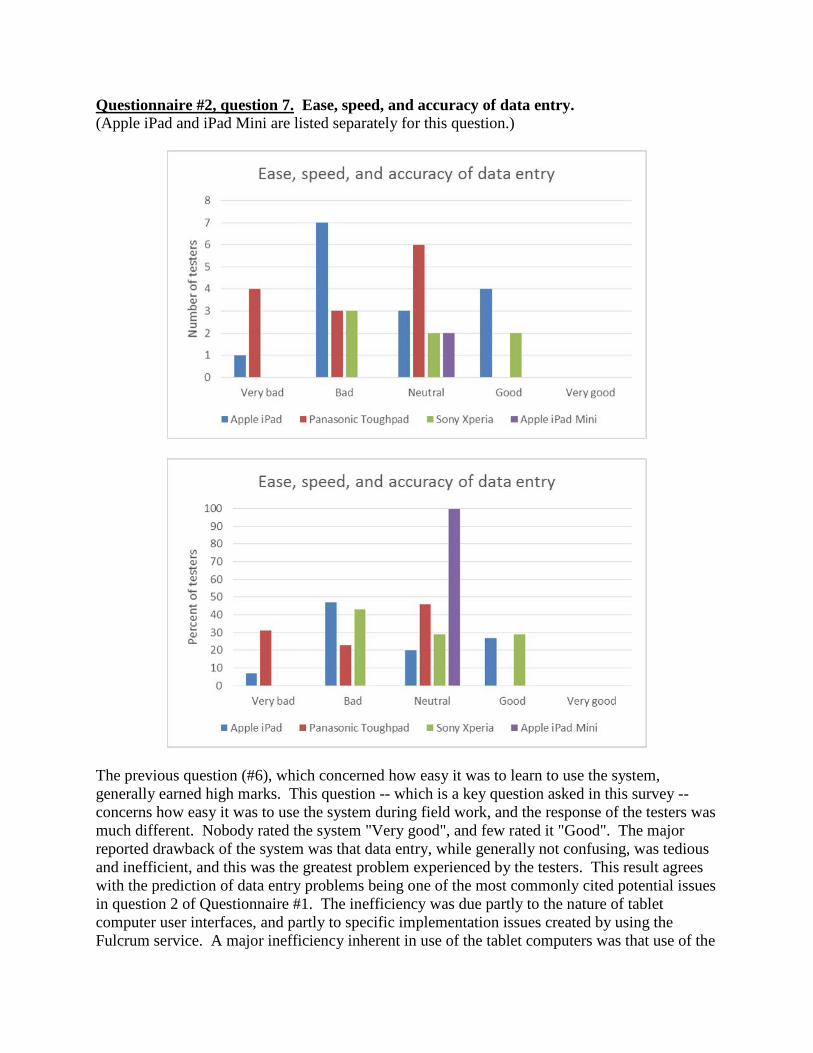
Questionnaire #2, question 7. Ease, speed, and accuracy of data entry. (Apple iPad and iPad Mini are listed separately for this question.)
The previous question (#6), which concerned how easy it was to learn to use the system, generally earned high marks. This question -- which is a key question asked in this survey -- concerns how easy it was to use the system during field work, and the response of the testers was much different. Nobody rated the system "Very good", and few rated it "Good". The major reported drawback of the system was that data entry, while generally not confusing, was tedious and inefficient, and this was the greatest problem experienced by the testers. This result agrees with the prediction of data entry problems being one of the most commonly cited potential issues in question 2 of Questionnaire #1. The inefficiency was due partly to the nature of tablet computer user interfaces, and partly to specific implementation issues created by using the Fulcrum service. A major inefficiency inherent in use of the tablet computers was that use of the
touchpad interface was slow, and having to switch between separate keypads (generally) for text and for numbers / special characters was very inefficient. Drop-down lists were slow to perform, and long lists were slow to scroll through to find the desired entry. Some of the inefficiency was due to the number of steps required. For each field, a user needed to use a single finger to sequentially 1) touch an item to make it active, 2) then enter the data using a keyboard or scroll through a drop-down list, and then 3) accept the entry. While this is not too different than the steps needed for data entry using a keyboard and mouse, each screen touch on a tablet takes much longer than the equivalent action on a desktop computer - and is happening during data collection when data entry speed is often critical to success. Several testers quit the test almost immediately because the obvious inefficiency interfered with their field work. Another drawback noted by multiple users was that finding a previously-entered record was difficult and slow. Even people doing creel surveys, which is a slow data entry activity with relatively few records, found it difficult to enter data quickly enough and to find existing records. Because we realized before the field tests that data entry speed would be a critical issue, the user interfaces we made utilized the most efficient tools provided to us by Fulcrum, but still the testers found them to be inadequate. Only 32% of the ETS respondents reported problems with data entry speed. This is likely due to more often using computer systems (hardware and software) that were specifically designed for efficient data entry, as opposed to the Fulcrum system we tested which was designed for ease of form creation and updates, ease of use, and ease of data transfer. As well, 26% reported problems with the accuracy of data entry. These two facets of real-time electronic data capture appear to be issues that need improvement.
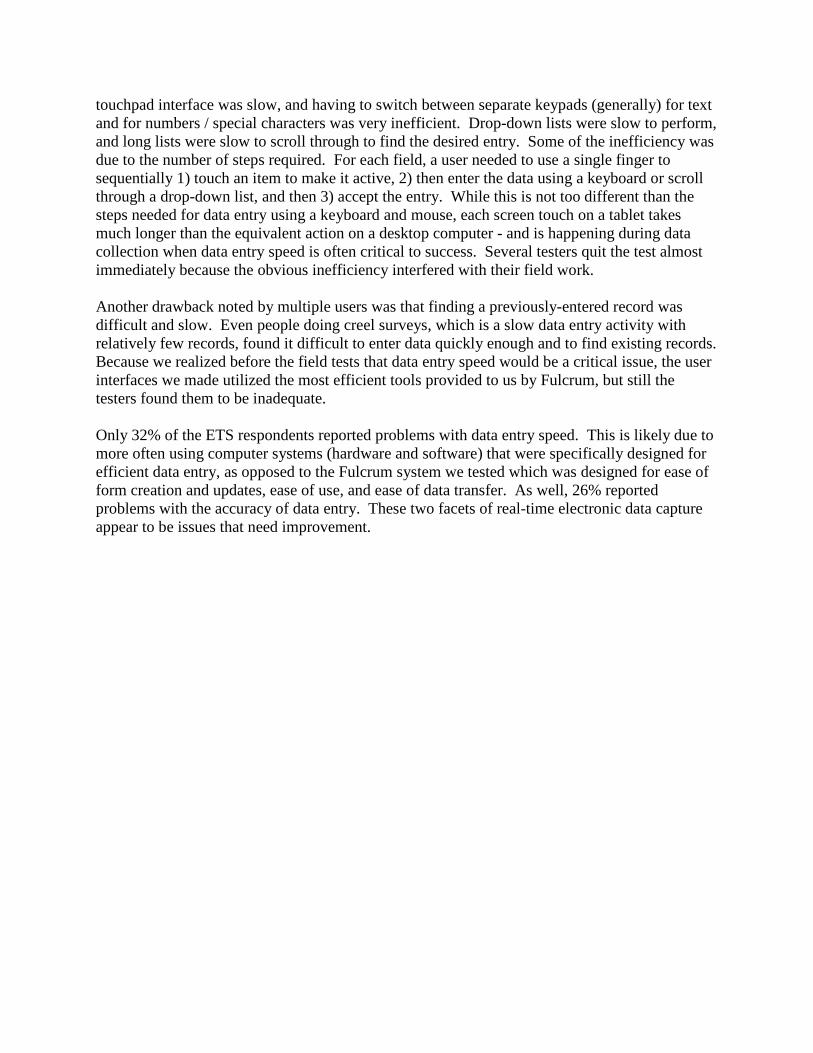
Questionnaire #2, question 8. Was view angle a problem?
For all tablet computers most users felt the view angle (angle at which the screen was visible) was sufficient. All Sony Xperia users found the view angle sufficient.
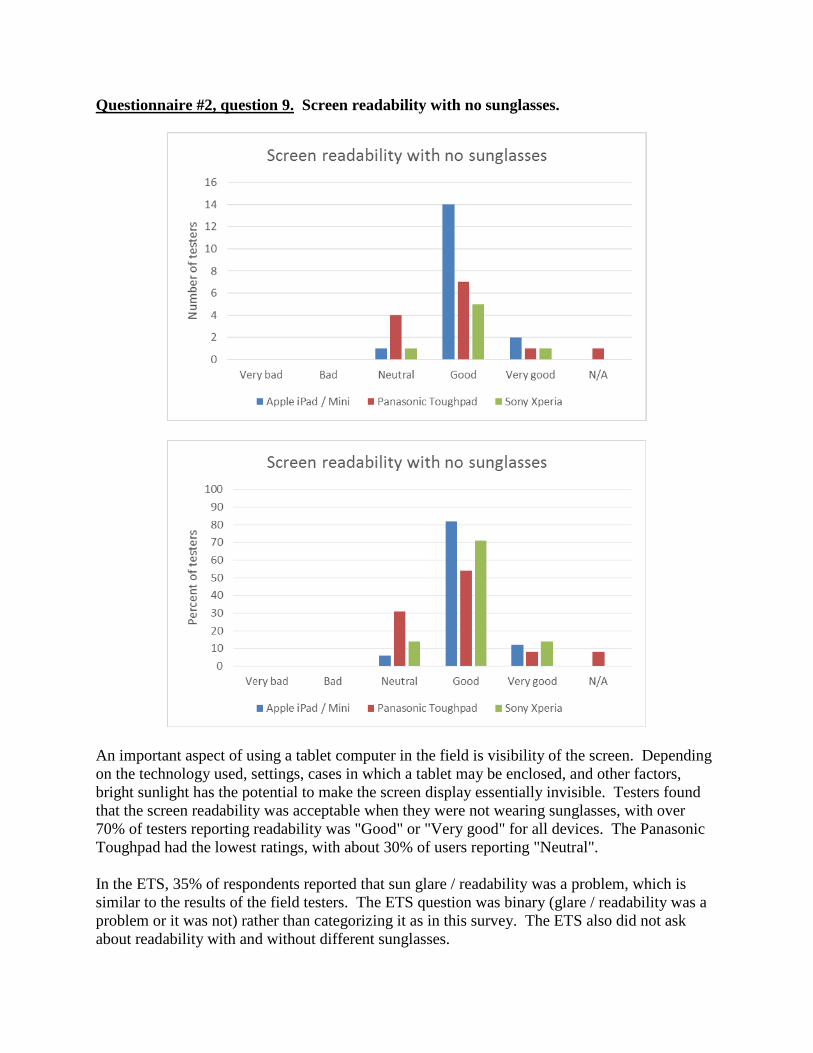
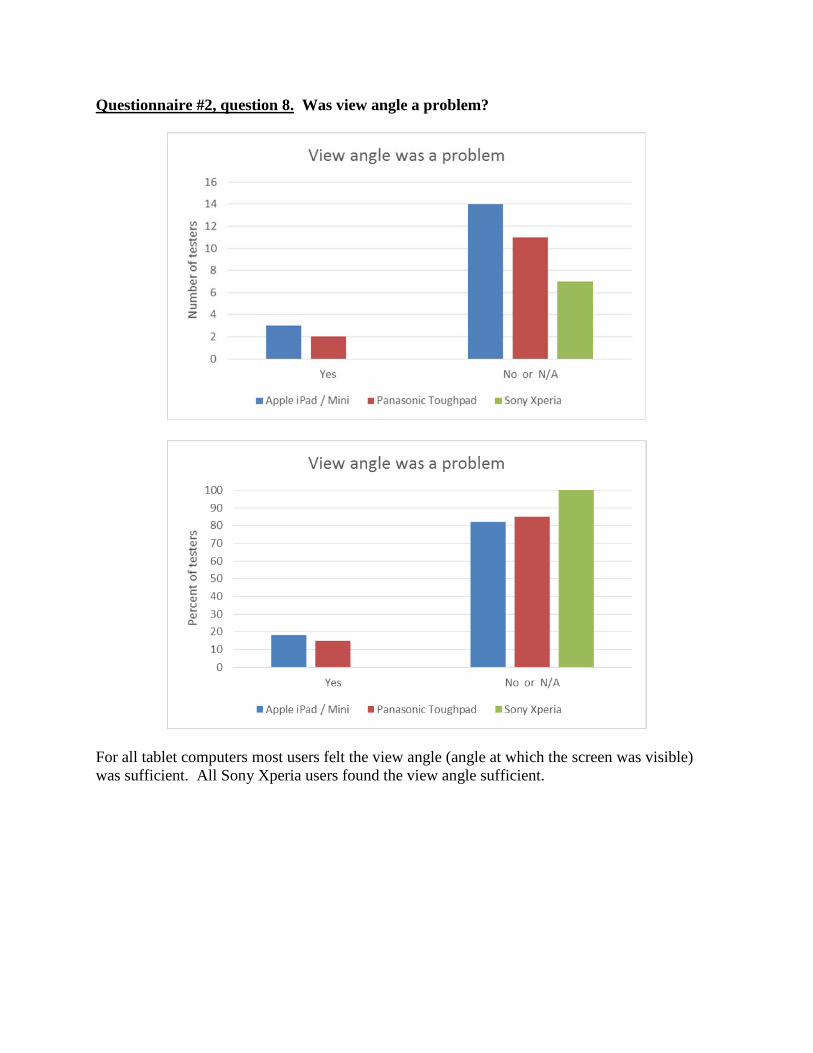
Questionnaire #2, question 9. Screen readability with no sunglasses.
An important aspect of using a tablet computer in the field is visibility of the screen. Depending on the technology used, settings, cases in which a tablet may be enclosed, and other factors, bright sunlight has the potential to make the screen display essentially invisible. Testers found that the screen readability was acceptable when they were not wearing sunglasses, with over 70% of testers reporting readability was "Good" or "Very good" for all devices. The Panasonic Toughpad had the lowest ratings, with about 30% of users reporting "Neutral". In the ETS, 35% of respondents reported that sun glare / readability was a problem, which is similar to the results of the field testers. The ETS question was binary (glare / readability was a problem or it was not) rather than categorizing it as in this survey. The ETS also did not ask about readability with and without different sunglasses.
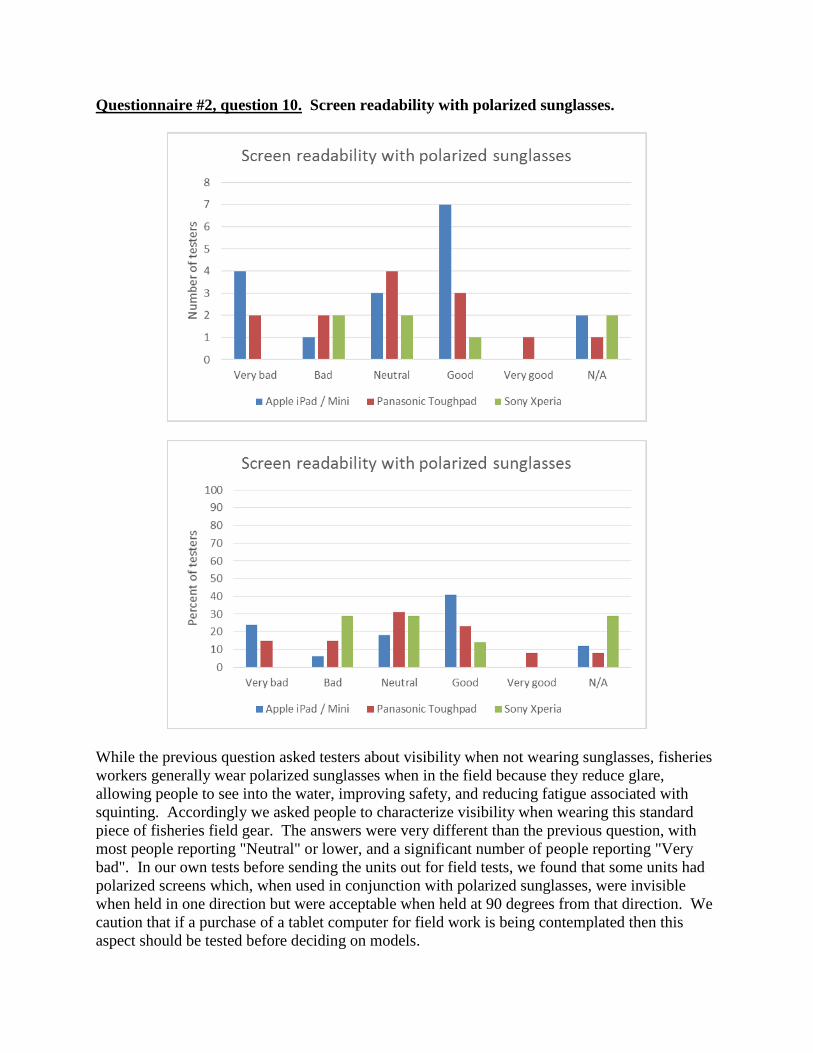
Questionnaire #2, question 10. Screen readability with polarized sunglasses.
While the previous question asked testers about visibility when not wearing sunglasses, fisheries workers generally wear polarized sunglasses when in the field because they reduce glare, allowing people to see into the water, improving safety, and reducing fatigue associated with squinting. Accordingly we asked people to characterize visibility when wearing this standard piece of fisheries field gear. The answers were very different than the previous question, with most people reporting "Neutral" or lower, and a significant number of people reporting "Very bad". In our own tests before sending the units out for field tests, we found that some units had polarized screens which, when used in conjunction with polarized sunglasses, were invisible when held in one direction but were acceptable when held at 90 degrees from that direction. We caution that if a purchase of a tablet computer for field work is being contemplated then this aspect should be tested before deciding on models.
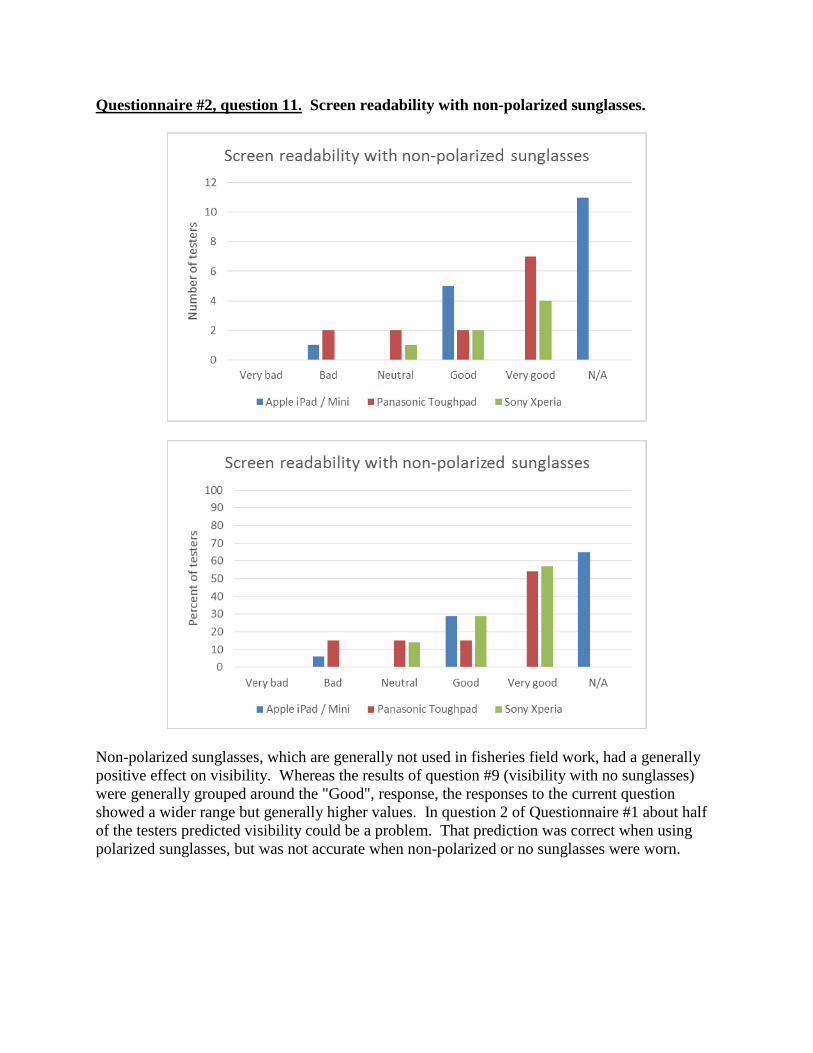
Questionnaire #2, question 11. Screen readability with non-polarized sunglasses.
Non-polarized sunglasses, which are generally not used in fisheries field work, had a generally positive effect on visibility. Whereas the results of question #9 (visibility with no sunglasses) were generally grouped around the "Good", response, the responses to the current question showed a wider range but generally higher values. In question 2 of Questionnaire #1 about half of the testers predicted visibility could be a problem. That prediction was correct when using polarized sunglasses, but was not accurate when non-polarized or no sunglasses were worn.
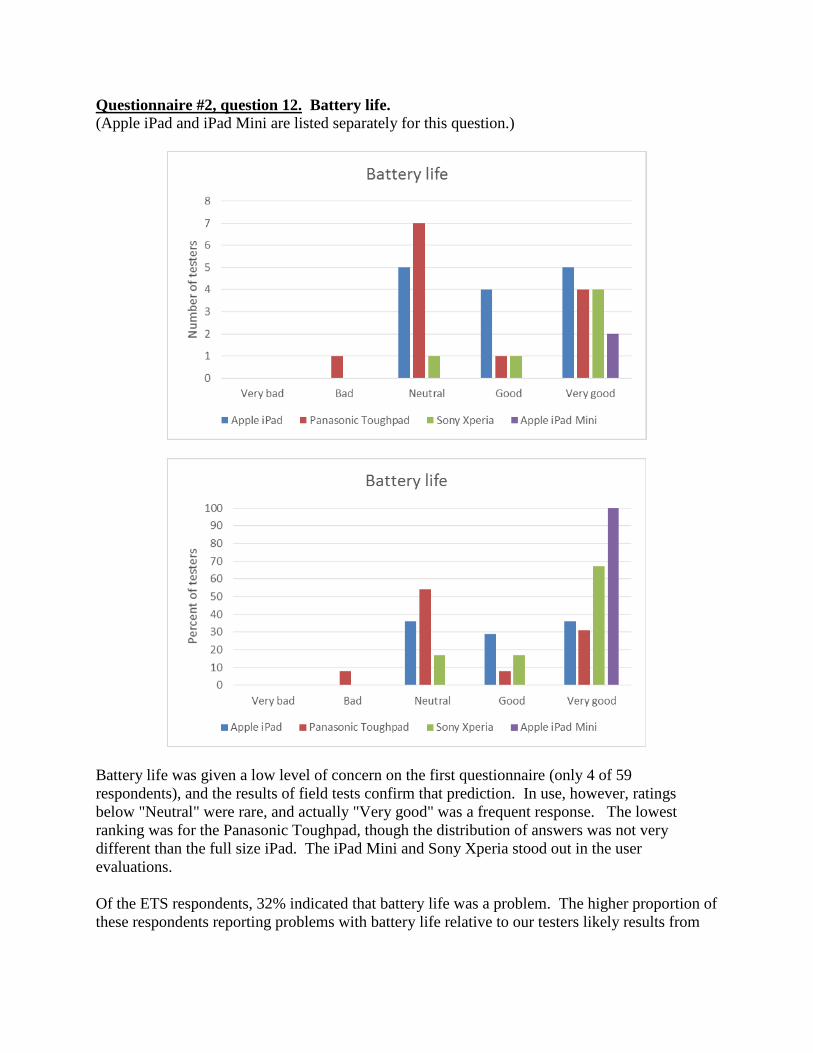
Questionnaire #2, question 12. Battery life. (Apple iPad and iPad Mini are listed separately for this question.)
Battery life was given a low level of concern on the first questionnaire (only 4 of 59 respondents), and the results of field tests confirm that prediction. In use, however, ratings below "Neutral" were rare, and actually "Very good" was a frequent response. The lowest ranking was for the Panasonic Toughpad, though the distribution of answers was not very different than the full size iPad. The iPad Mini and Sony Xperia stood out in the user evaluations. Of the ETS respondents, 32% indicated that battery life was a problem. The higher proportion of these respondents reporting problems with battery life relative to our testers likely results from
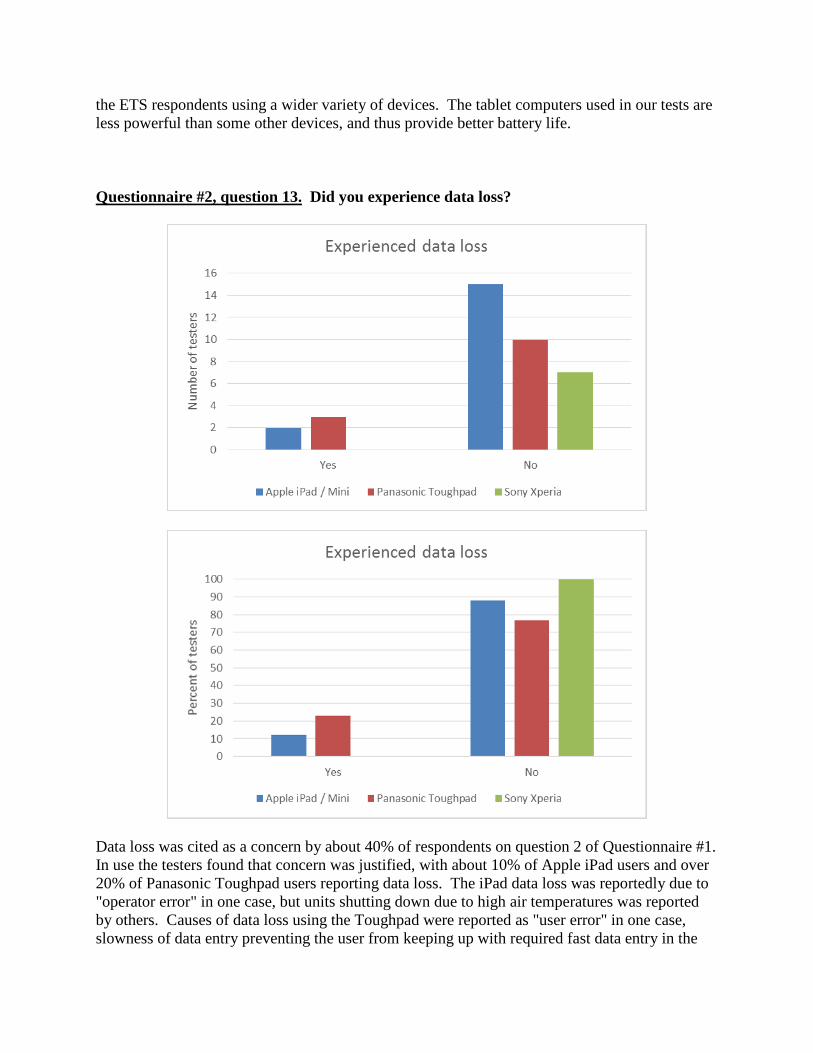
the ETS respondents using a wider variety of devices. The tablet computers used in our tests are less powerful than some other devices, and thus provide better battery life. Questionnaire #2, question 13. Did you experience data loss?
Data loss was cited as a concern by about 40% of respondents on question 2 of Questionnaire #1. In use the testers found that concern was justified, with about 10% of Apple iPad users and over 20% of Panasonic Toughpad users reporting data loss. The iPad data loss was reportedly due to "operator error" in one case, but units shutting down due to high air temperatures was reported by others. Causes of data loss using the Toughpad were reported as "user error" in one case, slowness of data entry preventing the user from keeping up with required fast data entry in the
second case, and a comments field not properly syncing in the third case. Although data loss was not common and mostly due to factors other than the units or software failing, it is a concern that should be considered by those contemplating using tablet computers for data collection. Data loss was much more frequently reported by the ETS respondents, with 41% saying they had lost data. The higher rate of reported data loss is most likely at least partially an artifact of more extensive use of these various devices than was the case in our tests. Specific reasons reported included both hardware and software issues, dropping the equipment in water (even a ruggedized and waterproof unit), failure of Bluetooth data transfer from the unit to a computer, software setups that relied on multiple users all using the same logon name, overwriting memory, difficulties interacting with peripheral devices, broken units, hot weather causing tablet computers to shut down, units ceasing to function (requiring a reboot), and several instances of unknown causes. Thus lost data, while perhaps not common, has affected many users of the various systems reported on and is a concern.
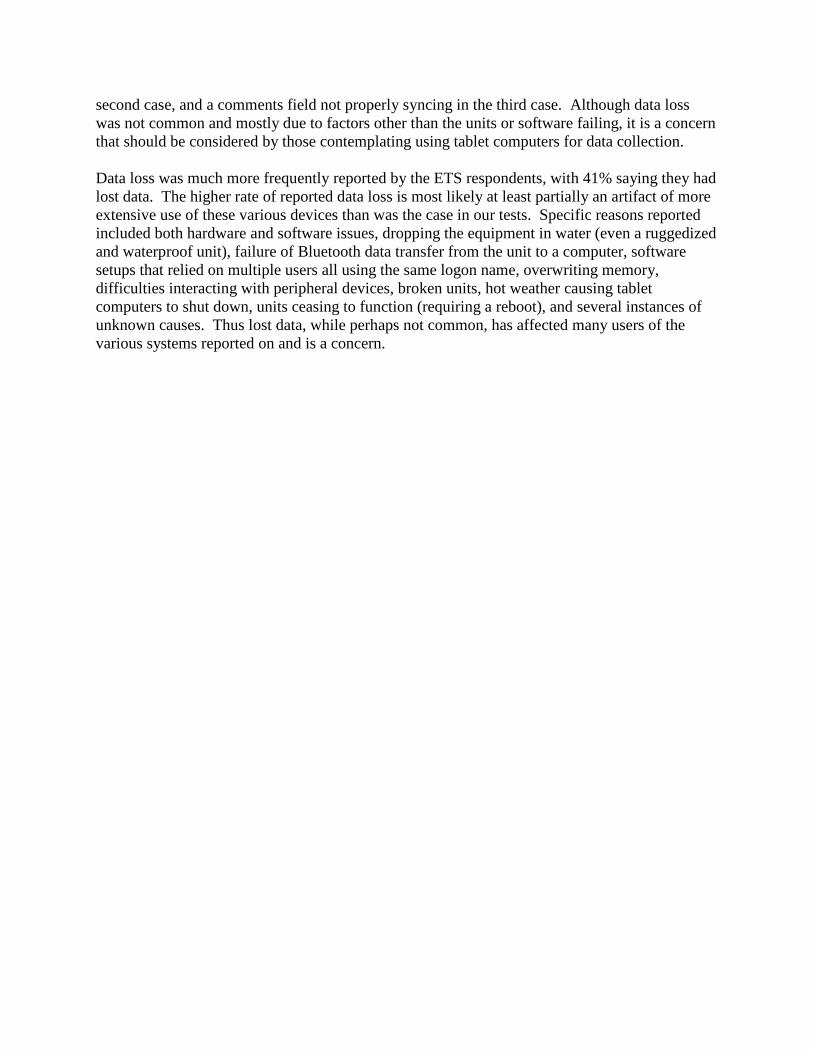
Questionnaire #2, question 14. Did you experience failure of the unit?
Failure - a cessation of functioning of the unit - occurred three times in the iPads because of the problem with heat buildup shutting down the units during use. The failures of the Panasonic and Sony tablets were actually reported incorrectly; the units did not fail, but instead the user was unable to make a connection to the Internet to sync data using these two devices. Eighteen percent (18%) of the ETS respondents reported having experienced a catastrophic failure. The higher rate is likely due to a more diverse array of hardware used, and also likely an artifact of more extensive use of these systems as compared with our testers. With roughly 1/5 of respondents having experienced unit failure, data loss due to this factor is a possibility researchers should consider when selecting equipment to use in the field.
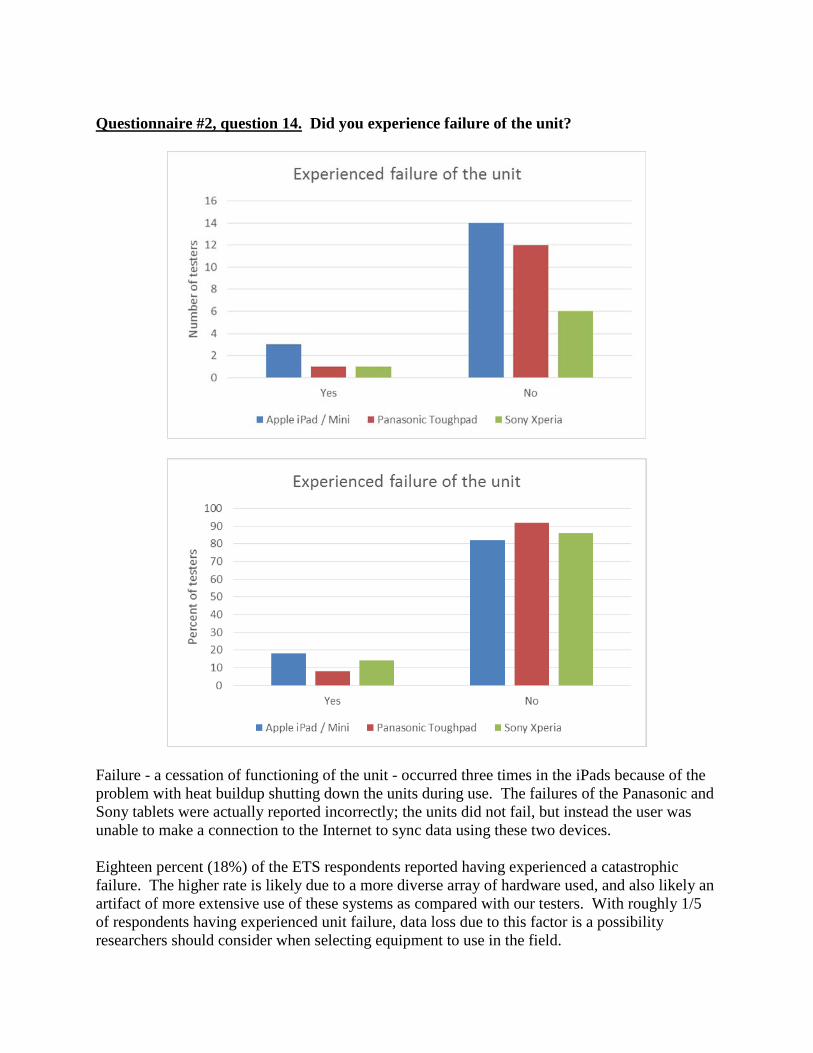
Questionnaire #2, question 15. Usability and reliability in hot weather (>80°F).
The iPads were found to shut down in hot air temperatures, resulting in interruption of field work and some data loss. The other models did not have this problem. Other functions of all tablets seemed to continue as normal.
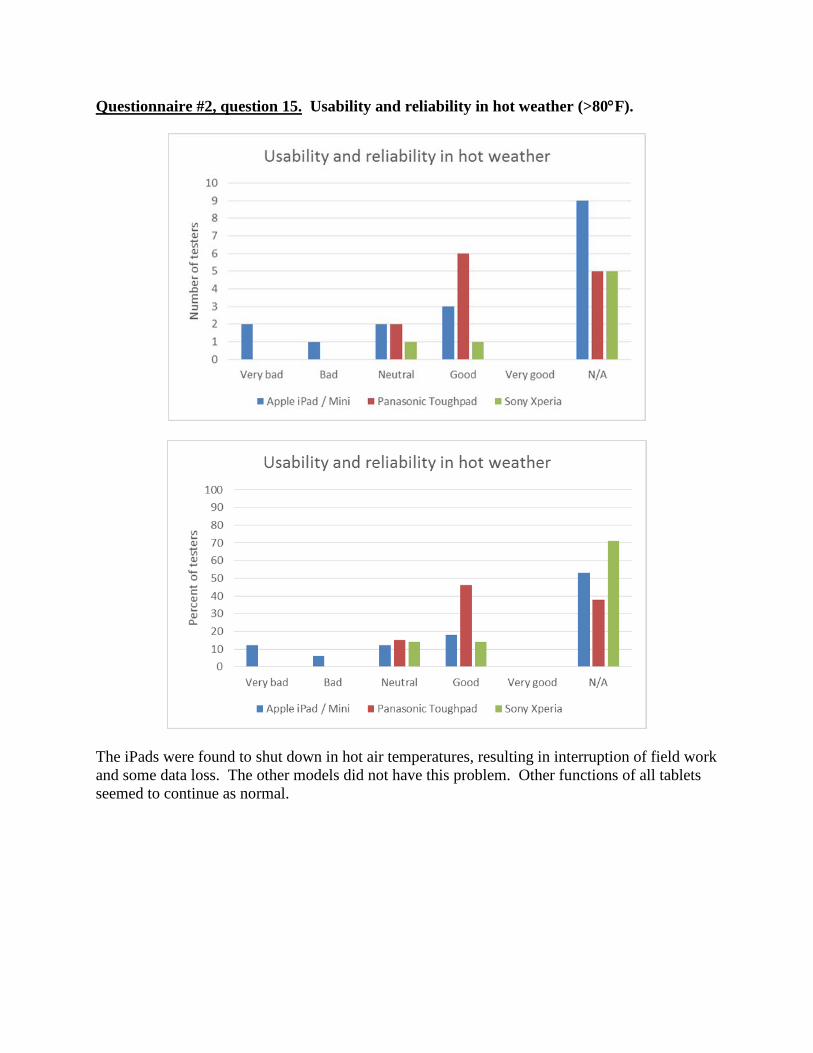
Questionnaire #2, question 16. Usability and reliability in cold weather (<40°F).
All testers who worked in cold weather were satisfied with the performance of the tablets under these conditions. While the iPads were not rated for use in temperatures below 40°F, none of the testers encountered difficulties in those temperatures. The widespread use of touchscreen cellular smart telephones confirms that this is likely not a problem.
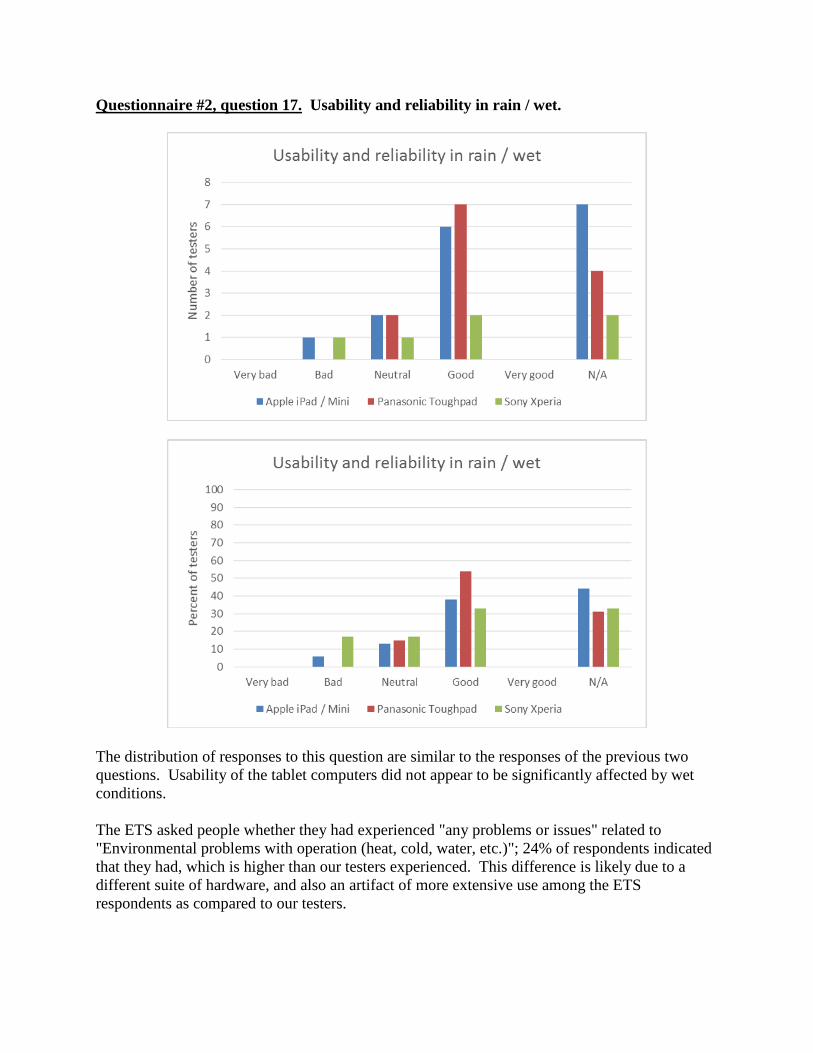
Questionnaire #2, question 17. Usability and reliability in rain / wet.
The distribution of responses to this question are similar to the responses of the previous two questions. Usability of the tablet computers did not appear to be significantly affected by wet conditions. The ETS asked people whether they had experienced "any problems or issues" related to "Environmental problems with operation (heat, cold, water, etc.)"; 24% of respondents indicated that they had, which is higher than our testers experienced. This difference is likely due to a different suite of hardware, and also an artifact of more extensive use among the ETS respondents as compared to our testers.
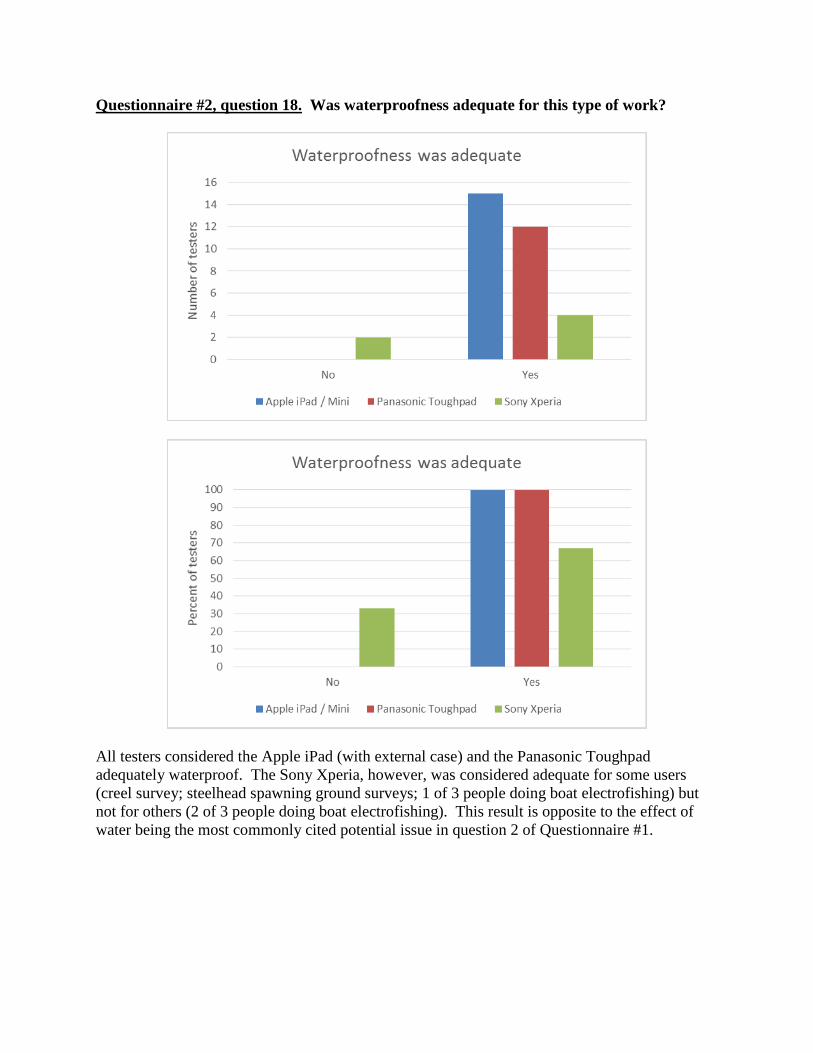
Questionnaire #2, question 18. Was waterproofness adequate for this type of work?
All testers considered the Apple iPad (with external case) and the Panasonic Toughpad adequately waterproof. The Sony Xperia, however, was considered adequate for some users (creel survey; steelhead spawning ground surveys; 1 of 3 people doing boat electrofishing) but not for others (2 of 3 people doing boat electrofishing). This result is opposite to the effect of water being the most commonly cited potential issue in question 2 of Questionnaire #1.

Questionnaire #2, question 19. Effect on usability of dust / dirt / fish slime, etc. (other than water alone).
Only one tester rated a tablet lower than "neutral". It appears that the testers did not experience problems related to dirt or other impurities on the touchscreen. This result is opposite to the effect of dust and other contaminants being one of the most commonly cited potential issues in question 2 of Questionnaire #1.
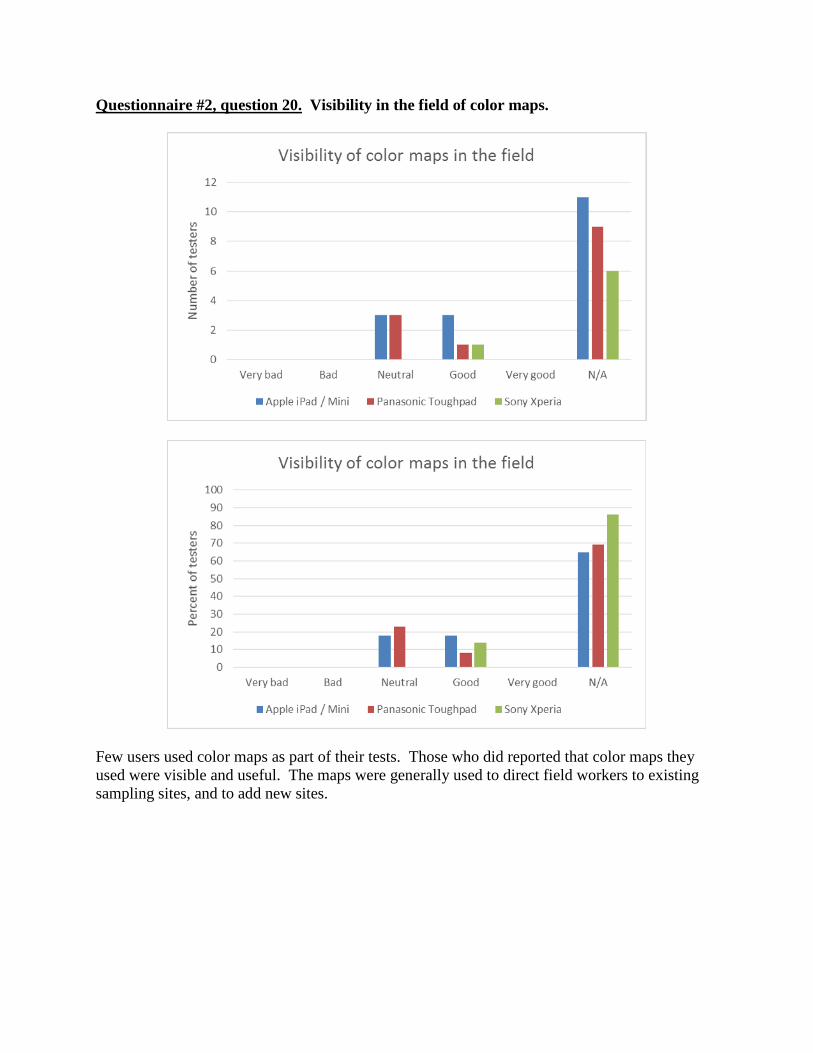
Questionnaire #2, question 20. Visibility in the field of color maps.
Few users used color maps as part of their tests. Those who did reported that color maps they used were visible and useful. The maps were generally used to direct field workers to existing sampling sites, and to add new sites.
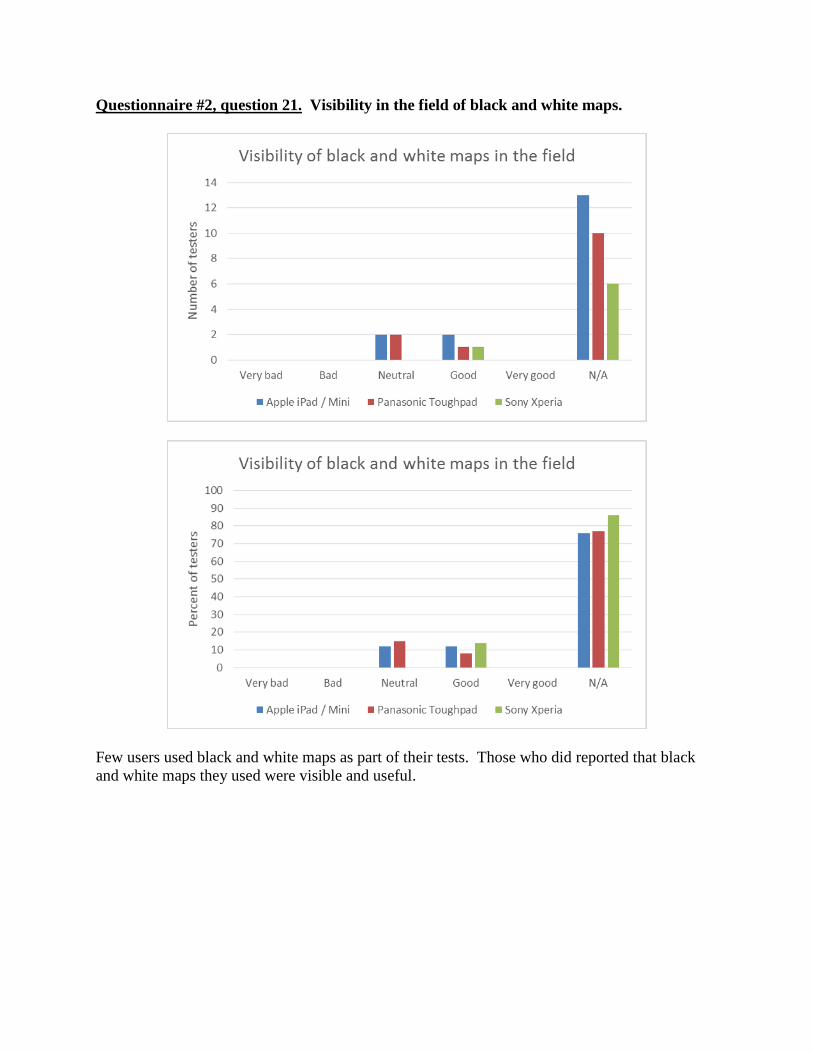
Questionnaire #2, question 21. Visibility in the field of black and white maps.
Few users used black and white maps as part of their tests. Those who did reported that black and white maps they used were visible and useful.
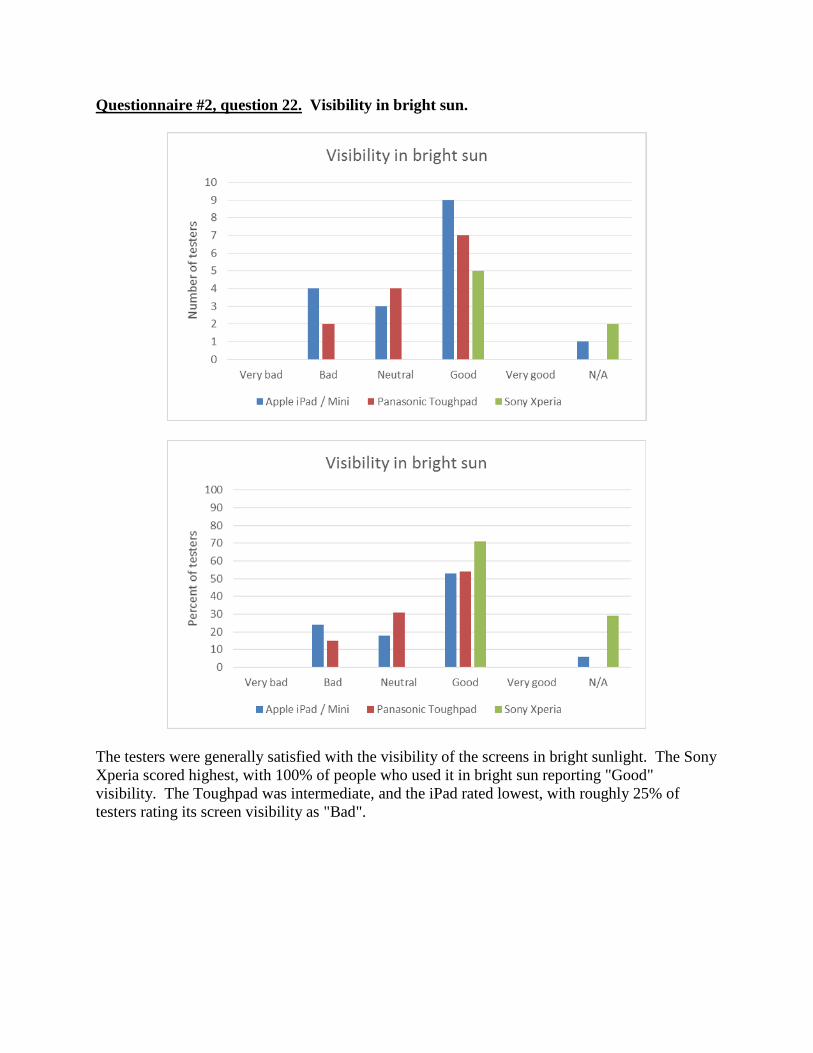
Questionnaire #2, question 22. Visibility in bright sun.
The testers were generally satisfied with the visibility of the screens in bright sunlight. The Sony Xperia scored highest, with 100% of people who used it in bright sun reporting "Good" visibility. The Toughpad was intermediate, and the iPad rated lowest, with roughly 25% of testers rating its screen visibility as "Bad".
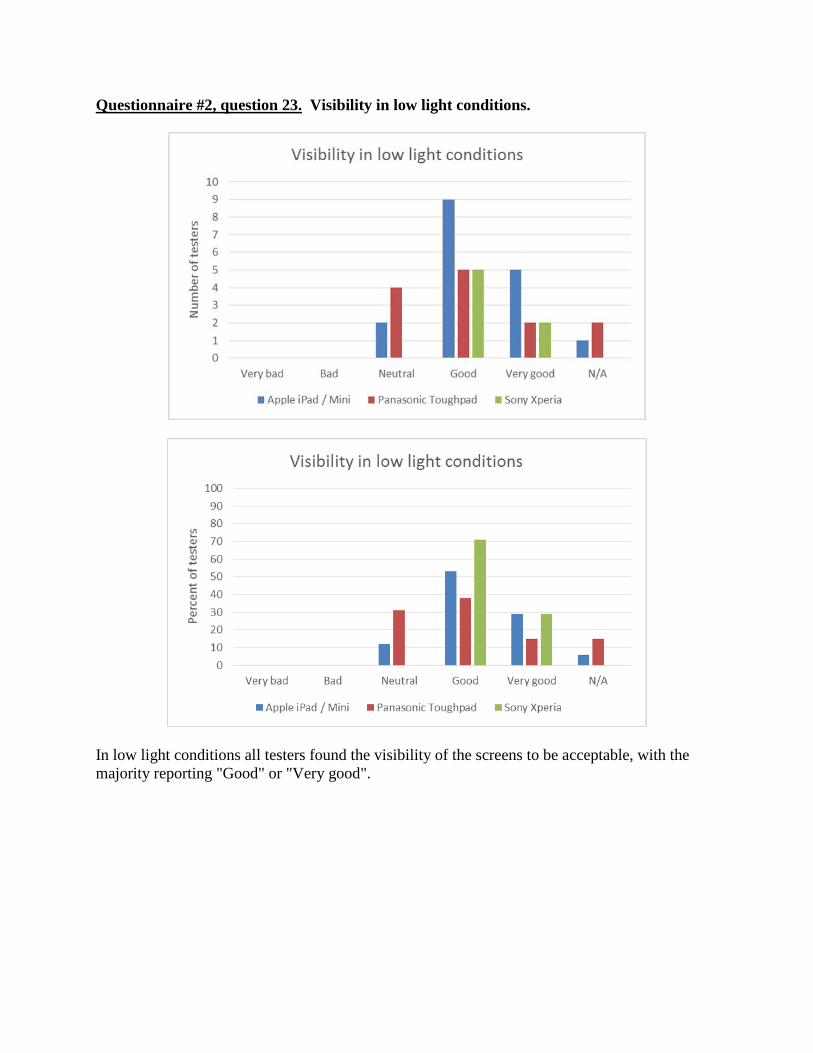
Questionnaire #2, question 23. Visibility in low light conditions.
In low light conditions all testers found the visibility of the screens to be acceptable, with the majority reporting "Good" or "Very good".
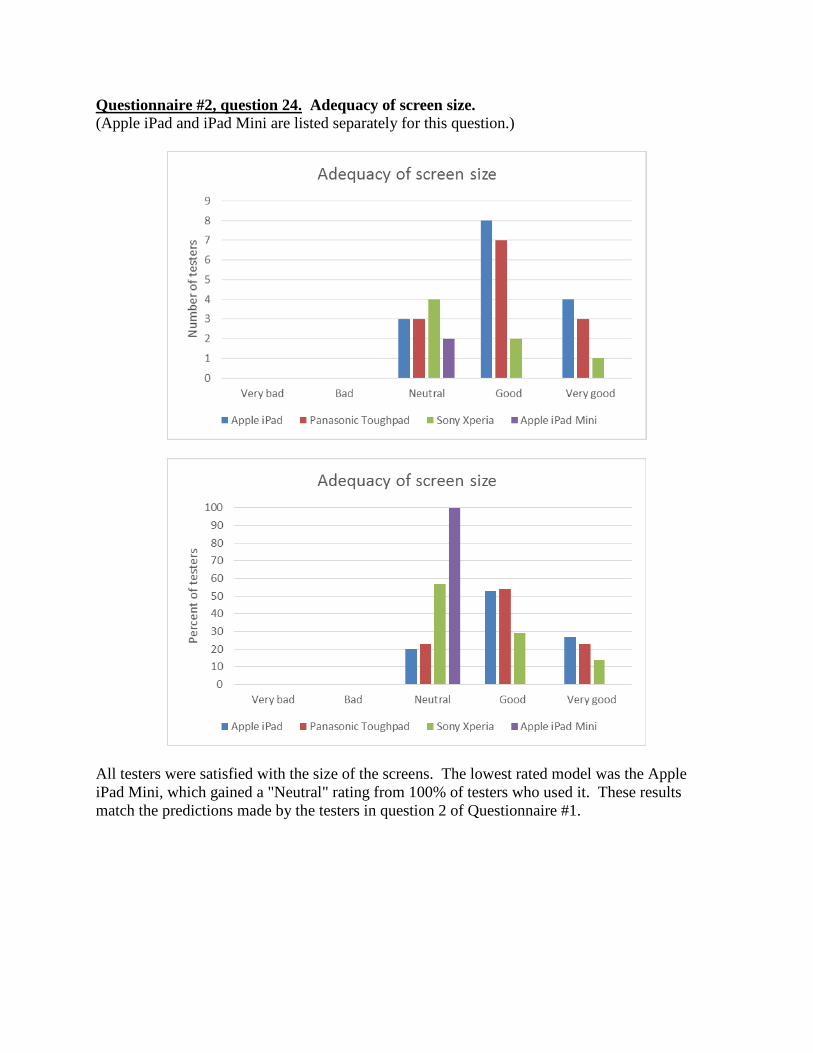
Questionnaire #2, question 24. Adequacy of screen size. (Apple iPad and iPad Mini are listed separately for this question.)
All testers were satisfied with the size of the screens. The lowest rated model was the Apple iPad Mini, which gained a "Neutral" rating from 100% of testers who used it. These results match the predictions made by the testers in question 2 of Questionnaire #1.
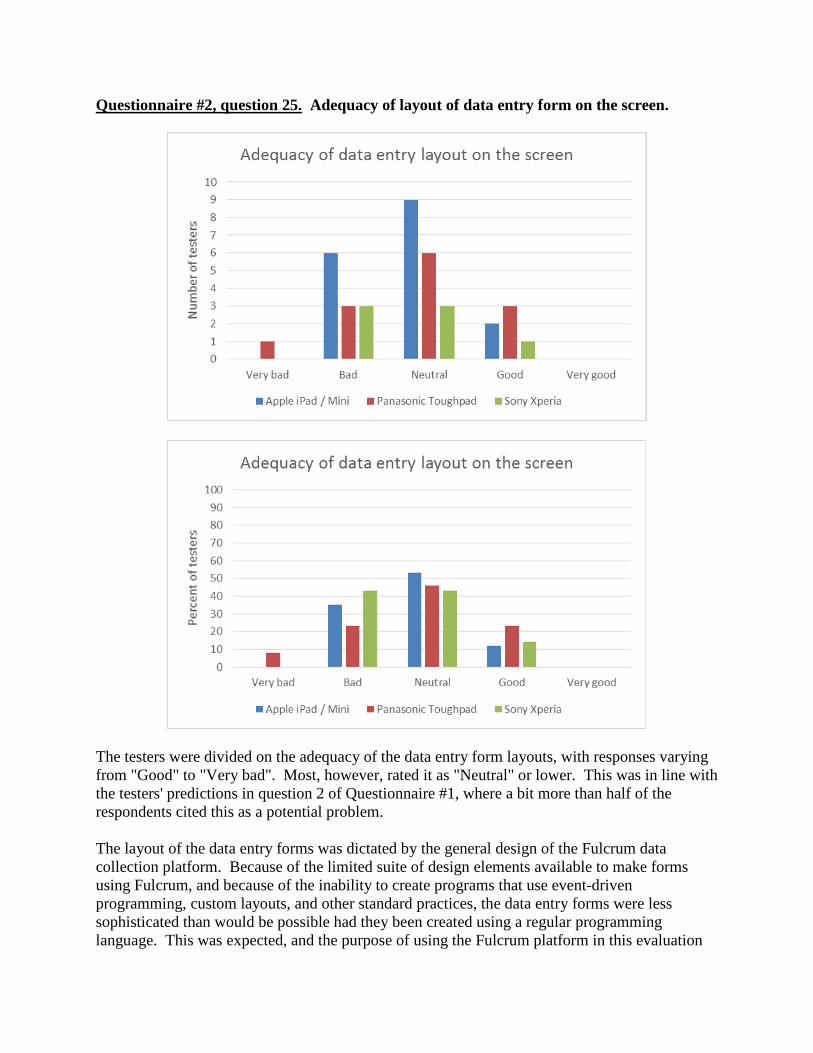
Questionnaire #2, question 25. Adequacy of layout of data entry form on the screen.
The testers were divided on the adequacy of the data entry form layouts, with responses varying from "Good" to "Very bad". Most, however, rated it as "Neutral" or lower. This was in line with the testers' predictions in question 2 of Questionnaire #1, where a bit more than half of the respondents cited this as a potential problem. The layout of the data entry forms was dictated by the general design of the Fulcrum data collection platform. Because of the limited suite of design elements available to make forms using Fulcrum, and because of the inability to create programs that use event-driven programming, custom layouts, and other standard practices, the data entry forms were less sophisticated than would be possible had they been created using a regular programming language. This was expected, and the purpose of using the Fulcrum platform in this evaluation
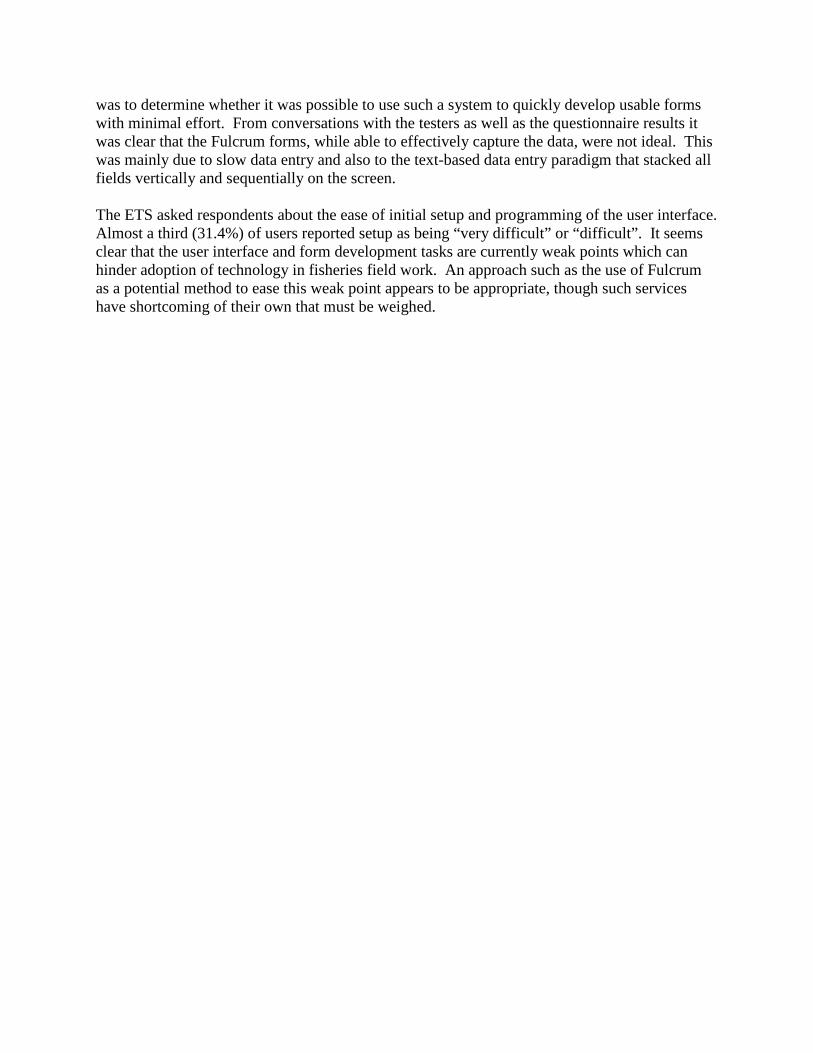
was to determine whether it was possible to use such a system to quickly develop usable forms with minimal effort. From conversations with the testers as well as the questionnaire results it was clear that the Fulcrum forms, while able to effectively capture the data, were not ideal. This was mainly due to slow data entry and also to the text-based data entry paradigm that stacked all fields vertically and sequentially on the screen. The ETS asked respondents about the ease of initial setup and programming of the user interface. Almost a third (31.4%) of users reported setup as being “very difficult” or “difficult”. It seems clear that the user interface and form development tasks are currently weak points which can hinder adoption of technology in fisheries field work. An approach such as the use of Fulcrum as a potential method to ease this weak point appears to be appropriate, though such services have shortcoming of their own that must be weighed.
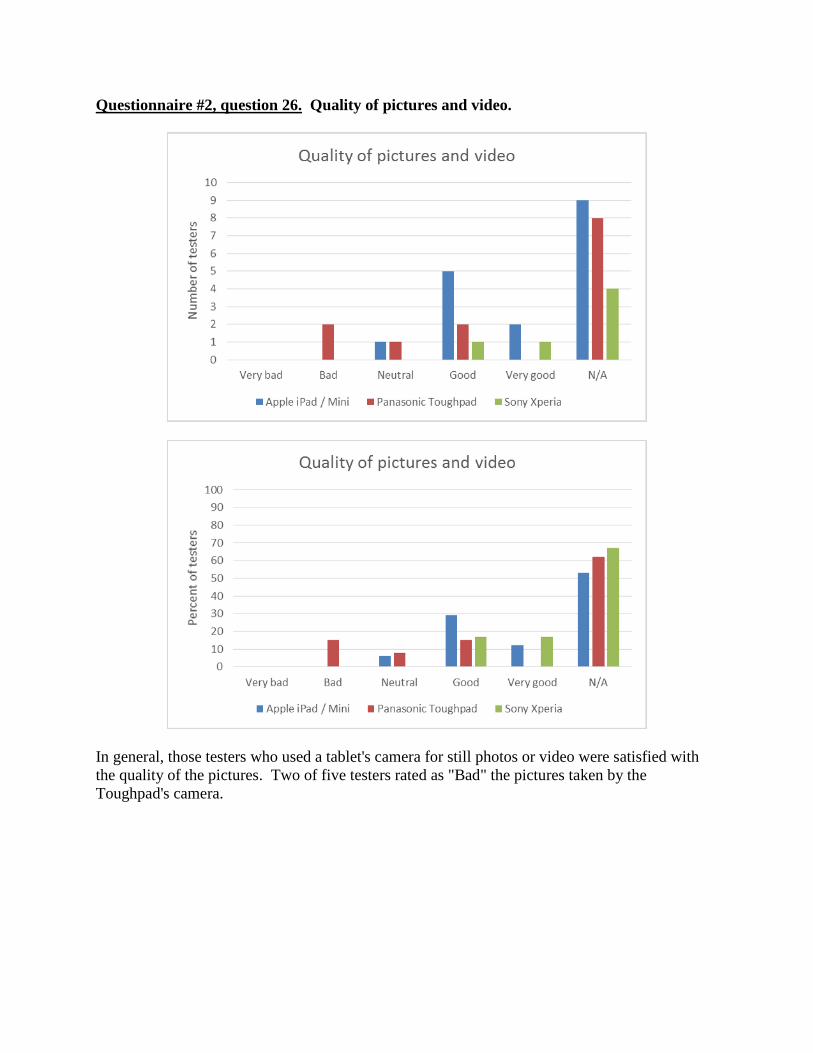
Questionnaire #2, question 26. Quality of pictures and video.
In general, those testers who used a tablet's camera for still photos or video were satisfied with the quality of the pictures. Two of five testers rated as "Bad" the pictures taken by the Toughpad's camera.
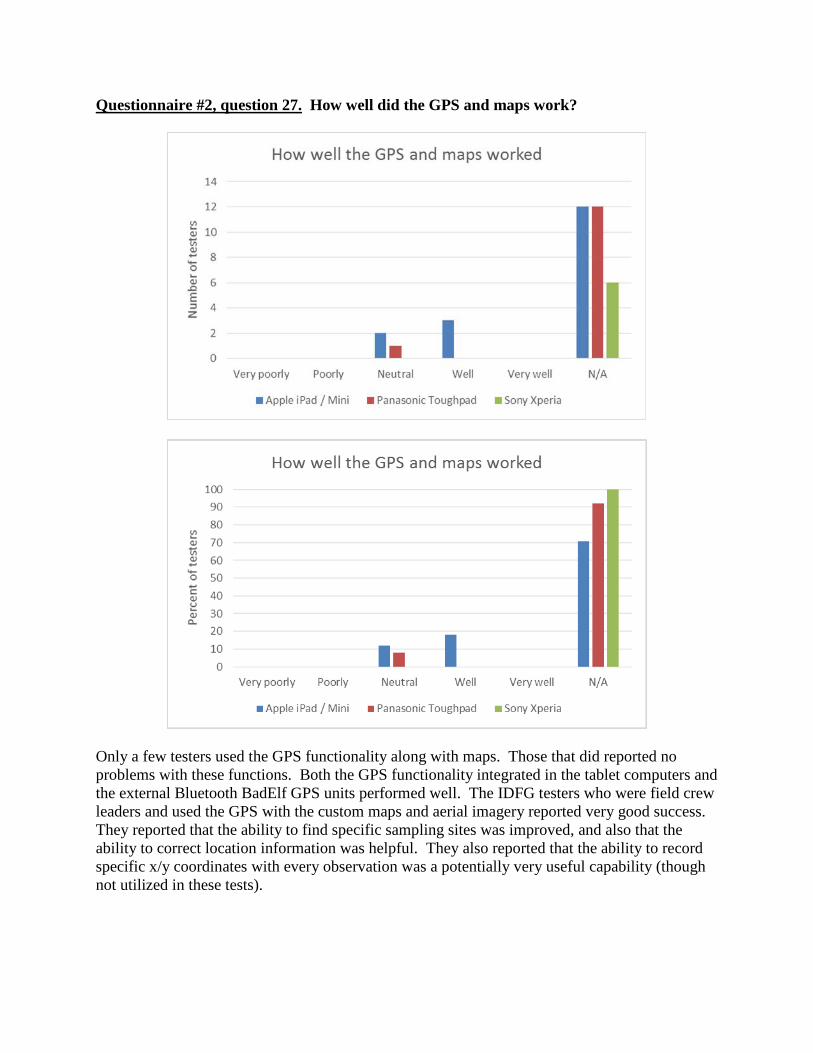
Questionnaire #2, question 27. How well did the GPS and maps work?
Only a few testers used the GPS functionality along with maps. Those that did reported no problems with these functions. Both the GPS functionality integrated in the tablet computers and the external Bluetooth BadElf GPS units performed well. The IDFG testers who were field crew leaders and used the GPS with the custom maps and aerial imagery reported very good success. They reported that the ability to find specific sampling sites was improved, and also that the ability to correct location information was helpful. They also reported that the ability to record specific x/y coordinates with every observation was a potentially very useful capability (though not utilized in these tests).
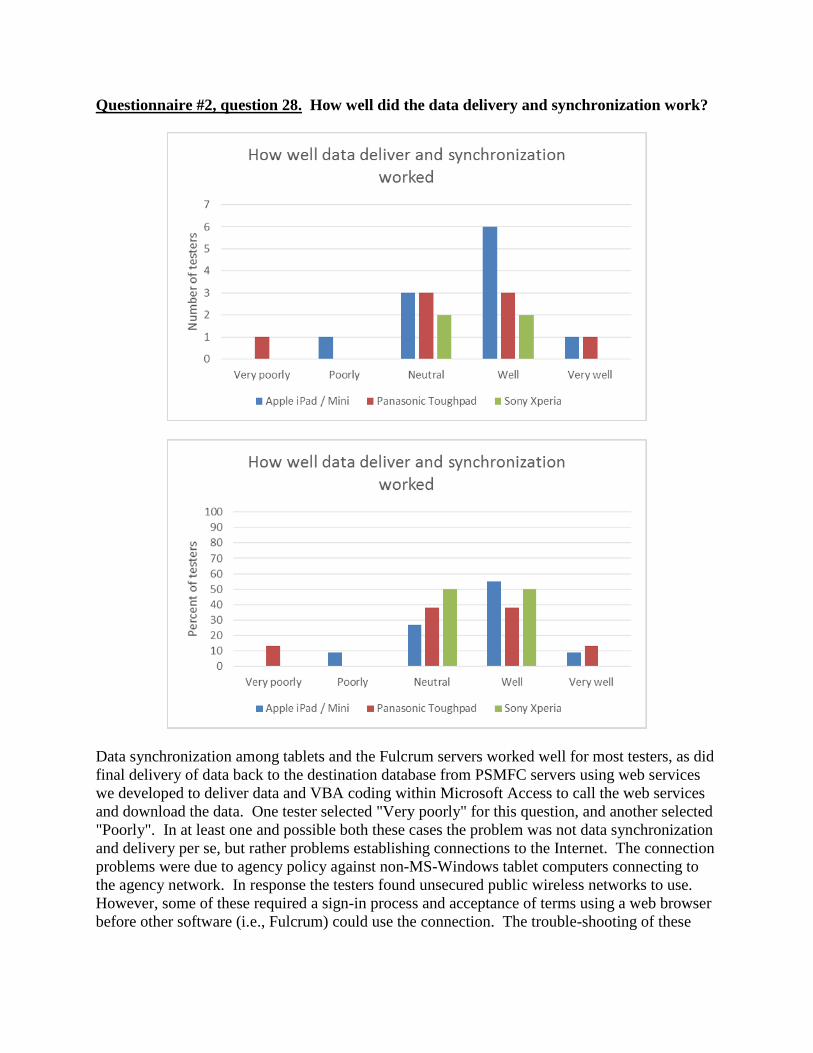
Questionnaire #2, question 28. How well did the data delivery and synchronization work?
Data synchronization among tablets and the Fulcrum servers worked well for most testers, as did final delivery of data back to the destination database from PSMFC servers using web services we developed to deliver data and VBA coding within Microsoft Access to call the web services and download the data. One tester selected "Very poorly" for this question, and another selected "Poorly". In at least one and possible both these cases the problem was not data synchronization and delivery per se, but rather problems establishing connections to the Internet. The connection problems were due to agency policy against non-MS-Windows tablet computers connecting to the agency network. In response the testers found unsecured public wireless networks to use. However, some of these required a sign-in process and acceptance of terms using a web browser before other software (i.e., Fulcrum) could use the connection. The trouble-shooting of these
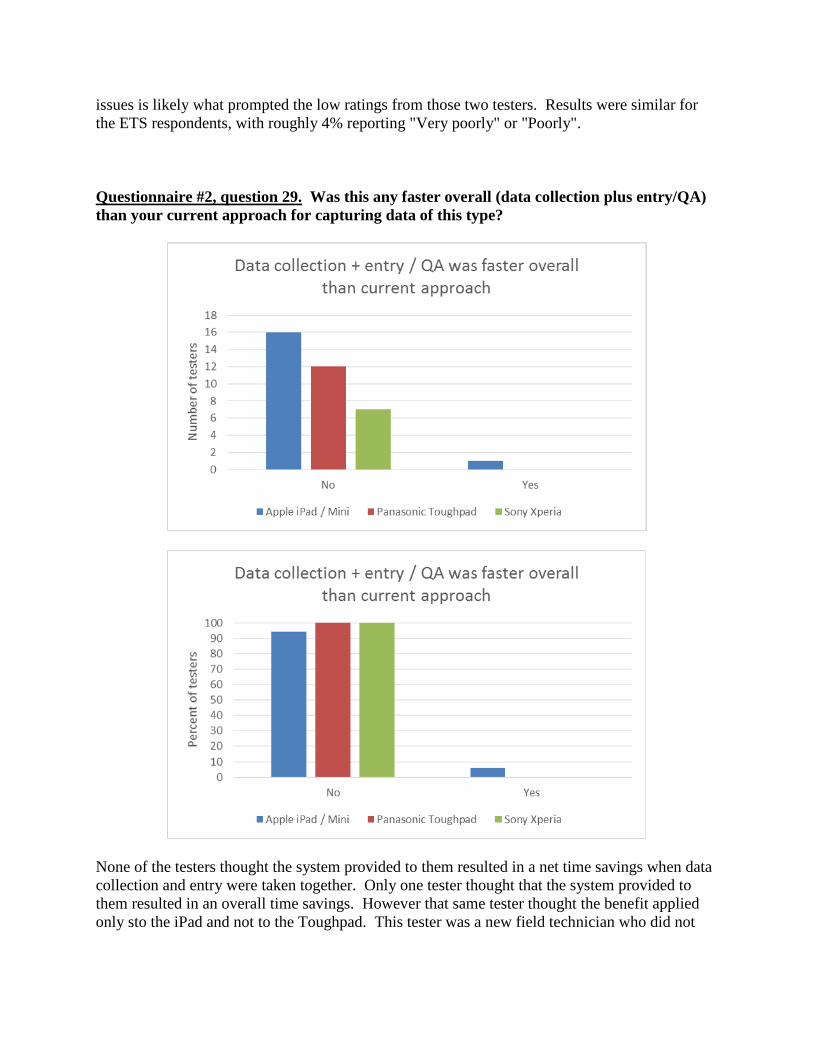
issues is likely what prompted the low ratings from those two testers. Results were similar for the ETS respondents, with roughly 4% reporting "Very poorly" or "Poorly". Questionnaire #2, question 29. Was this any faster overall (data collection plus entry/QA) than your current approach for capturing data of this type?
None of the testers thought the system provided to them resulted in a net time savings when data collection and entry were taken together. Only one tester thought that the system provided to them resulted in an overall time savings. However that same tester thought the benefit applied only sto the iPad and not to the Toughpad. This tester was a new field technician who did not
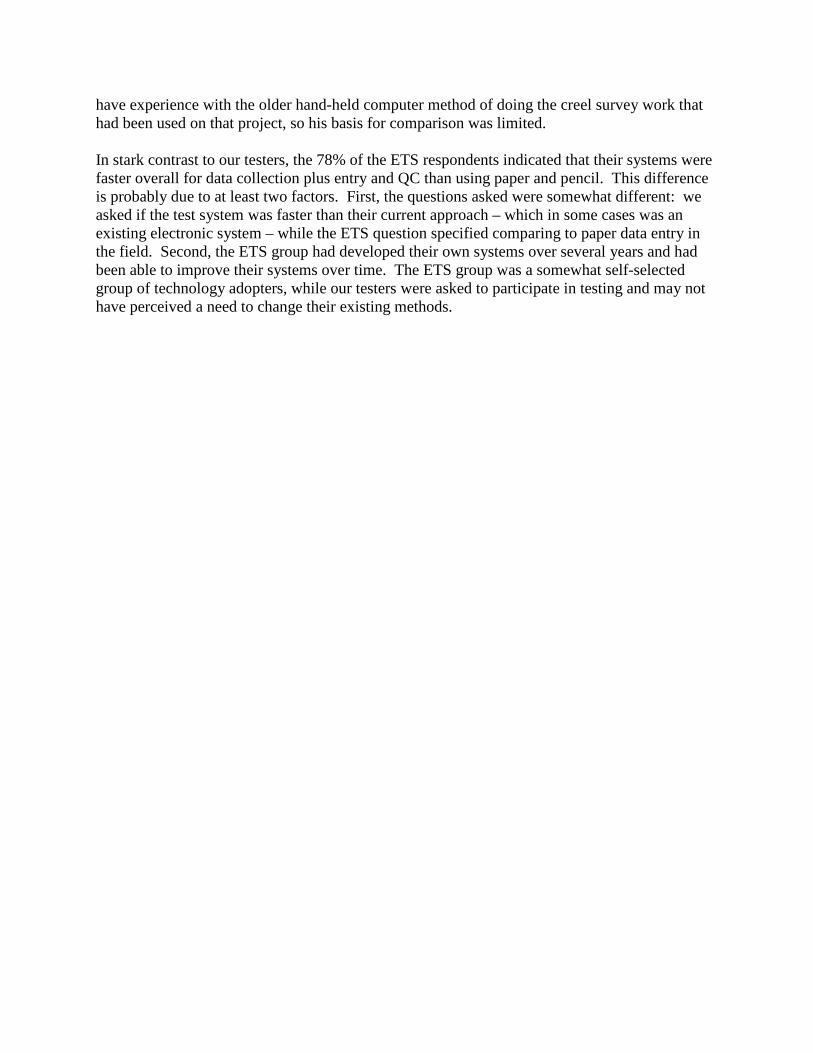
have experience with the older hand-held computer method of doing the creel survey work that had been used on that project, so his basis for comparison was limited. In stark contrast to our testers, the 78% of the ETS respondents indicated that their systems were faster overall for data collection plus entry and QC than using paper and pencil. This difference is probably due to at least two factors. First, the questions asked were somewhat different: we asked if the test system was faster than their current approach – which in some cases was an existing electronic system – while the ETS question specified comparing to paper data entry in the field. Second, the ETS group had developed their own systems over several years and had been able to improve their systems over time. The ETS group was a somewhat self-selected group of technology adopters, while our testers were asked to participate in testing and may not have perceived a need to change their existing methods.
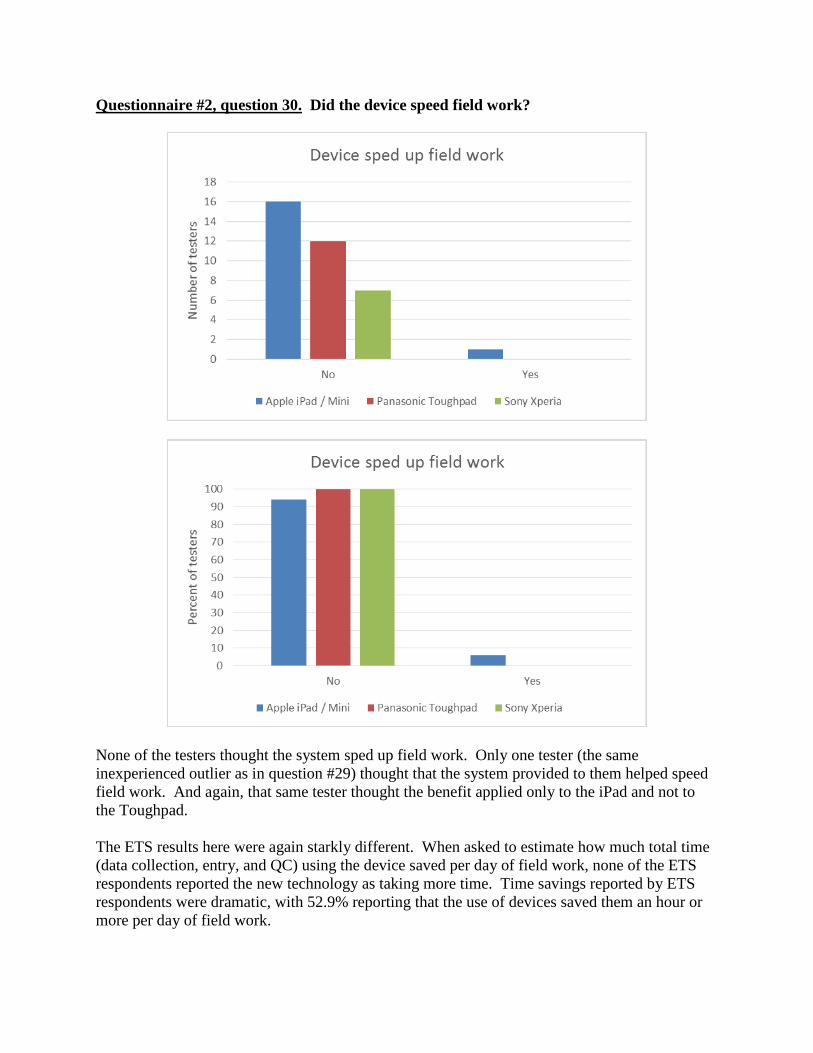
Questionnaire #2, question 30. Did the device speed field work?
None of the testers thought the system sped up field work. Only one tester (the same inexperienced outlier as in question #29) thought that the system provided to them helped speed field work. And again, that same tester thought the benefit applied only to the iPad and not to the Toughpad. The ETS results here were again starkly different. When asked to estimate how much total time (data collection, entry, and QC) using the device saved per day of field work, none of the ETS respondents reported the new technology as taking more time. Time savings reported by ETS respondents were dramatic, with 52.9% reporting that the use of devices saved them an hour or more per day of field work.
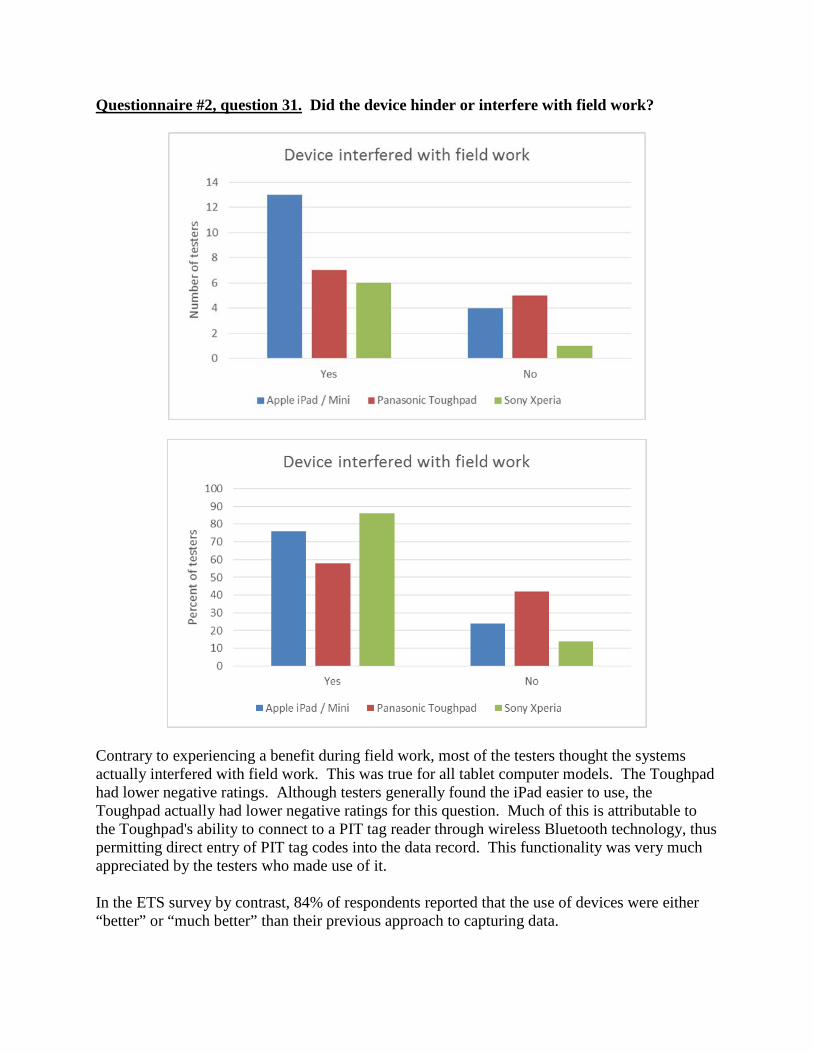
Questionnaire #2, question 31. Did the device hinder or interfere with field work?
Contrary to experiencing a benefit during field work, most of the testers thought the systems actually interfered with field work. This was true for all tablet computer models. The Toughpad had lower negative ratings. Although testers generally found the iPad easier to use, the Toughpad actually had lower negative ratings for this question. Much of this is attributable to the Toughpad's ability to connect to a PIT tag reader through wireless Bluetooth technology, thus permitting direct entry of PIT tag codes into the data record. This functionality was very much appreciated by the testers who made use of it. In the ETS survey by contrast, 84% of respondents reported that the use of devices were either “better” or “much better” than their previous approach to capturing data.
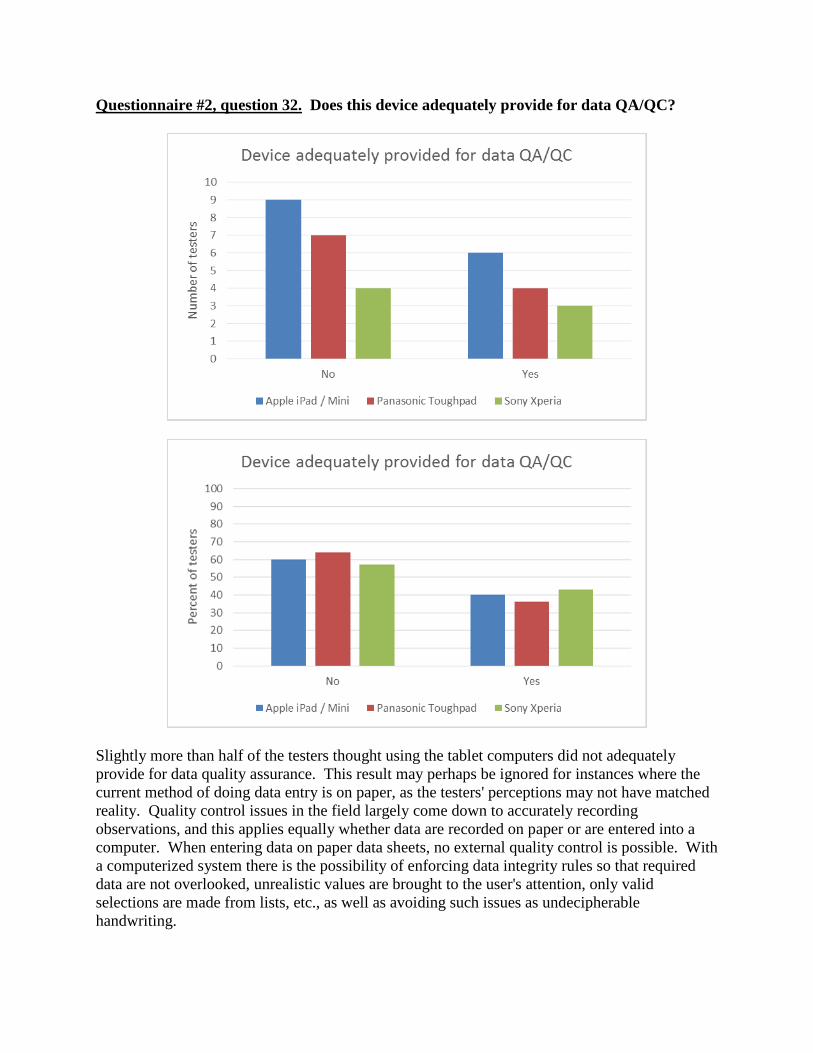
Questionnaire #2, question 32. Does this device adequately provide for data QA/QC?
Slightly more than half of the testers thought using the tablet computers did not adequately provide for data quality assurance. This result may perhaps be ignored for instances where the current method of doing data entry is on paper, as the testers' perceptions may not have matched reality. Quality control issues in the field largely come down to accurately recording observations, and this applies equally whether data are recorded on paper or are entered into a computer. When entering data on paper data sheets, no external quality control is possible. With a computerized system there is the possibility of enforcing data integrity rules so that required data are not overlooked, unrealistic values are brought to the user's attention, only valid selections are made from lists, etc., as well as avoiding such issues as undecipherable handwriting.
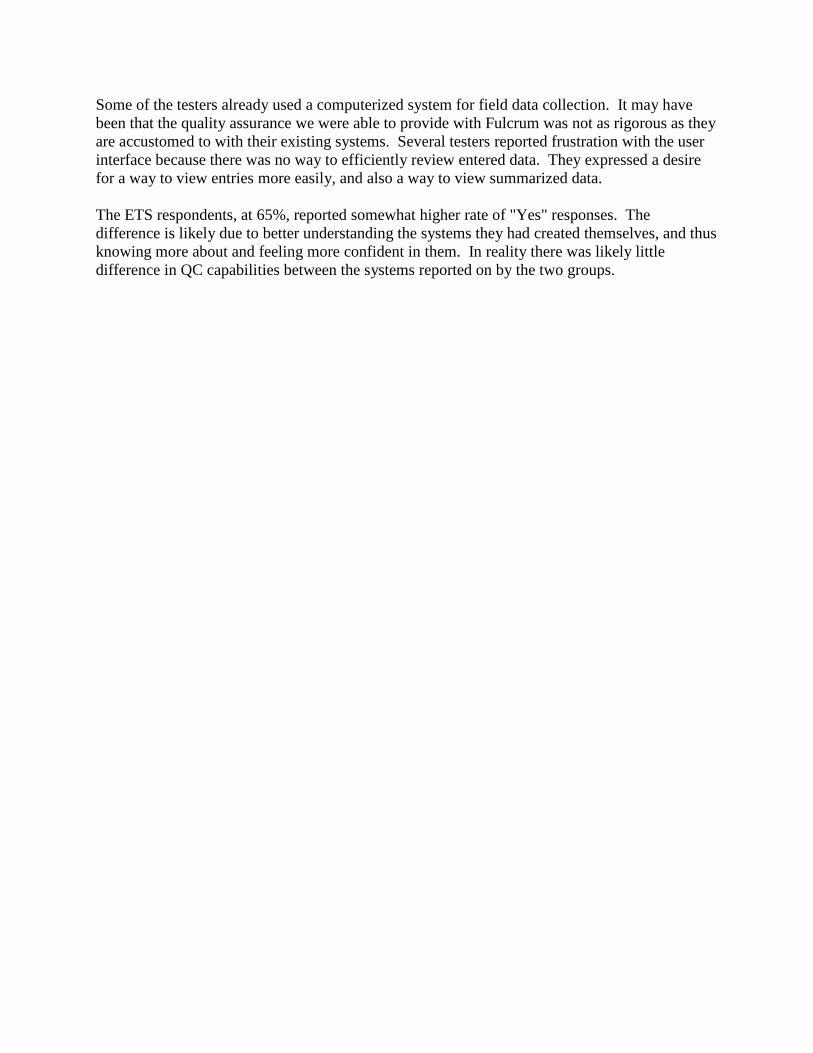
Some of the testers already used a computerized system for field data collection. It may have been that the quality assurance we were able to provide with Fulcrum was not as rigorous as they are accustomed to with their existing systems. Several testers reported frustration with the user interface because there was no way to efficiently review entered data. They expressed a desire for a way to view entries more easily, and also a way to view summarized data. The ETS respondents, at 65%, reported somewhat higher rate of "Yes" responses. The difference is likely due to better understanding the systems they had created themselves, and thus knowing more about and feeling more confident in them. In reality there was likely little difference in QC capabilities between the systems reported on by the two groups.
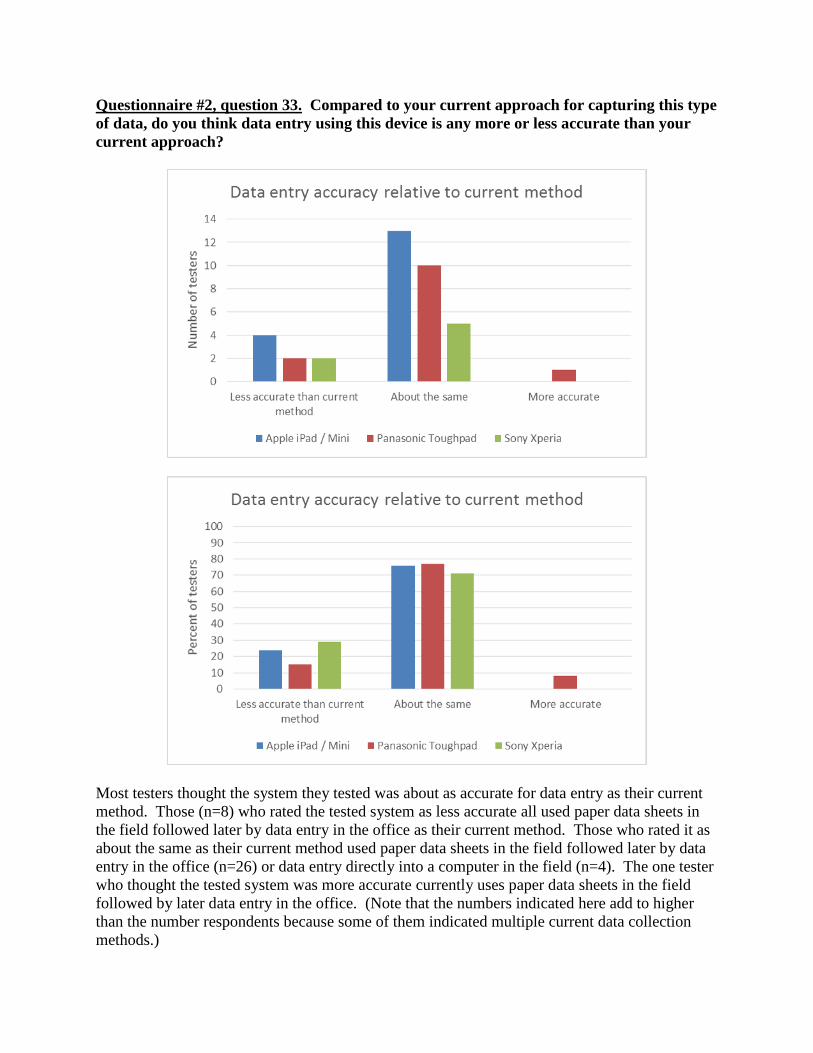
Questionnaire #2, question 33. Compared to your current approach for capturing this type of data, do you think data entry using this device is any more or less accurate than your current approach?
Most testers thought the system they tested was about as accurate for data entry as their current method. Those (n=8) who rated the tested system as less accurate all used paper data sheets in the field followed later by data entry in the office as their current method. Those who rated it as about the same as their current method used paper data sheets in the field followed later by data entry in the office (n=26) or data entry directly into a computer in the field (n=4). The one tester who thought the tested system was more accurate currently uses paper data sheets in the field followed by later data entry in the office. (Note that the numbers indicated here add to higher than the number respondents because some of them indicated multiple current data collection methods.)
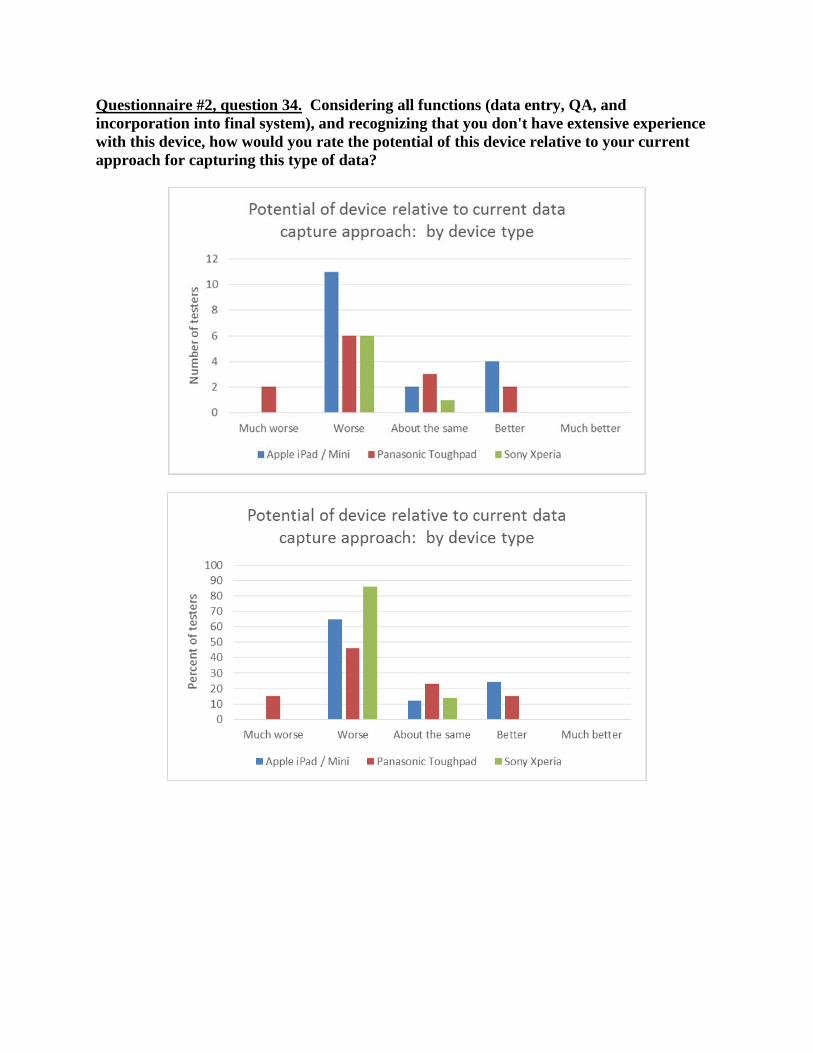
Questionnaire #2, question 34. Considering all functions (data entry, QA, and incorporation into final system), and recognizing that you don't have extensive experience with this device, how would you rate the potential of this device relative to your current approach for capturing this type of data?
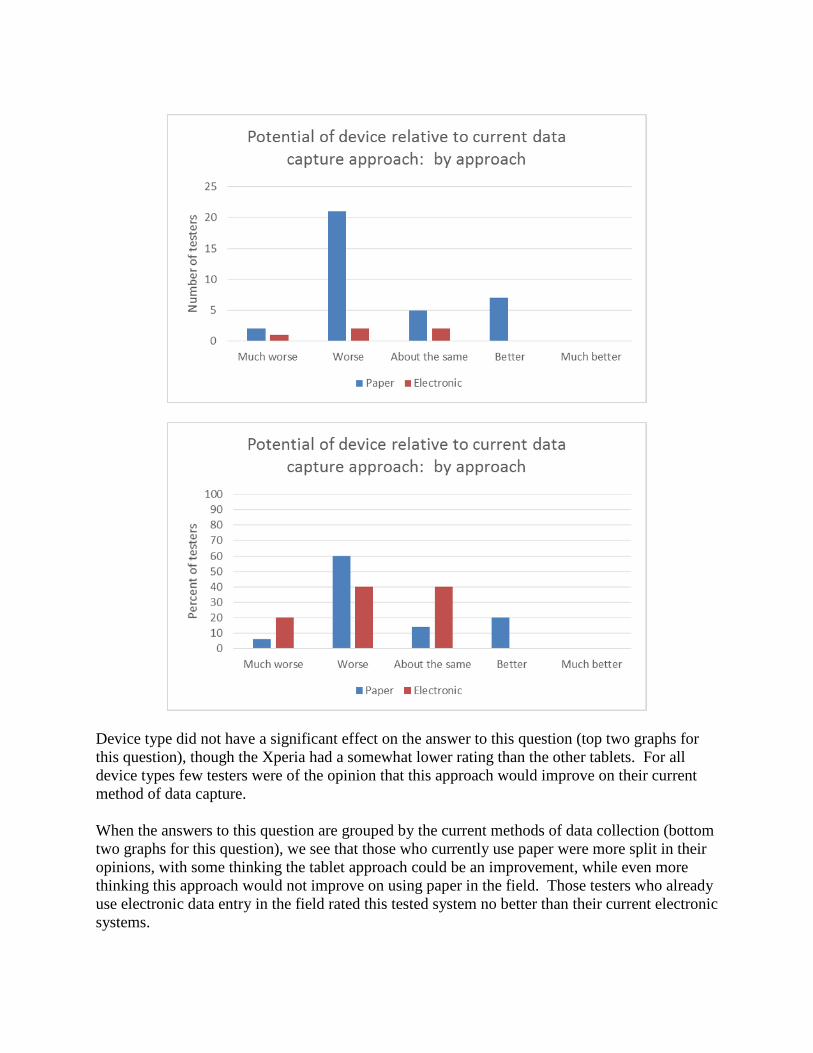
Device type did not have a significant effect on the answer to this question (top two graphs for this question), though the Xperia had a somewhat lower rating than the other tablets. For all device types few testers were of the opinion that this approach would improve on their current method of data capture. When the answers to this question are grouped by the current methods of data collection (bottom two graphs for this question), we see that those who currently use paper were more split in their opinions, with some thinking the tablet approach could be an improvement, while even more thinking this approach would not improve on using paper in the field. Those testers who already use electronic data entry in the field rated this tested system no better than their current electronic systems.
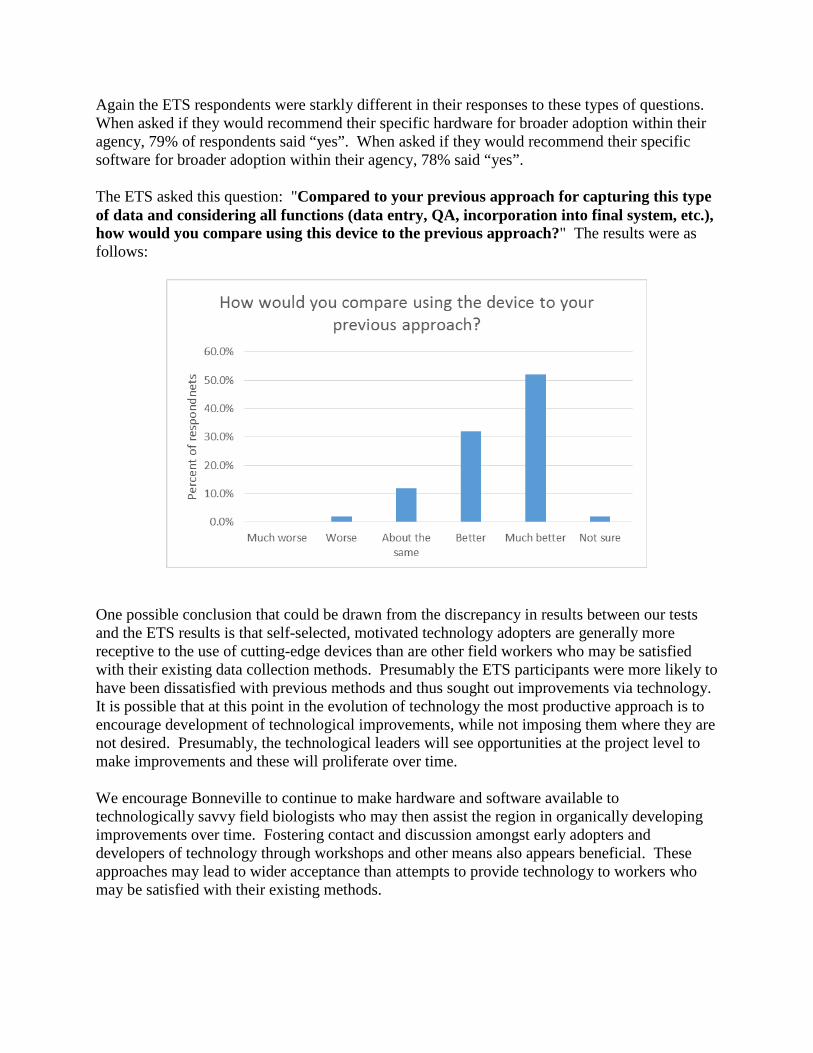
Again the ETS respondents were starkly different in their responses to these types of questions. When asked if they would recommend their specific hardware for broader adoption within their agency, 79% of respondents said “yes”. When asked if they would recommend their specific software for broader adoption within their agency, 78% said “yes”. The ETS asked this question: "Compared to your previous approach for capturing this type of data and considering all functions (data entry, QA, incorporation into final system, etc.), how would you compare using this device to the previous approach?" The results were as follows:
One possible conclusion that could be drawn from the discrepancy in results between our tests and the ETS results is that self-selected, motivated technology adopters are generally more receptive to the use of cutting-edge devices than are other field workers who may be satisfied with their existing data collection methods. Presumably the ETS participants were more likely to have been dissatisfied with previous methods and thus sought out improvements via technology. It is possible that at this point in the evolution of technology the most productive approach is to encourage development of technological improvements, while not imposing them where they are not desired. Presumably, the technological leaders will see opportunities at the project level to make improvements and these will proliferate over time. We encourage Bonneville to continue to make hardware and software available to technologically savvy field biologists who may then assist the region in organically developing improvements over time. Fostering contact and discussion amongst early adopters and developers of technology through workshops and other means also appears beneficial. These approaches may lead to wider acceptance than attempts to provide technology to workers who may be satisfied with their existing methods.
Other observations Several difficulties were encountered as the tests were designed and performed. Institutional difficulties the field testers encountered included tablet computers running iOS and Android not being allowed on government agency networks. In some cases an unofficial connection could be made via a network cable and adapter, and in these cases an IP address would be obtained and the system worked over the Internet without the tablet computer being given access to agency network resources. It is probably wise to assume that such unofficial connections will be prevented at some point in the future, and thus to have a system work using iOS or Android the agency IT departments will have to deliberately allow these systems. All of the testers successfully used public or home wireless networks; however relying on such networks into the future presents some uncertainty and exposes the tablets to security threats such as computer viruses. A related institutional difficulty we encountered that affects the future usability of such systems is that some government agencies are currently prevented, and may not be allowed for some time into the future, to purchase tablet computers that do not run under the Microsoft Windows operating system. A second set of difficulties encountered by the field testers were related to limitations of the hardware. Apple iPads were found to shut down due to overheating when the ambient air temperature was approximately 85°F. The usability of Apple tablets was also limited by the tight control that Apple exercises over connection to peripheral devices. In our tests several groups did not test Apple's iPads because the iPads were not allowed to connect to a PIT tag reader, thus preempting the main benefit some people saw in electronic data capture. The Android devices, on the other hand, had a user interface that although very similar to the Apple interface nonetheless was less intuitive for users and less "polished" than the Apple products. For example, the Panasonic Toughpad was noteworthy for data entry errors that seemed to occur at a rate of several percent -- when a button was touched the tablet would sometimes register that a neighboring button had been touched instead and make an incorrect entry. The image on the screen seemed slightly shifted from the touchpad functional layout. All the tablet computers, Apple and Android, suffered to an extent from the low power CPUs used, which sometimes resulted in performance lags. They also suffered from a touchpad interface paradigm that relies on the user switching keyboards between text and numeric data entry, greatly slowing data entry speed. We tested the "Fulcrum" platform because of its potential for a single programmer or small team to rapidly develop, deploy, and manage multiple data entry forms and data systems with minimal effort. Our experience, however, was that this system and presumably others like it required much more developer time than anticipated, did not have some capabilities we had hoped for, and created data entry interfaces that were not efficient enough for many applications. We ended up working with far fewer testers than we had hoped because it took more time than we anticipated to develop the Fulcrum data entry forms. Fulcrum's interface did not allow for elegant user interface designs for the complex data structures needed for most of the testers' data. Indeed, when we first began our development
Fulcrum did not allow for parent-child relationships in the data. The company was very responsive, however, and upon our request fairly quickly developed a method for working with parent-child relationships in data sets. We were able to take advantage of that new capability with all of the testers that needed it. The user interfaces created by using Fulcrum's services, not being the product of a true programming language, lacked some useful capabilities. The most important of these were a lack of sophisticated data entry controls ("control" as used in the computer programming sense to mean text boxes, check boxes, etc.), and the inability to create event-driven programs that can help with data entry and quality control and automatically present the end user with the correct tools for data entry at appropriate times. The Fulcrum applications did have a number of capabilities to assist with data entry and quality control such as defining drop-down lists with defined domains of acceptable values, the ability to define required and conditionally-required fields, and a wide array of data types with helpful built-in constraints, each of which would present the user with the appropriate entry tools (buttons, text keyboard, number keyboard, etc.). The Fulcrum system works only on devices running Apple's iOS or Google's Android operating systems. Microsoft Windows systems are not supported, and thus the suite of tablet computers that can be used is somewhat limited, but more importantly agencies are not allowing these computers onto their networks. A inefficiency we encountered with updates to data entry forms is that, to the best of our knowledge, Fulcrum lacked a development environment where we could make and test changes to an application without affecting an application people were using, and then port those changes once we were satisfied with them. Instead, we needed to either work in the live application and risk creating errors, or clone that application, make changes and do tests, and then when satisfied re-enter in the live application all the changes made in the clone. We encountered other inefficiencies in creating and updating data entry forms. The fairly extensive communication needed with people at distant locations made design of the data entry interface more difficult. We did improve this by using technologies that let them see our computer monitors as we worked, but it was not as efficient as being on-site during form design. Unfortunately it was not possible to track the exact amount of time required to develop and manage each project's forms, backend database tables, and programming infrastructure for moving data to the destination database. The first two instances required much more time (many days), as they were written not only for the immediate need but also as templates for the subsequent instances. Once the templates were created, the various parts of development for a data entry form generally required the following amount of time. Each of these are per table for an average table; multiple tables and forms were generally the norm and so the values listed here are a fraction of the actual need for each project.
• Designing and developing one Fulcrum form generally required about 8 hours, but was several times this when communication with a biologist was inefficient.
• Creating a back end database table at PSMFC required about 4 hours.
• Writing and testing programming code to fetch the data from Spatial Networks (Fulcrum) servers to the PSMFC database required about 4 hours.
• Writing and testing programming code for one web service to make the data available to the end user's database required about 8 hours.
• Writing and test programming code in VBA in Microsoft Access to call the appropriate web service and insert the new and updated data into the final user database required about 8 hours.
Thus, total development time for an average form/table was approximately 5 days. This is quite quick, but must be weighed against the shortcomings of the Fulcrum system. The ETS respondents reported a wide variety of time needs to develop a user interface. Responses to the question "Hours required for initial setup/programming of user interface." varied widely, ranging from "1" to the tongue-in-cheek "infinite". Roughly half of respondents indicated development took two weeks or longer. The great variability likely reflects different degrees of data complexity, different levels of sophistication and capabilities of the data entry interfaces, varying degrees of programming skill, and the systems chosen to do the programming. The inability to do rapid data entry is an obvious problem with typical touchscreen interfaces, and thus with Fulcrum and similar systems. Therefore several projects chose not to participate in the tests, or quickly abandoned the tests. These projects included: sampling juveniles at Lower Granite Dam (where they already use a computerized system); measuring and weighing batches of fish anesthetized in MS-222; measuring and collecting other data on fish during hatchery spawning. Advocates of using tablet computers for field data collection generally cite three potential benefits: increased efficiency; improved data quality; and improved overall speed of data acquisition and delivery to agency databases. The testers of the systems we created using Fulcrum as the platform for creating data entry forms did not feel efficiency was improved, and in fact most felt this method essentially transferred data entry office work to the field and interfered with field work. They also did not feel the system improved data quality, though we suggest that impression may be inaccurate. A test could be designed to answer this question. The third potential benefit was only indirectly addressed by this study. It is certainly true that a system like we tested here using Fulcrum or a similar service can speed up data delivery to agency databases, once those data have been entered. However, if raw data acquisition is slowed and interferes with data collection then the benefits of faster delivery to an agency database is negated. StreamNet is not currently conducting further tests of tablet computers. The state and tribal StreamNet partners continue to develop and test various approaches, in part using the experiences of this test for guidance. For example, Idaho Department of Fish and Game is developing a new user interface for tablet computers for snorkeling surveys, using different software. In this test they found the Fulcrum interface was acceptable for finding and recording locations, and for recording habitat data, but was a bit too slow for recording snorkel counts shouted to the recorder by the snorkelers. They will make better use of external battery
rechargers and solar panels that they tested this year. They found that recharging tablets driving between sites worked for most sites, and that often there was not enough time or sun to recharge a battery using the solar panels. The solar panels and rechargers did come in handy during wilderness sampling trips, and will be used this year for those needs. With increases in battery efficiency, better battery management, and back up batteries, they don't think they will need the solar panels as much, but will withhold judgement until after this 2015 field season, as they plan to use the tablets and accessories more intensely than during the tests described in this report. Acknowledgements Funding for this pilot project was provided by the Bonneville Power Administration. We thank them for their support and interest. The ETS survey and workshop were also supported by BPA, along with the Pacific Northwest Aquatic Monitoring Partnership and also Sitka Technology Group. Their assistance is also appreciated. We thank the following biologists and field personnel for participating in the field tests and other activities that supported this pilot study.
• Idaho Department of Fish and Game o Evan Brown o Aaryn Smith o Bart Butterfield o Bonnie Ricord o Bre Anderson o Chris Gratton o Chris Harrington o Cody Melchior o Eric Malone o Ethan Kalinowski o Jonas Smith o Jordan Messner o Kim Apperson o Lance Hebdon o Matt Lyon o Matt Pumfrey o Matthew Amick o Mike Raymondi o Randy Walsh o Rebecca Fritz o Ron Roberts o Samuel Romans o Scott Putnam o Sean Fitzmaurice
o Tim Copeland o Will Glaeser o Yvonne Rericha
• Oregon Department of Fish and Wildlife o Adam Storch o Christopher Horn o Christopher Tiffany o Curt Beyer o Dean Brown o Hilary Griffin o Jim Ruzycki o Jonathan LaTour o Kasey Bliesner o Kevin Rybacki o Lance Clarke o Matt Gardner o Matt Wyatt o Mike Flesher o Phil Simpson o Shelley Tattam
• U.S. Fish and Wildlife Service o Steve Lazzini o Steve Pastor
• Washington Department of Fish and Wildlife o Ethan Crawford o Jerry Dedloff o Joe Bumgarner o Mike Herr o Todd Miller
We also thank the following people who were willing to participate in the field tests but who did not because we determined the systems we could make for them were insufficient for their needs.
• National Marine Fisheries Service o Tiffani Marsh
• Oregon Department of Fish and Wildlife o Brian Jonasson

Appendix 1A: Questionnaire #1 This questionnaire was to be filled out by each tester after orientation/training for each specific model of tablet computer, but before actually using it in the field.
EVALUATION OF DATA CAPTURE IN THE FIELD USING PORTABLE
HAND-HELD DEVICES
QUESTIONNAIRE 1 This study is a multi-faceted evaluation of the utility of hand-held electronic devices for fisheries field data collection. This study is meant as a "proof of concept" exercise rather than a full-blown implementation. We are testing 1) hardware utility and reliability, 2) utility, ease of use, and appropriateness of one specific software system for data capture, and 3) ease of delivery of your data to you. Traditional capture of field data involves using data sheets to record data in the field, followed by data entry in the office into a spreadsheet or database, and then various data quality checks to ensure entry was correctly performed. The methods we will evaluate in this study involve electronic capture of data in the field, followed by delivery of the data to you via email, insertion directly into your database, or other method. Under these scenarios there is no need for data entry in the office -- and therefore no need (or ability) to check for data entry errors. Under some circumstances this could reduce overall time requirements to collect data and capture them in electronic format. Data quality checks that are done after data entry will still be needed. The basic questions we wish to answer are whether electronic data capture in the field using these devices is feasible, reliable, and saves enough time overall to justify the extra effort required to set up and learn to use such systems. In this study you will be introduced, one at a time, to several different devices for field data capture. After each introduction we will ask several questions regarding your initial expectations for the device for a particular type of work. We will work with you to set up a system to capture and automatically send your data to you, using a process that will be invisible to you – your data will simply show up where you direct us to put them, in a format you direct us to provide. You will then use the device for field work, and evaluate how well it works in the field and how well the data delivery mechanism meets your needs. We will then ask you another set of questions regarding your experience using the particular device for your particular data collection work. Thank you for participating in this study. The StreamNet team (www.StreamNet.org)
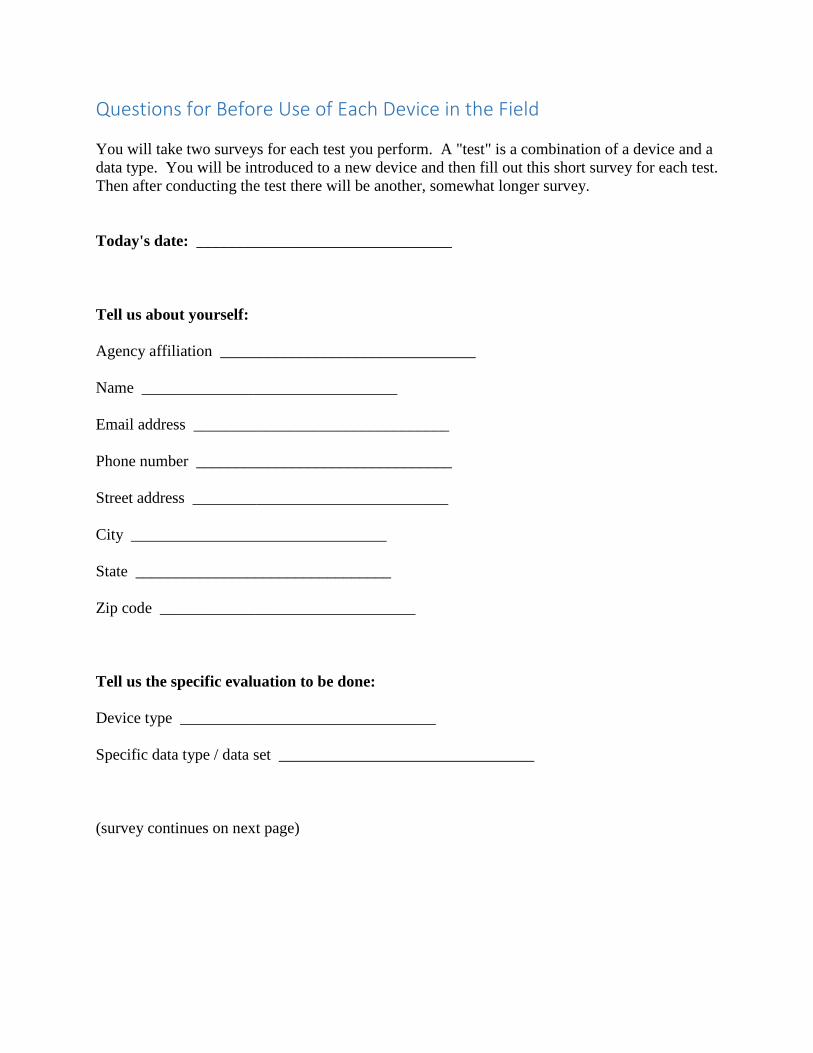
Questions for Before Use of Each Device in the Field You will take two surveys for each test you perform. A "test" is a combination of a device and a data type. You will be introduced to a new device and then fill out this short survey for each test. Then after conducting the test there will be another, somewhat longer survey. Today's date: ________________________________ Tell us about yourself: Agency affiliation ________________________________ Name ________________________________ Email address ________________________________ Phone number ________________________________ Street address ________________________________ City ________________________________ State ________________________________ Zip code ________________________________ Tell us the specific evaluation to be done: Device type ________________________________ Specific data type / data set ________________________________ (survey continues on next page)
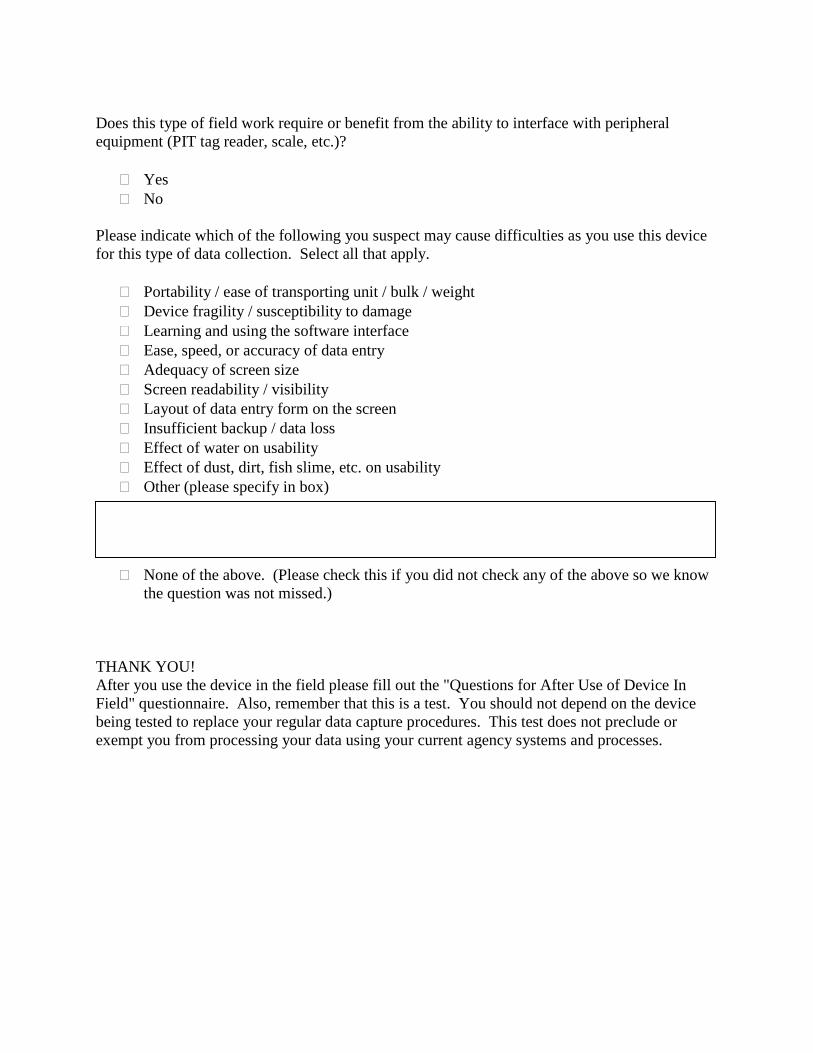
Does this type of field work require or benefit from the ability to interface with peripheral equipment (PIT tag reader, scale, etc.)?
� Yes � No
Please indicate which of the following you suspect may cause difficulties as you use this device for this type of data collection. Select all that apply.
� Portability / ease of transporting unit / bulk / weight � Device fragility / susceptibility to damage � Learning and using the software interface � Ease, speed, or accuracy of data entry � Adequacy of screen size � Screen readability / visibility � Layout of data entry form on the screen � Insufficient backup / data loss � Effect of water on usability � Effect of dust, dirt, fish slime, etc. on usability � Other (please specify in box)
� None of the above. (Please check this if you did not check any of the above so we know the question was not missed.)
THANK YOU! After you use the device in the field please fill out the "Questions for After Use of Device In Field" questionnaire. Also, remember that this is a test. You should not depend on the device being tested to replace your regular data capture procedures. This test does not preclude or exempt you from processing your data using your current agency systems and processes.

Appendix 1B: Questionnaire #2 This questionnaire was to be filled out by each tester for each specific model of tablet computer after using it in the field.
QUESTIONNAIRE: EVALUATION OF DATA CAPTURE IN THE FIELD USING
PORTABLE HAND-HELD DEVICES
QUESTIONNAIRE 2 This study is a multi-faceted evaluation of the utility of hand-held electronic devices for fisheries field data collection. This study is meant as a "proof of concept" exercise rather than a full-blown implementation. We are testing 1) hardware utility and reliability, 2) utility, ease of use, and appropriateness of one specific software system for data capture, and 3) ease of delivery of your data to you. Traditional capture of field data involves using data sheets to record data in the field, followed by data entry in the office into a spreadsheet or database, and then various data quality checks to ensure entry was correctly performed. The methods we will evaluate in this study involve electronic capture of data in the field, followed by delivery of the data to you via email, insertion directly into your database, or other method. Under these scenarios there is no need for data entry in the office -- and therefore no need (or ability) to check for data entry errors. Under some circumstances this could reduce overall time requirements to collect data and capture them in electronic format. Data quality checks that are done after data entry will still be needed. The basic questions we wish to answer are whether electronic data capture in the field using these devices is feasible, reliable, and saves enough time overall to justify the extra effort required to set up and learn to use such systems. In this study you will be introduced, one at a time, to several different devices for field data capture. After each introduction we will ask several questions regarding your initial expectations for the device for a particular type of work. We will work with you to set up a system to capture and automatically send your data to you, using a process that will be invisible to you – your data will simply show up where you direct us to put them, in a format you direct us to provide. You will then use the device for field work, and evaluate how well it works in the field and how well the data delivery mechanism meets your needs. We will then ask you another set of questions regarding your experience using the particular device for your particular data collection work. Thank you for participating in this study. The StreamNet team (www.StreamNet.org)
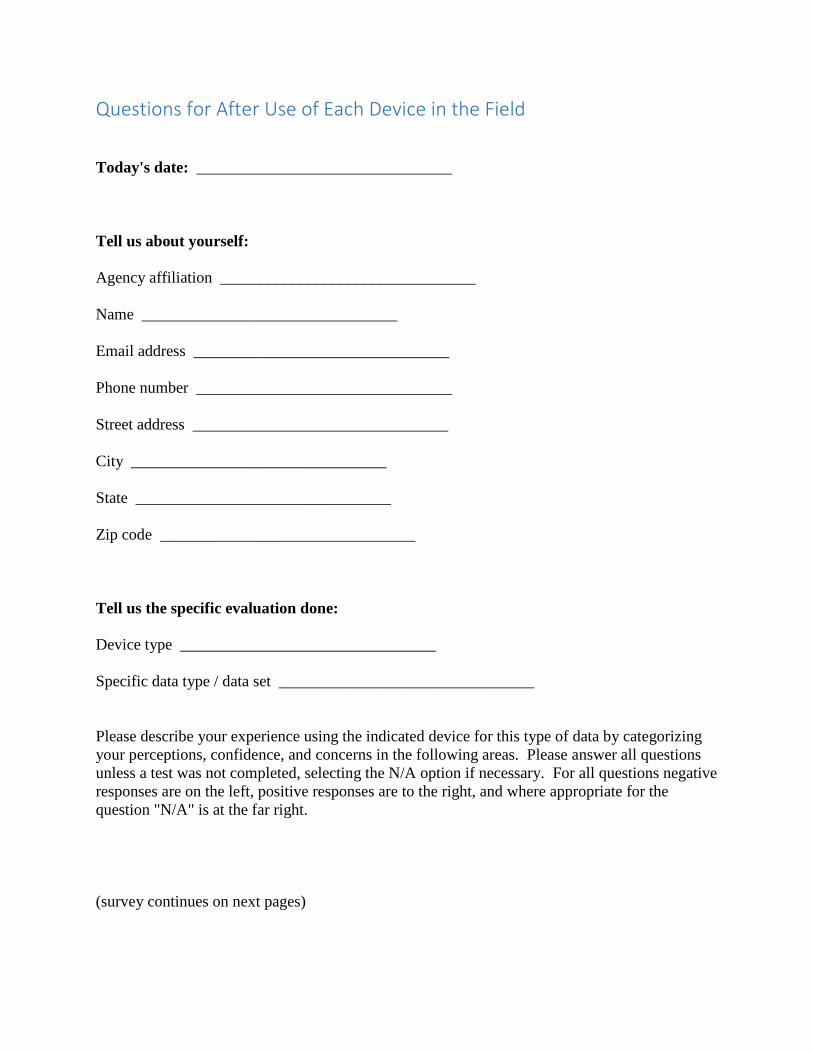
Questions for After Use of Each Device in the Field Today's date: ________________________________ Tell us about yourself: Agency affiliation ________________________________ Name ________________________________ Email address ________________________________ Phone number ________________________________ Street address ________________________________ City ________________________________ State ________________________________ Zip code ________________________________ Tell us the specific evaluation done: Device type ________________________________ Specific data type / data set ________________________________ Please describe your experience using the indicated device for this type of data by categorizing your perceptions, confidence, and concerns in the following areas. Please answer all questions unless a test was not completed, selecting the N/A option if necessary. For all questions negative responses are on the left, positive responses are to the right, and where appropriate for the question "N/A" is at the far right. (survey continues on next pages)
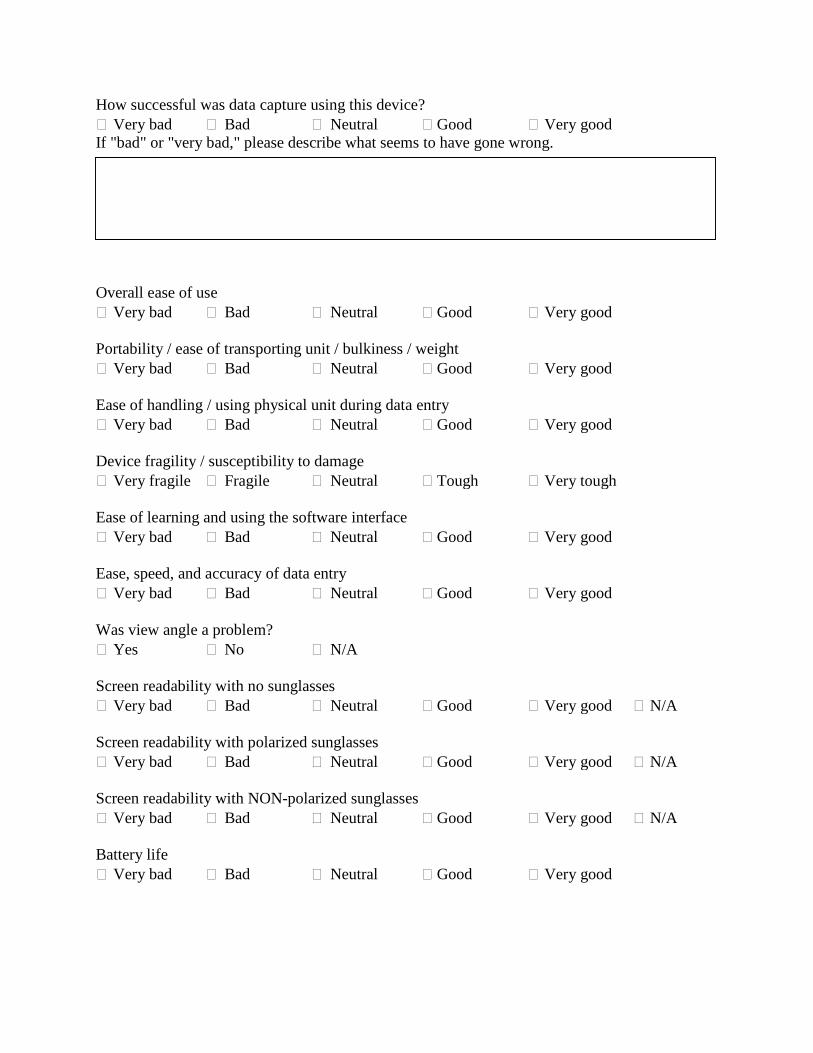
How successful was data capture using this device? � Very bad � Bad � Neutral � Good � Very good If "bad" or "very bad," please describe what seems to have gone wrong.
Overall ease of use � Very bad � Bad � Neutral � Good � Very good Portability / ease of transporting unit / bulkiness / weight � Very bad � Bad � Neutral � Good � Very good Ease of handling / using physical unit during data entry � Very bad � Bad � Neutral � Good � Very good Device fragility / susceptibility to damage � Very fragile � Fragile � Neutral � Tough � Very tough Ease of learning and using the software interface � Very bad � Bad � Neutral � Good � Very good Ease, speed, and accuracy of data entry � Very bad � Bad � Neutral � Good � Very good Was view angle a problem? � Yes � No � N/A Screen readability with no sunglasses � Very bad � Bad � Neutral � Good � Very good � N/A Screen readability with polarized sunglasses � Very bad � Bad � Neutral � Good � Very good � N/A Screen readability with NON-polarized sunglasses � Very bad � Bad � Neutral � Good � Very good � N/A Battery life � Very bad � Bad � Neutral � Good � Very good
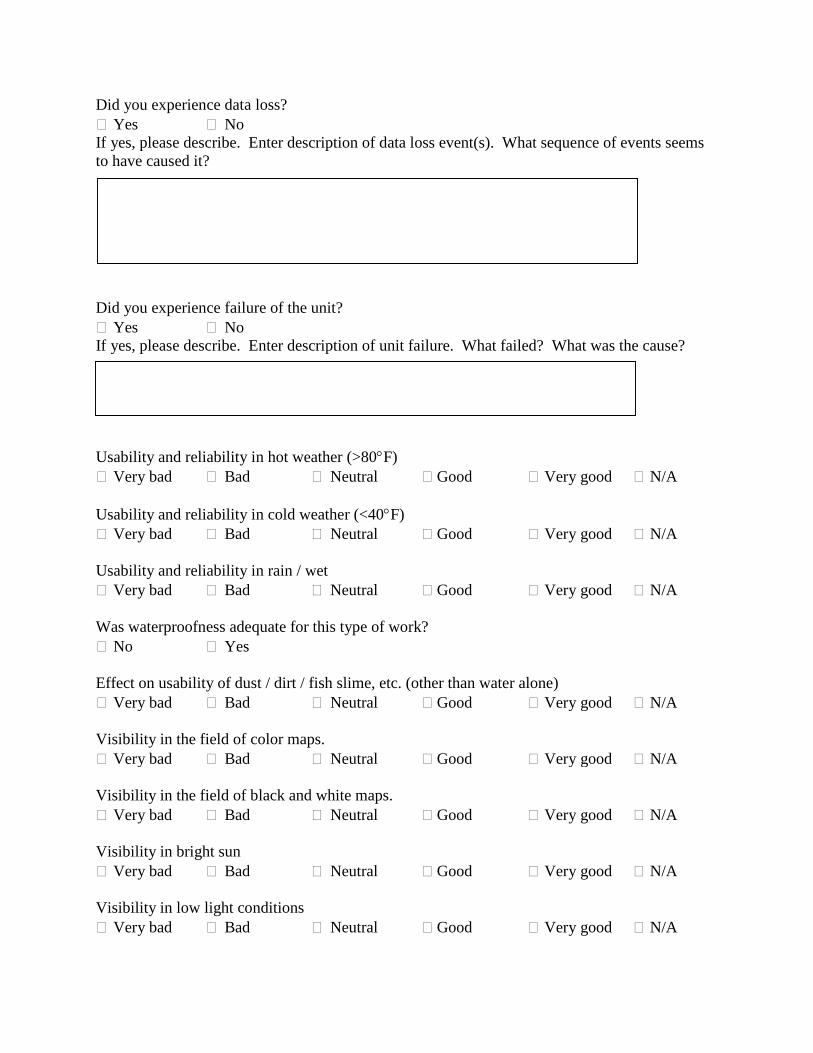
Did you experience data loss? � Yes � No If yes, please describe. Enter description of data loss event(s). What sequence of events seems to have caused it?
Did you experience failure of the unit? � Yes � No If yes, please describe. Enter description of unit failure. What failed? What was the cause?
Usability and reliability in hot weather (>80°F) � Very bad � Bad � Neutral � Good � Very good � N/A Usability and reliability in cold weather (<40°F) � Very bad � Bad � Neutral � Good � Very good � N/A Usability and reliability in rain / wet � Very bad � Bad � Neutral � Good � Very good � N/A Was waterproofness adequate for this type of work? � No � Yes Effect on usability of dust / dirt / fish slime, etc. (other than water alone) � Very bad � Bad � Neutral � Good � Very good � N/A Visibility in the field of color maps. � Very bad � Bad � Neutral � Good � Very good � N/A Visibility in the field of black and white maps. � Very bad � Bad � Neutral � Good � Very good � N/A Visibility in bright sun � Very bad � Bad � Neutral � Good � Very good � N/A Visibility in low light conditions � Very bad � Bad � Neutral � Good � Very good � N/A
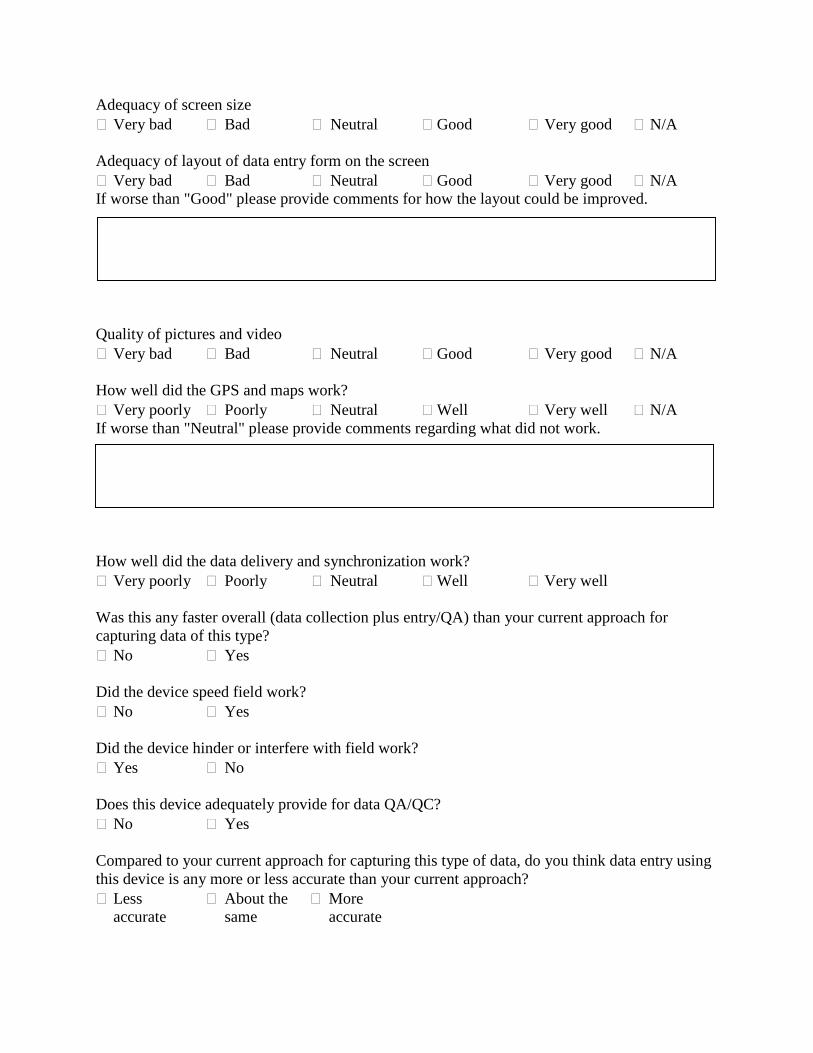
Adequacy of screen size � Very bad � Bad � Neutral � Good � Very good � N/A Adequacy of layout of data entry form on the screen � Very bad � Bad � Neutral � Good � Very good � N/A If worse than "Good" please provide comments for how the layout could be improved.
Quality of pictures and video � Very bad � Bad � Neutral � Good � Very good � N/A How well did the GPS and maps work? � Very poorly � Poorly � Neutral � Well � Very well � N/A If worse than "Neutral" please provide comments regarding what did not work.
How well did the data delivery and synchronization work? � Very poorly � Poorly � Neutral � Well � Very well Was this any faster overall (data collection plus entry/QA) than your current approach for capturing data of this type? � No � Yes Did the device speed field work? � No � Yes Did the device hinder or interfere with field work? � Yes � No Does this device adequately provide for data QA/QC? � No � Yes Compared to your current approach for capturing this type of data, do you think data entry using this device is any more or less accurate than your current approach? � Less
accurate � About the
same � More
accurate
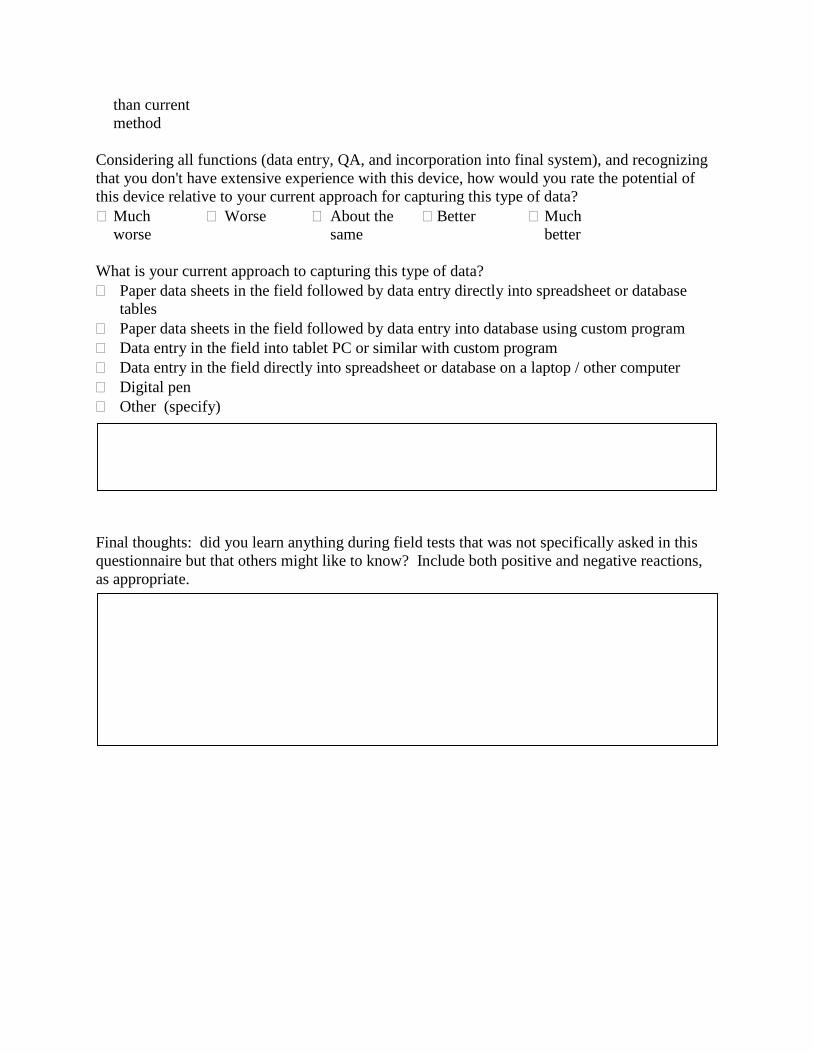
than current method
Considering all functions (data entry, QA, and incorporation into final system), and recognizing that you don't have extensive experience with this device, how would you rate the potential of this device relative to your current approach for capturing this type of data? � Much
worse � Worse � About the
same � Better � Much
better What is your current approach to capturing this type of data? � Paper data sheets in the field followed by data entry directly into spreadsheet or database
tables � Paper data sheets in the field followed by data entry into database using custom program � Data entry in the field into tablet PC or similar with custom program � Data entry in the field directly into spreadsheet or database on a laptop / other computer � Digital pen � Other (specify)
Final thoughts: did you learn anything during field tests that was not specifically asked in this questionnaire but that others might like to know? Include both positive and negative reactions, as appropriate.

Appendix 2: Holycross, Brett. 2014. Idaho Field Data Collection Maps GIS Products and Services. Pacific States Marine Fisheries Commission white paper.
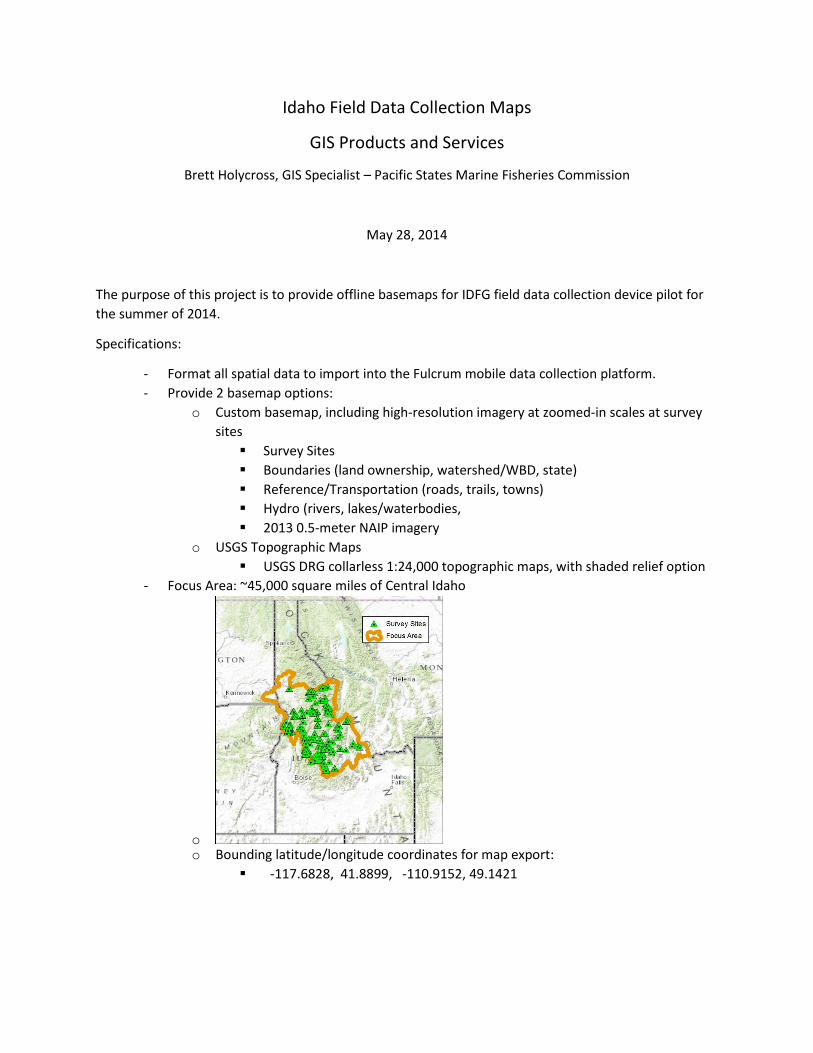
Idaho Field Data Collection Maps
GIS Products and Services
Brett Holycross, GIS Specialist – Pacific States Marine Fisheries Commission
May 28, 2014
The purpose of this project is to provide offline basemaps for IDFG field data collection device pilot for the summer of 2014.
Specifications:
- Format all spatial data to import into the Fulcrum mobile data collection platform. - Provide 2 basemap options:
o Custom basemap, including high-resolution imagery at zoomed-in scales at survey sites Survey Sites Boundaries (land ownership, watershed/WBD, state) Reference/Transportation (roads, trails, towns) Hydro (rivers, lakes/waterbodies, 2013 0.5-meter NAIP imagery
o USGS Topographic Maps USGS DRG collarless 1:24,000 topographic maps, with shaded relief option
- Focus Area: ~45,000 square miles of Central Idaho
o o Bounding latitude/longitude coordinates for map export:
-117.6828, 41.8899, -110.9152, 49.1421
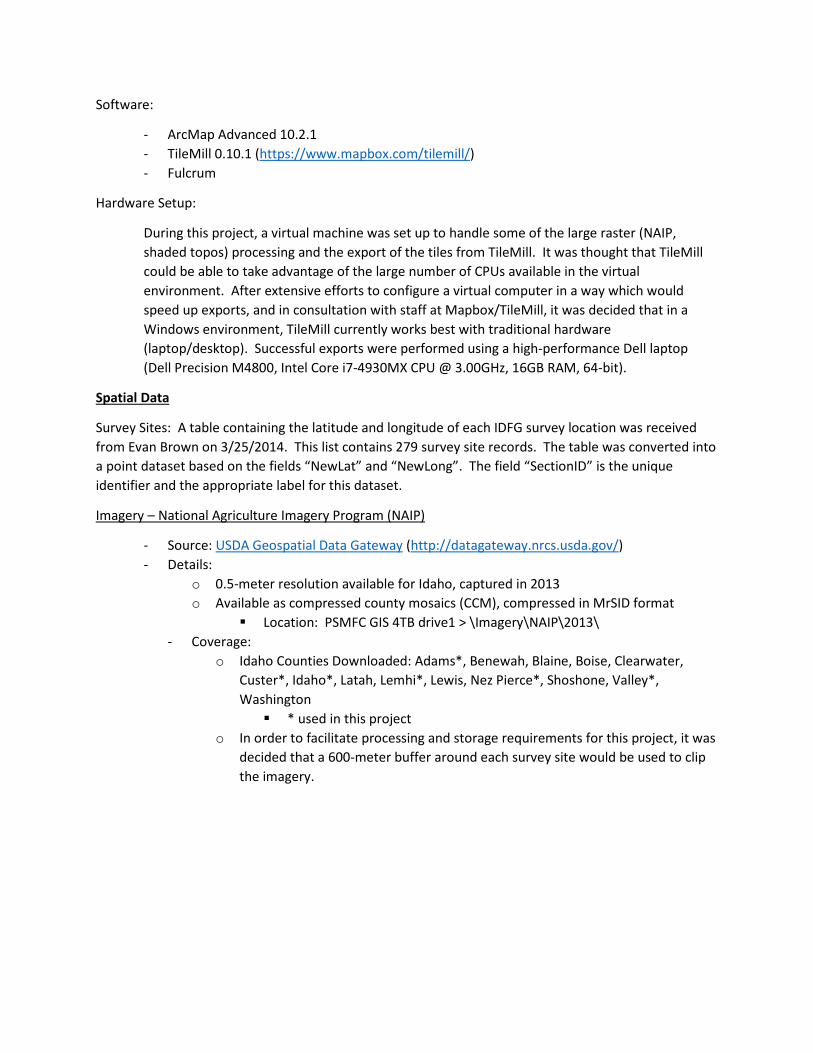
Software:
- ArcMap Advanced 10.2.1 - TileMill 0.10.1 (https://www.mapbox.com/tilemill/) - Fulcrum
Hardware Setup:
During this project, a virtual machine was set up to handle some of the large raster (NAIP, shaded topos) processing and the export of the tiles from TileMill. It was thought that TileMill could be able to take advantage of the large number of CPUs available in the virtual environment. After extensive efforts to configure a virtual computer in a way which would speed up exports, and in consultation with staff at Mapbox/TileMill, it was decided that in a Windows environment, TileMill currently works best with traditional hardware (laptop/desktop). Successful exports were performed using a high-performance Dell laptop (Dell Precision M4800, Intel Core i7-4930MX CPU @ 3.00GHz, 16GB RAM, 64-bit).
Spatial Data
Survey Sites: A table containing the latitude and longitude of each IDFG survey location was received from Evan Brown on 3/25/2014. This list contains 279 survey site records. The table was converted into a point dataset based on the fields “NewLat” and “NewLong”. The field “SectionID” is the unique identifier and the appropriate label for this dataset.
Imagery – National Agriculture Imagery Program (NAIP)
- Source: USDA Geospatial Data Gateway (http://datagateway.nrcs.usda.gov/) - Details:
o 0.5-meter resolution available for Idaho, captured in 2013 o Available as compressed county mosaics (CCM), compressed in MrSID format
Location: PSMFC GIS 4TB drive1 > \Imagery\NAIP\2013\ - Coverage:
o Idaho Counties Downloaded: Adams*, Benewah, Blaine, Boise, Clearwater, Custer*, Idaho*, Latah, Lemhi*, Lewis, Nez Pierce*, Shoshone, Valley*, Washington * used in this project
o In order to facilitate processing and storage requirements for this project, it was decided that a 600-meter buffer around each survey site would be used to clip the imagery.
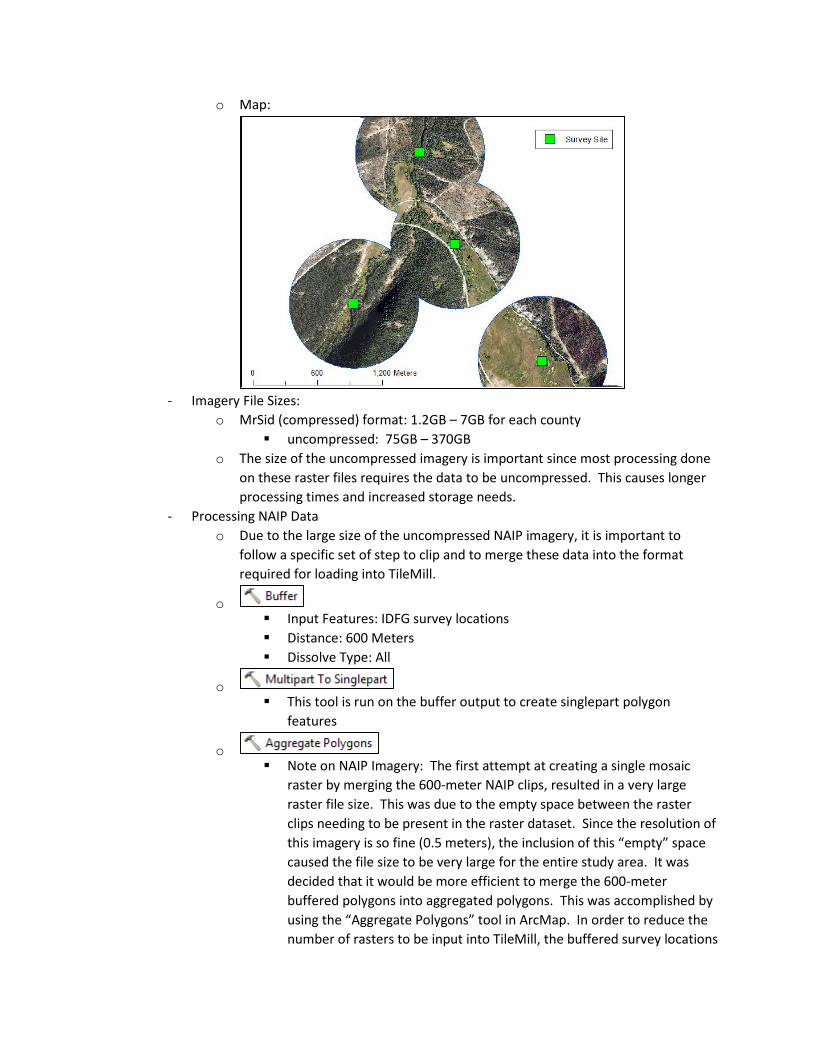
o Map:
- Imagery File Sizes:
o MrSid (compressed) format: 1.2GB – 7GB for each county uncompressed: 75GB – 370GB
o The size of the uncompressed imagery is important since most processing done on these raster files requires the data to be uncompressed. This causes longer processing times and increased storage needs.
- Processing NAIP Data o Due to the large size of the uncompressed NAIP imagery, it is important to
follow a specific set of step to clip and to merge these data into the format required for loading into TileMill.
o Input Features: IDFG survey locations Distance: 600 Meters Dissolve Type: All
o This tool is run on the buffer output to create singlepart polygon
features
o Note on NAIP Imagery: The first attempt at creating a single mosaic
raster by merging the 600-meter NAIP clips, resulted in a very large raster file size. This was due to the empty space between the raster clips needing to be present in the raster dataset. Since the resolution of this imagery is so fine (0.5 meters), the inclusion of this “empty” space caused the file size to be very large for the entire study area. It was decided that it would be more efficient to merge the 600-meter buffered polygons into aggregated polygons. This was accomplished by using the “Aggregate Polygons” tool in ArcMap. In order to reduce the number of rasters to be input into TileMill, the buffered survey locations
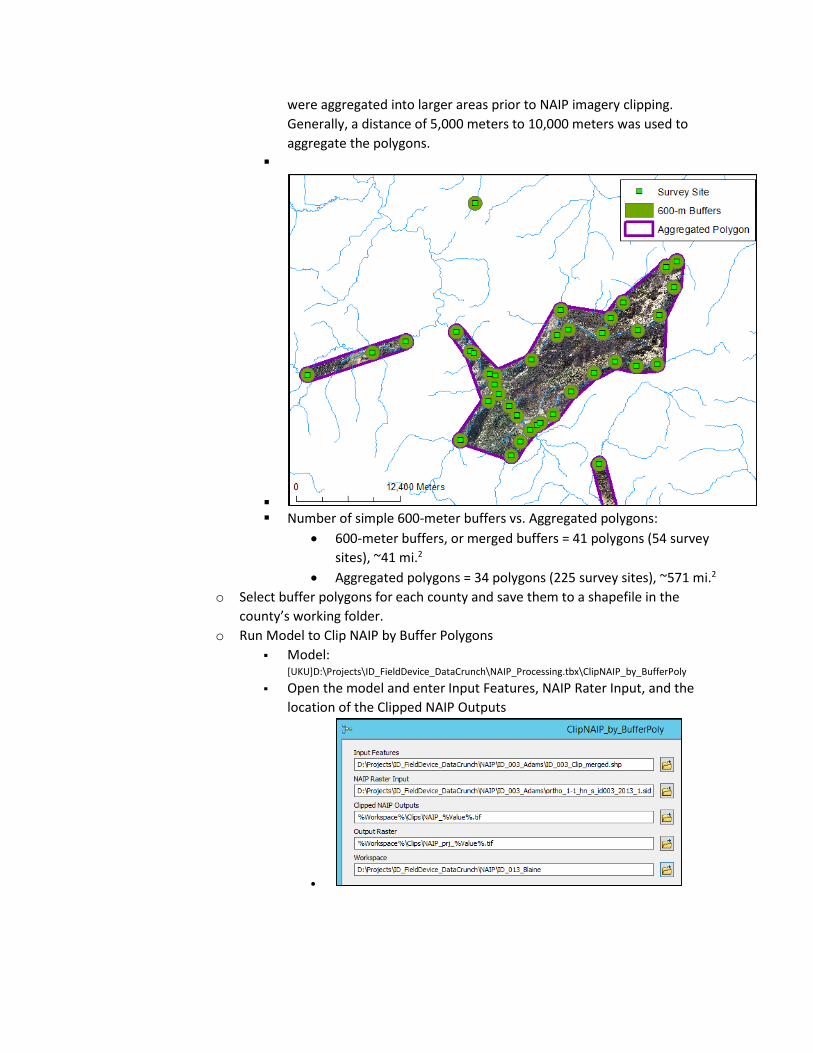
were aggregated into larger areas prior to NAIP imagery clipping. Generally, a distance of 5,000 meters to 10,000 meters was used to aggregate the polygons.
Number of simple 600-meter buffers vs. Aggregated polygons:
• 600-meter buffers, or merged buffers = 41 polygons (54 survey sites), ~41 mi.2
• Aggregated polygons = 34 polygons (225 survey sites), ~571 mi.2 o Select buffer polygons for each county and save them to a shapefile in the
county’s working folder. o Run Model to Clip NAIP by Buffer Polygons
Model: [UKU]D:\Projects\ID_FieldDevice_DataCrunch\NAIP_Processing.tbx\ClipNAIP_by_BufferPoly
Open the model and enter Input Features, NAIP Rater Input, and the location of the Clipped NAIP Outputs
•
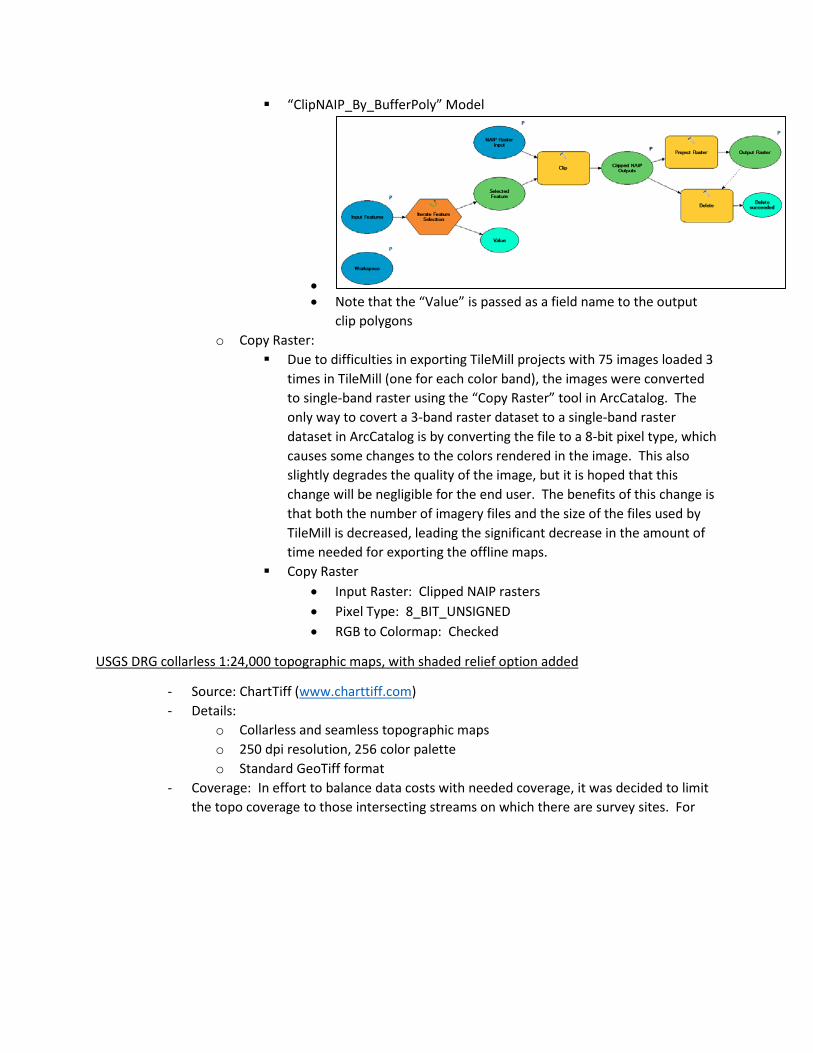
“ClipNAIP_By_BufferPoly” Model
• • Note that the “Value” is passed as a field name to the output
clip polygons o Copy Raster:
Due to difficulties in exporting TileMill projects with 75 images loaded 3 times in TileMill (one for each color band), the images were converted to single-band raster using the “Copy Raster” tool in ArcCatalog. The only way to covert a 3-band raster dataset to a single-band raster dataset in ArcCatalog is by converting the file to a 8-bit pixel type, which causes some changes to the colors rendered in the image. This also slightly degrades the quality of the image, but it is hoped that this change will be negligible for the end user. The benefits of this change is that both the number of imagery files and the size of the files used by TileMill is decreased, leading the significant decrease in the amount of time needed for exporting the offline maps.
Copy Raster • Input Raster: Clipped NAIP rasters • Pixel Type: 8_BIT_UNSIGNED • RGB to Colormap: Checked
USGS DRG collarless 1:24,000 topographic maps, with shaded relief option added
- Source: ChartTiff (www.charttiff.com) - Details:
o Collarless and seamless topographic maps o 250 dpi resolution, 256 color palette o Standard GeoTiff format
- Coverage: In effort to balance data costs with needed coverage, it was decided to limit the topo coverage to those intersecting streams on which there are survey sites. For

this project, the number of topo quads meeting this criteria was 271 (covering ~ 14,250 square miles). See the map below for details.
- - Cost: $569.10 for 271 collarless and shaded topos. - File size: ~24.4GB - Shaded Option: enhanced topographic maps with shaded relief generated from the
USGS National Elevation Dataset. See map below for a comparison of unshaded and shaded topos.
- - Processing topos in ArcCatalog:
o Coordinate System for Raster Column =
WGS_1984_Web_Mercator_Auxiliary_Sphere Raster Management Type = UNMANAGED Run time = 2 seconds
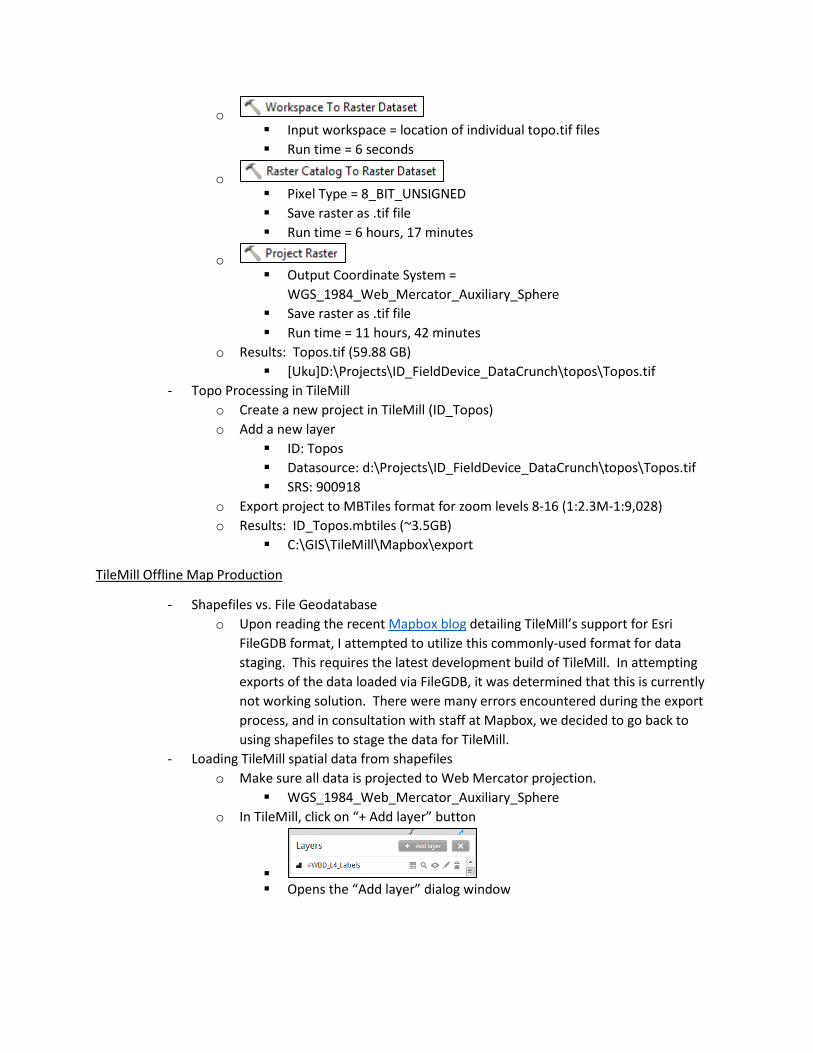
o Input workspace = location of individual topo.tif files Run time = 6 seconds
o Pixel Type = 8_BIT_UNSIGNED Save raster as .tif file Run time = 6 hours, 17 minutes
o Output Coordinate System =
WGS_1984_Web_Mercator_Auxiliary_Sphere Save raster as .tif file Run time = 11 hours, 42 minutes
o Results: Topos.tif (59.88 GB) [Uku]D:\Projects\ID_FieldDevice_DataCrunch\topos\Topos.tif
- Topo Processing in TileMill o Create a new project in TileMill (ID_Topos) o Add a new layer
ID: Topos Datasource: d:\Projects\ID_FieldDevice_DataCrunch\topos\Topos.tif SRS: 900918
o Export project to MBTiles format for zoom levels 8-16 (1:2.3M-1:9,028) o Results: ID_Topos.mbtiles (~3.5GB)
C:\GIS\TileMill\Mapbox\export
TileMill Offline Map Production
- Shapefiles vs. File Geodatabase o Upon reading the recent Mapbox blog detailing TileMill’s support for Esri
FileGDB format, I attempted to utilize this commonly-used format for data staging. This requires the latest development build of TileMill. In attempting exports of the data loaded via FileGDB, it was determined that this is currently not working solution. There were many errors encountered during the export process, and in consultation with staff at Mapbox, we decided to go back to using shapefiles to stage the data for TileMill.
- Loading TileMill spatial data from shapefiles o Make sure all data is projected to Web Mercator projection.
WGS_1984_Web_Mercator_Auxiliary_Sphere o In TileMill, click on “+ Add layer” button
Opens the “Add layer” dialog window
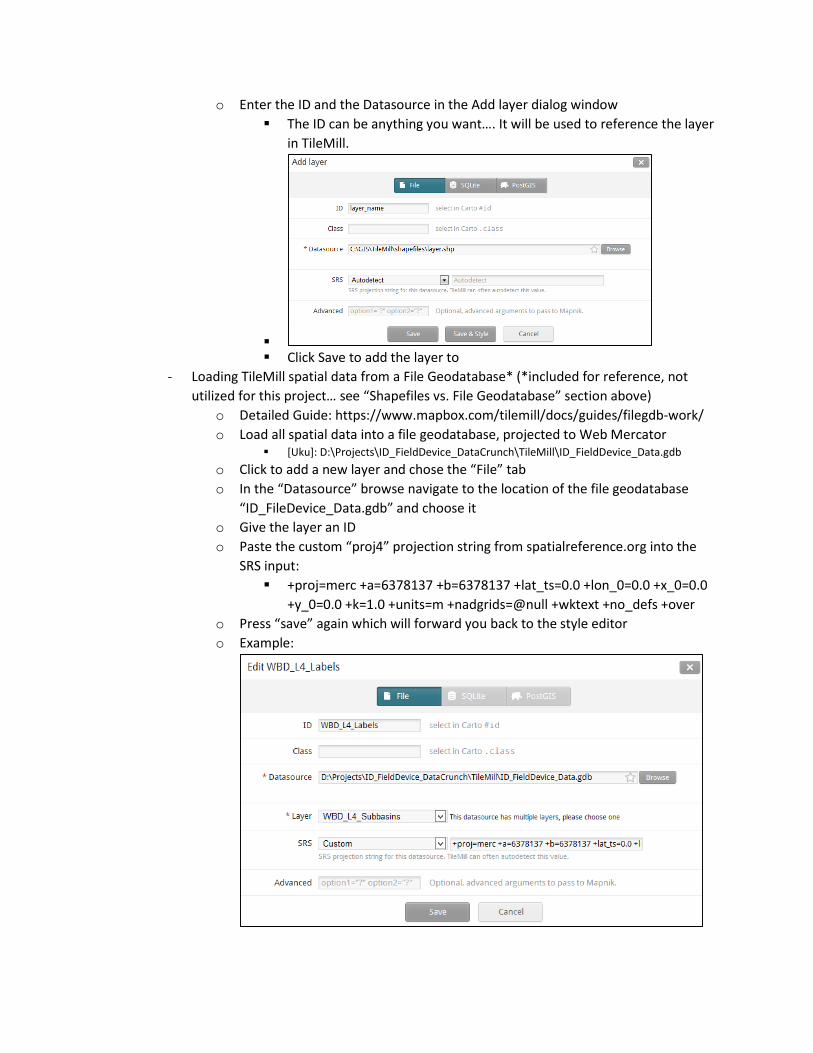
o Enter the ID and the Datasource in the Add layer dialog window The ID can be anything you want…. It will be used to reference the layer
in TileMill.
Click Save to add the layer to
- Loading TileMill spatial data from a File Geodatabase* (*included for reference, not utilized for this project… see “Shapefiles vs. File Geodatabase” section above)
o Detailed Guide: https://www.mapbox.com/tilemill/docs/guides/filegdb-work/ o Load all spatial data into a file geodatabase, projected to Web Mercator
[Uku]: D:\Projects\ID_FieldDevice_DataCrunch\TileMill\ID_FieldDevice_Data.gdb o Click to add a new layer and chose the “File” tab o In the “Datasource” browse navigate to the location of the file geodatabase
“ID_FileDevice_Data.gdb” and choose it o Give the layer an ID o Paste the custom “proj4” projection string from spatialreference.org into the
SRS input: +proj=merc +a=6378137 +b=6378137 +lat_ts=0.0 +lon_0=0.0 +x_0=0.0
+y_0=0.0 +k=1.0 +units=m +nadgrids=@null +wktext +no_defs +over o Press “save” again which will forward you back to the style editor o Example:
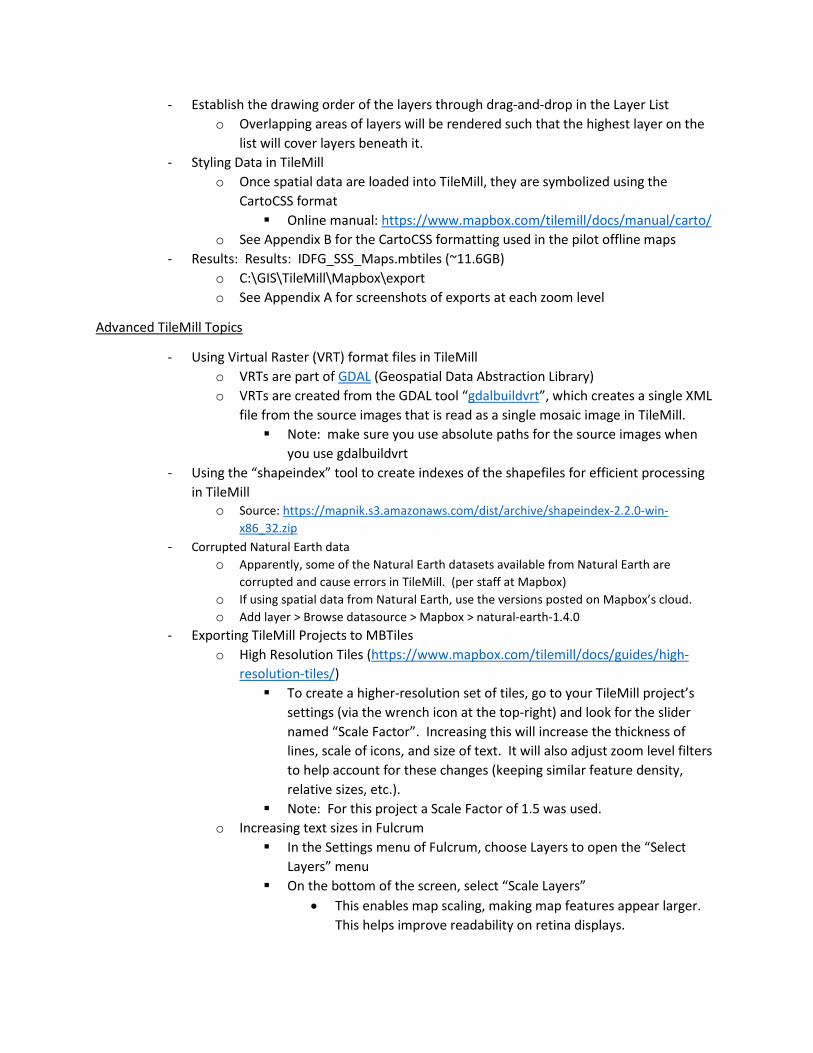
- Establish the drawing order of the layers through drag-and-drop in the Layer List o Overlapping areas of layers will be rendered such that the highest layer on the
list will cover layers beneath it. - Styling Data in TileMill
o Once spatial data are loaded into TileMill, they are symbolized using the CartoCSS format Online manual: https://www.mapbox.com/tilemill/docs/manual/carto/
o See Appendix B for the CartoCSS formatting used in the pilot offline maps - Results: Results: IDFG_SSS_Maps.mbtiles (~11.6GB)
o C:\GIS\TileMill\Mapbox\export o See Appendix A for screenshots of exports at each zoom level
Advanced TileMill Topics
- Using Virtual Raster (VRT) format files in TileMill o VRTs are part of GDAL (Geospatial Data Abstraction Library) o VRTs are created from the GDAL tool “gdalbuildvrt”, which creates a single XML
file from the source images that is read as a single mosaic image in TileMill. Note: make sure you use absolute paths for the source images when
you use gdalbuildvrt - Using the “shapeindex” tool to create indexes of the shapefiles for efficient processing
in TileMill o Source: https://mapnik.s3.amazonaws.com/dist/archive/shapeindex-2.2.0-win-
x86_32.zip - Corrupted Natural Earth data
o Apparently, some of the Natural Earth datasets available from Natural Earth are corrupted and cause errors in TileMill. (per staff at Mapbox)
o If using spatial data from Natural Earth, use the versions posted on Mapbox’s cloud. o Add layer > Browse datasource > Mapbox > natural-earth-1.4.0
- Exporting TileMill Projects to MBTiles o High Resolution Tiles (https://www.mapbox.com/tilemill/docs/guides/high-
resolution-tiles/) To create a higher-resolution set of tiles, go to your TileMill project’s
settings (via the wrench icon at the top-right) and look for the slider named “Scale Factor”. Increasing this will increase the thickness of lines, scale of icons, and size of text. It will also adjust zoom level filters to help account for these changes (keeping similar feature density, relative sizes, etc.).
Note: For this project a Scale Factor of 1.5 was used. o Increasing text sizes in Fulcrum
In the Settings menu of Fulcrum, choose Layers to open the “Select Layers” menu
On the bottom of the screen, select “Scale Layers” • This enables map scaling, making map features appear larger.
This helps improve readability on retina displays.
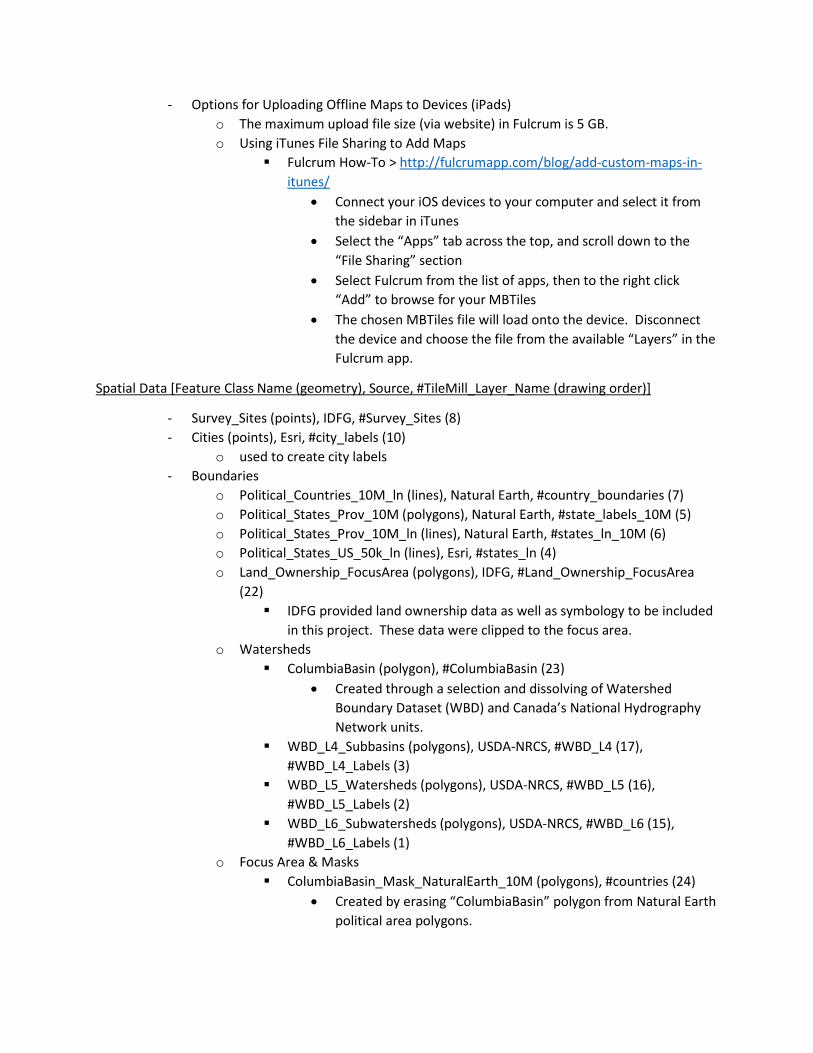
- Options for Uploading Offline Maps to Devices (iPads) o The maximum upload file size (via website) in Fulcrum is 5 GB. o Using iTunes File Sharing to Add Maps
Fulcrum How-To > http://fulcrumapp.com/blog/add-custom-maps-in-itunes/
• Connect your iOS devices to your computer and select it from the sidebar in iTunes
• Select the “Apps” tab across the top, and scroll down to the “File Sharing” section
• Select Fulcrum from the list of apps, then to the right click “Add” to browse for your MBTiles
• The chosen MBTiles file will load onto the device. Disconnect the device and choose the file from the available “Layers” in the Fulcrum app.
Spatial Data [Feature Class Name (geometry), Source, #TileMill_Layer_Name (drawing order)]
- Survey_Sites (points), IDFG, #Survey_Sites (8) - Cities (points), Esri, #city_labels (10)
o used to create city labels - Boundaries
o Political_Countries_10M_ln (lines), Natural Earth, #country_boundaries (7) o Political_States_Prov_10M (polygons), Natural Earth, #state_labels_10M (5) o Political_States_Prov_10M_ln (lines), Natural Earth, #states_ln_10M (6) o Political_States_US_50k_ln (lines), Esri, #states_ln (4) o Land_Ownership_FocusArea (polygons), IDFG, #Land_Ownership_FocusArea
(22) IDFG provided land ownership data as well as symbology to be included
in this project. These data were clipped to the focus area. o Watersheds
ColumbiaBasin (polygon), #ColumbiaBasin (23) • Created through a selection and dissolving of Watershed
Boundary Dataset (WBD) and Canada’s National Hydrography Network units.
WBD_L4_Subbasins (polygons), USDA-NRCS, #WBD_L4 (17), #WBD_L4_Labels (3)
WBD_L5_Watersheds (polygons), USDA-NRCS, #WBD_L5 (16), #WBD_L5_Labels (2)
WBD_L6_Subwatersheds (polygons), USDA-NRCS, #WBD_L6 (15), #WBD_L6_Labels (1)
o Focus Area & Masks ColumbiaBasin_Mask_NaturalEarth_10M (polygons), #countries (24)
• Created by erasing “ColumbiaBasin” polygon from Natural Earth political area polygons.
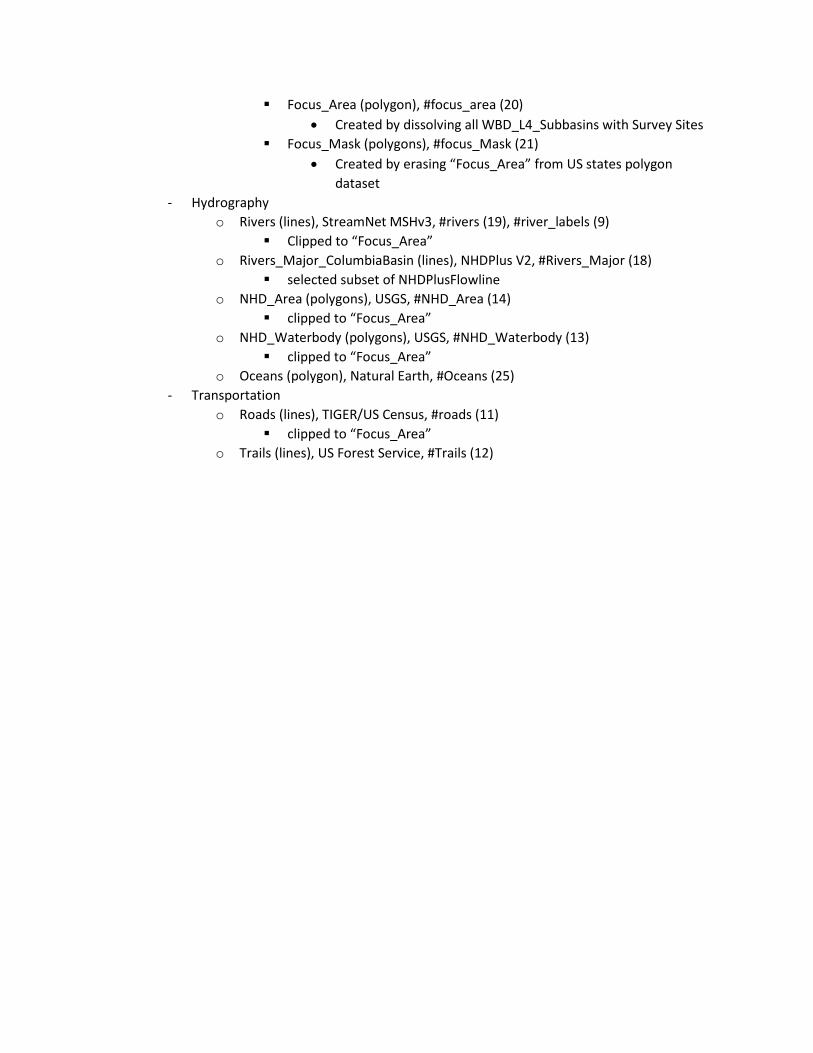
Focus_Area (polygon), #focus_area (20) • Created by dissolving all WBD_L4_Subbasins with Survey Sites
Focus_Mask (polygons), #focus_Mask (21) • Created by erasing “Focus_Area” from US states polygon
dataset - Hydrography
o Rivers (lines), StreamNet MSHv3, #rivers (19), #river_labels (9) Clipped to “Focus_Area”
o Rivers_Major_ColumbiaBasin (lines), NHDPlus V2, #Rivers_Major (18) selected subset of NHDPlusFlowline
o NHD_Area (polygons), USGS, #NHD_Area (14) clipped to “Focus_Area”
o NHD_Waterbody (polygons), USGS, #NHD_Waterbody (13) clipped to “Focus_Area”
o Oceans (polygon), Natural Earth, #Oceans (25) - Transportation
o Roads (lines), TIGER/US Census, #roads (11) clipped to “Focus_Area”
o Trails (lines), US Forest Service, #Trails (12)
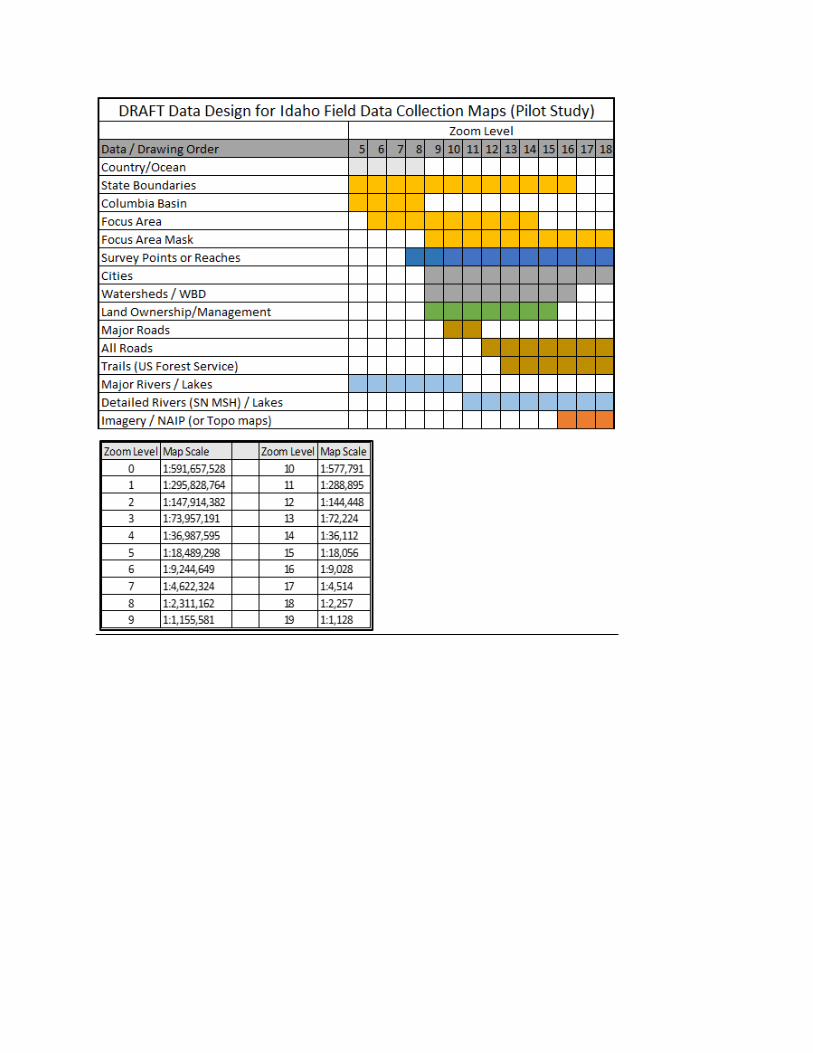
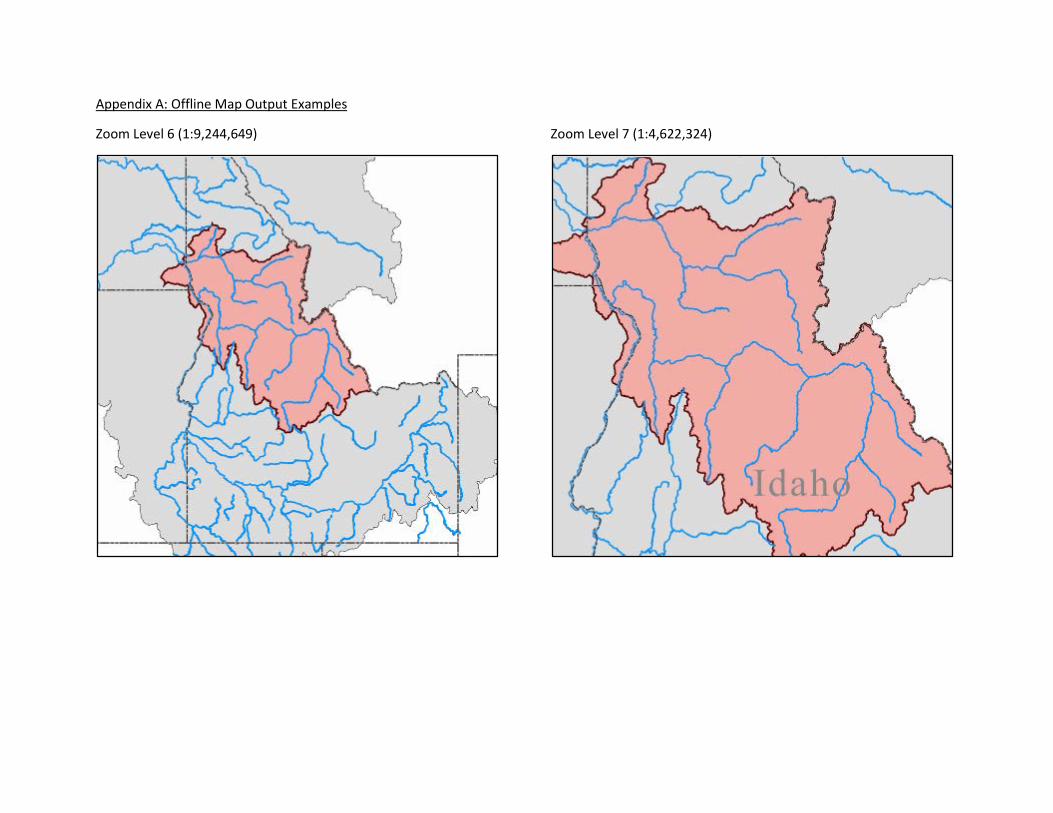
Appendix A: Offline Map Output Examples
Zoom Level 6 (1:9,244,649)
Zoom Level 7 (1:4,622,324)
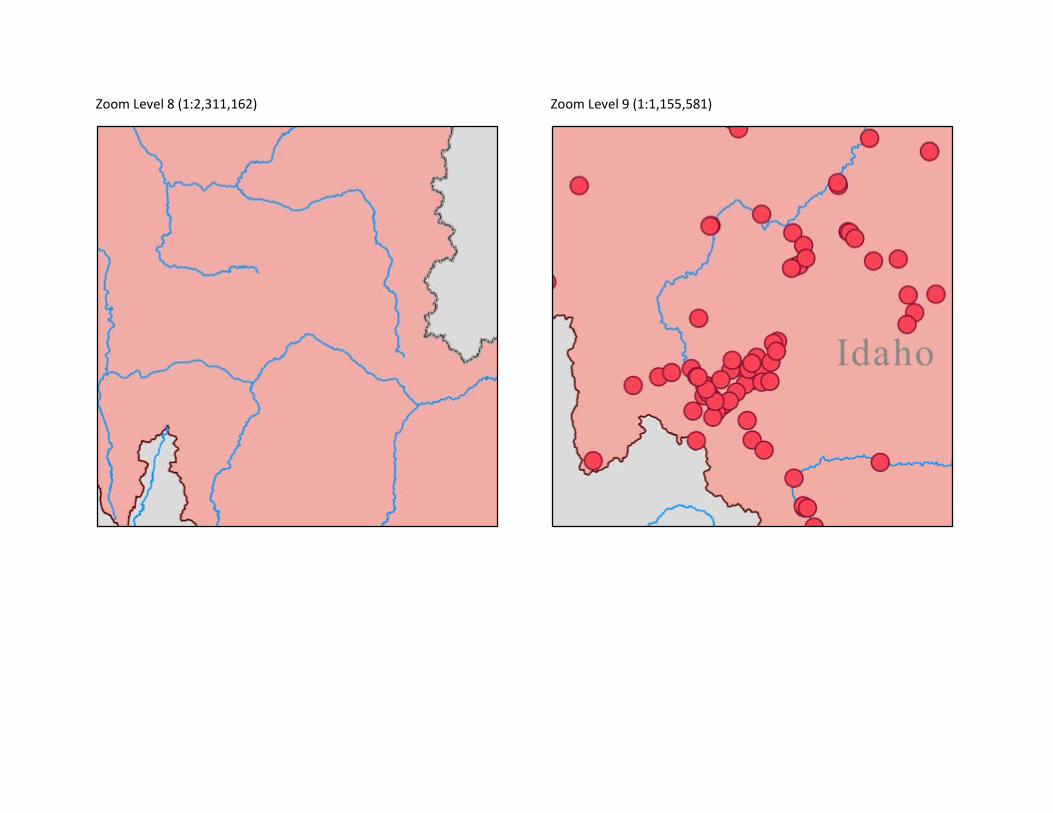
Zoom Level 8 (1:2,311,162)
Zoom Level 9 (1:1,155,581)
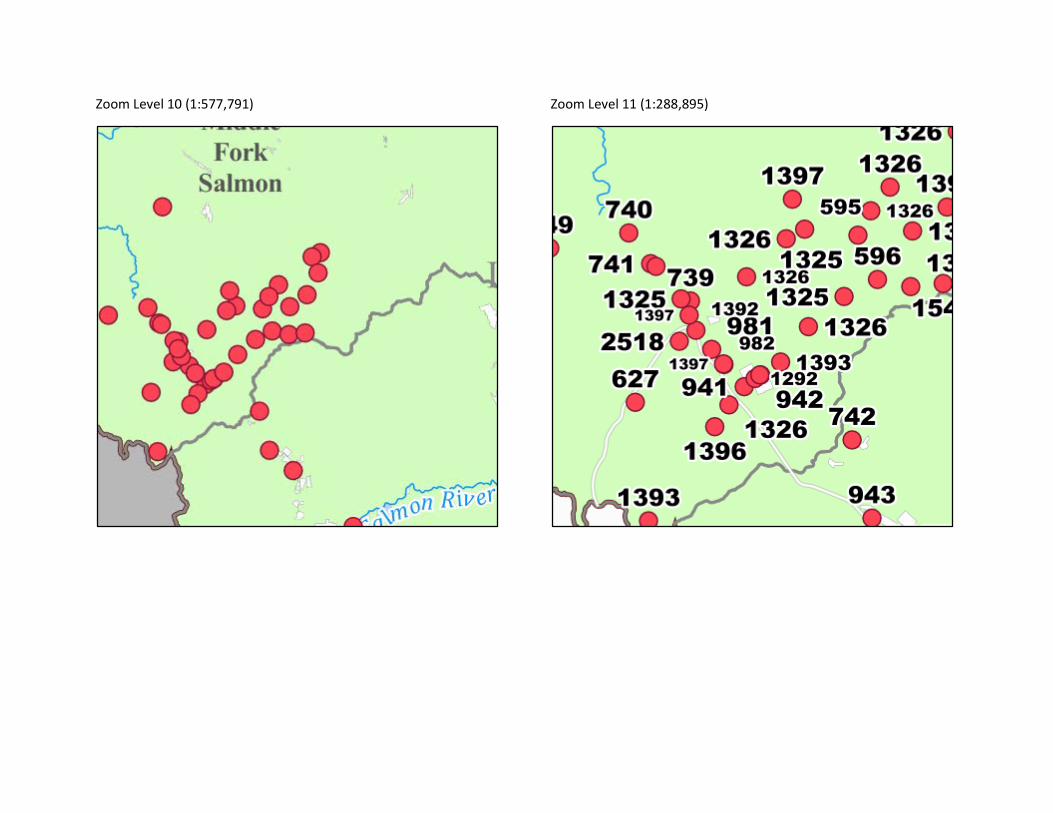
Zoom Level 10 (1:577,791)
Zoom Level 11 (1:288,895)
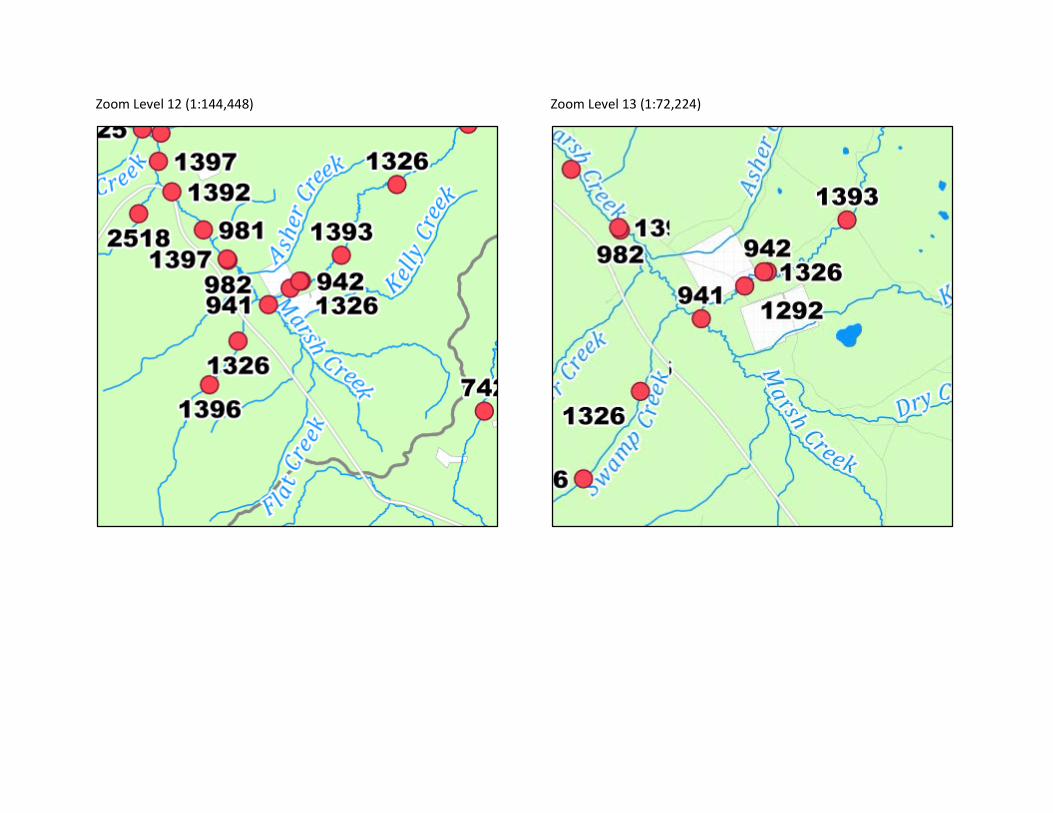
Zoom Level 12 (1:144,448)
Zoom Level 13 (1:72,224)
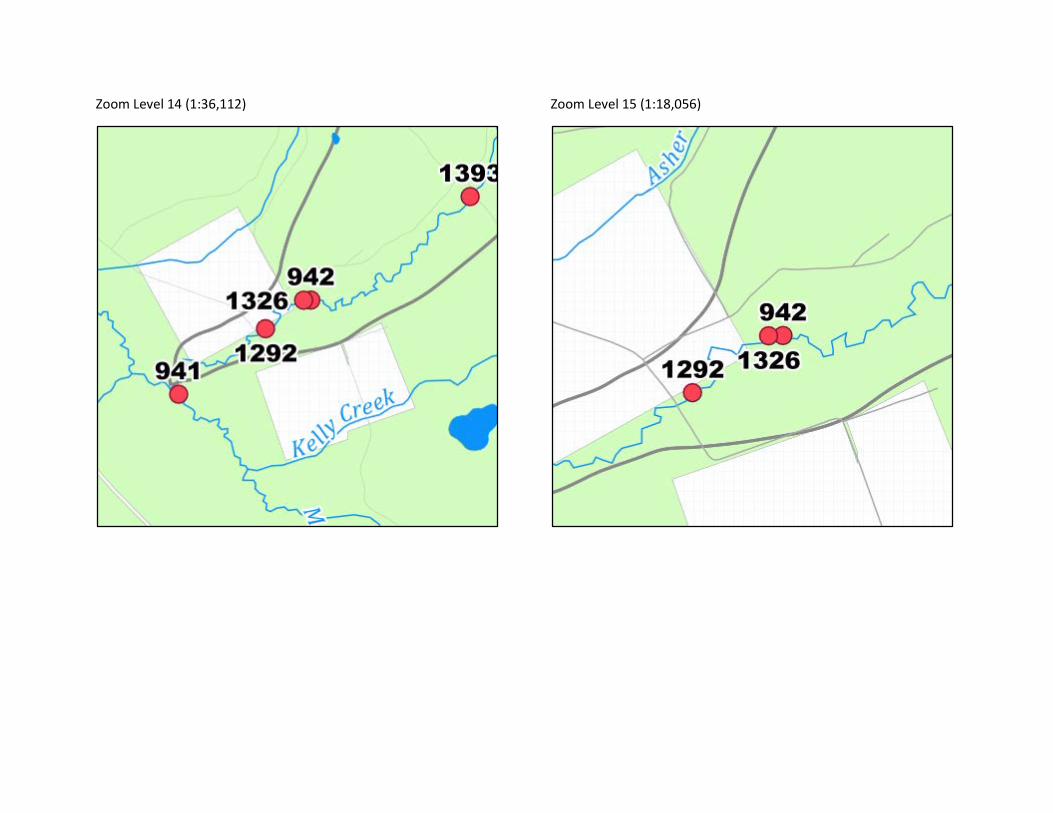
Zoom Level 14 (1:36,112)
Zoom Level 15 (1:18,056)
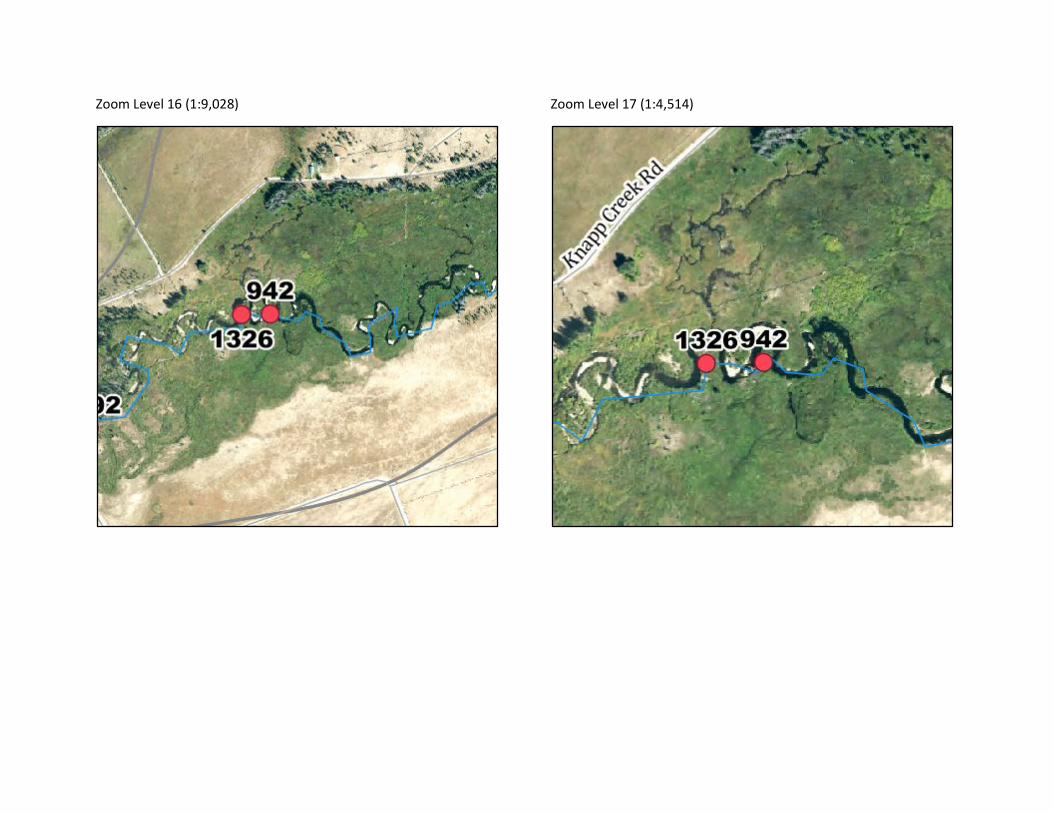
Zoom Level 16 (1:9,028)
Zoom Level 17 (1:4,514)
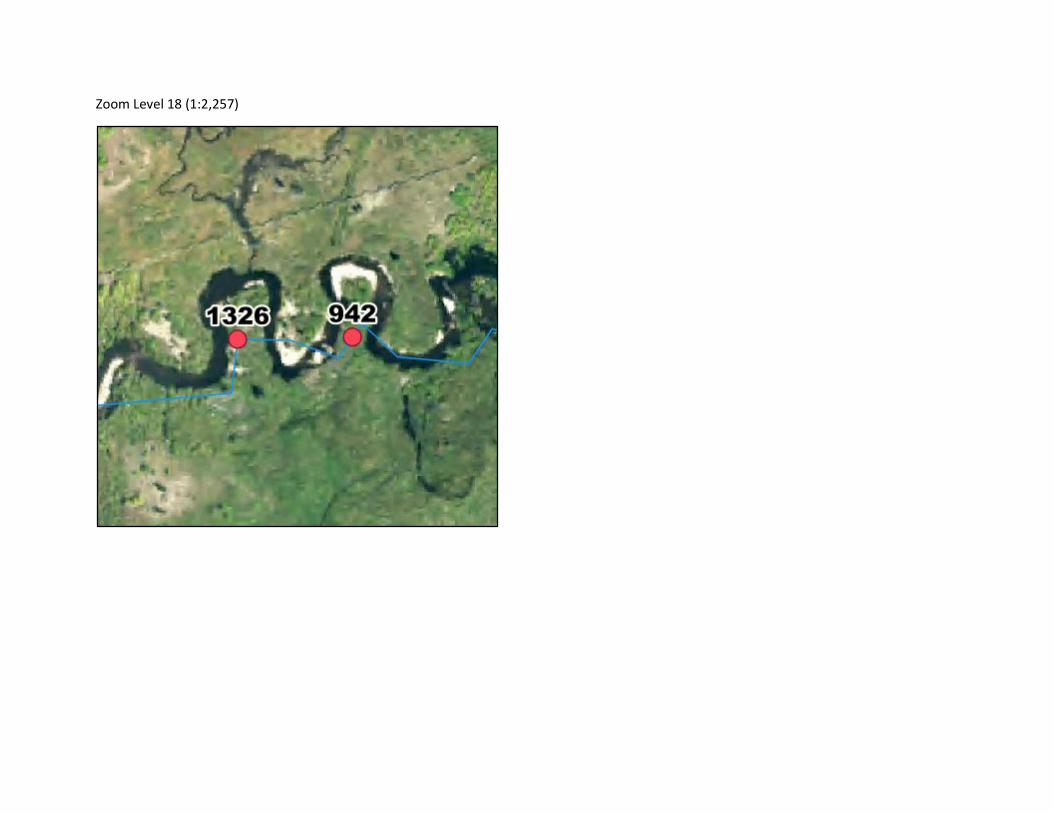
Zoom Level 18 (1:2,257)
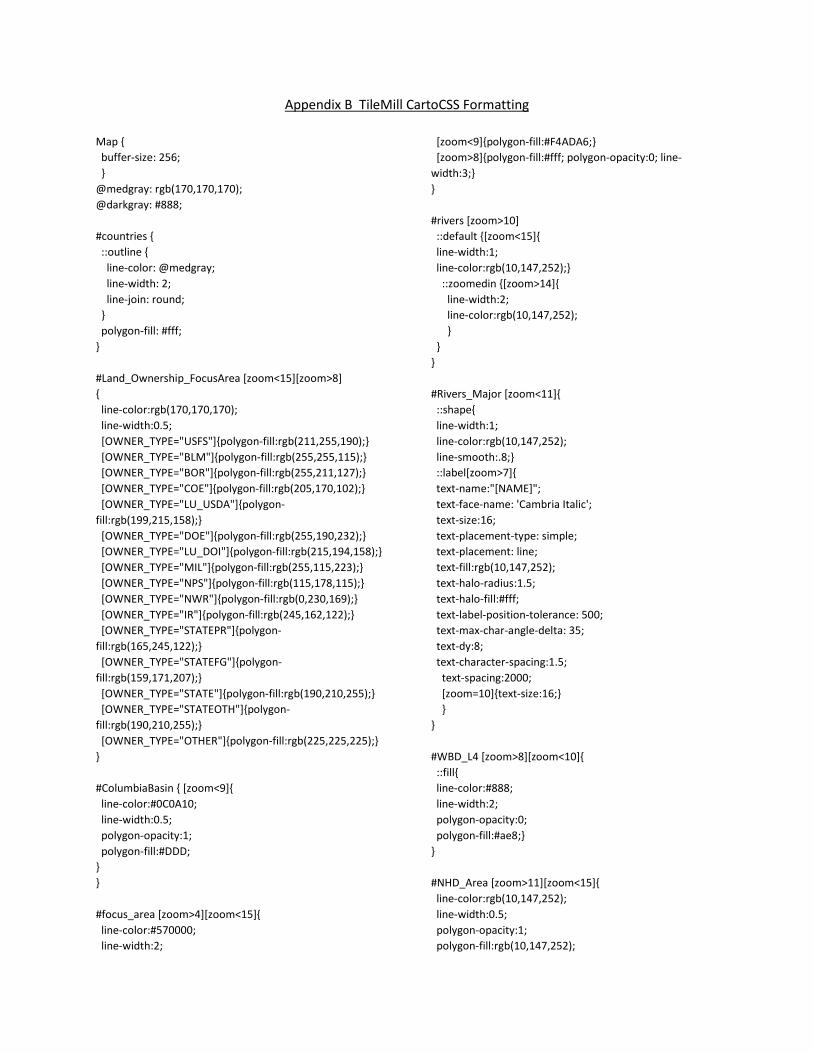
Appendix B TileMill CartoCSS Formatting Map { buffer-size: 256; } @medgray: rgb(170,170,170); @darkgray: #888; #countries { ::outline { line-color: @medgray; line-width: 2; line-join: round; } polygon-fill: #fff; } #Land_Ownership_FocusArea [zoom<15][zoom>8] { line-color:rgb(170,170,170); line-width:0.5; [OWNER_TYPE="USFS"]{polygon-fill:rgb(211,255,190);} [OWNER_TYPE="BLM"]{polygon-fill:rgb(255,255,115);} [OWNER_TYPE="BOR"]{polygon-fill:rgb(255,211,127);} [OWNER_TYPE="COE"]{polygon-fill:rgb(205,170,102);} [OWNER_TYPE="LU_USDA"]{polygon-fill:rgb(199,215,158);} [OWNER_TYPE="DOE"]{polygon-fill:rgb(255,190,232);} [OWNER_TYPE="LU_DOI"]{polygon-fill:rgb(215,194,158);} [OWNER_TYPE="MIL"]{polygon-fill:rgb(255,115,223);} [OWNER_TYPE="NPS"]{polygon-fill:rgb(115,178,115);} [OWNER_TYPE="NWR"]{polygon-fill:rgb(0,230,169);} [OWNER_TYPE="IR"]{polygon-fill:rgb(245,162,122);} [OWNER_TYPE="STATEPR"]{polygon-fill:rgb(165,245,122);} [OWNER_TYPE="STATEFG"]{polygon-fill:rgb(159,171,207);} [OWNER_TYPE="STATE"]{polygon-fill:rgb(190,210,255);} [OWNER_TYPE="STATEOTH"]{polygon-fill:rgb(190,210,255);} [OWNER_TYPE="OTHER"]{polygon-fill:rgb(225,225,225);} } #ColumbiaBasin { [zoom<9]{ line-color:#0C0A10; line-width:0.5; polygon-opacity:1; polygon-fill:#DDD; } } #focus_area [zoom>4][zoom<15]{ line-color:#570000; line-width:2;
[zoom<9]{polygon-fill:#F4ADA6;} [zoom>8]{polygon-fill:#fff; polygon-opacity:0; line-width:3;} } #rivers [zoom>10] ::default {[zoom<15]{ line-width:1; line-color:rgb(10,147,252);} ::zoomedin {[zoom>14]{ line-width:2; line-color:rgb(10,147,252); } } } #Rivers_Major [zoom<11]{ ::shape{ line-width:1; line-color:rgb(10,147,252); line-smooth:.8;} ::label[zoom>7]{ text-name:"[NAME]"; text-face-name: 'Cambria Italic'; text-size:16; text-placement-type: simple; text-placement: line; text-fill:rgb(10,147,252); text-halo-radius:1.5; text-halo-fill:#fff; text-label-position-tolerance: 500; text-max-char-angle-delta: 35; text-dy:8; text-character-spacing:1.5; text-spacing:2000; [zoom=10]{text-size:16;} } } #WBD_L4 [zoom>8][zoom<10]{ ::fill{ line-color:#888; line-width:2; polygon-opacity:0; polygon-fill:#ae8;} } #NHD_Area [zoom>11][zoom<15]{ line-color:rgb(10,147,252); line-width:0.5; polygon-opacity:1; polygon-fill:rgb(10,147,252);
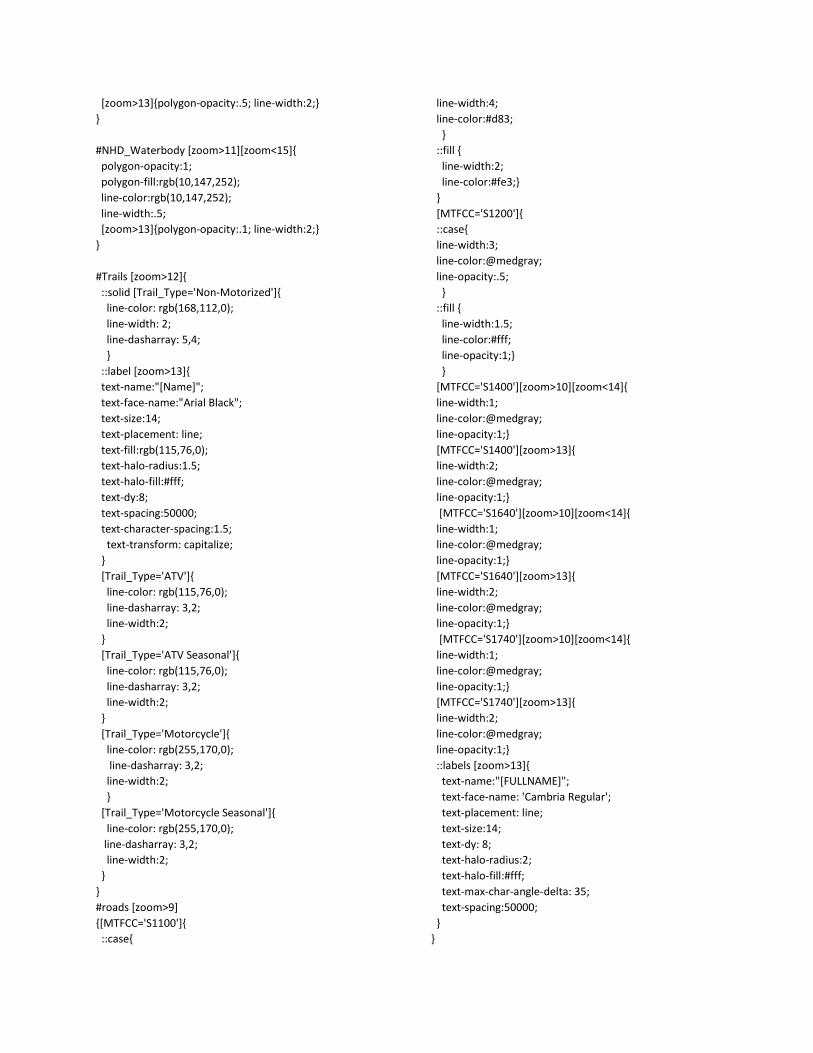
[zoom>13]{polygon-opacity:.5; line-width:2;} } #NHD_Waterbody [zoom>11][zoom<15]{ polygon-opacity:1; polygon-fill:rgb(10,147,252); line-color:rgb(10,147,252); line-width:.5; [zoom>13]{polygon-opacity:.1; line-width:2;} } #Trails [zoom>12]{ ::solid [Trail_Type='Non-Motorized']{ line-color: rgb(168,112,0); line-width: 2; line-dasharray: 5,4; } ::label [zoom>13]{ text-name:"[Name]"; text-face-name:"Arial Black"; text-size:14; text-placement: line; text-fill:rgb(115,76,0); text-halo-radius:1.5; text-halo-fill:#fff; text-dy:8; text-spacing:50000; text-character-spacing:1.5; text-transform: capitalize; } [Trail_Type='ATV']{ line-color: rgb(115,76,0); line-dasharray: 3,2; line-width:2; } [Trail_Type='ATV Seasonal']{ line-color: rgb(115,76,0); line-dasharray: 3,2; line-width:2; } [Trail_Type='Motorcycle']{ line-color: rgb(255,170,0); line-dasharray: 3,2; line-width:2; } [Trail_Type='Motorcycle Seasonal']{ line-color: rgb(255,170,0); line-dasharray: 3,2; line-width:2; } } #roads [zoom>9] {[MTFCC='S1100']{ ::case{
line-width:4; line-color:#d83; } ::fill { line-width:2; line-color:#fe3;} } [MTFCC='S1200']{ ::case{ line-width:3; line-color:@medgray; line-opacity:.5; } ::fill { line-width:1.5; line-color:#fff; line-opacity:1;} } [MTFCC='S1400'][zoom>10][zoom<14]{ line-width:1; line-color:@medgray; line-opacity:1;} [MTFCC='S1400'][zoom>13]{ line-width:2; line-color:@medgray; line-opacity:1;} [MTFCC='S1640'][zoom>10][zoom<14]{ line-width:1; line-color:@medgray; line-opacity:1;} [MTFCC='S1640'][zoom>13]{ line-width:2; line-color:@medgray; line-opacity:1;} [MTFCC='S1740'][zoom>10][zoom<14]{ line-width:1; line-color:@medgray; line-opacity:1;} [MTFCC='S1740'][zoom>13]{ line-width:2; line-color:@medgray; line-opacity:1;} ::labels [zoom>13]{ text-name:"[FULLNAME]"; text-face-name: 'Cambria Regular'; text-placement: line; text-size:14; text-dy: 8; text-halo-radius:2; text-halo-fill:#fff; text-max-char-angle-delta: 35; text-spacing:50000; } }
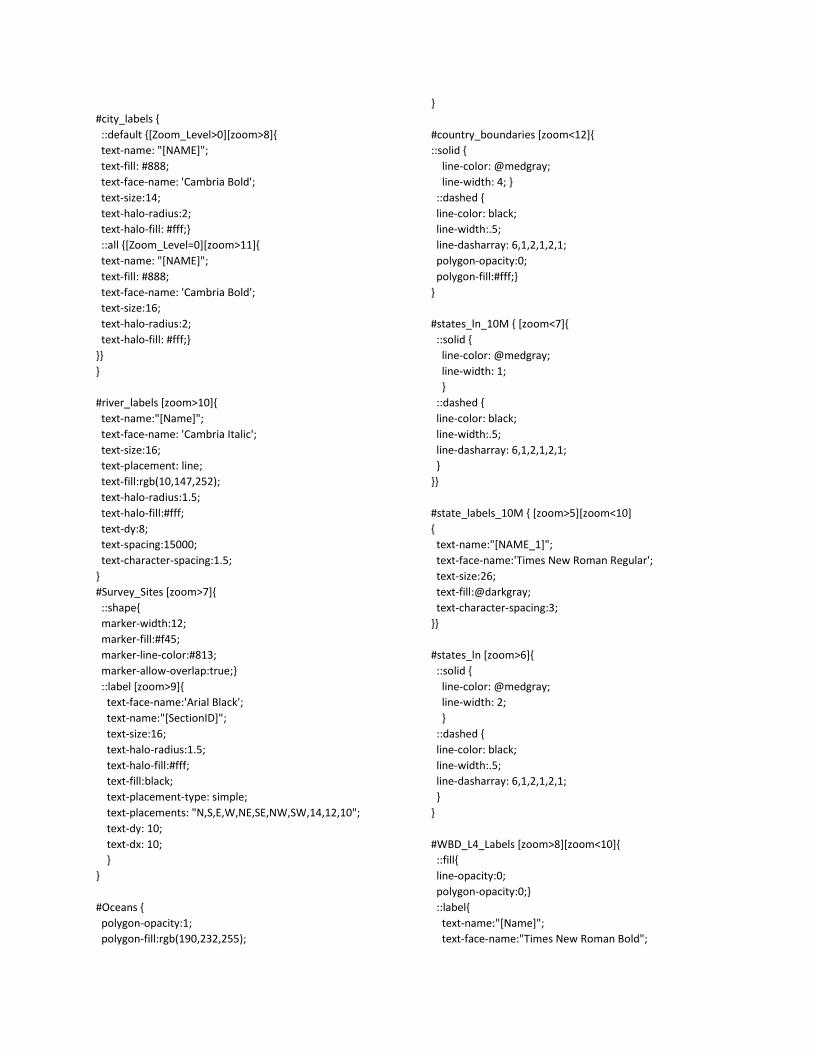
#city_labels { ::default {[Zoom_Level>0][zoom>8]{ text-name: "[NAME]"; text-fill: #888; text-face-name: 'Cambria Bold'; text-size:14; text-halo-radius:2; text-halo-fill: #fff;} ::all {[Zoom_Level=0][zoom>11]{ text-name: "[NAME]"; text-fill: #888; text-face-name: 'Cambria Bold'; text-size:16; text-halo-radius:2; text-halo-fill: #fff;} }} } #river_labels [zoom>10]{ text-name:"[Name]"; text-face-name: 'Cambria Italic'; text-size:16; text-placement: line; text-fill:rgb(10,147,252); text-halo-radius:1.5; text-halo-fill:#fff; text-dy:8; text-spacing:15000; text-character-spacing:1.5; } #Survey_Sites [zoom>7]{ ::shape{ marker-width:12; marker-fill:#f45; marker-line-color:#813; marker-allow-overlap:true;} ::label [zoom>9]{ text-face-name:'Arial Black'; text-name:"[SectionID]"; text-size:16; text-halo-radius:1.5; text-halo-fill:#fff; text-fill:black; text-placement-type: simple; text-placements: "N,S,E,W,NE,SE,NW,SW,14,12,10"; text-dy: 10; text-dx: 10; } } #Oceans { polygon-opacity:1; polygon-fill:rgb(190,232,255);
} #country_boundaries [zoom<12]{ ::solid { line-color: @medgray; line-width: 4; } ::dashed { line-color: black; line-width:.5; line-dasharray: 6,1,2,1,2,1; polygon-opacity:0; polygon-fill:#fff;} } #states_ln_10M { [zoom<7]{ ::solid { line-color: @medgray; line-width: 1; } ::dashed { line-color: black; line-width:.5; line-dasharray: 6,1,2,1,2,1; } }} #state_labels_10M { [zoom>5][zoom<10] { text-name:"[NAME_1]"; text-face-name:'Times New Roman Regular'; text-size:26; text-fill:@darkgray; text-character-spacing:3; }} #states_ln [zoom>6]{ ::solid { line-color: @medgray; line-width: 2; } ::dashed { line-color: black; line-width:.5; line-dasharray: 6,1,2,1,2,1; } } #WBD_L4_Labels [zoom>8][zoom<10]{ ::fill{ line-opacity:0; polygon-opacity:0;} ::label{ text-name:"[Name]"; text-face-name:"Times New Roman Bold";
text-size:18; text-placement:interior; text-placement-type: simple; text-fill:#555; text-wrap-width: 50; text-allow-overlap: true;
} *#Raster_XX [zoom>14]{ raster-opacity:1; } }
* Note: 75 individual Geotiff rasters were add to this project. These are not included in the CartoCSS code since they are all the same except the layer names.