electronic communication survey - nspra · mobile app, linkedin, instagram, ... how many...
TRANSCRIPT
This survey was conducted from June 2 through June 19, 2015.
399 NSPRA members responded.
All rights reserved. You may not reproduce or transmit any part of this publication in any form
without permission from the National School Public Relations Association. © NSPRA 2015
Electronic
Communication
Survey
Electronic Communication Survey
1
Electronic Communication Survey
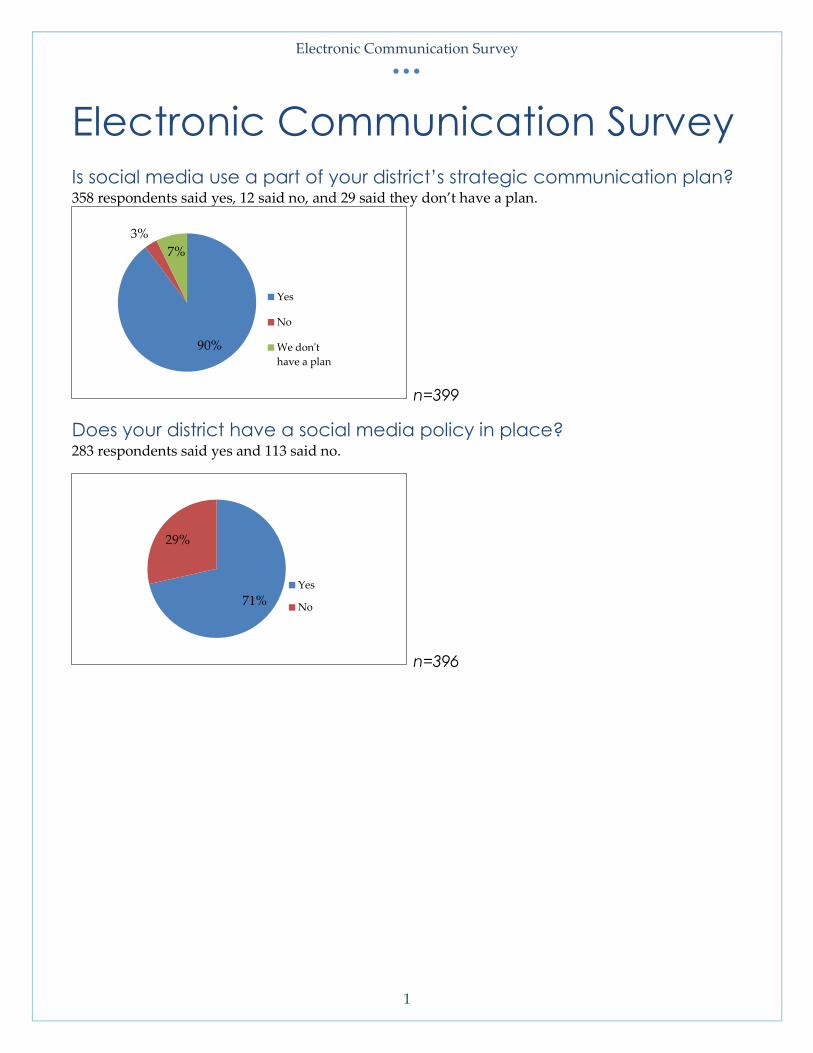
Is social media use a part of your district’s strategic communication plan? 358 respondents said yes, 12 said no, and 29 said they don’t have a plan.
n=399
Does your district have a social media policy in place? 283 respondents said yes and 113 said no.
n=396
90%
3%
7%
Yes
No
We don't
have a plan
71%
29%
Yes
No
Electronic Communication Survey
2
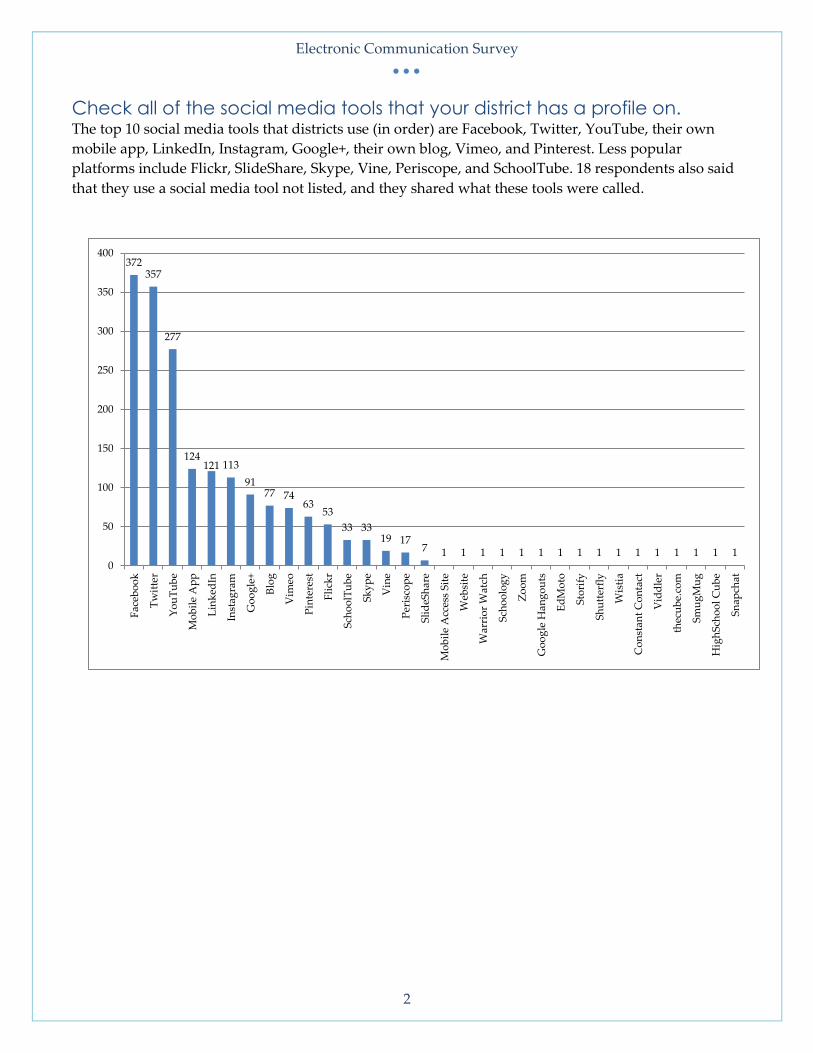
Check all of the social media tools that your district has a profile on. The top 10 social media tools that districts use (in order) are Facebook, Twitter, YouTube, their own
mobile app, LinkedIn, Instagram, Google+, their own blog, Vimeo, and Pinterest. Less popular
platforms include Flickr, SlideShare, Skype, Vine, Periscope, and SchoolTube. 18 respondents also said
that they use a social media tool not listed, and they shared what these tools were called.
372 357
277
124 121 113
91 77 74
63 53
33 33 19 17
7 1 1 1 1 1 1 1 1 1 1 1 1 1 1 1 1 0
50
100
150
200
250
300
350
400
Fac
ebo
ok
Tw
itte
r
Yo
uT
ub
e
Mo
bil
e A
pp
Lin
ked
In
Inst
agra
m
Go
og
le+
Blo
g
Vim
eo
Pin
tere
st
Fli
ckr
Sch
oo
lTu
be
Sk
yp
e
Vin
e
Per
isco
pe
Sli
deS
har
e
Mo
bil
e A
cces
s S
ite
Web
site
War
rio
r W
atch
Sch
oo
log
y
Zo
om
Go
og
le H
ang
ou
ts
Ed
Mo
to
Sto
rify
Sh
utt
erfl
y
Wis
tia
Co
nst
ant
Co
nta
ct
Vid
dle
r
thec
ub
e.co
m
Sm
ug
Mu
g
Hig
hS
cho
ol
Cu
be
Sn
apch
at
Electronic Communication Survey
3
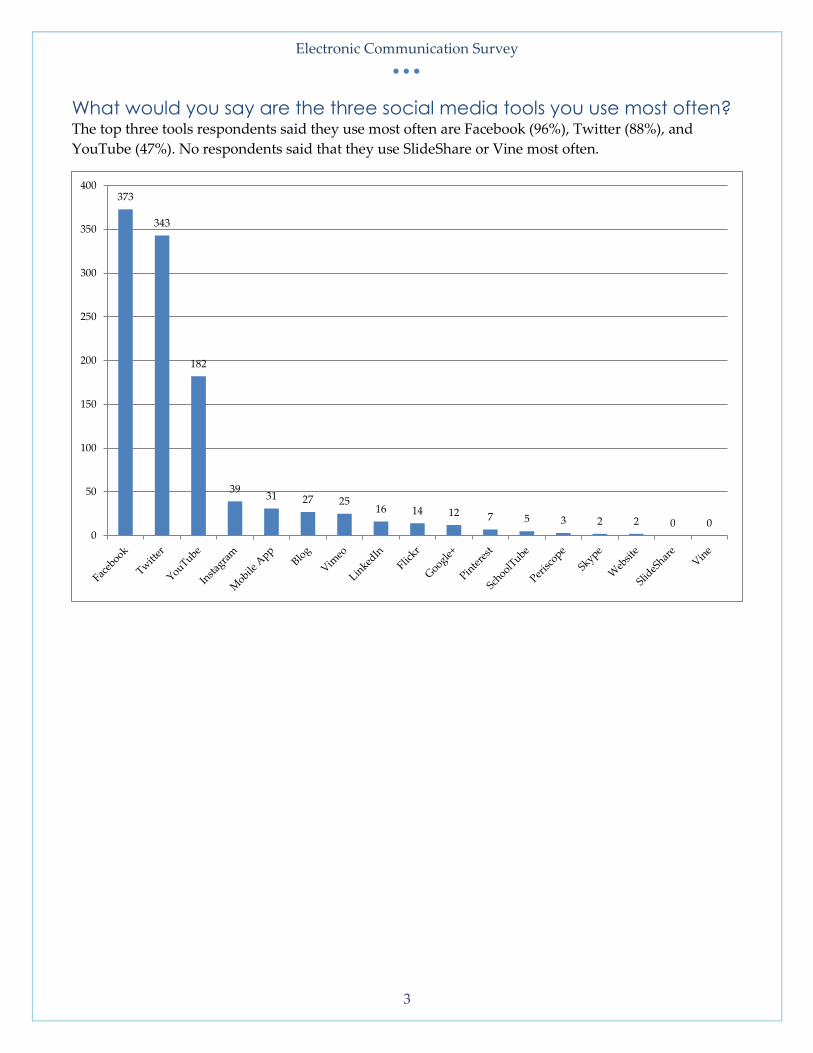
What would you say are the three social media tools you use most often? The top three tools respondents said they use most often are Facebook (96%), Twitter (88%), and
YouTube (47%). No respondents said that they use SlideShare or Vine most often.
373
343
182
39 31 27 25
16 14 12 7 5 3 2 2 0 0 0
50
100
150
200
250
300
350
400

Electronic Communication Survey
4
Which three social media tools would you anticipate using most often
three years from now? Member said that they most anticipated using Twitter (75%), Facebook (67%), and YouTube (39%) most
often three years from now. They also believed they would use Instagram (29%), something that
doesn’t even exist yet (23%) or their mobile app. Members least thought they’d be using SlideShare,
Skype, or Vine three years from now.
292
262
152
112
90 85
29 22 17 15 14 13 10 8 4 3 1 1
0
50
100
150
200
250
300
350
Electronic Communication Survey
5
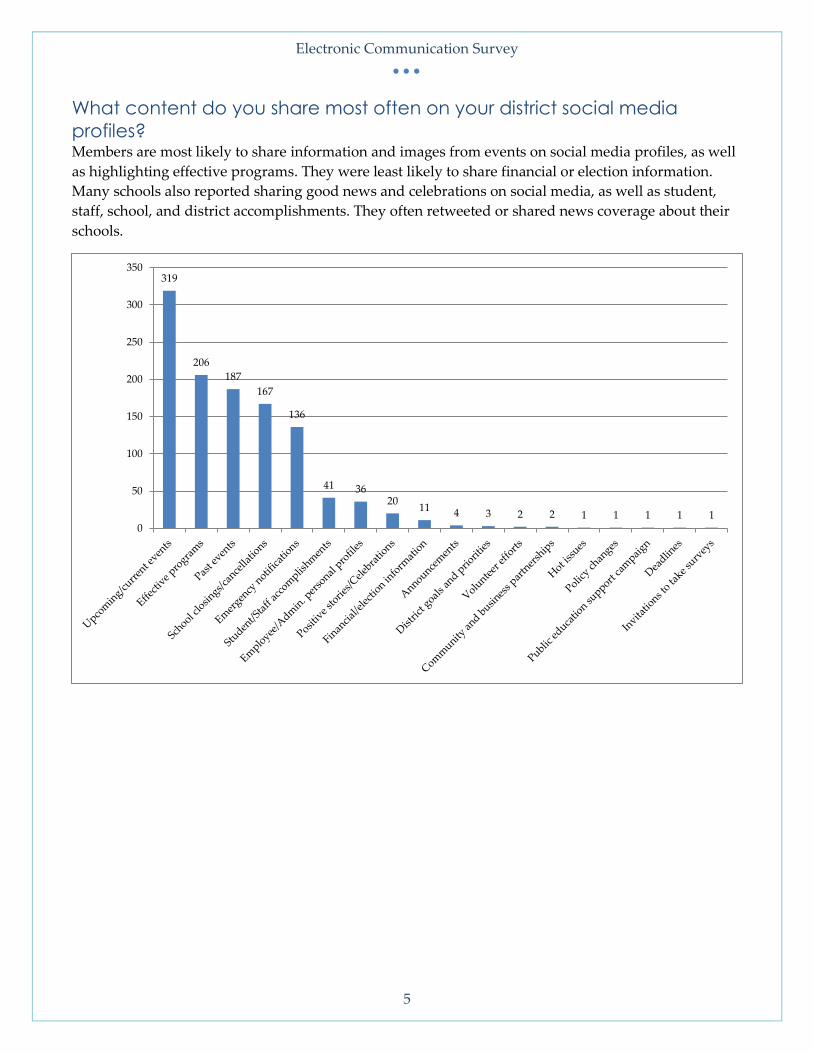
What content do you share most often on your district social media
profiles? Members are most likely to share information and images from events on social media profiles, as well
as highlighting effective programs. They were least likely to share financial or election information.
Many schools also reported sharing good news and celebrations on social media, as well as student,
staff, school, and district accomplishments. They often retweeted or shared news coverage about their
schools.
319
206
187
167
136
41 36 20
11 4 3 2 2 1 1 1 1 1 0
50
100
150
200
250
300
350
Electronic Communication Survey
6
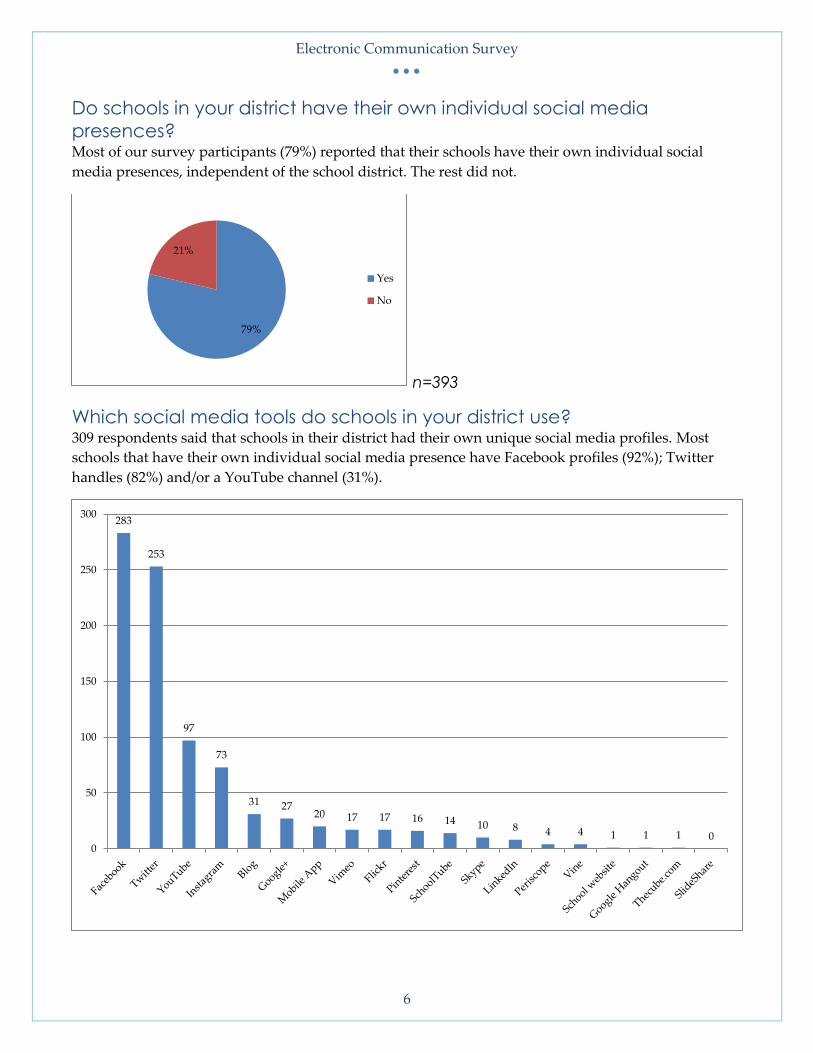
Do schools in your district have their own individual social media
presences? Most of our survey participants (79%) reported that their schools have their own individual social
media presences, independent of the school district. The rest did not.
n=393
Which social media tools do schools in your district use? 309 respondents said that schools in their district had their own unique social media profiles. Most
schools that have their own individual social media presence have Facebook profiles (92%); Twitter
handles (82%) and/or a YouTube channel (31%).
79%
21%
Yes
No
283
253
97
73
31 27 20 17 17 16 14 10 8 4 4 1 1 1 0
0
50
100
150
200
250
300
Electronic Communication Survey
7
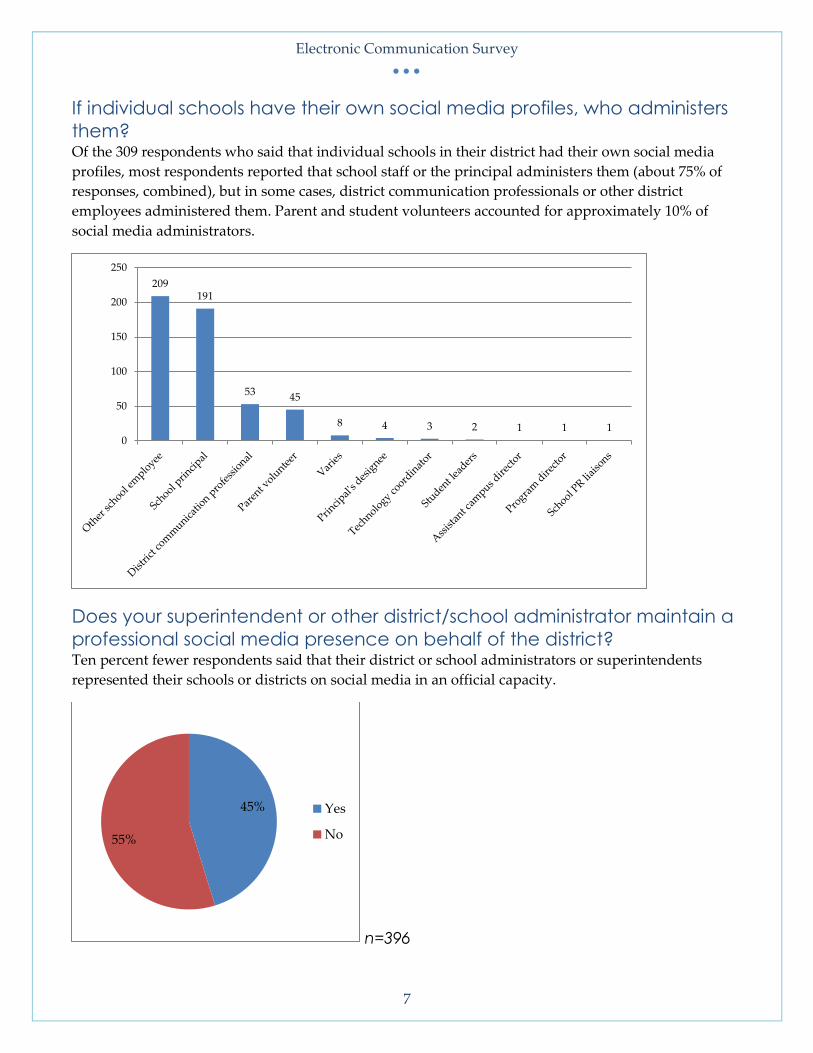
If individual schools have their own social media profiles, who administers
them? Of the 309 respondents who said that individual schools in their district had their own social media
profiles, most respondents reported that school staff or the principal administers them (about 75% of
responses, combined), but in some cases, district communication professionals or other district
employees administered them. Parent and student volunteers accounted for approximately 10% of
social media administrators.
Does your superintendent or other district/school administrator maintain a
professional social media presence on behalf of the district? Ten percent fewer respondents said that their district or school administrators or superintendents
represented their schools or districts on social media in an official capacity.
n=396
209 191
53 45
8 4 3 2 1 1 1 0
50
100
150
200
250
45%
55%
Yes
No
Electronic Communication Survey
8
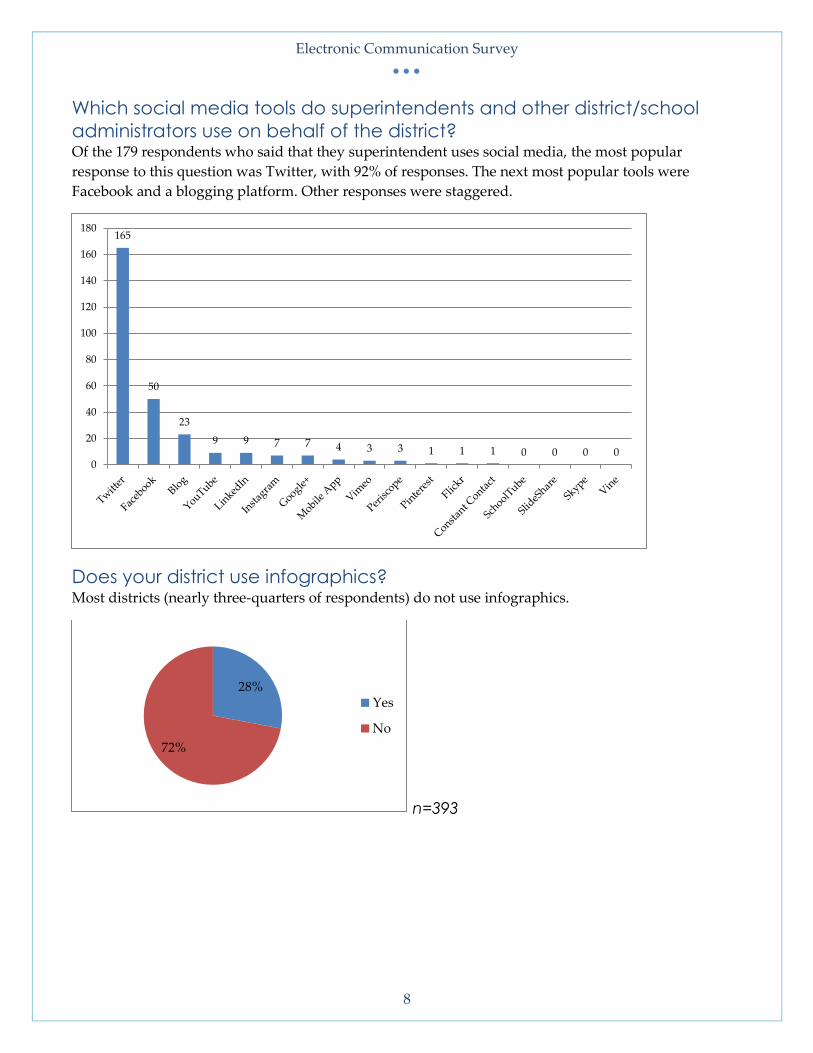
Which social media tools do superintendents and other district/school
administrators use on behalf of the district? Of the 179 respondents who said that they superintendent uses social media, the most popular
response to this question was Twitter, with 92% of responses. The next most popular tools were
Facebook and a blogging platform. Other responses were staggered.
Does your district use infographics? Most districts (nearly three-quarters of respondents) do not use infographics.
n=393
165
50
23
9 9 7 7 4 3 3 1 1 1 0 0 0 0 0
20
40
60
80
100
120
140
160
180
28%
72%
Yes
No
Electronic Communication Survey
9
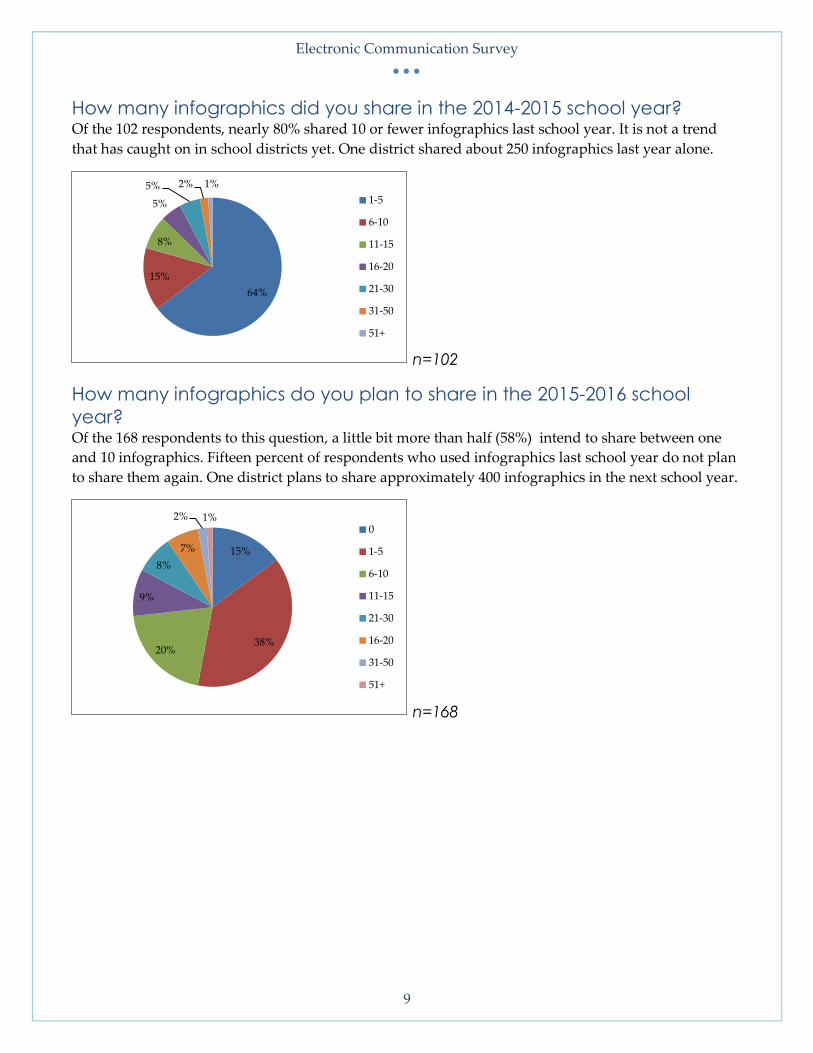
How many infographics did you share in the 2014-2015 school year? Of the 102 respondents, nearly 80% shared 10 or fewer infographics last school year. It is not a trend
that has caught on in school districts yet. One district shared about 250 infographics last year alone.
n=102
How many infographics do you plan to share in the 2015-2016 school
year? Of the 168 respondents to this question, a little bit more than half (58%) intend to share between one
and 10 infographics. Fifteen percent of respondents who used infographics last school year do not plan
to share them again. One district plans to share approximately 400 infographics in the next school year.
n=168
64%
15%
8%
5%
5% 2% 1%
1-5
6-10
11-15
16-20
21-30
31-50
51+
15%
38% 20%
9%
8%
7%
2% 1% 0
1-5
6-10
11-15
21-30
16-20
31-50
51+
Electronic Communication Survey
10
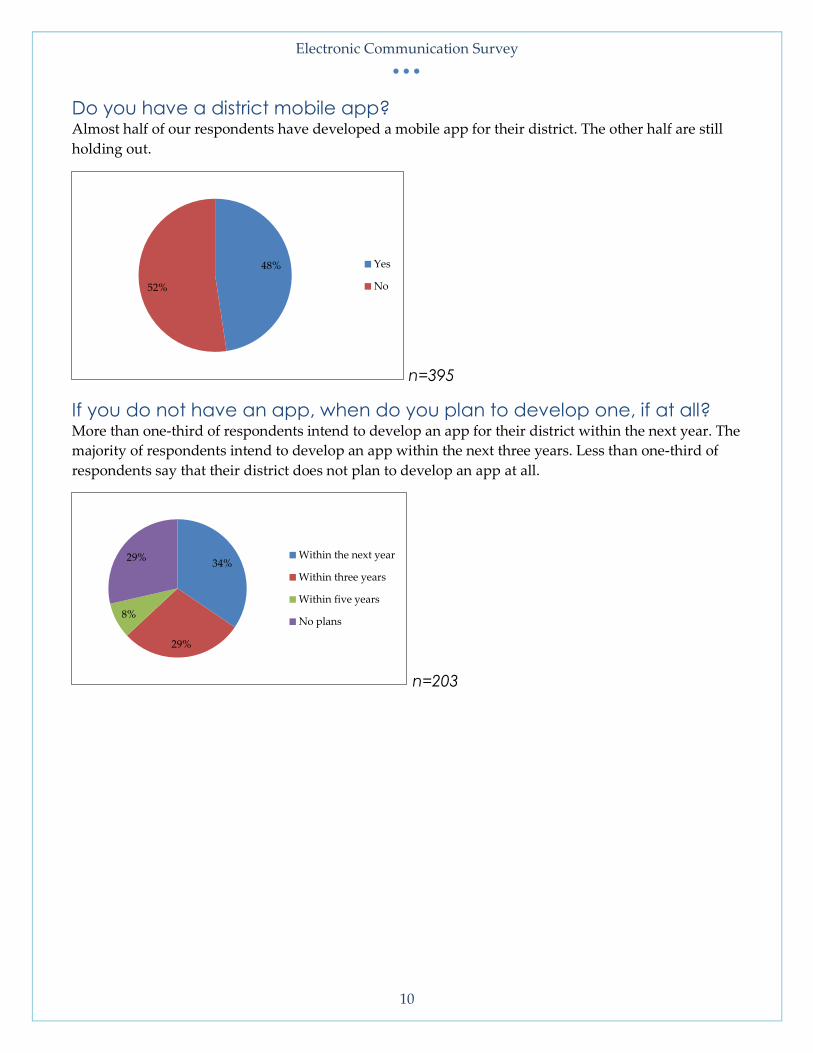
Do you have a district mobile app? Almost half of our respondents have developed a mobile app for their district. The other half are still
holding out.
n=395
If you do not have an app, when do you plan to develop one, if at all? More than one-third of respondents intend to develop an app for their district within the next year. The
majority of respondents intend to develop an app within the next three years. Less than one-third of
respondents say that their district does not plan to develop an app at all.
n=203
48%
52%
Yes
No
34%
29%
8%
29% Within the next year
Within three years
Within five years
No plans
Electronic Communication Survey
11
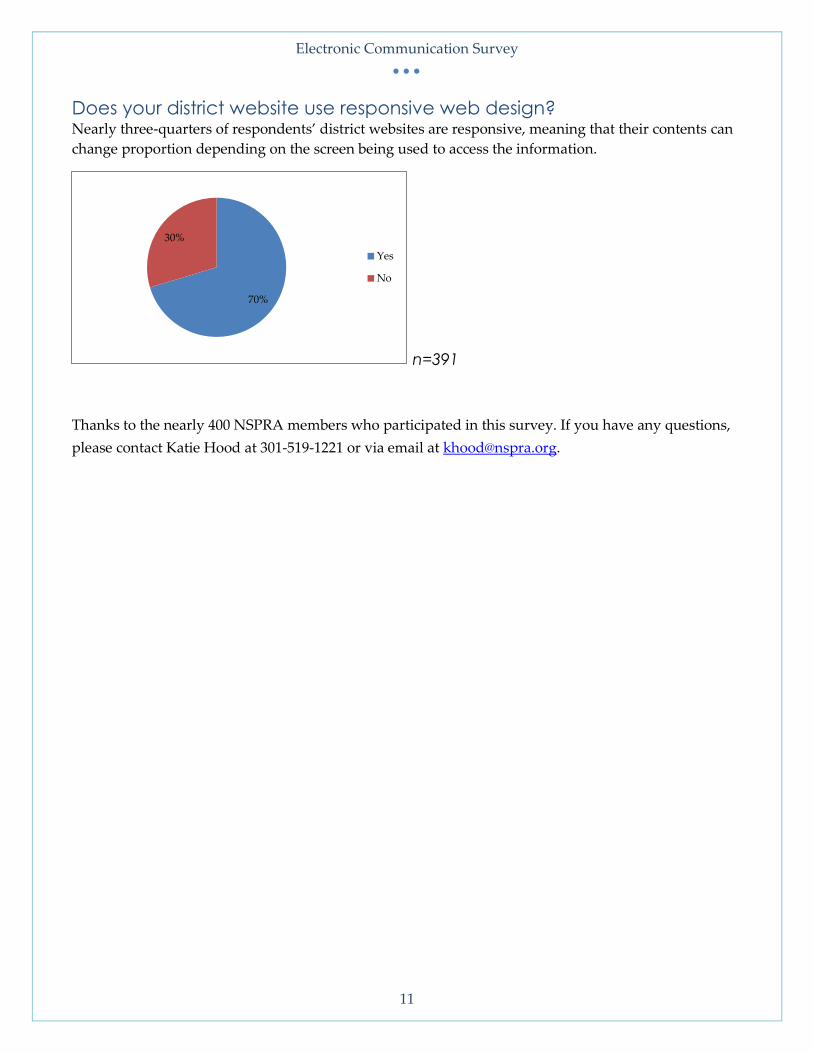
Does your district website use responsive web design? Nearly three-quarters of respondents’ district websites are responsive, meaning that their contents can
change proportion depending on the screen being used to access the information.
n=391
Thanks to the nearly 400 NSPRA members who participated in this survey. If you have any questions,
please contact Katie Hood at 301-519-1221 or via email at [email protected].
70%
30%
Yes
No