electrochemical immunoassay of carcinoembryonic antigen based on tio 2 ...
TRANSCRIPT
Electrochemical immunoassay ofcarcinoembryonic antigen based on TiO2–graphene / thionine / gold nanoparticles composite
Ke-Jing Huang, Zhi-Wei Wu, Ying-Ying Wu, and Yan-Ming Liu
Abstract: A novel multilayer film based on gold nanoparticles (AuNPs), thionine (Thi), and TiO2–graphene (TiO2–Gr) wasexploited to develop a highly sensitive amperometric immunosensor for detecting carcinoembryonic antigen (CEA). Firstly,Nafion–TiO2–Gr homogeneous composite was dropped on the surface of a glassy carbon electrode (GCE). Then Thi waschemisorbed by the TiO2–Gr–Nafion composite. Furthermore, the negative ly charged AuNPs were chemisorbed onto Thifilm through the electrostatic force with the amino groups of Thi. Cyclic voltammetry (CV) was employed to characterizethe assembly process and the performance of the immunosensor. Because of the synergistic effect of the AuNPs, Thi, andthe unique properties of TiO2–Gr, the obtained immunosensor exhibited a wide linear response to CEA in two ranges from0.1 to 10.0 ng mL–1 and from 10.0 to 120.0 ng mL–1 with a relatively low detection limit of 0.01 ng mL–1 (S/N = 3), aswell as good stability and repeatability.
Key words: TiO2–graphene, gold nanoparticles, thionine, carcinoembryonic antigen, immunosensor.
Résumé : On a mis à profit un nouveau film à couches multiples, à base de nanoparticules d’or (NPAu), de thionine (Thi)et de TiO2–graphène (TiO2–Gr), pour développer une sonde immunologique ampérométrique ultrasensible pour la détectionde l’antigène cancéroembryonique (ACE). Dans une première étape, le composite homogène Nafion–TiO2–Gr est déposésur la surface d’une électrode de carbone vitreux (ECV). La thionine est alors chimisorbée par le composite Nafion–TiO2–Gr. Les nanoparticules d’or, chargées négativement, sont ensuite chimisorbées sur le film de thionine par la force électrosta-tique des groupes aminés de la thionine. On a fait appel à la cyclovoltampérométrie pour caractériser le processus d’assem-blage et la performance de la sonde immunologique. En raison des effets de synergie des nanoparticules d’or, de la thionineet des propriétés uniques du TiO2–Gr, la sonde immunologique obtenue présente des plages étendues de réponse linéaire àl’antigène cancéroembryonique (ACE) de 0,1 à 10,0 ng mL–1 et de 10,0 à 120,0 ng mL–1, avec une limite de détection rela-tivement faible de 0,01 ng mL–1 (S/N = 3), ainsi qu’une bonne stabilité et répétabilité.
Mots‐clés : TiO2–graphène, nanoparticules d’or, thionine, antigène cancéroembryonique, sonde immunologique.
[Traduit par la Rédaction]
Introduction
Increasing attention has been focused on the developmentof immunoassay because it has become a major analyticaltool in clinical diagnosis. Many diseases are closely relatedto some proteins that are called as biomarkers, such as carci-noembryonic antigen (CEA) and a-fetoprotein (AFP). How-ever, sensitive detection of protein biomarkers remains agreat challenge as some biomarkers present at ultralow levelsin the early stages of diseases.1,2 It is very important to ex-plore new methods for signal amplification to increase thesensitivity of the detection. Different methods for signal en-hancement have been investigated such as enzyme labeling,3rolling circle amplification,4 and nanomaterial labeling.5Among these methods, nanomaterial labeling is gaininggrowing interest because of the intrinsic advantages of nano-materials, such as low cost, good thermal stability, and largesurface area.6,7
3Graphene (Gr) has recently received attention from mate-rials scientists because of its unique qualities including fastelectron transportation and good biocompatibility, which re-sult in promising applications in electrochemical sensors andbiosensors.8–10 However, many of the interesting and uniqueproperties of Gr can only be realized after it is integratedinto more complex assemblies. Some Gr-based hybrid materi-als have shown greater versatility as advanced electrode ma-terials for the fabrication of electrochemical sensors andbiosensors.11,12TiO2 is a metal oxide that has been widely used in the fab-
rication of electrochemical biosensors and biosensors13,14 ow-ing to its good biocompatibility and high conductivity. Forexample, TiO2 was employed as a support matrix for immo-bilizing enzymes and the results showed that the TiO2-basedcomposite can facilitate the direct electron transfer and en-hance the catalytic activity of enzymes.15 Most recently, we
Received 7 December 2011. Accepted 1 May 2012. Published at www.nrcresearchpress.com/cjc on 4 July 2012.
K.-J. Huang, Z.-W. Wu, Y.-Y. Wu, and Y.-M. Liu. College of Chemistry and Chemical Engineering, Xinyang Normal University,Xinyang 464000, P.R. China.
Corresponding author: Ke-Jing Huang (e-mail: [email protected]).
608
Can. J. Chem. 90: 608–615 (2012) doi:10.1139/V2012-040 Published by NRC Research Press
Can
. J. C
hem
. Dow
nloa
ded
from
ww
w.n
rcre
sear
chpr
ess.
com
by
Geo
rge
Mas
on U
nive
rsity
on
05/1
6/13
For
pers
onal
use
onl
y.

reported a TiO2–graphene (TiO2–Gr) nanocomposite used inelectrochemical biosensor construction and its application insome biomolecule sensing, such as dopamine, glucose, ad-enine, and guanine.16–18 TiO2–Gr based analytical methodsshowed excellent performance, such as high selectivity, broaddynamic range, and low detection limit, owing to the charac-teristics and advantages of the TiO2–Gr nanocomposite, andit opened a new platform for electrochemical sensor and bio-sensor design.CEA, an acidic glycoprotein with a molecular weight of
about 200 kDa, is one of the most extensively used tumormarkers.19 The normal range for CEA in an adult nonsmokeris <2.5 ng mL–1 and the normal range for a smokeris <5.0 ng mL–1. An elevated CEA level in serum may bean early indication of lung cancer, ovarian carcinoma, coloncancer, breast cancer, and cystadenocarcinoma.20,21 In thiswork, a sensitive electrochemical immunosensor for the de-tection of CEA based on a signal amplification of gold nano-particles (AuNPs), thionine (Thi), and TiO2–Gr is reported.Nafion–TiO2–Gr composite was employed to form a stableand uniform film on the cleaned glassy carbon electrode(GCE) surface. Furthermore, Thi could be adsorbed on theNafion–TiO2–Gr film based on the electronic exchange be-tween Nafion and cationic dye Thi. Moreover, AuNPs, whichwere utilized to immobilize the biomolecule for its biocom-patibility and to provide satisfactory conductive capability,were adsorbed on Thi film through opposite-charged adsorp-tion and the interaction between AuNPs and the aminogroups of Thi. In this case, an efficiently conductive multi-layer was formed on the electrode surface, which was respon-sible for the satisfactory current and amplified sensitivity.The whole route of this novel immunosensor immobilizationwas very simple and time-saving. This developed immunoas-say showed good performance in areas such as high sensitiv-ity, improved stability, good selectivity, and wider linearrange owing to the synergic effects of TiO2–Gr, Thi, andAuNPs. This strategy could be further developed for practicalclinical detections of CEA and other important tumormarkers.
Experimental
MaterialsChloroauric acid, sodium citrate, graphite powder, hydra-
zine solution (50 wt %), and ammonia solution (28 wt %)were obtained from the Shanghai Chemical Reagent Corpora-tion (Shanghai, P.R. China). Bovine serum albumin (BSA),CEA, prostate-specific antigen (PSA), low-density lipoprotein(LDL), and human immunoglobulin (HIgG) were obtainedfrom Sigma-Aldrich (Saint Louis, Missouri). AFP was pur-chased from Biocell (Zhengzhou, P.R. China). Gold nanopar-ticles were produced by reducing gold chloride tetrahydratewith citric acid.22 The mean size of the prepared Au colloidswas about 18 nm. The acetate buffer solutions with variouspH values were prepared with 0.1 mol/L HAc–NaAc contain-ing 0.1 mol/L KCl. Double-distilled water was used through-out this study
InstrumentsA CHI660D electrochemical workstation (CH Instruments,
Shanghai, P.R. China) and a standard three-electrode cell
containing a platinum wire auxiliary electrode, a saturatedcalomel reference electrode (SCE), and a modified electrodeas the working electrode were employed for the electrochem-ical studies. All of the potentials were with respect to theSCE. The pH measurements were made with a pH meter(MP 230, Mettler–Toledo, Greiffensee, Switzerland).
Preparation of TiO2–Gr nanocompositeGraphene oxide (GO) was prepared from graphite powder
by the modified Hummers method.22 Graphite was put into amixture of 12 mL of concentrated H2SO4, 2.5 g of K2S2O8,and 2.5 g of P2O5. The solution was heated to 80 °C andkept stirring for 5 h using an oil bath. Next, the mixturewas diluted with deionized water (500 mL). The productwas obtained by filtering using a 0.2 µm nylon film andthen dried in air. The product was reoxidized by using theHummers and Offeman method to produce the GO. Exfolia-tion was carried out by sonicating 0.1 mg/mL of the GO dis-persion for 1 h. TiO2–Gr nanocomposite was preparedaccording to the method provided in previous work.16 Inshort, 20 mg of GO was dispersed in a mixed solution ofH2O (10 mL) and ethanol (5 mL) under ultrasonication for1 h to get a homogenous colloidal suspension of exfoliatedGO. Then, 0.2 mL of Ti(Oi-Pr)4 was added to the GO sus-pension and ultrasonicated for another 1 h. The resultantmixture was transferred to a 25 mL Teflon-sealed autoclaveand kept at 130 °C for 12 h. The final product was isolatedby filtration and rinsed thoroughly with water and then etha-nol. After rinsing, the product was dried in vacuum. TheTiO2–Gr nanocomposite was obtained in the form of a blackpowder.
Fabrication of the immunosensorOne milligram of the as-prepared TiO2–Gr nanocomposite
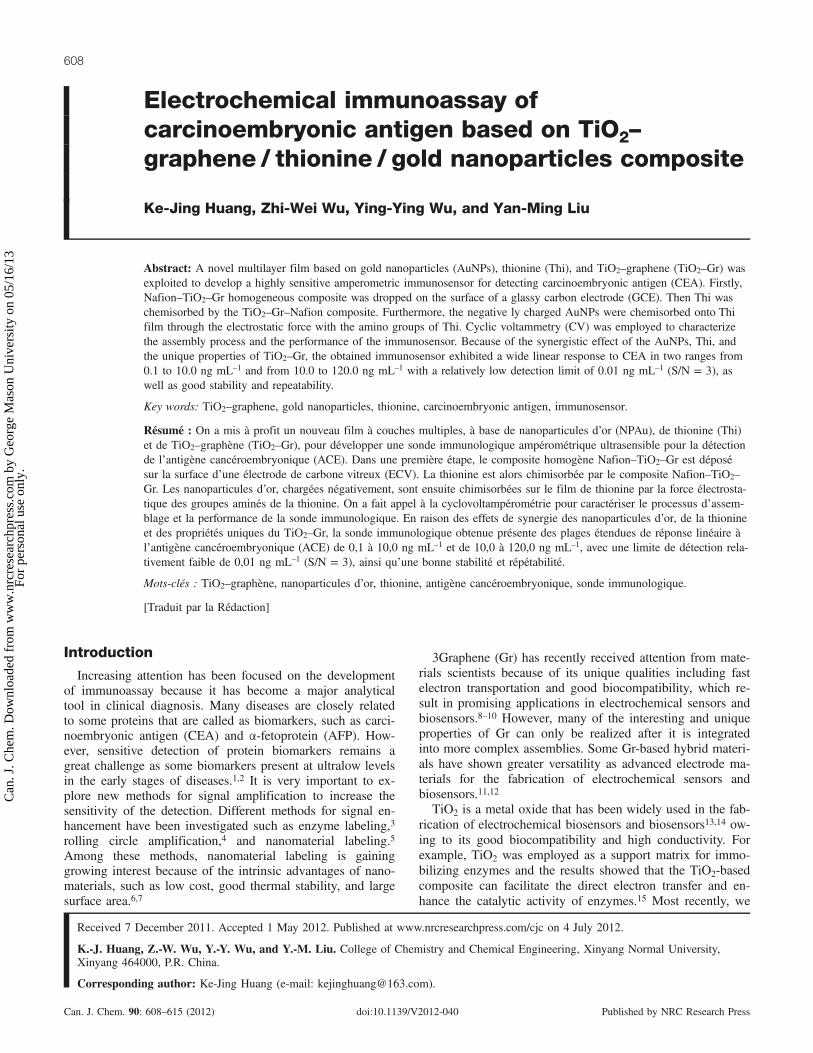
was dispersed in 10.0 mL of 0.25 wt % Nafion solutionunder ultrasonication for 30 min to obtain a homogeneous,well-distributed suspension of Nafion–TiO2–Gr composite.Prior to the modification, the bare GCE (3 mm diameter)was carefully polished to obtain a mirrorlike surface with 0.3and 0.05 µm alumina slurries, followed by successive sonica-tion in water and ethanol for 5 min and then the GCE wasdried in air. Subsequently, 20 µL of the prepared Nafion–TiO2–Gr was dropped on the clean GCE, which was thensoaked in Thi solution (3 mmol/L) for 10 min. Followingthat it was incubated in gold colloids for 2 h. Twenty micro-litres of anti-CEA antibody was then dropped on the surfaceof the AuNPs / Thi / Nafion–TiO2–Gr / GCE and incubated for6 h at 4 °C. The as-prepared immunosensor (assigned as anti-CEA / AuNPs / Thi / Nafion–TiO2–Gr / GCE) was incubatedin 0.25 wt % BSA for 60 min to eliminate nonspecific bind-ing effects and block the remaining active groups. The proc-ess for the assembly of the immunosensor is presented inScheme 1.
Electrochemical measurementsThe immunosensor was then placed in an unstirred electro-
chemical cell containing 0.1 mol/L HAc–NaAc buffer (pH5.0) at room temperature. The detection of the current re-sponse change before and after the antigen–antibody reactionwas carried out by cyclic voltammetry (CV) measurements,with the potential range from –0.6 to 0.2 V (vs SCE). After
Huang et al. 609
Published by NRC Research Press
Can
. J. C
hem
. Dow
nloa
ded
from
ww
w.n
rcre
sear
chpr
ess.
com
by
Geo
rge
Mas
on U
nive
rsity
on
05/1
6/13
For
pers
onal
use
onl
y.
incubation in antigen, the peak current response of the immu-nosensor was expected to decrease, because the antigen–antibody immunocomplex should hinder the access of theelectron to the electrode. The amount of immunocomplexincreased when the concentration of antigen increased, andthis resulted in a decrease in the current response.
Results and discussion
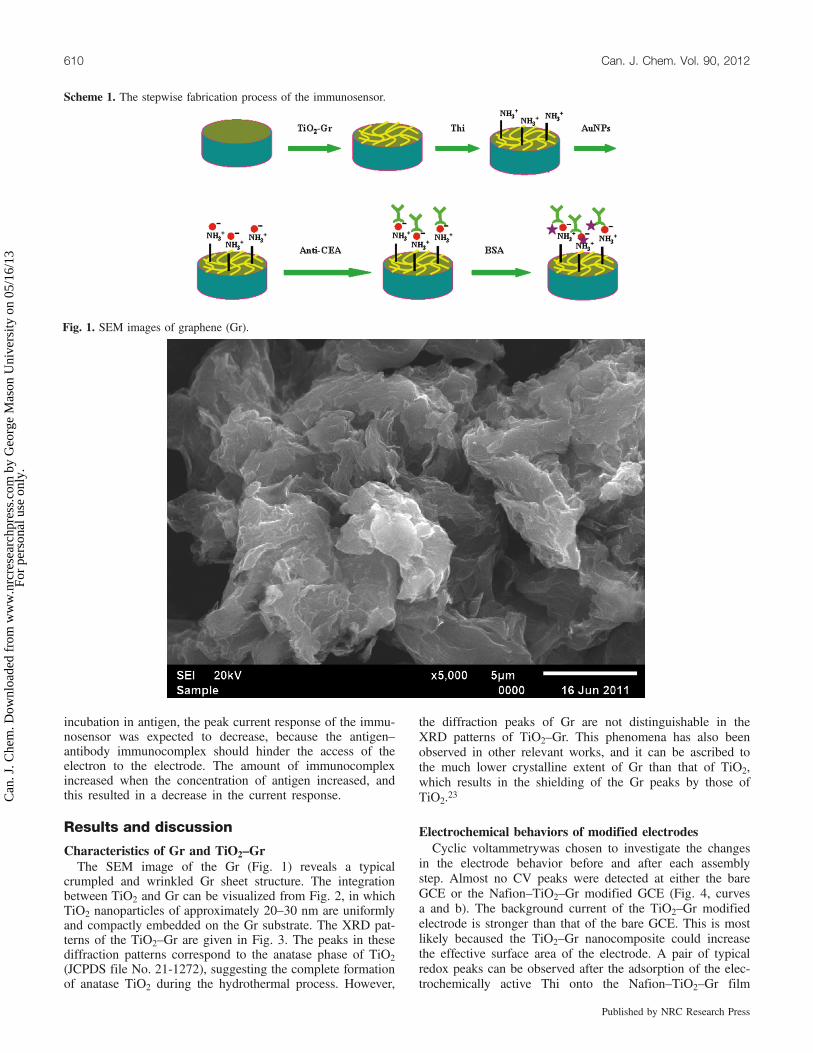
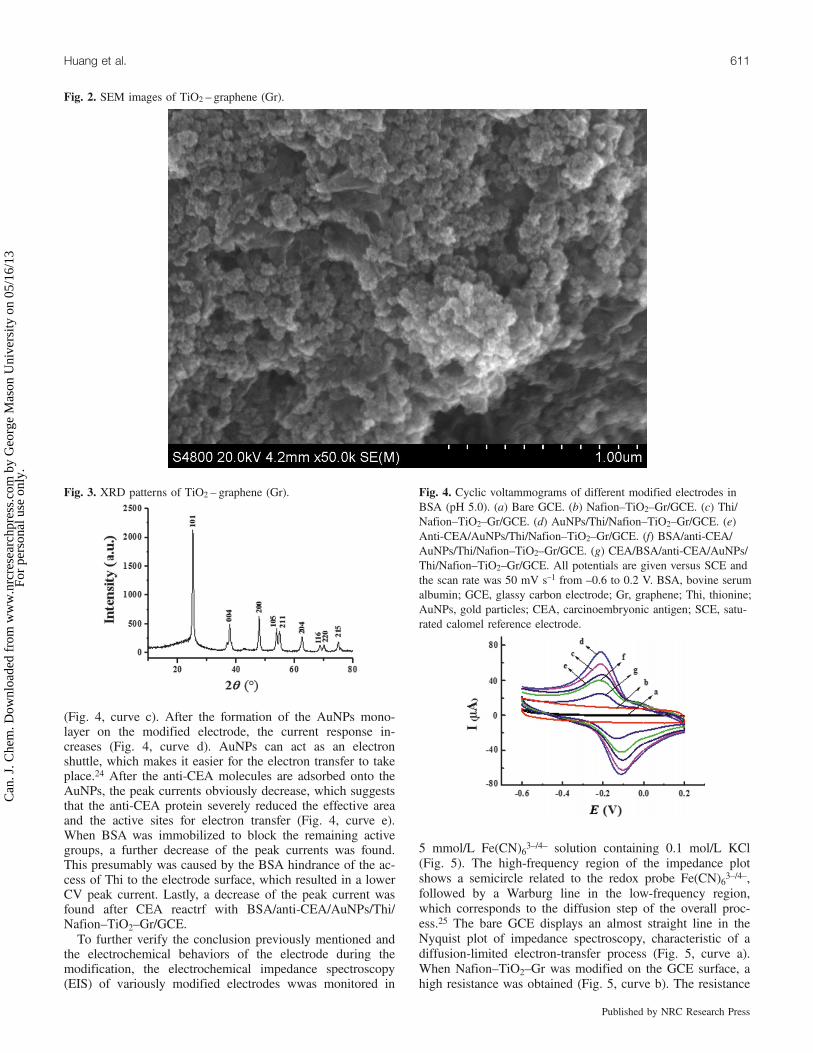
Characteristics of Gr and TiO2–GrThe SEM image of the Gr (Fig. 1) reveals a typical
crumpled and wrinkled Gr sheet structure. The integrationbetween TiO2 and Gr can be visualized from Fig. 2, in whichTiO2 nanoparticles of approximately 20–30 nm are uniformlyand compactly embedded on the Gr substrate. The XRD pat-terns of the TiO2–Gr are given in Fig. 3. The peaks in thesediffraction patterns correspond to the anatase phase of TiO2(JCPDS file No. 21-1272), suggesting the complete formationof anatase TiO2 during the hydrothermal process. However,
the diffraction peaks of Gr are not distinguishable in theXRD patterns of TiO2–Gr. This phenomena has also beenobserved in other relevant works, and it can be ascribed tothe much lower crystalline extent of Gr than that of TiO2,which results in the shielding of the Gr peaks by those ofTiO2.23
Electrochemical behaviors of modified electrodesCyclic voltammetrywas chosen to investigate the changes
in the electrode behavior before and after each assemblystep. Almost no CV peaks were detected at either the bareGCE or the Nafion–TiO2–Gr modified GCE (Fig. 4, curvesa and b). The background current of the TiO2–Gr modifiedelectrode is stronger than that of the bare GCE. This is mostlikely becaused the TiO2–Gr nanocomposite could increasethe effective surface area of the electrode. A pair of typicalredox peaks can be observed after the adsorption of the elec-trochemically active Thi onto the Nafion–TiO2–Gr film
Scheme 1. The stepwise fabrication process of the immunosensor.
Fig. 1. SEM images of graphene (Gr).
610 Can. J. Chem. Vol. 90, 2012
Published by NRC Research Press
Can
. J. C
hem
. Dow
nloa
ded
from
ww
w.n
rcre
sear
chpr
ess.
com
by
Geo
rge
Mas
on U
nive
rsity
on
05/1
6/13
For
pers
onal
use
onl
y.
(Fig. 4, curve c). After the formation of the AuNPs mono-layer on the modified electrode, the current response in-creases (Fig. 4, curve d). AuNPs can act as an electronshuttle, which makes it easier for the electron transfer to takeplace.24 After the anti-CEA molecules are adsorbed onto theAuNPs, the peak currents obviously decrease, which suggeststhat the anti-CEA protein severely reduced the effective areaand the active sites for electron transfer (Fig. 4, curve e).When BSA was immobilized to block the remaining activegroups, a further decrease of the peak currents was found.This presumably was caused by the BSA hindrance of the ac-cess of Thi to the electrode surface, which resulted in a lowerCV peak current. Lastly, a decrease of the peak current wasfound after CEA reactrf with BSA/anti-CEA/AuNPs/Thi/Nafion–TiO2–Gr/GCE.To further verify the conclusion previously mentioned and
the electrochemical behaviors of the electrode during themodification, the electrochemical impedance spectroscopy(EIS) of variously modified electrodes wwas monitored in
5 mmol/L Fe(CN)63–/4– solution containing 0.1 mol/L KCl(Fig. 5). The high-frequency region of the impedance plotshows a semicircle related to the redox probe Fe(CN)63–/4–,followed by a Warburg line in the low-frequency region,which corresponds to the diffusion step of the overall proc-ess.25 The bare GCE displays an almost straight line in theNyquist plot of impedance spectroscopy, characteristic of adiffusion-limited electron-transfer process (Fig. 5, curve a).When Nafion–TiO2–Gr was modified on the GCE surface, ahigh resistance was obtained (Fig. 5, curve b). The resistance
Fig. 3. XRD patterns of TiO2 – graphene (Gr). Fig. 4. Cyclic voltammograms of different modified electrodes inBSA (pH 5.0). (a) Bare GCE. (b) Nafion–TiO2–Gr/GCE. (c) Thi/Nafion–TiO2–Gr/GCE. (d) AuNPs/Thi/Nafion–TiO2–Gr/GCE. (e)Anti-CEA/AuNPs/Thi/Nafion–TiO2–Gr/GCE. (f) BSA/anti-CEA/AuNPs/Thi/Nafion–TiO2–Gr/GCE. (g) CEA/BSA/anti-CEA/AuNPs/Thi/Nafion–TiO2–Gr/GCE. All potentials are given versus SCE andthe scan rate was 50 mV s–1 from –0.6 to 0.2 V. BSA, bovine serumalbumin; GCE, glassy carbon electrode; Gr, graphene; Thi, thionine;AuNPs, gold particles; CEA, carcinoembryonic antigen; SCE, satu-rated calomel reference electrode.
Fig. 2. SEM images of TiO2 – graphene (Gr).
Huang et al. 611
Published by NRC Research Press
Can
. J. C
hem
. Dow
nloa
ded
from
ww
w.n
rcre
sear
chpr
ess.
com
by
Geo
rge
Mas
on U
nive
rsity
on
05/1
6/13
For
pers
onal
use
onl
y.
decreased after Thi was assembled on the surface of Nafion–TiO2–Gr (Fig. 5, curve c). This may occur because Thi as amediator could facilitate the electron transfer and the posi-tively charged Thi could attract the negatively charged Fe(CN)63–/4–. In contrast, the resistance decreased again at theAuNPs/Thi/Nafion–TiO2–Gr/GCE (Fig. 5, curve d), which ismainly attributed to the high conductivity of AuNPs. Anti-CEA antibody is a biomacromolecule with weak electroactiv-ity and its assembly resulted in a resistance increase (Fig. 5,curve e). After the electrode was blocked with BSA, the re-sistance increased (Fig. 5, curve f), which can be attributedto the fact that the outer protein membrane insulates the con-ductive support and counteracts the interfacial electron trans-fer. After immobilization of CEA onto the electrode surface,a remarkable increase in the resistance was observed (Fig. 5,
curve g). The reason is that the immunocomplex layer on theelectrode acts as the electron communication and mass-transferblocking layer, further insulating the conductive support andsignificantly hindering the access of the redox probe to theelectrode surface.
Optimizing conditions for immunoassayThe incubation time is a block to the improvement of im-
munoassay efficiency, which is usually controlled by themass transport of immunoreagents and the kinetics of immu-noreaction. Figure 6 displays the electrochemical responsesof the immunosensor in pH 5.0 BSA after incubation with30 ng mL–1 CEA for various times. The peak currents in-crease with the increasing incubation time and then tends tolevel off after 18 min, and a longer incubation time does notimprove the response. Thus, 18 min was used for the anti-gen–antibody reaction. Figure 5b shows the CVs of the im-munosensor in 0.1 mol/L BSA with various pH values at50 mV s–1 after incubation with 30 ng mL–1 CEA. As indi-cated in Fig. 7, the peak currents decrease with an increasein pH from 4.0 to 7.0, while the potential separation of theanodic peak and cathodic peak increases. At BSA pH 5.0,the electrochemical immunosensor exhibits a quasireversibleredox process. Meanwhile, we also considered that higher orlower pH might affect the bioactivity of the immobilized pro-teins. So, ABS pH 5.0 was selected for the detection of CEA.The effect of incubation temperature on the peak currents
Fig. 5. Electrochemical impedance spectroscopy (EIS) of differentmodified electrodes in 5 mmol/L Fe(CN)63–/4– solution containing0.1 mol/L KCl: (a) bare GCE, (b) Nafion–TiO2–Gr/GCE, (c) Thi/Nafion–TiO2–Gr/GCE, (d) AuNPs/Thi/Nafion–TiO2–Gr/GCE, (e)anti-CEA/AuNPs/Thi/Nafion-–TiO2–Gr/GCE, (f) BSA/anti-CEA/AuNPs/Thi/Nafion–TiO2–Gr/GCE, and (g) CEA/BSA/anti-CEA/AuNPs/Thi/Nafion–TiO2–Gr/GCE. The frequency range isfrom 1 ×10⁻² to 1 × 10⁶ Hz with a perturbation amplitude of 5 mV. The in-itial potential is –0.16 V. The inset is the equivalent circuit used tomodel impedance data in the presence of the redox couple. GCE,glassy carbon electrode; Gr, graphene; Thi, thionine; AuNPs, goldparticles; CEA, carcinoembryonic antigen. Rs, Zw, Ret, and Cdl re-present the solution resistance, the Warburg diffusion resistance, theelectron-transfer resistance, and the double-layer capacitance, re-spectively.
Fig. 6. Influence of incubation time.
Fig. 7. The immunosensor response in the detection solution (BSA)at various pH values (4.0, 4.5, 5.0, 5.5, 6.0, 6.5, and 7.0).
Fig. 8. Influence of incubation temperature on current response. Allpotentials are given versus a saturated calomel reference electrode(SCE) and the scan rate was 50 mV s–1.
612 Can. J. Chem. Vol. 90, 2012
Published by NRC Research Press
Can
. J. C
hem
. Dow
nloa
ded
from
ww
w.n
rcre
sear
chpr
ess.
com
by
Geo
rge
Mas
on U
nive
rsity
on
05/1
6/13
For
pers
onal
use
onl
y.
was studied over a temperature range from 10 to 45 °C. Themaximum response appears at an incubation temperature of35 °C (Fig. 8). However, considering the activity of the bio-molecule and the lifetime of the immunosensor, a tempera-ture of 25 °C was used for the experiment.
Analytical performance of the immunosensorUnder optimal conditions, the immunosensor was incu-
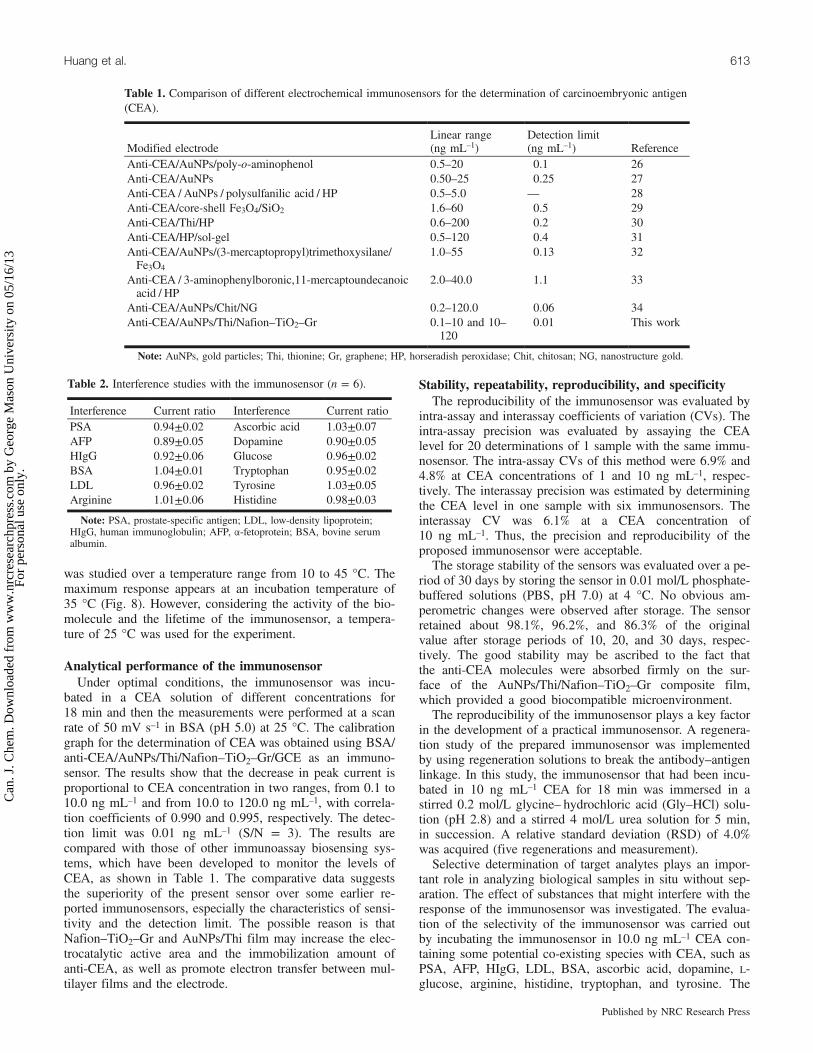
bated in a CEA solution of different concentrations for18 min and then the measurements were performed at a scanrate of 50 mV s–1 in BSA (pH 5.0) at 25 °C. The calibrationgraph for the determination of CEA was obtained using BSA/anti-CEA/AuNPs/Thi/Nafion–TiO2–Gr/GCE as an immuno-sensor. The results show that the decrease in peak current isproportional to CEA concentration in two ranges, from 0.1 to10.0 ng mL–1 and from 10.0 to 120.0 ng mL–1, with correla-tion coefficients of 0.990 and 0.995, respectively. The detec-tion limit was 0.01 ng mL–1 (S/N = 3). The results arecompared with those of other immunoassay biosensing sys-tems, which have been developed to monitor the levels ofCEA, as shown in Table 1. The comparative data suggeststhe superiority of the present sensor over some earlier re-ported immunosensors, especially the characteristics of sensi-tivity and the detection limit. The possible reason is thatNafion–TiO2–Gr and AuNPs/Thi film may increase the elec-trocatalytic active area and the immobilization amount ofanti-CEA, as well as promote electron transfer between mul-tilayer films and the electrode.
Stability, repeatability, reproducibility, and specificityThe reproducibility of the immunosensor was evaluated by
intra-assay and interassay coefficients of variation (CVs). Theintra-assay precision was evaluated by assaying the CEAlevel for 20 determinations of 1 sample with the same immu-nosensor. The intra-assay CVs of this method were 6.9% and4.8% at CEA concentrations of 1 and 10 ng mL–1, respec-tively. The interassay precision was estimated by determiningthe CEA level in one sample with six immunosensors. Theinterassay CV was 6.1% at a CEA concentration of10 ng mL–1. Thus, the precision and reproducibility of theproposed immunosensor were acceptable.The storage stability of the sensors was evaluated over a pe-
riod of 30 days by storing the sensor in 0.01 mol/L phosphate-buffered solutions (PBS, pH 7.0) at 4 °C. No obvious am-perometric changes were observed after storage. The sensorretained about 98.1%, 96.2%, and 86.3% of the originalvalue after storage periods of 10, 20, and 30 days, respec-tively. The good stability may be ascribed to the fact thatthe anti-CEA molecules were absorbed firmly on the sur-face of the AuNPs/Thi/Nafion–TiO2–Gr composite film,which provided a good biocompatible microenvironment.The reproducibility of the immunosensor plays a key factor
in the development of a practical immunosensor. A regenera-tion study of the prepared immunosensor was implementedby using regeneration solutions to break the antibody–antigenlinkage. In this study, the immunosensor that had been incu-bated in 10 ng mL–1 CEA for 18 min was immersed in astirred 0.2 mol/L glycine– hydrochloric acid (Gly–HCl) solu-tion (pH 2.8) and a stirred 4 mol/L urea solution for 5 min,in succession. A relative standard deviation (RSD) of 4.0%was acquired (five regenerations and measurement).Selective determination of target analytes plays an impor-
tant role in analyzing biological samples in situ without sep-aration. The effect of substances that might interfere with theresponse of the immunosensor was investigated. The evalua-tion of the selectivity of the immunosensor was carried outby incubating the immunosensor in 10.0 ng mL–1 CEA con-taining some potential co-existing species with CEA, such asPSA, AFP, HIgG, LDL, BSA, ascorbic acid, dopamine, L-glucose, arginine, histidine, tryptophan, and tyrosine. The
Table 1. Comparison of different electrochemical immunosensors for the determination of carcinoembryonic antigen(CEA).
Modified electrodeLinear range(ng mL–1)
Detection limit(ng mL–1) Reference
Anti-CEA/AuNPs/poly-o-aminophenol 0.5–20 0.1 26Anti-CEA/AuNPs 0.50–25 0.25 27Anti-CEA / AuNPs / polysulfanilic acid / HP 0.5–5.0 — 28Anti-CEA/core-shell Fe3O4/SiO2 1.6–60 0.5 29Anti-CEA/Thi/HP 0.6–200 0.2 30Anti-CEA/HP/sol-gel 0.5–120 0.4 31Anti-CEA/AuNPs/(3-mercaptopropyl)trimethoxysilane/Fe3O4
1.0–55 0.13 32
Anti-CEA / 3-aminophenylboronic,11-mercaptoundecanoicacid / HP
2.0–40.0 1.1 33
Anti-CEA/AuNPs/Chit/NG 0.2–120.0 0.06 34Anti-CEA/AuNPs/Thi/Nafion–TiO2–Gr 0.1–10 and 10–
1200.01 This work
Note: AuNPs, gold particles; Thi, thionine; Gr, graphene; HP, horseradish peroxidase; Chit, chitosan; NG, nanostructure gold.
Table 2. Interference studies with the immunosensor (n = 6).
Interference Current ratio Interference Current ratioPSA 0.94±0.02 Ascorbic acid 1.03±0.07AFP 0.89±0.05 Dopamine 0.90±0.05HIgG 0.92±0.06 Glucose 0.96±0.02BSA 1.04±0.01 Tryptophan 0.95±0.02LDL 0.96±0.02 Tyrosine 1.03±0.05Arginine 1.01±0.06 Histidine 0.98±0.03
Note: PSA, prostate-specific antigen; LDL, low-density lipoprotein;HIgG, human immunoglobulin; AFP, a-fetoprotein; BSA, bovine serumalbumin.
Huang et al. 613
Published by NRC Research Press
Can
. J. C
hem
. Dow
nloa
ded
from
ww
w.n
rcre
sear
chpr
ess.
com
by
Geo
rge
Mas
on U
nive
rsity
on
05/1
6/13
For
pers
onal
use
onl
y.

degree of interference from these substances can be judgedfrom the value of the current ratio. Herein, the current ratioscan be obtained from the current reading of the immunosen-sor incubated in 10.0 ng mL–1 CEA and 10.0 ng mL–1 inter-fering substances versus the current reading with theimmunosensor incubated in 10.0 ng mL–1 CEA. The resultsare listed in Table 2. The results suggested that the substanceselected did not interfere remarkably. Moreover, these non-specific species did not lead to a significant current shift orcurrent change. Therefore, the immunosensor had a good se-lectivity to CEA.
ApplicationTo investigate the reliability of the immunosensor for ac-
tual samples, six human serum samples were diluted to dif-ferent concentrations with PBS (pH 7.0) and were assayedusing the immunosensor with reference to the ELISAmethod. The results are shown in Table 3. The relative devia-tions of the two methods ranged from –6.5% to 6.2%, whichindicated that the results obtained by the immunosensor werein agreement with that obtained by the ELISA. Therefore, theproposed immunosensor could be reasonably applied in as-saying actual samples.
Conclusions
This work developed a novel strategy for an amperometricimmunosensor for CEA based on the antibody adsorbed inAuNPs/Thi/Nafion–TiO2–GR/GCE. The combination of thegood conductivity and a large surface area with TiO2–Gr,and the advantages of the AuNPs/Thi film, including bio-compatibility and amplification, significantly enhanced thesensitivity of the immunosensor. The biosensor possessesgood bioactivity, comparable detection limit and linear range,and acceptable storage stability. The results showed that themethod was simple and sensitive enough for determinationof CEA in human serum samples with good precision andaccuracy. A new goal based on this work is to construct anew TiO2–Gr-based bionanolabel for the amplification of theassay signal. This research could open new avenues in theapplication of TiO2–Gr-based nanocables for clinical immu-noassays, and could provide a convenient platform to modifyfor clinical testing and drug screening.
AcknowledgmentsThis work was supported by the National Natural Science
Foundation of China (Grant No. 21075106), the Program forScience & Technology Innovation Talents in Universities ofHenan Province (Grant No. 2010HASTIT025), and the Ex-cellent Youth Foundation of He’nan Scientific Committee(Grant No. 104100510020).
References(1) Zhang, B.; Zhang, X.; Yan, H. H.; Xu, S. J.; Tang, D. H.; Fu,
W. I. Biosens. Bioelectron. 2007, 23 (1), 19. doi:10.1016/j.bios.2007.03.007.
(2) Wu, J.; Fu, Z. F.; Yan, F.; Ju, H. X. Trends Anal. Chem. 2007,26 (7), 679. doi:10.1016/j.trac.2007.05.007.
(3) Yang, M. H.; Li, H.; Javadi, A.; Gong, S. Q. Biomaterials2010, 31 (12), 3281. doi:10.1016/j.biomaterials.2010.01.033.
(4) Zhou, L.; Ou, L. J.; Chu, X.; Shen, G. L.; Yu, R. Q. Anal.Chem. 2007, 79 (19), 7492. doi:10.1021/ac071059s.
(5) Wan, Y.; Wang, Y.; Wu, J. J.; Zhang, D. Anal. Chem. 2011, 83(3), 648. doi:10.1021/ac103047c.
(6) Wang, J. X.; Zhu, X.; Tu, Q. Y.; Guo, Q.; Zarui, C. S.;Momand, J.; Sun, X. Z.; Zhou, F. M. Anal. Chem. 2008, 80(3), 769. doi:10.1021/ac0714112.
(7) Wang, J.; Meng, W. Y.; Zheng, X. F.; Liu, S. L.; Li, G. X.Biosens. Bioelectron. 2009, 24 (6), 1598. doi:10.1016/j.bios.2008.08.030.
(8) Shan, C.; Yang, H.; Han, D.; Zhang, Q.; Ivaska, A.; Niu, L.Biosens. Bioelectron. 2010, 25 (5), 1070. doi:10.1016/j.bios.2009.09.024.
(9) Savchenko, A. Science 2009, 323 (5914), 589. doi:10.1126/science.1169246.
(10) Zhou, M.; Zhai, Y. M.; Dong, S. J. Anal. Chem. 2009, 81 (14),5603. doi:10.1021/ac900136z.
(11) Guo, S. J.; Wen, D.; Zhai, Y.; Dong, S. J.; Wang, E. K. ACSNano 2010, 4 (7), 3959. doi:10.1021/nn100852h.
(12) Shan, C.; Yang, H.; Han, D.; Zhang, Q.; Ivaska, A.; Niu, L.Biosens. Bioelectron. 2010, 26 (7), 3181.
(13) Jiang, L. C.; Zhang, W. D. Electroanalysis 2009, 21 (8), 988.doi:10.1002/elan.200804502.
(14) Lin, H. G.; Ji, X. B.; Chen, Q. Y.; Zhou, Y. K.; Banks, C. E.;Wu, K. B. Electrochem. Commun. 2009, 11 (10), 1990. doi:10.1016/j.elecom.2009.08.034.
(15) Bao, S. J.; Li, C. M.; Zang, J. F.; Cui, X. Q.; Qiao, Y.; Guo, J.Adv. Funct. Mater. 2008, 18 (4), 591. doi:10.1002/adfm.200700728.
(16) Fan, Y.; Lu, H. T.; Liu, J. H.; Yang, C. P.; Jing, Q. S.; Zhang,Y. X.; Yang, X. K.; Huang, K. J. Colloids Surf. B Biointerfaces2011, 83 (1), 78. doi:10.1016/j.colsurfb.2010.10.048.
(17) Fan, Y.; Huang, K.-J.; Niu, D.-J.; Yang, C.-P.; Jing, Q.-S.Electrochim. Acta 2011, 56 (12), 4685. doi:10.1016/j.electacta.2011.02.114.
(18) Sun, J.-Y.; Huang, K.-J.; Zhao, S.-F.; Fan, Y.; Wu, Z.-W.Bioelectrochemistry 2011, 82 (2), 125. doi:10.1016/j.bioelechem.2011.06.007.
(19) Gao, X.; Zhang, Y. M.; Chen, H.; Chen, Z. C.; Lin, X. F. Anal.Biochem. 2011, 414 (1), 70. doi:10.1016/j.ab.2011.03.005.
(20) Sato, K.; Tokeshi, M.; Kimura, H.; Kitamori, T. Anal. Chem.2001, 73 (6), 1213. doi:10.1021/ac000991z.
(21) Li, J. P.; Gao, H. L.; Chen, Z. Q.; Wei, X. P.; Yang, C. F. Anal.Chim. Acta 2010, 665 (1), 98. doi:10.1016/j.aca.2010.03.020.
(22) Kovtyukhova, N. I.; Ollivier, P. J.; Martin, B. R.; Mallouk, T.E.; Chizhik, S. A.; Buzaneva, E. V.; Gorchinskiy, A. D. Chem.Mater. 1999, 11 (3), 771. doi:10.1021/cm981085u.
Table 3. Comparison of the results of the analyses of serum samples using two different methods.
Method
Sample (ng mL–1)
1 2 3 4 5ELISA 5.1±0.2 14.3±0.2 21.6±0.6 40.4±0.5 70.3±0.8Method described in this work 4.8±0.3 14.9±0.6 20.2±0.3 42.9±0.5 74.1±0.7Relative standard deviation (%) –5.9 4.2 –6.5 6.2 5.4
614 Can. J. Chem. Vol. 90, 2012
Published by NRC Research Press
Can
. J. C
hem
. Dow
nloa
ded
from
ww
w.n
rcre
sear
chpr
ess.
com
by
Geo
rge
Mas
on U
nive
rsity
on
05/1
6/13
For
pers
onal
use
onl
y.

(23) Zhang, H.; Lv, X.; Li, Y.; Wang, Y.; Li, J. ACS Nano 2010, 4(1), 380. doi:10.1021/nn901221k.
(24) Chen, H.; Jiang, J. H.; Huang, Y.; Deng, T.; Li, J. S.; Shen, G.L.; Yu, R. Q. Sens. Actuators B Chem. 2006, 117 (1), 211.doi:10.1016/j.snb.2005.11.026.
(25) Atta, N.; El-Kady, M. Talanta 2009, 79 (3), 639. doi:10.1016/j.talanta.2009.04.040.
(26) Tang, H.; Chen, J.; Nie, L.; Kuang, Y.; Yao, S. Biosens.Bioelectron. 2007, 22 (6), 1061. doi:10.1016/j.bios.2006.04.027.
(27) Wu, J.; Tang, J.; Dai, Z.; Yan, F.; Ju, H.; Murr, E. N. Biosens.Bioelectron. 2006, 22 (1), 102. doi:10.1016/j.bios.2005.12.008.
(28) Li, X.; Yuan, R.; Chai, Y.; Zhang, L.; Zhuo, Y.; Zhang, Y. J.
Biotechnol. 2006, 123 (3), 356. doi:10.1016/j.jbiotec.2005.11.023.
(29) Pan, J.; Yang, Q. Anal. Bioanal. Chem. 2007, 388 (1), 279.doi:10.1007/s00216-007-1224-0.
(30) Dai, Z.; Chen, J.; Yan, F.; Ju, H. Cancer Detect. Prev. 2005, 29(3), 233. doi:10.1016/j.cdp.2004.12.003.
(31) Tan, F.; Yan, F.; Ju, H. Electrochem. Commun. 2006, 8 (12),1835. doi:10.1016/j.elecom.2006.08.026.
(32) Tang, D.; Xia, B.Microchim. Acta 2008, 163 (1–2), 41. doi:10.1007/s00604-007-0918-5.
(33) Zhang, X.; Wu, Y.; Tu, Y.; Liu, S. Analyst (Lond.) 2008, 133(4), 485. doi:10.1039/b714896h.
(34) He, X.; Yuan, R.; Chai, Y.; Shi, Y. J. Biochem. Biophys.Methods 2008, 70 (6), 823. doi:10.1016/j.jbbm.2007.06.002.
Huang et al. 615
Published by NRC Research Press
Can
. J. C
hem
. Dow
nloa
ded
from
ww
w.n
rcre
sear
chpr
ess.
com
by
Geo
rge
Mas
on U
nive
rsity
on
05/1
6/13
For
pers
onal
use
onl
y.