electrical property of stannic oxide hirajima,** tomoaki ... · as shown there, the irnpurity...
TRANSCRIPT

Electrical
Kazumasa
PrOperty Of Stannic OXide
HIRAJIMA,** Tomoaki SASAKI**
and Kenzo HIJIKATA**
(Re**i+*d o.t*b** 28, 1972)
Synopsis
A preliminary investigation has been conducted in order to gain "nearly intrinsic" character
on the defect nature of high purity polycrystalline stannic oxide (ca. 5 nine) in the oxygen
pressure range 10-2-103 mmHg (total pressure : I atm) and at the temperature range 550'.-
650'C. Measurement has been made by electrical conductivity (dc and ac) and thermoelec-
tric power techniques. Since the frequency dispersion of the conductivity was not observed at
the frequency range 1-30 KHZ and dc conductivity data corresponded to those of ac and the
sign of the thermo-emf indicated negative, it seems that the carrier is electronic ratber than
ionic. The relation between the log (F and the reciprocal of absolute temperature was represented
by a straight line in the temperature range 550' - 650'C. In the isothermal conductivity as a
function of oxygen partial pressure, a discontinuous change of conductivitity was observed at
P02~~0.3 mmHg, and below 0.3 mmHg, the electrical conductivity increased strikingly with ca. 2
order magnitude having a few 10-1 ~-1 ・ cm~1 in comparison with above 0.3 mmHg, and was
independent on the oxygen partial pressure and temperature, which phenomena seern a metal-
like conduction. While above 0.3 mmHg, the conductivity was found to obey the relation
(;=K・P02~1/m. Values of slope m were shifted from 7.1 to 4.2 with decreasing temperature.
A high temperature X-ray analysis was made on the same stannic oxide powders used for
the electrical conductivity measurements. A phase transformation was not detected from room
temperature to 6000c in oxygen and nitrogen atmospheres (1 atm, respectively). Measurement
of precise lattice parameter was also made on the stannic oxide powders in oxygen and nitrogen
atmospheres at 600'C. The volume of unit cell in oxygen atmosphere increased more than that
in nitrogen.
I. Introduction
The literatures contain many references to the properties of Sn02 films and coatings
as commercial products for many years. Films and coatings, however, are not suited
*
**
Reported at the Spring Meeting of
May 17 (1972).
Inst. Inorg. Chem., Depart. Chem.
Japan.
Japan Soc. of Powder
, Nihon Univ., 3-25 40
& Powder Metall., Tokyo,
Sakurajosui, Setagaya-ku,
Japan.
Tokyo.
- 17 -

Proceedings of the Institute of Natural Sciences (1973)
for studies of the nature of bulk. Very few detailed studiesl-6)can be found on polycry-
stalline bodies or single crystals. Most of these references were studied for Hall effect at
10w temperatures. Marleyi) and Reed2) both have grown single crystals, but have
not reported on their properties as yet. Kohnkef) studied the electrical and optical
properties of natural Sn02 crystals of Bolivian cassiterite with some impurities. He
reported that stannic oxide behaves as a normal broad-band semiconductor in the ex-
trinsic conductivity region above room temperature and found a value of 0.72 eV for the
activation energy of conductivity compared with 0.77 eV calculated from the data of
Foex4) on polycrystalline specimens. Loch5) reported a broad study of Sn02-based com-
positions as semiconductors. Nagasawa, et al6) studied the electrical properties of single
crystals of stannic oxide, prepared from the crystal growth using the vapor reaction of
SnC14 with H20.
It has been well known that semiconductive nature of stannic oxide is n-type,
however, the nature of donor centers responsible for n-type semiconductivity of stannic
oxide is yet unknown. In general, intrinsic electronic properties of oxide semiconductors
depend on lattice defects which are responsible for deviations from stoichiometry due
to interaction of the oxide with surrounding atmosphere. Native defects, namely
oxygen vacancies or interstitial metal ions, can fonu donors with resulting n-type con-
ductivity. The purpose of the present study is to survey whether the dominant donor
centers in pure stannic oxide specimen are composed of defects resulting from the
deviation of stoichiometry. The present investigation was carried out by measuring the
electrical conductivity and thermoelectric power of stannic oxide as a function of the
oxygen partial pressure at the high temperatures. In order to obtain the precise inform-
ation with respect to the electrical property of the oxides caused by the defect formation,
the high-purity oxide specimen was used, because impurities in the specimen will
signiflcantly affect the defect formation.
II. Experimental Procedures
1 . Specimens
The powder of high purity stannic oxide (rutile form) was prepared from five nine
metallic tin (Cu : <1 ppm,, Pb : I ppm. ; Mitsubishi Metal Mining Co., Ltd., Tokyo,
Japan) . Stannic acid, which was obtained by oxidation of metallic tin bar with Arister
HN03 (B. D.H. Co., Ltd. , England) , was washed with tripply distilled water, flltered and
- 400'C. dried in air at 150'C, and then a residual nitric acid was expelled at 350'
After grinding in an agate mortar, the fine powders were heated at 1000"C in air for l
hr. The X-ray diffraction paterns of the powders indicated a well crystallized structure
- 18 -

Electrlcal Property of Stannic Oxide (K.HIRAJIMA, T. SASAKI and K. HIJIKATA)
~f stannic oxide. With a small addition of ethyl alcohol as a binder, the powders were
compacted into tablets at ca. 2 T/cm2. After removing the binder and contamination
from the steel mould, the green compacts were packed in the same stannic oxide pow-
,ders in an alumina crucible, and sintered in a mullite tube with a SiC tube-heater at
1200'C for 6 hr. in air. The apparent densities of the sintered disks (ca. 8 mm in
diameter by 3 mm thick) ~~ere ca. 50 ~ of theoreticals. The impurities of the stannic
oxide powders and of the sintered specimens were analyzed by emission spectrographic
analysis (JACO. Spectrograph with a diffraction grating, Ebert mount 3.4 m) shown in
=Table 1. As shown there, the irnpurity elements, especially tri- and penta-valent metals,
~vere not detected.
Table I Spectrographic analyses* of Sn02 (from 5-nine metallic tin).
Sn02 powders Spectrographic pure
Sintered specimen Spectrographic pure
* J.A.CO. Emission spectrograph with a diffraction
grating, Ebert mount 3.4m.
2. Apparatus and Measurements
All measurements were made in a specially designed quartz tube as shown in Fig.
1. The specimen was held in a specimen holder placed inside the quartz tube, which
,could be evacuated to 10~3 mmHg with a rotary pump. The specimen was sandwitched
between electrodes of platinum plate with an aid of a spring loaded pressure. Gold
plates also were used as the electrodes. Two thermocouples (0.3 mmc. Pt-Pt 13 ~Rh) ,
with platinum wires as current leads, were contacted to each electrodes. The platinum
,arms of the thermocouples are used to measure ~ac conductivity, dc conductivity and
Seebeck voltage. The oxygen partial pressure was controlled in a static system of
atmosphere by using mixtures of oxygen and nitrogen gases. After evacuating the quartz
tube and a gas reservoir (ca. 10-3 mmHg) , a certain amount bf oxygen gas, dried (dew
point : ca. - 50'C) by molecullar sieve.~ * was introduced into the exprimental chamber
with measuring the pressure of oxygen gas by a Pirani gauge, and then dried nitrogen
gas (dew point : ca. - 50'C) was introduced until the total pressure reached to I atm.
The furnace with a Kanthal heater was moved by small increments to vary the tem-
perature difference between the two ends of the specimen.
Fig. 2 shows a schematic diagram of the apparatus for the measurements of
electrical conductivity and thermoelectric power. The conductivity measurements vtere
molecular sieves 5A, Nishio Industries Co., Ltd., Tokyo, Japan. *
- 19 -

Proceedings of the Institute ot Natural Sciences (1973)
Pt lead
/ Pt -Ptl 3% Rh
thermocouple
//'
/'+
quartz tubes
Pt-terminals ¥
:},,
furnaee with // a Kanthal heater
I¥¥ i ' ¥ I Pt- Pt 13~6 Rh ~pecimen Pt lead thermocouple
Fig. I Schematic diagram of
Pt-Pt 130/. Rh thermocouples
specimen holder.
digital millivolr
meter
standard resistor
D.C. circutt X D.C. s~i:~rJ
~-~IIlll[ variable
syncro scope resistor
A.C, generator
gas inlet A.C. circuit Fig. 2 Shematic diagram of apparatus for electrical conductivity and
thernloeletric power measurements.
made with both ac and dc. The ac conductivity measurement was made directly by an
impedance bridge* applying I KHZ to the specimen in all runs. All dc fields used were
below 6 V/cm to ensure ohmic behavior and the dc readings were taken in both direc-
tions and averaged. The ac and dc conductivities were determined on the both directions
of heating and cooling at each atmosphere. The thermoelectric power measurement was
carried out as the propotionality factor between the electrical fleld and the temperature
gradient, varied within 3'C/cm, existing in a specimen with the condition that electrical
current density was zero. Temperatures and emfs of the specimen were both measured
with a digital millivolt meter.**
It would be expected that the presence of defects in a crystal changes the average
s~:*
Model AS-7130, Ando Electric Co., Ltd,, Tokyo, Japan. Type 2805, 0.1 ;N (max. sensitivity/1 digit), Yokogawa Electric Works, Ltd.,Tokyo, Japan__
- 20 -

,
,L
,,
Electrical Property of Stannic Oxide (K.HIRAJIMA, T. SASAKI and K. HIJIKATA)
volume of unit cell and, therefore, the lattice parameter of the crystal. The manner, in
which the lattice parameter changes with varing oxygen partial pressure, could be an aid
to interpret the other more sensitive data. For the purpose of this, Iattice parameter
measurement was tentatively made on the stannic oxide powder specimen equilibrated at
high temperature under varing oxygen partial pressures by means of a diffractometer equip-
ped with a high temperature attachment.* The attachment consists of power leads for
resistance heating of a stage, a water cooled housing, and a cover with an aluminium
window for entrance and exit of X-ray beam. Either a gas or vacuum can be maintained
within the attachment. The high purity powder specimen fixed with Pt-mesh holder was
preheated at 1200'C, 30 hr. in air to avoid an effect of grain growth and associat-
ed variations in intensity and peak position. In the present work, the flow rate of each
gas was controlled by a flow-meter (80 cc/min.) and temperature was regulated by a
thermocouple and a SCR controllor within ~ O. I 'C. The 510 and 323 peaks were
recorded at slow speeds such that 1/8' ・ (20)/min. was 40 mm/min. on the chart. The
approach to equilibrium was monitored by following trace of peak position vs. time.
The lattice parameter values were reproducible in any oxygen partial pressure at a
constant temperature. An equilibrium value, however, remained constant even in 40 hr.
or more in all experimental conditions. The location of the peak could be determined
to ~0.002' (20), Ieading to an uncertainty in a (Aa) of ~4xl0-5 A.
III. Results
The resistance value of the specimens continued to change within maximum ca. 12
hr. under a given oxygen partial pressure, after the temperatures of the specimens
reached constant. Equilibrium values were taken after the specimen resistance stabilized
for I hr. These values, however, remained constant even in 24 hr. or more in all ex-
periments. The reproducibility was obtained in all used atmospheres on heating and
cooling and the thermal hysteresis was not observed. The ac conductivity was independent
on the frequency range I - 30 KHz, and the dc conductivity corresponded to those of ac
from 550' to 650'C and the oxygen pressure range O. 03 - 760 mmHg. As a typical
example, the frequency dispersion of the conductivity at 760 mmHg oxygen pressure is
shown in Fig. 3.
Some plots of log a vs. the reciprocal of absolute temperature at various oxygen
- 650'C, the data are pressure are displayed in Fig. 4. In the temperature range 550'
represented by a straight line at each oxygen pressure. Below P02 = O. 3 mmHg, the
* Geigerflex, Cat. No. 2034, equipped with a high temperature apparatus, Cat. No. 2311. Rigaku
Denki Co.. Ltd., Tokyo, Japan.
- 21 -

Proceedings of the Institute of Natural Sciences (1973)
~
s ~;e
b
l0-2
10-3
10-4 D. C.
Fig. 3
f (KHz)
Frequency dispersion for stannic oxide.
lOa
IL
650 600 5So 500
l0-1
10-l
~
~
~ 10-k)
1 O -4
10 -s
Stannlc OxiderD C.)
Po,= O. 1- O 25
rr]mHg
~¥¥¥:¥v¥] )()~ =
~ a' 3 lO 30
10 30
100
760
10 o 11 O 12 O
1'TXI04 ,('K l)'
13 O 14.0
Fig, 4 The electrical conductivity (D.C.)
vs, the reciprocal of absolute temperature
at the oxygen partial pressure range 0.1-
760 mmHg for stannic oxide.
electrical conductivity has slightly a tempera-
ture dependence.
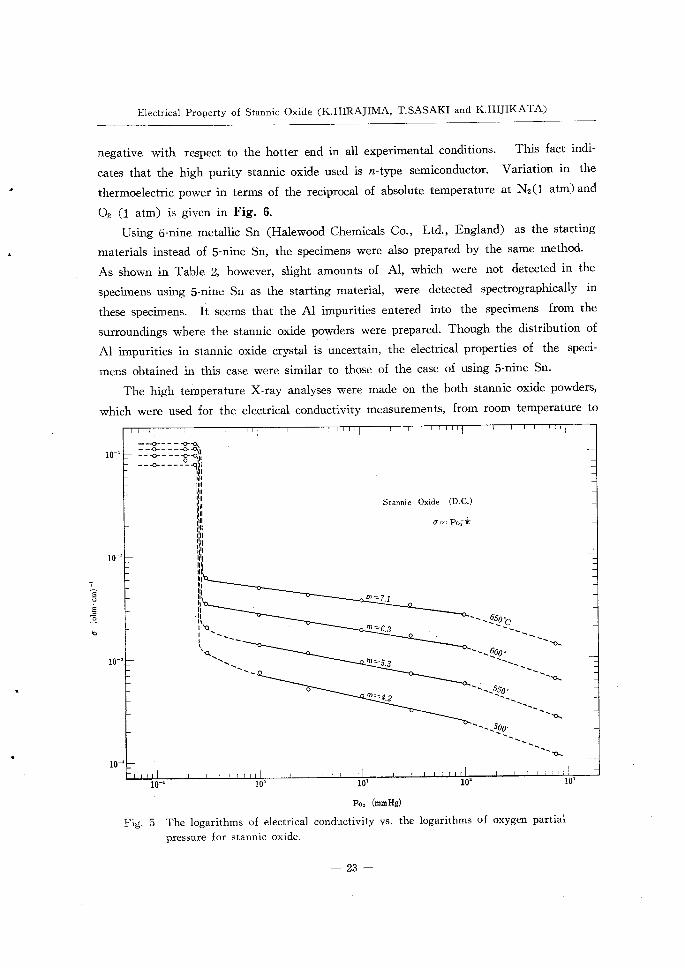
The isothermal conductivity as a function
of oxygen pressure in the temperatrue range
550' - 650'C is shown in Fig. 5. As shown
there, the discontinuous changes of conductivity
were observed at P02 - O. 3 mmHg. Above
O. 3mmHg, the electrical conductivites increased
with decreasing the oxygen partial pressure at
each temperature, and the electrical conduc-
tivity as a function of oxygen partial pressure
was found to obey the relation (T=K・P02~1J~
The value of slope m was shifted from 7.1 to
4.2 with decreasing the temperature. On the
other hand, below O. 3 mmHg, the electrical
conductivities increased steeply and independed
on the oxygen partial pressure.
In the thermoelectric power measurements.
the cooler end of the specimen was always
A
1'
- 22 -
Electrical Property of Stannic Oxide (K.HIRAJIMA, T.SASAKI and K.HIJIKATA)
~ ~i
~
negative with respect to the hotter end in all experimental conditions. This fact indi-
cates that the high purity stannic oxide used is n-type semiconductor. Variation in the
thermoelectric power in terms of the reciprocal of absolute temperature at N2 (1 atm) and
02 (1 atm) is given in Fig. 6.
Using 6-nine metallic Sn (Halewood Chemicals Co., Ltd. , England) as the starting
materials instead of 5-nine Sn, the specimens were also prepared by the same method.
As shown in Table 2, however, slight amounts of Al, which were not detected in the
specimens using 5-nine Sn as the starting material, were detected spectrographically in
these specimens. It seems that the Al impurities entered into the specimens from the
surroundings where the stannic oxide powders were prepared. Though the distribution of
Al impurities in stannic oxide crystal is uncertain, the electrical properties of the speci-
mens obtained in this case were similar to those of the case of using 5-nine Sn.
The high temperature X-ray analyses were made on the both stannic oxide powders,
which were used for the electrical conductivity measurements, from room temperature to
l0-l
10-2
io-s
io-d
--~ :~~¥ ~~~~~~ ~;L ---~- - - ~*~Llt _ _ ~. O_ <~ll~
tlll
l ll
III~
lhl
Ittl
IIIlt
lIII
,tll
JIR
Illl
lltl
l:Ii
llll
lll tll!
l[l
I,l
Ill
'l t
It
I
It
,t
l ~q;_
~l
¥~L_
o
Stannie
lll =~ 7. 1
In ~ 6.3
,7, ~~5.3
n, ~4.2
Oxide (D.C.)
aoc Po~1~'
-_650~)
-~600'
++--550'
-*~500'
~.
~+
~,
~+
Fig.
10-l
5
lO~
The logarithms of electrical
pressure for stannic oxide.
lO*
p02 (mmHg)
conductivity vs. the
- 23 -
10'
10garithms of oxygen
10*
partial

Proceedings of the Institute of Natural Scien(~es (1973)
600'C in steps ca. 100'C in flowing
nitrogen gas (1 atm) and oxygen gas ('C ) o 700 650 600 550
(1 atm), respectively. In both atmo-
spheres, no other phases were de- Stannic oxide - O. 1
tected within the scope of X-ray N, Iatm(Po,=0.03mmHg)
diffraction analyses and there we}s -o. 2
no observable crystal form difference _~
p between the X-ray diffraction pat- - ~0.3 > ~
terns (rutile form) of stannic oxide. ~ h The lattice parameters of stannic ~: -o,4 ~ ~ . oxide at 510 and 323 planes in oxy- O, Iatln(po,=760mnlH )
gen and nitrogen atmospheres at =0.5
600'C were given in Table 3. As 0.6 shown there, the volume of unit cell l0.5 11.0 u.5 12.0 12.5
in oxygen atmosphere increased more 1/T X I0'('K~') than that in nitrogen. Further work Fig. 6 Thermoelectric power vs. reciprocal of absolute
on the oxygen pressure dependence temperature for stannic oxide.
Tabel 2 Spectrographic analyses* of Sn02 (from 6-nine metallic tin).
Sn Al Mg Ca Si
Sn02 powders vS VW vW vvW vvW Sintered specimen vS vW V'~V vvW vv W
* J.A.CO. Emission Spectrograph with a diffraction grating, Ebert mount
3, 4 m.
Table 3 High precision lattice parameter analyses for
stannic oxide at 600'C.
Atmosphere l a (510) (A) c(323) (A) V = a2 , c (A*)
O I atm [ 4. 75316 3. 19495 72. 1821
N2 1 atm 4. 75195 3. 19529 72. 1529
- O. O012i +0. o0033 - o. 0292
of the lattice paramet_er of stannic oxide at high temperatures
precise measurement at a static pressure system of atmosphere.
IV. Discussion
The electronic configurations of the outer shells of Sn and
- 24 -
rs
O
in progress with more
atoms are 5s25p2 and

{'
Electrical Property of Stannic Oxide (K.HIRAJIMA, T.,SASAKI and K.HIJIKATA)
2s22p4, respectively. Therefore m formmg solid stannrc oxide the 5s and 5p electrons
<)f Sn atom are transferred to O atoms. Each O atom can accept two electrons in its
2p orbital. A simple picture of the band structure of stannic oxide consists of a 5s con-
duction band, which is a broad band, and a 2p valence band separated by a forbidden
gap. On the basis of electron mobilities calculated from the conductivities of Sb-doped
polycrystalline specimens and the behavior of the Seebeck coefiicient of such specimens,
Loch5) concluded that stannic oxide is a broad-band semiconductor. This agrees with
Kohnke's3) conclusion, which was based on the Hall mobility and donor activation energy
in natural single crystals (Bolivian cassiterite with some impurities) . Nagasawa, et al6)
also concluded that stannic oxide of single crystal is a typical n-type broad-band semi-
conductor having the value of the conductivity of a few ~ -1・ cm~1 and the mobility of
about 200 cm2. volt-1・ sec~1 at room temperature.
The nature of the donor centers responsible L0r n-type semiconductivity of stannic
<)xide is yet unknown. Some assumptions concerning the nature of the donor centers in
semiconducting thin films of stannic oxide have been presented by several authors, that
is, oxygen vacancies, interstitial tin ions, chlorine ions as an impurity included from
starting materials, or a complex combination of them ~vere assumed to be responsible.7, 8)
Kohnke3) suggested the possibility of O-H group as donor centers in his specimens. But
this may be out of consideration in the present experiment. Loch5) found that the elec-
trical conductivity of the O.O0036 mole~ Sb doped Sn02 specimen had steeply risen above
.500'C. He described that the defect carriers are becoming important in this instance.
If the dominant donor centers in pure stannic oxide are composed of defects resulting
from the deviation of stoichiometry, the electrical conductivity of stannic oxide has to
vary when the surrounding atmospheres are changed at high temperatures. The conduc-
tivity of the grown single crystal of Sn026) decreased by about one order of magnitude
when rt was heated m the atmosphere of oxygen at 1200'C for 5 hr., while it increased
by about flve hundred times when heated in vacuum (ca. 10-2 mmHg) at 1200'C for 40
lar. From these facts, Nagasawa, et al6) suggested that the dominant donor centers in
th crystals used are composed of native defects, namely oxygen vacancies and/or inter-
=stitial tin ions resulting from the deviation of stoichiometry. By Hoening and Seary, 9)
however, at low oxygen partial pressure, the thermal decomposition of Sn02 is accelerat-
~~d by the following relation,
Sn02 (s) ,~SnO(g) + 1/2 02 (g)
I'*,~o (g) =K・ P02~1J2
D =0.0072 mmHg at 1200'C. I s*o (g)
- 25 -

Proceedings of the Institute of Natural Sciences (1973)
According to our preliminary experiments, remarkable evaporation from the specimen of
Sn02 during heating was seen even in air at ll40' - 1350'C. Therefore, it seems that
Nagasawas' result of long duration in vacuum at 1200'C is uncertain. In the present
experiments, the reproducibility was obtained for the changing oxygen partial pressures.
Consequently, it is likely noted that the evaporation of specimen is negligible. As shown
in Fig. 5, above 0.3 mmHg oxygen partial pressure, the electrical conductivities increased
with decreasing the oxygen partial pressure at the tempreature range 550'-650'C. From
this fact, under such condition as this, it appears that the dominant donor centers in
stannic oxide are composed of native defects, namely oxygen vacancies and/or interstitial
tin ions resulting from the deviation of stoichiometry. A decision of native defect model
could not be made from oxygen pressure dependence 0L electrical conductivity of stannic
oxide, namely by ernploying Baumbach-Wagners' Iaw. Io)
As shown in Fig. 4, below P02 = O. 3 mmHg, the electrical conductivity was not affect--
ed by oxygen partial pressure and temperature, and indicated a few l0-1 ~ -1 ' cm~1
order magnitude, which seems a metal-like conductivity. Since no difference of the crystal
form was observed between the X-ray diffraction patterns (rutile form) of stannic oxide
in nitrogen atmosphere (1 atm) and that in oxygen atmoshere (1 atm) from room
temperature to 600'C, it seems likely that the characteristic conduction is not attributed
to the crystal transformation. There were no differences in the electrical conductivity
data between platinum electrode and gold electrode and also between nitrogen and helium
atmospheres (respectively, I atm with P02-0.03 mmHg) . Therefore it may be inferred
that " chenucal mteractlon " was not caused. The general problem of the stability of
compounds which exhibit an apparently large deviation from the stoichiometric composi--
tion has been reviewed by Anderson, et alll) and Wadsley. 12) There are some reportsl3-17)
L0r a shear plane of rutile (Ti02_x) which has the same crystal structures as that of
stannic oxide, but literatures for that of stannic oxide have not been reported. From
the present results alone, it cannot be proved whether the metal-like conduction is due
to the existence of the shear plane in stannic oxide. This characteristic conduction
also might be caused by the " transfer mechamsm", such as reported by Tannhauserl8)
for iron oxides or " metal-insulator transition " observed by Jayaraman, et all9) in V203.
This point is being investigated.
V. Summary
1) The electrical conductivity of high purity polycrystalline stannic oxide was measured:
as a function of the oxygen partial pressure (10-2-103 mmHg) at the temperature range=
550'-650'C. The frequency dispersion of the conductivity was not observed from 550'
- 26 -
Electrical Property of Stannic Oxide (K.HIRAJIMA, T. SASAKI and K.HIJIKATA)
to 650~C and the dc conductivity data corresponded to th.ose of ac.
2) In the isothermal conductivity as a function of oxygen partial pressure, a discon -
tinuous change of conductivity was observed at P02 * O. 3 mmHg, and below O. 3 mmHg,
the electrical conductivity increased strikingly with ca. 2 order magnitude having a few
10-1 ~ -1 , cm~1 in comparison with above 0.3 mmHg, and was independent on oxygen
partial pressure and temperature, which phenomena seem a metal-like conduction. While
above O. 3 mmHg, conductivity was found to obey the relation OF = K・P02~1/~. Values of
slope m were shifted from 7. I to 4.2 with decreasing temperature.
3) The relation log (T vs. 1/T was well represented by a straight line in the temperature=
range 550'-650'C and the apparent activation energy decreased with decreasing the oxy-
gen partial pressure.
4) In the thermoelectric power measurements, the cooler end of the specimen was al-
ways negative with respect to the hotter end indicating negative charge carriers.
5) High temperature X-ray analyses were made on the same stannic oxide powders.
used for the electrical conductivity measurements. There was no observable crystal form
difference between the diffraction patterns (rutile form) of stannic oxide from room tem-
perature to 600'C in nitrogen and oxygen atmospheres (1 atm) .
6) The precise lattice parameter measurement was also made on the stannic oxide
powders in oxygen and nitrogen atmospheres at 600'C. The volume of unit cell in
oxygen atmosphere increased more than that in nitrogen.
Acknowledgment
The authors wish to thank Dr. H. Kishi and Mr. T. Ishikawa, Mitsubishi Central
Research Institute, Mitsubishi Metal Mining Co., Ltd., Oomiya, Japan, for the spectro-
graphic analysis.
Literatures
IL
1) J. A. Marley and T. C. MacAvoy : J. Appl. Phys., 32 (1961), 2504.
2) T. B. Reed. J. T. Roddy and A. N. Mariano : ibid., 33 (1962), 1014.
3) E. E. Kohnke : J. Phys. Chem. Solids, 23 (1962), 1557.
4) M. Foex : Bull. Soc. Chim. Frnnce, 11 (1944), 6.
5) L. D. Loch : J. Electrochem. Soc., 110 (i963), 1081.
6) M. Nagasawa, S. Shionoya and S. Makishima : Japan J. Appl. Phys., 4 (1965), 195_
7) R. E. Aitchison : Australian J. Appl. Sci., 5 (1954), lO.
8) A. Fischer : Z. Naturforsch., 9a (1954), 508.
9) C. L. Hoening and A. W. Seary : J. Am. Ceruln. Soc., 49 (1966), 128.
10) H. H. Baumbach, C. Wagner : Z. Phys. Chel77., B22 (1933), 199.
- 27 -

Proceedings of the Institute of Natural Sciences(1973)
1!) J,S.Anderson:Nonstoichiometric Compomds,Advances in Chemistry Series39,Am・
Chem.Soc.,(1963),L
12)A.D.Wadsley:謝4。ヲ(1963)シ23,
13)S.Anderson,B.Collen,U.Kuylenstiema and A・Magn61i二且‘砒Cん召η~・S‘4η4・・11(1957)・
1641.
14)M.E.Straumanis,T.Ejima and W,J。James=A¢ααッ5ら14(1961),453・
15) L.A.Bursi11,B、G.Hyde:PhガZ,Mαg・.,20(1969),347・
16)R.N.Blumenthal,D,H,Whitmore:」,EZ臨706h6ノπ.βoら110(1963),92.
17) L。A.Bursill,B.G.Hyde=Progress in Solid-State Chemistry voL7シed.Reiss and
McCaldin,Pergamon Press,(1972),177.
18) D.S.Tannhauser二」.Pんlys.C舵那.80Z沼5シ23(1962),25,
ユ9)A.Jayaraman,D.B,McWhan,J,P.Remeika and P,D。Demier:Pんッ5.R6刀,,B2(1970)β75L
一28一