ejournal of tax research2).pdfjulie cassidy, man hung alvin cheng, toan le and eva huang abstract...
TRANSCRIPT
eJournal of Tax Research
Volume 17, Number 2 March 2020
CONTENTS
134 The impact of full franking credit refundability on corporate tax avoidance Rodney Brown, Youngdeok Lim and Chris Evans
168 A toss of a (bit)coin: the uncertain nature of the legal status of cryptocurrencies Julie Cassidy, Man Hung Alvin Cheng, Toan Le and Eva Huang
193 An empirical study on cross-border profit shifting in Australia Xuerui (Estelle) Li and Alfred Tran
233 Curtailing aggressive tax planning: the case for introducing mandatory disclosure rules in Australia (part 2) – cues from the United Kingdom and South Africa Annet Wanyana Oguttu and Ann Kayis-Kumar
258 Cost sharing of pensions paid under the 2001 and 2016 Australia-New Zealand social security agreements: should it be time for change? Andrew Smith
280 Value creation within multinational platform firms: a challenge for the international corporate tax system Victoria Plekhanova
© School of Taxation and Business Law (Atax), UNSW Business School UNSW Sydney
ISSN 1448-2398
eJournal of Tax Research EDITORS
Professor John Taylor School of Taxation & Business Law (Atax), UNSW Sydney
Professor Binh Tran-Nam School of Taxation & Business Law (Atax), UNSW Sydney
ASSOCIATE EDITOR
Dr Alexandra Evans School of Taxation & Business Law (Atax), UNSW Sydney
PRODUCTION EDITOR
Dr Peter Mellor School of Taxation & Business Law (Atax), UNSW Sydney
EDITORIAL BOARD
Professor Robin Boadway Department of Economics, Queen’s University
Professor Cynthia Coleman University of Sydney Business School
Professor Graeme Cooper Faculty of Law, University of Sydney
Professor Robert Deutsch School of Taxation & Business Law (Atax), UNSW Sydney
Professor Chris Evans School of Taxation & Business Law (Atax), UNSW Sydney
Professor Judith Freedman Faculty of Law, University of Oxford
Professor Malcolm Gammie
Professor John Hasseldine
Chambers of Lord Grabiner QC, London
Paul College of Business and Economics, University of New Hampshire
Professor Jeyapalan Kasipillai School of Business, Monash University Malaysia Campus
Professor Rick Krever Law School, University of Western Australia
Professor Charles McLure Jr
Professor Dale Pinto
Hoover Institution, Stanford University
Curtin Business School, Curtin University
Professor John Prebble
Professor Adrian Sawyer
Faculty of Law, Victoria University of Wellington
College of Business and Law, University of Canterbury
Professor Joel Slemrod Stephen M. Ross School of Business, University of Michigan
Professor Jeffrey Waincymer Faculty of Law, Monash University
Professor Neil Warren School of Taxation & Business Law (Atax), UNSW Sydney
Professor Robin Woellner School of Taxation & Business Law (Atax), UNSW Sydney
3
eJournal of Tax Research PUBLISHER
The School of Taxation & Business Law (Atax) is part of the UNSW Business School at UNSW Sydney. We are the largest tax school in any university in Australia, bringing together a team of expert academic staff with backgrounds in law, commerce, tax, accounting and economics. At Atax, we’re working towards building excellence in the tax profession, looking at tax from both a theoretical and practical perspective. EDITORS’ NOTE
The eJournal of Tax Research is a refereed journal that publishes original, scholarly works on all aspects of taxation. It aims to promote timely dissemination of research and public discussion of tax-related issues, from both theoretical and practical perspectives. It provides a channel for academics, researchers, practitioners, administrators, judges and policy makers to enhance their understanding and knowledge of taxation. The journal emphasises the interdisciplinary nature of taxation. SUBMISSION OF ORIGINAL MATERIAL
Submission of original contributions on any topic of tax interest is welcomed, and should be sent as an email attachment (Microsoft Word format) to the Production Editor at <[email protected]>. Submission of a manuscript is taken to imply that it is an unpublished work and has not already been submitted for publication elsewhere. Potential authors are requested to follow the “Notes to Authors”, which is available from the journal's website. WEBPAGE
Current and past issues of the eJournal of Tax Research are available via the journal’s website: https://www.business.unsw.edu.au/research/publications/atax-journal.
eJournal of Tax Research (2020) vol. 17, no. 2, pp. 134-167
134
The impact of full franking credit refundability on corporate tax avoidance
Rodney Brown, Youngdeok Lim and Chris Evans
Abstract
The debate about the efficacy of Australia's full dividend imputation system and especially the potential abolition of the full refundability of franking credits has intensified in recent times. This article contributes to the debate by empirically examining the impact of the introduction of section 67-25(1) of the Income Tax Assessment Act 1997 effective from 1 July 2000 that allows shareholders to claim all franking credits attached to dividends, even if it propels them into a tax refund position. Consistent with expectations, evidence is found of an economically significant increase in cash effective tax rates (decrease in tax avoidance) for domestic firms relative to foreign firms and for dividend-paying domestic firms relative to non-dividend-paying firms. This finding is even more pronounced for firms paying fully franked dividends. The results are consistent with the notion that firms undertake less tax avoidance in the post 1 July 2000 period given the presence of stronger incentives for them to pay corporate tax and suggest that an unintended consequence of a removal of full refundability of franking credits may be an increase in corporate tax avoidance.
Key words: corporate tax avoidance, dividend imputation
Lecturer, School of Taxation and Business Law, UNSW Business School. Corresponding author, email: [email protected]. Senior Lecturer, School of Accounting, UNSW Business School. Professor, School of Taxation and Business Law, UNSW Business School and Extraordinary Professor, Department of Taxation, University of Pretoria.
eJournal of Tax Research The impact of full franking credit refundability on corporate tax avoidance
135
1. INTRODUCTION
This article examines whether the level of tax avoidance undertaken by firms operating in a full dividend imputation system decreases when changes made to the system enhance shareholders’ after-tax returns.1 The focus is on Australian publicly listed firms because Australia is one of a few countries which continues to operate a full dividend imputation system.2 More importantly though, heated debate has recently emerged regarding the sustainability of full franking credit refundability to government revenue. On 13 March 2018, the Labor Party announced its intent to deny cash refunds for excess franking credits from 1 July 2019, if elected to power in the May 2019 federal election. In response, on 19 September 2018, the Treasurer asked the Standing Committee on Economics to inquire into the implications of removing refundable franking credits. In its April 2019 report, the Committee revealed it had formed the view that Labor’s policy is ‘inequitable and deeply flawed’.3 However, ultimately the question of the sustainability of the current arrangements is an empirical one. This article contributes to this debate by empirically examining the benefits of full franking credit refundability in terms of its impact on corporate tax avoidance.
Our approach is to exploit the plausibly exogenous shock that occurred in late 1999 whereby legislation (‘refund provision’) was passed allowing Australian resident shareholders to claim all franking credits attached to dividends they receive. That is, contrary to the prior rules which only allowed credits to be utilised up to the point where they offset a shareholder’s tax liability, the new rules allow taxpayers to claim all franking credits, even if it puts them into a tax refund position. Specifically, under section 67-25(1) of the Income Tax Assessment Act 1997, if the tax offset allowed for franking credits exceeds the tax payable by the shareholder, the excess franking credit is fully refundable to the taxpayer. Effective 1 July 2000, this rule increased the value and demand for franking credits by shareholders. The hypotheses are tested by examining tax avoidance, measured using cash effective tax rates (ETRs), before and after this change. Exploiting a modification in tax rules that does not affect financial reporting helps us to isolate the impact of the change on tax avoidance.
Accusations of tax avoidance have thrust many publicly listed companies into the spotlight in recent years. Downwards management of tax liabilities by multinational corporations (MNCs) such as Apple, Starbucks and Google, has met with condemnation from the press, public interest groups, politicians and global organisations such as the G20 and OECD, who express concern that these firms do not pay their ‘fair share’ of tax. The Tax Justice Network and United Voice (2014) accuse Australian listed companies of tax avoidance on an industrial scale claiming that the federal government is short-changed by AUD 8.4 billion annually in corporate tax revenue. The heightened interest from policy-makers in recent years is due to the perceived inequities surrounding questionable tax practices coupled with governments’ desire to preserve tax system integrity and safeguard revenue.
1 Tax avoidance, sometimes referred to as ‘aggressive tax planning’, involves activities that are within the ‘letter of the law’ but contrary to the ‘spirit of the law’ and usually involves the aggressive exploitation of tax law loopholes. However, to avoid the complexity of determining the legality of strategies used to reduce taxes, prior literature is followed to define tax avoidance as all activities undertaken that have the effect of reducing a firm’s overall cash taxes (Hanlon & Heitzman, 2010). 2 Chile, Malta, Mexico, and New Zealand operate full dividend imputation systems (Ainsworth, 2016). 3 See Australian Parliament (2019, p. 32).
eJournal of Tax Research The impact of full franking credit refundability on corporate tax avoidance
136
A rapidly evolving academic literature on corporate tax avoidance has emerged. Studies document a variety of determinants of corporate tax avoidance and an assortment of financial reporting, capital market, and contracting outcomes associated with such activities.4 Although considered by many as morally questionable, tax avoidance practices can lead to increases in both accounting earnings and cash flows. Furthermore, some managers believe their fiduciary duty to shareholders compels them to act aggressively with respect to tax strategy if it leads to significant cost savings and increased firm value. However, tax planning costs, management rent extraction, reputational effects, and post-audit penalties, may provide a counterweight to such incentives.5 Indeed, Chen et al. (2010) and Chyz et al. (2013) provide evidence that company stakeholders view tax avoidance negatively and seek to limit these activities. Thus, managers face a delicate risk-reward trade-off between personal incentives, prospective shareholder benefits, stakeholder expectations, and risk.6
Our argument is that in Australia the full dividend imputation system provides a strong countervailing influence on the incentives managers of certain firms may have to engage in tax avoidance. This system eliminates the double taxation on profits distributed by companies to shareholders by allowing the tax paid by the company to be credited, or imputed, to the shareholders by way of a franking credit attached to dividends to reduce the final income tax payable by the shareholder.7 Consequently, the imputation system likely leads to heterogeneity in tax avoidance incentives across Australian publicly listed firms due to differences in dividend pay-out policy. Australian firms that pay dividends with attached franking credits are more likely to face stronger incentives to pay corporate tax relative to foreign firms publicly listed in Australia, Australian firms that do not pay dividends, or Australian firms that pay unfranked dividends.8 Importantly, this heterogeneity facilitates comparisons between these different groups operating within the same system.
Prior studies suggest that dividend imputation is associated with lower tax avoidance (Ikin & Tran, 2013; McClure et al., 2018; Li & Tran, 2019). However, tax avoidance and dividend policy decisions are jointly determined in equilibrium. Therefore, to mitigate concerns regarding endogeneity, these findings are extended by exploiting the quasi-experimental setting offered by the change in Australia’s full dividend imputation system to provide cleaner identification of the relation between dividend imputation and tax avoidance. Specifically, an exogenous shock is exploited where a new rule allows shareholders to claim all franking credits attached to dividends. Arguably, this enhancement to shareholders’ after-tax positions provides stronger incentives for some firms to pay corporate taxes (minimise tax avoidance) to generate additional valuable
4 See Graham, Raedy and Shackelford (2012) and Hanlon and Heitzman (2010) for reviews of the extant tax research. 5 Corporate tax avoidance may increase information risk (Balakrishnan, Blouin & Guay, 2019), agency risk (Desai & Dharmapala, 2006), the risk of tax authority audit (Mills, 1998), and total firm risk (Guenther, Matsunaga & Williams, 2017). 6 Blouin (2014) and Armstrong et al. (2015) consider tax avoidance to be a form of investment similar to other investment opportunities available to the firm. Accordingly, before the firm chooses to invest, it evaluates the net present value of the ‘project’ which is a function of both the expected cash flows and the inherent risk (i.e., the dispersion of the potential cash flows). They argue that tax aggressiveness and tax risk are not separable concepts. 7 The terms ‘franking credit’ and ‘imputation credit’ are equivalent and used interchangeably throughout the article to describe the tax credit attached to dividends. 8 Details of the mechanics of the dividend imputation system are discussed in more detail in section 2 below.
eJournal of Tax Research The impact of full franking credit refundability on corporate tax avoidance
137
imputation credits for distribution to shareholders. Employing a difference-in-differences research design, the hypotheses are tested by examining the impact of the change on firms after the new legislation became effective on 1 July 2000.
Consistent with our hypotheses, we find that over the sample period (1997-2004), cash ETRs are significantly higher for: (i) Australian (domestic) dividend-paying firms relative to foreign firms publicly listed in Australia; (ii) domestic dividend-paying firms relative to domestic non-dividend-paying firms, and (iii) domestic firms paying fully franked dividends relative to domestic dividend-paying firms that do not pay fully franked dividends. Next, evidence is found of a reduction in tax avoidance after the introduction of the refund provision on 1 July 2000. Specifically, univariate tests reveal that cash ETRs for domestic dividend-paying firms are significantly higher in the period after the rule change. Then, utilising a difference-in-differences research design, we find that domestic firms and domestic dividend-paying firms report significantly higher cash ETRs following the change relative to foreign firms listed in Australia, indicating a decrease in tax avoidance. A similar result is found when comparing (i) dividend paying domestic firms to non-dividend-paying domestic firms and (ii) fully franked dividend-paying domestic firms to non-fully franked dividend-paying domestic firms. Estimates suggest the decreases in tax avoidance are economically significant with additional cash taxes paid ranging from approximately AUD 8.6 million to AUD 16.6 million.
The findings in this article have academic contribution and policy implications. From an academic standpoint, this study contributes to the extant literature in significant ways. First, an important exogenous shock to Australia’s full dividend imputation system and a difference-in-difference research design with control groups (e.g., foreign firms) is used to better identify the relation between this system and the level of tax avoidance undertaken by Australian publicly listed firms. Second, the findings will add to the emerging literature on corporate tax avoidance in Australia (e.g., Taylor & Richardson, 2012; 2014), especially the incentives Australian managers face to engage in tax avoidance and the role dividend imputation plays in curtailing such activities.
The findings advance the understanding of the incentives for corporate tax avoidance in Australia and may assist in designing future policy. Australia’s budget is more dependent on corporate tax than all other Organisation for Economic Co-operation and Development (OECD) countries except Norway (OECD, 2014a);9 and after personal income tax, corporate tax is the second largest source of federal government revenue (Australian Treasury, 2014, p. 274, Table D10). Hence, understanding the underlying motives for tax avoidance can help legislators design a more efficient and equitable corporate tax system. Finally, this study has particular relevance given the current discourse surrounding the efficacy of Australia’s full dividend imputation system.10 The
9 In 2013, Australia’s company tax revenue as a proportion of GDP was 4.9% compared to the OECD average of 2.9% (OECD, 2014a). 10 A move away from the current system was deliberated in the Commonwealth Government Tax Discussion Paper released in March 2015, which formally started the process for developing the White Paper on the ‘Reform of Australia’s Tax System’. However, in February 2016, then Prime Minister Malcom Turnbull stated that the 2016-2017 Federal Budget released in May 2016 was ‘for all practical purposes, the White Paper’ (reported in Henderson, 2016). The Tax Discussion Paper provides a broad overview of the need to respond to challenges such as globalisation, declining productivity, and an ageing population. It mentions several tax-related challenges that may need to be addressed including drawbacks of the full dividend imputation system (Australian Treasury, 2015). Unlike the 2009 Henry Review (Australia’s
eJournal of Tax Research The impact of full franking credit refundability on corporate tax avoidance
138
findings contribute to this debate by providing empirical evidence of the extent to which one mechanism of the current system, full franking credit refundability, helps mitigate corporate tax avoidance.
2. LITERATURE REVIEW AND HYPOTHESIS DEVELOPMENT
Upon receipt, shareholders pay tax on a dividend at their marginal tax rate with any final liability dependent on whether the dividend payer’s resident country employs a ‘dividend imputation’ or ‘classical’ system. In a dividend imputation system, the tax paid by a company may be imputed to the shareholders by way of a tax credit (franking credit) to reduce the subsequent tax payable on the dividend received. A full dividend imputation system allows shareholders a credit for the entire tax paid by the company whereas a partial imputation system does not.11 In contrast, a ‘classical’ system effectively results in double taxation of corporate income (i.e., income is taxed first at the company level and again at the shareholder level). Panel A of the Appendix provides an illustrative example of the after-tax cash flows available to shareholders under both regimes.
Essentially, under an imputation system, corporate tax paid by a company is a prepayment of shareholders’ personal tax and is not a real cost as in a classical system. Managers therefore have reduced incentives to undertake aggressive tax planning.12 Indeed, Ikin and Tran (2013) investigate large publicly listed Australian firms in the 1999-2003 period and find that firms distributing franked dividends adopt a more conservative tax strategy (measured using book ETRs) compared to firms that do not pay franked dividends. However, the authors do not attempt to exploit any of the changes to the imputation system that occurred during this period. More recently, McClure et al. (2018) find that Australian publicly listed firms paying partly franked or fully franked dividends, are less likely to engage in tax avoidance compared to firms that pay unfranked dividends or firms that pay no dividends at all. The authors deliberately chose the sample period as 2004-2015 for stability thereby avoiding changes to the dividend imputation system made before 2004. Li and Tran (2019) focus on profitable Australian listed companies across 2009-2012 and find that firms distributing a higher proportion of their after-tax profits as franked dividends and companies with less foreign ownership, engage in less tax avoidance.
Most importantly, from 1 July 2000, franking credits in Australia became fully refundable meaning that not only can they reduce a shareholder’s tax liability to zero, but any excess is refunded to the shareholder. The illustrative example in Panel B of the
Future Tax System Review Panel, 2009) which provided detailed recommendations, the Tax Discussion Paper provides few pointers as to the extensiveness of any future reform package. 11 Australia replaced its classical system with a full dividend imputation system from 1 July 1987. Finland, France, Germany, Italy and Norway eliminated their full imputation systems between 1999 and 2007 in response to European Court of Justice rulings that the imputation systems of several European countries were discriminatory and in violation of EU law. The US operates a ‘modified classical’ system (dividend income taxed at preferential rates (e.g., compared to interest income) at the shareholder level) (OECD, 2014b; Ainsworth, 2016). 12 This most likely relates to domestic tax avoidance because Australia, like most countries, with the major exception of the US, adopts a ‘territorial approach’ to the taxation of MNC income where it only taxes the profits earned within its borders (i.e., source basis). Profits earned overseas are taxed by foreign tax authorities which reduces the amount of Australian corporate tax paid and thus the amount of franking credits available. The US adopts a ‘worldwide’ taxation system in which it taxes the worldwide income of its MNCs (i.e., residency basis).
eJournal of Tax Research The impact of full franking credit refundability on corporate tax avoidance
139
Appendix demonstrates the impact of this change on shareholder-level tax liabilities for different types of resident shareholders with varying marginal tax rates.13 Clearly, the change is especially attractive to resident taxpayers whose marginal tax rate is less than the statutory company tax rate of 30% (Investors 1 and 2 in Panel B of the Appendix). Therefore, key beneficiaries of the change include Australian superannuation funds in pension mode (post-retirement phase) whose earnings are taxed at 0%, and superannuation funds in accumulation mode (pre-retirement phase) who are taxed at 15%. Indeed, Mackenzie and McKerchar (2014) interviewed Chief Investment Officers of 22 Australian superannuation funds and found that 71% claim to actively manage franking credits as part of their overall investment strategy. Notably, superannuation funds are major investors in Australian listed companies representing approximately 21% of total market capitalisation.14
Several additional changes were made to the Australian dividend imputation system in the years surrounding the introduction of the refund provision potentially creating confounding effects. For example, from 1 July 1997, the 45-day holding rule requires resident taxpayers to continuously hold shares at risk for at least 45 days to be eligible to receive franking credits. Other enhancements effective 1 July 2002 provided greater flexibility in the availability of franking credits and simplified the interaction of the imputation system with tax loss regulations. However, the refund provision effective 1 July 2000 arguably had a much greater impact for shareholders. Supporting this contention is the finding of Beggs and Skeels (2006) who show that franking credits had no value until 1 July 2000, after which franking credits were estimated to be worth 57% of their face value. Similarly, Cummings and Frino (2008) find that franking credits are worth at least 50% of their face value during the period 2002-2005. Jun, Gallagher and Partington (2011) propose that in combination the results of these two studies suggest that the year 2000 tax change significantly increased the value of franking credits to the marginal investor in the Australian market. Accordingly, this change is employed as the treatment effect in the empirical analysis.
In their review of the financial implications of dividend imputation, Ainsworth, Partington and Warren (2015) acknowledge that, at the margin, the imputation system creates a bias to Australian equities amongst domestic investors.15 Therefore, from a shareholder perspective, we argue that because many investors are further tax-advantaged by franking credits post July 2000, demand for fully franked dividends likely increased. Using Australian Taxation Office (ATO) data, Handley and Maheswaran (2008) find that, on average, 67% of distributed imputation credits were used to reduce personal taxes during 1990-2000. However, this increased to 81% over
13 Only Australian resident shareholders can utilise franking credits. 14 As at 30 June 2013, public superannuation funds have direct holdings in Australian listed companies worth AUD 123,462 million (APRA, 2015), while self-managed (private) superannuation funds own AUD 156,363 million (ATO, 2015). The total of AUD 279,825 million equates to 20.8% of the total market capitalisation of the Australian Stock Exchange (ASX) of AUD 1,347,186 million at that date (ASX, 2015). 15 Figure 11 in Ainsworth et al. (2015) reveals a stark divergence in dividend pay-out ratios of Australian firms (60-75%) compared to the world equity markets (35-40%) since the introduction of dividend imputation, providing evidence that imputation has encouraged higher pay-out ratios in Australia. Pattenden and Twite (2008) find that dividend initiations, pay-outs, and reinvestment plans increased following the introduction of dividend imputation in Australia and the increases were greater for firms with more franking credits. Recently, Balachandran et al. (2019) exploit the Australian setting and find that firms are more likely to pay dividends with higher pay-out ratios in an imputation environment compared to a traditional tax system.
eJournal of Tax Research The impact of full franking credit refundability on corporate tax avoidance
140
2001-2004 following the 2001 change consistent with an increase in demand from domestic investors. Jun et al.’s (2011) study of institutional tax clienteles shows that Australian institutional funds have a higher ownership of stocks which carry full franking credits compared to stocks which have partial, or zero franking credits.16
We contend that post-July 2000, shareholder-friendly managers of Australian firms have enhanced incentives to pay company tax (reduce tax avoidance) to generate valuable franking credits to satisfy shareholders’ increased demand for fully franked dividends. Underlying this argument are the findings of several studies regarding pay-out responses of management. First, Desai and Jin (2011) find that managers alter pay-out policies in response to the tax preferences of their institutional investors. Second, Hanlon and Hoopes (2014) present evidence suggesting that management is conscious of, and forms pay-out policy based on, shareholder-level taxes, and that they act in a manner that maximises shareholder value. Third, Amiram, Bauer and Frank (2019) show that tax avoidance significantly decreases after an exogenous enhancement of an imputation system consistent with managers acting for the benefit of shareholders, not themselves. The authors reason that tax avoidance within an imputation system merely shifts the burden of tax payments from the company to its shareholders and thus does not increase the shareholders’ after-tax cash flows and conclude that a country that eliminates its imputation system in favour of a classical system creates the incentive for managers to engage in tax avoidance to meet shareholders’ compensating demand for higher after-tax cash flows.
Only Australian resident shareholders can utilise franking credits. Consequently, low marginal rate resident shareholders (e.g., superannuation funds) will prefer franked dividends whilst foreign resident shareholders will prefer capital gains or unfranked dividends. Balachandran et al. (2019) demonstrate that Australian publicly listed firms with higher foreign institutional ownership are less likely to pay dividends and have lower pay-out ratios. Unfortunately, ownership data is not available for the sample firms during the sample period. Nevertheless, several foreign firms are publicly listed in Australia and a reasonable assumption can be made that a higher fraction of their shareholders are non-tax residents. Generally, foreign firms are excluded from samples because most of their profits will likely be subject to tax laws that diverge substantially from Australian tax laws.17 However, given that foreign firms are likely less impacted by the enhancement to the imputation system, these firms are used as the first control group in the difference-in-differences research design.
Based on the intuition that incentives to pay corporate tax intensified after the introduction of the refund provision, the following hypothesis is tested:
H1: Corporate tax avoidance decreased after 1 July 2000 for domestic firms relative to foreign firms.
16 Bellamy (1994) finds support for the existence of dividend clienteles and increased franked dividend pay-outs relative to unfranked dividend pay-outs for the 1985-1992 period. In contrast, Grinstein and Michaely (2005) do not find tax-based preferences by institutional investors. 17 Australia’s territorial approach to the taxation of MNC profits means that only the Australian sourced profits of foreign firms will be taxed in Australia. Withholding tax on franked dividends paid to a non-resident shareholder of a treaty country is 0%, i.e., franking (company tax paid) represents a final tax to non-resident shareholders.
eJournal of Tax Research The impact of full franking credit refundability on corporate tax avoidance
141
The enhancement to the dividend imputation system is likely to have a greater impact on those firms that pay dividends compared to non-dividend paying firms who cannot pass on franking credits to shareholders. Therefore, non-dividend paying firms are excluded from the treatment group to test the following hypothesis:
H2: Corporate tax avoidance decreased after 1 July 2000 for dividend-paying domestic firms relative to foreign firms.
Dividend-paying domestic firms comprise three different groups depending on dividend type. First, firms without franking credits may still pay dividends provided they have sufficient accumulated profits (absence of franking credits might result from the firm incurring tax losses in prior years). In this case, the dividend will be an ‘unfranked dividend’. Second, firms with some level of franking credits available from prior company tax paid, but not enough to fully-frank the dividend, may still impute these credits through a ‘partly franked dividend’. Third, firms that have paid sufficient corporate tax to generate enough franking credits to fully-frank their dividend may distribute these credits to shareholders via a ‘fully franked dividend’. It follows that the refund provision differentially impacts these three groups with fully franked dividend-paying firms (unfranked dividend-paying firms) likely facing the largest increase (smallest or no increase) in incentives to increase corporate tax paid (reduce tax avoidance). We take advantage of the heterogeneity of tax avoidance incentives across these three groups to develop alternative treatment and control groups to test the following hypotheses:18
H3: Corporate tax avoidance decreased more after 1 July 2000 for dividend-paying domestic firms relative to non-dividend-paying domestic firms.
H4: Corporate tax avoidance decreased more after 1 July 2000 for domestic firms paying fully franked dividends relative to dividend-paying domestic firms that do not pay fully franked dividends.
3. RESEARCH DESIGN
3.1 Sample selection and data sources
The sample initially consists of all companies publicly listed on the ASX during 1997-2004. To implement the identification strategy, the sample period is restricted to this relatively narrow period (4 years either side of the legislative change) to help mitigate the influence of any confounding factors (Allen et al., 2016). The choice of this time window is a reasonable compromise to the trade-off between relevance and precision. The window must be long enough to detect meaningful changes in tax avoidance given corporate tax strategies are usually long-term strategies that may take time to alter. In addition, it allows for the retention of a large enough sample size. However, the time window must be short enough so as not to incorporate too much noise into the analysis.
Panel A of Table 1 summarises the sample selection procedure. First, property partnership or trust entities are excluded due to their unique capital structures and the fact that trusts are not taxpayers.19 Second, firms with missing data (e.g., ticker, GICS
18 McClure et al. (2018) use dummy variables to distinguish between two groups of dividend-paying firms; firms paying franked dividends (partly- or fully franked) and firms paying unfranked dividends. 19 Trust income is taxed in the hands of trust beneficiaries or unit holders.
eJournal of Tax Research The impact of full franking credit refundability on corporate tax avoidance
142
codes) are excluded and only those firms that report in at least one year in both the pre and post periods are included. Firm-year observations for which data are available to calculate the model variables are retained. Finally, we follow recent tax avoidance studies (e.g., Ikin & Tran, 2013; McClure et al., 2018; Li & Tran, 2019) and exclude firm-year observations with negative pre-tax income on the basis that ETRs are difficult to interpret when the denominator is negative, and these firms may be in a different tax planning position relative to profitable firms. After imposing these requirements, the final sample is a panel of 2,237 firm-year observations for 482 firms. The panel comprises the main sample of 440 domestic firms (2,041 firm-year observations) and the control sample of 42 foreign firms (196 firm-year observations). Finally, to minimise the undue influence of outliers, all continuous variables are winsorized at the 1st and 99th percentiles of their respective distributions.
eJournal of Tax Research The impact of full franking credit refundability on corporate tax avoidance
143
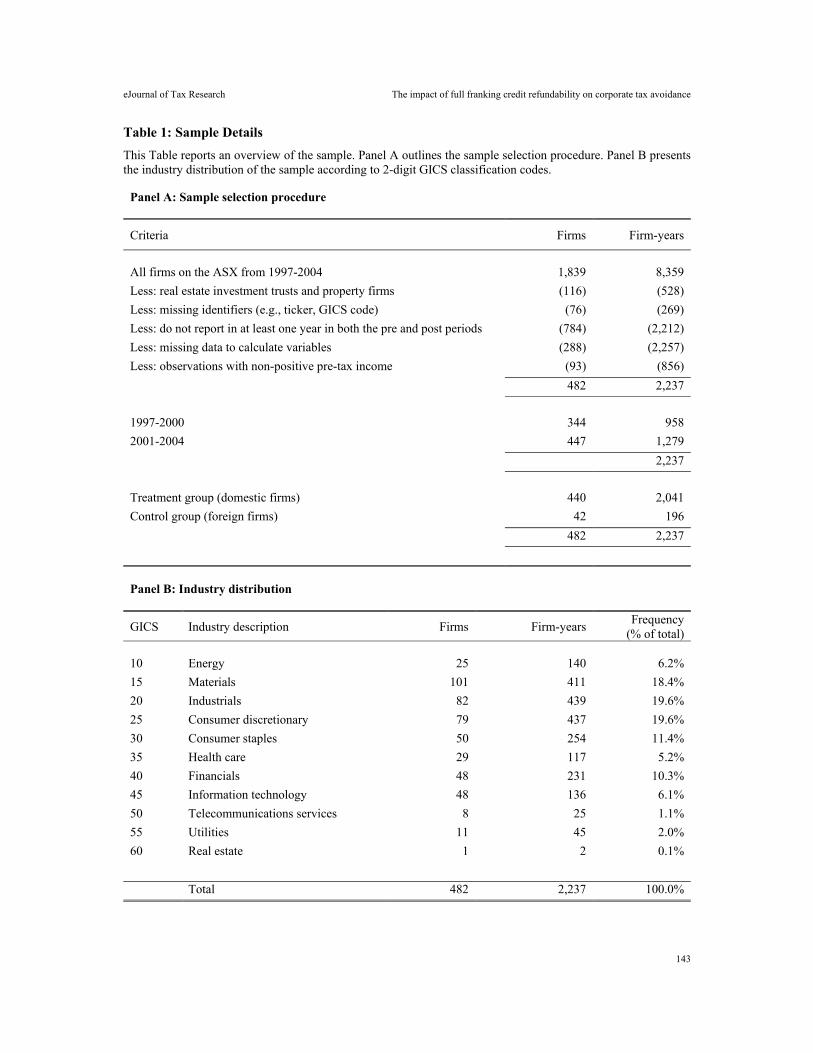
Table 1: Sample Details
This Table reports an overview of the sample. Panel A outlines the sample selection procedure. Panel B presents the industry distribution of the sample according to 2-digit GICS classification codes.
Panel A: Sample selection procedure
Criteria Firms Firm-years
All firms on the ASX from 1997-2004 1,839 8,359
Less: real estate investment trusts and property firms (116) (528)
Less: missing identifiers (e.g., ticker, GICS code) (76) (269)
Less: do not report in at least one year in both the pre and post periods (784) (2,212)
Less: missing data to calculate variables (288) (2,257)
Less: observations with non-positive pre-tax income (93) (856)
482 2,237
1997-2000 344 958
2001-2004 447 1,279
2,237
Treatment group (domestic firms) 440 2,041
Control group (foreign firms) 42 196
482 2,237
Panel B: Industry distribution
GICS Industry description Firms Firm-years Frequency
(% of total) 10 Energy 25 140 6.2%
15 Materials 101 411 18.4%
20 Industrials 82 439 19.6%
25 Consumer discretionary 79 437 19.6%
30 Consumer staples 50 254 11.4%
35 Health care 29 117 5.2%
40 Financials 48 231 10.3%
45 Information technology 48 136 6.1%
50 Telecommunications services 8 25 1.1%
55 Utilities 11 45 2.0%
60 Real estate 1 2 0.1%
Total 482 2,237 100.0%
eJournal of Tax Research The impact of full franking credit refundability on corporate tax avoidance
144
To construct the variables in the empirical models, financial statement information is collected from Datastream. Data relating to dividends and share prices are obtained from SIRCA. Panel B of Table 1 presents the industry distribution of the sample according to 2-digit GICS classification codes. The sample includes a greater proportion of firms in the industrials (19.6%), consumer discretionary (19.6%) and materials (18.4%) sectors, though there appears to be no significant industry bias.
3.2 Dependent variable
Tax avoidance is usually veiled in a cloak of secrecy and hence unobservable to the researcher. This makes such activities difficult to measure leading to claims that the degree of tax aggressiveness is ‘in the eye of the beholder’ (Hanlon & Heitzman, 2010). Following prior research, (e.g., Chen et al., 2010; Lennox, Lisowsky & Pittman, 2013; McClure et al., 2018), the annual cash ETR (CETR) is employed as the proxy for tax avoidance. CETR is computed as income tax paid from the cash flow statement in year t divided by pre-tax income in the same period, and it captures a firm’s ability to pay a low amount of cash taxes relative to earnings. Like book ETRs, this measure only reflects non-conforming tax avoidance, that is, tax-related transactions accounted for differently for book and tax purposes (Hanlon & Heitzman, 2010). CETR reflects both temporary and permanent book-tax differences (BTDs) and a very low level of CETR likely captures extreme cases of tax avoidance. However, unlike book ETRs, CETR is unaffected by opaque income tax accruals and represents a more accurate estimate of the cash taxes paid (Dhaliwal, Gleason & Mills, 2004).20 Given payment of cash corporate taxes underpins the franking credit generation process, CETR is the most appropriate ETR measure to use in the analysis.
Consistent with prior literature (e.g., Dyreng, Hanlon & Maydew, 2008; McClure et al., 2018) CETR is constrained to fall within the [0, 1] interval to ensure a valid interpretation of tax avoidance. Finally, firms generally have stronger incentives for tax avoidance when the statutory corporate tax rate is higher, so tax avoidance likely varies with statutory tax rate changes. During the sample period, the statutory corporate tax rate changed several times. For fiscal years ending 30 June 1997 through 30 June 2000 it was 36%, then decreased to 34% for the 2001 financial year, and decreased again to 30% for the 2002 and subsequent financial years. These changes are taken into account by dividing CETR by the statutory corporate tax rate prevailing at the time (Ikin & Tran, 2013).21 Tax avoidance activities are minimal when the ratios are close to unity and the smaller the ratios, the more aggressive is the tax strategy.
3.3 Regression model
A difference-in-differences specification is employed to analyse the effect of the change in the dividend imputation system on tax avoidance (Dyreng, Hoopes & Wilde, 2016). Several treatment and control groups are constructed to test the four hypotheses. This
20 A firm’s book ETR is total income tax expense divided by pre-tax accounting income and measures the taxes on the current period’s pre-tax income reported in the financial statements. However, the concern with this proxy is that both the numerator and denominator are recorded on an accruals basis, thus differences between the timing of income and expenses for financial reporting and tax reporting are reflected in the measure. It reflects aggressive tax planning through permanent BTDs, that is, a tax strategy that defers tax (e.g., accelerated depreciation for tax purposes) will not alter the book ETR. 21 CETR for foreign firms is divided by the statutory corporate tax rate prevailing at the time in the country where the firm is headquartered.
eJournal of Tax Research The impact of full franking credit refundability on corporate tax avoidance
145
research design allows us to control for time invariant differences between treatment and control groups in addition to general economic trends common to both groups. Different variations of the following specification are estimated:
CETRi,t = α0 + α1TREATEDi,t +α2TREATED*POSTi,t + α3SIZEi,t + α4ROAi,t +α5LEVi,t +α6INTANGi,t + α7CAPINTi,t+ α8MKTBKi,t + α9RNDi,t + εi,t (1)
TREATED is a dummy variable equal to 1 for each treatment group, and 0 otherwise. Treatment groups include domestic firms, domestic dividend-paying firms, domestic firms where all dividends paid are fully franked, and domestic firms where at least one dividend paid is fully franked. The legislative change became effective 1 July 2000, so an indicator variable denoted POST is included which takes the value of 1 for financial years ending 30 June 2001 onward, and 0 otherwise. The variable of interest is the interaction between TREATED and POST. To test all hypotheses, α2, the coefficient on TREATED*POST, is examined, which is the difference-in-differences estimate of the effect of the change in the dividend imputation system on tax avoidance in the post-refund period. A positive (negative) coefficient on this interaction variable indicates an increase (decrease) in CETR corresponding to a decrease (increase) in tax avoidance of treatment firms relative to control firms. In all four hypotheses, a positive coefficient for α2 is predicted.
An array of controls is included which have been identified in prior research as influencing tax avoidance to help alleviate concerns that correlated omitted variables are confounding inferences (Gupta & Newberry, 1997; Mills, Erickson & Maydew, 1998; Armstrong, Blouin & Larcker, 2012; Dyreng et al., 2017; McClure et al., 2018). Firm size (SIZE) is controlled for because larger firms may have higher political costs, or greater tax planning opportunities via economies of scale and greater sophistication. We control for firm performance (ROA) because some studies document an association between firm profitability and tax avoidance. Leverage (LEV) is controlled for because firms may reduce tax liabilities through the tax-deductibility of interest expenses, although interest payments reduce taxable profits and pre-tax earnings, thus attenuating the effect of leverage on ETRs.22 Firms may use intangible assets (e.g., patents, trademarks) to shift income to low-tax jurisdictions so the proportion of intangible assets to total assets (INTANG) is included. Higher levels of property, plant and equipment usually result in higher tax-deductible depreciation expenses leading to a positive association between capital intensity (CAPINT) and tax avoidance. Firms with more growth or investment opportunities likely face different tax planning incentives than mature firms, so the market-to-book ratio (MKTBK) is included to proxy for such opportunities. Lastly, research and development (R&D) intensity (RND) is controlled for because Australian firms receive generous R&D incentives which may lower taxable income (McClure et al., 2018).23
Finally, two different sets of fixed effects are included in the models. First, year fixed effects and industry fixed effects are included to control for general changes in tax
22 Interest expenses are fully tax-deductible in Australia (subject to thin capitalisation rules). 23 SIZE is calculated as the natural logarithm of total assets; ROA is calculated as pre-tax net income divided by common equity; LEV is calculated as total liabilities divided by total assets; INTANG is calculated as net intangible assets divided by total assets; CAPINT is calculated as net property, plant and equipment divided by total assets; MKTBK is calculated as the market value of equity divided by common equity; and RND is calculated as research and development expenditure divided by total revenues. Following prior literature (e.g., Dyreng et al., 2016), missing values of RND are replaced with zero.
eJournal of Tax Research The impact of full franking credit refundability on corporate tax avoidance
146
planning over time and the industry-affiliation effect, respectively. The inclusion of year fixed effects precludes the use of POST as a stand-alone variable in the models. The second set includes year fixed effects along with firm fixed effects to capture unobservable time-invariant firm characteristics. The inclusion of firm fixed effects prevents the inclusion of TREATED, a time-invariant firm variable, in the models.
4. EMPIRICAL RESULTS
4.1 Descriptive statistics
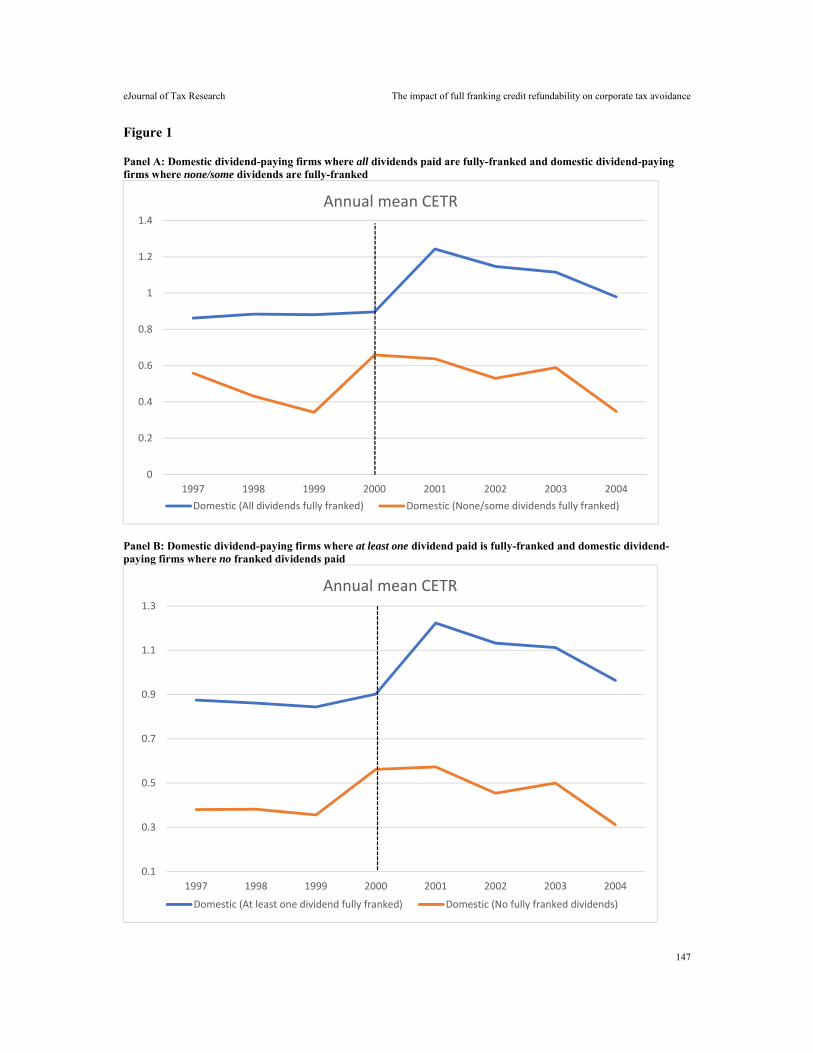
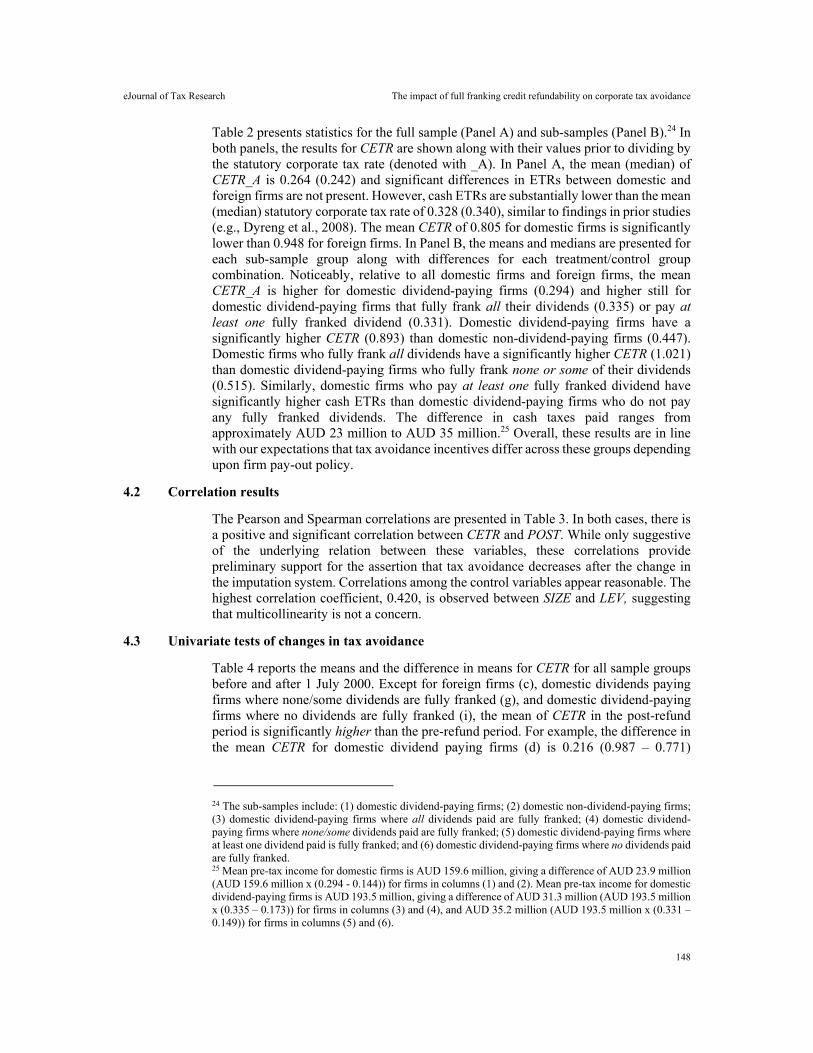
Analysis begins with the scrutiny of the time trend of CETR for each of the treatment and control group pairings used in the empirical analysis. Figure 1 illustrates that for H4 the trend in CETR before the change in the dividend imputation system is similar. In Panels A and B, despite level differences, the pre-change trend in CETR between both pairings is similar but noticeable increases exist for both treatment groups after the year 2000. Overall, the similar pre-change trends in CETR provides comfort that the treatment and control group combinations selected for analysis satisfy the parallel trends assumption underlying the difference-in-differences methodology (Roberts & Whited, 2013).
eJournal of Tax Research The impact of full franking credit refundability on corporate tax avoidance
147
Figure 1
Panel A: Domestic dividend-paying firms where all dividends paid are fully-franked and domestic dividend-paying firms where none/some dividends are fully-franked
Panel B: Domestic dividend-paying firms where at least one dividend paid is fully-franked and domestic dividend-paying firms where no franked dividends paid
0
0.2
0.4
0.6
0.8
1
1.2
1.4
1997 1998 1999 2000 2001 2002 2003 2004
Annual mean CETR
Domestic (All dividends fully franked) Domestic (None/some dividends fully franked)
0.1
0.3
0.5
0.7
0.9
1.1
1.3
1997 1998 1999 2000 2001 2002 2003 2004
Annual mean CETR
Domestic (At least one dividend fully franked) Domestic (No fully franked dividends)
eJournal of Tax Research The impact of full franking credit refundability on corporate tax avoidance
148
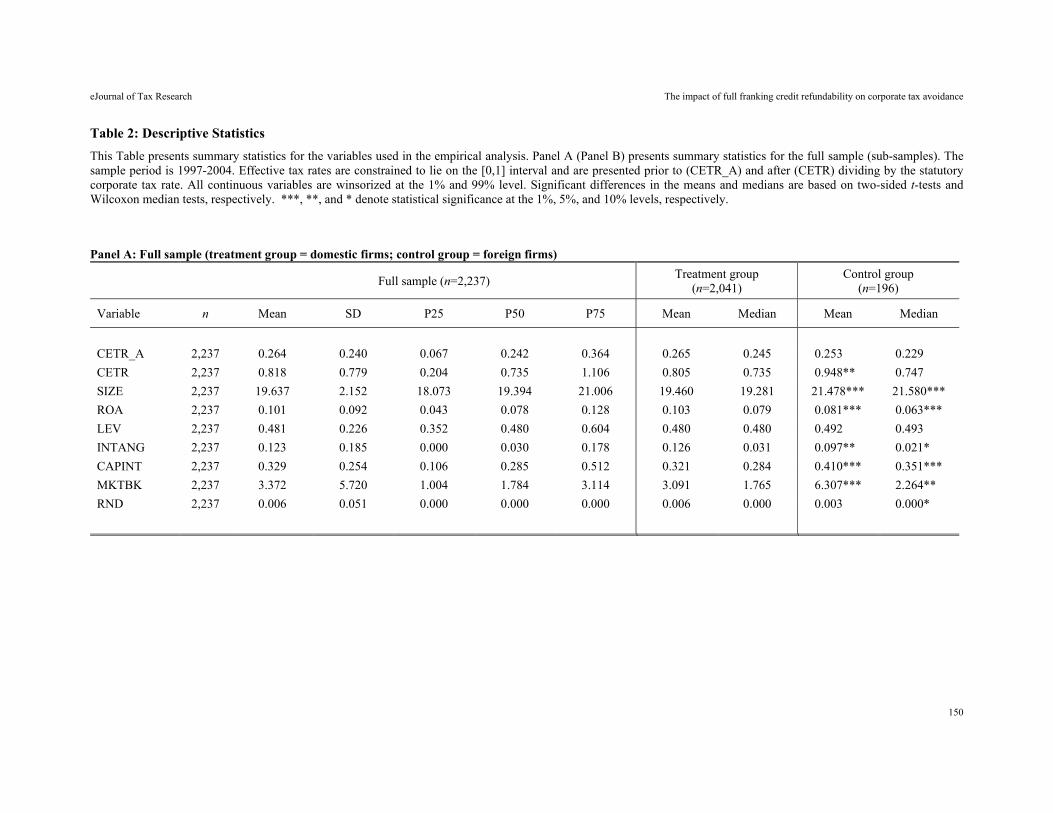
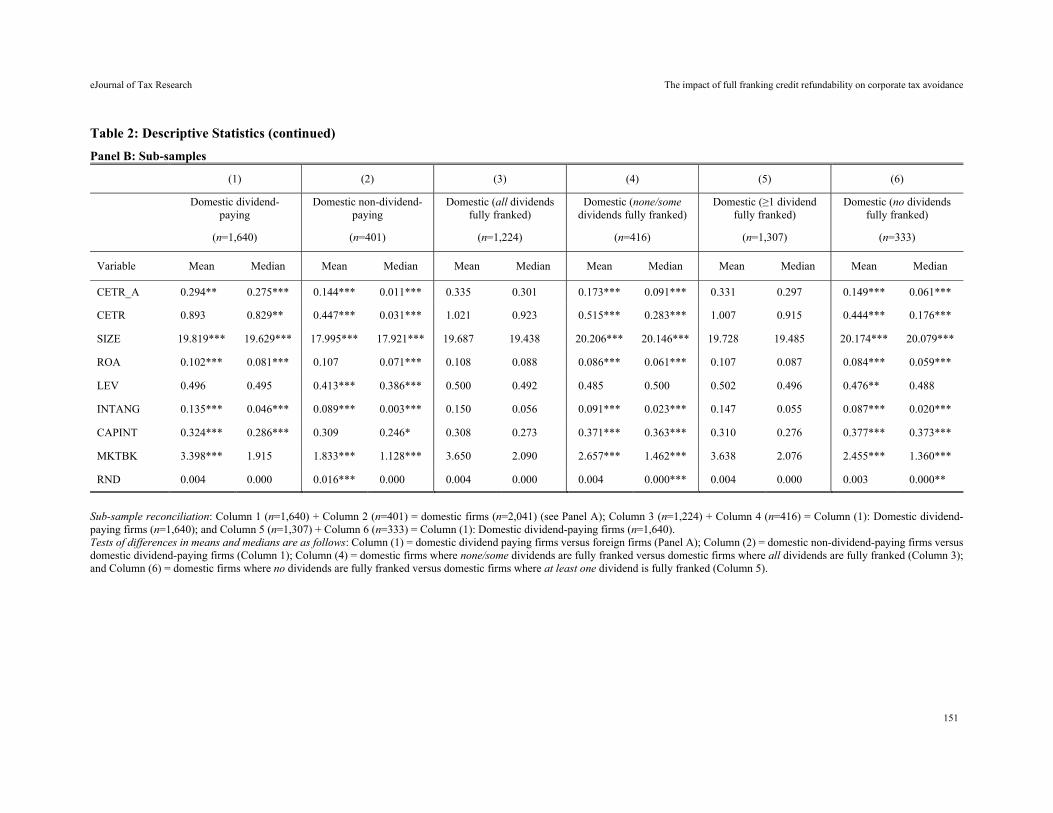
Table 2 presents statistics for the full sample (Panel A) and sub-samples (Panel B).24 In both panels, the results for CETR are shown along with their values prior to dividing by the statutory corporate tax rate (denoted with _A). In Panel A, the mean (median) of CETR_A is 0.264 (0.242) and significant differences in ETRs between domestic and foreign firms are not present. However, cash ETRs are substantially lower than the mean (median) statutory corporate tax rate of 0.328 (0.340), similar to findings in prior studies (e.g., Dyreng et al., 2008). The mean CETR of 0.805 for domestic firms is significantly lower than 0.948 for foreign firms. In Panel B, the means and medians are presented for each sub-sample group along with differences for each treatment/control group combination. Noticeably, relative to all domestic firms and foreign firms, the mean CETR_A is higher for domestic dividend-paying firms (0.294) and higher still for domestic dividend-paying firms that fully frank all their dividends (0.335) or pay at least one fully franked dividend (0.331). Domestic dividend-paying firms have a significantly higher CETR (0.893) than domestic non-dividend-paying firms (0.447). Domestic firms who fully frank all dividends have a significantly higher CETR (1.021) than domestic dividend-paying firms who fully frank none or some of their dividends (0.515). Similarly, domestic firms who pay at least one fully franked dividend have significantly higher cash ETRs than domestic dividend-paying firms who do not pay any fully franked dividends. The difference in cash taxes paid ranges from approximately AUD 23 million to AUD 35 million.25 Overall, these results are in line with our expectations that tax avoidance incentives differ across these groups depending upon firm pay-out policy.
4.2 Correlation results
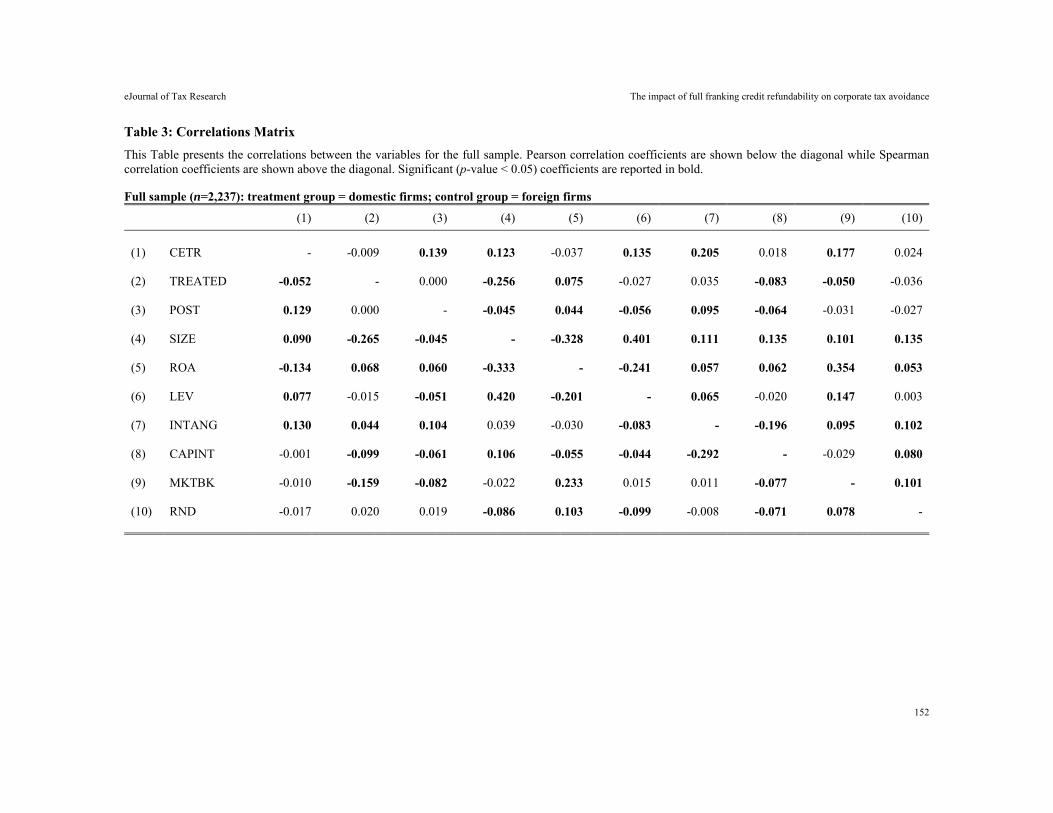
The Pearson and Spearman correlations are presented in Table 3. In both cases, there is a positive and significant correlation between CETR and POST. While only suggestive of the underlying relation between these variables, these correlations provide preliminary support for the assertion that tax avoidance decreases after the change in the imputation system. Correlations among the control variables appear reasonable. The highest correlation coefficient, 0.420, is observed between SIZE and LEV, suggesting that multicollinearity is not a concern.
4.3 Univariate tests of changes in tax avoidance
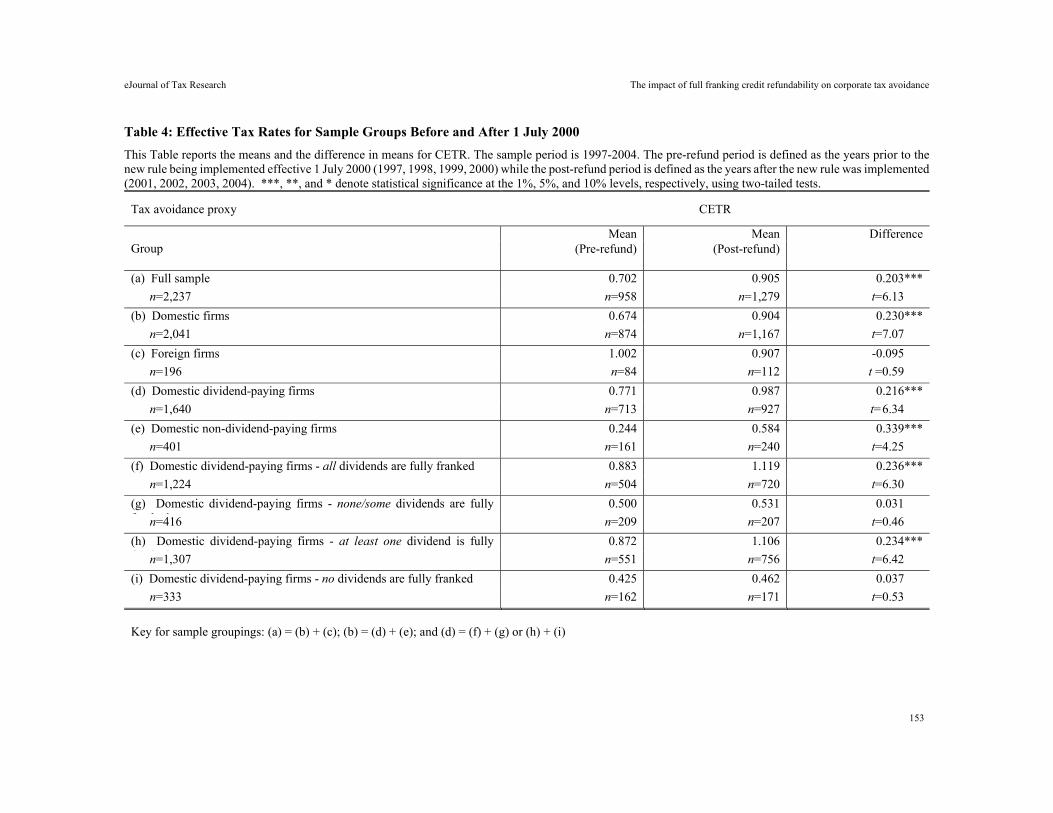
Table 4 reports the means and the difference in means for CETR for all sample groups before and after 1 July 2000. Except for foreign firms (c), domestic dividends paying firms where none/some dividends are fully franked (g), and domestic dividend-paying firms where no dividends are fully franked (i), the mean of CETR in the post-refund period is significantly higher than the pre-refund period. For example, the difference in the mean CETR for domestic dividend paying firms (d) is 0.216 (0.987 – 0.771)
24 The sub-samples include: (1) domestic dividend-paying firms; (2) domestic non-dividend-paying firms; (3) domestic dividend-paying firms where all dividends paid are fully franked; (4) domestic dividend-paying firms where none/some dividends paid are fully franked; (5) domestic dividend-paying firms where at least one dividend paid is fully franked; and (6) domestic dividend-paying firms where no dividends paid are fully franked. 25 Mean pre-tax income for domestic firms is AUD 159.6 million, giving a difference of AUD 23.9 million (AUD 159.6 million x (0.294 - 0.144)) for firms in columns (1) and (2). Mean pre-tax income for domestic dividend-paying firms is AUD 193.5 million, giving a difference of AUD 31.3 million (AUD 193.5 million x (0.335 – 0.173)) for firms in columns (3) and (4), and AUD 35.2 million (AUD 193.5 million x (0.331 – 0.149)) for firms in columns (5) and (6).
eJournal of Tax Research The impact of full franking credit refundability on corporate tax avoidance
149
significant at the 1% level (t-stat = 6.34). Using mean pre-tax income of AUD 193.5 million for these firms over the sample period, this 28.0% difference represents about AUD 13.7 million more in cash taxes paid in the post-refund period relative to the pre-refund period.26 This preliminary evidence is consistent with the argument that the enhancement to the dividend imputation system increased the incentives for certain firms to take a less aggressive approach to tax avoidance.
We note the surprising result in row (e) and offer two possible explanations. First, it may be that these profitable firms are reducing their tax avoidance (paying more cash taxes) in the post 1 July 2000 period to start generating franking credits for possible future distribution with planned dividends. Second, it may be that they are increasing their tax payments so as not to stand out from their competitors to minimise any ATO scrutiny (i.e. mimicking behaviour).
26 The mean statutory corporate tax rate over the sample period is 0.328. Therefore, the difference of AUD 13.7 million = ((AUD 193.5 million x (0.987 – 0.771)) x 0.328).
eJournal of Tax Research The impact of full franking credit refundability on corporate tax avoidance
150
Table 2: Descriptive Statistics
This Table presents summary statistics for the variables used in the empirical analysis. Panel A (Panel B) presents summary statistics for the full sample (sub-samples). The sample period is 1997-2004. Effective tax rates are constrained to lie on the [0,1] interval and are presented prior to (CETR_A) and after (CETR) dividing by the statutory corporate tax rate. All continuous variables are winsorized at the 1% and 99% level. Significant differences in the means and medians are based on two-sided t-tests and Wilcoxon median tests, respectively. ***, **, and * denote statistical significance at the 1%, 5%, and 10% levels, respectively.
Panel A: Full sample (treatment group = domestic firms; control group = foreign firms)
Full sample (n=2,237) Treatment group
(n=2,041) Control group
(n=196)
Variable n Mean SD P25 P50 P75 Mean Median Mean Median
CETR_A 2,237 0.264 0.240 0.067 0.242 0.364 0.265 0.245 0.253*** 0.229***
CETR 2,237 0.818 0.779 0.204 0.735 1.106 0.805 0.735 0.948*** 0.747***
SIZE 2,237 19.637 2.152 18.073 19.394 21.006 19.460 19.281 21.478*** 21.580***
ROA 2,237 0.101 0.092 0.043 0.078 0.128 0.103 0.079 0.081*** 0.063***
LEV 2,237 0.481 0.226 0.352 0.480 0.604 0.480 0.480 0.492*** 0.493***
INTANG 2,237 0.123 0.185 0.000 0.030 0.178 0.126 0.031 0.097*** 0.021***
CAPINT 2,237 0.329 0.254 0.106 0.285 0.512 0.321 0.284 0.410*** 0.351***
MKTBK 2,237 3.372 5.720 1.004 1.784 3.114 3.091 1.765 6.307*** 2.264***
RND 2,237 0.006 0.051 0.000 0.000 0.000 0.006 0.000 0.003*** 0.000***
eJournal of Tax Research The impact of full franking credit refundability on corporate tax avoidance
151
Table 2: Descriptive Statistics (continued)
Panel B: Sub-samples
(1) (2) (3) (4) (5) (6)
Domestic dividend-
paying Domestic non-dividend-
paying Domestic (all dividends
fully franked) Domestic (none/some
dividends fully franked) Domestic (≥1 dividend
fully franked) Domestic (no dividends
fully franked)
(n=1,640) (n=401) (n=1,224) (n=416) (n=1,307) (n=333)
Variable Mean Median Mean Median Mean Median Mean Median Mean Median Mean Median
CETR_A 0.294*** 0.275*** 0.144*** 0.011*** 0.335*** 0.301*** 0.173*** 0.091*** 0.331*** 0.297*** 0.149*** 0.061***
CETR 0.893*** 0.829*** 0.447*** 0.031*** 1.021*** 0.923*** 0.515*** 0.283*** 1.007*** 0.915*** 0.444*** 0.176***
SIZE 19.819*** 19.629*** 17.995*** 17.921*** 19.687*** 19.438*** 20.206*** 20.146*** 19.728*** 19.485*** 20.174*** 20.079***
ROA 0.102*** 0.081*** 0.107*** 0.071*** 0.108*** 0.088*** 0.086*** 0.061*** 0.107*** 0.087*** 0.084*** 0.059***
LEV 0.496*** 0.495*** 0.413*** 0.386*** 0.500*** 0.492*** 0.485*** 0.500*** 0.502*** 0.496*** 0.476*** 0.488***
INTANG 0.135*** 0.046*** 0.089*** 0.003*** 0.150*** 0.056*** 0.091*** 0.023*** 0.147*** 0.055*** 0.087*** 0.020***
CAPINT 0.324*** 0.286*** 0.309*** 0.246*** 0.308*** 0.273*** 0.371*** 0.363*** 0.310*** 0.276*** 0.377*** 0.373***
MKTBK 3.398*** 1.915*** 1.833*** 1.128*** 3.650*** 2.090*** 2.657*** 1.462*** 3.638*** 2.076*** 2.455*** 1.360***
RND 0.004*** 0.000*** 0.016*** 0.000*** 0.004*** 0.000*** 0.004*** 0.000*** 0.004*** 0.000*** 0.003*** 0.000***
Sub-sample reconciliation: Column 1 (n=1,640) + Column 2 (n=401) = domestic firms (n=2,041) (see Panel A); Column 3 (n=1,224) + Column 4 (n=416) = Column (1): Domestic dividend-paying firms (n=1,640); and Column 5 (n=1,307) + Column 6 (n=333) = Column (1): Domestic dividend-paying firms (n=1,640). Tests of differences in means and medians are as follows: Column (1) = domestic dividend paying firms versus foreign firms (Panel A); Column (2) = domestic non-dividend-paying firms versus domestic dividend-paying firms (Column 1); Column (4) = domestic firms where none/some dividends are fully franked versus domestic firms where all dividends are fully franked (Column 3); and Column (6) = domestic firms where no dividends are fully franked versus domestic firms where at least one dividend is fully franked (Column 5).
eJournal of Tax Research The impact of full franking credit refundability on corporate tax avoidance
152
Table 3: Correlations Matrix
This Table presents the correlations between the variables for the full sample. Pearson correlation coefficients are shown below the diagonal while Spearman correlation coefficients are shown above the diagonal. Significant (p-value < 0.05) coefficients are reported in bold.
Full sample (n=2,237): treatment group = domestic firms; control group = foreign firms (1) (2) (3) (4) (5) (6) (7) (8) (9) (10)
(1) CETR - -0.009 0.139 0.123 -0.037 0.135 0.205 0.018 0.177 0.024 (2) TREATED -0.052 - 0.000 -0.256 0.075 -0.027 0.035 -0.083 -0.050 -0.036 (3) POST 0.129 0.000 - -0.045 0.044 -0.056 0.095 -0.064 -0.031 -0.027 (4) SIZE 0.090 -0.265 -0.045 - -0.328 0.401 0.111 0.135 0.101 0.135 (5) ROA -0.134 0.068 0.060 -0.333 - -0.241 0.057 0.062 0.354 0.053 (6) LEV 0.077 -0.015 -0.051 0.420 -0.201 - 0.065 -0.020 0.147 0.003 (7) INTANG 0.130 0.044 0.104 0.039 -0.030 -0.083 - -0.196 0.095 0.102 (8) CAPINT -0.001 -0.099 -0.061 0.106 -0.055 -0.044 -0.292 - -0.029 0.080 (9) MKTBK -0.010 -0.159 -0.082 -0.022 0.233 0.015 0.011 -0.077 - 0.101 (10) RND -0.017 0.020 0.019 -0.086 0.103 -0.099 -0.008 -0.071 0.078 -
eJournal of Tax Research The impact of full franking credit refundability on corporate tax avoidance
153
Table 4: Effective Tax Rates for Sample Groups Before and After 1 July 2000
This Table reports the means and the difference in means for CETR. The sample period is 1997-2004. The pre-refund period is defined as the years prior to the new rule being implemented effective 1 July 2000 (1997, 1998, 1999, 2000) while the post-refund period is defined as the years after the new rule was implemented (2001, 2002, 2003, 2004). ***, **, and * denote statistical significance at the 1%, 5%, and 10% levels, respectively, using two-tailed tests.
Tax avoidance proxy CETR
Group Mean Mean Difference
(Pre-refund)
(Post-refund)
(a) Full sample 0.702 0.905 0.203***
n=2,237 n=958 n=1,279 t=6.13***
(b) Domestic firms 0.674 0.904 0.230***
n=2,041 n=874 n=1,167 t=7.07***
(c) Foreign firms 1.002 0.907 -0.095***
n=196 n=84 n=112 t =0.59***
(d) Domestic dividend-paying firms 0.771 0.987 0.216***
n=1,640 n=713 n=927 t=6.34***
(e) Domestic non-dividend-paying firms 0.244 0.584 0.339***
n=401 n=161 n=240 t=4.25***
(f) Domestic dividend-paying firms - all dividends are fully franked 0.883 1.119 0.236***
n=1,224 n=504 n=720 t=6.30***
(g) Domestic dividend-paying firms - none/some dividends are fully f k d
0.500 0.531 0.031***
n=416 n=209 n=207 t=0.46***
(h) Domestic dividend-paying firms - at least one dividend is fully f k d
0.872 1.106 0.234***
n=1,307 n=551 n=756 t=6.42***
(i) Domestic dividend-paying firms - no dividends are fully franked 0.425 0.462 0.037***
n=333 n=162 n=171 t=0.53***
Key for sample groupings: (a) = (b) + (c); (b) = (d) + (e); and (d) = (f) + (g) or (h) + (i)
eJournal of Tax Research The impact of full franking credit refundability on corporate tax avoidance
154
4.4 Multivariate tests of changes in tax avoidance
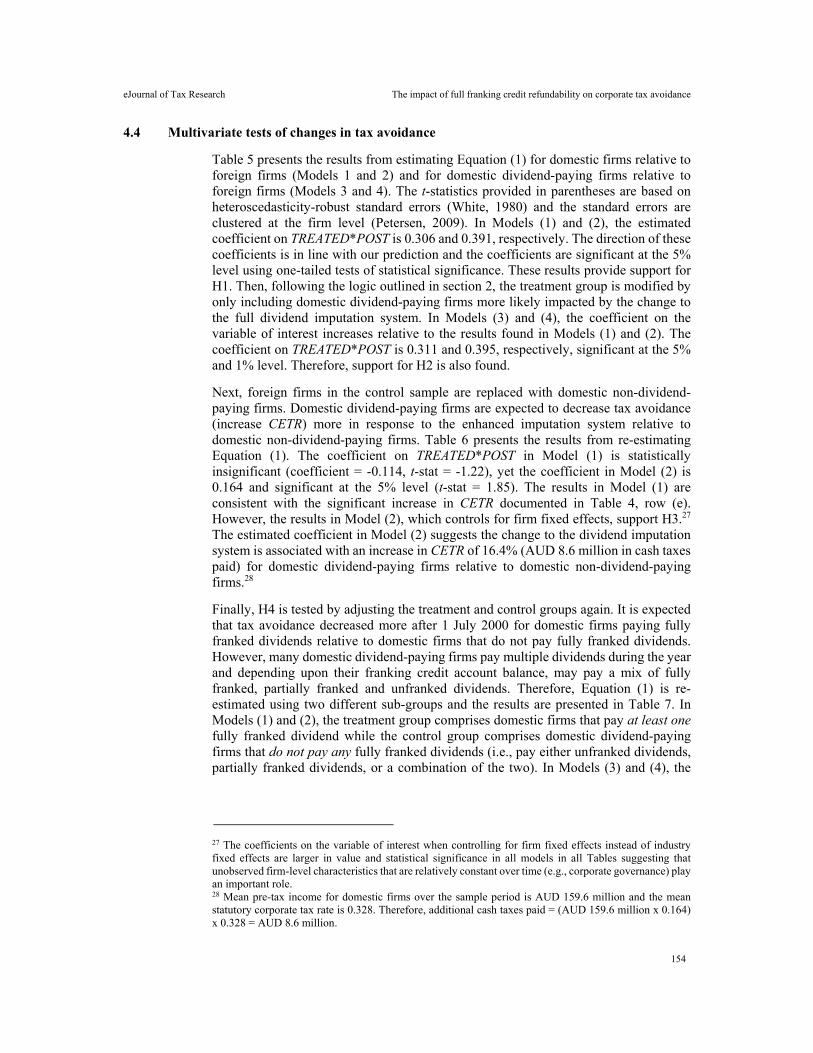
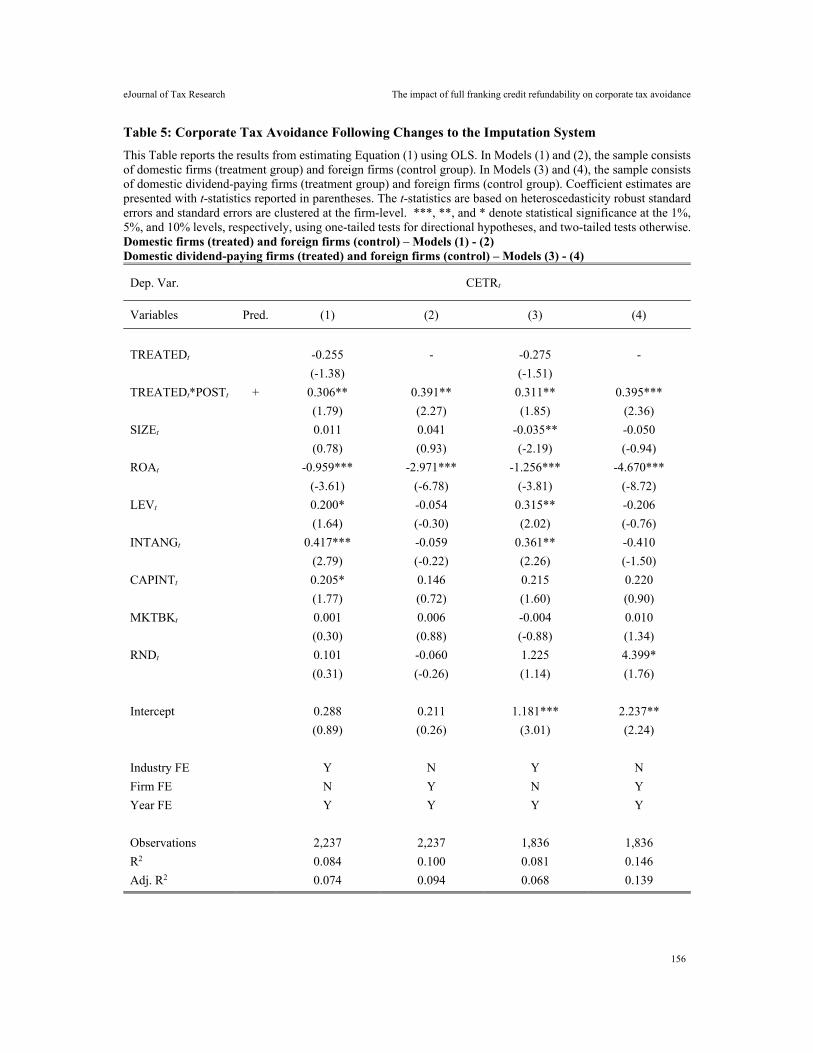
Table 5 presents the results from estimating Equation (1) for domestic firms relative to foreign firms (Models 1 and 2) and for domestic dividend-paying firms relative to foreign firms (Models 3 and 4). The t-statistics provided in parentheses are based on heteroscedasticity-robust standard errors (White, 1980) and the standard errors are clustered at the firm level (Petersen, 2009). In Models (1) and (2), the estimated coefficient on TREATED*POST is 0.306 and 0.391, respectively. The direction of these coefficients is in line with our prediction and the coefficients are significant at the 5% level using one-tailed tests of statistical significance. These results provide support for H1. Then, following the logic outlined in section 2, the treatment group is modified by only including domestic dividend-paying firms more likely impacted by the change to the full dividend imputation system. In Models (3) and (4), the coefficient on the variable of interest increases relative to the results found in Models (1) and (2). The coefficient on TREATED*POST is 0.311 and 0.395, respectively, significant at the 5% and 1% level. Therefore, support for H2 is also found.
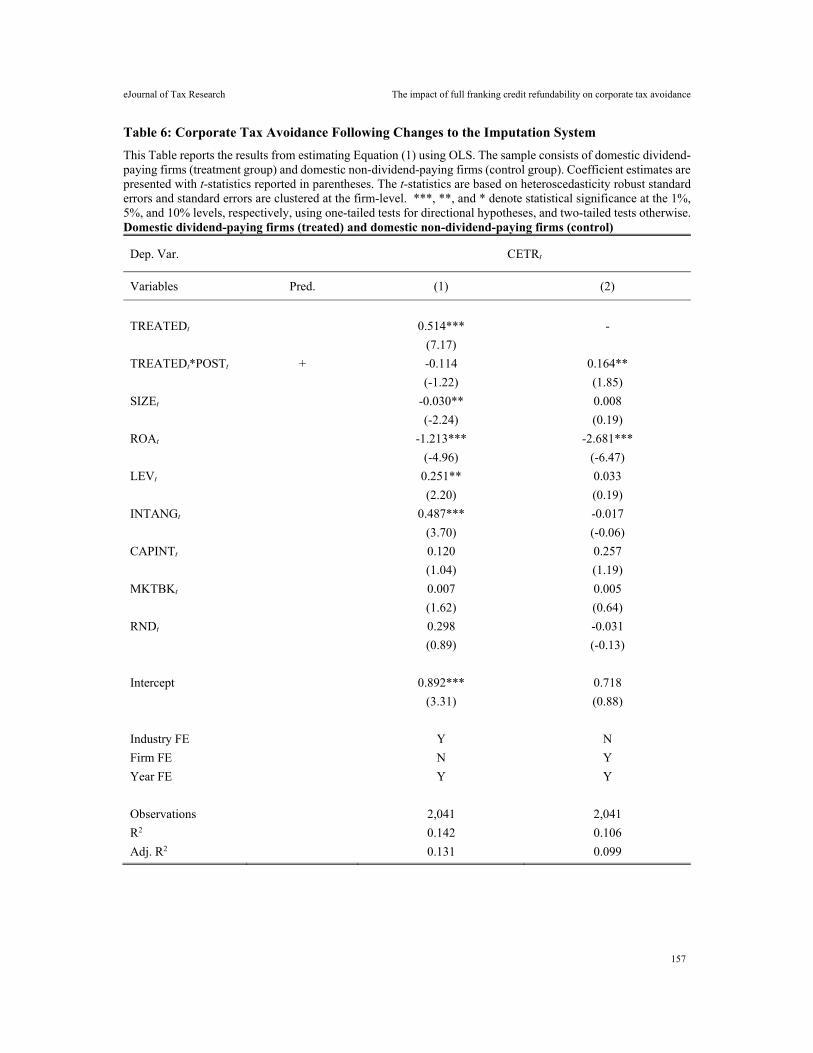
Next, foreign firms in the control sample are replaced with domestic non-dividend-paying firms. Domestic dividend-paying firms are expected to decrease tax avoidance (increase CETR) more in response to the enhanced imputation system relative to domestic non-dividend-paying firms. Table 6 presents the results from re-estimating Equation (1). The coefficient on TREATED*POST in Model (1) is statistically insignificant (coefficient = -0.114, t-stat = -1.22), yet the coefficient in Model (2) is 0.164 and significant at the 5% level (t-stat = 1.85). The results in Model (1) are consistent with the significant increase in CETR documented in Table 4, row (e). However, the results in Model (2), which controls for firm fixed effects, support H3.27 The estimated coefficient in Model (2) suggests the change to the dividend imputation system is associated with an increase in CETR of 16.4% (AUD 8.6 million in cash taxes paid) for domestic dividend-paying firms relative to domestic non-dividend-paying firms.28
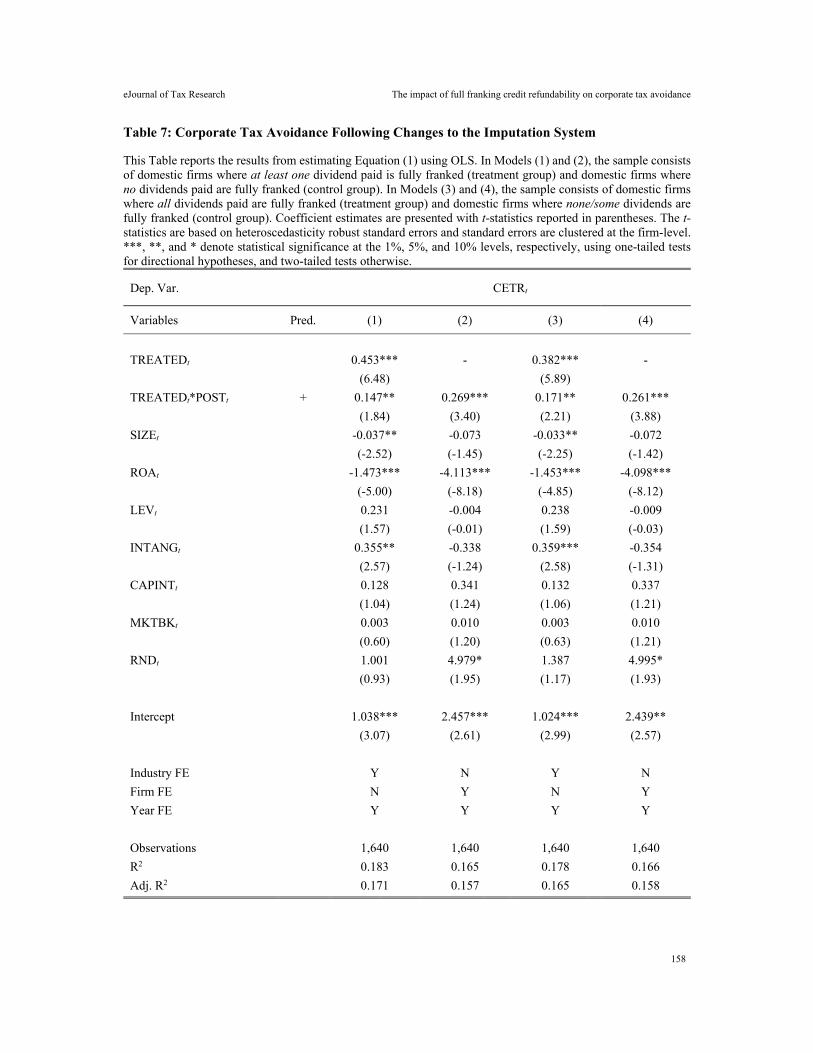
Finally, H4 is tested by adjusting the treatment and control groups again. It is expected that tax avoidance decreased more after 1 July 2000 for domestic firms paying fully franked dividends relative to domestic firms that do not pay fully franked dividends. However, many domestic dividend-paying firms pay multiple dividends during the year and depending upon their franking credit account balance, may pay a mix of fully franked, partially franked and unfranked dividends. Therefore, Equation (1) is re-estimated using two different sub-groups and the results are presented in Table 7. In Models (1) and (2), the treatment group comprises domestic firms that pay at least one fully franked dividend while the control group comprises domestic dividend-paying firms that do not pay any fully franked dividends (i.e., pay either unfranked dividends, partially franked dividends, or a combination of the two). In Models (3) and (4), the
27 The coefficients on the variable of interest when controlling for firm fixed effects instead of industry fixed effects are larger in value and statistical significance in all models in all Tables suggesting that unobserved firm-level characteristics that are relatively constant over time (e.g., corporate governance) play an important role. 28 Mean pre-tax income for domestic firms over the sample period is AUD 159.6 million and the mean statutory corporate tax rate is 0.328. Therefore, additional cash taxes paid = (AUD 159.6 million x 0.164) x 0.328 = AUD 8.6 million.
eJournal of Tax Research The impact of full franking credit refundability on corporate tax avoidance
155
treatment group (control group) comprises domestic dividend-paying firms that fully frank all dividends (fully frank none or some dividends).
The results in Table 7 strongly support H4. The coefficient on TREATED*POST in Model (1) is 0.147 and significant at the 5% level (t-stat = 1.84) and is 0.269 and significant at the 1% level (t-stat = 3.40) in Model (2). In Models (3) and (4), the coefficient on TREATED*POST is 0.171 (t-stat = 2.21) and in Model (4) is 0.261 (t-stat = 3.88). These coefficients are significant at the 5% and 1% levels, respectively. The results in Models (3) and (4) suggest that the introduction of the refund provision is associated with an increase in CETR of around 17-26% (AUD 10.9 million to AUD 16.6 million in cash taxes paid) for domestic dividend-paying firms that fully frank all dividends compared to those that do not fully frank all dividends.29
Overall, the results are consistent with the intuition that the change to the dividend imputation system effective 1 July 2000 provided stronger incentives for firms paying franked-dividends to minimise tax avoidance to generate further imputation credits demanded by tax-advantaged shareholders.30 In particular, the incentives appear to have increased more for those firms paying fully franked dividends. This finding suggests that managers of domestic dividend-paying firms are acting in the best interests of their resident shareholders who can utilise these tax credits to reduce their own tax liabilities.
29 Mean pre-tax income for the domestic dividend-paying firms over the sample period is AUD 193.5 million and the mean corporate tax rate is 0.328. Therefore, additional cash taxes paid is approximately AUD 10.9 million ((AUD 193.5 million x 0.171) x 0.328) to AUD 16.6 million ((AUD 193.5 million x 0.261) x 0.328). 30 We note that in some of the multivariate regressions results in Tables 5-8, the coefficients on LEV and INTANG are significantly positive. The significantly positive coefficients found for LEV and INTANG in some models are consistent with those found in Graham and Tucker (2006) and McClure et al. (2018). These results only obtain in the models where industry and year fixed effects are included. When industry fixed effects are replaced with firm fixed effects, the coefficients are insignificant.
eJournal of Tax Research The impact of full franking credit refundability on corporate tax avoidance
156
Table 5: Corporate Tax Avoidance Following Changes to the Imputation System
This Table reports the results from estimating Equation (1) using OLS. In Models (1) and (2), the sample consists of domestic firms (treatment group) and foreign firms (control group). In Models (3) and (4), the sample consists of domestic dividend-paying firms (treatment group) and foreign firms (control group). Coefficient estimates are presented with t-statistics reported in parentheses. The t-statistics are based on heteroscedasticity robust standard errors and standard errors are clustered at the firm-level. ***, **, and * denote statistical significance at the 1%, 5%, and 10% levels, respectively, using one-tailed tests for directional hypotheses, and two-tailed tests otherwise. Domestic firms (treated) and foreign firms (control) – Models (1) - (2) Domestic dividend-paying firms (treated) and foreign firms (control) – Models (3) - (4)
Dep. Var. CETRt
Variables Pred. (1) (2) (3) (4)
TREATEDt -0.255 - -0.275 -
(-1.38) (-1.51)
TREATEDt*POSTt + 0.306** 0.391** 0.311** 0.395***
(1.79) (2.27) (1.85) (2.36)
SIZEt 0.011 0.041 -0.035** -0.050
(0.78) (0.93) (-2.19) (-0.94)
ROAt -0.959*** -2.971*** -1.256*** -4.670***
(-3.61) (-6.78) (-3.81) (-8.72)
LEVt 0.200* -0.054 0.315** -0.206
(1.64) (-0.30) (2.02) (-0.76)
INTANGt 0.417*** -0.059 0.361** -0.410
(2.79) (-0.22) (2.26) (-1.50)
CAPINTt 0.205* 0.146 0.215 0.220
(1.77) (0.72) (1.60) (0.90)
MKTBKt 0.001 0.006 -0.004 0.010
(0.30) (0.88) (-0.88) (1.34)
RNDt 0.101 -0.060 1.225 4.399*
(0.31) (-0.26) (1.14) (1.76)
Intercept 0.288 0.211 1.181*** 2.237**
(0.89) (0.26) (3.01) (2.24)
Industry FE Y N Y N
Firm FE N Y N Y
Year FE Y Y Y Y
Observations 2,237 2,237 1,836 1,836
R2 0.084 0.100 0.081 0.146
Adj. R2 0.074 0.094 0.068 0.139
eJournal of Tax Research The impact of full franking credit refundability on corporate tax avoidance
157
Table 6: Corporate Tax Avoidance Following Changes to the Imputation System
This Table reports the results from estimating Equation (1) using OLS. The sample consists of domestic dividend-paying firms (treatment group) and domestic non-dividend-paying firms (control group). Coefficient estimates are presented with t-statistics reported in parentheses. The t-statistics are based on heteroscedasticity robust standard errors and standard errors are clustered at the firm-level. ***, **, and * denote statistical significance at the 1%, 5%, and 10% levels, respectively, using one-tailed tests for directional hypotheses, and two-tailed tests otherwise. Domestic dividend-paying firms (treated) and domestic non-dividend-paying firms (control)
Dep. Var. CETRt
Variables Pred. (1) (2)
TREATEDt 0.514*** -
(7.17)
TREATEDt*POSTt + -0.114 0.164**
(-1.22) (1.85)
SIZEt -0.030** 0.008
(-2.24) (0.19)
ROAt -1.213*** -2.681***
(-4.96) (-6.47)
LEVt 0.251** 0.033
(2.20) (0.19)
INTANGt 0.487*** -0.017
(3.70) (-0.06)
CAPINTt 0.120 0.257
(1.04) (1.19)
MKTBKt 0.007 0.005
(1.62) (0.64)
RNDt 0.298 -0.031
(0.89) (-0.13)
Intercept 0.892*** 0.718
(3.31) (0.88)
Industry FE Y N
Firm FE N Y
Year FE Y Y
Observations 2,041 2,041
R2 0.142 0.106
Adj. R2 0.131 0.099
eJournal of Tax Research The impact of full franking credit refundability on corporate tax avoidance
158
Table 7: Corporate Tax Avoidance Following Changes to the Imputation System
This Table reports the results from estimating Equation (1) using OLS. In Models (1) and (2), the sample consists of domestic firms where at least one dividend paid is fully franked (treatment group) and domestic firms where no dividends paid are fully franked (control group). In Models (3) and (4), the sample consists of domestic firms where all dividends paid are fully franked (treatment group) and domestic firms where none/some dividends are fully franked (control group). Coefficient estimates are presented with t-statistics reported in parentheses. The t-statistics are based on heteroscedasticity robust standard errors and standard errors are clustered at the firm-level. ***, **, and * denote statistical significance at the 1%, 5%, and 10% levels, respectively, using one-tailed tests for directional hypotheses, and two-tailed tests otherwise.
Dep. Var. CETRt
Variables Pred. (1) (2) (3) (4)
TREATEDt 0.453*** - 0.382*** -
(6.48) (5.89)
TREATEDt*POSTt + 0.147** 0.269*** 0.171** 0.261***
(1.84) (3.40) (2.21) (3.88)
SIZEt -0.037** -0.073 -0.033** -0.072
(-2.52) (-1.45) (-2.25) (-1.42)
ROAt -1.473*** -4.113*** -1.453*** -4.098***
(-5.00) (-8.18) (-4.85) (-8.12)
LEVt 0.231 -0.004 0.238 -0.009
(1.57) (-0.01) (1.59) (-0.03)
INTANGt 0.355** -0.338 0.359*** -0.354
(2.57) (-1.24) (2.58) (-1.31)
CAPINTt 0.128 0.341 0.132 0.337
(1.04) (1.24) (1.06) (1.21)
MKTBKt 0.003 0.010 0.003 0.010
(0.60) (1.20) (0.63) (1.21)
RNDt 1.001 4.979* 1.387 4.995*
(0.93) (1.95) (1.17) (1.93)
Intercept 1.038*** 2.457*** 1.024*** 2.439**
(3.07) (2.61) (2.99) (2.57)
Industry FE Y N Y N
Firm FE N Y N Y
Year FE Y Y Y Y
Observations 1,640 1,640 1,640 1,640
R2 0.183 0.165 0.178 0.166
Adj. R2 0.171 0.157 0.165 0.158
eJournal of Tax Research The impact of full franking credit refundability on corporate tax avoidance
159
5. ROBUSTNESS TESTS
5.1 Control for dividend payout ratio
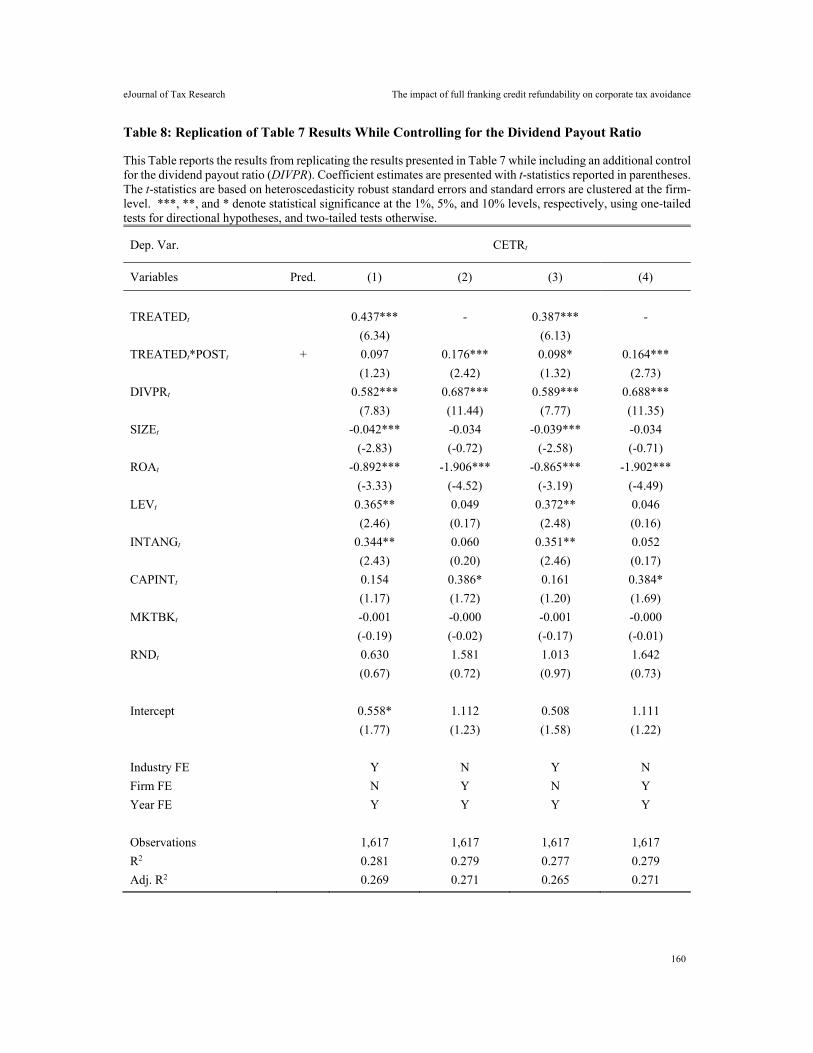
In the primary analysis of Hypothesis 4, we follow McClure et al. (2018) and do not control for the dividend payout ratio because any impact on tax avoidance associated with a pre-determined commitment by the Board of Directors to pay a certain level of dividends would be more appropriately described as a dividend effect rather than an imputation effect.31 Nevertheless, to alleviate any concerns, we follow Amiram et al. (2019) and include an additional control variable (DIVPR) to control for the dividend payout ratio and re-estimate the models in Table 7.32 The results are presented in Table 8 and the direction of the coefficients on TREATED*POST remain in line with our prediction and are significant in three of the four models. Overall, the results do not alter our inferences from the main findings.
5.2 Inclusion of firm-years with negative pre-tax income
In the main analysis, firm-year observations with negative pre-tax income are excluded. However, because accounting losses do not necessarily translate to tax losses,33 these firm-year observations are included and all models re-estimated.34 Untabulated results are similar to those in the main findings although the magnitude and statistical significance increases for the coefficients on the variable of interest in Tables 6 and 7. For example, the coefficient on TREATED*POST corresponding to Model (1) in Table 6 increases to 0.065, which is mildly significant at the 10% level (t-stat = 1.27). The coefficient on TREATED*POST relating to Models (1) and (2) in Table 7, increases to 0.168 (t-stat = 2.34) and 0.309 (t-stat = 3.55), respectively. The results do not alter our inferences but do suggest the impact of dividend imputation may be magnified when analysing all firms, be they profitable or loss making.
31 Furthermore, in many cases, firms set their dividend payout ratio in advance as part of their capital management policy and in many cases the payout ratio is stable over time. 32 DIVPR is calculated as dividends provided for or paid divided by pre-tax income. 33 Numerous adjustments for permanent and temporary differences are made to accounting net income to arrive at taxable income. 34 CETR is constrained to the [0,1] interval so any negative values of cash taxes paid or pre-tax income result in the value of CETR being 0.
eJournal of Tax Research The impact of full franking credit refundability on corporate tax avoidance
160
Table 8: Replication of Table 7 Results While Controlling for the Dividend Payout Ratio
This Table reports the results from replicating the results presented in Table 7 while including an additional control for the dividend payout ratio (DIVPR). Coefficient estimates are presented with t-statistics reported in parentheses. The t-statistics are based on heteroscedasticity robust standard errors and standard errors are clustered at the firm-level. ***, **, and * denote statistical significance at the 1%, 5%, and 10% levels, respectively, using one-tailed tests for directional hypotheses, and two-tailed tests otherwise.
Dep. Var. CETRt
Variables Pred. (1) (2) (3) (4)
TREATEDt 0.437*** - 0.387*** -
(6.34) (6.13)
TREATEDt*POSTt + 0.097 0.176*** 0.098* 0.164***
(1.23) (2.42) (1.32) (2.73)
DIVPRt 0.582*** 0.687*** 0.589*** 0.688***
(7.83) (11.44) (7.77) (11.35)
SIZEt -0.042*** -0.034 -0.039*** -0.034
(-2.83) (-0.72) (-2.58) (-0.71)
ROAt -0.892*** -1.906*** -0.865*** -1.902***
(-3.33) (-4.52) (-3.19) (-4.49)
LEVt 0.365** 0.049 0.372** 0.046
(2.46) (0.17) (2.48) (0.16)
INTANGt 0.344** 0.060 0.351** 0.052
(2.43) (0.20) (2.46) (0.17)
CAPINTt 0.154 0.386* 0.161 0.384*
(1.17) (1.72) (1.20) (1.69)
MKTBKt -0.001 -0.000 -0.001 -0.000
(-0.19) (-0.02) (-0.17) (-0.01)
RNDt 0.630 1.581 1.013 1.642
(0.67) (0.72) (0.97) (0.73)
Intercept 0.558* 1.112 0.508 1.111
(1.77) (1.23) (1.58) (1.22)
Industry FE Y N Y N
Firm FE N Y N Y
Year FE Y Y Y Y
Observations 1,617 1,617 1,617 1,617
R2 0.281 0.279 0.277 0.279
Adj. R2 0.269 0.271 0.265 0.271
eJournal of Tax Research The impact of full franking credit refundability on corporate tax avoidance
161
5.3 Alternative proxy for tax avoidance
Given the challenge in measuring tax avoidance precisely and because each measure has its own limitations (Blouin, 2014), an additional proxy is employed. Since the denominator in CETR is pre-tax net income, low CETRs may be driven by upwards earnings management. Moreover, if tax-avoiding firms simultaneously report lower accounting earnings and lower taxable income (i.e., conforming tax avoidance), then any change in CETR may be mechanical and inadvertently capturing a denominator effect only (Hanlon & Heitzman, 2010). Consequently, the second measure (CETR_M) modifies CETR by substituting net cash flows from operating activities for pre-tax net income in the denominator (Dyreng et al., 2008). The results are qualitatively similar to those in the primary analysis. For example, the coefficient on TREATED*POST corresponding to Models (1) and (3) in Table 5 are 0.173 (t-stat = 1.68) and 0.174 (t-stat = 1.76), respectively, and corresponding to Models (2) and (4) in Table 7 are 0.131 (t-stat = 2.24) and 0.112 (t-stat = 2.11), respectively.
5.4 Reduced sample period (1998-2003)
There may be concerns regarding the length of the time window used in the analysis, i.e., 8-year time period of 1997-2004. Therefore, the sample period is restricted to three years either side of the change i.e., 1998-2003 to allay concerns that the results are driven by confounding factors. Similar coefficients are found on the variable of interest relative to those in the primary analysis demonstrating that the results are not being unduly influenced by noise around the date of change (untabulated).
5.5 Exclusion of financial and insurance firms
Some studies of tax avoidance exclude financial and insurance firms from their samples (e.g., Richardson & Taylor, 2015; McClure et al., 2018).35 These firms are excluded because of special regulatory constraints imposed on them that potentially affect their tax avoidance activities coupled with differences in their application of accounting policies and derivation of accounting estimates compared to firms in other industries. In this setting, financial and insurance firms constitute less than 10% of the sample. Therefore, firms with GICS sector code 40 are dropped and all analyses re-run. The results (untabulated) mirror those in the primary analysis alleviating any concerns.
5.6 Alternative proxy for POST
While the majority of the sample (340 firms or 70.5%) have a 30 June fiscal year-end, some do not, meaning their 2000 financial year will include a mix of pre-1 July 2000 and post-1 July 2000 data.36 To account for this timing issue and the possibility that some firms alter tax avoidance behaviour in anticipation of the impending change in legislation, the POST variable is modified to take the value of 1 for financial years ending after the 1999 financial year, and 0 otherwise (denoted POST_1999). Notably, the possibility of tax reform was announced by the Commonwealth Treasurer in August 1998, while the implementation of the reform was announced in a media release dated
35 Other studies retain financial and insurance firms (e.g., Ikin & Tran, 2013; Dyreng et al., 2016). 36 The year to which Datastream assigns financial data is the year in which the company’s fiscal year ended, e.g., fiscal years ending 31 January 2000 (1 firm), 28 February 2000 (3 firms), 31 March 2000 (10 firms), 30 April 2000 (3 firms), 31 May 2000 (1 firm), 31 July 2000 (12 firms), 31 August 2000 (3 firms) 30 September 2000 (17 firms), and 31 December 2000 (92 firms), are all treated as 2000 in Datastream.
eJournal of Tax Research The impact of full franking credit refundability on corporate tax avoidance
162
21 September 1999 (Australian Treasury, 1998, p. 17; Costello, 1999). In untabulated results, the coefficients on TREATED*POST corresponding to Tables 5 and 6 are similar to the main results but the statistical significance of the coefficients reduces. In relation to Table 7, the coefficient on TREATED*POST relating to Models (1) and (3) are statistically insignificant though the same coefficients corresponding to Models (2) and (4) are significant; however the magnitude of the coefficient decreases from 0.269 to 0.220 (Model 2) and from 0.261 to 0.197 (Model 4). These results suggest there may have been a change in tax avoidance behaviour prior to 1 July 2000 but the main effect takes place post 1 July 2000.
6. CONCLUSION
Corporate tax avoidance is a major concern for governments, exacerbated in recent years by the global financial crisis and its aftermath. This article exploits an exogenous shock to Australia’s full dividend imputation system which enhanced the value of franking credits for tax-advantaged resident shareholders. This identification strategy arguably allows for cleaner identification of the relation between dividend imputation and tax avoidance. Overall, evidence is found to suggest that the rule change altered the incentives of management to engage in tax avoidance. Specifically, using a difference-in-differences research design and several treatment and control group combinations, an increase in cash ETRs is found for domestic dividend-paying firms relative to both foreign firms and non-dividend-paying domestic firms. In line with expectations, this finding is even more pronounced for firms paying fully franked dividends and the decreases in tax avoidance are economically significant. The findings are consistent with the notion that tax avoidance decreased for domestic firms who can take advantage of the rule change for the benefits of shareholders.
This study can inform ongoing policy debates in Australia. Recent tax reform reports have recommended the abolition of dividend imputation and the introduction of an Allowance for Corporate Equity and/or cash flow tax. Furthermore, the current debate centres on the potential removal of full franking credit refundability based on revenue unsustainability. However, the evidence provided in this study highlights the benefits of maintaining full franking credit refundability due to the incentives it provides to Australian dividend-paying firms to minimise tax avoidance activity. Hence, the results speak to the potential of the current full dividend imputation system to help protect corporate tax system integrity.
7. REFERENCES
Ainsworth, A 2016, ‘Dividend imputation: The international experience’, JASSA: The Finsia Journal of Applied Finance, vol. 2016, no. 1, pp. 58-63.
Ainsworth, A, Partington, G & Warren, G 2015, ‘Do franking credits matter? Exploring the financial implications of dividend imputation’, working paper no. 058/2015, Centre for International Finance and Regulation.
Allen, A, Francis, B B, Wu, Q & Zhao, Y 2016, ‘Analyst coverage and corporate tax aggressiveness’, Journal of Banking and Finance, vol. 73, pp. 84-98.
Amiram, D, Bauer, A M & Frank, M M 2019, ‘Tax avoidance at public corporations driven by shareholder taxes: Evidence from changes in dividend tax policy’, The Accounting Review, vol. 94, no. 5, pp. 27-55.
eJournal of Tax Research The impact of full franking credit refundability on corporate tax avoidance
163
Armstrong, C S, Blouin, J L, Jagolinzer, A D & Larcker, D F 2015, ‘Corporate governance, incentives, and tax avoidance’, Journal of Accounting and Economics, vol. 60, no. 1, pp. 1-17.
Armstrong, C S, Blouin, J L & Larcker, D F 2012, ‘The incentives for tax planning’, Journal of Accounting and Economics, vol. 53, nos. 1-2, pp. 391-411.
Australian Parliament, House of Representatives Standing Committee on Economics 2019, Report on the inquiry into the implications of removing refundable franking credits, Canberra, April. Available at: https://www.aph.gov.au/Parliamentary_Business/Committees/House/Economics/FrankingCredits/Report.
Australian Prudential Regulation Authority (APRA) 2015, Statistics: Annual superannuation bulletin (June 2013). Available at: http://www.apra.gov.au/Super/Publications/Documents/Revised%202013%20Annual%20Superannuation%20Bulletin%2005-02-14.pdf.
Australian Stock Exchange (ASX) 2015, ‘Historical market statistics’. Available at: http://www.asx.com.au/about/historical-market-statistics.htm#End_of_month_values.
Australian Taxation Office (ATO) 2015, ‘Self-managed super fund statistical report – June 2013’. Available at: https://www.ato.gov.au/about-ato/research-and-statistics/in-detail/super-statistics/smsf/self-managed-super-fund-statistical-report---June-2013/ (accessed 7 February 2020).
Australian Treasury (circulated by Hon P Costello, Treasurer) 1998, Tax reform: not a new tax, a new tax system, the Howard government’s plan for a new tax system, August.
Australian Treasury 2014, Mid-Year Economic and Fiscal Outlook (MYEFO) 2013-14, December. Available at: https://archive.budget.gov.au/2013-14/myefo/2013_14_MYEFO.pdf (accessed 7 February 2020).
Australian Treasury 2015, Re:think: Better tax system, better Australia, discussion paper.
Australia’s Future Tax System Review Panel (Dr K Henry, chair) 2009, Australia’s future tax system: Report to the Treasurer, December (Henry Review).
Balachandran, B, Khan, A, Mather, P & Theobald, M 2019, ‘Insider ownership and dividend policy in an imputation tax environment’, Journal of Corporate Finance, vol. 54, pp. 153-167.
Balakrishnan, K, Blouin, J L & Guay, W R 2019, ‘Tax aggressiveness and corporate transparency’, The Accounting Review, vol. 94, no. 1, pp. 45-69.
Beggs, D J & Skeels, C L 2006, ‘Market arbitrage of cash dividends and franking credits’, Economic Record, vol. 82, no. 258, pp. 239-252.
Bellamy, D E 1994, ‘Evidence of imputation clienteles in the Australian equity market’, Asia Pacific Journal of Management, vol. 11, no. 2, pp. 275-287.
Blouin, J 2014, ‘Defining and measuring tax planning aggressiveness’, National Tax Journal, vol. 67, no. 4, pp. 875-900.
Chen, S, Chen, X, Cheng, Q & Shevlin, T 2010, ‘Are family firms more aggressive than non-family firms?’, Journal of Financial Economics, vol. 95, no. 1, pp. 41-61.
eJournal of Tax Research The impact of full franking credit refundability on corporate tax avoidance
164
Chyz, J, Leung, W, Li, O & Rui, O 2013, ‘Labor unions and tax aggressiveness’, Journal of Financial Economics, vol. 108, no. 3, pp. 675-698.
Costello, Hon P (Treasurer) 1999, ‘The new business tax system’, press release 58, 21 September. Available at: https://www.petercostello.com.au/press/1999/2176-the-new-business-tax-system (accessed 8 February 2020).
Cummings, J & Frino, A 2008, ‘Tax effects on the pricing of Australian stock index futures’, Australian Journal of Management, vol. 33, no. 2, pp. 391-406.
Desai, M A & Dharmapala, D 2006, ‘Corporate tax avoidance and high-powered incentives’, Journal of Financial Economics, vol. 79, no. 1, pp. 145-179.
Desai, M & Jin, L 2011, ‘Institutional tax clienteles and pay-out policy’, Journal of Financial Economics, vol. 100, no. 1, pp. 68-84.
Dhaliwal, D, Gleason, C & Mills, L 2004, ‘Last-chance earnings management: Using the tax expense to meet analysts’ forecasts’, Contemporary Accounting Research, vol. 21, no. 2, pp. 431-459.
Dyreng, S D, Hanlon, M & Maydew, E L 2008, ‘Long-run corporate tax avoidance’, The Accounting Review, vol. 83, no. 1, pp. 61-82.
Dyreng, S D, Hanlon, M, Maydew, E L & Thornock, J R 2017, ‘Changes in corporate effective tax rates over the past 25 years’, Journal of Financial Economics, vol. 124, no. 3, pp. 441-463.
Dyreng, S D, Hoopes, J L & Wilde, J H 2016, ‘Public pressure and corporate tax behavior’, Journal of Accounting Research, vol. 54, no. 1, pp. 147-186.
Graham, J R, Raedy, J S & Shackelford, D A 2012, ‘Research in accounting for income taxes’, Journal of Accounting and Economics, vol. 53, nos. 1-2, pp. 412-434.
Graham, J R & Tucker, A 2006, ‘Tax shelters and corporate debt policy,Journal of Financial Economics, vol. 81, no. 3, pp 563-594.
Grinstein, G & Michaely, R 2005, ‘Institutional holdings and payout policy’, Journal of Finance, vol. 60, no. 3, pp. 1389-1426.
Guenther, D, Matsunaga, S & Williams, B 2017, ‘Is tax avoidance related to firm risk?’, The Accounting Review, vol. 92, no. 1, pp. 115-136.
Gupta, S & Newberry, K 1997, ‘Determinants of the variability in corporate effective tax rates: Evidence from longitudinal data’, Journal of Accounting and Public Policy, vol. 16, no. 1, pp. 1-34.
Handley, J C & Maheswaran, K 2008, ‘A measure of the efficacy of the Australian imputation tax system’, The Economic Record, vol. 84, no. 264, pp. 82-94.
Hanlon, M & Heitzman, S 2010, ‘A review of tax research’, Journal of Accounting and Economics, vol. 50, nos. 2-3, pp. 127-178.
Hanlon, M & Hoopes, J L 2014, ‘What do firms do when dividend tax rates change? An examination of alternative payout responses’, Journal of Financial Economics, vol. 114, no. 1, pp. 105-124.
Henderson, A 2016, ‘Malcolm Turnbull says tax announcements “likely” before May budget’, ABC News online, 5 February. Available at: https://www.abc.net.au/news/2016-02-05/malcolm-turnbull-lays-out-tax-timetable/7142736 (accessed 8 February 2020).
eJournal of Tax Research The impact of full franking credit refundability on corporate tax avoidance
165
Ikin, C & Tran, A 2013, ‘Corporate tax strategy in the Australian dividend imputation system’, Australian Tax Forum, vol. 28, no. 3, pp. 523-553.
Jun, A, Gallagher, D R & Partington, G H 2011, ‘Institutional dividend clienteles under an imputation tax system’, Journal of Business Finance and Accounting, vol. 38, nos. 1-2, pp. 198-224.
Lennox, C, Lisowsky, P & Pittman, J 2013, ‘Tax aggressiveness and accounting fraud’, Journal of Accounting Research, vol. 51, no. 4, pp. 739-778.
Li, X & Tran, A 2019, ‘The Australian dividend imputation system and corporate tax avoidance’, Australian Tax Forum, vol. 34, no. 2, pp. 357-399.
Mackenzie, G & McKerchar, M 2014, ‘Tax-aware investment management by public offer superannuation funds in Australia: Attitudes, practices and expectations’, Australian Tax Forum, vol. 29, no. 2, pp. 249-279.
McClure, R, Lanis, R, Wells, P & Govendir, B 2018, ‘The impact of dividend imputation on corporate tax avoidance: The case of shareholder value’, Journal of Corporate Finance, vol. 48, pp. 492-514.
Mills, L F 1998, ‘Book-tax differences and Internal Revenue Service adjustments’, Journal of Accounting Research, vol. 36, no. 2, pp. 343-356.
Mills, L F, Erickson, M & Maydew, E 1998, ‘Investments in tax planning’, Journal of the American Taxation Association, vol. 20, no. 1, pp. 1-20.
Organisation for Economic Co-operation and Development (OECD) 2014a, ‘Revenue Statistics – Comparative Tables’. Available at: http://stats.oecd.org/index.aspx?DataSetCode=REV.
Organisation for Economic Co-operation and Development (OECD) 2014b, ‘Table II.4 - Overall statutory tax rates on dividend income’. Available at: www.oecd.org/ctp/tax-policy/tax-database.htm#C_CorporateCapital.
Pattenden, K & Twite, G 2008, ‘Taxes and dividend policy under alternative tax regimes’, Journal of Corporate Finance, vol. 14, no. 1, pp. 1-16.
Petersen, M A 2009, ‘Estimating standard errors in finance panel data sets: Comparing approaches’, Review of Financial Studies, vol. 22, no. 1, pp. 435-480.
Plesko, G A 2003, ‘An evaluation of alternative measures of corporate tax rates’, Journal of Accounting and Economics, vol. 35, no. 2, pp. 201-226.
Richardson, G & Taylor, G 2015, ‘Income shifting incentives and tax haven utilization: Evidence from multinational US firms’, The International Journal of Accounting, vol. 50, no. 4, pp. 458-485.
Roberts, M R & Whited, T M 2013, ‘Chapter 7 – Endogeneity in empirical corporate finance’, Handbook of the Economics of Finance, vol. 2, pt. A, pp. 493-572.
Taylor, G & Richardson, G 2012, ‘International corporate tax avoidance practices: Evidence from Australian firms’, The International Journal of Accounting, vol. 47, no. 4, pp. 469-496.
Taylor, G & Richardson, G 2014, ‘Incentives for corporate tax planning and reporting: Empirical evidence from Australia’, Journal of Contemporary Accounting and Economics, vol. 10, no. 1, pp. 1-15.

eJournal of Tax Research The impact of full franking credit refundability on corporate tax avoidance
166
Tax Justice Network and United Voice 2014, Who pays for our common wealth? Tax practices of the ASX 200. Available at: http://taxjustice.org.au/reports.
White, A 1980, ‘A heteroskedasticity-consistent covariance matrix estimator and a direct test for heteroskedasticity’, Econometrica, vol. 48, no. 4, pp. 817-838.
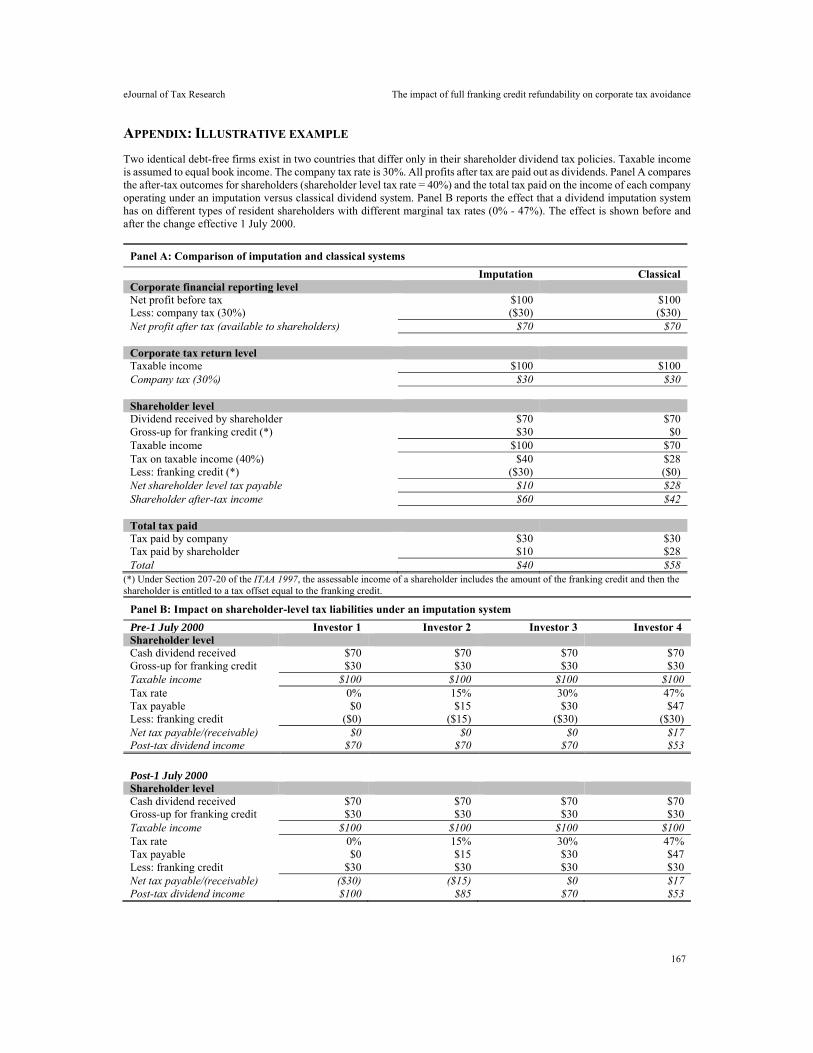
eJournal of Tax Research The impact of full franking credit refundability on corporate tax avoidance
167
APPENDIX: ILLUSTRATIVE EXAMPLE
Two identical debt-free firms exist in two countries that differ only in their shareholder dividend tax policies. Taxable income is assumed to equal book income. The company tax rate is 30%. All profits after tax are paid out as dividends. Panel A compares the after-tax outcomes for shareholders (shareholder level tax rate = 40%) and the total tax paid on the income of each company operating under an imputation versus classical dividend system. Panel B reports the effect that a dividend imputation system has on different types of resident shareholders with different marginal tax rates (0% - 47%). The effect is shown before and after the change effective 1 July 2000.
Panel A: Comparison of imputation and classical systems
Imputation Classical Corporate financial reporting level Net profit before tax $100 $100 Less: company tax (30%) ($30) ($30) Net profit after tax (available to shareholders) $70 $70 Corporate tax return level Taxable income $100 $100 Company tax (30%) $30 $30 Shareholder level Dividend received by shareholder $70 $70 Gross-up for franking credit (*) $30 $0 Taxable income $100 $70 Tax on taxable income (40%) $40 $28 Less: franking credit (*) ($30) ($0) Net shareholder level tax payable $10 $28 Shareholder after-tax income $60 $42 Total tax paid Tax paid by company $30 $30 Tax paid by shareholder $10 $28 Total $40 $58
(*) Under Section 207-20 of the ITAA 1997, the assessable income of a shareholder includes the amount of the franking credit and then the shareholder is entitled to a tax offset equal to the franking credit.
Panel B: Impact on shareholder-level tax liabilities under an imputation system
Pre-1 July 2000 Investor 1 Investor 2 Investor 3 Investor 4 Shareholder level Cash dividend received $70 $70 $70 $70 Gross-up for franking credit $30 $30 $30 $30 Taxable income $100 $100 $100 $100 Tax rate 0% 15% 30% 47% Tax payable $0 $15 $30 $47 Less: franking credit ($0) ($15) ($30) ($30) Net tax payable/(receivable) $0 $0 $0 $17 Post-tax dividend income $70 $70 $70 $53
Post-1 July 2000
Shareholder level Cash dividend received $70 $70 $70 $70 Gross-up for franking credit $30 $30 $30 $30 Taxable income $100 $100 $100 $100 Tax rate 0% 15% 30% 47% Tax payable $0 $15 $30 $47 Less: franking credit $30 $30 $30 $30 Net tax payable/(receivable) ($30) ($15) $0 $17 Post-tax dividend income $100 $85 $70 $53
eJournal of Tax Research (2020) vol. 17, no. 2, pp. 168-192
168
A toss of a (bit)coin: the uncertain nature of the legal status of cryptocurrencies
Julie Cassidy, Man Hung Alvin Cheng, Toan Le and Eva Huang
Abstract
Regulating cryptocurrency is a difficult task for regulators. At present, there is no clear and authoritative definition of cryptocurrency, making it difficult for regulators to determine which aspects require regulation and, if so, how to control and monitor activities. Defining the legal nature of cryptocurrencies is important. At its most fundamental level the answer to these matters will determine the regulatory framework within which trading in cryptocurrencies may or may not occur. The government may simply prohibit trading in cryptocurrencies, even making such transactions illegal. Alternatively, trading may not only be legal, but facilitated by government concessions. A government may recognise cryptocurrencies as ‘currency’. It may be determined that transactions involving cryptocurrencies merely involve the sale of property, possibly akin to a financial product. This article discusses the different approaches to regulating cryptocurrency and the taxation implications in four Asian countries which account for a large proportion of cryptocurrency transactions.
Key words: cryptocurrency, taxation, blockchain technology, fintech regulation, digital economy
Professor, Commercial Law Department, University of Auckland. Lecturer, Department of Finance and Accounting, University of Nottingham. Lecturer, Department of Business Law and Taxation, Monash Business School, Monash University. Lecturer, University of Sydney Business School; Research Affiliate, Cambridge Centre for Alternative Finance, the University of Cambridge Judge Business School.
eJournal of Tax Research The uncertain nature of the legal status of cryptocurrencies
169
1. INTRODUCTION
Fintech is becoming mainstream in facilitating transactions. Blockchain technology, from its humble beginning as a decentralised encrypted form of record keeping, has moved to the mainstream. The advent of cryptocurrencies as a result of blockchain technology is a more novel Fintech development. Based on similar technology, hundreds of cryptocurrencies are being created and traded. Bitcoins are by far the most popular cryptocurrency, but many others exist.1 The popular ‘coins’ fluctuate dramatically in ‘prices’, where realised and unrealised gains are being made by coin-holders.2
The economic substance of cryptocurrencies gives them value, but to date the law has not conclusively defined this substance. The difficulty is that the transfer of value between the parties involves the transfer of a unique digital file that in itself has no intrinsic value.3 Thus regulating cryptocurrency is a difficult task for regulators across the globe. At present, there is no clear and authoritative definition of cryptocurrency, making it difficult for regulators to determine which aspects (if any) require regulation and, if so, how to control and monitor activities. This difficulty exists at two levels: initial coin offerings (ICOs) that brought the cryptocurrency into existence and trading in the cryptocurrencies themselves.
Defining the legal nature of cryptocurrencies and in turn ascertaining what gives them value is important for many reasons that must be addressed by each nation worldwide. At its most fundamental level the answer to these matters will determine the regulatory framework within which ICOs and trading in cryptocurrencies may or may not occur. A government may simply prohibit the issuing of ICOs and/or prohibit trading in cryptocurrencies. As discussed below, at one extreme China and Vietnam have chosen to make such transactions illegal. South Korea sits in the middle, prohibiting ICOs, but allowing for trading within a regulatory framework. At the other end of the spectrum ICOs and trading may not only be legal, but also facilitated by government concessions.
1 As of October 2018, 2,076 cryptocurrencies were listed by Coin Market Cap. For further discussion of the role of Bitcoin as a cryptocurrency, see Evan Hewitt, “Bringing Continuity to Cryptocurrency: Commercial Law as a Guide to the Asset Categorization of Bitcoin” (2016) 39(2) Seattle University Law Review 619, 623. See further Garrick Hileman and Michel Rauchs, Global Cryptocurrency Benchmarking Study (Cambridge Centre for Alternative Finance, University of Cambridge, 2017); Esko Cate and Oliver Massmann, ‘Did the State Bank of Vietnam Just Turn its Back on the Future of Commerce?’ Duane Morris Vietnam blog (11 December 2017), https://blogs.duanemorris.com/vietnam/2017/12/11/vietnam-bitcoin-and-cryptocurrencies-did-the-state-bank-of-vietnam-just-turn-its-back-on-the-future-of-commerce (accessed 26 January 2020). 2 The value of Bitcoin increased by approximately 750 per cent between August 2016 and August 2017. As to the volatility of the cryptocurrency and the ‘bubble’ at times bursting, see Laura Davidson and Walter Block, “Bitcoin, the Regression Theorem, and the Emergence of New Medium of Exchange” (2015) 18(3) Quarterly Journal of Austrian Economics 311, 327; Adam Hartung, ‘A Bitcoin Is Worth $4,000 – Why You Probably Should Not Own One’, Forbes (15 August 2015), https://www.forbes.com/sites/adamhartung/2017/08/15/a-bitcoin-is-worth-4000-why-you-probably-should-not-own-one/#cccc4f63b082 (accessed 26 January 2020); Fitz Tepper, ‘The Reward for Mining Bitcoin Was Just Cut in Half’, Tech Crunch (10 July 2016), https://techcrunch.com/2016/07/09/the-reward-for-mining-bitcoin-was-just-cut-in-half/ (accessed 26 January 2020); Jeff John Roberts, ‘5 Big Bitcoin Crashes: What We Learned”, Fortune (19 September 2017), https://fortune.com/2017/09/18/bitcoin-crash-history/ (accessed 26 January 2020). 3 Ghassan Karame, Elli Androulaki and Srdjan Capkun, ‘Two Bitcoins at the Price of One? Double-Spending Attacks on Fast Payments in Bitcoin’ (Proceedings of the Conference on Computer Security, 2012), http://citeseerx.ist.psu.edu/viewdoc/summary?doi=10.1.1.400.6276.
eJournal of Tax Research The uncertain nature of the legal status of cryptocurrencies
170
The most important of these concessions is recognising cryptocurrencies as ‘a legal method of payment’, as in Japan,4 or a form of ‘digital currency’.5 It may be accorded the same status as foreign currency or, in extreme cases, equivalent with currency issued by the local sovereign state.6 To this end it is crucial from the outset to understand that that the term ‘cryptocurrency’ is in itself a misnomer. Whether it is to obtain the status of ‘currency’ will be determined by the government of the relevant jurisdiction.
If the government decides it is not ‘currency’, how will it be characterised? The government may, as in the case of Vietnam, determine that transactions involving cryptocurrencies merely involve the sale of property.7 Sales of cryptocurrencies have been suggested to be akin to the sale of shares or futures. In some cases the parallel that is drawn is oil8 or gold bullion.9 A further related issue is whether that characterisation will be embraced for all purposes, such as in Vietnam,10 or whether a government will be ‘schizophrenic’ and pick and choose which characterisation it will utilise for different purposes.11
The above characterisation of cryptocurrencies has in turn significant ramifications to both the regulatory framework and taxation regime. As to the former, as already addressed above, at the macro level the government will need to decide whether ICOs and trading are allowed. If ICOs and trading are allowed then it must be determined if current laws will be applied or a new legal framework will be developed for cryptocurrency exchanges/business.12 If the former, do existing consumer protection
4 Garrett Keirns, ‘Japan’s Bitcoin Law Goes into Effect Tomorrow’, Coindesk (31 March 2017), https://www.coindesk.com/japan-bitcoin-law-effect-tomorrow (accessed 26 January 2020). 5 This approach has also been adopted in Australia in regard to its goods and services tax. A new definition of digital currency was recently included in s 9-10(4) of the A New Tax System (Goods and Services Tax) Act 1999, effective from 1 July 2017. See further Julie Cassidy and Alvin Cheng, ‘A Toss of a (Bit)coin: The Uncertain Nature of the Legal Status of Cryptocurrencies’ (10th Queensland Tax Researchers Symposium, University of Queensland, 3 July 2019), https://law.uq.edu.au/files/47324/Cassidy_Bitcoin_Theme_1.pdf. 6 If China’s proposal to issue its own digital currency, discussed below, eventuates, it is assumed it will act as a digital form of the renminbi (RMB). At the time of writing, the Chinese government has not yet decided on the technology to build this digital currency. 7 Cate and Massmann, above n 1. This approach has also been adopted in New Zealand. See Inland Revenue Department, ‘Questions & Answers: Cryptocurrencies and Tax” (April 2018) [4], https://www.classic.ird.govt.nz/income-tax-individual/cryptocurrency-qa.html (accessed 26 January 2020); Inland Revenue Department, Income Tax – Salary and Wages Paid in Crypto-Assets, Public Ruling BR Pub 19/01 (27 June 2019), https://www.classic.ird.govt.nz/technical-tax/public-rulings/2019/public-ruling-1901.html. 8 Cate and Massmann, above n 1. 9 The parallel to the sale of gold bullion, as adopted in New Zealand’s fiscal authority, the Inland Revenue Department, is important as it dictates that the cryptocurrency was bought for resale at a profit, not an income stream, such as dividends: Inland Revenue Department, ‘Questions & Answers: Cryptocurrencies and Tax’ (April 2018) [4]. 10 This approach has also been adopted in New Zealand where cryptocurrencies are treated as a commodity for all purposes, whether that be, for example, income tax, goods and services tax and securities legislation. See Inland Revenue Department, ‘Questions & Answers: Cryptocurrencies and Tax’ (April 2018) [4].; Inland Revenue Department, Income Tax – Salary and Wages Paid in Crypto-Assets, BR Pub 19/01 (27 June 2019). See further Cassidy and Cheng, above n 5. 11 This approach has also been adopted in Australia where cryptocurrencies are treated as a commodity for the purposes of income tax (specifically capital gains tax) and currency for goods and services tax. See Cassidy and Cheng, above n 5. 12 For example, in June 2015 the New York State Department of Financial Services introduced a new regulatory regime to control the conduct of businesses using cryptocurrencies, known as ‘virtual currencies’; trading is regulated through the mandatory requirement to obtain a ‘BitLicense’. See
eJournal of Tax Research The uncertain nature of the legal status of cryptocurrencies
171
laws apply to both ICOs and trading? Are they a financial product subject to the control of relevant government securities regulators?13 Will existing money laundering rules apply in this context?14 A thread in the discussion below is governmental concerns for the use of cryptocurrencies in money laundering and their use in financing drugs, slavery and terrorist activities through sites such as the Silk Road, a virtual black market operating on the Deep Web.15
The above characterisation of cryptocurrencies has, in turn, significant ramifications to the tax treatment of gains and losses from such transactions. As property, not only will transactions made in the course of business be subject to tax as ordinary/business income, but non-business trading may also be subject to income/capital gains tax. The umbrella of transactions caught under the latter approach may include sales when the cryptocurrency was purchased within a business with the specific purpose of resale at a profit and mere ad hoc dabbling in such trading with a hope of a profit. Even in this context, the category of property into which cryptocurrencies are placed will be important. Are they a form of tangible or intangible property?16 As discussed above, are they a financial product? In the tax context, financial products are traditionally either exempt or ‘zero rated’ in terms of value added taxes (VAT)/goods and services taxes (GST). If the cryptocurrency is akin to currency it will not only be exempt from
Department of State, New York, Title 23 Financial Services, Part 200 Virtual Currencies (New York Codes, Rules and Regulations, 2015), https://govt.westlaw.com/nycrr/Browse/Home/NewYork/NewYorkCodesRulesandRegulations?guid=I7444ce80169611e594630000845b8d3e&originationContext=documenttoc&transitionType=Default&contextData=(sc.Default). 13 In New Zealand the securities regulatory authority, the Financial Markets Authority, has taken a strong stance on this matter and asserted that, no matter their configuration, cryptocurrencies are financial products that are regulated under its regime. See Financial Markets Authority, ‘Commentary on ICOs and Cryptocurrencies’, Media Release MR No. 2017-46 (25 October 2017), https://www.fma.govt.nz/news-and-resources/media-releases/fma-commentary-on-icos-and-cryptocurrencies/ (accessed 26 January 2020). By contrast, the position in Australia is uncertain. The Australian regulatory authority, the Australian Securities and Investments Commission (ASIC), when considering the relevant misleading and deceptive conduct provisions, at one stage determined that the offering of cryptocurrency was not the offering of a financial product: see https://www.aph.gov.au/DocumentStore.ashx?id=4b6d105f-3e0a-4d52-aaab-1f35842ed5f1&subId=302297 (accessed 4 February 2020). However, more recently ASIC has suggested that cryptocurrency might be a financial product, in which case it would fall within its regulatory parameters: ASIC, ‘Initial Coin Offerings and Cryptocurrency’ (30 May 2019), https://asic.gov.au/regulatory-resources/digital-transformation/initial-coin-offerings-and-crypto-assets/ (accessed 26 January 2020). See further Cassidy and Cheng, above n 5. See also Paul Latimer and Michael Duffy, ‘Deconstructing Digital Currency and its Risks: Why ASIC Must Rise to the Regulatory Challenge’ (2019) 47(1) Federal Law Review 121. 14 Australia recently amended its Anti-Money Laundering and Counter-Terrorism Financing Act 2006 (Cth) by including ‘digital exchange services’ within the scope of the anti-money laundering rules: Anti-Money Laundering and Counter-Terrorism Financing Amendment Act 2017 (Cth). 15 There is a wealth of literature on the Silk Road and its interrelationship with cryptocurrencies, in particular Bitcoin. Selected references include Aaron Lindquist, ‘Funny Money: Why Bitcoin Does Not Warrant Increased Government Regulation’ (2014) 1(1) Journal of Global Justice and Public Policy 79; Carmine DiPiero, ‘Deciphering Cryptocurrency: Shining a Light on the Deep Dark Web’ [2017] 3 University of Illinois Law Review 1267. 16 Cryptocurrencies have no physical form. Their foundation lies in the data strings that represent the coin: Corin Faife, ‘Bitcoin Hash Functions Explained’, Coindesk (19 February 2017), https://www.coindesk.com/bitcoin-hash-functions-explained (accessed 27 January 2020). As discussed below, Vietnam has formally recognised that trading in cryptocurrencies involves the trading of intangible assets: Tuoi Tre News, ‘Bitcoin Regulation Headaches Reemerge in Vietnam’, Tuoi Tre News (7 November 2017), https://tuoitrenews.vn/news/business/20171107/bitcoin-regulation-headaches-reemerge-in-vietnam/42501.html (accessed 27 January 2020).
eJournal of Tax Research The uncertain nature of the legal status of cryptocurrencies
172
VAT/GST but also exempt from taxes such as capital gains tax. As to which way a government might turn is anyone’s guess: a toss of a (bit)coin!
While it has been noted above that these matters are global issues which each nation needs to address, the current analysis is confined to four key Asian nations, namely China, Vietnam, South Korea and Japan. These nations have been specifically selected as they represent the extreme positions that have been taken in this context. They effectively provide the ‘book ends’; standards that other nations should utilise when determining how they stand on these issues. At one end of the spectrum, China has effectively banned trading in cryptocurrencies, particularly bitcoin. Vietnam has cautiously approached the issue, reflecting its infancy in the area of cryptocurrencies, by banning payment by cryptocurrencies.17 Payment by cryptocurrency is considered illegal.18 Nevertheless, the government has not totally banned cryptocurrency. It still recognises it as property, thus an asset that may be invested in and traded.19 Japan, by contrast, has taken the polaristic view that cryptocurrencies are ‘currency’ and sought to support and foster trading in them. South Korea had originally followed the lead of Japan, but recently has done a backflip in this regard. In a way the South Korean government has embraced a hybrid view. While no longer treating cryptocurrency as a ‘currency’, the government has asserted it will not ban trading in cryptocurrencies. It will, however, heavily regulate the market to prevent anonymous trades and trading by non-nationals.20
This article begins with a brief introduction to the technology underpinning cryptocurrencies. This is important to understanding the very nature of cryptocurrencies and how transactions occur. It then considers the legal position(s) in China, Vietnam, Japan and South Korea, exploring in particular the tax implications of cryptocurrencies in these jurisdictions. While the focus is on tax implications, this is obviously very much dependent upon each nation’s answers to the macro questions posed above.
2. A BRIEF TECHNICAL OUTLINE OF CRYPTOCURRENCIES
As noted in the introduction to this article, there is no clear and authoritative definition of cryptocurrency. The best way to understand cryptocurrency is to highlight its unique features. First, cryptocurrencies such as bitcoin are entirely digital. Cryptocurrencies have no physical form. As discussed below, their foundation lies in no more than the data strings that represent each ‘coin’.21 A 64-character long identifier represents each coin.22 The final coin is a ‘chain’ of data strings as each transaction is recorded, adding
17 Charlie Osborne, ‘Vietnam Bans Payments in Bitcoin and Other Cryptocurrencies’, Zdnet.com (30 October 2017), https://www.zdnet.com/article/vietnam-bans-payments-in-bitcoin-cryptocurrencies/ (accessed 27 January 2020). 18 Vietnam Law and Legal Forum, ‘Legality of Cryptocurrencies in Vietnam Remains Unclear, Vietnam Law and Legal Forum (28 February 2018), http://vietnamlawmagazine.vn/legality-of-cryptocurrencies-in-vietnam-remains-unclear-6170.html ((accessed 13 October 2019). 19 Tuoi Tre News, above n 16. 20 Financial Services Commission, Republic of Korea, ‘Financial Measures to Curb Speculation in Cryptocurrency Speculation’, Press Release (23 January 2018), https://www.iosco.org/library/ico-statements/Korea%20-%20FSC%20-%2020180123%20-%20Financial%20Measures%20to%20Curb%20Speculation%20in%20Cryptocurrency%20Trading.pdf (accessed 27 January 2020). 21 Faife, above n 16. 22 Andreas Antonopoulos, Mastering Bitcoin: Programming the Open Blockchain (O’Reilly Media Inc, 2017) 202.
eJournal of Tax Research The uncertain nature of the legal status of cryptocurrencies
173
a new link to the chain.23 By contrast, other forms of electronic representations of money that are part of a jurisdiction’s fiat currency supply may be involved in a digital environment, but they still have an underlying physical form, namely coins and notes.24 The issuing and availability of these notes and coins are guaranteed by law.
Slattery suggests that a cryptocurrency is ‘loosely defined as a decentralized system of exchange, or electronic money, which uses cryptography to provide the program’s security’.25 Thus a second feature of cryptocurrencies is the use of cryptography; hence the crypto prefix. Cryptocurrencies are ‘an electronic payment system based on cryptographic proof instead of trust, allowing any two willing parties to transact directly with each other without the need for a trusted third party’.26 Thus cryptocurrencies exist in a decentralised system without an intermediary party such as a bank. Each bitcoin is effectively the solution to a complex algorithm.27 The solution to the encryption is partially in a public key and partially in the owner’s private key.28 These keys are both required to confirm the validity and ownership of a bitcoin.29 In turn, a person must have the private key, like a pin code, to transfer a bitcoin. While the private key is needed as proof of ownership, a third feature of cryptocurrency is that ultimately the system is based on cryptographic proof alone which provides a system of, albeit recorded, anonymity.
Fourth, and arguably foremost, they are not issued by a sovereign nation, thereby having no connection to a government or State bank.30 Instead each cryptocurrency is contained in its own network. Each time a person interacts with a cryptocurrency, their computer joins that network to record the transaction. More correctly, the transaction is recorded in a public ledger that is continuously ‘talking’ to all the computers in the network. Computers in the network are constantly updating the information and sealing off the recorded parts of the digital ledger by encrypting the record using the above discussed complex mathematical algorithm.31 To incentivise the recording and sealing off of a block in the ledger, computers are rewarded with new currency, known as ‘native tokens’.32 In turn, the process of recording and sealing of blocks in the ledger is known as ‘mining’.33 The ledger is stored on every computer in the network rather than a central server.34
23 Thomas Slattery, ‘Taking a Bit Out of Crime: Bitcoin and Cross-Border Tax Evasion’ (2014) 39(2) Brooklyn Journal of International Law 829, 836. 24 Ibid 833. 25 Ibid 831. To this end some other terms commonly used may have the same meaning, including digital currency, virtual currency and digital token. There are some differences in their nature, but in the context of this article, they are grouped together as cryptocurrencies. 26 Satoshi Nakamoto, ‘Bitcoin: A Peer-to-Peer Electronic Cash System’ (research paper, 2008), https://bitcoin.org/en/bitcoin-paper. 27 Faife, above n 16. 28 John McGinnis and Kyle Roche, ‘Bitcoin: Order Without Law in the Digital Age’ (2019) 94(4) Indiana Law Journal 1497, 1520. 29 Adam Chodorow, ‘Bitcoin and the Definition of Foreign Currency’ (2016) 19(6) Florida Tax Review 365, 374. 30 Cate and Massman, above n 1. 31 Ibid. 32 Hileman and Rauchs, above n 1, 13. 33 Cate and Massmann, above n 1. 34 Ibid.
eJournal of Tax Research The uncertain nature of the legal status of cryptocurrencies
174
This sealing off process of new transactions in turn relies on the information contained in previously sealed off blocks in the ledger.35 Thus each block is a link which relies on earlier links. The linking of the blocks in this way provides the reason why the technology used by cryptocurrencies is known as ‘blockchain’.36
In each cryptocurrency’s blockchain system, there are different players. These players are cryptocurrency exchanges, who facilitate the ‘purchase, sale and trading of cryptocurrencies’, digital wallets that store cryptocurrencies, payment systems that facilitate payments using cryptocurrencies (where the cryptocurrencies are used to purchase goods and services) and the above discussed miners who secure the public ledger.37
Thus a fifth feature of cryptocurrencies is its foundation in blockchain. Definitions of what a blockchain is vary, but the general consensus is that it is a database or ledger of transactions which is distributed over a peer to peer network (such as the internet). It uses a variety of cryptographic techniques and validity rules to reach consensus between participants over changes to the shared database without needing to trust the integrity of any of the network participants.
There are many misconceptions about blockchain as a technology. These misconceptions include that blockchains are ‘trustless’, tamper-proof and 100 per cent secure. In regards to the notion of ‘trustless’ transactions, the misconception is that people transact without having to trust the party with whom they are transacting. This ‘trustless’ nature is guaranteed because every user of the blockchain keeps a record of the transaction and a consensus by the block is needed before the transaction goes through. This is true, but while there is no trusted third party (ie, a bank), a degree of trust will always be required in the underlying code and the cryptography applied in the algorithm.
With regard to the assertion that blockchain is tamper-proof, while transactions on the blockchain are more tamper resistant than mainstream transactions, transactions can be reversed if enough nodes on the network collude. Nodes are participants on the blockchain. Once more than 50 per cent of computational power on the blockchain collude, the blockchain can be tampered with. This is often described in the context of the ‘double spending problem’ as collusion could facilitate the bitcoin being traded/spent more than once.
With regard to being 100 per cent secure, while blockchains use cryptography, it is only as secure as how well the cryptographic ‘keys’ are managed. This factor is no different to centralised technologies; colluding actors can tamper with the records on the chain if they could solve the cryptography in the algorithm.
3. THE ROLE AND FUNCTIONS OF CRYPTOCURRENCIES ILLUSTRATED THROUGH MARKET
ACTIVITIES
The initial aim of cryptocurrencies such as the bitcoin was to function as a ‘single digitalized currency, regulated not by a central authority, but rather by the individual
35 Hileman and Rauchs, above n 1; Cate and Massmann, above n 1. 36 Cate and Massmann, above n 1. 37 Hileman and Rauchs, above n 1.
eJournal of Tax Research The uncertain nature of the legal status of cryptocurrencies
175
users who take part in the system’.38 While people have used cryptocurrencies to pay for goods and services, the survey of market activities and international regulatory schemes by the Cambridge Centre for Alternative Finance (CCAF) at the University of Cambridge Judge Business School acts as a proxy to illustrate the current role and functions of cryptocurrencies. As discussed below, the outcomes of this study indicate that cryptocurrencies do not yet play the role of currency or money in the digital economy.
Theoretically, economists address the function of money, and a lawyer’s definition of currency will be captured by the economists’ characterisation of money.39 For economists, money has three primary functions: a medium of exchange, a unit of account and a store of value.40 For lawyers, currency includes the paper money and coins printed or minted according to law – for example, the Regulation of the People's Republic of China on the Administration of Renminbi (2000) in China. This section illustrates the roles and functions of cryptocurrencies by comparison with the three primary economic functions of money.
One of the best-known textbooks on the economics of money is that written by Mishkin.41 Mishkin clearly defines the three primary functions, to the extent that money and payment systems42 are different ideas in economics.
Money as a medium of exchange is much broader than the functions of a payment system. As a medium of exchange, the value of the medium, that is, the commodity that plays the role of money, should be able to function independently for the purposes of exchanging a good or service. Mishkin identified five criteria for a commodity to function effectively as money:43
‘(1) it must be clearly standardized, making it simple to ascertain its value;
(2) It must be widely accepted;
(3) It must be divisible, so that it is easy to “make change”;
(4) It must be easy to carry; and
(5) It must not deteriorate quickly’.
Mishkin identifies the economic role of payment systems as ‘the method of conducting transactions in the economy’.44 The historical evolution of payment systems shows how money as a medium of exchange functions through payment systems to facilitate transactions. Money is the underlying substance and payment systems provide the medium of exchange. Over time this has shifted from the days of commodity money in the form of gold or shells to governments issuing fiat money that are ‘decreed by governments as legal tender (meaning that legally it must be accepted as payment for
38 Daniela Sonderegger, ‘A Regulatory and Economic Perplexity: Bitcoin Needs Just a Bit of Regulation’ (2015) 47 Washington University Journal of Law and Policy 175, 175-176. 39 Frederic S Mishkin, The Economics of Money, Banking and Financial Markets (Pearson and Renmin University Press, 9th ed, 2013) 49. 40 Ibid 50-52. 41 Ibid. 42 Ibid 50-52. 43 Ibid 50-51. 44 Ibid 52.
eJournal of Tax Research The uncertain nature of the legal status of cryptocurrencies
176
debts) but not convertible into coins or precious metal, and coins minted by governments according to law’,45 to cheques that document transfers of money between account holders, to electronic payment systems such as Paypal and Alipay, and e-money such as debit cards.
The next role money plays is as a unit of account, that ‘it is used to measure value in the economy’.46 This role allows goods and services to be priced in the economy, which is well beyond the role of a payment system.
The third role of money is as a store of value, that it is a ‘repository of purchasing power over time’,47 allowing purchasing power to be ‘saved from the time income is received until the time it is spent’. This additional function allows economic agents to delay exchange of goods and services until the purchase is necessary. Payment systems do not have this function. Cryptocurrencies cannot be used to measure value in the economy, because their own value is measured against the money, so they cannot act as a unit of account. Cryptocurrencies also do not store value to enable future purchasing power.
The cryptocurrency/cryptoasset ecosystem48 captures several market activities relating to the trading of different types of assets or the facilitation of such trading, or the payment system role they play. Recent reports published by CCAF have documented these market activities, the functions the assets played and how global regulators have attempted to regulate cryptoassets.49 As discussed below, Japan, being one of the jurisdictions that is friendly towards cryptocurrencies, provides clear guidance on the accepted functions of cryptocurrencies and the activities the jurisdiction accepts: that is, its role as a payment method50 and that trade is not prevented.
As noted above, key actors in the cryptocurrency/cryptoasset ecosystem are cryptocurrency wallet users and operators, exchanges and their clients, payment companies and their clients, and miners. Cryptocurrency wallet users and operators, exchanges, payment companies and miners are themselves on the blockchains, clients of exchanges and payment companies may not necessarily be on the blockchain.51 Market activities are interactions between these main actors, where the exchange of
45 Such as the Regulation of the People's Republic of China on the Administration of Renminbi (2000). 46 Mishkin, above n 39, 51. 47 Ibid 51. 48 ‘Ecosystem‘ here refers to the meaning given to it by systems theorists such as Luhmann in Law as a Social System. The ecosystem captures related activities: Niklas Luhmann, Klaus Ziegert, trans, Fatima Kastner and Richard Nobles R, eds, Law as a Social System, (tr. Klaus Ziegert, ed. Fatima Kastner, Richard Nobles, David Schiff and Rosamund Ziegert, Oxford University Press, 2004 [1993]). See also Peter Weill and Stephanie L Woerner, ‘Thriving in an Increasingly Digital Ecosystem’ (2015) 56(4) MIT Sloan Management Review 27; Yogachandran Rahulamathavan, Raphael C-W Phan, Muttukrishnan Rajarajan, Sudip Misra and Ahmet Kondoz, ‘Privacy-preserving Blockchain based IoT Ecosystem using Attribute-based Encryption’ (paper presented at the IEEE International Conference on Advanced Networks and Telecommunications Systems, Bhubaneswar, 17-20 December 2017), https://ieeexplore.ieee.org/document/8384164. 49 Apolline Blandin, Ann Sofie Cloots, Hatim Hussain, Michel Rauchs, Rasheed Saleuddin, Jason Grant Allen, Bryan Zhang and Katherine Cloud, Global Cryptoasset Regulatory Landscape Study (Cambridge Centre for Alternative Finance, University of Cambridge Judge Business School, 2019). 50 Payment Services Act 2009 (Japan). 51 Hileman and Rauchs, above n 1. See especially Appendix B, at 105-106. Also see Figure 2, in Michel Rauchs, Apolline Blandin, Kristina Klein, Gina Pieters, Martino Recanatini and Bryan Zhang, 2nd Global Cryptoasset Benchmarking Study (Cambridge Centre for Alternative Finance, University of Cambridge Judge Business School, 2018) 19.
eJournal of Tax Research The uncertain nature of the legal status of cryptocurrencies
177
cryptocurrencies occurs on exchanges in a similar fashion to commodity trades on commodity markets. Payment companies build platforms where the cryptocurrencies facilitate transactions. This facilitation corresponds to the economic role of payment systems explained by Mishkin,52 discussed above.
Returning to the indicia identified by Mishkin,53 the market activities in the cryptocurrency ecosystem do not correspond to the functions of money. They do not conform to the criteria of mediums of exchange. As to Mishkin’s first criteria, cryptocurrencies are not standardised. As noted above, there are many different cryptocurrencies. Industry reports on their aggregate market capitalisation;54 which means that the value of each cryptocurrency fluctuates in the marketplace; thus the value is not simple to ascertain. As to the second criteria, as the analysis in this article shows, cryptocurrencies, in particular their use in purchase and sale agreements, are not widely accepted across the economies of the world. However, as to the final three criteria, it is possible for cryptocurrencies such as bitcoins to be divided, and their digital nature is easy to carry in digital wallets and since they do not come in a physical form, they do not deteriorate.
As noted above, there have been hidden economy activities facilitated by cryptocurrencies such as the bitcoin. The Silk Road on the Dark Web is a well-known example.55 As a payment method, other forms of digital hidden economy activities may occur, where payment via cryptocurrencies facilitates tax evasion activities. An example of a digital hidden economy activity is online Daigou activities, where people solicit sales of goods via social media platforms such as Instagram, WeChat or Facebook. Sellers request payment via private means,56 which could include via cryptocurrency payment platforms. There is a gap between solicitation of sales and actual payment. The common practice on social media platforms is that people do not use their full legal names as their account names. The sheer number of accounts means it is difficult to identify that a sale has been made. Once the sale has been made, it is difficult to link the payment to the solicitation of trade.
4. CHINA
In August 2009, the People’s Bank of China issued the ‘Administrative Measures for Electronic Currency Issuance and Clearing Measures: Exposure Draft (Exposure Draft)’, which defined the term ‘electronic currency’ as ‘the prepaid value stored on a client’s electronic media for the purpose of payment’. This definition captures the ‘store of value’ criteria of money nominated by Mishkin,57 discussed above. Article 3 of Chapter 1 of the Exposure Draft states that electronic currency can be divided into two categories: card-based electronic currency and network-based electronic currency. Card-based electronic currency is defined as a form of electronic currency stored in a computer-chip (ie, a debit card), while network-based electronic currency is defined as
52 Mishkin, above n 39, 50-52. 53 Mishkin, above n 39, 50-51. 54 Rauchs et al, above n 51, 10. 55 As discussed in n 15 above and references there cited, there is a wealth of literature on the Silk Road and its interrelationship with cryptocurrencies, in particular bitcoin. 56 See Xi Nan and Eva Huang, ‘Another Place to Hide Business Activities? The Side Effects of Social Media Platforms’ (Paper presented at the 31st Annual Conference of the Australasian Tax Teachers Association, Perth, 16-18 January 2019). 57 Mishkin, above n 39, 50-52.
eJournal of Tax Research The uncertain nature of the legal status of cryptocurrencies
178
the electronic currency stored in software (ie, types of cryptocurrencies that have official backing). Article 3 also states that electronic currency excludes any prepaid currency used for inter-departmental payments. The definition is consistent with the one suggested by the Basel Committee on Banking Supervision.58 This definition points towards China’s stance on issuing its own digital currency, that it will act as a digital representation of the RMB, and serve the payment functions of the RMB in a digital environment. This definition is different from the functions of cryptocurrencies, as analysed above. Strictly speaking, China does not recognise the bitcoin as a digital currency via this definition.
The State Administration of Taxation (SAT) issued Letter No. 818 [2008] of the State Administration of Taxation, responding to a query submitted by the Beijing Municipal Bureau of Local Taxation regarding the collection of individual income tax on virtual currency.59 Letter No. 818 confirms that any gain from the transfer of the virtual currency should be subject to the individual income tax. Under Article 2(9) of the Individual Income Tax Law of the People's Republic of China (2011 Amendment), the capital gains on the exchange of capital assets are subject to the individual income tax under the item of ‘incomes generated from property transfer’ and are generally taxable at a flat rate of 20 per cent. In the context of cryptocurrencies, the original value (or the cost base) includes the price and any taxes that the taxpayer initially paid for the virtual currency. If the taxpayer cannot provide the evidence regarding the original value of virtual currency being traded, then the taxation authority will determine the original value. As cryptocurrency was initially deemed to be a commodity in China, the trade between a legal and a digital currency for a consideration would at that time have also constituted a supply for VAT purposes, taxed at the standard rate of 15 per cent. However, as will be discussed below, this was all about to change.
On 5 December 2013, due to the rapid growth of bitcoin in China and the increasing risk associated with the bitcoin transactions, the People’s Bank of China, the Ministry of Industry and Information Technology, the Securities Regulatory Commission, the China Banking Regulatory Commission and the China Insurance Regulatory Commission jointly issued the Circular of the People's Bank of China, Ministry of Industry and Information Technology, China Banking Regulatory Commission, China Securities Regulatory Commission, and China Insurance Regulatory Commission on the Prevention of Risks from Bitcoin (‘2013 Circular’) in order to more tightly regulate bitcoin. The 2013 Circular referred to bitcoin as a specific ‘virtual commodity’. It states that bitcoin cannot be used as legal tender in China, prohibiting bitcoin from acting as a payment medium for the purchase of any goods or services. The Circular prohibits any financial institution and payment institution from conducting transactions associated with bitcoin. Added to this, it required that any trading platform must implement compulsory registration and be subject to anti-money laundering laws.60 In
58 L J Pu and Zhang, Internet Financing (WangLuo JinRon Xue) (Southwestern University of Finance and Economics Press, 2018); Z L Zhao, Research on the Legal Issues of Virtual Currency (MSc Dissertation, China University of Political Science and Law, 2010). 59 The Chinese terms referring to digital and virtual currencies are used interchangeably in the Chinese language literature. 60 People’s Bank of China, Notice on Prevention of Bitcoin Risks (5 December 2013), http://www.pbc.gov.cn/goutongjiaoliu/113456/113469/2804576/index.html (accessed 27 January 2020).
eJournal of Tax Research The uncertain nature of the legal status of cryptocurrencies
179
order to prevent money laundering, China warned that it would take future action to further regulate the private ownership of bitcoin.61
In September 2017, the joint statement, Announcement of the People's Bank of China, the Office of the Central Leading Group for Cyberspace Affairs, the Ministry of Industry and Information Technology and Other Departments on Preventing the Financing Risks of Initial Coin Offerings,62 was issued banning any Initial Coin Offering (ICO) in China. It further reinforces that no organisation is allowed to engage in the exchange of virtual currency as legal tender. It prohibits various types of token financing activities and forced platforms which were involved in token financing or virtual currency trading to close down. More recently, in January 2018, the People’s Bank of China issued an internal document among banks, prohibiting financial institutions from providing banking or funding facilities to any activity related to cryptocurrencies.63
Thus, in China, cryptocurrency is not only no longer accepted as a means of payment, but is banned. However, it is important to note that while cryptocurrency exchanges have been banned, China has always taken an active position in blockchain technology research and the introduction of a central bank digital currency. It is predicted that China will be the first major country to launch a central bank digital currency.64 The proposed digital currency will be set up as a two-tier structure which is referred to as the digital currency/electronic payment (DC/EP) system.65 It is expected that this DC/EP will replace some of the ‘M0’ component of the central bank’s money supply. China will also implement real-name verification and other measures to counter money laundering and tax evasion. Currently, the People Bank of China has stated China is ready to trial its new digital currency.66 Thus the banning of bitcoin is seen as the first step in the Chinese government’s issuing of its own digital currency, that may involve cryptography as part of the technology.
5. VIETNAM
Cryptocurrencies were introduced into Vietnam in 2013 when Bitcoin Vietnam, in collaboration with an Israeli company, ‘Bit of Gold’, first promoted bitcoins.67 Despite its relatively late introduction into the Vietnamese economy, bitcoin and other digital
61 Matthew Sparkes, ‘Bitcoin Plunges 29pc as China Bans Banks From Trade’, The Telegraph (5 December 2013), https://www.telegraph.co.uk/technology/news/10497146/Bitcoin-plunges-29pc-as-China-bans-banks-from-trade.html (accessed 27 January 2020). 62 See http://en.pkulaw.cn/display.aspx?cgid=64264ae40d2e078dbdfb&lib=law (accessed 27 January 2020). 63 Xie Yu, ‘China Orders Banks to Stop Financing Cryptocurrencies as Noose Tightens Around Disrupter’ South China Morning Post (19 January 2018), http://www.scmp.com/business/banking-finance/article/2129645/pboc-orders-banks-halt-banking-services-cryptocurrency (accessed 27 January 2020). 64 Ibid. 65 Nicole Jao, ‘China’s Digital Fiat Currency is “Nearly Ready” For Launch: PBOC Official’, Technode (12 August 2019), https://technode.com/2019/08/12/chinas-digital-fiat-currency-is-nearly-ready-for-launch-pboc-official/ (accessed 27 January 2020). 66 Tim Morrison, ‘The Greenback Needs a Digital Makeover’, Foreign Policy (24 January 2020), https://foreignpolicy.com/2020/01/24/dollar-reserve-currency-united-states-china-crypto-digital-currency/ (accessed 25 February 2020). 67 Andrew P Rowan, ‘A Brief History of Bitcoin in Vietnam, Medium (22 July 2017), https://medium.com/@MrRowan/a-brief-history-of-bitcoin-in-vietnam-a41a7b26cb83 (accessed 13 October 2019).
eJournal of Tax Research The uncertain nature of the legal status of cryptocurrencies
180
currencies have become popular. While there are no official statistics, it is estimated that the total daily bitcoin trading value is USD 100 million.68
In June 2014, the first bitcoin exchange was launched and local businesses started to accept bitcoin in exchange for day to day expenses.69 However, most Vietnamese see bitcoin as an investment instrument for speculation purposes, rather than currency for the purchase of services and goods.
Several cases of cryptocurrency scams have accelerated the urgency for the government to develop a legal framework. Ho Chi Minh City-based Sky Mining, the self-proclaimed largest cryptocurrency mining firm in Vietnam, was alleged to have defrauded investors after the director absconded to the United States.70 Investors in Sky Mining had been asked to pay between USD 100 and 5,000 for the 7,000 mining rigs that Sky Mining had acquired by computer systems that perform necessary computations for cryptocurrency mining. The investors were promised that they would earn back all their initial investment and make profits of up to 300 per cent.71 In November 2017 the Public Security Department of the northern province of Bac Giang asserted that three members of a criminal gang had defrauded residents from this province and other nearby localities of billions of Vietnamese Dong (VND).72 Most recently there are reports of an alleged USD 660 million scam involving initial coin offerings and affecting 32,000 investors who were swindled out of VND 15 trillion (about AUD 981.4 million) through sales of two ECR-20-standard tokens, Ifan and Pincoin.73
Similar to other countries, cryptocurrency remained unregulated in Vietnam for a period of time after its introduction. In October 2017, the Central Bank of Vietnam addressed the issue by ruling that cryptocurrencies were a prohibited method of payment, with effect from 1 January 2018.74 In support of this approach, the Central Bank relied on Decree 101/2012/ND-CP75 on non-cash payments, as amended by Decree 80/2016/ND-CP.76 This Decree states that the State Bank of Vietnam only recognises ‘checks, payment orders, collection orders, bank cards, and some other SBV-prescribed payment
68 Vietnam Law and Legal Forum, above n 18; Georgi Georgiev, ‘Vietnam Calls for Tougher Cryptocurrency Measure Amid Investigation into Possible $658m Scam’, Bitcoinist (13 April 2018), http://bitcoinist.com/suspected-660-million-ico-scam-calls-for-tough-measures-on-cryptocurrency-in-vietnam/ (accessed 13 October 2019). 69 FPT University had announced it would accept payment of tuition fees by Bitcion. See Huong Hoang, ‘Using Bitcoin to Pay Student’s Tuition Fee in FPT University’ (27 October 2017), http://international.fpt.edu.vn/fpt-university-accepts-bitcoin-payment/ (accessed 13 October 2019). 70 Dy Tung, ‘Thousands Duped by Cryptocurrency Scams in Vietnam in 2018’, VNExpress (26 December 2018), https://e.vnexpress.net/news/business/companies/thousands-duped-by-cryptocurrency-scams-in-vietnam-in-2018-3859459.html (accessed 13 October 2019). 71 Ibid. 72 Straits Times, ‘Vietnam Vows Cryptocurrency Crackdown after $864m Fraud’, Straits Times (12 April 2018), https://www.straitstimes.com/asia/se-asia/vietnam-vows-cryptocurrency-crackdown-after-864m-fraud (accessed 27 January 2020); Vietnam Law and Legal Forum, above n 18. 73 Tung, above n 70. 74 Osborne, above n 17. 75 Government of Vietnam, ‘Decree No. 101/2012/ND-CP of November 22, 2012: On Non Cash Payment’, http://vietnamlawmagazine.vn/decree-no-101-2012-nd-cp-of-november-22-2012-on-non-cash-payment-4750.html (accessed 13 October 2019). 76 Government of Vietnam, ‘Decree No. 80/2016/ND-CP of 1 July 2016 on Amendments to Government’s Decree of No. 101/2012/ND-CP dated Nov 22 2012 on Non-Cash Payment’, https://vanbanphapluat.co/decree-no-80-2016-nd-cp-amend-governments-decree-101-2012-nd-cp-on-non-cash-payments (accessed 13 October 2019).
eJournal of Tax Research The uncertain nature of the legal status of cryptocurrencies
181
instruments as lawful means of payment. All other non-cash payment methods are considered illegal’.77 Relying on Article 27 of Decree 96/2014/ND-CP78, it provides that those who issue, supply or use such forms of payment instruments not stipulated by the State Bank, implicitly bitcoin and other digital currencies, will face a fine of between VND 150 million and 200 million. 79 As of 1 January 2018, criminal prosecution can also follow a breach.80
Despite this, ‘the central bank only bans the use of Bitcoin as a means of payment, which means investors in the currency are still able to store and exchange the cryptocurrency as an asset, not a currency unit, without violating the law’.81 In response the leading virtual currency exchange, Vietnam Bitcoin Company Limited, made a public statement on its website reaffirming that its trading activities do not involve a payment for services (in breach of the law), but rather involves the trading of intangible goods.82 Potentially, recognising cryptocurrencies as a commodity, rather than currency that conforms to the criteria of money according to Mishkin,83 could nevertheless allow for bartering transactions, without breaching the law.84
In a further recent development, it was reported in March 2019 that Vietnam’s Linh Thanh Group has signed a memorandum of understanding (MOU) with Swiss blockchain company KRONN Ventures AG to establish a cryptocurrency exchange, which would facilitate the production of cryptocurrency.85 While some speculated whether the companies had received an appropriate licence, a deputy head of the Payment Department under the State Bank of Vietnam (SBV) stated on 1 April 2019 that the State Bank of Vietnam has not granted permission to any virtual and cryptocurrency trading platforms in Vietnam.86
Recently, the Prime Minister called for new rules to ‘strengthen the management of activities related to cryptocurrencies’, including a review of the provisions of the profit tax, income tax and corporation tax considered relevant to cryptocurrencies.87 This statement indicates that bitcoin and other cryptocurrencies will be taxed in Vietnam – the only question is how?
77 Vietnam Law and Legal Forum, above n 18; Georgiev, above n 68. 78 Government of Vietnam, ‘Decree on Penalties for Administrative Violations Against Currency Banking’ doc no. 96/2014/NĐ-CP (17 October 2014), https://thuvienphapluat.vn/van-ban/Tien-te-Ngan-hang/Decree-96-2014-ND-CP-penalties-for-administrative-violations-against-currency-banking-265135.aspx (accessed 13 October 2019). 79 Vietnam Law and Legal Forum, above n 18; Georgiev, above n 68. 80 Vietnam Law and Legal Forum, above n 18. 81 Tuoi Tre News, above n 16. 82 Ibid. 83 Mishkin, above n 39, 50-52. 84 See the discussion with lawyer Le Cao in Tuoi Tre News, above n 16. 85 Alphan Maina, ‘First Ever Crytocurrencies Exchange in Vietnam’, Coinrevolution (28 March 2019), https://coinrevolution.com/first-ever-cryptocurrency-exchange-in-vietnam/ (accessed 13 October 2019). 86 Vietnam Investment Review, ‘Central Bank Gives No Permission to Cryptocurrencys Platforms”, Vietnam Investment Review (2 April 2019), https://www.vir.com.vn/central-bank-gives-no-permission-to-cryptocurrency-platforms-66826.html (accessed 13 October 2019). 87 Cộng Hòa Xã Hội Chủ Nghĩa Việt Nam, Phê Duyệt Đề Án Hoàn Thiện Khung Pháp Lý Để Quản Lý, Xử Lý Đối Với Các Loại Tài Sản Ảo, Tiền Điện Tử, Tiền Ảo [The Socialist Republic of Vietnam, Approving the Project to Design a Legal Framework to Regulate Cryptocurrencies and Other Form of Digital Assets, Document No. 1255/QD-TTg, 21 September 2017, https://vanbanphapluat.co/quyet-dinh-1255-qd-ttg-2017-hoan-thien-khung-phap-ly-de-quan-ly-xu-ly-doi-voi-tai-san-ao-tien-ao (accessed 13 October 2019).
eJournal of Tax Research The uncertain nature of the legal status of cryptocurrencies
182
As noted above, the legal treatment of cryptocurrencies will have great implications as to their regulation from a taxation perspective. To this end, Vietnamese lawmakers are still in the process of deciding whether to treat bitcoin as currency or as an asset. So far, there is little detail on the taxation treatment of cryptocurrencies in Vietnam, except that the government is determined to prevent tax evasion from those engaging in cryptocurrency transactions. From the declaration that cryptocurrencies are not a lawful means of payment referred to above, it would seem logical that for taxation purposes Vietnamese lawmakers are likely to continue not to recognise cryptocurrency as money. As discussed below, this however, needs to be supported by legislation expressly confirming such. Equally, the allowance of trading in cryptocurrencies indicates the government will treat it as a commodity.
Any profits could be taxed as corporate business income (tax rate 20 per cent) and for non-corporate taxpayers, taxed as ‘non-employment’ income which includes business income (tax rate of between 0.5 and 5 per cent), gains from the sale of securities (tax rate 1 per cent of sale proceeds), or capital gains (tax rate 20 per cent of the net gain or 0.1 per cent of sale proceeds).88 However, again this needs to be supported by legislation. Equally the 10 per cent VAT could apply to the sale of such commodities. However, financial products and foreign currency trading are excluded from VAT.89 Thus once again the very nature of the cryptocurrency as determined by the government will determine the applicability of the VAT.
The need to address the taxation of cryptocurrencies through legislation was highlighted by a recent decision where a local government failed in its attempt to tax the taxpayer of his capital gain made of the sale of bitcoin. A local government had sought to require a bitcoin investor to pay personal and property taxes to the amount of VND 2.6 trillion from gains made from his investment.90 In a major victory for the bitcoin investor, the Court held that in absence of any legal provision recognising bitcoin as an asset, the government could not collect taxes from the bitcoin investor.91 Until the status of cryptocurrencies is confirmed by legislative measures, the taxation of gains and losses will remain uncertain.
In conclusion, the announcement from the Central Bank and statements from the Prime Minister have indicated that, whilst denying cryptocurrency as an instrument of payment, thereby indicating that they are not money as defined by Mishkin,92 the government is determined to recognise cryptocurrencies as an intangible asset in a step to tax gains made from cryptocurrency trades. However, until the status of cryptocurrencies is confirmed by legislative measures, the taxation of gains and losses will remain uncertain.
88 KPMG, ‘Vietnam – Income Tax’ (13 March 2018), https://home.kpmg.com/xx/en/home/insights/2011/12/vietnam-income-tax.html (accessed 13 October 2019). 89 Ibid; PricewaterhouseCoopers, Vietnam Pocket Tax Book 2016 (1 March 2016), https://www.pwc.com.au/asia-practice/assets/vietnam-pocket-tax-book-2016.pdf (accessed 13 October 2019). 90 M Thành, ‘Bitcoin Investment: Tax Office Wants to Tax 2.6 trillion, Court Declare No Dollar is Subject to Tax’, Tuoi Tre News (15 November 2017), https://tuoitre.vn/kinh-doanh-bitcoin-thue-muon-thu-2-6-ti-toa-tuyen-0-dong-20171115160517126.htm (accessed 27 January 2020). 91 Ibid. 92 Mishkin, above n 39, at 50-52.
eJournal of Tax Research The uncertain nature of the legal status of cryptocurrencies
183
6. JAPAN
Japan is one of the eight largest cryptocurrency markets and has the highest cryptocurrency ownership in the world.93 It is reported that approximately 40 per cent of overall trading in bitcoin is Japanese yen. Significant to these figures is the fact that, since 2018, a large number of cryptocurrency investors have moved away from China after it banned bitcoin transactions.94
Japan has positioned itself as a pioneer in regards to cryptocurrency regulation.95 Regulations for cryptocurrencies were developed after the collapse of one of the largest bitcoin exchanges, Mt Gox, in 2014.96 Two major working group reports were submitted by the Financial Services Agency (FSA) and these submissions resulted in 2017 tax reforms and a revision of the Payment Services Act.97 The revised Payment Services Act was effective from 1 April 2017.98 The aims of the revision of the Payment Services Act were threefold: 99
protect cryptocurrency users;
induce a registration system for dealers; and
allow the wider use of cryptocurrencies for payments and remittances.100
The Payment Services Act refers to cryptocurrency as a ‘virtual currency’.101 It is defined as:
(i) Property value which can be used in relation to unspecified persons for the purpose of paying consideration for the purchase or leasing of goods or the receipt of provision of services and can also be purchased from and sold to unspecified persons acting as counterparties, and which can be transferred by means of an electronic data processing system; and
(ii) Property value which can be mutually exchanged with what is set forth in the preceding item with unspecified persons acting as counterparties, and which can be transferred by means of an electronic data processing system.
93 Rytis Jakubauskas, ‘How Many People Actually Own Cryptocurrency?’, Dalia (11 May 2018), https://daliaresearch.com/blog-cryptocurrency-ownership/+&cd=1&hl=en&ct=clnk&gl=au (accessed 27 January 2020). 94 Y L Zhou, ‘On Crypto Currencies’ (2018) 4 Financial Market Research 74, 78-79. 95 Kai Sedgwick, ‘Japan Teaches Western Governments a Lesson in Cryptocurrency Regulation’, Bitcoin.com (13 November 2017), https://news.bitcoin.com/japan-teaches-western-governments-lesson-cryptocurrency-regulation/ (accessed 27 January 2020). 96 Sayuri Umeda, ‘Japan’, in Law Library of Congress, Regulation of Cryptocurrency in Selected Jurisdictions (The Law Library of Congress, Global Legal Research Center, 2018) 53, https://www.loc.gov/law/help/cryptocurrency/regulation-of-cryptocurrency.pdf. 97 Ibid. 98 Keirns, above n 4. 99 Ji Ji, ‘Japan's Financial Services Agency Set to Update Cryptocurrency Regulations in Speculation Countermeasure’, Japan Times (2018), https://www.japantimes.co.jp/news/2018/08/08/business/japans-financial-services-agency-set-update-cryptocurrency-regulations-speculation-countermeasure/#.XSICULsUmCc. (accessed on 29 August 2019). 100 Ibid. 101 Payment Services Act 2009, art 2, para 5.
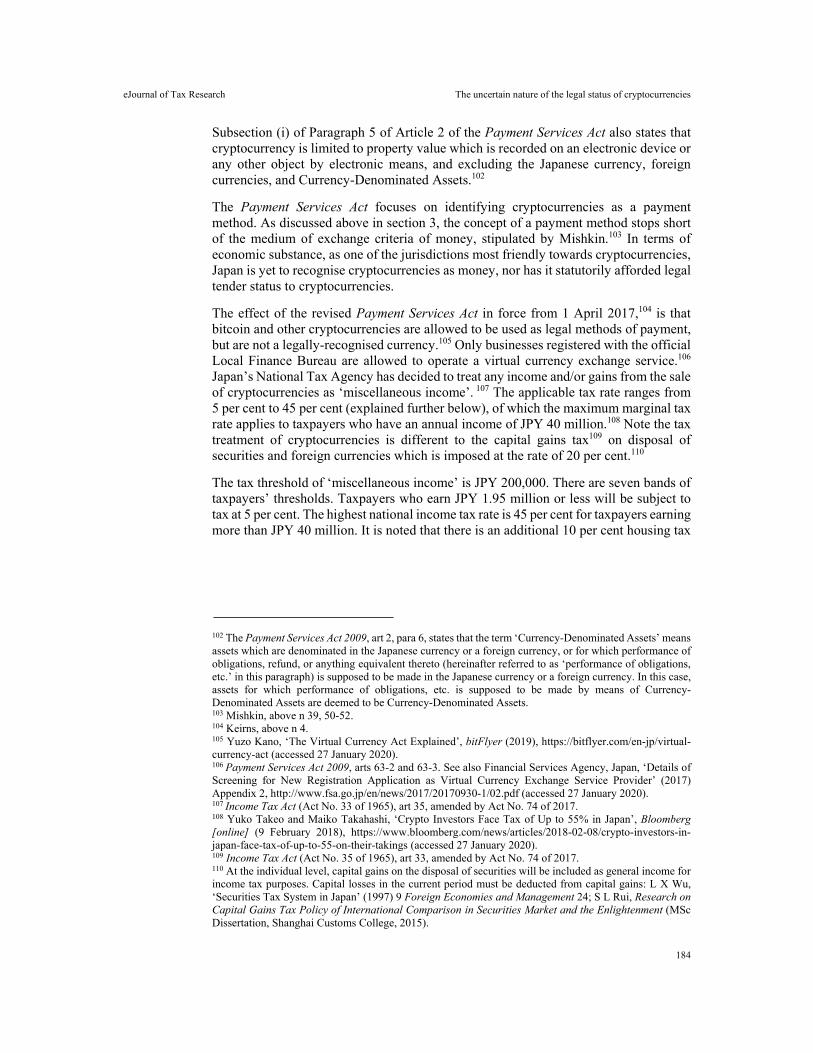
eJournal of Tax Research The uncertain nature of the legal status of cryptocurrencies
184
Subsection (i) of Paragraph 5 of Article 2 of the Payment Services Act also states that cryptocurrency is limited to property value which is recorded on an electronic device or any other object by electronic means, and excluding the Japanese currency, foreign currencies, and Currency-Denominated Assets.102
The Payment Services Act focuses on identifying cryptocurrencies as a payment method. As discussed above in section 3, the concept of a payment method stops short of the medium of exchange criteria of money, stipulated by Mishkin.103 In terms of economic substance, as one of the jurisdictions most friendly towards cryptocurrencies, Japan is yet to recognise cryptocurrencies as money, nor has it statutorily afforded legal tender status to cryptocurrencies.
The effect of the revised Payment Services Act in force from 1 April 2017,104 is that bitcoin and other cryptocurrencies are allowed to be used as legal methods of payment, but are not a legally-recognised currency.105 Only businesses registered with the official Local Finance Bureau are allowed to operate a virtual currency exchange service.106 Japan’s National Tax Agency has decided to treat any income and/or gains from the sale of cryptocurrencies as ‘miscellaneous income’. 107 The applicable tax rate ranges from 5 per cent to 45 per cent (explained further below), of which the maximum marginal tax rate applies to taxpayers who have an annual income of JPY 40 million.108 Note the tax treatment of cryptocurrencies is different to the capital gains tax109 on disposal of securities and foreign currencies which is imposed at the rate of 20 per cent.110
The tax threshold of ‘miscellaneous income’ is JPY 200,000. There are seven bands of taxpayers’ thresholds. Taxpayers who earn JPY 1.95 million or less will be subject to tax at 5 per cent. The highest national income tax rate is 45 per cent for taxpayers earning more than JPY 40 million. It is noted that there is an additional 10 per cent housing tax
102 The Payment Services Act 2009, art 2, para 6, states that the term ‘Currency-Denominated Assets’ means assets which are denominated in the Japanese currency or a foreign currency, or for which performance of obligations, refund, or anything equivalent thereto (hereinafter referred to as ‘performance of obligations, etc.’ in this paragraph) is supposed to be made in the Japanese currency or a foreign currency. In this case, assets for which performance of obligations, etc. is supposed to be made by means of Currency-Denominated Assets are deemed to be Currency-Denominated Assets. 103 Mishkin, above n 39, 50-52. 104 Keirns, above n 4. 105 Yuzo Kano, ‘The Virtual Currency Act Explained’, bitFlyer (2019), https://bitflyer.com/en-jp/virtual-currency-act (accessed 27 January 2020). 106 Payment Services Act 2009, arts 63-2 and 63-3. See also Financial Services Agency, Japan, ‘Details of Screening for New Registration Application as Virtual Currency Exchange Service Provider’ (2017) Appendix 2, http://www.fsa.go.jp/en/news/2017/20170930-1/02.pdf (accessed 27 January 2020). 107 Income Tax Act (Act No. 33 of 1965), art 35, amended by Act No. 74 of 2017. 108 Yuko Takeo and Maiko Takahashi, ‘Crypto Investors Face Tax of Up to 55% in Japan’, Bloomberg [online] (9 February 2018), https://www.bloomberg.com/news/articles/2018-02-08/crypto-investors-in-japan-face-tax-of-up-to-55-on-their-takings (accessed 27 January 2020). 109 Income Tax Act (Act No. 35 of 1965), art 33, amended by Act No. 74 of 2017. 110 At the individual level, capital gains on the disposal of securities will be included as general income for income tax purposes. Capital losses in the current period must be deducted from capital gains: L X Wu, ‘Securities Tax System in Japan’ (1997) 9 Foreign Economies and Management 24; S L Rui, Research on Capital Gains Tax Policy of International Comparison in Securities Market and the Enlightenment (MSc Dissertation, Shanghai Customs College, 2015).
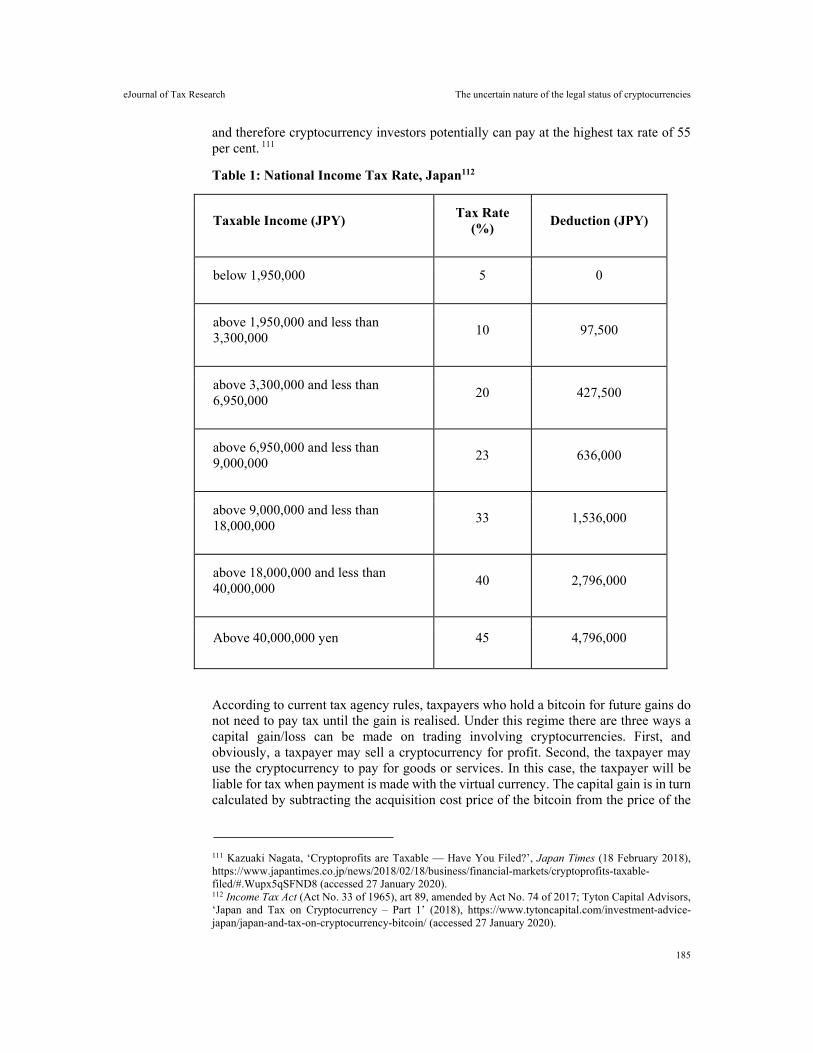
eJournal of Tax Research The uncertain nature of the legal status of cryptocurrencies
185
and therefore cryptocurrency investors potentially can pay at the highest tax rate of 55 per cent. 111
Table 1: National Income Tax Rate, Japan112
Taxable Income (JPY) Tax Rate
(%) Deduction (JPY)
below 1,950,000 5 0
above 1,950,000 and less than 3,300,000
10 97,500
above 3,300,000 and less than 6,950,000
20 427,500
above 6,950,000 and less than 9,000,000
23 636,000
above 9,000,000 and less than 18,000,000
33 1,536,000
above 18,000,000 and less than 40,000,000
40 2,796,000
Above 40,000,000 yen 45 4,796,000
According to current tax agency rules, taxpayers who hold a bitcoin for future gains do not need to pay tax until the gain is realised. Under this regime there are three ways a capital gain/loss can be made on trading involving cryptocurrencies. First, and obviously, a taxpayer may sell a cryptocurrency for profit. Second, the taxpayer may use the cryptocurrency to pay for goods or services. In this case, the taxpayer will be liable for tax when payment is made with the virtual currency. The capital gain is in turn calculated by subtracting the acquisition cost price of the bitcoin from the price of the
111 Kazuaki Nagata, ‘Cryptoprofits are Taxable — Have You Filed?’, Japan Times (18 February 2018), https://www.japantimes.co.jp/news/2018/02/18/business/financial-markets/cryptoprofits-taxable-filed/#.Wupx5qSFND8 (accessed 27 January 2020). 112 Income Tax Act (Act No. 33 of 1965), art 89, amended by Act No. 74 of 2017; Tyton Capital Advisors, ‘Japan and Tax on Cryptocurrency – Part 1’ (2018), https://www.tytoncapital.com/investment-advice-japan/japan-and-tax-on-cryptocurrency-bitcoin/ (accessed 27 January 2020).
eJournal of Tax Research The uncertain nature of the legal status of cryptocurrencies
186
purchased goods and services. For example, if the acquisition cost of the bitcoin is JPY 200,000 and the price of goods purchased is JPY 1 million, the taxable capital gain is JPY 800,000 (ie, JPY 1 million minus 200,000). Third, any gain from the exchange of a virtual currency to another type of virtual currency will be taxable and the way to compute the capital gain is similar to the way in calculating the capital gain on the exchange of goods as mentioned earlier. In general, a capital loss on disposal of cryptocurrency is not allowed. Only capital losses from the disposal of real estate, business, assets transfers and forestry income can be deducted from income.
A penalty of 20 per cent plus delay fines will apply for those who refuse to pay tax on their cryptocurrency gain. Japan’s tax authorities are able to trace and identify account holders from reports prepared by currency exchanges. Therefore, taxpayers who have made capital gains from trading cryptocurrencies are not able to avoid tax.113 The 2017 tax reforms also exempted virtual currency trading from consumption tax, effective 1 July 2017.114
On 31 May 2019, the Japanese House of Representatives amended the Payment Services Act and the Financial Instruments and Exchange Act.115 In particular, the term ‘virtual currency’ is replaced by a new term ‘crypto asset’, which is used by the G20 and better describes cryptocurrencies.116 Also it has been suggested that certain types of cryptocurrencies such as tokens could be recognised as ‘securities’ for purposes of Japanese securities regulations.117 This will become effective from April 2020.
In conclusion, under the Payment Services Act, bitcoin and other cryptocurrencies are allowed to be used as legal methods of payment, but are not a legally recognised currency.118 Only businesses registered with the official Local Finance Bureau are allowed to operate a virtual currency exchange service.119 Virtual currency trading is exempt from consumption tax120.
7. SOUTH KOREA
After the United States and Japan, South Korea is believed to be the largest market for cryptocurrency trading in the world.121 In January 2018 trade in Bitcoin in Korean won
113 Nagata, above n 111. 114 Cabinet Order for Partial Revision of the Order for Enforcement of the Consumption Tax Act, Official Gazette (Extra Edition No. 7), 31 March 2017, 250. 115 Act No. 25 of 1948, as amended. 116 An FSA report states that ‘the term “crypto-asset” has recently been used in international discussions. Moreover… to prevent misunderstanding that virtual currency is equivalent to fiat currency’: Financial Services Agency, Japan, Report from Study Group on Virtual Currency Exchange Services (21 December 2018) 30 (references omitted), https://www.fsa.go.jp/en/refer/councils/virtual-currency/20181228.html (accessed 27 January 2020). 117 Katsuhiko Fujihira and Seth A Graham, ‘FSA Proposes Bill to Amend Japanese Laws Regulating Cryptocurrency-Related Businesses’, Morrison Foerster Client Alert (9 April 2019), https://www.mofo.com/resources/publications/190409-japanese-cryptocurrency.html (accessed 27 January 2020). 118 Kano, above n 105. 119 Financial Services Agency, Japan, above n 106. 120 Cabinet Order, above n 114. 121 Chrisjan Pauw, ‘South Korea and Crypto Regulations, Explained’, Cointelegraph (6 February 2018), https://cointelegraph.com/explained/south-korea-and-crypto-regulations-explained (accessed 27 January 2020).
eJournal of Tax Research The uncertain nature of the legal status of cryptocurrencies
187
(KRW) stood at approximately 4 per cent of all trades.122 While this compares to more than 40 per cent of total bitcoin trade in Japanese yen and roughly 30 per cent transacted in US dollar terms,123 South Korean trade still plays a significant part in the overall market. Moreover, consequent to such rising demand in South Korea, cryptocurrencies have at times traded at prices 30 per cent higher than prices in other countries.124
Initially it appeared South Korea would follow the approach taken in Japan and allow for cryptocurrencies at both levels: ICOs and trading. However, after China banned the currency, South Korea decided on a major turnaround.125 It followed suit and announced on 28 September 2017 a ban on all kinds of ICOs. Specifically, South Korea's Financial Services Commission prohibited domestic companies and start-ups from issuing ICOs.126 Those involved in breaches of this prohibition would face ‘stern penalties’.127 Currently the legislature is considering lifting the ban, allowing for the issuing of domestic ICOs.128 However, this would only be allowed after exchanges met stringent conditions and in the framework of regulator supervision.129
There were rumours that the government would follow China’s approach and also ban domestic trading of cryptocurrencies.130 In response, the government instead announced a crackdown on anonymous trading.131 On 23 January 2018 South Korea’s Financial Services Commission issued a press release asserting that from 30 January 2018 it will only allow trade in cryptocurrencies from real-name bank accounts.132 It also announced that it will introduce a guideline to prevent cryptocurrency-related money laundering (‘Cryptocurrency-related AML Guideline’).133 The measures outlined were intended to ‘reduce room for cryptocurrency transactions to be exploited for illegal activities, such as crimes, money laundering and tax evasion’.134 Thus the focus of the measures is to combat the otherwise prevalent anonymity underpinning cryptocurrencies and the illegal use of cryptocurrencies facilitated by this anonymity.
Information on the consequent tax treatment of trading in cryptocurrencies in South Korea is lacking. Corporate income (CIT) is taxed under Article 19 of the Income Tax Act at marginal rates, the top rate recently being increased to 25 per cent for income
122 Cheang Ming, ‘New Cryptocurrency Rules Just Came Into Effect in South Korea’, CNBC (30 January 2018), https://www.cnbc.com/2018/01/29/south-korea-cryptocurrency-regulations-come-into-effect.html (accessed 27 January 2020); Nagata, above n 111. 123 Ming, above n 122. 124 Pauw, above n 121. 125 Cynthia Kim, ‘South Korea Bans Raising Money Through Initial Coin Offerings’, Reuters (29 September 2017), https://www.reuters.com/article/us-southkorea-bitcoin/south-korea-bans-raising-money-through-initial-coin-offerings-idUSKCN1C408N (accessed 27 January 2020). 126 Ibid. 127 Gertrude Chavez-Dreyfuss and Angela Moon, ‘Factbox: National Regulators Views on Initial Coin Offerings’, Reuters (28 November 2017), https://de.reuters.com/article/us-blockchain-regulation-tokens-factbox/factbox-national-regulators-views-on-initial-coin-offerings-idUKKBN1DS0FW (accessed 27 January 2020); Kim, above n 125. 128 Kim, above n 125. 129 Ibid. 130 Pauw, above n 121. 131 Financial Services Commission, Republic of Korea, ‘Financial Measures to Curb Speculation’, above n 20. 132 Ibid. 133 Ibid. 134 Ibid.
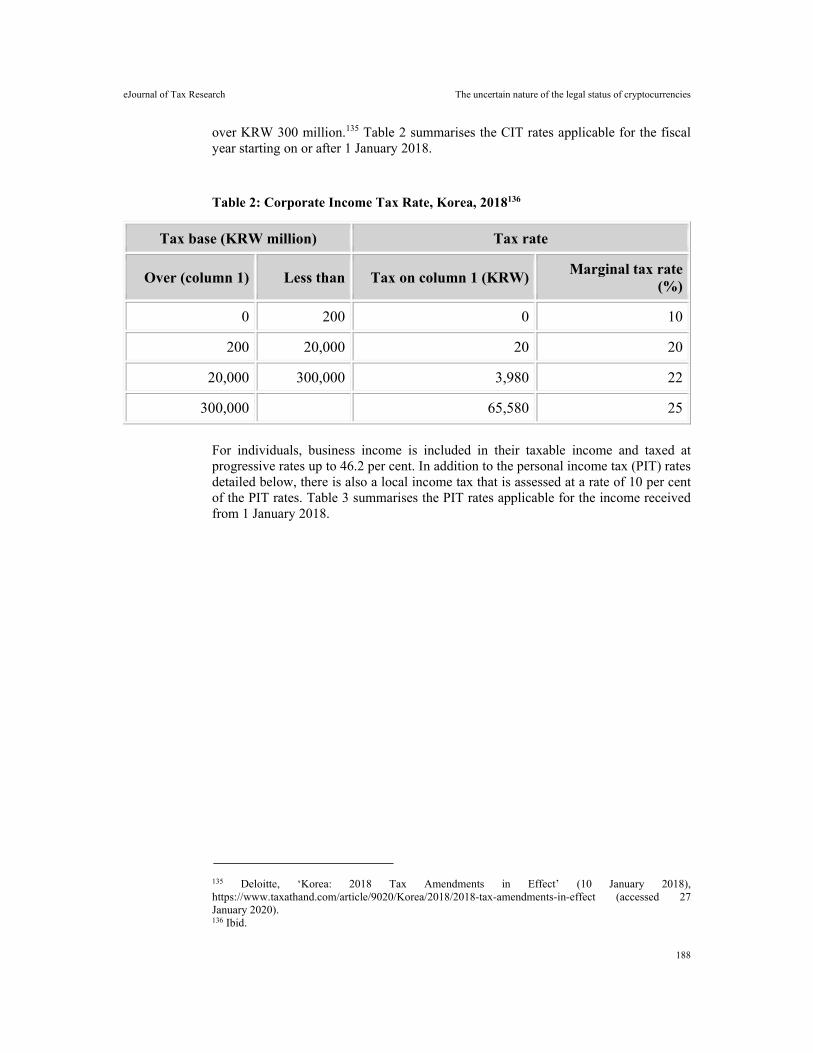
eJournal of Tax Research The uncertain nature of the legal status of cryptocurrencies
188
over KRW 300 million.135 Table 2 summarises the CIT rates applicable for the fiscal year starting on or after 1 January 2018.
Table 2: Corporate Income Tax Rate, Korea, 2018136
Tax base (KRW million) Tax rate
Over (column 1) Less than Tax on column 1 (KRW) Marginal tax rate
(%)
0 200 0 10
200 20,000 20 20
20,000 300,000 3,980 22
300,000 65,580 25
For individuals, business income is included in their taxable income and taxed at progressive rates up to 46.2 per cent. In addition to the personal income tax (PIT) rates detailed below, there is also a local income tax that is assessed at a rate of 10 per cent of the PIT rates. Table 3 summarises the PIT rates applicable for the income received from 1 January 2018.
135 Deloitte, ‘Korea: 2018 Tax Amendments in Effect’ (10 January 2018), https://www.taxathand.com/article/9020/Korea/2018/2018-tax-amendments-in-effect (accessed 27 January 2020). 136 Ibid.
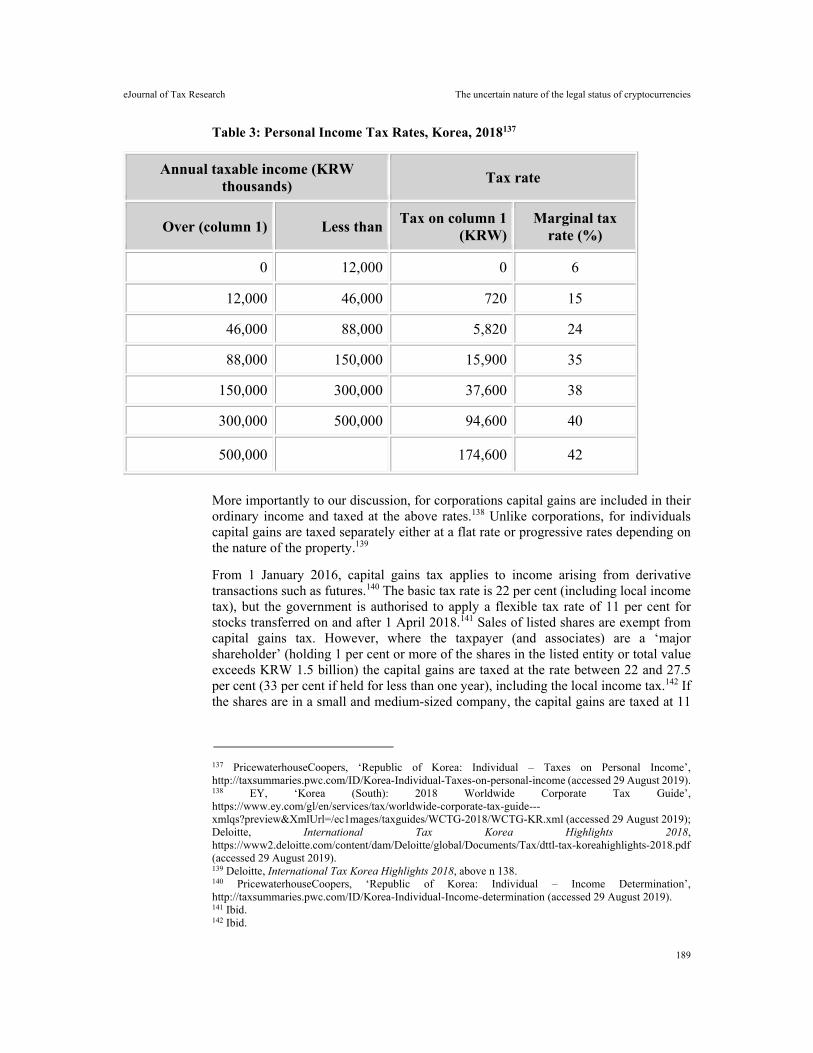
eJournal of Tax Research The uncertain nature of the legal status of cryptocurrencies
189
Table 3: Personal Income Tax Rates, Korea, 2018137
Annual taxable income (KRW thousands)
Tax rate
Over (column 1) Less than Tax on column 1
(KRW) Marginal tax
rate (%)
0 12,000 0 6
12,000 46,000 720 15
46,000 88,000 5,820 24
88,000 150,000 15,900 35
150,000 300,000 37,600 38
300,000 500,000 94,600 40
500,000 174,600 42
More importantly to our discussion, for corporations capital gains are included in their ordinary income and taxed at the above rates.138 Unlike corporations, for individuals capital gains are taxed separately either at a flat rate or progressive rates depending on the nature of the property.139
From 1 January 2016, capital gains tax applies to income arising from derivative transactions such as futures.140 The basic tax rate is 22 per cent (including local income tax), but the government is authorised to apply a flexible tax rate of 11 per cent for stocks transferred on and after 1 April 2018.141 Sales of listed shares are exempt from capital gains tax. However, where the taxpayer (and associates) are a ‘major shareholder’ (holding 1 per cent or more of the shares in the listed entity or total value exceeds KRW 1.5 billion) the capital gains are taxed at the rate between 22 and 27.5 per cent (33 per cent if held for less than one year), including the local income tax.142 If the shares are in a small and medium-sized company, the capital gains are taxed at 11
137 PricewaterhouseCoopers, ‘Republic of Korea: Individual – Taxes on Personal Income’, http://taxsummaries.pwc.com/ID/Korea-Individual-Taxes-on-personal-income (accessed 29 August 2019). 138 EY, ‘Korea (South): 2018 Worldwide Corporate Tax Guide’, https://www.ey.com/gl/en/services/tax/worldwide-corporate-tax-guide---xmlqs?preview&XmlUrl=/ec1mages/taxguides/WCTG-2018/WCTG-KR.xml (accessed 29 August 2019); Deloitte, International Tax Korea Highlights 2018, https://www2.deloitte.com/content/dam/Deloitte/global/Documents/Tax/dttl-tax-koreahighlights-2018.pdf (accessed 29 August 2019). 139 Deloitte, International Tax Korea Highlights 2018, above n 138. 140 PricewaterhouseCoopers, ‘Republic of Korea: Individual – Income Determination’, http://taxsummaries.pwc.com/ID/Korea-Individual-Income-determination (accessed 29 August 2019). 141 Ibid. 142 Ibid.
eJournal of Tax Research The uncertain nature of the legal status of cryptocurrencies
190
per cent (including the local income tax).143 There is a separate securities transaction tax (STT) on the sale of shares, taxed at a rate of 0.3 per cent on the sale of listed shares and the rate is increased to 0.5 per cent if the shares are unlisted.144 The default capital gains tax rate is 20 per cent. Thus, depending on whether cryptocurrencies are treated as a financial product (derivative or security) or ‘other’ commodity, they could be taxed accordingly.
As with the other jurisdictions considered in this article, South Korea applies a VAT. The standard rate is 10 per cent. As with many other jurisdictions, foreign currency (Article 24) and financial supplies (Article 26) are zero-rated under the Value Added Tax Act.145
While the taxation of business income is clear cut and the inclusionary nature of all capital gains in the taxable income of corporations is less complicated than the varying rates that apply to individuals, the characterisation of the commodity will affect the taxation of capital gains derived by both groups. Equally, the applicability of the VAT will come down to the crucial questions: is cryptocurrency a commodity? Is it a financial product? Is it currency? Only the South Korean government can determine this crucial matter.
8. CONCLUDING THOUGHTS
The above discussion highlights the very different stances that governments may take towards cryptocurrencies. At one end of the spectrum, China has rejected cryptocurrencies as a legal form of payment and effectively banned trading in cryptocurrencies, particularly bitcoin. Concerns as to the use of cryptocurrencies in money laundering and illegal activities clearly underpins this approach in China, Vietnam and South Korea. In the case of Vietnam, the stance taken by the government is also probably a protectionist measure to protect the Vietnamese currency. Japan, by contrast, has taken the polaristic view that cyroptocurrencies are legal forms of payment and sought to support and foster trading in them. Clearly this is spurred by that country’s embrace of e-commerce and the benefits that flow from same. As to which way a government might turn is anyone’s guess: A toss of a (bit)coin!
This in turn raises many difficult tax issues. Characterising the cryptocurrency is going to be the key to the assessability of any gains made through trades. If they are treated as a commodity, then existing business income, personal income and capital gains tax provisions can apply and provide for assessment of these gains, subject to any applicable exceptions. To this end, capital gains will be chargeable when the cryptocurrencies are sold, traded or exchanged (as the case may be),146 rather than on an accruals basis.
However, even if a tax system grapples with these issues and seeks to apply its income tax or capital gains tax to such trades, a further issue relates to the valuation of the sales and cost base from the exchange of cryptocurrency. As the price of cryptocurrency is
143 Ibid. 144 Hak Rae Cho and Jin Woo Lee, ‘Tax on Corporate Transactions in South Korea: Overview’, Practical Law (1 September 2018). 145 See further EY, Worldwide VAT, GST and Sales Tax Guide 2018 (April 2018), https://www.ey.com/Publication/vwLUAssets/EY_Worldwide_VAT,_GST_and_Sales_Tax_Guide_2018/%24File/Worldwide%20VAT,%20GST%20and%20Sales%20Tax%20Guide%202018.pdf. 146 Tyton Capital Advisors, ‘Japan and Tax on Cryptocurrency – Part 2’ (2018), https://www.tytoncapital.com/investment-advice-japan/japan-and-tax-on-cryptocurrency-part-2/.
eJournal of Tax Research The uncertain nature of the legal status of cryptocurrencies
191
fluctuating, there is a lack of an objective valuation method and trading platforms to determine the value of the cryptocurrency. This is especially the case given that, as established above, the economic substance of cryptocurrencies is not that of money, so that the foreign currency valuation models could not be applied to value cryptocurrencies. Further, some cryptocurrencies, such as Bitcoin Cash and Bitcoin Gold, allow coin-splits into different parts or provide free native tokens to current cryptocurrency investors. Quantifying these coin-splits and subsequent gains could be a challenge. The current tax treatment in Japan is that the split-coins and free native tokens obtained through mining are considered to have a zero face value at acquisition.147
Furthermore, a related issue is to decide the types of expenditure eligible for tax deduction. For example, should the electricity expense related to the mining of the cryptocurrency be deductible? Also, many taxpayers are holding their cryptocurrency in ‘paper wallets’ or other physical devices. Should the cost/loss be tax deductible when a taxpayer loses access to their crypto wallets or when their cryptocurrency is embezzled by hackers such as Coinbase?148
Whether cryptocurrency is considered a financial product akin to a share also entails further tax and non-tax issues. Financial products are regulated under securities legislation, normally administered by a state authority. If cryptocurrencies are not considered financial products, the danger is that they will be unregulated without further government regulatory intervention. From a tax perspective, if they are considered financial products, trading in cryptocurrencies will again be subject to existing business income, personal income and in some cases, capital gains tax provisions. However, as noted above, financial products are often exempt from capital gains and normally exempt from GST/VAT.
There are further issues in the context of GST/VAT. If a cryptocurrency is deemed to be a commodity, as in Vietnam and South Korea, the trade of a digital currency for consideration would constitute a supply for VAT purposes. By contrast if it is treated as currency, as in Australia and the European Union, the exchange of cryptocurrency is zero-rated.149
This article has focused on key domestic tax issues in this regard. However, there are further international tax issues. Due to the rapid growth of the digital economy, the taxation of cryptocurrencies presents a great challenge to the existing tax system. In particular, the nature of cryptocurrencies often poses problems in determining the source of tax and tax collection.150
Both domestic tax laws and double tax agreements are based on the core notions of ‘source’ and ‘residence’, and at times ‘domicile’. For example, in Japan, permanent tax residents who have a domicile in Japan are subject to tax on their worldwide income.
147 Ibid 148 Tyton Capital Advisors, ‘Japan and Tax on Cryptocurrency – Part 3’ (2018), https://www.tytoncapital.com/investment-advice-japan/japan-and-tax-on-cryptocurency-part-3/. 149 See the discussion of the European Court of Justice (ECJ) decision in Case (C-264/14) Skatteverket v David Hedqvist in Rose Boevé, ‘Bitcoin and Other Cryptocurrencies in Tax’ (2018) 29(2) International Tax Review 51. In regard to the Australian position, see further Cassidy and Cheng, above n 5. 150 Yang Xiao Qian, The Impact and Countermeasures of Enterprise Income Tax in the Era of Digital Economy -- Based on the International Comparison Perspective (MSc Dissertation, Guizhou University of Finance and Economics, 2017) 19-27.
eJournal of Tax Research The uncertain nature of the legal status of cryptocurrencies
192
Non-permanent domicile residents are taxed on all income except foreign source income that is not paid in or remitted to Japan. In China, domicile and non-domicile individual taxpayers who are long-term residents pay tax on their worldwide income, and therefore such individuals pay tax on certain investment income (including capital gains) regardless of where it is sourced or received. On the other hand, non-domicile individual taxpayers who reside in China for less than six years pay tax on China-sourced investment income only. As discussed in this article, digital technology allows the trading of cryptocurrencies from a remote platform. One challenge to the application of an income tax system to trades in cryptocurrencies is the difficultly in determining the source of the income. In turn, should the tax be imposed by the source country of the enterprise/exchange or to the tax resident trader? In the digital economy era, electronic transactions are often characterised by a lack of physical nature. In particular, it is difficult to apply the traditional concept of tax residency in the context of cryptocurrency trading. This impacts not only on issues of source and residence, but also complicates the tax collection process. These are all issues with which nations across the globe will have to grapple.
eJournal of Tax Research (2020) vol. 17, no. 2, pp. 193-232
193
An empirical study on cross-border profit shifting in Australia
Xuerui (Estelle) Li and Alfred Tran
Abstract
This is an empirical study on the cross-border profit shifting engaged in by Australian subsidiaries of foreign multinational enterprises for tax avoidance. The study reveals that in comparison with domestic-owned listed Australian companies, foreign-owned Australian companies utilise intra-group transfer pricing and pay high interest rates on intra-group debts to shift profits out of Australia to avoid Australian tax to a greater extent, which are manifested in their lower gross profit margins and operating profit margins, higher interest expenses but similar leverage ratios, as well as lower pre-tax profits and income tax expenses.
Key words: Cross-border profit shifting, Australian subsidiaries of foreign multinationals, transfer pricing, thin capitalisation
Research School of Accounting, The Australian National University. Research School of Accounting, The Australian National University. Corresponding author, email: [email protected]. We gratefully acknowledge the financial support of the ANU College of Business and Economics Research School Grant. We also appreciate the helpful suggestions and comments of the participants of the 2015 Australasian Tax Teachers’ Association Conference (19-21 January 2015 at the University of Adelaide) and the Tax and Transfer Policy Institute seminar (13 October 2015 at the Australian National University) on the previous versions of this article.
eJournal of Tax Research An empirical study on cross-border profit shifting in Australia
194
1. INTRODUCTION
In the wake of accelerated globalisation and advanced information technology, multinational enterprises (MNEs) typically engage in cross-border profit shifting to artificially shift their profits from high-tax to low-tax jurisdictions for tax avoidance. The profit shifting results in the erosion of the tax bases and hence reduced tax payments due in the high-tax jurisdictions where the MNEs operate. This practice is referred to by the Organisation for Economic Co-operation and Development (OECD) as base erosion and profit shifting, or BEPS. Research has estimated that BEPS may result in an annual tax revenue loss of USD 100-240 billion (OECD, 2015a). Consider two well-known MNEs as examples. Apple Inc., the giant technology company, has been revealed in recent Congressional hearings in the US that it had successfully sheltered USD 44 billion from taxation worldwide for the years 2009 to 2012 by implementing a tax structure where the transfer of economic rights of its intellectual property played a key role (Ting, 2014). In Australia, BHP has agreed to pay the Australian Taxation Office AUD 529 million over the transfer pricing issues involving its Singaporean marketing hub (Ker, 2018).
This article investigates whether and the extent to which Australian subsidiaries of foreign MNEs (ASFMs) engage in cross-border profit shifting to avoid Australian corporate income tax, focusing on two main tax avoidance strategies: intra-group transfer pricing and thin capitalisation. Intra-group transfer pricing refers to the manipulation of ‘the monetary value attaching to goods, services and intangibles traded between units of the same group which cross national boundaries’ (Elliott & Emmanuel, 2000, p. 216), so that higher profits are recorded in countries with lower tax rates.1 Thin capitalisation refers to ‘thinly capitalise foreign affiliates in high-tax countries and rely instead to an excessive extent on debt financing’ (Merlo & Wamser, 2014, p. 27). It is an indirect way of profit shifting as companies in high-tax jurisdictions can borrow from related parties in low-tax jurisdictions which results in higher interest expenses (on the intra-group debts) hence lower profits booked in high-tax jurisdictions.
Ideally, tax-motivated cross-border profit shifting would best be revealed by examining subsidiary-level financial and tax data, or intra-group trade data, which are not available to most researchers.2 Nevertheless, since this article looks at cross-border profit shifting in Australia which operates a dividend imputation system that has a corporate tax avoidance-reducing effect for domestically-owned listed Australian companies (DOLACs), an alternative approach is developed: comparing ASFMs with DOLACs on cross-border profit shifting indicators.
Specifically, prior studies such as Amiram, Bauer and Frank (2019), Ikin and Tran (2013), Li and Tran (2019), and Wilkinson, Cahan and Jones (2001), have provided evidence for the corporate tax avoidance-reducing effect of the dividend imputation system. In the Australian context, the dividend imputation system allows Australian listed companies to pass their domestic corporate income tax to Australian shareholders in the form of franking credits attached to dividend distributions. Australian
1 The transfer price per se is ‘the price an organization must charge or pay to transfer goods from one subsidiary or internal branch to another segment of the same organization’ (Barnhouse, Booth & Wester 2012, p. 2). 2 The group-level financial information of many MNEs is available. However, all intra-group transactions are eliminated upon consolidation, rendering detailed subsidiary-level data unrevealed.
eJournal of Tax Research An empirical study on cross-border profit shifting in Australia
195
shareholders can claim the franking credits received as a tax offset against their personal income tax. As such, for Australian shareholders, Australian corporate income tax does not reduce the after-tax returns on their investment in the companies. Foreign shareholders, however, cannot claim the franking credit tax offset in either Australia or their countries of residence, and therefore view Australian corporate tax as a real cost.3 In line with this argument, Li and Tran (2019) reveal that among Australian listed companies, those with higher foreign ownership engage in greater tax avoidance than do those with lower foreign ownership.
Based on the findings in prior studies, this article treats DOLACs as the benchmark companies which do not have strong incentives to engage in Australian corporate tax avoidance by means such as shifting profits out of Australia. By contrast, ASFMs, due to their foreign shareholdings and the relatively high corporate tax rate in Australia,4 are hypothesised to engage in Australian tax avoidance by shifting profits to foreign low-tax jurisdictions where their affiliates operate. More specifically, if ASFMs employ intra-group transfer pricing to shift out profits, they would have reduced gross profit margins and operating profit margins due to the inflated costs of purchases of goods and services or depressed selling prices for intra-group transactions. Likewise, if ASFMs are structured to be thinly capitalised to claim a high level of tax deductions for interest expenses, one would observe substantial interest expenses and relatively high leverage ratios for ASFMs. If by engaging in either intra-group transfer pricing or thin capitalisation, or both, ASFMs effectively shift profits out of Australia, then they would have lowered pre-tax profits as well as lowered income tax expenses.
To compare ASFMs with DOLACs on their cross-border profit shifting, paired sample t-tests are performed around six financial ratios which are designed to capture intra-group transfer pricing, thin capitalisation, and the effectiveness of the two profit shifting methods to avoid tax. The results show that compared to the matched DOLACs, ASFMs have lower gross profit to sale revenue ratios and lower earnings before interest and tax (EBIT) to sales revenue ratios, which implies that they engage in intra-group transfer pricing activities. ASFMs have higher interest expense to sales revenue ratios yet similar leverage ratios, which indicates that they may pay higher interest rates on intra-group debts to claim more tax deductions. ASFMs also have lower pre-tax profit to sales
3 If foreign shareholders receive franked dividends from Australian companies, no further Australian withholding tax on the dividend income is payable. However, in their countries of residence, foreign portfolio shareholders (those with shareholding of less than 10% of the issued equity shares of the Australian company) are liable to pay income tax on the dividend income, and they cannot claim the franking credits received as tax offsets. Therefore, from their perspective, the underlying corporate profits from which dividends are paid out are subject to double taxation: once in Australia in the form of corporate income tax, and again in the shareholders’ countries of residence in the form of personal income tax. For a foreign non-portfolio investor (with shareholding of at least 10% of the voting power in the dividend-distributing company) such as the parent company of an ASFM, foreign tax on the non-portfolio dividends is likely to be exempt or can be deferred indefinitely, depending on the tax system that the foreign investor’s home country adopts. If the country adopts a territorial tax system, then the non-portfolio dividends are likely to be exempt from income tax (similar to Subdivision 768-A of the Income Tax Assessment Act 1997 in Australia). If the country adopts a worldwide tax system (such as the US before the recent tax reform), then the investor’s home country income tax in excess of foreign tax credit, if any, can be deferred indefinitely as long as the Australian subsidiary does not pay dividends. In both cases, the more Australian corporate income tax the ASFM can avoid, the higher the after-tax returns from the ASFM will be. In sum, for foreign shareholders (portfolio or non-portfolio), Australian corporate income tax reduces their after-tax returns, and franking credits are of no value. 4 KPMG (2016) provides a list of corporate tax rates around the world. The Australian corporate tax rate (30%) is higher than the OECD average and the average of the European Union (EU).
eJournal of Tax Research An empirical study on cross-border profit shifting in Australia
196
revenue ratios and lower income tax expense to sales revenue ratios, which suggests that they effectively shift profits out of Australia and lowered their Australian tax liabilities.
Multivariate regression analyses are also performed. The six financial measures of intra-group transfer pricing, thin capitalisation and the effectiveness of the two profit shifting methods are regressed on an ASFM indicator along with control variables. The results are consistent with the findings from the paired sample t-tests.
The article contributes to the literature on tax-induced cross-border profit shifting as well as dividend imputation systems. It shows, in an alternative way in the absence of intra-group trade data, that ASFMs engage in cross-border profit shifting to a greater extent than do comparable DOLACs, and hence also provides evidence of the impeding role of foreign ownership on the corporate tax avoidance-reducing effect of the dividend imputation system which has not been adequately examined in prior studies. The article also develops measures, using financial data and in accordance with the pertinent guidelines provided by the OECD to capture corporate tax avoidance via intra-group transfer and thin capitalisation.
The remainder of this article is organised as follows. Section 2 reviews the literature on tax-induced intra-group transfer pricing and thin capitalisation. Hypotheses are developed based on the discussion. Section 3 explains the sample selection and introduces the propensity score matching technique employed to construct the matched samples. Results from the paired sample t-tests and the multivariate regression analyses are presented in section 4. Section 5 provides a robustness check. Lastly, section 6 summarises and concludes the article.
2. LITERATURE REVIEW AND HYPOTHESES DEVELOPMENT
MNEs typically engage in corporate tax avoidance via cross-border profit shifting to exploit the differences in tax laws and tax rates across jurisdictions. This article focuses on two main cross-border profit shifting practices as suggested in the literature and government reports, namely, intra-group transfer pricing and thin capitalisation.
2.1 Intra-group transfer pricing
Intra-group transfer pricing refers to the prices charged on the flow of goods and services between members of an MNE that operate in different countries with different tax rates. It provides a means for MNEs to shift profits from high-tax countries (such as Australia) to low-tax countries to take advantage of the tax rate arbitrage.
Due to the lack of subsidiary-level financial and tax data and intra-group trade data, extant studies have mostly relied on examining the relationship between foreign subsidiaries’ profitability levels and the local tax rates to provide indirect evidence of tax-motivated intra-group transfer pricing. A negative relation between profitability and tax rates indicates profit shifting as greater profits are booked into low-tax jurisdictions and consequently the MNE group as a whole has reduced tax liability.
Early studies, based on aggregate country-level data, have documented a negative relation between foreign subsidiaries’ tax rates and their profitability levels (e.g., Grubert & Mutti, 1991; Hines & Rice, 1994). Recent firm-level studies have addressed whether and how the tax rate differentials among subsidiaries and between subsidiaries and their parent companies affect their respective profitability levels. For instance,
eJournal of Tax Research An empirical study on cross-border profit shifting in Australia
197
Dischinger (2007) reveals a negative relation between a subsidiary’s pre-tax profit and the statutory corporate tax rate differential of the subsidiary relative to its foreign parent. Further analysis shows that subsidiaries located in countries with high tax rates (relative to that of the parent company) shift out approximately three times more profits than do subsidiaries in low-tax countries (Dischinger, 2007). Similarly, Huizinga and Laeven (2008) also find supporting evidence for tax-induced profit shifting among foreign subsidiaries of European MNEs operating in the manufacturing industry.
In contrast to many cross-border profit shifting studies that focus on the negative relation between tax rate differential and subsidiaries’ profitability levels, Egger, Eggert and Winner (2010) investigate the extent to which foreign plant ownership involves lower tax payments than domestic plant ownership in Europe. They use the propensity score matching approach to match European manufacturing plants that are foreign-owned with those that are domestically-owned based on nine firm-level, region-level, industry-level, and region-industry-level characteristics that are expected to affect the probability of a plant being foreign-owned.5 The matching approach helps to eliminate the self-selection bias (into foreign ownership) which may confound the result when comparing the tax payments of foreign-owned versus domestically-owned plants. With a series of t-tests based on the matched sample, Egger et al. (2010) provide supporting evidence for MNEs’ tax-induced profit shifting: in low-tax countries, foreign-owned plants make substantially greater profits than do their domestic counterparts; on the contrary, in high-tax countries, they earn significantly lower profits than do comparable domestic counterparts.
A few studies, using intra-group trade data, have provided more direct supporting evidence for tax-induced intra-group transfer pricing of MNEs. For instance, based on monthly intra-firm trade prices (both export and import) of MNEs with either subsidiaries or parent companies located in the US, Clausing (2003) reports a strong relation between the trade countries’ tax rates and the prices charged on the intra-group transactions: when the tax rate of the trade country decreases, the US intra-group export (import) prices become lower (higher) relative to non-intra-group trade prices. Also using the US data, Bernard, Jensen and Schott (2006) match, for each firm, the arm’s length transaction price for a particular product with the average of the firm’s exporting prices to related parties, on a destination country-month-transport mode basis. They find that the US export prices for related parties are lower than those for arm’s length customers, and the price discrepancy is larger when the destination country has a lower tax rate and higher import tariffs (Bernard et al., 2006).6
In the Australian context, given the relatively high corporate tax rate, ASFMs would have strong incentives to shift profits out of Australia to foreign low-tax countries via intra-group transfer pricing. The intra-group transfer pricing arrangements can take the form of supplying goods and services to related parties (other members within the MNE group) at depressed transfer prices, or by purchasing goods and services (including patented technologies) from related parties at inflated transfer prices. As a consequence,
5 The nine firm-level, region-level, industry-level, and region-industry-level characteristics are firm age, number of plants in the same region and industry, ratio of MNEs to all firms in the same region and industry, number of employees in the same region, number of employees per firm in the same region and industry, annual labour costs in the same region, annual labour costs per employee in the same region and industry, material costs per firm in the same region and industry, and employees of the firm. 6 The US has a relatively high corporate tax rate compared to other countries in the world.
eJournal of Tax Research An empirical study on cross-border profit shifting in Australia
198
depending on the type of the goods and services that are transacted with related parties, ASFMs would have reduced gross profit margins and reduced operating profit margins.
In the absence of intra-firm trade data, this article proposes an alternative approach to reveal the intra-group transfer pricing engaged in by ASFMs to avoid Australian corporate income tax: comparing them against firms with similar operations but which are not motivated to engage in intra-group transfer pricing to avoid Australian tax. This article argues that DOLACs are the best available benchmarking firms for two reasons. First, as suggested in prior studies, DOLACs do not have strong incentives to avoid Australian tax because their Australian resident shareholders can enjoy franking credit tax offsets. In other words, for DOLACs, Australian corporate tax avoidance is arduous but fruitless: it requires substantial costs but may not proffer real tax savings. Thus, engaging in intra-group transfer pricing to shift profits out of Australia is not expected to be observed among DOLACs. Second, unlike ASFMs, DOLACs are the ultimate parent companies, which means on consolidation, intra-group transactions and balances are eliminated and DOLACs’ consolidated financial reports only reflect the results of transactions with external parties which are at arm’s length, instead of the results of any intra-group transfer pricing (except for the resultant tax expenses).
Based on the above discussion, this article compares gross profit margins and operating profit margins of ASFMs with those of DOLACs’ to detect tax-induced intra-group transfer pricing by ASFMs. If ASFMs engage in tax-induced intra-group transfer pricing to shift profits out of Australia, they would have lower gross profit margins (because of the lower sales revenue or higher cost of sales) and lower operating profit margins (because of the higher management and other fees paid) in comparison with those of DOLACs. Such comparison is also in line with the OECD transfer pricing guidelines to determine whether the transfer prices of intra-group transactions are at arm’s length.7 The following two hypotheses are developed:
H1A: ASFMs have lower gross profit to sales revenue ratios than do comparable DOLACs.
H1B: ASFMs have lower earnings before interest and tax (EBIT) to sales revenue ratios than do comparable DOLACs.
2.2 Thin capitalisation
Generally, thin capitalisation refers to the heavy use of debts, especially debts from related parties, rather than equity, as a source of finance. In the context of cross-border tax avoidance, thin capitalisation can be viewed as shifting debts to subsidiaries located in high-tax countries (e.g., Australia) so that a high level of tax deduction for interest
7 To deal with tax avoidance via intra-group transfer pricing, the OECD identifies five methods to determine the ‘arm’s length’ transfer prices of intra-group transactions within MNEs. Three of the five methods determine the ‘arm’s length’ transfer prices by referring to the gross profit margins or the operating profit margins achieved in similar transactions between independent parties. The other two methods require detailed corporate internal data. One of these two methods determines the ‘arm’s length’ transfer prices of intra-group transactions by referring to the prices charged for similar goods or services in a comparable transaction but between independent parties. The other requires the calculation of the total profit generated by the two related parties and a split of the total profit between the two parties based on an appropriate splitting percentage.
eJournal of Tax Research An empirical study on cross-border profit shifting in Australia
199
expense can be claimed, resulting in subsidiaries in high-tax countries being highly geared.
Prior studies have documented MNEs’ use of thin capitalisation for tax avoidance. For instance, Mills and Newberry (2004) find that among US subsidiaries of foreign MNEs, those being part of foreign MNEs with lower average foreign tax rates (i.e., the US tax rate is relatively high) report lower taxable income and have higher leverage ratios and interest expense to sales ratios. Desai, Foley and Hines (2004) document a positive relation between leverage levels and local tax rates for foreign subsidiaries of US MNEs: a 10% higher local tax rate is associated with 2.8% higher leverage ratios. Huizinga, Laeven and Nicodeme (2008) show that an MNE’s foreign subsidiaries’ capital structures are affected by both the local tax rates and the tax rate differentials across countries where the parent company and other foreign subsidiaries within the group operate. For example, for an MNE with two subsidiaries in two countries, a 10% overall tax rate increase in one country would result in an increase of 2.4% in the leverage ratio in that country but a decrease of 0.6% in the leverage ratio in the other country; in contrast, for stand-alone domestic firms, a 10% increase in the overall tax rate would lead to 1.8% increase in the leverage ratio (Huizinga et al., 2008).
As with intra-group transfer pricing, due to the relatively high corporate tax rate in Australia and the restrictions on claiming the franking credit tax offset by foreign shareholders, ASFMs have incentives to adopt highly geared structures by means such as borrowing from related parties overseas and even at inflated interest rates to claim substantial interest expenses to reduce their Australian tax liabilities. By contrast, DOLACs do not have strong incentives for thin capitalisation. This is also consistent with the findings in a number of Australian studies, such as Twite (2001), which have observed declines in leverage ratios of listed companies after the introduction of the dividend imputation system in Australia. In addition, as explained in the discussion of intra-group transfer pricing in section 2.1 above, DOLACs’ consolidated financial reports only reflect the results of transactions with external parties. Thus, DOLACs can serve as a benchmark for the levels of debt and interest expense that Australian companies without tax-induced thin capitalisation normally have. Comparing ASFMs with DOLACs on their interest expenses and leverage ratios can help infer ASFMs’ use of thin capitalisation. In fact, the level of interest expense and level of debt, as relative measures, have been suggested or used by countries in formulating thin capitalisation rules.8
Following the discussion above, it is hypothesised that ASFMs employ thin capitalisation to increase their tax deductions for interest expenses. Their inflated interest expenses and highly geared structures would be manifested in higher interest expense to sales revenue ratios and higher leverage ratios in comparison with those of DOLACs. Thus, the following two hypotheses are developed:
8 The OECD (2012) recognised two primary approaches by which thin capitalisation rules in various countries normally operated: (1) determining a maximum amount of debt on which interest payments can be claimed as tax deductions, and (2) determining a maximum amount of interest that is deductible by referring to interest ratios such as interest to operating profit or cash flow. In 2015, the OECD released the BEPS Project Recommendation on Action Item 4 which suggested a fixed ratio approach to replace the previous thin capitalisation rules. Under the newly recommended approach, interest payments will not be deductible for tax purpose if the ratio of net interest expense to EBITDA (earnings before interest, tax, depreciation and amortisation) exceeds a certain threshold in the range of 10% to 30% (OECD, 2015b).
eJournal of Tax Research An empirical study on cross-border profit shifting in Australia
200
H2A: ASFMs have higher interest expense to sales revenue ratios than do comparable DOLACs.
H2B: ASFMs have higher leverage ratios (long-term borrowings to total assets) than do comparable DOLACs.
2.3 Effectiveness of ASFMs’ tax avoidance arrangements
Cross-border tax avoidance via intra-group transfer pricing and thin capitalisation cannot be captured by conventional tax avoidance measures such as the effective tax rate, because the arrangements result in simultaneous reductions in tax expense, pre-tax accounting profit and taxable income.
Regardless of the choice between intra-group transfer pricing and thin capitalisation, tax-induced cross-border profit shifting results in reduced profit (taxable income) and tax liability. To complement the analyses above, this article examines the extent to which ASFMs successfully shift profits out of Australia and hence enjoy a reduced Australian tax burden.
In line with the argument provided in the previous sections, DOLACs serve as the benchmark because they do not have strong incentives to engage in Australian tax avoidance and their consolidated financial figures (other than tax expense) reflect the results of transactions with external third parties. For tax expense, DOLACs’ tax expense may comprise both Australian income tax and foreign income tax. Though Australian corporate income tax paid can be passed to shareholders as franking credits and hence does not reduce shareholders’ after-tax returns, foreign income tax cannot. Thus, DOLACs may seek foreign tax avoidance by engaging in tax avoidance arrangements in the foreign countries where they have operations, or by shifting foreign profits to Australia as the resultant Australian tax can be passed to shareholders as franking credits and hence does not reduce shareholders’ after-tax returns. In comparison, the second approach is more appealing as it not only reduces foreign taxes but also enhances franking credit availability which would enable the distribution of franked dividends as preferred by the Australian capital market.9 Such approach makes the tax expenses of DOLACs with foreign operations similar to those without foreign operations. Therefore, arguably, DOLACs’ tax expenses reflect the level of tax expenses of Australian companies without extensively engaging in corporate tax avoidance (domestic or foreign), and therefore can serve as the benchmark.
If ASFMs engage in intra-group transfer pricing, or thin capitalisation, or both, to effectively shift profits out of Australia, it is expected that they have lower pre-tax accounting profits and lower income tax expenses, relative to sales revenues, than those of DOLACs, leading to the following two hypotheses:
H3A: ASFMs have lower pre-tax accounting profit to sales revenue ratios than do comparable DOLACs.
9 Bellamy (1994) finds that the dividend paid per share was higher for companies distributing franked dividends than for companies distributing unfranked dividends. Pattenden and Twite (2008) argue for a tax-induced preference for franked dividends. The Australian Taxation Office (2015) documents increased franked dividend distributions since the introduction of the dividend imputation system.
eJournal of Tax Research An empirical study on cross-border profit shifting in Australia
201
H3B: ASFMs have lower income tax expense to sales revenue ratios than do comparable DOLACs.
3. RESEARCH DESIGN
3.1 Data collection and calculation
To test the hypotheses developed in section 2, ASFMs are compared with DOLACs in terms of the six ratios capturing intra-group transfer pricing, thin capitalisation and the effectiveness of these two methods in shifting profits out of Australia to reduce income tax liabilities (hereafter referred to as the outcome ratios).10 The six outcome ratios are defined and calculated as shown in the following six equations:
GrossProfitRatio
(1)
EBITRatio-
(2)
InterestExpenseRatio
(3)
Leverage-
(4)
Pre-TaxProfitRatio -
(5)
IncomeTaxExpenseRatio
(6)
The Gross Profit Ratio and the EBIT Ratio capture the outcome of engaging in intra-group transfer pricing. The Interest Expense Ratio and the Leverage capture the outcome of using thin capitalisation. The Pre-Tax Profit Ratio and the Income Tax Expense Ratio measure the extent to which profits are shifted out of Australia and the extent to which Australian tax liabilities are reduced, respectively.
To calculate the above ratios, financial data are hand-collected from annual reports, including notes to financial statements. ASFMs’ annual reports are purchased from the Australian Securities and Investments Commission (ASIC).11 DOLACs’ annual reports
10 This article does not intend to examine the specific arrangements used in practice to achieve cross-border profit shifting for tax avoidance, such as whether or how an ASFM purchases goods from overseas related parties at prices higher than an arm’s length range. Such examination requires internal and often confidential data which are not available to outside researchers. In the absence of intra-group transaction data, tax-induced profit shifting behaviour can only be detected by comparing the financial ratios of ASFMs with comparable DOLACs as a control group (comparable in terms of industry, firm size and capital intensity) to detect cross-border profit shifting. The ultimate parent’s financial reports do not help to investigate cross-border profit shifting because intra-group transactions are eliminated upon consolidation. In other words, the financial reports of the ultimate parent only show the results of the group as a whole from transactions with outside parties, not the transactions within the group. 11 ASFMs are not listed on the Australian Securities Exchange (ASX) and therefore are not required to make their annual reports publicly available free of charge. Nevertheless, in accordance with Chapter 2M of the Corporations Act 2001, all large proprietary companies and small proprietary companies that are
eJournal of Tax Research An empirical study on cross-border profit shifting in Australia
202
are obtained from commercial database DatAnalysis Premium. Pre-tax accounting profit does not include the share of associates’ profit or loss which is an after-tax figure. Income tax expense does not include royalty-related taxation and resource rent tax.12 Since some ASFMs present their financial data in thousands of dollars, for consistency, all financial data are collected in thousands of dollars.
3.2 Sample selection
3.2.1 Initial sample
The sample year is 2012. Because of the significant cost of purchasing annual reports of ASFMs from the ASIC, the sample year and sample size are subject to resource constraints. Moreover, 2012 is the last year to study cross-border profit shifting without the impact of the highly publicised Base Erosion and Profit Shifting (BEPS) Project of the OECD and the related amendments to the Australian tax legislation (including the transfer pricing rules effective from 2013) which are expected to reduce international tax avoidance.
To draw a sample of ASFMs, a list of Australia’s top 2,000 companies in the year 2012 is obtained from IBISWorld; the description of each of the companies available on the IBISWorld website is then examined.13 Companies which are described as ‘subsidiaries’ of foreign MNEs or ‘wholly foreign-owned’ are classified as ASFMs. Additional efforts are made to identify companies with names appearing to associate with foreign MNEs but whose foreign ownership cannot be confirmed by screening the information from IBISWorld.14 Financial companies,15 companies with operations in countries other than Australia and New Zealand,16 and companies without 2012 financial information are excluded. The above selection procedure results in 319 ASFMs for which annual reports
foreign-controlled (with some exceptions) are required to lodge financial reports with ASIC. Their annual reports can be purchased from ASIC at a cost of AUD 38 each. 12 Royalty-related taxation and resource rent tax are levied based on the mining production output. Thus, they do not change in proportion to profit and are better regarded as part of cost of goods sold than as income tax. 13 The list includes public companies (both listed and non-listed), large proprietary companies, foreign-owned companies, trusts (e.g., large superannuation funds), as well as public sector and not-for-profit entities (e.g., universities and charitable organisations). Focusing on the top 2,000 companies increases the chance of finding foreign-owned companies which tend to be large in size and hence have annual reports available from ASIC. 14 For instance, the foreign ownership of some Australian companies is confirmed by examining the list of subsidiaries of their foreign parents. The list can usually be found in the foreign parents’ annual reports, or, for US MNEs, in the files lodged to the Securities and Exchange Commission. 15 ASFMs in the financial industry (e.g., subsidiaries of foreign banks) are excluded because they are subject to prudential regulations and special thin capitalisation rules, so their operations and financial structures are different from other companies. 16 The exclusion of foreign-owned companies with operations in countries other than Australia and New Zealand is to ensure that the foreign-owned companies to be included in the ASFMs sample are not affected by other foreign tax rates or tax systems. For example, if an Australian subsidiary of a foreign MNE has subsidiaries in Singapore (Singaporean corporate tax has been 17% since 2010), then its financial statement would reflect both the Australian operation and the Singaporean operation. Further, its intra-group transactions with the Singaporean operating part (other than the resultant tax expense) are not reflected in its financial reports. New Zealand is not treated as a foreign country for three reasons. First, the Australian and New Zealand governments have extended their dividend imputation systems to include companies residing in the other country under the trans-Tasman triangular imputation rules. Second, many foreign MNEs set up subsidiaries in Australia which are responsible for both Australian and New Zealand markets. Third, the corporate tax rate in New Zealand has been 28% since 2011, similar to the Australian rate of 30%.
eJournal of Tax Research An empirical study on cross-border profit shifting in Australia
203
are purchased from the ASIC. In addition, for each of the ASFMs, the parent company information in their annual reports is also examined to ensure that the ASFM is not a subsidiary of another ASFM included in the sample. In cases where an ASFM has a few subsidiaries in Australia, the financial data of the Australian consolidated group is collected.
The sample of DOLACs is based on companies listed on the Australian Securities Exchange (ASX) for the year 2012. Foreign companies, financial companies, trusts and stapled securities are first excluded.17 The top 500 companies, ranked by sales revenue, are then taken, with the aim of better matching between ASFMs and DOLACs in term of firm size because ASFMs in the sample are generally large in size. Sales revenue, rather than total assets, is used as the ranking base because ranking based on total assets may result in a large number of mining firms with substantial assets to be included in the sample albeit they are still at their start-up stage and do not have significant operating revenue or profit. To ensure that the companies selected as DOLACs have predominantly domestic ownership, those with more than 20% foreign ownership among the top 20 shareholders are excluded.18 The 20% threshold is employed to maintain a reasonably large sample size. In total, 423 companies are included in the DOLACs sample. Table 1 shows how the samples of ASFMs and DOLACs are derived.
3.2.2 Six sub-samples
Six sub-samples corresponding to the six outcome ratios are extracted from the initial sample described above, and are used to test the six hypotheses. In each of the six sub-samples, companies with the corresponding outcome ratio greater than 1 or less than 0 are excluded. For example, in the Gross Profit Ratio sub-sample which is used to test H1A, ASFMs and DOLACs with Gross Profit Ratio greater than 1 or less than 0 are excluded. This is to ensure that the results are not dominated by extreme values. Thus, the size of each sub-sample varies, depending on the number of observations with extreme values.
The sizes and compositions (ASFMs and DOLACs) of the six sub-samples are summarised in Table 2.
17 The ASX identifies 95 foreign incorporated entities quoted on ASX in June 2012. Foreign companies are excluded because the Australian dividend imputation system does not apply to them. Financial companies are excluded because they are subject to special regulations and special disclosure requirements, so some of the required data items in this study are not available for financial companies. Trust funds and trusts in stapled securities are excluded because they are ‘pass-through’ entities for tax purposes. 18 Foreign ownership among the top 20 shareholders (i.e., the percentage of foreign shareholding divided by the total percentage of the top 20 shareholdings) is estimated based on the top 20 shareholders information extracted from annual reports and by referring to the Osiris database which shows the nationality of some of the top 20 shareholders. Additional efforts are made to search for the shareholders (mainly corporate shareholders) from some credible websites such as Bloomberg and ASIC Connect to identity their nationalities. Foreign ownership is estimated as the ratio of the percentage of foreign shareholdings to the total percentage of the top 20 shareholders. New Zealand shareholders are not treated as foreign because the Australian and New Zealand governments have extended their dividend imputation systems to include companies residing in the other country under the trans-Tasman triangular imputation rules. In total, 74 companies with foreign ownership being greater than 20% are excluded (including two dual-listed companies: BHP Billiton and Rio Tinto). Three companies with no top 20 shareholder information are also excluded.
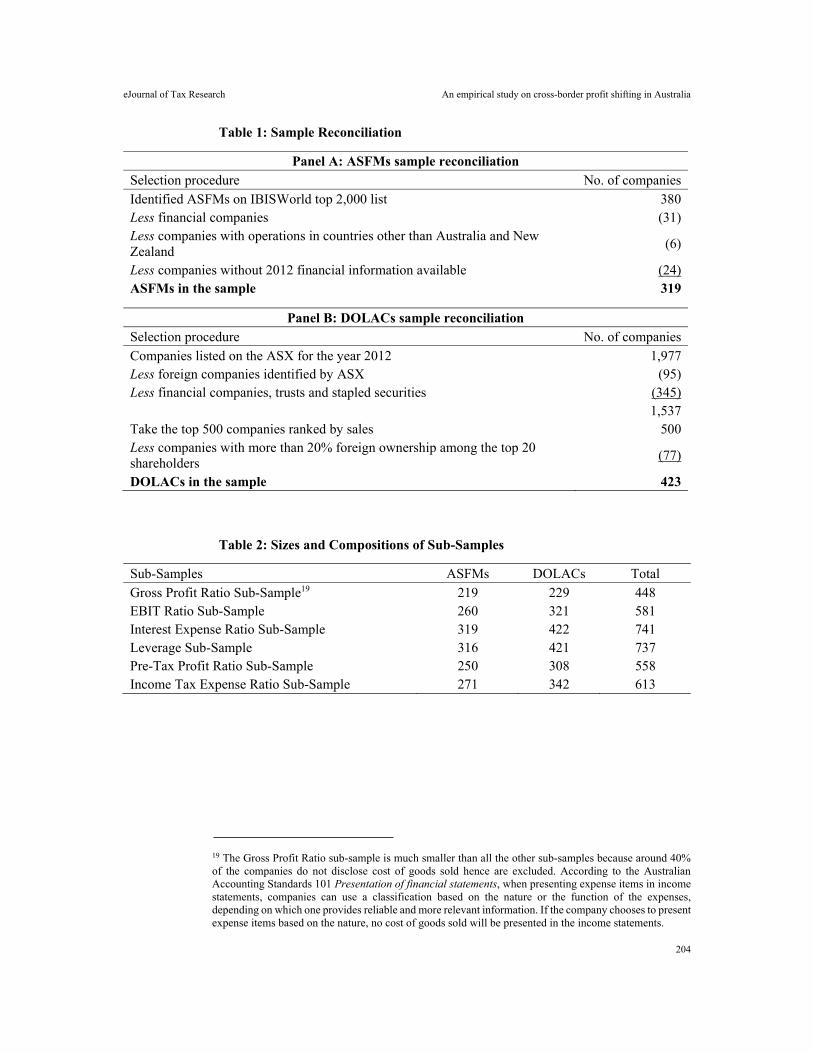
eJournal of Tax Research An empirical study on cross-border profit shifting in Australia
204
Table 1: Sample Reconciliation
Panel A: ASFMs sample reconciliation Selection procedure No. of companies Identified ASFMs on IBISWorld top 2,000 list 380 Less financial companies (31) Less companies with operations in countries other than Australia and New Zealand
(6)
Less companies without 2012 financial information available (24) ASFMs in the sample 319
Panel B: DOLACs sample reconciliation Selection procedure No. of companies Companies listed on the ASX for the year 2012 1,977 Less foreign companies identified by ASX (95) Less financial companies, trusts and stapled securities (345) 1,537 Take the top 500 companies ranked by sales 500 Less companies with more than 20% foreign ownership among the top 20 shareholders
(77)
DOLACs in the sample 423
Table 2: Sizes and Compositions of Sub-Samples
Sub-Samples ASFMs DOLACs Total Gross Profit Ratio Sub-Sample19 219 229 448 EBIT Ratio Sub-Sample 260 321 581 Interest Expense Ratio Sub-Sample 319 422 741 Leverage Sub-Sample 316 421 737 Pre-Tax Profit Ratio Sub-Sample 250 308 558 Income Tax Expense Ratio Sub-Sample 271 342 613
19 The Gross Profit Ratio sub-sample is much smaller than all the other sub-samples because around 40% of the companies do not disclose cost of goods sold hence are excluded. According to the Australian Accounting Standards 101 Presentation of financial statements, when presenting expense items in income statements, companies can use a classification based on the nature or the function of the expenses, depending on which one provides reliable and more relevant information. If the company chooses to present expense items based on the nature, no cost of goods sold will be presented in the income statements.
eJournal of Tax Research An empirical study on cross-border profit shifting in Australia
205
3.3 Propensity score matching
Extant studies such as Girma and Görg (2007) and Chari, Chen and Dominguez (2012) have suggested the endogeneity of foreign ownership of companies. This means there are some systematic differences between foreign-owned and domestically-owned companies. Therefore, neither simple t-tests on the six outcome ratios, nor regressions of the six outcome ratios on an ASFM indicator along with control variables, is an appropriate approach to examine whether ASFMs engage in intra-group transfer pricing and thin capitalisation to shift profits out of Australia to reduce their Australian tax liabilities.
To address the endogeneity issue, this article employs the propensity score matching technique, as developed by Rosenbaum and Rubin (1983), to construct a ‘matched’ or ‘paired’ sample of ASFMs and DOLACs.
In the context of the current study, propensity score is the predicted probability of a company in the sub-samples being an ASFM conditional on the baseline covariates or explanatory variables which are expected to affect the pertinent outcome variable but may or may not influence the foreign ownership of the company.20 Among the six outcome ratios, Gross Profit Ratio, EBIT Ratio, and Pre-Tax Profit Ratio are profitability measures; Income Tax Expense Ratio captures corporate tax avoidance or tax liability; and Interest Expense Ratio and Leverage reflect corporate capital structure. Prior studies have commonly suggested firm size and industry affiliation to be determinants of profitability, tax avoidance, and capital structure (e.g., Goddard, Tavakoli & Wilson, 2005; Porter, 1980; Titman & Wessels, 1988).21 In addition, capital intensity or tangibility has also been found to be a significant determinant of corporate capital structure, especially in Australia (e.g., Deesomsak, Paudyal & Pescetto, 2004; Fan, Titman & Twite, 2012).22 Interestingly, firm size and industry affiliation are also foreign ownership influential factors. Egger et al. (2010) and Chari et al. (2012) argue that large companies and companies in certain industries are more likely to be foreign-owned.
Based on the above discussion, for each of the sub-samples of Gross Profit Ratio, EBIT Ratio, Pre-Tax Profit Ratio and Income Tax Expense Ratio, firm size and industry
20 In selecting the appropriate baseline covariates or explanatory variables for the matching model, no consensus has been achieved among empirical researchers (Austin, 2011). However, Austin, Grootendorst and Anderson (2007) show that when only the potential confounders (explanatory variables affecting the outcome variable) or the true confounders (explanatory variables affecting both the treatment assignment and the outcome variable) are included in the model so that it is balanced between the treated and untreated subjects, the imbalanced variables would be those affecting the treatment assignment but not the outcome. Moreover, including either of the two confounders in the matching model would generate relatively precise estimation of the treatment effect without introducing additional bias. Brookhart et al. (2006) argue that including variables affecting the treatment only but not the outcome variable would result in increased variance of the treatment effect estimation but not reduced bias. Thus, including explanatory variables that influence the outcome variable and/or the treatment assignment at the same time appears to be appropriate. 21 Other profitability determinants such as R&D expenditure and marketing or advertising expenditure are not employed as the explanatory variables because ASFMs, as subsidiaries of foreign MNEs, may not incur these expenditures themselves but rely on the group with regards to product innovation, brand name establishment or advertising campaign. Moreover, the financial statements of ASFMs do not disclose as much detailed information as that of DOLACs. For ASFMs, some expenditure items are not separately disclosed. 22 Other capital structure determinants are capital market-based, such as growth opportunities and share price performance. They are not available for ASFMs because ASFMs are not listed on the ASX.
eJournal of Tax Research An empirical study on cross-border profit shifting in Australia
206
dummy variables are employed as the explanatory variables; whilst for each of the sub-samples of Interest Expense Ratio and Leverage, in addition to firm size and industry dummy variables, capital intensity is also incorporated as an explanatory variable. The propensity score for each of the sample companies are estimated using the following two logit models:
ASFM α β SIZE β - IND ε (7)
ASFM α β SIZE β CAPINT β - IND ε (8)
Where for firm i,
ASFM: ASFM indicator, taking the value of 1 if the company is an ASFM, and 0 otherwise;
SIZE: firm size, measured by the natural logarithm of sales revenue;23
CAPINT: capital intensity, measured by non-current assets divided by total assets;
IND: industry dummy variables, created based on four-digit Global Industry Classification Standards (GICS) codes;24
ɛ: regression error term.
The logit regression results from Equation (7) and Equation (8) are presented in Table 3 (pages 216 to 218). Note that due to matching on industry dummy variables, a few industries are excluded due to lack of observations in the opposite group in the same industry.
From the two logit models, propensity scores are estimated for each of the companies in the six sub-samples. Within each sub-sample, each ASFM is then matched with a DOLAC, without replacement, which has the closest estimated propensity score within a maximum distance which is also known as the caliper. The caliper is initially determined as 25% of the standard deviation of the propensity scores, truncated to two-decimal places without rounding (Guo & Fraser, 2015), then reduced in hundredths till reaching a balanced sample of ASFMs and DOLACs, i.e., ASFMs are not significantly
23 In comparison with other common firm size measures such as total assets, market capitalisation, and employee numbers, sales revenue is considered as the most appropriate proxy for firm size. Total assets cannot capture the operating scales of ASFMs, especially those with electronic commerce and those whose products are sold by themselves as well as by other companies. Consider Apple Pty Ltd which is the Australian subsidiary of Apple Inc. as an example. The company not only has its own retailing stores in Australian metropolitan cities, but also sells by wholesale or distributes its products to other consumer electronic stores such as JB Hi-Fi. Market capitalisation cannot be used as the firm size measure in this study because ASFMs are not listed on the ASX. Employee number is not disclosed by every company and may include the number of contractors who may have a number of employees and subcontractors not included in the number disclosed. 24 For DOLACs, their four-digit GICS codes are readily available from the commercial database DatAnalysis Premium. However, for ASFMs, their industry classification is not readily available and therefore needs to be coded manually based on the principal activity information disclosed in their annual reports. There are 20 industries in total where the sample companies operate. Thus, 19 industry dummy variables are created. The base industry is Energy, with GICS code being 1010.
eJournal of Tax Research An empirical study on cross-border profit shifting in Australia
207
different from DOLACs on the explanatory variables at the 10% level.25 If the caliper is reduced to 0.01 and a balanced sample is not reached, then the caliper is further reduced in thousandths. Imposing a caliper has been proposed as one of the best ways to reduce possible poor matches and to enhance balance in the explanatory variables (Shipman, Swanquist & Whited, 2017).
4. RESULTS AND DISCUSSION
4.1 Descriptive statistics and paired sample t-tests
Table 4 (pages 219 to 226) shows the descriptive statistics for the six sub-samples before and after matching, and t-tests serve as balancing tests for the matching. Paired sample t-tests are used to test the differences between the matched ASFMs and DOLACs on the six outcome ratios, with t-statistics reported in brackets. It is observed that before matching, ASFMs have lower outcome ratios than DOLACs at the 1% level, except Interest Expense Ratio for which the difference is only significant at the 10% level. There are some significant differences between ASFMs and DOLACs in terms of firm size, industry affiliation, and capital intensity before matching. In all of the six sub-samples, before matching, ASFMs are on average larger than DOLACs. For the Interest Expense Ratio sub-sample and the Leverage sub-sample, before matching, ASFMs are on average less capital intensive than DOLACs.
After matching, no significant difference exists among the explanatory variables (including industry dummy variables), indicating that the matching procedure effectively reduces the systematic differences between ASFMs and DOLACs, and the resultant ASFMs are reasonably comparable to DOLACs in each of the six sub-samples.
With regard to the outcome variables, ASFMs are still significantly different from DOLACs in most of the outcome ratios after matching. Specifically, ASFMs have lower Gross Profit Ratio and lower EBIT Ratio than do comparable DOLACs (0.263 versus 0.374, and 0.095 versus 0.142, respectively) and the differences are significant at the 1% level, consistent with H1A and H1B. The results suggest that for every one dollar of sales revenue, ASFMs generate 11.1 cents lower gross profits and 4.7 cents lower EBITs than do comparable DOLACs, which is indicative of ASFMs’ being charged inflated prices for the goods or services purchased (greater costs of goods sold and greater expenses such as management and other service fees), or charging depressed prices on the goods sold. Thus, it can be inferred that ASFMs engage in intra-group transfer pricing to shift profits out of Australia to avoid Australian tax.26
Regarding thin capitalisation, ASFMs have higher Interest Expense Ratio than do comparable DOLACs (0.029 versus 0.017) and the difference is significant at the 5%
25 For example, if the standard deviation of the estimated propensity score is 0.1895, then the initial caliper is calculated as 25% × 0.1895, truncated to 0.04. Since different sub-samples have different propensity scores and hence standard deviations of propensity scores, the imposed caliper varies across samples. The specific calipers are shown in Table 3 for each of the sub-samples. Attempts have been made to use calipers which are smaller than 0.25 of the standard deviations of the estimated propensity scores. The results are similar to those reported in Table 3. 26 It is unlikely that the found lower Gross Profit Ratio and lower EBIT Ratio of ASFMs can be attributable to their inefficient operations in Australia for reasons such as being unfamiliar with the local conditions. ASFMs are subsidiaries of foreign MNEs which are well-established and lucrative in the global market. Thus, ASFMs should have ample resources to compete against Australian domestic businesses.
eJournal of Tax Research An empirical study on cross-border profit shifting in Australia
208
level, consistent with H2A. However, on average, ASFMs have Leverage of 0.111 which is higher than that of comparable DOLACs, 0.098, but the difference is not statistically significant. The two findings together suggest that in comparison with DOLACs, ASFMs incur higher interest expenses for every one dollar of sales revenue generated, but they do not borrow more long-term debts to finance assets. The higher interest expenses but similar long-term debt levels indicate that ASFMs may pay higher interest rates than do comparable DOLACs, which is consistent with tax-induced debt shifting to allow subsidiaries in high-tax countries to claim more tax deductions for interest expenses. In this case, the lender is likely to be a related party operating in a low-tax country so that the higher interest revenue is taxed at a low rate and the group as a whole achieves tax savings.
In fact, the similar levels of Leverage of ASFMs and DOLACs may be partially due to the strong cash positions of ASFMs. As subsidiaries of foreign MNEs, ASFMs may have strong incentives to keep their after-tax profits in the host country (Australia) instead of sending them back to the parent companies. With a substantial amount of cash especially in the case of distributors, debt financing may not be needed. Consider an Australian subsidiary of a US MNE as an example. The US adopted the worldwide approach to tax foreign profits in the sample year. Under the approach, the operating profit of a foreign subsidiary was subject to foreign income tax only unless and until it was repatriated, usually in the form of dividend payment. Upon profit repatriation, US income tax liability on the foreign profit was incurred, which was generally the difference between the US income tax payable as if the profit were sourced in the US and the foreign tax credit for the foreign tax paid. Therefore, the US income tax on the foreign profit can be indefinitely deferred if the foreign subsidiary did not repatriate profit to its US parent company. Consequently, US MNEs had incentives to retain their foreign subsidiaries’ profits overseas. In fact, it has been reported that the majority of the over USD 2 trillion cash held by US MNEs are held by their foreign subsidiaries (Casselman & Lahart, 2011). Foley et al. (2007) suggest that the high levels of US MNEs’ foreign cash holdings could be partially attributable to the US repatriation tax rules. For example, Apple Pty Ltd, the Australian subsidiary of Apple Inc., held more than AUD 363 million cash and cash equivalents by September 2012, which constituted approximately 40% (30%) of the company’s current assets (total assets).
Furthermore, as the Australian thin capitalisation rules specify debt limit but not the maximum interest expense that is deductible for tax purposes, adopting highly-geared structures may place ASFMs in a risky position to be challenged by the tax authority. In comparison, borrowing from related parties within the limit but with relatively high interest rate provides an alternative way to reduce ASFMs’ Australian tax liabilities.
In terms of the effectiveness of ASFMs’ Australian tax avoidance via intra-group transfer pricing and thin capitalisation, Table 4 shows that ASFMs have lower Pre-Tax Profit Ratio and lower Income Tax Expense Ratio than do comparable DOLACs (0.086 versus 0.137, and 0.025 versus 0.034, respectively), and the differences are significant at the 1% and 10% levels, respectively, supporting H3A and H3B. These figures suggest that for every one dollar of sales revenue, ASFMs book 5.1 cents lower pre-tax profits and incur 0.9 cent lower income tax expenses than do comparable DOLACs. The findings imply that ASFMs effectively shift profits out of Australia thereby reducing their Australian tax liabilities.
The 6.3% significance level (higher than the conventional 5%) for the difference between ASFMs and DOLACs in Income Tax Expense Ratio is possibly due to the
eJournal of Tax Research An empirical study on cross-border profit shifting in Australia
209
inclusion of DOLACs with up to 20% foreign ownership among the top 20 shareholders in the sample. As discussed previously, Australian companies with foreign ownership have incentives to engage in tax avoidance, which may bring down their overall tax liabilities.27 On the other hand, some ASFMs might have been subject to additional tax following tax audits that identified tax shortfalls due to cross-border profit shifting. For example, Chevron Australia Holdings Pty Ltd28 borrowed USD 2.45 billion from a subsidiary in the US at an interest rate of approximately 9%, but the US subsidiary raised the money by issuing commercial paper in the US at an interest rate of about 1.2%. The dividends that Chevron received from the US subsidiary were regarded as non-assessable non-exempt income pursuant to section 23AJ of the Income Tax Assessment Act 1936. In 2012, the Commissioner of Taxation issued amended assessments under Division 815 of the Income Tax Assessment Act 1997 for the 2006, 2007 and 2008 income years on the basis that the interest paid by Chevron to the US subsidiary was greater than it would have been in an arm’s length dealing between independent parties. The assessments were held by the Full Federal Court to be valid.
4.2 Regression analyses
To triangulate the findings from the paired sample t-tests, Ordinary Least Squares (OLS) regression analyses are performed. For each of the six sub-samples, the outcome ratio is regressed on an ASFM indicator, along with the pertinent control variables. The equations below show the six OLS regression models.
GrosProfitRatio α β ASFM β SIZE β - IND ε (9)
EBITRatio α β ASFM β SIZE β - IND ε (10)
InterestExpenseRatio α β ASFM β SIZE β CAPINT β - IND ε (11)
Leverage α β ASFM β SIZE β CAPINT β - IND ε (12)
Pre-TaxProfitRatio α β ASFM β SIZE β - IND ε (13)
IncomeTaxExpenseRatio α β ASFM β SIZE β - IND ε (14)
Table 5 (pages 227 to 232) reports the regression results.29 It should be noted that although firm size, industry affiliation dummy variables and capital intensity are already
27 In the sample selection process, there is no restriction imposed on DOLACs’ foreign operations. This is to ensure that the evidence for ASFMs’ engaging in intra-group transfer pricing and thin capitalisation to shift profits out of Australia can be attributed to their strong incentives, rather than opportunities, to avoid Australia tax, as DOLACs may also have foreign operations hence opportunities to reduce Australian tax. 28 Chevron Australia Holdings Pty Ltd v Federal Commissioner of Taxation [2017] FCAFC 62. Chevron is one of the ASFMs in the matched sample. 29 Regression analyses are also performed on samples where ASFMs whose propensity score is higher than the maximum or lower than the minimum propensity score of DOLACs are excluded (i.e., regressions on common support). The results are similar to those reported in Table 4, except the coefficient for the ASFM indicator in the Income Tax Expense Ratio Sub-Sample which becomes negative and significant at the 5% level.
eJournal of Tax Research An empirical study on cross-border profit shifting in Australia
210
included in the propensity score matching logit models, they are still significant determinants of the six outcome ratios and need to be controlled for.
The regression analyses before and after the propensity score matching generate similar results. For simplicity, the discussion here focuses on the matched samples. In both the Gross Profit Ratio sub-sample and the EBIT Ratio sub-sample, the coefficient for the ASFM indicator is negative and significant at the 1% level. It implies that after controlling for firm size and industry affiliation, ASFMs generate lower gross profits and lower EBITs for every $1 of sales revenue than do comparable DOLACs, supporting H1A and H1B. In the Interest Expense Ratio sub-sample, the coefficient for the ASFM indicator is positive and significant at the 1% level. It means that after controlling for firm size, industry affiliation and capital intensity, ASFMs incur higher interest expenses per dollar of sales revenue than do DOLACs, supporting H2A. In the Leverage sub-sample, the ASFM indicator is not significantly related to Leverage, meaning that ASFMs do not rely on debt financing to a greater extent than do DOLACs, after controlling for firm size, industry affiliation and capital intensity. In this sense, H2B is not supported. As discussed previously, such finding may be attributable to ASFMs’ strong cash positions (especially in the case of distributors) as they may have incentives to keep their after-tax profits in Australia rather than sending them back to the foreign parent companies. In the Pre-Tax Profit Ratio sub-sample, the coefficient for the ASFM indicator is negative and significant at the 1% level, suggesting that after controlling for firm size and industry affiliation, ASFMs generate lower pre-tax profit for every $1 of sales revenue than do DOLACs, lending support to H3A. In the Income Tax Expense Ratio sub-sample, the coefficient for the ASFM indicator is negative and significant at the 10% level, indicating that ASFMs incur lower income tax expense for every $1 of sales revenue than do DOLACs, supporting H3B.
In summary, both the paired sample t-tests and the regression analyses on the matched samples provide supporting evidence that ASFMs engage in intra-group transfer pricing and pay high interest rates on intra-group debts to reduce their Australian profits hence Australian tax liabilities.
5. ROBUSTNESS CHECK
A robustness check is performed to exclude companies operating in industries with fewer than five ASFMs or five DOLACs. Such exclusion may help generate better matched samples, though results in smaller sample sizes. In total, 69 companies are excluded.30
Based on the reduced sample, the same paired sample t-tests and OLS regression analyses as those discussed in section 4 are performed. The results largely resemble those reported in the main test.31
30 The excluded 69 companies include three ASFMs and 23 DOLACs operating in the Consumer Services sector, seven ASFMs and three DOLACs operating in the Food & Staples Retailing sector, four ASFMs and two DOLACs operating in the Household & Personal Products sector, one DOLAC operating in the Semiconductors & Semiconductor Equipment sector, for ASFMs and 13 DOLACs operating in the Telecommunication Services sector, and three ASFMs and six DOLACs operating in the Utilities sector. 31 An exception is that in the paired sample t-tests, ASFMs do not have significantly lower Income Tax Expense Ratio than matched DOLACs.
eJournal of Tax Research An empirical study on cross-border profit shifting in Australia
211
6. CONCLUSION
This article investigates the tax-induced cross-border profit shifting, namely intra-group transfer pricing and thin capitalisation, engaged in by Australian subsidiaries of foreign multinationals (ASFMs) as compared to domestic-owned listed Australian companies (DOLACs). The comparison helps to reveal the tax avoidance practices of ASFMs because DOLACs, based on prior studies, do not have strong incentives for Australian tax avoidance and therefore can serve as the benchmark. This is because in the Australian dividend imputation system, shareholders of DOLACs, predominantly Australian residents, can enjoy the franking credit tax offset and hence do not view Australian corporate income tax as a cost to be minimised for after-tax wealth maximisation; in contrast, ASFMs have strong incentives to reduce Australian tax because the more Australian corporate income tax that the ASFMs can avoid, the higher the after-tax returns from the ASFMs will be.
To compare ASFMs with DOLACs on six financial measures of intra-group transfer pricing and thin capitalisation, paired sample t-tests using the propensity score matching technique are performed. The comparisons between ASFMs and DOLACs show that ASFMs have lower gross profit to sales revenue ratios and lower EBIT to sales revenue ratios than do comparable DOLACs. It indicates that ASFMs engage in intra-group transfer pricing: they charge depressed prices for the goods and services supplied to related parties, or pay inflated prices for the goods and services purchased from related parties. The comparison also shows that ASFMs have higher interest expense to sales revenue ratios, yet similar leverage, than do comparable DOLACs. The results suggest that ASFMs may pay high interest rates on intra-group debts to claim a high level of tax deductions for interest expenses. The differences in the intra-group transfer pricing measures between ASFMs and DOLACs are larger in absolute values than those in the thin capitalisation measures, indicating that intra-group transfer pricing has a more profound effect hence constituting the primary tax avoidance channel by ASFMs. Furthermore, the effectiveness of the tax avoidance activities engaged in by ASFMs is also evidenced in the sense that ASFMs have lower pre-tax profit to sales revenue ratios and lower income tax expense to sales revenue ratios than do comparable DOLACs.
Multivariate regression analyses on the matched sample triangulate the findings from the paired sample t-tests.
The study is subject to a number of limitations. First, since ASFMs do not have four-digit GICS codes readily available, coding for the industry classification is performed manually. The coding may not be precise because many companies engage in activities across multiple industries. Decisions have to be made as to which is the main industry based on the information available. Second, the sample size is relatively small compared with other studies using the propensity score matching approach. A larger sample may result in better matching between ASFMs and DOLACs. Third, five of the six outcome ratios are scaled by sales revenue which may be depressed by companies engaging in intra-group transfer pricing. Had the arm’s length sales revenue of ASFMs been available and used for the scaling, the evidence that ASFMs engage in Australian tax avoidance via intra-group transfer pricing and thin capitalisation would have been even stronger.
The findings of this article should be of interest to both Australian and overseas policy-makers. At the national level, they indicate that the Australian transfer pricing rules before 2013 may not be as effective as expected. Prior to 2013, the Australian transfer
eJournal of Tax Research An empirical study on cross-border profit shifting in Australia
212
pricing rules imposed arm’s length standards on MNEs’ internal dealings, and the trading of property or services between separate legal entities under international arrangements. In 2013, the government introduced new transfer pricing rules which aligned the application of the arm’s length principle in the Australian tax law with the international transfer pricing standards set by the OECD guidelines. Nevertheless, the inherent deficiencies in the arm’s length principle, which involve the difficulty in identifying comparable transactions and the determination of arm’s length prices, may still enable companies to circumvent the law.
The thin capitalisation rules prior to 2013 appeared to be effective in limiting the gearing ratios of companies, yet companies could still claim substantial tax deductions for interest expenses at high interest rates on intra-group debts. Although the government tightened the thin capitalisation rules in 2014, the new rules do not stipulate limitations on interest rates on debts. That said, interest rates on intra-group debts are now assessed under the arm’s length principle following the Chevron case.
Moreover, the findings in this article also correspond with those in prior studies on the corporate tax avoidance-reducing effect of the dividend imputation system: Australian companies with significant foreign ownership have strong incentives to avoid Australian corporate income tax. Thus, improvement to the current imputation system to extend the imputation benefits to foreign shareholders may help broaden the corporate tax avoidance-reducing effect of the imputation system. However, this requires foreign tax authorities to recognise Australian corporate tax paid as tax offsets in their countries, which is outside the jurisdiction of the Australian tax system.
Future studies could investigate whether the newly introduced transfer pricing rules in Australia in 2013 help tackle cross-border tax avoidance more effectively, and consider whether the recommended ‘fixed ratio approach’ to deduction of interest expense by the OECD (2015b) is worth adopting. The decision of the full Federal Court in 2017 in the Chevron case confirms that transfer pricing rules can be used to tackle the non-arm’s length interest rates charged on intra-group loans.
At the global level, the finding that DOLACs engage in intra-group transfer pricing and thin capitalisation to a lesser extent than do comparable ASFMs suggests that adopting the imputation system may form part of the solutions to corporate tax avoidance. Countries which have never adopted the system or have abolished the system in the past (e.g., some European countries) may consider adopting the system (again). International organisations and forums such as the OECD and the Group of Twenty (G20) have not considered the dividend imputation system to deal with tax avoidance via cross-border profit shifting. Their action plans and recommendations mainly address the requirement of more transparent disclosures by MNEs and the development of a multilateral instrument to deal with international tax matters. Based on the findings of this article, it appears that a global dividend imputation system with a central clearing house may be complementary to the international corporate tax avoidance countermeasures in the OECD BEPS Action Plan.
eJournal of Tax Research An empirical study on cross-border profit shifting in Australia
213
7. REFERENCES
Amiram, D, Baur, A M & Frank, M M 2019, ‘Tax avoidance at public corporations driven by shareholder taxes: Evidence from changes in dividend tax policy’, The Accounting Review, vol. 94, no. 5, pp. 27-55.
Austin, P C 2011, ‘An introduction to propensity score methods for reducing the effects of confounding in observational studies’, Multivariate Behavioral Research, vol. 46, no. 3, pp. 399-424.
Austin, P C, Grootendorst, P & Anderson, G M 2007, ‘A comparison of the ability of different propensity score models to balance measured variables between treated and untreated subjects: A Monte Carlo study’, Statistics in Medicine, vol. 26, no. 4, pp. 734-753.
Australian Taxation Office (ATO) 2015, Taxation Statistics 2012-13 / Companies - Table 1, https://data.gov.au/dataset/taxation-statistics-2012-13/resource/5bfb5001-2d3c-46cb-a76d-1b86b6913ac3?inner_span=True (accessed 22 January 2017).
Barnhouse, N C, Booth, A & Wester, K 2012, ‘Transfer pricing’, Working Paper, http://ssrn.com/abstract=2196826.
Bellamy, D E 1994, ‘Evidence of imputation clienteles in the Australian equity market’, Asia Pacific Journal of Management, vol. 11, no. 2, pp. 275-287.
Bernard, A B, Jensen, J B & Schott, P K 2006, ‘Transfer pricing by US-based multinational firms’, National Bureau of Economic Research, NBER Working Paper No. 12493, http://www.nber.org/papers/w12493.pdf.
Brookhart, M A, Schneeweiss, S, Rothman, K J, Glynn, R J, Avorn, J & Stürmer, T 2006, ‘Variable selection for propensity score models’, American Journal of Epidemiology, vol. 163, no. 12, pp. 1149-1156.
Casselman, B & Lahart, J 2011, ‘Companies shun investment, hoard cash’, The Wall Street Journal, 17 September. Available at: https://www.wsj.com/articles/SB10001424053111903927204576574720017009568 (accessed 10 February 2020).
Chari, A, Chen, W & Dominguez, K M E 2012, ‘Foreign ownership and firm performance: Emerging market acquisitions in the United States’, IMF Economic Review, vol. 60, no. 1, pp. 1-42.
Clausing, K A 2003, ‘Tax-motivated transfer pricing and US intrafirm trade prices’, Journal of Public Economics, vol. 87, nos. 9-10, pp. 2207-2223.
Deesomsak, R, Paudyal, K & Pescetto, G 2004, ‘The determinants of capital structure: Evidence from the Asia Pacific region’, Journal of Multinational Financial Management, vol. 14, nos. 4-5, pp. 387-405.
Desai, M A, Foley, C F & Hines, J R 2004, ‘A multinational perspective on capital structure choice and internal capital markets’, The Journal of Finance, vol. 59, no. 6, pp. 2451-2487.
Dischinger, M 2007, ‘Profit shifting by multinationals: indirect evidence from European micro data’, Working Paper, University of Munich, https://epub.ub.uni-muenchen.de/2029/1/dischinger_2007_profit_shifting.pdf%3Bh=repec:lmu:muenec:2029.
eJournal of Tax Research An empirical study on cross-border profit shifting in Australia
214
Egger, P, Eggert, W & Winner, H 2010, ‘Saving taxes through foreign plant ownership’, Journal of International Economics, vol. 81, no. 1, pp. 99-108.
Elliott, J, & Emmanuel, C (2000), ‘International transfer pricing: Searching for patterns’, European Management Journal, vol. 18, no. 2, pp. 216-222.
Fan, J P H, Titman, S & Twite, G 2012, ‘An international comparison of capital structure and debt maturity choices’, Journal of Financial and Quantitative Analysis, vol. 47, no. 1, pp. 23-56.
Foley, C F, Hartzell, J C, Titman, S & Twite, G 2007, ‘Why do firms hold so much cash? A tax-based explanation’, Journal of Financial Economics, vol. 86, no. 3, pp. 579-607.
Girma, S & Görg, H 2007, ‘Evaluating the foreign ownership wage premium using a difference-in-differences matching approach’, Journal of International Economics, vol. 72, no. 1, pp. 97-112.
Goddard, J, Tavakoli, M & Wilson, J O S 2005, ‘Determinants of profitability in European manufacturing and services: Evidence from a dynamic panel model’, Applied Financial Economics, vol. 15, no. 8, pp. 1269-1282.
Grubert, H & Mutti, J 1991, ‘Taxes, tariffs and transfer pricing in multinational corporate decision making’, The Review of Economics and Statistics, vol. 73, no. 2, pp. 285-293.
Guo, S & Fraser, M W 2015, Propensity score analysis: Statistical methods and applications, 2nd edn., Sage, Los Angeles.
Hines, J R & Rice, E M 1994, ‘Fiscal paradise: Foreign tax havens and American business’, The Quarterly Journal of Economics, vol. 109, no. 1, pp. 149-182.
Huizinga, H & Laeven, L 2008, ‘International profit shifting within multinationals: A multi-country perspective’, Journal of Public Economics, vol. 92, nos. 5-6, pp. 1164-1182.
Huizinga, H, Laeven, L & Nicodeme, G 2008, ‘Capital structure and international debt shifting’, Journal of Financial Economics, vol. 88, no. 1, pp. 80-118.
Ikin, C & Tran, A 2013, ‘Corporate tax strategy in the Australian dividend imputation system’, Australian Tax Forum, vol. 28, no. 3, pp. 523-553.
Ker, P 2018, ‘BHP to pay ATO $529m in tax settlement over Singapore marketing hub’, Australian Financial Review, 19 November. Available at: https://www.afr.com/business/mining/bhp-to-pay-529m-in-ato-settlement-20181119-h182zf (accessed 10 February 2020).
KPMG 2016, Corporate tax rates table, https://home.kpmg.com/xx/en/home/services/tax/tax-tools-and-resources/tax-rates-online/corporate-tax-rates-table.html.
Li, X & Tran, A 2019, ‘The Australian dividend imputation system and corporate tax avoidance’, Australian Tax Forum, vol. 34, no. 2, pp. 357-399.
Merlo, V & Wamser, G 2014, ‘Debt shifting and thin-capitalization rules’, DICE Report, vol. 12, issue 4, pp. 27-31.
Mills, L F & Newberry, K J 2004, ‘Do foreign multinationals’ tax incentives influence their US income reporting and debt policy?’, National Tax Journal, vol. 57, no. 1, pp. 89-107.
eJournal of Tax Research An empirical study on cross-border profit shifting in Australia
215
Organisation for Economic Co-operation and Development (OECD) 2012, Thin capitalisation legislation: A background paper for country tax administrations (pilot draft), OECD, Paris, http://www.oecd.org/ctp/tax-global/5.%20thin_capitalization_background.pdf.
Organisation for Economic Co-operation and Development (OECD) 2015a, Information brief: OECD/G20 Base Erosion and Profit Shifting Project 2015 final reports, OECD, Paris, https://www.oecd.org/ctp/beps-reports-2015-information-brief.pdf.
Organisation for Economic Co-operation and Development (OECD) 2015b, Limiting base erosion involving interest deductions and other financial payments: Action 4 – 2015 Final Report, OECD/G20 Base Erosion and Profit Shifting Project, OECD Publishing, Paris.
Pattenden, K & Twite, G 2008, ‘Taxes and dividend policy under alternative tax regimes’, Journal of Corporate Finance, vol. 14, no. 1, pp. 1-16.
Porter, M E 1980, ‘Industry structure and competitive strategy: Keys to profitability’, Financial Analysts Journal, vol. 36, no. 4, pp. 30-41.
Rosenbaum, P R & Rubin, D B 1983, ‘The central role of the propensity score in observational studies for causal effects’, Biometrika, vol. 70, no. 1, pp. 41-55.
Shipman, J E, Swanquist, Q T & Whited, R L 2017, ‘Propensity score matching in accounting research’, The Accounting Review, vol. 92, no. 1, pp. 213-244.
Ting, A 2014, ‘iTax – Apple’s international tax structure and the double non-taxation issue’, British Tax Review, vol. 2014, no. 1, pp. 40-71.
Titman, S & Wessels, R 1988, ‘The determinants of capital structure choice’, The Journal of Finance, vol. 43, no. 1, pp. 1-19.
Twite, G 2001, ‘Capital structure choices and taxes: Evidence from the Australian dividend imputation tax system’, International Review of Finance, vol. 2, no. 4, pp. 217-234.
Wilkinson, B R, Cahan, S F & Jones, G 2001, ‘Strategies and dividend imputation: The effect of foreign and domestic ownership on average effective tax rates’, Journal of International Accounting, Auditing and Taxation, vol. 10, no. 2, pp. 157-175.
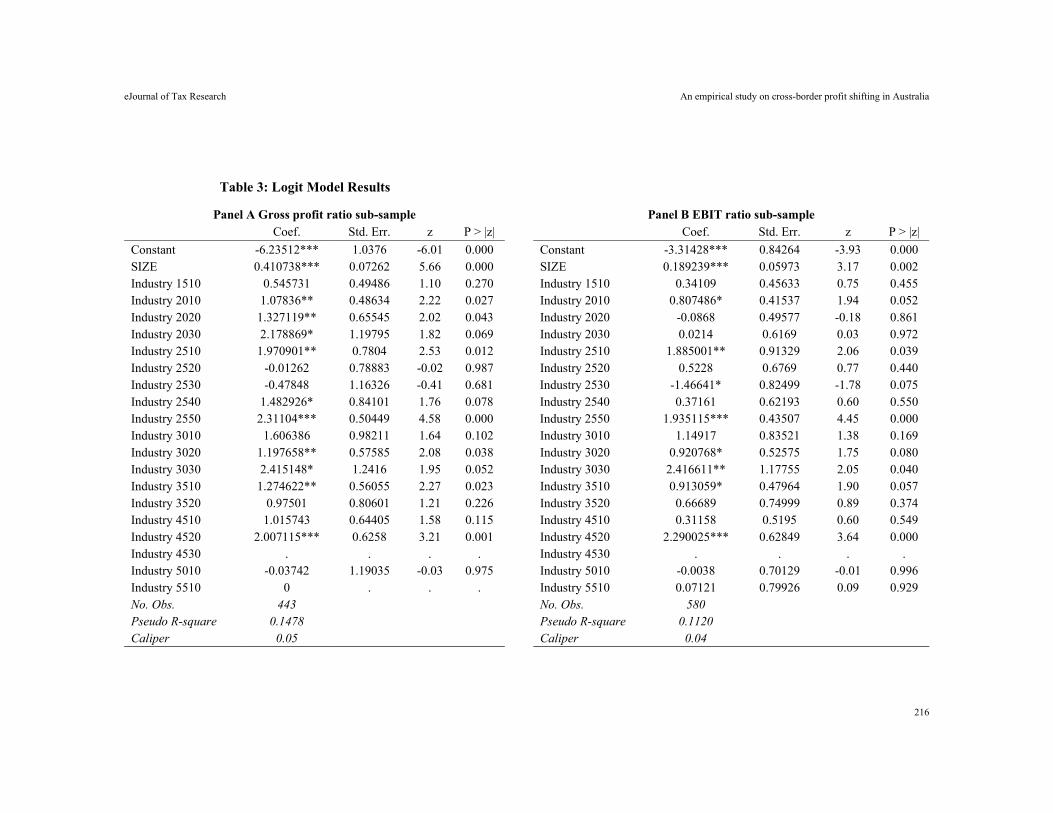
eJournal of Tax Research An empirical study on cross-border profit shifting in Australia
216
Table 3: Logit Model Results
Panel A Gross profit ratio sub-sample Panel B EBIT ratio sub-sample Coef. Std. Err. z P > |z| Coef. Std. Err. z P > |z|
Constant -6.23512*** 1.0376 -6.01 0.000 Constant -3.31428*** 0.84264 -3.93 0.000 SIZE 0.410738*** 0.07262 5.66 0.000 SIZE 0.189239*** 0.05973 3.17 0.002 Industry 1510 0.545731 0.49486 1.10 0.270 Industry 1510 0.34109 0.45633 0.75 0.455 Industry 2010 1.07836** 0.48634 2.22 0.027 Industry 2010 0.807486* 0.41537 1.94 0.052 Industry 2020 1.327119** 0.65545 2.02 0.043 Industry 2020 -0.0868 0.49577 -0.18 0.861 Industry 2030 2.178869* 1.19795 1.82 0.069 Industry 2030 0.0214 0.6169 0.03 0.972 Industry 2510 1.970901** 0.7804 2.53 0.012 Industry 2510 1.885001** 0.91329 2.06 0.039 Industry 2520 -0.01262 0.78883 -0.02 0.987 Industry 2520 0.5228 0.6769 0.77 0.440 Industry 2530 -0.47848 1.16326 -0.41 0.681 Industry 2530 -1.46641* 0.82499 -1.78 0.075 Industry 2540 1.482926* 0.84101 1.76 0.078 Industry 2540 0.37161 0.62193 0.60 0.550 Industry 2550 2.31104*** 0.50449 4.58 0.000 Industry 2550 1.935115*** 0.43507 4.45 0.000 Industry 3010 1.606386 0.98211 1.64 0.102 Industry 3010 1.14917 0.83521 1.38 0.169 Industry 3020 1.197658** 0.57585 2.08 0.038 Industry 3020 0.920768* 0.52575 1.75 0.080 Industry 3030 2.415148* 1.2416 1.95 0.052 Industry 3030 2.416611** 1.17755 2.05 0.040 Industry 3510 1.274622** 0.56055 2.27 0.023 Industry 3510 0.913059* 0.47964 1.90 0.057 Industry 3520 0.97501 0.80601 1.21 0.226 Industry 3520 0.66689 0.74999 0.89 0.374 Industry 4510 1.015743 0.64405 1.58 0.115 Industry 4510 0.31158 0.5195 0.60 0.549 Industry 4520 2.007115*** 0.6258 3.21 0.001 Industry 4520 2.290025*** 0.62849 3.64 0.000 Industry 4530 . . . . Industry 4530 . . . . Industry 5010 -0.03742 1.19035 -0.03 0.975 Industry 5010 -0.0038 0.70129 -0.01 0.996 Industry 5510 0 . . . Industry 5510 0.07121 0.79926 0.09 0.929 No. Obs. 443 No. Obs. 580 Pseudo R-square 0.1478 Pseudo R-square 0.1120 Caliper 0.05 Caliper 0.04
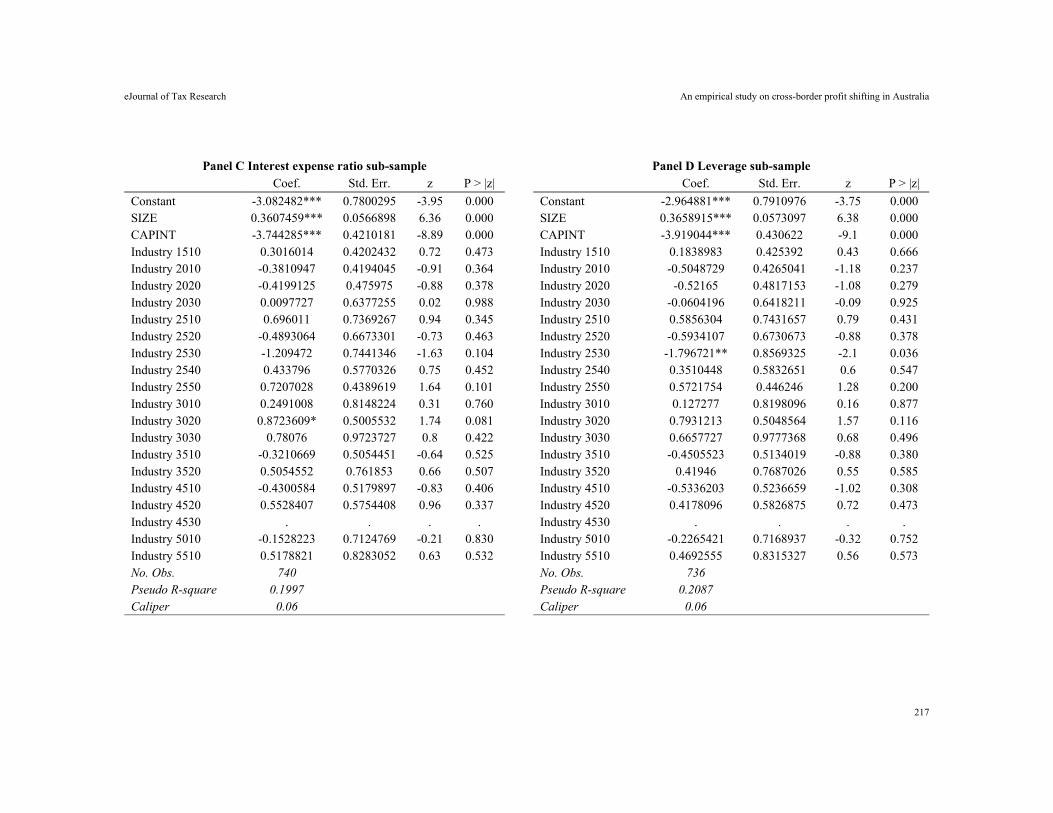
eJournal of Tax Research An empirical study on cross-border profit shifting in Australia
217
Panel C Interest expense ratio sub-sample Panel D Leverage sub-sample Coef. Std. Err. z P > |z| Coef. Std. Err. z P > |z|
Constant -3.082482*** 0.7800295 -3.95 0.000 Constant -2.964881*** 0.7910976 -3.75 0.000 SIZE 0.3607459*** 0.0566898 6.36 0.000 SIZE 0.3658915*** 0.0573097 6.38 0.000 CAPINT -3.744285*** 0.4210181 -8.89 0.000 CAPINT -3.919044*** 0.430622 -9.1 0.000 Industry 1510 0.3016014 0.4202432 0.72 0.473 Industry 1510 0.1838983 0.425392 0.43 0.666 Industry 2010 -0.3810947 0.4194045 -0.91 0.364 Industry 2010 -0.5048729 0.4265041 -1.18 0.237 Industry 2020 -0.4199125 0.475975 -0.88 0.378 Industry 2020 -0.52165 0.4817153 -1.08 0.279 Industry 2030 0.0097727 0.6377255 0.02 0.988 Industry 2030 -0.0604196 0.6418211 -0.09 0.925 Industry 2510 0.696011 0.7369267 0.94 0.345 Industry 2510 0.5856304 0.7431657 0.79 0.431 Industry 2520 -0.4893064 0.6673301 -0.73 0.463 Industry 2520 -0.5934107 0.6730673 -0.88 0.378 Industry 2530 -1.209472 0.7441346 -1.63 0.104 Industry 2530 -1.796721** 0.8569325 -2.1 0.036 Industry 2540 0.433796 0.5770326 0.75 0.452 Industry 2540 0.3510448 0.5832651 0.6 0.547 Industry 2550 0.7207028 0.4389619 1.64 0.101 Industry 2550 0.5721754 0.446246 1.28 0.200 Industry 3010 0.2491008 0.8148224 0.31 0.760 Industry 3010 0.127277 0.8198096 0.16 0.877 Industry 3020 0.8723609* 0.5005532 1.74 0.081 Industry 3020 0.7931213 0.5048564 1.57 0.116 Industry 3030 0.78076 0.9723727 0.8 0.422 Industry 3030 0.6657727 0.9777368 0.68 0.496 Industry 3510 -0.3210669 0.5054451 -0.64 0.525 Industry 3510 -0.4505523 0.5134019 -0.88 0.380 Industry 3520 0.5054552 0.761853 0.66 0.507 Industry 3520 0.41946 0.7687026 0.55 0.585 Industry 4510 -0.4300584 0.5179897 -0.83 0.406 Industry 4510 -0.5336203 0.5236659 -1.02 0.308 Industry 4520 0.5528407 0.5754408 0.96 0.337 Industry 4520 0.4178096 0.5826875 0.72 0.473 Industry 4530 . . . . Industry 4530 . . . . Industry 5010 -0.1528223 0.7124769 -0.21 0.830 Industry 5010 -0.2265421 0.7168937 -0.32 0.752 Industry 5510 0.5178821 0.8283052 0.63 0.532 Industry 5510 0.4692555 0.8315327 0.56 0.573 No. Obs. 740 No. Obs. 736 Pseudo R-square 0.1997 Pseudo R-square 0.2087 Caliper 0.06 Caliper 0.06
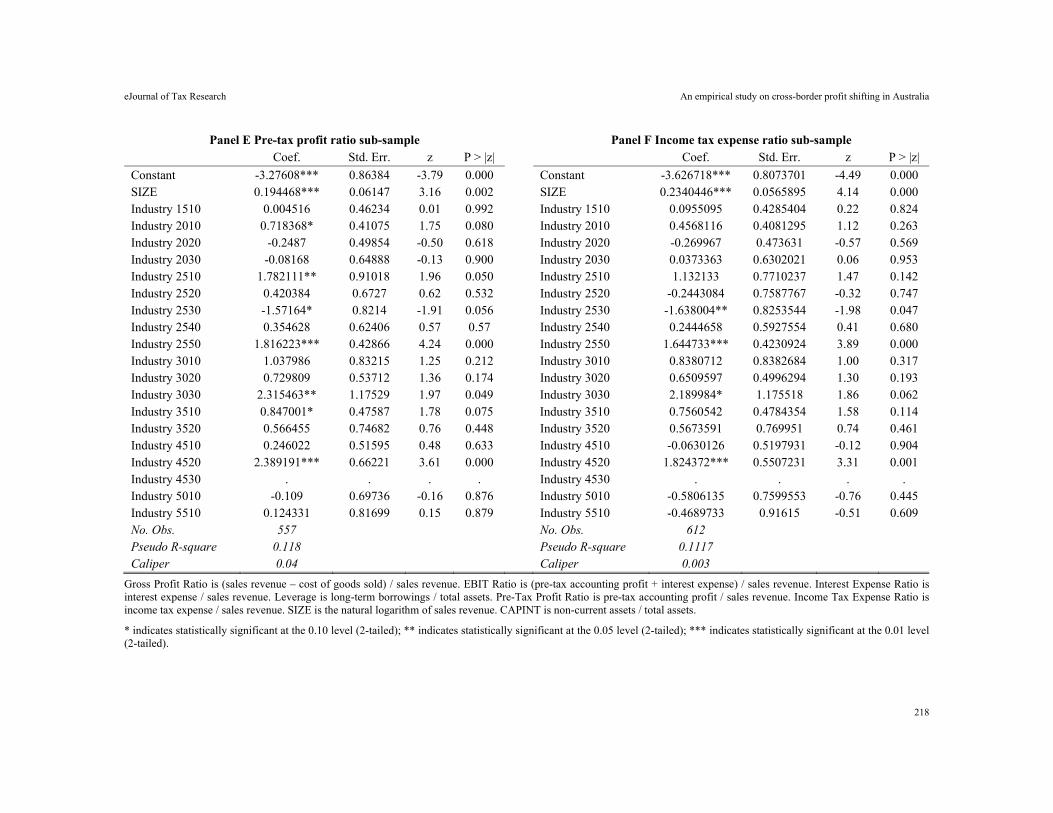
eJournal of Tax Research An empirical study on cross-border profit shifting in Australia
218
Gross Profit Ratio is (sales revenue – cost of goods sold) / sales revenue. EBIT Ratio is (pre-tax accounting profit + interest expense) / sales revenue. Interest Expense Ratio is interest expense / sales revenue. Leverage is long-term borrowings / total assets. Pre-Tax Profit Ratio is pre-tax accounting profit / sales revenue. Income Tax Expense Ratio is income tax expense / sales revenue. SIZE is the natural logarithm of sales revenue. CAPINT is non-current assets / total assets.
* indicates statistically significant at the 0.10 level (2-tailed); ** indicates statistically significant at the 0.05 level (2-tailed); *** indicates statistically significant at the 0.01 level (2-tailed).
Panel E Pre-tax profit ratio sub-sample Panel F Income tax expense ratio sub-sample Coef. Std. Err. z P > |z| Coef. Std. Err. z P > |z|
Constant -3.27608*** 0.86384 -3.79 0.000 Constant -3.626718*** 0.8073701 -4.49 0.000 SIZE 0.194468*** 0.06147 3.16 0.002 SIZE 0.2340446*** 0.0565895 4.14 0.000 Industry 1510 0.004516 0.46234 0.01 0.992 Industry 1510 0.0955095 0.4285404 0.22 0.824 Industry 2010 0.718368* 0.41075 1.75 0.080 Industry 2010 0.4568116 0.4081295 1.12 0.263 Industry 2020 -0.2487 0.49854 -0.50 0.618 Industry 2020 -0.269967 0.473631 -0.57 0.569 Industry 2030 -0.08168 0.64888 -0.13 0.900 Industry 2030 0.0373363 0.6302021 0.06 0.953 Industry 2510 1.782111** 0.91018 1.96 0.050 Industry 2510 1.132133 0.7710237 1.47 0.142 Industry 2520 0.420384 0.6727 0.62 0.532 Industry 2520 -0.2443084 0.7587767 -0.32 0.747 Industry 2530 -1.57164* 0.8214 -1.91 0.056 Industry 2530 -1.638004** 0.8253544 -1.98 0.047 Industry 2540 0.354628 0.62406 0.57 0.57 Industry 2540 0.2444658 0.5927554 0.41 0.680 Industry 2550 1.816223*** 0.42866 4.24 0.000 Industry 2550 1.644733*** 0.4230924 3.89 0.000 Industry 3010 1.037986 0.83215 1.25 0.212 Industry 3010 0.8380712 0.8382684 1.00 0.317 Industry 3020 0.729809 0.53712 1.36 0.174 Industry 3020 0.6509597 0.4996294 1.30 0.193 Industry 3030 2.315463** 1.17529 1.97 0.049 Industry 3030 2.189984* 1.175518 1.86 0.062 Industry 3510 0.847001* 0.47587 1.78 0.075 Industry 3510 0.7560542 0.4784354 1.58 0.114 Industry 3520 0.566455 0.74682 0.76 0.448 Industry 3520 0.5673591 0.769951 0.74 0.461 Industry 4510 0.246022 0.51595 0.48 0.633 Industry 4510 -0.0630126 0.5197931 -0.12 0.904 Industry 4520 2.389191*** 0.66221 3.61 0.000 Industry 4520 1.824372*** 0.5507231 3.31 0.001 Industry 4530 . . . . Industry 4530 . . . . Industry 5010 -0.109 0.69736 -0.16 0.876 Industry 5010 -0.5806135 0.7599553 -0.76 0.445 Industry 5510 0.124331 0.81699 0.15 0.879 Industry 5510 -0.4689733 0.91615 -0.51 0.609 No. Obs. 557 No. Obs. 612 Pseudo R-square 0.118 Pseudo R-square 0.1117 Caliper 0.04 Caliper 0.003
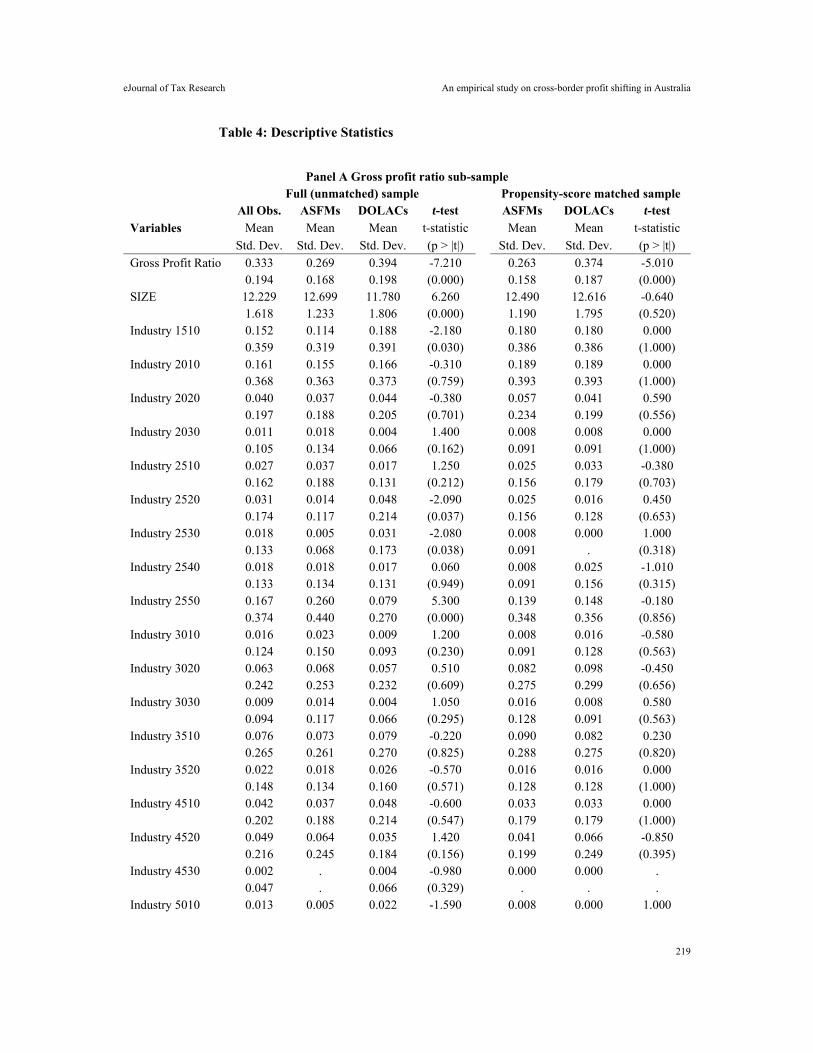
eJournal of Tax Research An empirical study on cross-border profit shifting in Australia
219
Table 4: Descriptive Statistics
Panel A Gross profit ratio sub-sample
Full (unmatched) sample Propensity-score matched sample
Variables
All Obs. ASFMs DOLACs t-test ASFMs DOLACs t-test Mean Mean Mean t-statistic Mean Mean t-statistic
Std. Dev. Std. Dev. Std. Dev. (p > |t|) Std. Dev. Std. Dev. (p > |t|)
Gross Profit Ratio 0.333 0.269 0.394 -7.210 0.263 0.374 -5.010 0.194 0.168 0.198 (0.000) 0.158 0.187 (0.000) SIZE 12.229 12.699 11.780 6.260 12.490 12.616 -0.640 1.618 1.233 1.806 (0.000) 1.190 1.795 (0.520) Industry 1510 0.152 0.114 0.188 -2.180 0.180 0.180 0.000 0.359 0.319 0.391 (0.030) 0.386 0.386 (1.000) Industry 2010 0.161 0.155 0.166 -0.310 0.189 0.189 0.000 0.368 0.363 0.373 (0.759) 0.393 0.393 (1.000) Industry 2020 0.040 0.037 0.044 -0.380 0.057 0.041 0.590 0.197 0.188 0.205 (0.701) 0.234 0.199 (0.556) Industry 2030 0.011 0.018 0.004 1.400 0.008 0.008 0.000 0.105 0.134 0.066 (0.162) 0.091 0.091 (1.000) Industry 2510 0.027 0.037 0.017 1.250 0.025 0.033 -0.380 0.162 0.188 0.131 (0.212) 0.156 0.179 (0.703) Industry 2520 0.031 0.014 0.048 -2.090 0.025 0.016 0.450 0.174 0.117 0.214 (0.037) 0.156 0.128 (0.653) Industry 2530 0.018 0.005 0.031 -2.080 0.008 0.000 1.000 0.133 0.068 0.173 (0.038) 0.091 . (0.318) Industry 2540 0.018 0.018 0.017 0.060 0.008 0.025 -1.010 0.133 0.134 0.131 (0.949) 0.091 0.156 (0.315) Industry 2550 0.167 0.260 0.079 5.300 0.139 0.148 -0.180 0.374 0.440 0.270 (0.000) 0.348 0.356 (0.856) Industry 3010 0.016 0.023 0.009 1.200 0.008 0.016 -0.580 0.124 0.150 0.093 (0.230) 0.091 0.128 (0.563) Industry 3020 0.063 0.068 0.057 0.510 0.082 0.098 -0.450 0.242 0.253 0.232 (0.609) 0.275 0.299 (0.656) Industry 3030 0.009 0.014 0.004 1.050 0.016 0.008 0.580 0.094 0.117 0.066 (0.295) 0.128 0.091 (0.563) Industry 3510 0.076 0.073 0.079 -0.220 0.090 0.082 0.230 0.265 0.261 0.270 (0.825) 0.288 0.275 (0.820) Industry 3520 0.022 0.018 0.026 -0.570 0.016 0.016 0.000 0.148 0.134 0.160 (0.571) 0.128 0.128 (1.000) Industry 4510 0.042 0.037 0.048 -0.600 0.033 0.033 0.000 0.202 0.188 0.214 (0.547) 0.179 0.179 (1.000) Industry 4520 0.049 0.064 0.035 1.420 0.041 0.066 -0.850 0.216 0.245 0.184 (0.156) 0.199 0.249 (0.395) Industry 4530 0.002 . 0.004 -0.980 0.000 0.000 . 0.047 . 0.066 (0.329) . . . Industry 5010 0.013 0.005 0.022 -1.590 0.008 0.000 1.000
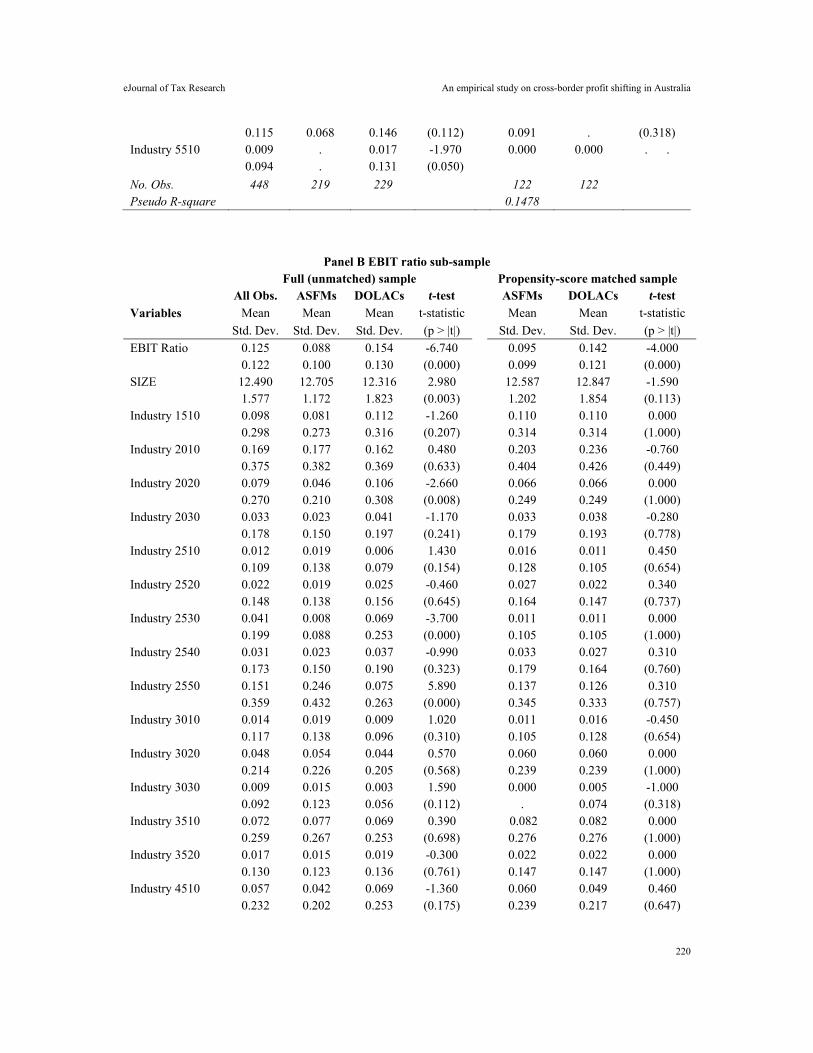
eJournal of Tax Research An empirical study on cross-border profit shifting in Australia
220
0.115 0.068 0.146 (0.112) 0.091 . (0.318) Industry 5510 0.009 . 0.017 -1.970 0.000 0.000 . . 0.094 . 0.131 (0.050) No. Obs. 448 219 229 122 122
Pseudo R-square 0.1478
Panel B EBIT ratio sub-sample
Full (unmatched) sample Propensity-score matched sample
Variables
All Obs. ASFMs DOLACs t-test ASFMs DOLACs t-test Mean Mean Mean t-statistic Mean Mean t-statistic
Std. Dev. Std. Dev. Std. Dev. (p > |t|) Std. Dev. Std. Dev. (p > |t|)
EBIT Ratio 0.125 0.088 0.154 -6.740 0.095 0.142 -4.000 0.122 0.100 0.130 (0.000) 0.099 0.121 (0.000) SIZE 12.490 12.705 12.316 2.980 12.587 12.847 -1.590 1.577 1.172 1.823 (0.003) 1.202 1.854 (0.113) Industry 1510 0.098 0.081 0.112 -1.260 0.110 0.110 0.000 0.298 0.273 0.316 (0.207) 0.314 0.314 (1.000) Industry 2010 0.169 0.177 0.162 0.480 0.203 0.236 -0.760 0.375 0.382 0.369 (0.633) 0.404 0.426 (0.449) Industry 2020 0.079 0.046 0.106 -2.660 0.066 0.066 0.000 0.270 0.210 0.308 (0.008) 0.249 0.249 (1.000) Industry 2030 0.033 0.023 0.041 -1.170 0.033 0.038 -0.280 0.178 0.150 0.197 (0.241) 0.179 0.193 (0.778) Industry 2510 0.012 0.019 0.006 1.430 0.016 0.011 0.450 0.109 0.138 0.079 (0.154) 0.128 0.105 (0.654) Industry 2520 0.022 0.019 0.025 -0.460 0.027 0.022 0.340 0.148 0.138 0.156 (0.645) 0.164 0.147 (0.737) Industry 2530 0.041 0.008 0.069 -3.700 0.011 0.011 0.000 0.199 0.088 0.253 (0.000) 0.105 0.105 (1.000) Industry 2540 0.031 0.023 0.037 -0.990 0.033 0.027 0.310 0.173 0.150 0.190 (0.323) 0.179 0.164 (0.760) Industry 2550 0.151 0.246 0.075 5.890 0.137 0.126 0.310 0.359 0.432 0.263 (0.000) 0.345 0.333 (0.757) Industry 3010 0.014 0.019 0.009 1.020 0.011 0.016 -0.450 0.117 0.138 0.096 (0.310) 0.105 0.128 (0.654) Industry 3020 0.048 0.054 0.044 0.570 0.060 0.060 0.000 0.214 0.226 0.205 (0.568) 0.239 0.239 (1.000) Industry 3030 0.009 0.015 0.003 1.590 0.000 0.005 -1.000 0.092 0.123 0.056 (0.112) . 0.074 (0.318) Industry 3510 0.072 0.077 0.069 0.390 0.082 0.082 0.000 0.259 0.267 0.253 (0.698) 0.276 0.276 (1.000) Industry 3520 0.017 0.015 0.019 -0.300 0.022 0.022 0.000 0.130 0.123 0.136 (0.761) 0.147 0.147 (1.000) Industry 4510 0.057 0.042 0.069 -1.360 0.060 0.049 0.460 0.232 0.202 0.253 (0.175) 0.239 0.217 (0.647)
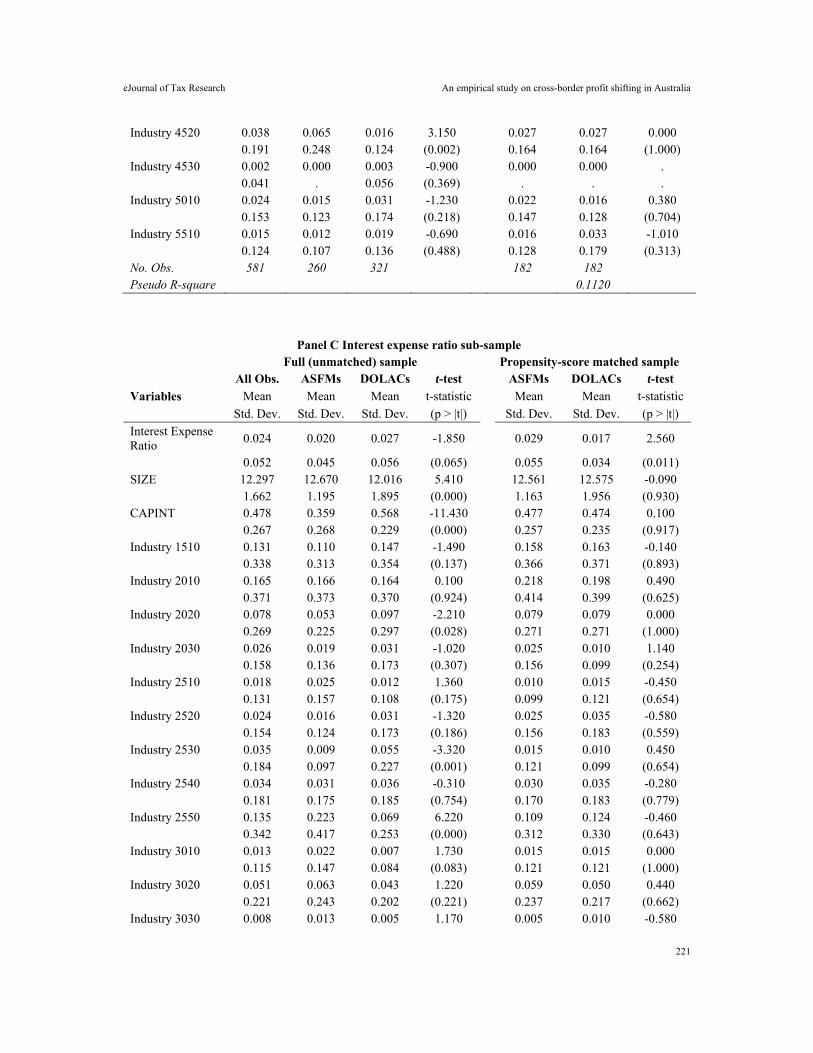
eJournal of Tax Research An empirical study on cross-border profit shifting in Australia
221
Industry 4520 0.038 0.065 0.016 3.150 0.027 0.027 0.000 0.191 0.248 0.124 (0.002) 0.164 0.164 (1.000) Industry 4530 0.002 0.000 0.003 -0.900 0.000 0.000 . 0.041 . 0.056 (0.369) . . . Industry 5010 0.024 0.015 0.031 -1.230 0.022 0.016 0.380 0.153 0.123 0.174 (0.218) 0.147 0.128 (0.704) Industry 5510 0.015 0.012 0.019 -0.690 0.016 0.033 -1.010 0.124 0.107 0.136 (0.488) 0.128 0.179 (0.313) No. Obs. 581 260 321 182 182
Pseudo R-square 0.1120
Panel C Interest expense ratio sub-sample
Full (unmatched) sample Propensity-score matched sample
Variables
All Obs. ASFMs DOLACs t-test ASFMs DOLACs t-test
Mean Mean Mean t-statistic Mean Mean t-statistic
Std. Dev. Std. Dev. Std. Dev. (p > |t|) Std. Dev. Std. Dev. (p > |t|)
Interest Expense Ratio
0.024 0.020 0.027 -1.850 0.029 0.017 2.560
0.052 0.045 0.056 (0.065) 0.055 0.034 (0.011) SIZE 12.297 12.670 12.016 5.410 12.561 12.575 -0.090 1.662 1.195 1.895 (0.000) 1.163 1.956 (0.930) CAPINT 0.478 0.359 0.568 -11.430 0.477 0.474 0.100 0.267 0.268 0.229 (0.000) 0.257 0.235 (0.917) Industry 1510 0.131 0.110 0.147 -1.490 0.158 0.163 -0.140 0.338 0.313 0.354 (0.137) 0.366 0.371 (0.893) Industry 2010 0.165 0.166 0.164 0.100 0.218 0.198 0.490 0.371 0.373 0.370 (0.924) 0.414 0.399 (0.625) Industry 2020 0.078 0.053 0.097 -2.210 0.079 0.079 0.000 0.269 0.225 0.297 (0.028) 0.271 0.271 (1.000) Industry 2030 0.026 0.019 0.031 -1.020 0.025 0.010 1.140 0.158 0.136 0.173 (0.307) 0.156 0.099 (0.254) Industry 2510 0.018 0.025 0.012 1.360 0.010 0.015 -0.450 0.131 0.157 0.108 (0.175) 0.099 0.121 (0.654) Industry 2520 0.024 0.016 0.031 -1.320 0.025 0.035 -0.580 0.154 0.124 0.173 (0.186) 0.156 0.183 (0.559) Industry 2530 0.035 0.009 0.055 -3.320 0.015 0.010 0.450 0.184 0.097 0.227 (0.001) 0.121 0.099 (0.654) Industry 2540 0.034 0.031 0.036 -0.310 0.030 0.035 -0.280 0.181 0.175 0.185 (0.754) 0.170 0.183 (0.779) Industry 2550 0.135 0.223 0.069 6.220 0.109 0.124 -0.460 0.342 0.417 0.253 (0.000) 0.312 0.330 (0.643) Industry 3010 0.013 0.022 0.007 1.730 0.015 0.015 0.000 0.115 0.147 0.084 (0.083) 0.121 0.121 (1.000) Industry 3020 0.051 0.063 0.043 1.220 0.059 0.050 0.440 0.221 0.243 0.202 (0.221) 0.237 0.217 (0.662) Industry 3030 0.008 0.013 0.005 1.170 0.005 0.010 -0.580
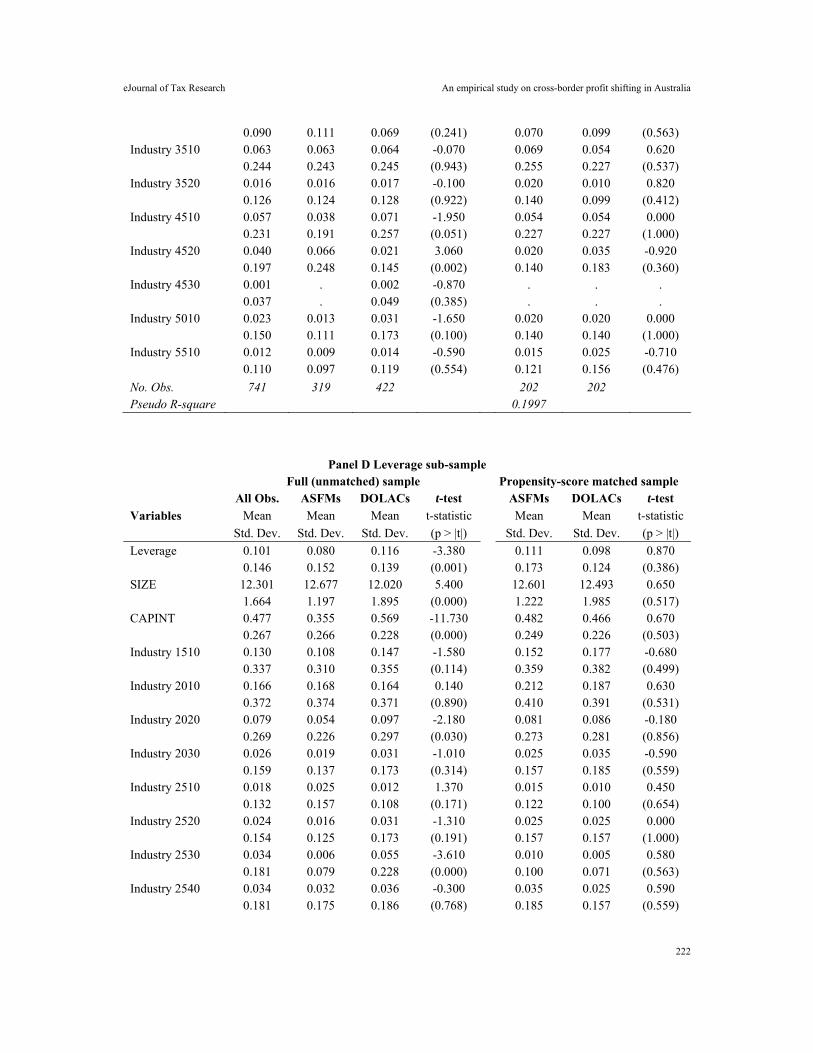
eJournal of Tax Research An empirical study on cross-border profit shifting in Australia
222
0.090 0.111 0.069 (0.241) 0.070 0.099 (0.563) Industry 3510 0.063 0.063 0.064 -0.070 0.069 0.054 0.620 0.244 0.243 0.245 (0.943) 0.255 0.227 (0.537) Industry 3520 0.016 0.016 0.017 -0.100 0.020 0.010 0.820 0.126 0.124 0.128 (0.922) 0.140 0.099 (0.412) Industry 4510 0.057 0.038 0.071 -1.950 0.054 0.054 0.000 0.231 0.191 0.257 (0.051) 0.227 0.227 (1.000) Industry 4520 0.040 0.066 0.021 3.060 0.020 0.035 -0.920 0.197 0.248 0.145 (0.002) 0.140 0.183 (0.360) Industry 4530 0.001 . 0.002 -0.870 . . . 0.037 . 0.049 (0.385) . . . Industry 5010 0.023 0.013 0.031 -1.650 0.020 0.020 0.000 0.150 0.111 0.173 (0.100) 0.140 0.140 (1.000) Industry 5510 0.012 0.009 0.014 -0.590 0.015 0.025 -0.710 0.110 0.097 0.119 (0.554) 0.121 0.156 (0.476) No. Obs. 741 319 422 202 202
Pseudo R-square 0.1997
Panel D Leverage sub-sample
Full (unmatched) sample Propensity-score matched sample
Variables
All Obs. ASFMs DOLACs t-test ASFMs DOLACs t-test Mean Mean Mean t-statistic Mean Mean t-statistic
Std. Dev. Std. Dev. Std. Dev. (p > |t|) Std. Dev. Std. Dev. (p > |t|)
Leverage 0.101 0.080 0.116 -3.380 0.111 0.098 0.870 0.146 0.152 0.139 (0.001) 0.173 0.124 (0.386) SIZE 12.301 12.677 12.020 5.400 12.601 12.493 0.650 1.664 1.197 1.895 (0.000) 1.222 1.985 (0.517) CAPINT 0.477 0.355 0.569 -11.730 0.482 0.466 0.670 0.267 0.266 0.228 (0.000) 0.249 0.226 (0.503) Industry 1510 0.130 0.108 0.147 -1.580 0.152 0.177 -0.680 0.337 0.310 0.355 (0.114) 0.359 0.382 (0.499) Industry 2010 0.166 0.168 0.164 0.140 0.212 0.187 0.630 0.372 0.374 0.371 (0.890) 0.410 0.391 (0.531) Industry 2020 0.079 0.054 0.097 -2.180 0.081 0.086 -0.180 0.269 0.226 0.297 (0.030) 0.273 0.281 (0.856) Industry 2030 0.026 0.019 0.031 -1.010 0.025 0.035 -0.590 0.159 0.137 0.173 (0.314) 0.157 0.185 (0.559) Industry 2510 0.018 0.025 0.012 1.370 0.015 0.010 0.450 0.132 0.157 0.108 (0.171) 0.122 0.100 (0.654) Industry 2520 0.024 0.016 0.031 -1.310 0.025 0.025 0.000 0.154 0.125 0.173 (0.191) 0.157 0.157 (1.000) Industry 2530 0.034 0.006 0.055 -3.610 0.010 0.005 0.580 0.181 0.079 0.228 (0.000) 0.100 0.071 (0.563) Industry 2540 0.034 0.032 0.036 -0.300 0.035 0.025 0.590 0.181 0.175 0.186 (0.768) 0.185 0.157 (0.559)
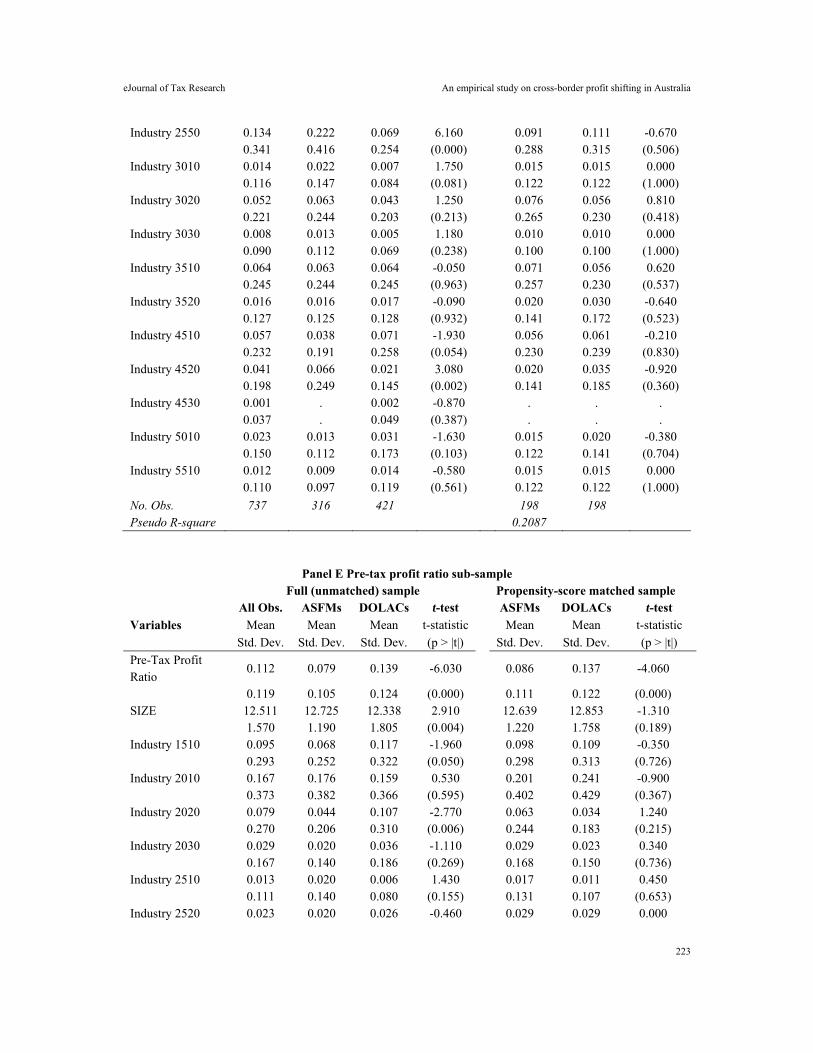
eJournal of Tax Research An empirical study on cross-border profit shifting in Australia
223
Industry 2550 0.134 0.222 0.069 6.160 0.091 0.111 -0.670 0.341 0.416 0.254 (0.000) 0.288 0.315 (0.506) Industry 3010 0.014 0.022 0.007 1.750 0.015 0.015 0.000 0.116 0.147 0.084 (0.081) 0.122 0.122 (1.000) Industry 3020 0.052 0.063 0.043 1.250 0.076 0.056 0.810 0.221 0.244 0.203 (0.213) 0.265 0.230 (0.418) Industry 3030 0.008 0.013 0.005 1.180 0.010 0.010 0.000 0.090 0.112 0.069 (0.238) 0.100 0.100 (1.000) Industry 3510 0.064 0.063 0.064 -0.050 0.071 0.056 0.620 0.245 0.244 0.245 (0.963) 0.257 0.230 (0.537) Industry 3520 0.016 0.016 0.017 -0.090 0.020 0.030 -0.640 0.127 0.125 0.128 (0.932) 0.141 0.172 (0.523) Industry 4510 0.057 0.038 0.071 -1.930 0.056 0.061 -0.210 0.232 0.191 0.258 (0.054) 0.230 0.239 (0.830) Industry 4520 0.041 0.066 0.021 3.080 0.020 0.035 -0.920 0.198 0.249 0.145 (0.002) 0.141 0.185 (0.360) Industry 4530 0.001 . 0.002 -0.870 . . . 0.037 . 0.049 (0.387) . . . Industry 5010 0.023 0.013 0.031 -1.630 0.015 0.020 -0.380 0.150 0.112 0.173 (0.103) 0.122 0.141 (0.704) Industry 5510 0.012 0.009 0.014 -0.580 0.015 0.015 0.000 0.110 0.097 0.119 (0.561) 0.122 0.122 (1.000) No. Obs. 737 316 421 198 198
Pseudo R-square 0.2087
Panel E Pre-tax profit ratio sub-sample Full (unmatched) sample Propensity-score matched sample
Variables
All Obs. ASFMs DOLACs t-test ASFMs DOLACs t-test Mean Mean Mean t-statistic Mean Mean t-statistic
Std. Dev. Std. Dev. Std. Dev. (p > |t|) Std. Dev. Std. Dev. (p > |t|)
Pre-Tax Profit Ratio
0.112 0.079 0.139 -6.030 0.086 0.137 -4.060
0.119 0.105 0.124 (0.000) 0.111 0.122 (0.000) SIZE 12.511 12.725 12.338 2.910 12.639 12.853 -1.310 1.570 1.190 1.805 (0.004) 1.220 1.758 (0.189) Industry 1510 0.095 0.068 0.117 -1.960 0.098 0.109 -0.350 0.293 0.252 0.322 (0.050) 0.298 0.313 (0.726) Industry 2010 0.167 0.176 0.159 0.530 0.201 0.241 -0.900 0.373 0.382 0.366 (0.595) 0.402 0.429 (0.367) Industry 2020 0.079 0.044 0.107 -2.770 0.063 0.034 1.240 0.270 0.206 0.310 (0.006) 0.244 0.183 (0.215) Industry 2030 0.029 0.020 0.036 -1.110 0.029 0.023 0.340 0.167 0.140 0.186 (0.269) 0.168 0.150 (0.736) Industry 2510 0.013 0.020 0.006 1.430 0.017 0.011 0.450 0.111 0.140 0.080 (0.155) 0.131 0.107 (0.653) Industry 2520 0.023 0.020 0.026 -0.460 0.029 0.029 0.000
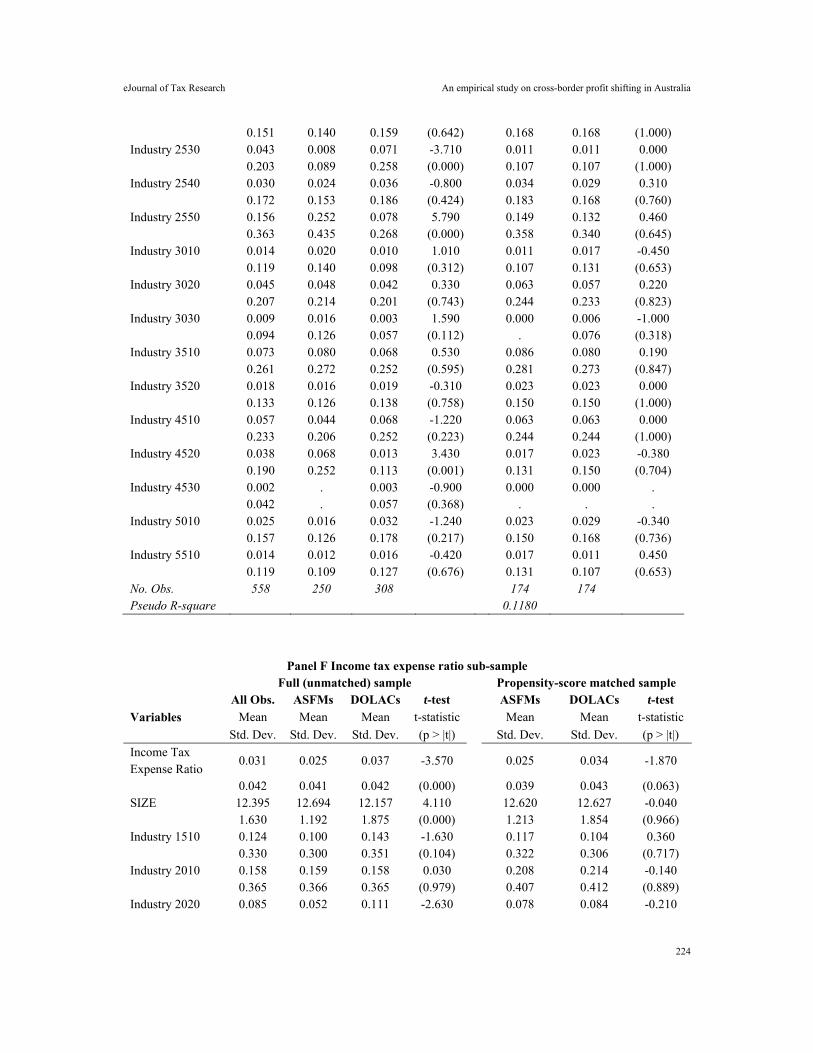
eJournal of Tax Research An empirical study on cross-border profit shifting in Australia
224
0.151 0.140 0.159 (0.642) 0.168 0.168 (1.000) Industry 2530 0.043 0.008 0.071 -3.710 0.011 0.011 0.000 0.203 0.089 0.258 (0.000) 0.107 0.107 (1.000) Industry 2540 0.030 0.024 0.036 -0.800 0.034 0.029 0.310 0.172 0.153 0.186 (0.424) 0.183 0.168 (0.760) Industry 2550 0.156 0.252 0.078 5.790 0.149 0.132 0.460 0.363 0.435 0.268 (0.000) 0.358 0.340 (0.645) Industry 3010 0.014 0.020 0.010 1.010 0.011 0.017 -0.450 0.119 0.140 0.098 (0.312) 0.107 0.131 (0.653) Industry 3020 0.045 0.048 0.042 0.330 0.063 0.057 0.220 0.207 0.214 0.201 (0.743) 0.244 0.233 (0.823) Industry 3030 0.009 0.016 0.003 1.590 0.000 0.006 -1.000 0.094 0.126 0.057 (0.112) . 0.076 (0.318) Industry 3510 0.073 0.080 0.068 0.530 0.086 0.080 0.190 0.261 0.272 0.252 (0.595) 0.281 0.273 (0.847) Industry 3520 0.018 0.016 0.019 -0.310 0.023 0.023 0.000 0.133 0.126 0.138 (0.758) 0.150 0.150 (1.000) Industry 4510 0.057 0.044 0.068 -1.220 0.063 0.063 0.000 0.233 0.206 0.252 (0.223) 0.244 0.244 (1.000) Industry 4520 0.038 0.068 0.013 3.430 0.017 0.023 -0.380 0.190 0.252 0.113 (0.001) 0.131 0.150 (0.704) Industry 4530 0.002 . 0.003 -0.900 0.000 0.000 . 0.042 . 0.057 (0.368) . . . Industry 5010 0.025 0.016 0.032 -1.240 0.023 0.029 -0.340 0.157 0.126 0.178 (0.217) 0.150 0.168 (0.736) Industry 5510 0.014 0.012 0.016 -0.420 0.017 0.011 0.450 0.119 0.109 0.127 (0.676) 0.131 0.107 (0.653) No. Obs. 558 250 308 174 174
Pseudo R-square 0.1180
Panel F Income tax expense ratio sub-sample
Full (unmatched) sample Propensity-score matched sample
Variables
All Obs. ASFMs DOLACs t-test ASFMs DOLACs t-test Mean Mean Mean t-statistic Mean Mean t-statistic
Std. Dev. Std. Dev. Std. Dev. (p > |t|) Std. Dev. Std. Dev. (p > |t|)
Income Tax Expense Ratio
0.031 0.025 0.037 -3.570 0.025 0.034 -1.870
0.042 0.041 0.042 (0.000) 0.039 0.043 (0.063) SIZE 12.395 12.694 12.157 4.110 12.620 12.627 -0.040 1.630 1.192 1.875 (0.000) 1.213 1.854 (0.966) Industry 1510 0.124 0.100 0.143 -1.630 0.117 0.104 0.360 0.330 0.300 0.351 (0.104) 0.322 0.306 (0.717) Industry 2010 0.158 0.159 0.158 0.030 0.208 0.214 -0.140 0.365 0.366 0.365 (0.979) 0.407 0.412 (0.889) Industry 2020 0.085 0.052 0.111 -2.630 0.078 0.084 -0.210
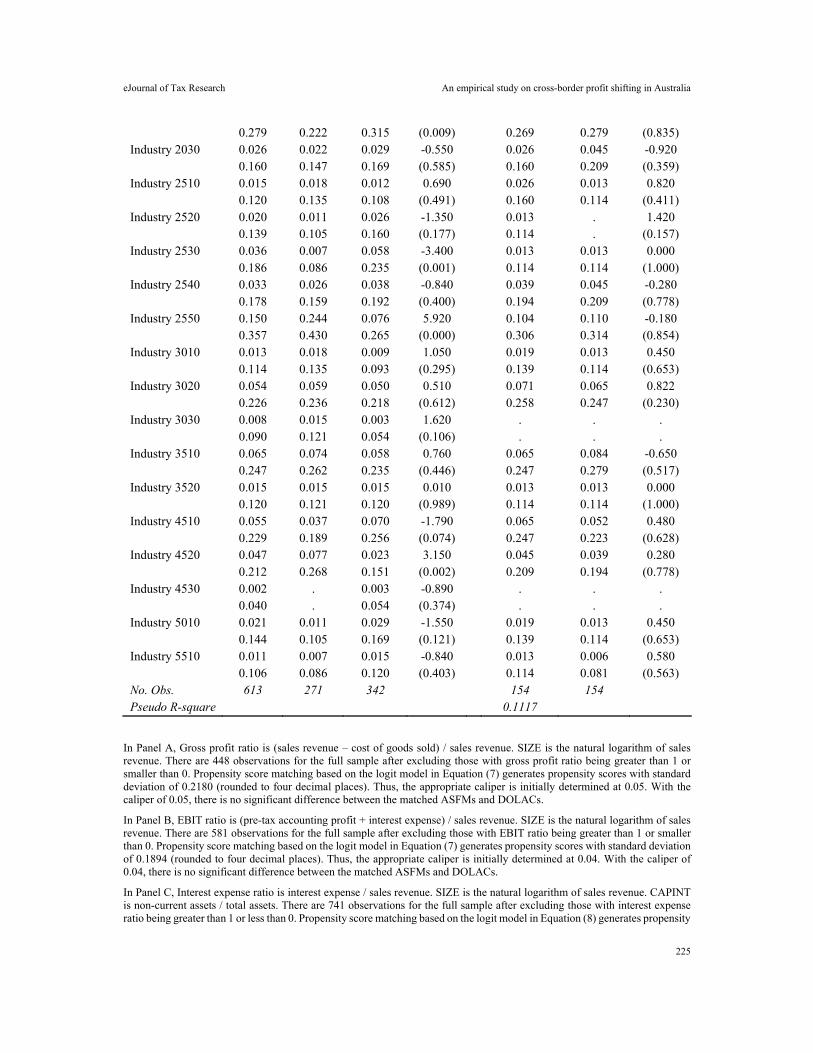
eJournal of Tax Research An empirical study on cross-border profit shifting in Australia
225
0.279 0.222 0.315 (0.009) 0.269 0.279 (0.835) Industry 2030 0.026 0.022 0.029 -0.550 0.026 0.045 -0.920 0.160 0.147 0.169 (0.585) 0.160 0.209 (0.359) Industry 2510 0.015 0.018 0.012 0.690 0.026 0.013 0.820 0.120 0.135 0.108 (0.491) 0.160 0.114 (0.411) Industry 2520 0.020 0.011 0.026 -1.350 0.013 . 1.420 0.139 0.105 0.160 (0.177) 0.114 . (0.157) Industry 2530 0.036 0.007 0.058 -3.400 0.013 0.013 0.000 0.186 0.086 0.235 (0.001) 0.114 0.114 (1.000) Industry 2540 0.033 0.026 0.038 -0.840 0.039 0.045 -0.280 0.178 0.159 0.192 (0.400) 0.194 0.209 (0.778) Industry 2550 0.150 0.244 0.076 5.920 0.104 0.110 -0.180 0.357 0.430 0.265 (0.000) 0.306 0.314 (0.854) Industry 3010 0.013 0.018 0.009 1.050 0.019 0.013 0.450 0.114 0.135 0.093 (0.295) 0.139 0.114 (0.653) Industry 3020 0.054 0.059 0.050 0.510 0.071 0.065 0.822 0.226 0.236 0.218 (0.612) 0.258 0.247 (0.230) Industry 3030 0.008 0.015 0.003 1.620 . . . 0.090 0.121 0.054 (0.106) . . . Industry 3510 0.065 0.074 0.058 0.760 0.065 0.084 -0.650 0.247 0.262 0.235 (0.446) 0.247 0.279 (0.517) Industry 3520 0.015 0.015 0.015 0.010 0.013 0.013 0.000 0.120 0.121 0.120 (0.989) 0.114 0.114 (1.000) Industry 4510 0.055 0.037 0.070 -1.790 0.065 0.052 0.480 0.229 0.189 0.256 (0.074) 0.247 0.223 (0.628) Industry 4520 0.047 0.077 0.023 3.150 0.045 0.039 0.280 0.212 0.268 0.151 (0.002) 0.209 0.194 (0.778) Industry 4530 0.002 . 0.003 -0.890 . . . 0.040 . 0.054 (0.374) . . . Industry 5010 0.021 0.011 0.029 -1.550 0.019 0.013 0.450 0.144 0.105 0.169 (0.121) 0.139 0.114 (0.653) Industry 5510 0.011 0.007 0.015 -0.840 0.013 0.006 0.580 0.106 0.086 0.120 (0.403) 0.114 0.081 (0.563) No. Obs. 613 271 342 154 154
Pseudo R-square 0.1117
In Panel A, Gross profit ratio is (sales revenue – cost of goods sold) / sales revenue. SIZE is the natural logarithm of sales revenue. There are 448 observations for the full sample after excluding those with gross profit ratio being greater than 1 or smaller than 0. Propensity score matching based on the logit model in Equation (7) generates propensity scores with standard deviation of 0.2180 (rounded to four decimal places). Thus, the appropriate caliper is initially determined at 0.05. With the caliper of 0.05, there is no significant difference between the matched ASFMs and DOLACs.
In Panel B, EBIT ratio is (pre-tax accounting profit + interest expense) / sales revenue. SIZE is the natural logarithm of sales revenue. There are 581 observations for the full sample after excluding those with EBIT ratio being greater than 1 or smaller than 0. Propensity score matching based on the logit model in Equation (7) generates propensity scores with standard deviation of 0.1894 (rounded to four decimal places). Thus, the appropriate caliper is initially determined at 0.04. With the caliper of 0.04, there is no significant difference between the matched ASFMs and DOLACs.
In Panel C, Interest expense ratio is interest expense / sales revenue. SIZE is the natural logarithm of sales revenue. CAPINT is non-current assets / total assets. There are 741 observations for the full sample after excluding those with interest expense ratio being greater than 1 or less than 0. Propensity score matching based on the logit model in Equation (8) generates propensity
eJournal of Tax Research An empirical study on cross-border profit shifting in Australia
226
scores with standard deviation of 0.2471 (rounded to four decimal places). Thus, the appropriate caliper is initially determined at 0.06. With the caliper of 0.06, there is no significant difference between the matched ASFMs and DOLACs.
In Panel D, Leverage is long-term borrowings / total assets. SIZE is the natural logarithm of sales revenue. CAPINT is non-current assets / total assets. There are 737 observations for the full sample after excluding those with leverage being greater than 1 or less than 0. Propensity score matching based on the logit model in Equation (8) generates propensity scores with standard deviation of 0.2517 (rounded to four decimal places). Thus, the appropriate caliper is initially determined at 0.06. With the caliper of 0.06, there is no significant difference between the matched ASFMs and DOLACs.
In Panel E, Pre-tax profit ratio is pre-tax accounting profit / sales revenue. SIZE is the natural logarithm of sales revenue. There are 558 observations for the full sample after excluding those with pre-tax profit ratio being greater than 1 or less than 0. Propensity score matching based on the logit model in Equation (7) generates propensity scores with standard deviation of 0.1942 (rounded to four decimal places). Thus, the appropriate caliper is initially determined at 0.04. With the caliper of 0.04, there is no significant difference between the matched ASFMs and DOLACs.
In Panel F, Income tax expense ratio is income tax expense / sales revenue. SIZE is the natural logarithm of sales revenue. There are 613 observations for the full sample after excluding those with income tax expense ratio being greater than 1 or less than 0. Propensity score matching based on the logit model in Equation (7) generates propensity scores with standard deviation of 0.1891 (rounded to four decimal places). Thus, the appropriate caliper is initially determined at 0.04. With the caliper of 0.04, there are significant difference between the matched ASFMs and DOLACs. The caliper is further reduced to 0.003 when a matched sample of ASFMs and DOLACs is reached.
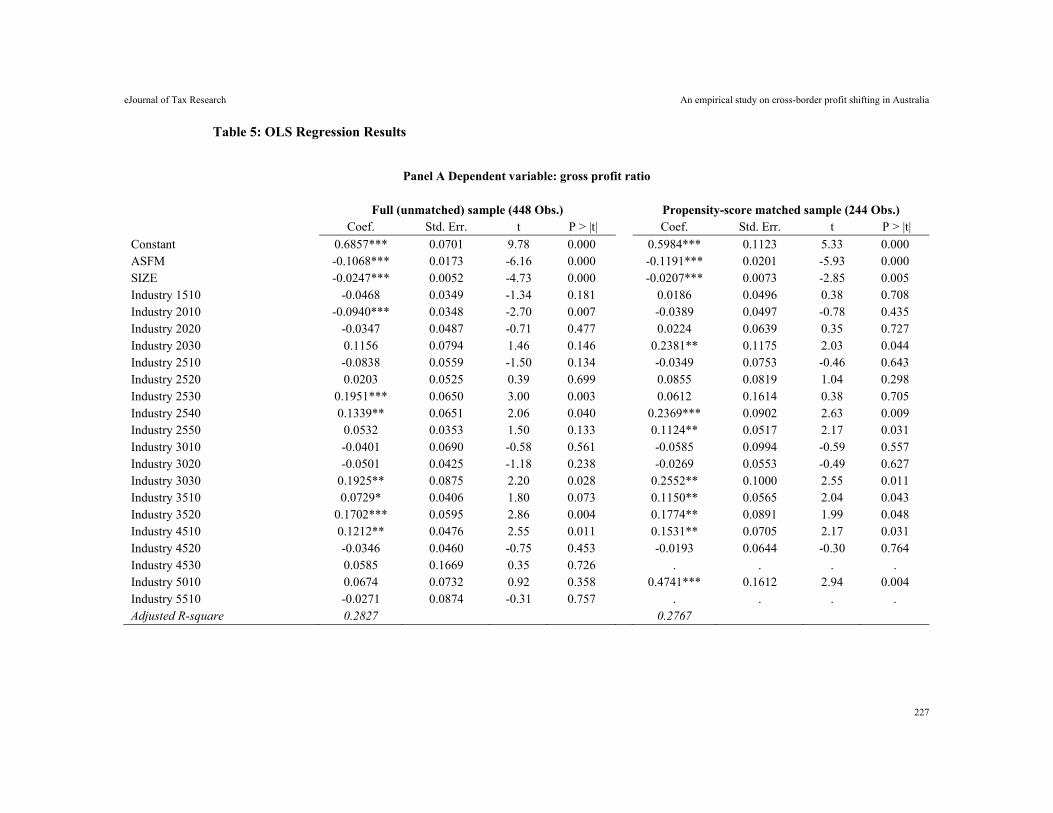
eJournal of Tax Research An empirical study on cross-border profit shifting in Australia
227
Table 5: OLS Regression Results
Panel A Dependent variable: gross profit ratio
Full (unmatched) sample (448 Obs.) Propensity-score matched sample (244 Obs.) Coef. Std. Err. t P > |t| Coef. Std. Err. t P > |t|
Constant 0.6857*** 0.0701 9.78 0.000 0.5984*** 0.1123 5.33 0.000 ASFM -0.1068*** 0.0173 -6.16 0.000 -0.1191*** 0.0201 -5.93 0.000 SIZE -0.0247*** 0.0052 -4.73 0.000 -0.0207*** 0.0073 -2.85 0.005 Industry 1510 -0.0468 0.0349 -1.34 0.181 0.0186 0.0496 0.38 0.708 Industry 2010 -0.0940*** 0.0348 -2.70 0.007 -0.0389 0.0497 -0.78 0.435 Industry 2020 -0.0347 0.0487 -0.71 0.477 0.0224 0.0639 0.35 0.727 Industry 2030 0.1156 0.0794 1.46 0.146 0.2381** 0.1175 2.03 0.044 Industry 2510 -0.0838 0.0559 -1.50 0.134 -0.0349 0.0753 -0.46 0.643 Industry 2520 0.0203 0.0525 0.39 0.699 0.0855 0.0819 1.04 0.298 Industry 2530 0.1951*** 0.0650 3.00 0.003 0.0612 0.1614 0.38 0.705 Industry 2540 0.1339** 0.0651 2.06 0.040 0.2369*** 0.0902 2.63 0.009 Industry 2550 0.0532 0.0353 1.50 0.133 0.1124** 0.0517 2.17 0.031 Industry 3010 -0.0401 0.0690 -0.58 0.561 -0.0585 0.0994 -0.59 0.557 Industry 3020 -0.0501 0.0425 -1.18 0.238 -0.0269 0.0553 -0.49 0.627 Industry 3030 0.1925** 0.0875 2.20 0.028 0.2552** 0.1000 2.55 0.011 Industry 3510 0.0729* 0.0406 1.80 0.073 0.1150** 0.0565 2.04 0.043 Industry 3520 0.1702*** 0.0595 2.86 0.004 0.1774** 0.0891 1.99 0.048 Industry 4510 0.1212** 0.0476 2.55 0.011 0.1531** 0.0705 2.17 0.031 Industry 4520 -0.0346 0.0460 -0.75 0.453 -0.0193 0.0644 -0.30 0.764 Industry 4530 0.0585 0.1669 0.35 0.726 . . . . Industry 5010 0.0674 0.0732 0.92 0.358 0.4741*** 0.1612 2.94 0.004 Industry 5510 -0.0271 0.0874 -0.31 0.757 . . . . Adjusted R-square 0.2827 0.2767
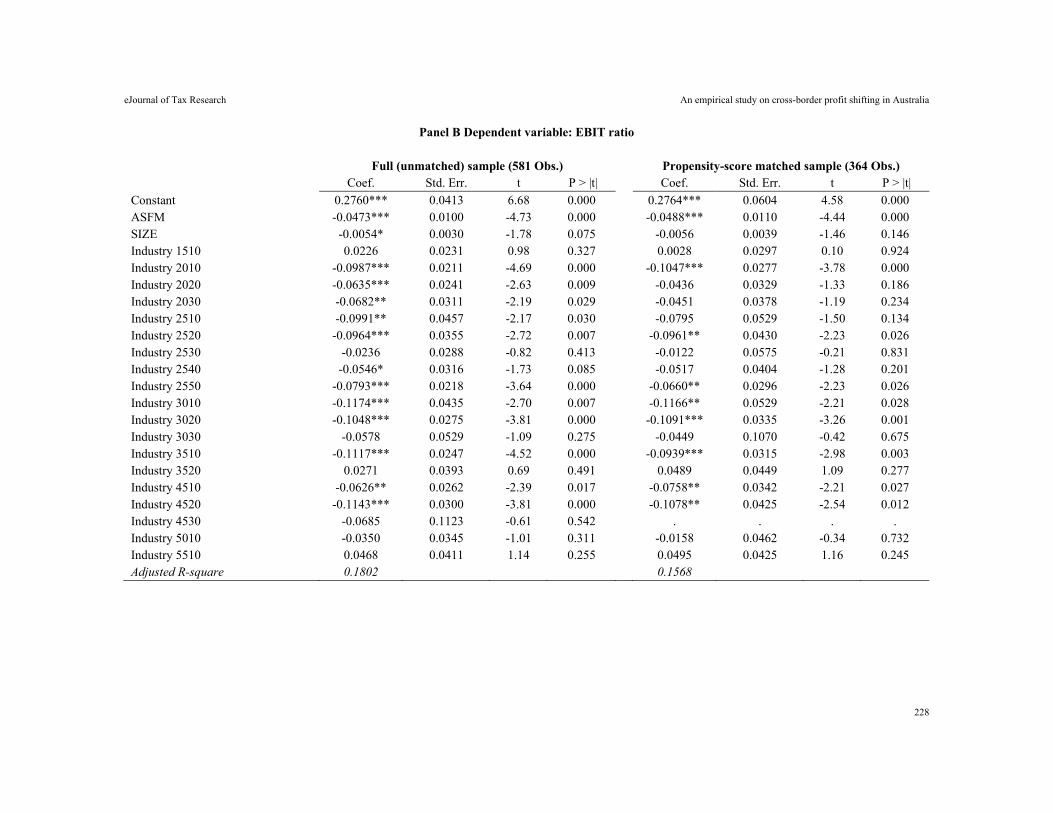
eJournal of Tax Research An empirical study on cross-border profit shifting in Australia
228
Panel B Dependent variable: EBIT ratio
Full (unmatched) sample (581 Obs.) Propensity-score matched sample (364 Obs.) Coef. Std. Err. t P > |t| Coef. Std. Err. t P > |t|
Constant 0.2760*** 0.0413 6.68 0.000 0.2764*** 0.0604 4.58 0.000 ASFM -0.0473*** 0.0100 -4.73 0.000 -0.0488*** 0.0110 -4.44 0.000 SIZE -0.0054* 0.0030 -1.78 0.075 -0.0056 0.0039 -1.46 0.146 Industry 1510 0.0226 0.0231 0.98 0.327 0.0028 0.0297 0.10 0.924 Industry 2010 -0.0987*** 0.0211 -4.69 0.000 -0.1047*** 0.0277 -3.78 0.000 Industry 2020 -0.0635*** 0.0241 -2.63 0.009 -0.0436 0.0329 -1.33 0.186 Industry 2030 -0.0682** 0.0311 -2.19 0.029 -0.0451 0.0378 -1.19 0.234 Industry 2510 -0.0991** 0.0457 -2.17 0.030 -0.0795 0.0529 -1.50 0.134 Industry 2520 -0.0964*** 0.0355 -2.72 0.007 -0.0961** 0.0430 -2.23 0.026 Industry 2530 -0.0236 0.0288 -0.82 0.413 -0.0122 0.0575 -0.21 0.831 Industry 2540 -0.0546* 0.0316 -1.73 0.085 -0.0517 0.0404 -1.28 0.201 Industry 2550 -0.0793*** 0.0218 -3.64 0.000 -0.0660** 0.0296 -2.23 0.026 Industry 3010 -0.1174*** 0.0435 -2.70 0.007 -0.1166** 0.0529 -2.21 0.028 Industry 3020 -0.1048*** 0.0275 -3.81 0.000 -0.1091*** 0.0335 -3.26 0.001 Industry 3030 -0.0578 0.0529 -1.09 0.275 -0.0449 0.1070 -0.42 0.675 Industry 3510 -0.1117*** 0.0247 -4.52 0.000 -0.0939*** 0.0315 -2.98 0.003 Industry 3520 0.0271 0.0393 0.69 0.491 0.0489 0.0449 1.09 0.277 Industry 4510 -0.0626** 0.0262 -2.39 0.017 -0.0758** 0.0342 -2.21 0.027 Industry 4520 -0.1143*** 0.0300 -3.81 0.000 -0.1078** 0.0425 -2.54 0.012 Industry 4530 -0.0685 0.1123 -0.61 0.542 . . . . Industry 5010 -0.0350 0.0345 -1.01 0.311 -0.0158 0.0462 -0.34 0.732 Industry 5510 0.0468 0.0411 1.14 0.255 0.0495 0.0425 1.16 0.245 Adjusted R-square 0.1802 0.1568
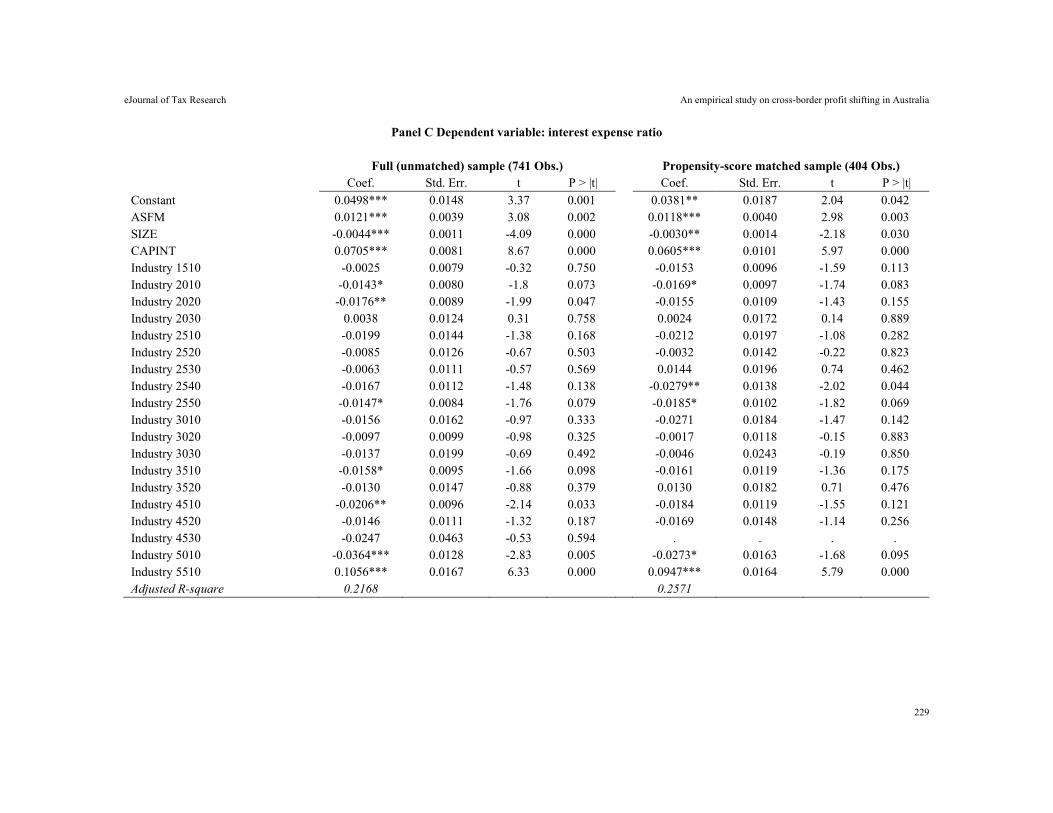
eJournal of Tax Research An empirical study on cross-border profit shifting in Australia
229
Panel C Dependent variable: interest expense ratio
Full (unmatched) sample (741 Obs.) Propensity-score matched sample (404 Obs.) Coef. Std. Err. t P > |t| Coef. Std. Err. t P > |t|
Constant 0.0498*** 0.0148 3.37 0.001 0.0381** 0.0187 2.04 0.042 ASFM 0.0121*** 0.0039 3.08 0.002 0.0118*** 0.0040 2.98 0.003 SIZE -0.0044*** 0.0011 -4.09 0.000 -0.0030** 0.0014 -2.18 0.030 CAPINT 0.0705*** 0.0081 8.67 0.000 0.0605*** 0.0101 5.97 0.000 Industry 1510 -0.0025 0.0079 -0.32 0.750 -0.0153 0.0096 -1.59 0.113 Industry 2010 -0.0143* 0.0080 -1.8 0.073 -0.0169* 0.0097 -1.74 0.083 Industry 2020 -0.0176** 0.0089 -1.99 0.047 -0.0155 0.0109 -1.43 0.155 Industry 2030 0.0038 0.0124 0.31 0.758 0.0024 0.0172 0.14 0.889 Industry 2510 -0.0199 0.0144 -1.38 0.168 -0.0212 0.0197 -1.08 0.282 Industry 2520 -0.0085 0.0126 -0.67 0.503 -0.0032 0.0142 -0.22 0.823 Industry 2530 -0.0063 0.0111 -0.57 0.569 0.0144 0.0196 0.74 0.462 Industry 2540 -0.0167 0.0112 -1.48 0.138 -0.0279** 0.0138 -2.02 0.044 Industry 2550 -0.0147* 0.0084 -1.76 0.079 -0.0185* 0.0102 -1.82 0.069 Industry 3010 -0.0156 0.0162 -0.97 0.333 -0.0271 0.0184 -1.47 0.142 Industry 3020 -0.0097 0.0099 -0.98 0.325 -0.0017 0.0118 -0.15 0.883 Industry 3030 -0.0137 0.0199 -0.69 0.492 -0.0046 0.0243 -0.19 0.850 Industry 3510 -0.0158* 0.0095 -1.66 0.098 -0.0161 0.0119 -1.36 0.175 Industry 3520 -0.0130 0.0147 -0.88 0.379 0.0130 0.0182 0.71 0.476 Industry 4510 -0.0206** 0.0096 -2.14 0.033 -0.0184 0.0119 -1.55 0.121 Industry 4520 -0.0146 0.0111 -1.32 0.187 -0.0169 0.0148 -1.14 0.256 Industry 4530 -0.0247 0.0463 -0.53 0.594 . . . . Industry 5010 -0.0364*** 0.0128 -2.83 0.005 -0.0273* 0.0163 -1.68 0.095 Industry 5510 0.1056*** 0.0167 6.33 0.000 0.0947*** 0.0164 5.79 0.000 Adjusted R-square 0.2168 0.2571
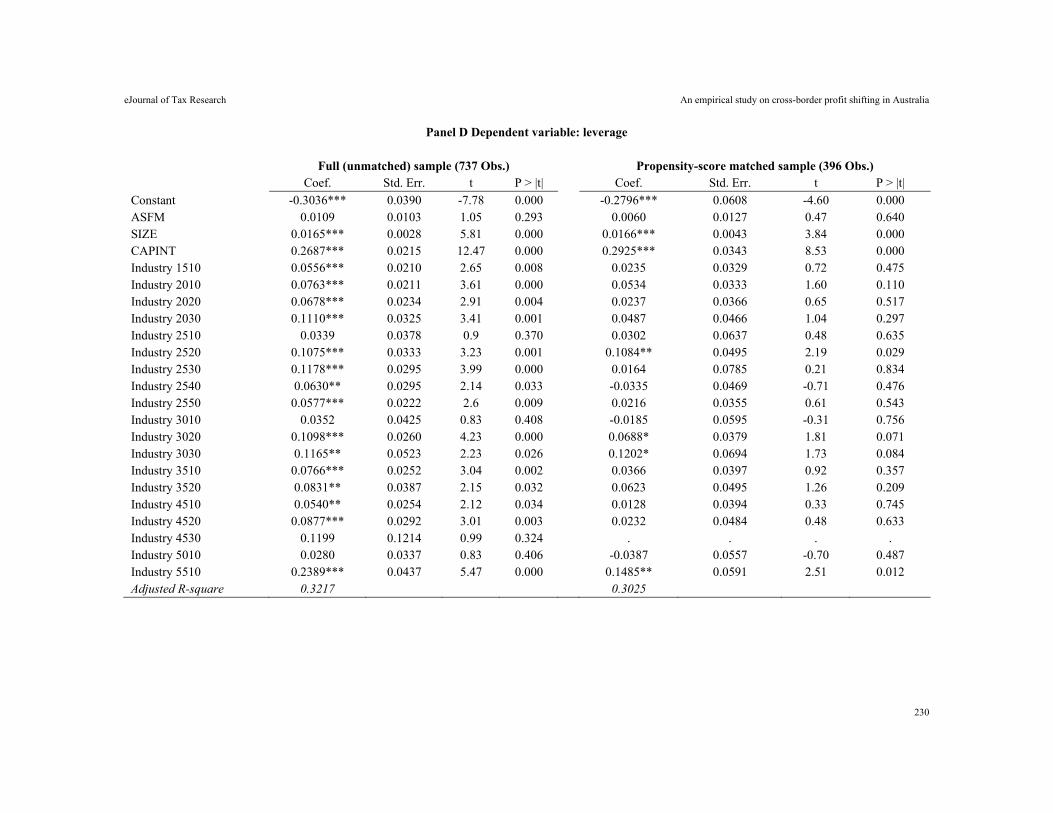
eJournal of Tax Research An empirical study on cross-border profit shifting in Australia
230
Panel D Dependent variable: leverage
Full (unmatched) sample (737 Obs.) Propensity-score matched sample (396 Obs.) Coef. Std. Err. t P > |t| Coef. Std. Err. t P > |t|
Constant -0.3036*** 0.0390 -7.78 0.000 -0.2796*** 0.0608 -4.60 0.000 ASFM 0.0109 0.0103 1.05 0.293 0.0060 0.0127 0.47 0.640 SIZE 0.0165*** 0.0028 5.81 0.000 0.0166*** 0.0043 3.84 0.000 CAPINT 0.2687*** 0.0215 12.47 0.000 0.2925*** 0.0343 8.53 0.000 Industry 1510 0.0556*** 0.0210 2.65 0.008 0.0235 0.0329 0.72 0.475 Industry 2010 0.0763*** 0.0211 3.61 0.000 0.0534 0.0333 1.60 0.110 Industry 2020 0.0678*** 0.0234 2.91 0.004 0.0237 0.0366 0.65 0.517 Industry 2030 0.1110*** 0.0325 3.41 0.001 0.0487 0.0466 1.04 0.297 Industry 2510 0.0339 0.0378 0.9 0.370 0.0302 0.0637 0.48 0.635 Industry 2520 0.1075*** 0.0333 3.23 0.001 0.1084** 0.0495 2.19 0.029 Industry 2530 0.1178*** 0.0295 3.99 0.000 0.0164 0.0785 0.21 0.834 Industry 2540 0.0630** 0.0295 2.14 0.033 -0.0335 0.0469 -0.71 0.476 Industry 2550 0.0577*** 0.0222 2.6 0.009 0.0216 0.0355 0.61 0.543 Industry 3010 0.0352 0.0425 0.83 0.408 -0.0185 0.0595 -0.31 0.756 Industry 3020 0.1098*** 0.0260 4.23 0.000 0.0688* 0.0379 1.81 0.071 Industry 3030 0.1165** 0.0523 2.23 0.026 0.1202* 0.0694 1.73 0.084 Industry 3510 0.0766*** 0.0252 3.04 0.002 0.0366 0.0397 0.92 0.357 Industry 3520 0.0831** 0.0387 2.15 0.032 0.0623 0.0495 1.26 0.209 Industry 4510 0.0540** 0.0254 2.12 0.034 0.0128 0.0394 0.33 0.745 Industry 4520 0.0877*** 0.0292 3.01 0.003 0.0232 0.0484 0.48 0.633 Industry 4530 0.1199 0.1214 0.99 0.324 . . . . Industry 5010 0.0280 0.0337 0.83 0.406 -0.0387 0.0557 -0.70 0.487 Industry 5510 0.2389*** 0.0437 5.47 0.000 0.1485** 0.0591 2.51 0.012 Adjusted R-square 0.3217 0.3025
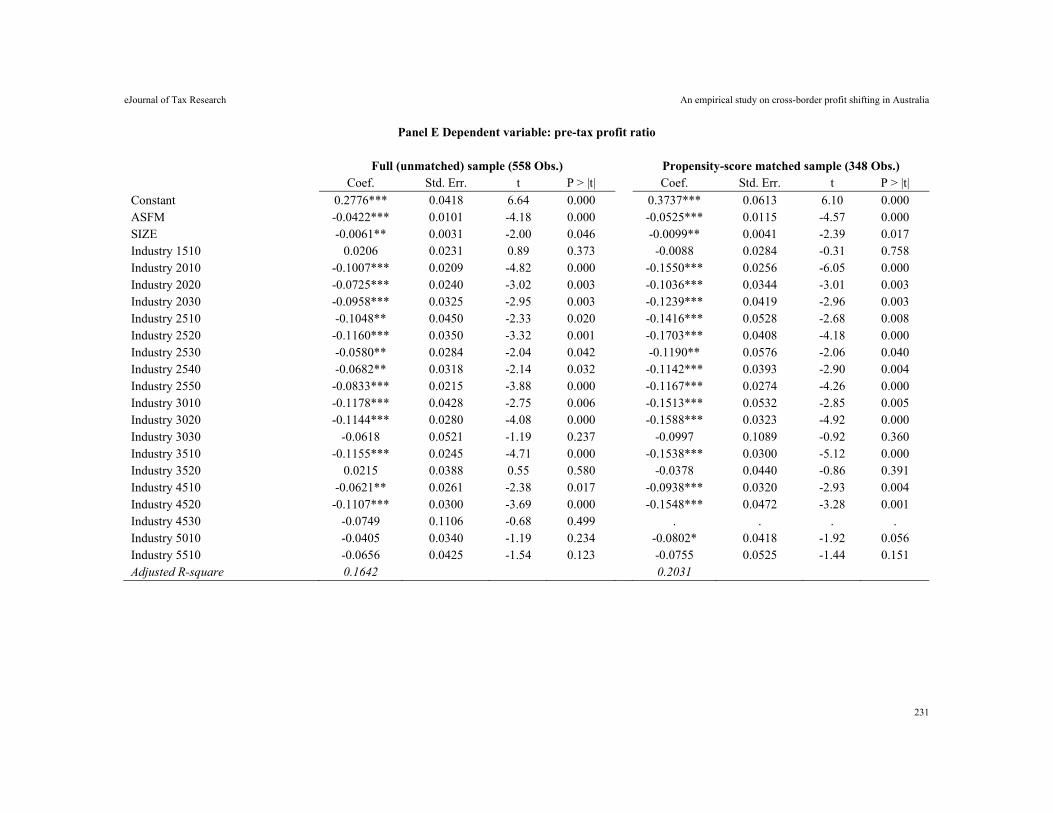
eJournal of Tax Research An empirical study on cross-border profit shifting in Australia
231
Panel E Dependent variable: pre-tax profit ratio
Full (unmatched) sample (558 Obs.) Propensity-score matched sample (348 Obs.) Coef. Std. Err. t P > |t| Coef. Std. Err. t P > |t|
Constant 0.2776*** 0.0418 6.64 0.000 0.3737*** 0.0613 6.10 0.000 ASFM -0.0422*** 0.0101 -4.18 0.000 -0.0525*** 0.0115 -4.57 0.000 SIZE -0.0061** 0.0031 -2.00 0.046 -0.0099** 0.0041 -2.39 0.017 Industry 1510 0.0206 0.0231 0.89 0.373 -0.0088 0.0284 -0.31 0.758 Industry 2010 -0.1007*** 0.0209 -4.82 0.000 -0.1550*** 0.0256 -6.05 0.000 Industry 2020 -0.0725*** 0.0240 -3.02 0.003 -0.1036*** 0.0344 -3.01 0.003 Industry 2030 -0.0958*** 0.0325 -2.95 0.003 -0.1239*** 0.0419 -2.96 0.003 Industry 2510 -0.1048** 0.0450 -2.33 0.020 -0.1416*** 0.0528 -2.68 0.008 Industry 2520 -0.1160*** 0.0350 -3.32 0.001 -0.1703*** 0.0408 -4.18 0.000 Industry 2530 -0.0580** 0.0284 -2.04 0.042 -0.1190** 0.0576 -2.06 0.040 Industry 2540 -0.0682** 0.0318 -2.14 0.032 -0.1142*** 0.0393 -2.90 0.004 Industry 2550 -0.0833*** 0.0215 -3.88 0.000 -0.1167*** 0.0274 -4.26 0.000 Industry 3010 -0.1178*** 0.0428 -2.75 0.006 -0.1513*** 0.0532 -2.85 0.005 Industry 3020 -0.1144*** 0.0280 -4.08 0.000 -0.1588*** 0.0323 -4.92 0.000 Industry 3030 -0.0618 0.0521 -1.19 0.237 -0.0997 0.1089 -0.92 0.360 Industry 3510 -0.1155*** 0.0245 -4.71 0.000 -0.1538*** 0.0300 -5.12 0.000 Industry 3520 0.0215 0.0388 0.55 0.580 -0.0378 0.0440 -0.86 0.391 Industry 4510 -0.0621** 0.0261 -2.38 0.017 -0.0938*** 0.0320 -2.93 0.004 Industry 4520 -0.1107*** 0.0300 -3.69 0.000 -0.1548*** 0.0472 -3.28 0.001 Industry 4530 -0.0749 0.1106 -0.68 0.499 . . . . Industry 5010 -0.0405 0.0340 -1.19 0.234 -0.0802* 0.0418 -1.92 0.056 Industry 5510 -0.0656 0.0425 -1.54 0.123 -0.0755 0.0525 -1.44 0.151 Adjusted R-square 0.1642 0.2031
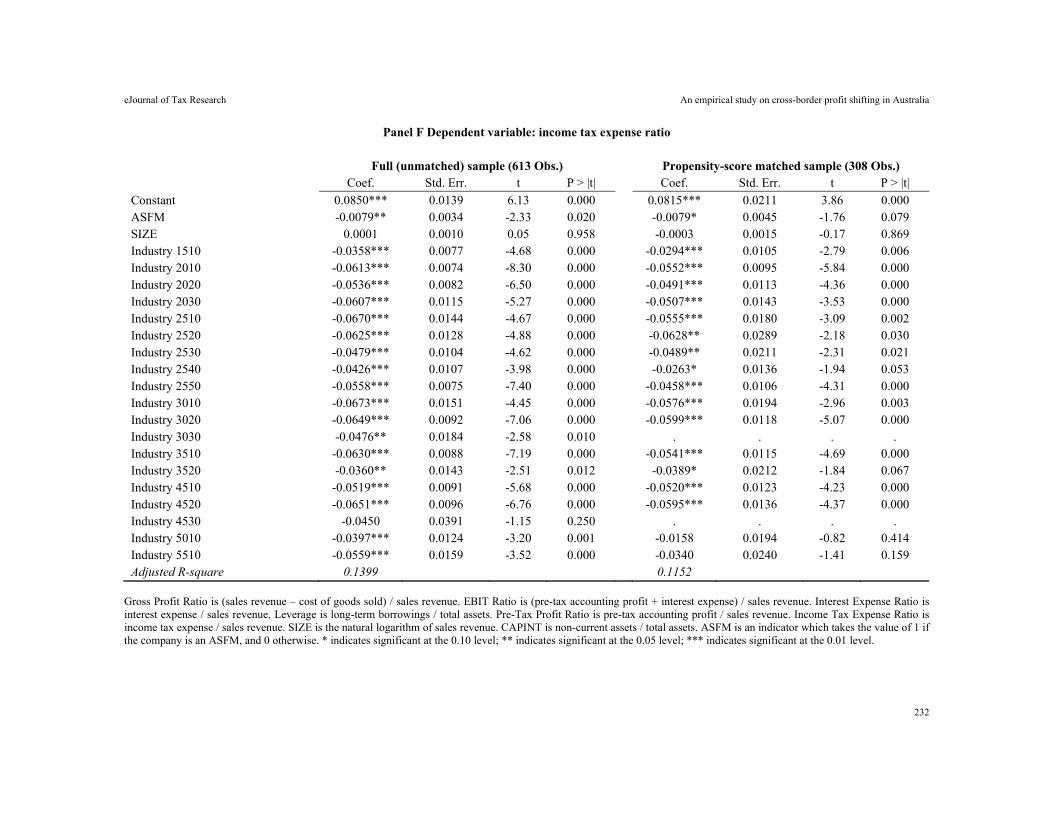
eJournal of Tax Research An empirical study on cross-border profit shifting in Australia
232
Panel F Dependent variable: income tax expense ratio
Full (unmatched) sample (613 Obs.) Propensity-score matched sample (308 Obs.) Coef. Std. Err. t P > |t| Coef. Std. Err. t P > |t|
Constant 0.0850*** 0.0139 6.13 0.000 0.0815*** 0.0211 3.86 0.000 ASFM -0.0079** 0.0034 -2.33 0.020 -0.0079* 0.0045 -1.76 0.079 SIZE 0.0001 0.0010 0.05 0.958 -0.0003 0.0015 -0.17 0.869 Industry 1510 -0.0358*** 0.0077 -4.68 0.000 -0.0294*** 0.0105 -2.79 0.006 Industry 2010 -0.0613*** 0.0074 -8.30 0.000 -0.0552*** 0.0095 -5.84 0.000 Industry 2020 -0.0536*** 0.0082 -6.50 0.000 -0.0491*** 0.0113 -4.36 0.000 Industry 2030 -0.0607*** 0.0115 -5.27 0.000 -0.0507*** 0.0143 -3.53 0.000 Industry 2510 -0.0670*** 0.0144 -4.67 0.000 -0.0555*** 0.0180 -3.09 0.002 Industry 2520 -0.0625*** 0.0128 -4.88 0.000 -0.0628** 0.0289 -2.18 0.030 Industry 2530 -0.0479*** 0.0104 -4.62 0.000 -0.0489** 0.0211 -2.31 0.021 Industry 2540 -0.0426*** 0.0107 -3.98 0.000 -0.0263* 0.0136 -1.94 0.053 Industry 2550 -0.0558*** 0.0075 -7.40 0.000 -0.0458*** 0.0106 -4.31 0.000 Industry 3010 -0.0673*** 0.0151 -4.45 0.000 -0.0576*** 0.0194 -2.96 0.003 Industry 3020 -0.0649*** 0.0092 -7.06 0.000 -0.0599*** 0.0118 -5.07 0.000 Industry 3030 -0.0476** 0.0184 -2.58 0.010 . . . . Industry 3510 -0.0630*** 0.0088 -7.19 0.000 -0.0541*** 0.0115 -4.69 0.000 Industry 3520 -0.0360** 0.0143 -2.51 0.012 -0.0389* 0.0212 -1.84 0.067 Industry 4510 -0.0519*** 0.0091 -5.68 0.000 -0.0520*** 0.0123 -4.23 0.000 Industry 4520 -0.0651*** 0.0096 -6.76 0.000 -0.0595*** 0.0136 -4.37 0.000 Industry 4530 -0.0450 0.0391 -1.15 0.250 . . . . Industry 5010 -0.0397*** 0.0124 -3.20 0.001 -0.0158 0.0194 -0.82 0.414 Industry 5510 -0.0559*** 0.0159 -3.52 0.000 -0.0340 0.0240 -1.41 0.159 Adjusted R-square 0.1399 0.1152
Gross Profit Ratio is (sales revenue – cost of goods sold) / sales revenue. EBIT Ratio is (pre-tax accounting profit + interest expense) / sales revenue. Interest Expense Ratio is interest expense / sales revenue. Leverage is long-term borrowings / total assets. Pre-Tax Profit Ratio is pre-tax accounting profit / sales revenue. Income Tax Expense Ratio is income tax expense / sales revenue. SIZE is the natural logarithm of sales revenue. CAPINT is non-current assets / total assets. ASFM is an indicator which takes the value of 1 if the company is an ASFM, and 0 otherwise. * indicates significant at the 0.10 level; ** indicates significant at the 0.05 level; *** indicates significant at the 0.01 level.
eJournal of Tax Research (2020) vol. 17, no. 2, pp. 233-257
233
Curtailing aggressive tax planning: the case for introducing mandatory disclosure rules in Australia (part 2) – cues from the United Kingdom and South Africa
Annet Wanyana Oguttu and Ann Kayis-Kumar
Abstract
Increased opportunities for aggressive tax planning (ATP) schemes by multinationals has heightened pressure on governments and policy-makers to curtail these activities. However, the design of most anti-avoidance rules is reactive rather than proactive. One exception is the use of mandatory disclosure rules (MDRs), which require the upfront disclosure of tax information. Part 1 of this two-part study in the previous issue of this journal explored the case for introducing MDRs by presenting a case study of Australia’s experience in considering whether to adopt such a regime. This article (part 2) explores the key design features of an effective MDR regime with reference to the OECD’s recommendations and a comparative legal analysis of how these rules apply in the UK and South African contexts. This provides the framework for a review of the effectiveness of MDRs and presents useful ‘lessons learnt’ which are informative in framing a regime suitable for adoption in other Commonwealth law jurisdictions such as Australia.
Key words: mandatory disclosure rules, aggressive tax planning, multinationals, international tax law
Professor in the Department of Taxation and the African Tax Institute, Faculty of Economic and Management Sciences, University of Pretoria. This article (written in collaboration with an academic at the School of Taxation and Business Law, UNSW) is in fulfilment of the duties required of the author as a recipient of the 2017 Abe Greenbaum Research Fellowship of the School of Taxation and Business Law, UNSW Sydney. Senior Lecturer in the School of Taxation and Business Law, UNSW Sydney.
eJournal of Tax Research The case for introducing mandatory disclosure rules in Australia (part 2)
234
1. INTRODUCTION
Aggressive tax planning (ATP) has been postulated as one the main challenges that tax administrations would face in ensuring compliance with tax legislation in the coming years.1 Part 1 of this study, in the previous issue of this journal, delineated the concept of ATP, namely tax planning that goes beyond what is legally acceptable in that it makes use of artificial transactions that have little or no economic impact and conflict with the intention of countries’ tax legislation. Part 1 explained that, despite the fact that countries have various anti-avoidance rules – including penalty regimes, tax rulings and disclosure regimes2 – tax administrations are still not able to respond quickly and adequately to prevent ATP schemes, due to the lack of timely, targeted and comprehensive information on ATP schemes.3 Tax administrations usually detect these schemes by auditing taxpayers’ returns, which is followed by enactment of anti-avoidance rules. While audits remain a key source of relevant information, the inevitable delays in the rule-making process imply that years may pass by before the schemes are curtailed,4 rendering audits ineffective for early detection of ATP schemes.5
In response to these challenges, an increasing number of countries have enacted mandatory disclosure rules (MDRs).6 These rules require scheme promoters and/or their clients to report their planned ATP arrangements in advance, so that they can be curtailed before they are put into use. The timely and targeted detection of such schemes enables countries to quickly adopt risk management strategies as well as legislative and administrative measures to counteract tax risk.7 However, many Commonwealth jurisdictions such as Australia do not yet have these rules. The main argument is often put forward that these countries already have a number of anti-avoidance and disclosure rules which serve to deter ATP, thus leaving little need for these rules.
Nonetheless, the OECD’s8 base erosion and profit shifting (BEPS) recommendations include highlighting the usefulness of MDRs as best practice9 in providing tax authorities with comprehensive and relevant information for the early detection of ATP strategies. Part 1 of this study presented a case study analysis of the Australian experience,10 supporting the introduction of MDRs in Australia.
1 Organisation for Economic Co-operation and Development (OECD), Seoul Declaration: Third Meeting of the OECD Forum on Tax Administration (14-15 September 2006), http://www.oecd.org/dataoecd/38/29/37415572.pdf (accessed 9 July 2015). 2 OECD, Tackling Aggressive Tax Planning through Improved Transparency and Disclosure (OECD Publishing, 2011) 11. 3 OECD, Action Plan on Base Erosion and Profit Shifting (OECD Publishing, 2013) 22. 4 Larin Gilles, Robert Duong and Lyne Latulippe, ‘Effective Responses to Aggressive Tax Planning: What Canada Can Learn from Other Jurisdictions, Instalment 4: United Kingdom – Disclosure Rules’ (Study by the Research Chair in Taxation and Public Finance, University of Sherbrooke, July 2009). 5 OECD, Action Plan on Base Erosion and Profit Shifting, above n 3, 22. 6 OECD, Public Discussion Draft, BEPS Action 12: Mandatory Disclosure Rules (11 May 2015) para 37. 7 OECD, ‘OECD’s Work on Aggressive Tax Planning’, http://www.oecd.org/tax/exchange-of-tax-information/atp.htm (accessed 31 July 2017). 8 OECD, Action Plan on Base Erosion and Profit Shifting, above n 3, 22. 9 OECD, Explanatory Statement – 2015 Final Reports, OECD/G20 BEPS Project (2015) paras 11 and 18. Minimum standards were agreed in particular to tackle issues in cases where no action by some countries would have created negative spillovers into other countries. Best practices or common approaches are intended to facilitate the convergence of national practices by interested countries. 10 Australian Treasury, OECD Proposals for Mandatory Disclosure of Tax Information: Discussion Paper (2016).
eJournal of Tax Research The case for introducing mandatory disclosure rules in Australia (part 2)
235
Part 2 (this article) responds to the design aspect of MDRs as highlighted in the Australian Treasury’s Discussion Paper,11 in which the government anticipated further consultations on implementation design issues.12 Accordingly, this articleprovides recommendations on the design features of MDRs in an Australian context which can be more widely applied by other Commonwealth law jurisdictions contemplating whether to introduce MDRs. This article sets out the OECD’s recommended best practice design features of effective MDRs. Acknowledging the OECD recommendation that countries that wish to adopt MDR rules should draw on experiences of other countries that have such rules,13 this article provides a comparative study of how the rules apply in two Commonwealth countries – the UK and South Africa – whose experiences may be informative in framing a regime suitable for Australia.
The reasons for selecting these two juridictions is that, just like Australia, the UK and South Africa are part of the Commonwealth and they constitute two of Australia’s large trading partners. The UK has an extensive economic and trade relationship with Australia. The UK is Australia’s fifth largest two-way trading partner and export market for trade in goods and services, and its sixth largest source of imports. Both countries have a large commercial presence in the other’s country.14 South Africa is Australia's 21st largest merchandise trading partner and it now represents Australia’s 16th most significant merchandise export market. South Africa is Australia’s most dynamic market in Africa and dominates stocks of African investment into Australia. Australian investment in South Africa has also increased over the years, mainly in mining, mining equipment, agriculture, agribusiness and infrastructure and services trade.15
Both the UK and South Africa have already introduced MDRs, as discussed below. Some of the concerns that Australia is contending with, regarding the introduction MDR (such as the proliferation of disclosure rules and balancing conflicting policy imperatives) were also faced by these two countries. Lessons could thus be gleaned from them with respect to how Australia can resolve its specific challenges.
In the section that follows, after considering the Australian Government’s preliminary views, and taking into consideration the OECD recommendations as well as the pros and cons of the approaches in the UK and South Africa, recommendations are provided on design features for each of the relevant elements of a potential MDR regime.
2. KEY DESIGN FEATURES AND PRINCIPLES OF AN EFFECTIVE MANDATORY DISCLOSURE
REGIME
In Action 12 of the OECD BEPS Reports, the OECD recommends that MDRs should cover:
what has to be reported;
11 Ibid. 12 Ibid. 13 OECD, Action Plan on Base Erosion and Profit Shifting, above n 3, 22. 14 Australian Government, Department of Foreign Affairs and Trade ‘United Kingdom Country Brief’, http://dfat.gov.au/geo/united-kingdom/Pages/united-kingdom-country-brief.aspx (accessed 23 July 2018). 15 AiGroup, outh Africa’, https://www.aigroup.com.au/business-services/trade/export/south-africa/ (accessed 23 July 2018); see also Mokhtar Metwally, Ann Hodgkinson and André Jordaan, ‘An Assessment of the Trade Relationship between South Africa and Australia’ (2006) 4(2) International Journal of Applied Business and Economic Research 79, 80.
eJournal of Tax Research The case for introducing mandatory disclosure rules in Australia (part 2)
236
who has to report;
information to be reported;
when to report;
identification of scheme promoters and/or users;
consequences of non-compliance;
how to use the information collected; and
ensuring the rules cover international tax schemes.
As such, this section explores each of these design features, with a comparative analysis of how their application is carried out in the UK and South Africa. This is supplemented with an outline of overarching principles. This provides the conceptual framework for design recommendations for Australia.
2.1 What has to be reported?
2.1.1 OECD recommendations on what has to be reported
A country needs to decide what types of schemes or arrangements should be disclosed under its MDRs (ie, what transactions are reportable).16 The OECD recommends that this can be determined by use of tests such as threshold requirements, de-minimis filters or hallmarks. Each of these is briefly explained below.
Threshold requirements. Threshold requirements may be used to determine what is reportable. The threshold test may consider whether a transaction has the features of an avoidance scheme or whether the main benefit of the scheme is to obtain a tax advantage.17 This ensures that the transactions targeted are those that are likely to pose the greatest tax policy and revenue risks.18 This excludes irrelevant disclosures and reduces compliance and administrative burdens.19 The challenges of the ‘main benefit’ test as a threshold are that it sets a relatively high threshold for disclosure and it can be used inappropriately as a justification for not disclosing tax avoidance schemes that would be of interest to a tax administration. It may also make enforcement of the disclosure obligations more complex and create uncertain outcomes for taxpayers.20 Where threshold requirements (like the main benefit test) are not used, there is the challenge of the rules generating a large number of disclosures, which would increase the costs to taxpayers and tax administrations and dilute the relevance of the information received. This disadvantage can be ameliorated by using defined de-minimis filters, hallmarks or listed transactions.21
De-minimis filter. The de-minimis filter could be considered as an alternative, or additional provision, to a threshold requirement. It may be based on certain monetary limits such that smaller transactions, below a certain amount, are excluded from the
16 OECD, Mandatory Disclosure Rules: Action 12 – 2015 Final Report (OECD Publishing, 2015) para 78. 17 Ibid para 79. 18 Ibid para 80. 19 Ibid. 20 Ibid para 82. 21 Ibid paras 84-85.
eJournal of Tax Research The case for introducing mandatory disclosure rules in Australia (part 2)
237
disclosure requirements.22 A de-minimis filter could be applied to all transactions or to categories of transactions that might elicit large numbers of reportable transactions. The advantages of de-minimis filters are that they narrow the ambit of the rules, enhance the usefulness of the information collected, reduce excessive or defensive filings by focusing on transactions that pose significant tax risk, and reduce the costs to taxpayers and the administrative burden for tax administrations. The disadvantage of de-minimis filters is that they could suggest that tax avoidance, in small amounts, is acceptable.23
Hallmarks. Hallmarks can also be used as tools to identify the features of schemes that tax administrations are interested in. Hallmarks help in setting the scope of the rules, so that they target only those transactions that raise tax avoidance concerns.24 The proper design of hallmarks is critical to the effective functioning and compliance with the rules.25 There are two categories of hallmarks: generic and specific.26 Generic hallmarks target features that are common to promoted schemes; examples include use of mass marketed schemes, requirement of confidentiality by the promoter, charging premium fees for the value of tax benefits obtained under the scheme and mass marketed schemes (standardised tax products that are made available to more than one person).27 Generic hallmarks can be used to capture ‘innovative’ tax planning arrangements that may be easily replicated and sold to a variety of taxpayers. This has the advantage of increasing the number of reportable transactions – enabling tax administrations to detect and react quickly to new innovative transactions and thus reduce their circulation in the market.28 The disadvantage of generic hallmarks is that if they are ambiguously drafted, they have the potential to increase compliance costs for taxpayers and administrative costs for tax administrations.29
In specific hallmarks, the disclosure obligation is triggered by describing certain potentially abusive transactions in regulations or by legislation. Specific hallmarks have the advantage of targeting the known vulnerabilities in a country’s tax system that are commonly used in tax avoidance arrangements.30 The OECD recommends that specific hallmarks should be drafted broadly to avoid providing too much technical detail. Narrow or technical drafting can be given a restrictive interpretation by taxpayers or may provide opportunities for taxpayers and promoters to structure their disclosure obligations around them.31 Specific hallmarks have the advantage of keeping MDRs up to date and dealing with avoidance on non-mainstream taxes that reflect the key risk areas in a given jurisdiction. The main disadvantages of specific hallmarks are the costs and capacity issues for the tax administration and the reporting burden on taxpayers.32
22 Ibid para 87. 23 Ibid. 24 Ibid paras 20, 23. 25 Karen Payne, ‘Mandatory Disclosure Rules and reporting’ (Paper presented at the 2018 Financial Services Taxation Conference, Gold Coast, 7-9 February 2018) 11. 26 OECD, Mandatory Disclosure Rules: Action 12 – 2015 Final Report, above n 16, para 91. 27 Ibid para 92. 28 Ibid para 91. 29 Ibid para 132. 30 Ibid para 91. 31 Ibid para 118. 32 Ibid paras 135-137.
eJournal of Tax Research The case for introducing mandatory disclosure rules in Australia (part 2)
238
2.1.2 UK rules on what has to be reported
An ‘arrangement’ for the purposes of the UK Disclosure of Tax Avoidance Schemes (DOTAS) regime means any scheme, transaction or series of transactions.33 An arrangement has to be disclosed to HM Revenue and Customs if it satisfies three criteria. First, the arrangement enables, or might be expected to enable, a taxpayer to obtain a tax advantage in relation to the tax law in the UK. In this regard, a tax ‘advantage’ is defined in section 318(1) of the Finance Act 2004 as the avoidance or reduction of tax, the obtaining or increase of an amount of tax relief or refund, the deferral of payment of tax or advancement of repayment of tax, or the avoidance of the obligation to deduct or account for tax. The second criterion is that the tax advantage constitutes, or might be expected to constitute, the main benefit or one of the main benefits of the arrangement. The third criterion is that the arrangement is likened to any of the arrangements whose hallmarks have an avoidance risk, as identified by HM Revenue and Customs under its regulatory power (prescribed arrangements, commonly referred to as ‘hallmarked schemes’).34
From the above it is clear that the UK regime makes use of a threshold requirement (tax benefit) to determine what is reportable, as well as hallmarks prescribed in regulations to identify schemes of interest to HM Revenue and Customs. Generic hallmarks, such as mass marketed schemes, requirement of confidentiality and charging of premium fees are applied in the UK.35
2.1.3 South African rules on what has to be reported
Under section 34 of the Tax Administration Act 28 of 2011 (TAA), an ‘arrangement’ means ‘any transaction, operation, scheme, agreement or understanding (whether enforceable or not)’. South Africa uses a threshold requirement (tax benefit) to determine what is reportable, as well as hallmarks prescribed in legislation and those listed in a public notice by the Commissioner of the South African Revenue Service (SARS).
Section 35 provides for two circumstances in which an arrangement would qualify as a reportable arrangement. The first circumstance is the specific reportable arrangements (specific hallmark) set out in section 35(1), under which an arrangement is reportable if a tax benefit is or will be derived or is assumed to be derived by any participant.36
The second circumstance under which an arrangement is reportable is, under section 35(2) of the TAA, if the arrangement is listed by the Commissioner of SARS by public notice, being satisfied that the arrangement may lead to an undue tax benefit. However, this is subject to two categories of carve-outs. The first category is the ‘specifically excluded arrangements’ which are set out in section 36(1) (subject to certain exceptions), including loans and leases. The second category of excluded arrangements are those excluded by the Commissioner of SARS by public notice under section 36(4), being satisfied that the arrangement is not likely to lead to an undue ‘tax benefit’. Essentially, the excluded transactions and arrangements that do not exceed ZAR 5
33 Finance Act 2004 (UK) s 318(1). 34 Finance Act 2004 s 306(1). 35 OECD, Mandatory Disclosure Rules: Action 12 – 2015 Final Report, above n 16, para 92. 36 TAA s 35(1); Ide Louw and Bronwyn Simpson, ‘The Simple Life Before Reportable Arrangements’, in DLA Cliffe Dekker Hofmeyr, Tax Matters (Winter 2010) 3, 4.
eJournal of Tax Research The case for introducing mandatory disclosure rules in Australia (part 2)
239
million, act as de-minimis filters37 that reduce the risks of over-disclosure by focusing on transactions that pose significant tax risk, thereby reducing compliance costs for taxpayers and administrative burdens for the tax administration.
2.1.4 Australia’s preliminary position on what has to be reported
The Australian Treasury’s initial view is that the Australian Taxation Office (ATO) should have broad discretion (subject to the limits described below) in determining which ATP arrangements would trigger the MDRs.38
If the government were to adopt a broad discretionary approach, the ATO would have to initiate action to set the rules in motion. The ATO would have to publish some regulations or guidelines which describe the disclosable arrangements envisaged; alternatively, these could be set out clearly in legislation (as is done in the UK and in South Africa).39 The government’s proposal to identify targeted aggressive tax arrangements in a manner similar to the Taxpayer Alerts has, however, been criticised by tax practitioners for lacking clarity – which is not suited for drafting the proposed MDRs.40 For example, the Taxpayer Alerts refer to the offending arrangements as those which ‘typically display’ certain features and which display ‘all or most of the features’ – wording that tax practitioners have found confusing, and which raises concerns about penalties for failing to notify the ATO even where the ATO is not clear about what needs to be notified.41 The Australian Law Council suggests that, where broad discretion lacks clarity, this ‘could be tempered by provisions for internal and external review and appeal’.42
Australia could ensure clarity by emulating South Africa in this matter, where reportable arrangements are clearly set out in the legislation and the Commissioner of SARS has broad discretion to prescribe and update in a Gazetted Public Notice the arrangements that are of particular risk to revenue.43 For Australia’s circumstances, the hallmarks of an ATP arrangement should be derived from the ‘prohibited conduct’ provisions under the promoter penalty rules in section 290-B of Schedule 1 to the Taxation Administration Act 1953 (discussed in Part 1 of this study).
The Australian Treasury’s Discussion Paper44 sought views on the use of generic hallmarks as triggers for MDRs, as well as their advantages and disadvantages.45 Confidentiality may, for example, not be an appropriate hallmark for Australia
37 OECD, Mandatory Disclosure Rules: Action 12 – 2015 Final Report, above n 16, para 87. 38 Australian Treasury, OECD Proposals for Mandatory Disclosure of Tax Information, above (n 10, Table 2, Issue 2. 39 Law Council of Australia, ‘Mandatory Disclosure’ (15 July 2016) para 14.3, https://www.lawcouncil.asn.au/resources/submissions/mandatory-disclosure (accessed 3 August 2017). 40 Greenwoods & Herbert Smith Freehills, ‘OECD Proposals for Mandatory Disclosure of Tax Information – Discussion Paper’ (15 July 2016) para 4, http://www.greenwoods.com.au/media/1798/oecd-proposals-for-mandatory-disclosure-of-tax-information-submission-to-treasury-july-2016.pdf (accessed 3 August 2017). 41 Ibid para 4; Payne, above n 25, 6. 42 Law Council of Australia, above n 39, para 14.3. 43 See TAA s 35(2), which provides for the reporting of arrangements listed by the Commissioner of SARS by public notice. 44 Australian Treasury, OECD Proposals for Mandatory Disclosure of Tax Information, above (n 10, Table 2, Issue 2. 45 Ibid 20, para 11.4.
eJournal of Tax Research The case for introducing mandatory disclosure rules in Australia (part 2)
240
considering that the common law recognises legal professional privilege.46 Rather, more appropriate hallmarks would be a lack of transparency (that is, the refusal of a person to disclose to a taxpayer or their advisers all the details of a particular arrangement, including any legal and other opinions that person relies on in support of the effectiveness of the arrangement)47 or that the fee, or a proportion of the fee, is contingent on the scheme set up by the person charging for it being successful.48 The OECD advises that this ‘premium fee’ hallmark is appropriate where the amount the client pays for the advice can be attributed to the value of the tax benefits obtained under the scheme (which is how it is applied in the UK).49 It is important that generic hallmarks are designed clearly and targeted appropriately to minimise excessive and unnecessary disclosure of information by making it easy for advisers to understand and determine whether they need to disclose. Unnecessary disclosure would increase compliance and administrative costs, without improving the detection of ATP arrangements in the tax system. 50
Use of subjective or objective criteria in the rules is also an important matter to consider. A subjective approach to the rules can for instance be inferred from the ‘label’ given to the rules. The use of ‘scornful’ or pejorative labels, such as ‘aggressive tax arrangements’, may enhance deterrence in that they can create a negative perception among clients of scheme promoters, which may influence behaviour change from such promoters for fear of business reputation risks. Neutral labels, such as ‘reportable arrangements’ (as used in South Africa, may create a less ‘scornful’ perception but rather reflect the intelligence gathering objective of the rules. The effectiveness of neutral labels must however be accompanied by hallmarks that are based on objective criteria, as purposive elements would lead to uncertainty and be open to manipulation, which would undermine the rules.51
2.2 Who has to report?
2.2.1 OECD recommendations
MDRs need to identify the person who is obliged to disclose information under the regime. The OECD notes that there are two options that countries can apply. The first option is that both the promoter and the user have the obligation to disclose separately.52 The advantage of this option is that it has a stronger deterrent effect on both the promoter and the user, thereby reducing the risk of inadequate disclosure.53 The disadvantage is that it places greater administrative costs on tax administrations due to the dual disclosure obligation imposed and it increases compliance costs for the taxpayers.54
46 Baker v Campbell [1983] HCA 39, 153 CLR 52; Mann v Carnell [1999] HCA 66, 201 CLR 1; British American Tobacco Australia Ltd v Secretary, Department of Health and Ageing [2011] FCAFC 107, 195 FCR 123. 47 Law Council of Australia, above n 39, para 14.4. 48 Ibid. 49 OECD, Mandatory Disclosure Rules: Action 12 – 2015 Final Report, above n 16, para 92. 50 Payne, above n 25, 11. 51 Ibid. 52 This is applied in Canada and the United States; see OECD, Mandatory Disclosure Rules: Action 12 – 2015 Final Report, above n 16, para 61. 53 Ibid paras 63-74. 54 Ibid paras 63-64.
eJournal of Tax Research The case for introducing mandatory disclosure rules in Australia (part 2)
241
The second option is that either the promoter or the taxpayer has the obligation to disclose, but the promoter has the primary obligation to disclose.55 The advantage of placing the primary obligation to disclose on the promoter is that it ensures efficiency, particularly for mass marketed schemes, as the promoter has a better understanding of the scheme and the tax benefit arising under the scheme. The disadvantage arises where the promoter is offshore or asserts legal professional privilege as recognised by many common law jurisdictions; these may prevent the promoter from providing the required information.56 In such cases, the OECD recommends that the obligation to disclose should shift to the user.57
2.2.2 Who has to report in the UK?
In the UK, the duty to disclose a notifiable arrangement falls on three groups of persons. First, promoters have the primary duty to disclose to HM Revenue and Customs information on the arrangements a taxpayer has implemented further to their advice.58 Subsections 307(1) and (2) of the Finance Act 2004 state that a person is a promoter, in relation to a notifiable proposal, if in the course of a relevant business (any trade, profession or business involving the provision of taxation services to other persons, or business carried on by a bank or a securities house), that person is responsible for the design of the proposed arrangements, or if they make the notifiable proposal available for implementation by other persons. A person is also a promoter in relation to notifiable arrangements, if in the course of a relevant business, that person is responsible for the implementation of a notifiable proposal, or if that person is to any extent responsible for the design of the arrangements, or the organisation or management of the arrangements. It should be noted, though, that the UK MDRs provide for legal professional privilege. Section 314(1) of the Finance Act 2004 provides that there is no requirement for any person to disclose any privileged information, which is defined in section 314(2) to mean information with respect to which a claim to legal professional privilege or to confidentiality of communications could be maintained in legal proceedings.
Where a promoter is outside the UK, section 309(1) of the Finance Act 2004 places the second duty of disclosure on any person (the user) who enters into any transaction forming part of any notifiable arrangements. However, where a promoter complies with the duty to disclose a notifiable arrangement, as explained above, this discharges the duty of the client to disclose.59 Thus, where the disclosure of the scheme by the promoter would infringe legal professional privilege (eg, if the promoter were a law firm whose clients enjoy legal professional privilege), then the duty of disclosure would fall on the user. 60
The third duty of disclosure is provided for under section 310 of the Finance Act 2004. It provides that any person who is a party to a notifiable arrangement that does not involve a promoter (section 308), or where the promoter is outside the UK (section 309), has a duty to disclose a notifiable arrangement at the prescribed time. In its consultation document, Strengthening the Tax Avoidance Disclosure Regimes, HM Revenue and
55 Ibid para 61. 56 Ibid para 70. 57 Ibid para 68. 58 Philip Baker, ‘The BEPS Project: Disclosure of Aggressive Tax Planning Schemes’ (2015) 43(1) Intertax 85, 87. 59 Finance Act 2004 s 309(2). 60 Baker, above n 58, 87.
eJournal of Tax Research The case for introducing mandatory disclosure rules in Australia (part 2)
242
Customs noted that anyone working with a non-resident promoter (such as a business partner) should be required to disclose reportable arrangements that are promoted by the offshore promoter, to deter the use of offshore promoters to circumvent the UK disclosure requirements.61
2.2.3 Who has to report in South Africa?
The reporting obligation in South Africa is in the first instance on the promoter (defined under section 34 of the TAA as the person who is responsible for organising, designing, selling, financing or managing the reportable arrangement) as this is the person most likely to have insight into the whole transaction. If there is no promoter, or if the promoter is a non-resident, the participants to the transaction have the obligation to report. Section 34 of the TAA defines a participant to include not only a promoter but also a person who directly or indirectly will derive or assumes that will derive a ‘tax benefit’ or ‘financial benefit’ by virtue of an arrangement. The definition of participant also includes any other person who is party to an arrangement listed in a public notice by the Commissioner of SARS. This include companies and trusts.62
2.2.4 Australia’s preliminary position on who has to report
The Australian Treasury’s initial view is that the MDRs should apply primarily to ‘tax advisers who are involved in the design, distribution and management of aggressive tax arrangements’.63 However, in limited circumstances, where the relevant tax adviser is offshore, the ATO may require disclosures to be made by the taxpayers.64 This preliminary view is supported, as it is in line with the OECD recommendations and the approaches followed in the UK and in South Africa. The Australian Treasury’s Discussion Paper suggested that the rules would provide a clear definition of targeted ‘tax advisers’ who are involved in the design, distribution and management of aggressive tax arrangements.65
However, instead of using the term ‘tax adviser’, the term ‘promoter’ would be consistent with the use by both the OECD and also the UK and South Africa. This term more closely targets those who design, distribute and manage aggressive tax arrangements, rather than all tax advisers.66 Thus, advisers who merely advise on the tax consequences of proposals put to them (eg, those who give second opinions) and tax return preparers who report the consequences of transactions on which others have opined, should not be within the scope of the rules.67 It is however important to note that the tax advisory profession in Australia consists of various operators that may need specific consideration; these include: accountants, lawyers, tax lawyers, tax agents, financial planners, financial institutions, Australian Financial Services Licensees, as
61 HM Revenue and Customs, Consultation Document: Strengthening the Tax Avoidance Disclosure Regimes (31 July 2014), https://www.gov.uk/government/consultations/strengthening-the-tax-avoidance-disclosure-regimes (accessed 4 August 2017). 62 Louw and Simpson, above n 36, 3. 63 Australian Treasury, OECD Proposals for Mandatory Disclosure of Tax Information, above n 10, Table 2, Issue 1. 64 Ibid. 65 Ibid. 66 Joanna Mather, ‘Lawyers, Accountants Balk at Disclosure Rules’, Australian Financial Review (4 August 2016), http://www.afr.com/news/policy/tax/lawyers-accountants-balk-at-disclosure-rules-20160802-gqj77u (accessed 3 August 2017). 67 Greenwoods & Herbert Smith Freehills, above n 40.
eJournal of Tax Research The case for introducing mandatory disclosure rules in Australia (part 2)
243
well as in-house and offshore advisers.68 Some of these may be regulated by bodies such as the Tax Practitioners Board, others may not. Payne69 takes the view that where an individual provides advice on behalf of a company or firm, then the obligation to disclose must be on that company or firm, as this would affect both regulated and unregulated advisers. It is important that the reporting rules do not fall on only regulated tax advisers, as this may encourage the unregulated ones to go offshore, which may present greater challenges in getting information from them, and thus turning to the Australian user for the disclosure who as the user may not know the details of how the scheme operates.
To ensure that the rules target specific taxpayer cohorts and preclude duplication with existing rules, we recommend that the rules expand on the definition of a ‘promoter’ in the promoter penalty rules in section 290-60 of Schedule 1 to the Taxation Administration Act 1958 (Cth),70 which as discussed in Part 1 mimic some mandatory provisions in MDRs. In terms of these rules, an entity is considered a promoter if it markets or encourages the growth of the scheme, the entity or its associate directly or indirectly receives consideration in respect of marketing or encouragement, it has a substantial role in the marketing or encouragement of the scheme or it causes another entity to be a promoter.71 For the purposes of the MDRs, the definition should cover all taxpayers – it should not be limited to entities only.
There may however be some difficulties where a taxpayer is a foreign resident who is an owner of an indirect Australian real property interest, and is advised by a foreign resident promoter. In such cases where substantial Australian assets are held indirectly, Australian MDRs should provide for specific rules to effectively address such issues.
2.3 Information to be reported
2.3.1 OECD recommendations
The OECD notes that it is imperative that once a transaction is reportable, the person who is obliged to disclose (promoter or user) must provide the tax authorities with particular information to enable them to understand how the scheme operates and how the expected tax advantage arises.72
2.3.2 UK rules on information to be reported
In the UK, the disclosure obligations require identification of the details of the arrangements so that HM Revenue and Customs can understand how the scheme achieves a tax benefit for those who use it.73 The information required must be provided in a form and manner specified by HM Revenue and Customs.74 Where auditors have reasonable grounds for believing that promoters subject to the disclosure rules have not filed the prescribed form, they can ask them in writing to provide the reasons why they should not be subject to the disclosure rules. HM Revenue and Customs can obtain a court order enjoining a promoter to provide additional documents or information to
68 Payne, above n 25, 20. 69 Ibid 21. 70 The rules require entities not to engage in ‘prohibited conduct’ or they will be penalised. 71 Taxation Administration Act 1953 (Cth) s 290C. 72 OECD, Mandatory Disclosure Rules: Action 12 – 2015 Final Report, above n 16, paras 201-202. 73 Baker, above n 58, 87. 74 Finance Act 2004 s 316.
eJournal of Tax Research The case for introducing mandatory disclosure rules in Australia (part 2)
244
explain the lack of prescribed forms or to clarify the information contained in a form it previously filed (supplementary filing order). HM Revenue and Customs could also obtain a court order regarding a promoter, which declares that an arrangement is a notifiable arrangement.75 Where the court so orders, the promoter must then file the prescribed form as if the arrangement specified in the court order were a notifiable arrangement.
2.3.3 South African rules on information to be reported
Under section 38 of the TAA, a promoter or participant must submit (on the prescribed form) the following information in relation to a reportable arrangement, by the date specified:
a detailed description of all its steps and key features, including, in the case of an arrangement that is a step or part of a larger ‘arrangement’, all the steps and key features of the larger arrangement;
a detailed description of the assumed tax benefits for all participants, including, but not limited to, tax deductions and deferred income;
the names, registration numbers, and registered addresses of all participants;
a list of all agreements; and
any financial model that embodies the projected tax treatment.
2.3.4 Australia’s preliminary views on information to be reported
The Australian Treasury’s initial view is that, to minimise unnecessary additional compliance costs, the legislation should clearly specify the information that is required to be disclosed under the MDRs.76 The government is also of the view that a standard form should be provided by the ATO regarding the information that should be disclosed. The government sought views on how the legislative guidelines should be designed.77 The government’s view is in line with the approaches in the UK and in South Africa.
Legislative guidelines on information to be reported could be drawn from the OECD recommendations and the South African procedure (as set out above). To ensure that the rules do not overlap with existing rules, the information requirements could build on the provisions in the Reportable Tax Position Schedule78 which (as discussed in Part 1) has mandatory provisions that mimic the MDRs.79
75 Finance Act 2004 s 314A, as added by Finance Act 2007 s 108. 76 Australian Treasury, OECD Proposals for Mandatory Disclosure of Tax Information, above n 10, Table 2, Issue 3. 77 Ibid 20, para 11.5. 78 The Schedule requires some large corporations to make early disclosure of contestable and material tax positions which may not be sustained when analysed by the ATO. See ATO, ‘Guide to Reportable Tax Positions’ (2017), https://www.ato.gov.au/Forms/Guide-to-Reportable-Tax-Positions-2017/ (accessed 3 August 2017). 79 ATO, ‘RTP Early Disclosure Form’ (2011) Item 8, www.ato.gov.au/content/downloads/bus00279408nat73857.pdf (accessed 17 August 2017).
eJournal of Tax Research The case for introducing mandatory disclosure rules in Australia (part 2)
245
2.4 When to report
2.4.1 OECD recommendations
The OECD notes that, since the purpose of MDRs is to provide the tax administration with early information on ATP schemes and their users so as to deter the use of those schemes, the determination of the timeframe for when promoters and/or users are required to make a disclosure is key to achieving that goal.80 The more quickly a tax administration can act against a scheme, the more this may enhance the deterrent effect by reducing the time available to take advantage of any tax benefit, and so altering the economics of the transaction.81 The timing of disclosure depends on two factors: the trigger event and the time period for reporting (this depends on the time allowed by the MDRs of a given country).82
With respect to the first timing factor (trigger event), usually the event that triggers disclosure by a promoter could be linked to either the time the scheme is made available for users to implement or the time the scheme is implemented by users.83 The OECD recommends that, where the promoter has the obligation to disclose, the time of disclosure should be linked to the availability of the scheme to the users rather than the time the scheme is implemented.84 Where there is no promoter or where the promoter is offshore and the user is required to disclose, the OECD recommends that the reporting requirement should be linked to implementation rather than availability of a scheme, since it may be difficult to identify another point or event that provides an objective trigger for the reporting obligation.85
As regards the time period for reporting,86 in general the time in countries’ MDRs can vary from within days, to months or longer. Similar times for disclosure normally apply for the promoter and for the user (depending on who has the obligation to disclosure). Either way, the OECD recommends that a shorter period of time enables the disclosure regime to meet its objectives of maximising the tax administration’s ability to react to the scheme quickly and to influence taxpayers’ behaviour.87 The longer the gap between a scheme being marketed and the eventual disclosure, the more users there will be and greater loss of tax revenues.88 The OECD, however, notes that there is less need to have a very short period if a government is unable to react quickly to change its legislation. This means that the administrative constraints on each tax administration need to be taken into account. The timeframe for disclosure should be as efficient as possible within the context of domestic law.89
2.4.2 Time of disclosure in the UK
In the UK, the time of disclosure by a promoter is linked to the time the scheme is made available for users to implement. Section 308 of the Finance Act 2004 requires that a
80 OECD, Mandatory Disclosure Rules: Action 12 – 2015 Final Report, above n 16, para 139. 81 Ibid. 82 Ibid 18. 83 Ibid para 156. 84 Ibid. 85 Ibid para 152. 86 Ibid 18. 87 Ibid para 156. 88 Ibid para 155. 89 Ibid.
eJournal of Tax Research The case for introducing mandatory disclosure rules in Australia (part 2)
246
promoter must provide HM Revenue and Customs information relating to any notifiable proposal on the earlier of: (a) the date on which the promoter makes a notifiable proposal available for implementation by any other person, or (b) the date on which the promoter first becomes aware of any transaction forming part of notifiable arrangements that implement the notifiable proposal. Thus, the date a promoter makes a notifiable proposal available to users for implementation is essentially the date when all the elements necessary for implementation of the scheme are in place and a communication is made to a client suggesting that the client might consider entering into transactions forming part of the scheme; it does not matter whether full details of the scheme are communicated at that time.90
2.4.3 Time of disclosure in South Africa
Unlike the case in the UK, in South Africa the time of disclosure is the time the scheme is implemented by users. Section 37(1) of the TAA provides that a ‘participant’ in an ‘arrangement’ is required to disclose an arrangement on the date on which it qualifies as a ‘reportable arrangement’, and it should be reported within 45 business days after that date. Section 37(5) provides that SARS may grant an extension for disclosure for a further 45 business days, if reasonable grounds exist for the extension.
The disclosure obligation is therefore triggered within 45 days after there is receipt or payment of money for a transaction forming part of a reportable arrangement; this effectively shows that the arrangement has been implemented.91 The disadvantage with South Africa’s trigger event is that it impacts on the tax administration’s ability to react more quickly, potentially leading to greater revenue loss and a reduced deterrent effect.92
2.4.4 Australia’s preliminary views on time of disclosure
The Australian Treasury’s initial position on the time of disclosure is that the ATO should have discretion to determine when tax advisers are required to disclose information.93 Further, the timing should not be earlier than 90 days from the ATO publishing that a scheme is reportable.94 The government indicated that there would be a mechanism for tax advisers to seek the ATO’s approval for extending the timeframe for making a disclosure and sought community views on this matter.95
In light of the OECD recommendations and the disadvantages of this approach (which is used in South Africa), we recommend that the UK approach be implemented in Australia whereby the time of disclosure by a promoter is linked to the time the scheme is made available for users to implement. With respect to the time of reporting, the important matter is to ensure that the time is not so long that it impacts on the ATO’s ability to act quickly against ATP.96
90 Ibid para 141. 91 Ibid para 146. 92 Ibid para 147. 93 Australian Treasury, OECD Proposals for Mandatory Disclosure of Tax Information, above n 10, Table 2, Issue 3. 94 Ibid, Table 2, Issue 4. 95 Ibid. 96 OECD, Mandatory Disclosure Rules: Action 12 – 2015 Final Report, above n 16, para 157.
eJournal of Tax Research The case for introducing mandatory disclosure rules in Australia (part 2)
247
Advice or ideas developed in response to a request for advice should not be targeted, since the scheme would not be ready to be made available for users to implement. However, there may be challenges in establishing a clear distinction in certain circumstances. For example it may be difficult to distinguish between: a scenario suggestion and giving advice for implementation; ATP behaviour or general activities of tax professionals; the giving of second opinions by in-house advisers or advisers.97 It is thus important that the key elements in determining the point at which an arrangement is substantially designed must be clearly set out in order to determine if it has been sufficiently developed, that it can be implemented by potential users.
2.5 Identification of scheme users
2.5.1 OECD recommendations
The ability of tax administrations to identify scheme users is an essential part of any mandatory disclosure regime. It allows a tax administration to improve risk assessment and it enables it to better quantify the extent of any tax loss.98 Two methods can be used to identify users: use of scheme reference numbers and use of client lists.
Scheme reference numbers. Identification through use of scheme reference numbers enables the tax authorities to identify which taxpayer has used a specific scheme,99 so that they can obtain information on the users of that specific scheme and build up a picture of the risk presented by individual taxpayers. The OECD recommends that, where the scheme reference number is allocated to the promoter, the promoter must provide the scheme reference number to the user within a given timeframe.
Client lists. Identification of scheme users could also be effected by imposing an obligation on the promoter to provide a list of clients who have made use of a disclosed scheme.100 Requiring the promoter to provide a client list has the advantage of identifying other taxpayers that participated in a scheme but did not disclose this.101 The fact that the user knows they will be identified through a client list may deter some from using a scheme in the first place.102 Client lists can also enable tax authorities to carry out early interventions, such as contacting taxpayers who appear on the lists to advise them not to claim the effects of the avoidance scheme on their returns.103
Some countries, including the UK, require identification through the use of both scheme reference numbers and client lists. Such dual identification is likely to help tax administrations to cross-check the information and to rapidly obtain an accurate picture of the extent of the tax risk posed by a scheme and to easily identify when a taxpayer has used a scheme.104 The administrative burdens on tax administrations are, however, high.
97 Payne, above 25, 22. 98 OECD, Mandatory Disclosure Rules: Action 12 – 2015 Final Report, above n 16, para 168. 99 Ibid para 158. 100 Ibid. 101 Ibid para 168. 102 Ibid para 169. 103 Ibid para 171. 104 Ibid para 29.
eJournal of Tax Research The case for introducing mandatory disclosure rules in Australia (part 2)
248
2.5.2 UK rules on identification of schemes users
Under section 311(1) of the Finance Act 2004, where a person complies with the duty to disclose a notifiable arrangement or a notifiable proposal, HM Revenue and Customs may within 30 days allocate a reference number to the notifiable arrangement or to the notifiable proposal, and notify the relevant person of that number. Under section 312(1), any promoter who provides services to a client in connection with notifiable arrangements must, within 30 days, provide the reference number to the client. Under section 313(3), the regulations require that the reference number is included in any tax return or account. This allows HM Revenue and Customs to identify every taxpayer who has purchased and implemented a particular scheme. Inclusion of a DOTAS reference number on a tax return is almost certain to result in an audit of that particular taxpayer.105
In addition to reference numbers, the UK also requires the promoter to provide quarterly client lists.106 This additional mechanism is used for checking that schemes are disclosed by all users.107
2.5.3 South African rules on identification of scheme users
Under section 39 of the TAA, after SARS has received the information relating to a reportable arrangement, it must issue a reportable arrangement reference number to each ‘participant’ for administrative purposes only.
2.5.4 Australia’s preliminary position on identification of scheme users
The Australian Treasury’s initial view on this matter is that all reported schemes will be assigned a reference number within 10 days of the date for required disclosure.108 To avoid duplication, the taxpayer would not be required to provide the same information as reported by the tax adviser.109
To ensure effectiveness of reference numbers, it is important that the government follows the UK’s approach by developing a legislative provision that requires the reference number to be included in taxpayers’ returns. This will enable the ATO to identify the taxpayer who has purchased and implemented a particular scheme, which could be followed by an audit of that taxpayer. Such use of reference numbers enhances the deterrence effect of the rules.
2.6 Consequences of non-compliance
2.6.1 OECD recommendations
Mandatory disclosure regimes cannot be effective unless promoters and taxpayers fully comply with the reporting requirements. Compliance with disclosure requirements can be enhanced through the imposition of penalties so as to increase the pressure to comply
105 Baker, above n 58, 87. 106 OECD, Mandatory Disclosure Rules: Action 12 – 2015 Final Report, above n 16, para 166. 107 Ibid para 45. 108 Australian Treasury, OECD Proposals for Mandatory Disclosure of Tax Information, above n 10, Table 2, Issue 5. 109 Ibid.
eJournal of Tax Research The case for introducing mandatory disclosure rules in Australia (part 2)
249
with the law.110 Penalties could be monetary or non-monetary or include elements of both.
With respect to the structure and amounts of monetary penalties, the OECD notes that this is generally an issue for each country to consider.111 The structure and amount of the penalty may depend on the type of taxpayer (ie, corporate or individual) and the type of transaction. Monetary penalties could be levied for non-disclosure of a scheme, failure to provide or maintain client lists, failure to provide a scheme reference number or failure to report a scheme reference number.112 The OECD recommends that penalties should be set at a level that maximises their deterrent value without being overly burdensome or disproportionate. In setting penalty levels, jurisdictions may take into account factors such as whether there is negligence or deliberate non-compliance. Penalties may also be linked to the level of fees, the transaction size or the extent of the tax benefit.113 The OECD is of the view that penalty initiatives are likely to be more effective if they target promoters (rather than the end user, ie, the taxpayer) since promoters have greater knowledge of a scheme’s tax effects and are better placed to know whether a scheme constitutes tax avoidance and are aware of any risks inherent in that scheme.114
Countries may also implement non-monetary penalties for non-disclosure. For example, a failure to disclose could suspend the efficacy of the scheme and taxpayers could be denied any tax benefit arising from the scheme.115
2.6.2 UK rules on the consequences of non-compliance
The UK rules emphasise penalising promoters so as to increase transparency and improve their behaviour. Section 313 of the Finance Act 2004 provides that a promoter or reporting taxpayer who fails to comply with disclosure obligations is liable to a penalty not exceeding GBP 5,000, and if the failure continues after a penalty is imposed, further penalties apply not exceeding GBP 600 for each day on which the failure continues. Section 313(4) provides for situations where a person is not liable to a penalty with respect to some sections of certain Tax Acts.
2.6.3 South African rules on the consequences of non-compliance
Where a participant (as defined in section 2.5.3 above) fails to disclose the information in respect of a reportable arrangement, section 212 of the TAA sets out penalties. In the case of a promoter, a penalty of ZAR 100,000 applies per month of non-disclosure, up to 12 months. In the case of any other participant, a penalty of ZAR 50,000 per month is imposed, up to 12 months.
2.6.4 Australia’s preliminary position on consequences of non-compliance
The Australian Treasury’s initial view is that lateness or non-compliance with the disclosure obligation will be subject to monetary tax penalties on the tax adviser (or the
110 OECD, Mandatory Disclosure Rules: Action 12 – 2015 Final Report, above n 16, para 180. 111 Ibid para 181. 112 Ibid para 182. 113 Ibid para 183. 114 Ibid. 115 Ibid para 195.
eJournal of Tax Research The case for introducing mandatory disclosure rules in Australia (part 2)
250
taxpayer, depending on who the disclosure requirement is imposed on).116 This is in line with OECD recommendations and also with international practices. It is therefore recommended that, to ensure deterrence, Australia’s MDRs should have specific monetary penalty provisions, which increase when non-compliance persists, as is the case with the UK and South African provisions. The non-monetary penalties should complement the monetary penalties by the ensuring that the latter are designed in a robust way to ensure greater compliance. It is however important to take into consideration the fact that the majority of tax advisers in Australia are most likely within the regulatory environment, for instance the regulation by the Tax Practitioner’s Board, which also sets out monetary and non-monetary penalties for non-compliance. It would thus be instructive for the rules to take into consideration the penalties for regulated tax advisers when designing the penalties for Australia’s MDRs.117
2.7 How to use the information collected
2.7.1 OECD recommendations
The OECD recommends that, in order to enhance the deterrence effect of a disclosure regime, information collected be used quickly by the tax authorities to change behaviour and to counteract tax avoidance schemes.118 This can be done through administrative, regulatory and legislative changes to close down opportunities for tax avoidance.119 A risk assessment can also be carried out to determine whether further action can be taken; this can, for example, take the form of an audit or more inquiries or legislative change. The tax authorities could also come up with a communication strategy whereby they issue notifications to taxpayers that they have detected an arrangement in the marketplace and are currently considering its tax implications. In such publications, tax authorities could describe the arrangement and their concerns with the arrangement, so that taxpayers are aware of the risks in undertaking the scheme; this can play an important role in influencing taxpayers’ and promoters’ behaviour on tax compliance.120
2.7.2 How the information collected is used in the UK
The UK regime has provided HM Revenue and Customs early information about tax avoidance schemes, allowing the UK Government, where appropriate, to introduce legislation closing them down before significant tax is lost and to deter such schemes.121
2.7.3 How the information collected has been used in South Africa
SARS data show that most of the disclosures relating to preference shares provided an insight into how preference share funding is utilised, which has informed the design of the new hybrid equity tax rules that were introduced.122 The information received has also been used by the Commissioner of SARS to quickly revise its Public Notices in the
116 Australian Treasury, OECD Proposals for Mandatory Disclosure of Tax Information, above n 10, Table 2, Issue 5. 117 Payne, above n 25, 24. 118 OECD, Mandatory Disclosure Rules: Action 12 – 2015 Final Report, above n 16, para 15. 119 Ibid para 213. 120 Ibid para 217. 121 UK Government, ‘HMRC Disclosure Statistics: Data for the period from 1 August 2014 to 30 September 2014’, https://www.gov.uk/government/uploads/system/uploads/attachment_data/file/379821/HMRC_-_Tax_avoidance_disclosure_statistics_1_Aug_2004_to_30_Sept_2014.pdf (accessed 7 July 2015). 122 OECD, Mandatory Disclosure Rules: Action 12 – 2015 Final Report, above n 16, para 42.
eJournal of Tax Research The case for introducing mandatory disclosure rules in Australia (part 2)
251
Government Gazette (under section 35 of the TAA) to target the disclosed schemes that cause tax risk (without having to waiting for lengthy legislative procedures).
2.7.4 Australia’s preliminary position on the use of information collected
The Australian Treasury’s initial view is that, when a taxpayer has disclosed an arrangement, the ATO may take any of the following actions: use the information to improve risk assessment systems, review guidance and ruling products to determine suitability and contemporaneity, undertake additional educational programs and undertake case reviews and audits where appropriate or necessary.123 The government’s preliminary proposals are in line with OECD recommendations and international practices.
2.8 Ensuring the rules cover international tax schemes
2.8.1 OECD recommendations
Action 12 of the OECD BEPS Project requires that countries ensure that their MDRs are effective in detecting cross-border tax planning. When the OECD reviewed some countries’ current MDRs, it noted that the rules largely cover domestic schemes and were not particularly effective in detecting cross-border ATP schemes. Thus, countries generally receive comparatively fewer disclosures of cross-border schemes and tax administrators find it difficult to obtain information on these schemes or to get a clear picture of the overall tax and economic consequences. This, the OECD explains, is because of the way cross-border schemes are structured and the approaches countries follow in formulating the requirements for disclosure of a reportable scheme.124 In Action 12, the OECD presented the five recommendations set out below to ensure that MDRs can appropriately target cross-border transactions, while not placing undue compliance burdens on taxpayers.125
(a) The hallmarks for an arrangement must cover cross-border tax planning. Cross-border schemes may be difficult to target by using generic hallmarks because these schemes often involve tailored commercial transactions (eg, acquisitions, refinancing or restructuring) which may not be widely promoted domestically.126 Thus, the OECD recommends that cross-border schemes are best targeted by using specific hallmarks that focus on the tax policy or revenue concerns for a particular country.127
(b) Ensure proper threshold conditions for disclosure of cross-border schemes. Unlike domestic schemes, cross-border schemes typically generate multiple tax benefits for different parties in different jurisdictions.128 Thus, if disclosure focuses exclusively on domestic tax outcomes for domestic taxpayers, tax administrations will not be able to understand the global picture or capture information on cross-border tax planning. Thus,
123 Australian Treasury, OECD Proposals for Mandatory Disclosure of Tax Information, above n 10, Table 2, Issue 5. 124 OECD, Mandatory Disclosure Rules: Action 12 – 2015 Final Report, above n 16, para 227. 125 Ibid para 228. 126 Ibid para 230. 127 Ibid para 240. 128 Ibid para 228.
eJournal of Tax Research The case for introducing mandatory disclosure rules in Australia (part 2)
252
the OECD recommends that countries should streamline the disclosure requirements for cross-border schemes by removing the threshold condition for cross-border schemes.129
(c) The definition of an ‘arrangement’ should cater for cross-border tax planning. The OECD recommends that countries should develop a broad definition of an arrangement to ensure that arrangements by domestic taxpayers include cross-border tax outcomes. Domestic taxpayers must disclose cross-border arrangements, even if they are not a direct party to the cross-border outcome. This would prevent the use of intermediaries and back-to-back structures to avoid disclosure.130 However, a reporting jurisdiction should not require disclosure of cross-border arrangements that have no substantive connection with the reporting jurisdiction and that do not give rise to any tax revenue risks.131
(d) Disclosure obligations must include cross-border transactions. A country’s disclosure rules should include cross-border schemes that have a substantive connection with that country and have domestic tax consequences for a domestic taxpayer.132 Even though taxpayers may not be aware of the offshore elements of the scheme or be in a position to properly understand its effects, the rules should not be framed in such a way as to encourage taxpayers to ignore the cross-border aspects of a scheme.133 To prevent an undue burden on taxpayers, a country should only require disclosure from a taxpayer that was a party to the arrangement (eg, the information is within their knowledge, possession or control) or where the cross-border outcome arises within the same group of companies.134
(e) Information to be reported should cover cross-border schemes. The OECD recommends that the information that should be disclosed in the cross-border context should generally be the same as the information required for domestic schemes. Such information should include information about the operation of the scheme, including key provisions of foreign law relevant to the elements of the disclosed transaction.135 Where the information about the scheme is held offshore and may be subject to confidentiality or other restrictions on disclosure, the OECD recommends that domestic taxpayers, advisers and intermediaries should be required to disclose all material information about the scheme that is within their knowledge, possession or control. The information obtained could also be used as the trigger for spontaneous exchange with another jurisdiction under information exchange provisions.136
2.8.2 UK regime and cross-border reporting
It should be noted that, although the UK DOTAS regime has a cross-border element, it is fundamentally a domestic scheme, and was never envisaged to specifically target international arrangements.137 With respect to ensuring that the disclosure obligations cover cross-border disclosure, section 309(1) of the Finance Act 2004 provides that
129 Ibid para 244. 130 Ibid para 241. 131 Ibid. 132 Ibid para 233. 133 Ibid para 234. 134 Ibid para 246. 135 Ibid para 253. 136 Ibid para 255. 137 Baker, above n 58, 88.
eJournal of Tax Research The case for introducing mandatory disclosure rules in Australia (part 2)
253
where a promoter is resident outside the UK, any person (the client) who enters into any transaction forming part of any notifiable arrangement must report.
2.8.3 South African regime and cross-border reporting
With respect to the OECD recommendation to use specific hallmarks as the best method to target cross-border schemes, in South Africa reportable arrangements include those specifically listed by the Commissioner of SARS by public notice in the Government Gazette (section 35(2) of the TAA). Currently, this covers cross-border transactions such as those involving non-resident trusts, foreign insurers and services rendered to a permanent establishment of a non-resident person in South Africa.138 To ensure that the disclosure obligations cover cross-border disclosure, section 34 of the TAA requires that if there is no promoter, or if the promoter is a non-resident, the participants to the transaction must report.139
2.8.4 Australia’s views
The Australian Treasury is yet to explore how to ensure the rules are effective in an international context. It is recommended that the design and drafting of MDRs for Australia should also take into consideration the OECD recommendations on cross-border matters as discussed above. The UK and South African approaches that have a cross-border element could be emulated.
2.9 Principles to bear in mind when designing effective mandatory rules
Overall, the OECD highlights that the design of MDRs should comply with the following principles:
The rules should be clear and easy to understand so that taxpayers have certainty about what is required by the regime.140
The rules should balance additional compliance costs to taxpayers with the benefits obtained by the tax administration.141
The rules should be effective in achieving the intended policy objectives and should accurately identify the schemes to be disclosed.142
The rules should be flexible and dynamic enough to allow the tax administration to adjust the system to respond to new risks (or carve-out obsolete risks).143
Information collected under mandatory disclosure should be used effectively to ensure change in behaviour and to counteract tax avoidance schemes.144
138 SARS Public Notice No. 140, para 2, in Government Gazette No. 39650 (3 February 2016). 139 Louw and Simpson, above n 36, 3. 140 OECD, Mandatory Disclosure Rules: Action 12 – 2015 Final Report, above n 16, 20. 141 Ibid 9. 142 Ibid 20, 23. 143 Ibid 9. 144 Ibid, Executive Summary.
eJournal of Tax Research The case for introducing mandatory disclosure rules in Australia (part 2)
254
The Australian Treasury’s Discussion Paper alludes to the above principles – an indication of the government’s intention to adhere to the same.145 In particular the Discussion Paper makes it clear that the government’s key priority will be ensuring that there is no unnecessary overlap with existing disclosure rules.146
3. REVIEW OF THE EFFECTIVENESS OF MANDATORY DISCLOSURE REGIMES
This section assesses the effectiveness of MDRs in both the UK and South African contexts, thereby providing a platform for ‘lessons learnt’ that can be useful for policy-makers in other Commonwealth law jurisdictions, including Australia.
3.1 The UK’s experience
HM Revenue and Customs asserts that the DOTAS regime has been a successful part of its multi‐pronged strategy for dealing with tax avoidance. Most of the professional firms and the tax directors of large companies have agreed that DOTAS has been effective in reducing marketed tax avoidance schemes.147
The DOTAS regime has been instrumental in providing HM Revenue and Customs with early information to ensure early detection of tax avoidance schemes. The early years following the introduction of the DOTAS regime saw a significant number of historical schemes disclosed. This gave rise to an initial spike of action to close down loopholes through legislative changes as more information became available about the schemes being promoted in the market.148 Over the years, the number of disclosures, especially from most mainstream tax advisers, lessened, which implies a decrease in the number of reportable schemes that are being invented and offered to customers.149 A 2011 OECD report indicated that the DOTAS rules have changed the economics of tax avoidance in the UK, and that the disclosures cut off over GBP 15 billion in avoidance opportunities.150 DOTAS is believed to be one, but not the only, factor in this change in behaviour.151 As numbers of disclosures have got much lower in recent years, the UK tax administration assumes that this shows the market for ATP schemes is shrinking, but they have put measures in place to ensure this is not as a result of non-compliance with the DOTAS regime.152 The marketed avoidance schemes are now believed to be largely the province of a small minority of tax advisory firms, generally referred to as boutique firms in the UK.153
The DOTAS regime has been an effective instrument in the identification of ATP schemes and their promoters and users. OECD statistics show that, from the introduction of DOTAS on 1 August 2004 up to 31 March 2013, around 2,366 schemes
145 Australian Treasury, OECD Proposals for Mandatory Disclosure of Tax Information, above n 10, para 4. 146 Ibid. 147 Baker, above n 58, 87. 148 UK Government, ‘HMRC Disclosure Statistics’, above n 121. 149 UK House of Lords, Select Committee on Economic Affairs, Tackling Corporate Tax Avoidance in a Global Economy: Is a New Approach Needed?, 1st Report of Session 2013-14 (31 July 2013) para 41; Baker, above n 58, 88. 150 OECD, Tackling Aggressive Tax Planning, above n 2. 151 OECD, Public Discussion Draft, above n 6, para 49. 152 Ibid para 50. 153 Baker, above n 58, 87.
eJournal of Tax Research The case for introducing mandatory disclosure rules in Australia (part 2)
255
were disclosed and 925 of them were closed by legislative changes.154 Over 200 stamp duty land tax schemes were closed by just three legislative changes.155
Clearly, the rules have been effective in deterring the promotion and use of ATP schemes. The information provided to HM Revenue and Customs has been useful in allowing the UK Government, where appropriate, to introduce legislation to close down ATP schemes before significant tax revenue was lost. The time taken to shut down certain schemes has also been quick. In one occasion, a scheme was closed down within a week of the disclosure, protecting millions in tax revenue.156 The use of client lists has enabled the government to put together an operational response unit that ensures the deployment of UK tax administration resources to be coordinated and planned more effectively to identify the number of possible cases at an early stage. Client lists have also provided an additional mechanism for checking that schemes are disclosed by all users.157 The UK has also used the information provided to influence taxpayer behaviour. For instance, HM Revenue and Customs may use the disclosed information and the client lists to make early contact with promoters and potential users to encourage them to change their view of a scheme. Legislation was introduced in 2014 which may require disputed tax in disclosed schemes to be paid before the dispute is settled, thus ensuring that the Exchequer, not the taxpayer in question, holds the benefit of the money during the dispute.158
It must be acknowledged, though, that the DOTAS regime can only do so much to reduce the UK tax gap. The 2014 HM Revenue and Customs statistics indicate that the UK tax gap was at 6.8 per cent of all tax liabilities (a total of GBP 34 billion), of which avoidance made up GBP 3.1 billion and ‘legal interpretation’ another GBP 4.5 billion.159 Thus, the DOTAS regime has no impact on other elements of the tax gap, which include error, failure to take reasonable care, criminal attacks on the tax system, evasion, non-payment of tax and the hidden economy.160
3.2 A review of South Africa’s provisions
South Africa’s reportable arrangement provisions161 work as an ‘early warning system’ for SARS, to identify aggressive transactions when they are entered into. This has allowed SARS to counter ‘innovative’ transactions as they are devised, instead of attempting to catch up a number of years later.162 When the rules were initially introduced in 2003,163 they largely focused on structured financial arrangements facilitated by banks (eg, preference share arrangements, which are legitimate), so fewer than 150 transactions. Some taxpayers indicated that they had encountered fewer transactions that they believed would give rise to concern, while others raised technical
154 OECD, Public Discussion Draft, above n 6, para 40. 155 Ibid. 156 Ibid. 157 Ibid para 45. 158 Ibid para 51. 159 HM Revenue and Customs, Measuring the Tax Gap: 2014 Edition (2014), http://webarchive.nationalarchives.gov.uk/20150612044958/https://www.gov.uk/government/statistics/measuring-tax-gaps. 160 Baker, above n 58, 88. 161 Part B of the TAA. 162 Louw and Simpson, above n 36, 3. 163 Introduced by the Revenue Law Amendment Act 45 of 2003, and set in section 76A of the Income Tax Act 58 of 1962 (now repealed).
eJournal of Tax Research The case for introducing mandatory disclosure rules in Australia (part 2)
256
points to avoid reporting or restructured their transactions to avoid the triggers for reporting.164 With various revisions to rules over the years, their deterrent effect on aggressive tax avoidance became more apparent, particularly in light of the SARS Commissioner’s Gazetted Public Notices of specific reportable arrangements, which have extended the scope of the rules with additional specific hallmarks targeting transactions that are of particular concern to the South African tax administration.165 Data from SARS shows that 582 arrangements have been reported since 2009 and that the majority of disclosures under the ‘specific reportable arrangements’ were made during 2009 by several large companies.166 SARS data shows that most of these disclosures comprised preference shares that are redeemable within 10 years of issue, which has provided an insight into how preference share funding is utilised. This understanding has informed the design of the new hybrid equity tax rules that have been introduced.167
4. CONCLUSION AND RECOMMENDATIONS
This article is the follow up to Part 1 which presented a case study of Australia in considering whether to adopt MDRs and how such a regime should be framed in the Australian context. Part 1 argued that MDRs will enhance the information available to the ATO to crack down on ATP. It provided recommendations to ensure that the rules do not unnecessarily overlap with existing disclosure rules, avoid unnecessary compliance burdens on taxpayers and ensure an appropriate balance of competing policy priorities.
This article (Part 2) has explored the anticipated168 implementation design issues of MDRs for the Australian context.169 It draws on the OECD recommendations for the design features of effective MDRs and presents a comparative legal analysis of how MDRs apply in two Commonwealth countries – the UK and South Africa – whose experiences may be informative in framing a regime suitable for Australia’s context and other Commonwealth countries contemplating the adoption of these rules. The article uses the OECD’s recommended best practices to critique the approaches followed in the UK and in South Africa; from their success stories, if any, recommendations are provided on the matters the government sought community views on with respect to the design features for Australia’s envisaged MDRs.
With respect to views sought by the government on the suitability of referring to some disclosure provisions in crafting some of the MDRs provisions,170 this article asserts that this is a plausible approach that will ensure that the rules are crafted in light of Australia’s circumstances. For example, some provisions in the existing promoter penalty regime (such as those relating to the definition of a promoter, meaning of prohibited conduct and the structure of penalties) could be expanded on and redrafted
164 South African Institute of Chartered Accountants, ‘New Reportable Arrangements Legislation’ (2009) 150 Tech Talk https://www.saica.co.za/TechnicalInformation/Publications/TechTalk/tabid/711/itemid/1211/pageid/4/language/en-ZA/language/en-ZA/Default.aspx (accessed 13 May 2012). 165 OECD, Public Discussion Draft, above n 6, para 54. 166 Ibid para 42. 167 Ibid. 168 Australian Treasury, OECD Proposals for Mandatory Disclosure of Tax Information, above n 10. 169 Ibid. 170 Ibid, Table 2, Issue 5.

eJournal of Tax Research The case for introducing mandatory disclosure rules in Australia (part 2)
257
to form certain sections of the envisaged MDRs. Similarly, some provisions in the Reportable Tax Position Schedule (as discussed in Part 1), such as those relating to reportable tax positions, could be redrafted to form certain sections of the envisaged MDRs that are suitable for Australia’s circumstances.
Ultimately, it is hoped that this two-part study is useful for governments and policy-makers in Australia – and other Commonwealth countries more broadly – considering whether to implement an MDR regime.
eJournal of Tax Research (2020) vol. 17, no. 2, pp. 258-279
258
Cost sharing of pensions paid under the 2001 and 2016 Australia-New Zealand social security agreements: should it be time for change?
Andrew Smith
Abstract New Zealand and Australia negotiated two social security agreements (SSAs) in 2001 and 2016 to coordinate and harmonise the payment of pensions to individuals who have migrated between the countries. Both SSAs include shared funding formulas where each country pays a part pension to a claimant based on how much of their working life that person has spent in each country. Using a modelling methodology this article examines whether these formulas result in an appropriate sharing of pension costs or whether one country gains at the expense of the other. The modelling suggests that New Zealand fiscally gains if its wealthier citizens retire in Australia irrespective of whether that wealth was accumulated in New Zealand prior to emigration or accumulated in Australia after arrival. New Zealand fiscally loses if wealthier Australian retirees retire to New Zealand and conversely gains if Australia’s poorer citizens retire there.
Key words: Old age pensions, superannuation, trans-Tasman migration, social security agreements
Associate Professor in Taxation, Victoria Business School, Victoria University of Wellington. Email: [email protected]. The author wishes to acknowledge the support of the School of Taxation and Business Law at the University of New South Wales where he was a Senior Visiting Fellow while researching and writing earlier versions of this article.
eJournal of Tax Research Cost sharing of pensions under Australia-New Zealand social security agreements
259
1. INTRODUCTION
The issue of which country should assume responsibility of meeting the cost of pensions paid to a migrant is a topical issue as migration increases and governments become increasingly concerned about meeting the costs of an aging society. This issue is of particular concern to the Australian and New Zealand governments given the free movement of labour under the Trans-Tasman Travel Arrangement (TTTA) and high levels of migration that have taken place pursuant to that agreement.
Reflecting the free movement of labour that has existed between the two countries going back to 1920, New Zealand and Australia have negotiated a number of bilateral treaties from as early as 1943 (known as ‘social security agreements’ or ‘SSAs’1) to coordinate and harmonise the payment of social security benefits to individuals who have migrated between the two countries. In the early stages both countries were happy to negotiate these SSAs on a ‘host country’ basis meaning that the country where the individual filed a claim for benefits would meet the cost of providing them even though they had split their working lives between the two countries or had spent most of their working life in the other country.
The host country basis for social security coordination became increasingly untenable for Australia from the 1980s as an increasing number of New Zealanders migrated to Australia which was not matched by similar migration in the opposite direction. In response to increasing concerns in Australia about the financial exposure they faced under the existing SSA with New Zealand, a revised SSA was negotiated in 1988 which required for the first time that the New Zealand Government contribute towards the cost of paying certain benefits (such as old age and veterans’ pensions) to former New Zealand residents living in Australia. The host country basis for social security coordination was, however, in principle retained at the claimant level.
The reimbursement provisions in the 1988 SSA proved insufficient for the Australian Government and in 1994 another SSA was negotiated requiring each country to make direct reimbursements to the other towards the cost of meeting social security benefits where a claimant had resided for less than 10 years in the other country.
Despite these reimbursements, friction remained between the two countries over social security issues which led to the negotiation of a completely new SSA in 2001. The 2001 SSA abandoned the host country basis for social security coordination at the claimant level and instead adopted a shared funding model based upon individual claims for pensions, with each state paying a part pension based on the time the claimant had spent in each state during their working life (from 20 to 65 years). Such an approach is more likely to produce a fairer allocation of pension costs between two states considering the tax that would have paid by the claimant during their working life. The 2001 SSA was replaced by a new SSA in 2016; however, both contain the same cost-sharing arrangements.2 The shared funding model incorporated into these two SSAs is
1 Sometimes also referred to as costing sharing agreements or totalisation agreements. 2 The 2001 and 2016 SSAs are substantially the same. The 2016 SSA was negotiated to reflect changes arising from the introduction of New Zealand legislation on same-sex couples and civil unions and the Australian raising of the eligibility age for the Australian age pension from 65 to 67 years. See Agreement on Social Security between the Government of Australia and the Government of New Zealand, signed on 28 March 2001, Canberra (entered into force 1 July 2002), [2002] ATS 12; [2002] NZTS 4 and Social Welfare (Reciprocity with Australia) Order 2002 SR 2002/119 (NZ) (‘2001 SSA’); Agreement on Social
eJournal of Tax Research Cost sharing of pensions under Australia-New Zealand social security agreements
260
consistent with the approach adopted in New Zealand’s other SSAs (except for the UK SSA)3 and follows the approach commonly adopted by European countries in their SSAs.
This article will examine how the liability to fund pension payments is allocated under the 2001 and 2016 SSAs between the Australian and New Zealand Governments through the application of a model based on a single claimant. The article is organised as follows: first, in section 2, the key features of an SSA will be reviewed followed in section 3 by a brief history of social security coordination between Australia and New Zealand. In section 4 the allocation formula in the 2001 SSA will be explained followed in section 5 by the development and application model to determine how the allocation formulas work in practice. Section 5 will also provide an analysis will be made of the results obtained and their implications for retirement income policies. Section 6 concludes.
2. WHAT IS A SOCIAL SECURITY AGREEMENT (SSA)?
Social security agreements are bilateral treaties between two states for the coordination and harmonisation of social security benefits. While they can apply to a range of social security benefits, they largely apply to old age pensions and other retirement income benefits. Entitlements to such pensions and benefits are usually accrued through contributions or residency by an individual over a long period of time spanning most of their working lives during which individuals may have migrated or worked offshore.
SSAs are designed to address several problems that can arise when two states’ social security programmes overlap or where individuals migrate between states. These relate to the responsibility for the funding of social security benefits (sometimes referred to as ‘dual coverage’) and the coordination of benefits for claimants.
Dual coverage arises when social security programmes are financed by specific levies or contributions which may result in an individual being liable to contribute to two countries’ social security schemes simultaneously but may not necessarily result in increased pension benefits. Dual coverage is not an issue between Australia and New Zealand as all social security benefits are paid out of general taxation.
Conflicts between two countries’ social security programmes can arise when an individual who has entitlements or coverage in two countries claims benefits. A person who has split their working life between two countries may also find that they are disadvantaged under both countries’ social security rules when they claim benefits and may end up receiving reduced pensions.4 These are usually addressed in an SSA by the
Security between the Government of Australia and the Government of New Zealand, signed on 8 December 2016, Wellington (entered into force 1 July 2017), [2017] ATS 10 and Social Welfare (Reciprocity with Australia) Order 2017 (NZ) (‘2016 SSA’). 3 The UK SSA (along with the earlier Australian SSAs) had its origins in a period when under domestic law New Zealand benefits were not payable offshore. In the late 1980s New Zealand Superannuation became payable outside New Zealand when partial benefit portability was introduced and thus the shared funding part pension approach for international social security coordination became possible. 4 Staff of the Social Security Administration (US), Social Security Handbook [107.3], as cited by Allison Christians, ‘National Report USA’ in Michael Lang (ed), Double Taxation Conventions and Social Security Conventions (Linde Verlag, 2006) 683, 703-704. It should be noted that the United States provides for portability of social security benefits under its domestic law and merely seeks to improve portability by
eJournal of Tax Research Cost sharing of pensions under Australia-New Zealand social security agreements
261
concept of ‘totalisation’.5 As eligibility to claim benefits typically depends upon the claimant making the necessary contributions to a social security scheme or, alternatively, establishing a period of residency in a state, ‘totalisation’ is used to coordinate eligibility between the two states. The totalisation principle operates by treating residency or a contributing period in one state as residency or contributions in the other state for the purposes of eligibility. It removes any disadvantage arising in terms of eligibility because a claimant has split their working lives between two countries. It should be noted that totalisation usually applies only to eligibility for benefits. It does not necessarily affect the calculation of benefits and how much each state must pay to a claimant falling under the SSA.
Beyond totalisation, SSAs usually prescribe how benefits are to be paid by the two countries where the claimant has split their working lives between the two countries. They may require the host country to meet the full cost or alternatively provide for each country to pay a proportional benefit.
Another benefit of SSAs is that they usually allow a person to make an application for benefits from outside the country where they are lodging their claim. In the absence of such provisions, many countries do not permit applications for social security from offshore due to increased risks of fraud and their inability to verify information supplied in applications. SSAs facilitate this because the agreements usually allow the social security administration of one state to use the services of their counterpart in the other state in processing benefit applications.
A feature of many New Zealand’s SSAs is a ‘grandfathering’ clause.6 The grandfathering clauses allow persons who are receiving benefits under a particular SSA to continue to receive them if the SSA is terminated or replaced by another SSA. The new 2016 SSA is unusual in that rights a person may have had under the 2001 SSA are not grandfathered, but instead the 2016 SSA applies. However, grandfathering of rights a claimant has under the 1994 SSA remains.7 Given that the two SSAs are largely the same other than the latest one just incorporating new provisions applying to same sex and civil union couples, the lack of grandfathering of rights under the 2001 SSA is of no significance.8
Politically these grandfathering clauses must create constraints when an SSA is being renegotiated to ensure that existing claimants are not disadvantaged compared to those falling under a replacement SSA and possibly the reverse where existing claimants receive a better treatment than those under a later SSA or if no successor agreement is negotiated.
obtaining undertakings that neither country will impose restrictions on benefit payments based solely on criteria of residency or personal presence in the other state: Christians, 689-690. 5 This concept of totalisation has sometimes resulted in SSAs being termed ‘totalisation agreements’. 6 See 2001 SSA (Australia), above n 2, art 26(2). 7 See 2016 SSA, above n 2, arts 26(3) and (4). 8 Rights under the 1994 SSA (Agreement Between the Government of New Zealand and the Government of Australia on Social Security, signed on 19 July 1994, Wellington, [1995] ATS 33; [1995] NZTS 1 (‘1994 SSA’)) are still grandfathered under the 2016 SSA, above n 2.
eJournal of Tax Research Cost sharing of pensions under Australia-New Zealand social security agreements
262
3. BACKGROUND TO THE SOCIAL SECURITY AGREEMENTS BETWEEN AUSTRALIA AND
NEW ZEALAND
New Zealand and Australia first entered into an SSA in 1943 around the time that Australia first introduced a comprehensive social security regime during World War II. Since then revised SSAs were negotiated in 1943,9 1949,10 1986,11 1988,12 1994,13 1999, 200114 and the current one in 2016.15 When SSAs were first negotiated by the two countries, both imposed separate social security levies; however, these were abolished in Australia in 1950 and in New Zealand in 1968. Both countries now fund social security largely out of general taxation unlike most Organisation for Economic Co-operation and Development (OECD) countries where separate levies are still found. The absence of such specific levies or taxes makes it harder to establish a link between the payment of levies or taxes into a social security scheme and the right to claim benefits. Even where a particular social risk is covered through a scheme funded by specific levies, it does not necessarily follow that the taxpayer has right of coverage or to make a claim.16
The earlier SSAs between Australia and New Zealand covered all major social security benefits on a ‘host country’ basis meaning that the government of the country where the person resided picked up the full cost of providing benefits to them, something only sustainable where migration between the two countries was largely balanced and income levels in both countries were roughly similar. However, as New Zealand citizens began to move to Australia in large numbers from the late 1960s and anecdotal evidence of welfare abuse by newly settled New Zealand migrants appeared, tensions emerged between the two countries over which government should meet the costs of social security benefits paid to New Zealand migrants who had settled in Australia.
The 1988 SSA departed from the strict host country principle by requiring the New Zealand Government to directly reimburse the Australian Government for New Zealand migrants who were receiving certain New Zealand benefits (New Zealand Superannuation,17 invalid and widow’s benefits) at the time they migrated.18 Individuals who had migrated before becoming eligible for one of those benefits were not required to be reimbursed by New Zealand. From the perspective of a claimant the 1988 SSA
9 Agreement Between the Government of Australia and the Government of New Zealand in respect to Reciprocity in Payment of Pensions, signed on 4 August 1943, Canberra and 3 September 1943, Wellington (entered into force 1 September 1943), [1943] ATS 3 (‘1943 SSA’). 10 Agreement on Social Security Between the Government of Australia and Government of New Zealand, signed on 15 April 1949, Sydney (entered into force 1 July 1949), [1949] ATS 9 (‘1949 SSA’). 11 Agreement Between the Government of Australia and the Government of New Zealand Providing for Reciprocity in Matters Relating to Social Security, signed on 5 October 1986, Melbourne (entered into force 1 October 1987), [1987] ATS 18 (‘1986 SSA’). 12 Agreement Between the Government of Australia and the Government of New Zealand Providing For Reciprocity in Matters Relating to Social Security, signed on 31 October 1988, Canberra (entered into force 1 April 1989), [1989] ATS 8; [1988] NZTS 7 (‘1988 SSA’). 13 See 1994 SSA, above n 8. 14 See 2001 SSA, above n 2. 15 See 2016 SSA, above n 2. 16 The National Disability Insurance Scheme (NDIS) scheme being introduced in Australia is partially funded by an increase in the Medicare levy, however, non-protected SCV holders in Australia (being New Zealand citizens who migrated after 26 February 2001) are not eligible to claim benefits under the NDIS despite being liable to pay the levy. 17 Then called ‘national superannuation’. 18 See 1988 SSA, above n 12, art 13.
eJournal of Tax Research Cost sharing of pensions under Australia-New Zealand social security agreements
263
was still a ‘host country’ one because they still only received a benefit from the state they resided in, although the SSA was not entirely a host-country one due to the direct reimbursement provisions.
The direct reimbursement provisions were revised (and effectively extended) in the 1994 SSA to cover persons who were claiming a benefit in one state where they had less than 10 years’ working age residence there and they had last commenced residence in that state on or after 1 January 1983.19 A 10 year period is also the residency qualification for old age pensions under both countries’ domestic laws and the purpose of these government-to-government reimbursements was to share the funding costs where a new migrant had only met the domestic residency qualification for an old age pension through totalisation under the SSA.20 These provisions had broader effect than the reimbursement provisions under the 1988 SSA as they applied in respect of a greater number of claimants and also in that the Australian Government had liability to reimburse the New Zealand Government as well.
It appears that by the late 1990s the Australian authorities were finding the practical aspects of the calculations to be made for each affected claimant cumbersome and impractical.21 In October 1999 a Protocol was negotiated which suspended the reimbursement provisions in Article 12 of the 1994 SSA and required New Zealand to make direct lump sum payments to Australia instead.22 These amounts started at AUD 107.5 million (plus AUD 17.5 million supplement) for the year beginning 1 July 1999 and AUD 122.5 million (plus AUD 12.5 supplement) for the year beginning 1 July 2000 pending the negotiation of a new SSA.23 It is not clear whether these lump sum amounts were discounted for the reimbursements to New Zealand that Australia would no longer have to make.
In October 2000 negotiations commenced for revised social security arrangements. Australia sought an outcome in which New Zealand increased its reimbursement for the cost of all social security benefits paid to New Zealand citizens living in Australia which at that point covered only age, veterans, single parent and disability pensions. Negotiations foundered on the amount to be reimbursed (AUD 300 million vs. AUD 1 billion)24 and the reluctance of Australia to take into account the amount of tax paid by New Zealand residents in Australia, quoted at being around AUD 2.5 billion.25 A
19 See 1994 SSA, above n 8, art 11. 20 In addition to the provisions for direct reimbursement in the 1988 and 1994 SSAs, a number of benefits were removed from the scope of SSA coordination (such as unemployment and sole parent benefits) and stand down periods were also introduced for new migrants in each country. 21 Exchange of Notes Between the Government of New Zealand and the Government of Australia To Make An Interim Amendment to the Reimbursement Provisions of the Social Security Agreement of 1994 as amended, Canberra, 21-25 October 1999, 2, para 2. 22 Ibid cl 1, para 1. 23 Ibid paras 3-5. 24 Amounts mentioned by Helen Clark in the Transcript of the Joint Press Conference of Prime Minsters Helen Clark and John Howard, Wellington (26 February 2001). It appears that the figure of $300 million was based on research undertaken by the Ministry of Social Policy by the New Zealand Institute for Economic Research (NZIER) –refer Vhari McWha and Phil Briggs, The Opportunity Cost of Unrestricted Trans-Tasman Migration – Report to the Ministry of Social Policy, New Zealand Institute of Economic Research (November 2000) 3. The amount is calculated as the additional costs incurred by the Australian Government by allowing the migration of lower skilled New Zealand citizens under the TTTA that would other not meet the immigration standards imposed by Australia for migrants from other countries. 25 Ministry of Foreign Affairs and Trade (NZ), ‘National Interest Analysis, New Zealand - Australia Social Security Agreement’, Wellington (2001) para 3.
eJournal of Tax Research Cost sharing of pensions under Australia-New Zealand social security agreements
264
compromise was reached that any cost-sharing arrangements between the two countries would be limited to age, veterans and disability pensions only and that ‘policy on access to the broader range of benefits remained a policy matter for each Government’.26
A new SSA was negotiated in 2001 which came into force on 1 July 2002. The key change heralded by the 2001 SSA was that funding for all the benefits covered by the SSA (being age, veterans and disability pensions) would be shared between both countries as had been occurring to some extent under the earlier SSAs but with two major changes:
shared cost arrangements would apply to all benefits covered by the SSA (mainly old age and veterans’ pensions) according to respective periods of working age residency in each country not just to those claimants who had less than 10 years’ residency in the state where they resided. Thus the number of persons potentially affected by these shared funding arrangements was much wider than before;
government to government reimbursements in respect of person claiming benefits under the 1994 SSA would be phased out.27 While the 1994 SSA remained in force, it would apply only to individuals who had sought benefits under the 1994 SSA before the 2001 SSA came into effect.
In addition, at the same time as these negotiations Australia immediately amended their domestic law to remove any newly arrived New Zealand migrant’s right to claim Australian social security benefits outside the scope of the 2001 SSA.28
The 2001 SSA was replaced by the 2016 SSA in December 2016. The 2016 SSA is substantially similar to the 2001 one except for incorporating new provisions for same-sex relationships and civil unions arising under New Zealand law and for the increase in the eligibility age to 67 years for the Australian Age Pension.
For the year ended 31 October 2016, 15,540 former Australian residents who are resident in New Zealand received a total of NZD 63.6 million from Australia (having grown from NZD 13.2 million and 3,900 individuals in 2007). For the same period New Zealand Superannuation totalling NZD 281.7 million was paid to 42,414 claimants residing in Australia (growing from NZD 51.5 million paid to 8,000 persons in 2007), although this excludes former New Zealand residents who became ineligible for any New Zealand Superannuation due to the income and asset tests for the Australian Age Pension. No data appears to have been collected by either the New Zealand or Australian authorities as to the number of former New Zealand residents retired in Australia who
26 Ibid. 27 Details of the remaining lump sum reimbursements required are set out in the 2001 SSA, above n 2, art 27. They are due to terminate in 2022 according to this provision; however, the Ministry of Social Development has reported that a final lump sum payment will be made in 2015 covering 5 years’ lump sums. See Ministry of Social Development (NZ), The Statistical Report 2012 (2013) 186. 28 This was done by making the SCV granted to New Zealand citizens on arrival after 26 February 2001 a temporary visa which made them ineligible to claim social security benefits under Australian law. In addition, making the non-protected SCV a temporary one removed any automatic right to apply for permanent residence in Australia and also any pathway to Australian citizenship irrespective of the length of Australian residency.
eJournal of Tax Research Cost sharing of pensions under Australia-New Zealand social security agreements
265
have forgone any payment of New Zealand Superannuation due to the level of their other income and assets.
4. THE COST SHARING FORMULAS IN THE 2001 AND 2016 SSAS
The 2001 and 2016 SSAs apply to old age, veterans’ and disability pensions only. They continue to include totalisation provisions whereby residency in one state is deemed to be residency in the other state for the purposes of pension eligibility but not payment. For the purposes of this article, the analysis will be limited to old age pensions (being the Australian Age Pension and New Zealand Superannuation) as they are by far the most important benefit (from a cost perspective) covered by both SSAs.
As mentioned earlier, the key feature of the two SSAs is the adoption of shared funding to the benefits falling within the scope of each agreement at the claimant level rather a government to government basis. Both states agree to pay offshore a pro rata pension to an eligible person who has migrated to the other state, based on the period of working age residency (i.e., between the ages of 20 and 65) the person had attained in the state they migrated from. In calculating the amount to be paid offshore, no account can be made of any pension payable by the state where they reside.29
4.1 Payments of New Zealand Superannuation
The following provisions override the general portability rules30 for New Zealand Superannuation even though they may produce a less advantageous outcome for a claimant.
Where New Zealand Superannuation is paid to someone resident in Australia under the SSA, the amount to be paid to them is determined by the following formula:31
Maximumbenefit
540
All periods of working age residency in New Zealand are to be aggregated;
the maximum rate of benefit is the maximum benefit payable for either a single or married person less a percentage agreed to in writing by the competent authorities. (This percentage reduction will be intended to be in lieu of New Zealand income tax since New Zealand Superannuation is subject to income tax in New Zealand32);
29 This prevents New Zealand from applying its deduction policy when New Zealand Superannuation is paid overseas under the SSA. Under the Social Security Act 1964 (NZ) s 70(1A), a deduction is not made for any foreign pensions received when New Zealand Superannuation is paid overseas under the general portability rules in the New Zealand Superannuation and Retirement Income Act 2001 (NZ) s 26. The deduction is made, however, for foreign pensions when New Zealand Superannuation is paid under the Pacific Islands portability provisions. 30 New Zealand Superannuation and Retirement Income Act 2001 ss 26, 26A and 26B. 31 See 2001 SSA and 2016 SSA, above n 2, art 9(1). 32 Income Tax Act 2007 (NZ) s CF 1(e). Despite the requirement in art 9(1)(b)(i) and (ii) of the SSA that the percentage to be applied in the reduction should be published in the New Zealand Gazette, the author has not been able to find any such notice. The Work and Income New Zealand website in their explanation
eJournal of Tax Research Cost sharing of pensions under Australia-New Zealand social security agreements
266
no amount of any Australian Age Pension is to be taken into account except for the cap under Article 9(3) – discussed further below.
There are specific provisions for dealing with working age residency in third countries. If a claimant is not a permanent resident of Australia under Australian immigration law, any periods of third country residency are to be treated as periods of New Zealand residency. Otherwise third country residency is not taken into account and effectively Australia bears that cost.
The amount of New Zealand Superannuation payable to a person in Australia under the above formula is, however, subject to a cap. Under Article 9(3) of the two SSAs the amount of New Zealand Superannuation payable to a person resident in Australia cannot exceed the amount that would have been payable to a person if they were entitled to receive an Australian Age Pension only. This means that the amount of New Zealand Superannuation payable to a person resident in Australia is ultimately determined by the application of the income and asset tests for the Australian Age Pension. There is, however, no corresponding cap in the other direction if a former Australian resident retires in New Zealand receiving an Australian Age Pension which is greater than the equivalent amount of New Zealand Superannuation. This latter possibility only arises under the 2001 and 2016 SSAs as under the earlier SSAs the Australian Age Pension was not payable to persons retired in New Zealand.
The justification for the cap is that it is to ensure that someone who has split their working lives between Australia and New Zealand and retired in Australia does not receive a publicly funded pension greater than someone who has spent their whole working life in Australia and has retired there. It also means that an individual claiming a benefit under either the 1994 or the 2001/2016 SSAs will receive the same levels of pensions under all of them if their circumstances are otherwise the same.
4.2 Payments of Australian Age Pensions
Article 13 applies to the calculation of the Australian Age Pension. In all cases the amount of the Age Pension is to be calculated disregarding any amount of New Zealand Superannuation received as being income for the purposes of the income test.33
Where an Age Pension is payable to someone who is in Australia, the amount of that Age Pension is to be determined by:34
excluding any New Zealand benefit from the amount of their income assessed for social security purposes;
the amount of any New Zealand benefit is to be deducted from the maximum rate of the Australian Age Pension;
of the 2001 SSA, above n 2, state that a 15 per cent reduction is applied. This amount could be greater than the applicable income tax if New Zealand Superannuation was the only income of the claimant. 33 See 2001 SSA and 2016 SSA, above n 2, art 13(1). 34 See n 33, above.
eJournal of Tax Research Cost sharing of pensions under Australia-New Zealand social security agreements
267
the balance of the Australian Age Pension (after deduction of any New Zealand benefit payable) is to be applied to abatement calculations required under the Australian income and asset tests.35
Where an Australian Age Pension is to be paid to a person resident in New Zealand, the amount to be paid to them is determined under two different formulas depending upon whether the person has more than 10 years’ working age residency in New Zealand or not.
If they have had less than 10 years’ working age residency in New Zealand, the following formula applies:36
A = where:
A = amount of the Australian Age Pension payable to someone in New Zealand;
Z = months of working age residency in New Zealand;37
R = the amount of the Australian Age Pension the person would have received if they had remained in Australia.
If they have had more than 10 years’ working age residency, the following formula applies:38
A =
where:
A = amount of the Australian Age Pension payable to someone in New Zealand;
W = months of working age residency in Australia with a minimum of 12 months;39
R = the amount of the Australian Age Pension the person would have received if they had remained in Australia.
The effect of the difference between the two formulas is not immediately apparent but it affects how periods of residency in third countries are treated. If the person has less than 10 years’ working age residency in New Zealand, the period of third country residency is effectively included as Australian residency and will be taken into account for the purposes of calculating the Australian Age Pension. This is reflected in Article 13(7) of the 2001 and 2016 SSAs that states that any pension obtained from a third
35 If the claimant retired in Australia is not a permanent resident of Australia any benefit received from a third country is to be deducted directly from the amount of Australian Age Pension payable: 2001 SSA and 2016 SSA, above n 2, art 13(7)(a). 36 See 2001 SSA, above n 2, art 13(4)(a) and 2016 SSA, above n 2, art 13(5)(a). 37 Although not explicitly mentioned it is assumed that all periods of New Zealand residency are aggregated. 38 See 2001 SSA, above n 2, art 13(4)(b) and 2016 SSA, above n 2, art 13(5)(b). 39 See n 38, above.
eJournal of Tax Research Cost sharing of pensions under Australia-New Zealand social security agreements
268
country will be excluded from the calculation of the Australian Age Pension but instead be deducted directly from it.
While there is a cap upon the amount of New Zealand Superannuation payable in Australia, which is determined with reference to the amount of the Australian Age Pension payable, there is no equivalent cap upon the amount of the Australian Age Pension payable to someone who has retired in New Zealand. It is possible for them to receive an Australian Age Pension in excess of the maximum rate of New Zealand Superannuation payable. In such cases, no New Zealand Superannuation will be payable.
Interestingly, there is no provision in the SSA placing any restriction upon New Zealand as to how it calculates the amount of New Zealand Superannuation payable to former residents of Australia. The SSA would have been negotiated with the knowledge that section 70 of the Social Security Act 1964 (NZ) would apply which requires any foreign publicly funded benefit to be deducted from any benefit paid by the New Zealand Government.
5. HOW DO THE ALLOCATION FORMULAS WORK IN PRACTICE?
5.1 Domestic payment rates
The allocation formulas contained in the 2001 and 2016 SSAs are applied using amounts determined under each country’s respective social security rules. In the case of New Zealand it is relatively simple to obtain those amounts as New Zealand Superannuation is a universal benefit with a range of amounts payable depending upon the circumstances of the claimant (i.e., married, single, living alone etc.). Their income and/or assets are not usually taken into account.40 Like all social security benefits in New Zealand, New Zealand Superannuation is subject to income tax. As income tax is levied in New Zealand from the first dollar earned, the tax effects of income tax must be taken into account when analysing New Zealand Superannuation.41
The amount of an Australian Age Pension payable to a claimant is a more complex calculation because the amount payable is determined after the application of both income and asset tests. The tests are applied separately and the test that produces the lower amount of age pension is the one that is applied.42 Like New Zealand Superannuation, the Australian age pension is taxable in Australia, but in most circumstances it is effectively tax free because the first AUD 18,200 of income earned by a resident individual in Australia is not taxed43 and this together with the Senior Australian and Pensioner Tax Offset (SAPTO) means that no income tax is payable if a
40 If they receive an overseas pension from a publicly funded scheme similar to New Zealand Superannuation then this is deducted from the New Zealand Superannuation paid under section 70 of the Social Security Act 1964. If they have a spouse/partner who does not qualify (usually because the spouse/partner is below the qualifying age of 65 years) a targeted benefit is payable where income is taken into account. 41 Up to NZD 14,000 the rate is 10.5 per cent and 17.5 per cent from that amount to NZD 48,000. 42 In practice the assets test tends to result in abatement before the income test does. This infers there is an assumption when setting these tests that pensioners will run down their capital to supplement their incomes. 43 For the income year beginning 1 July 2018. Above AUD 18,200 the marginal tax rate starts at 19 per cent up to AUD 37,000 then steeply climbs at 32.5 per cent up to AUD 90,000 and 37 per cent to AUD 180,000 and 45 per cent above that. In addition there is a Medicare Levy of 2 per cent although individuals on low incomes are exempt from this levy.
eJournal of Tax Research Cost sharing of pensions under Australia-New Zealand social security agreements
269
claimant’s income44 is below AUD 32,279 per year. The Australian Age Pension is also taxable in New Zealand if received by a New Zealand claimant.45
Under the income test, a single pensioner is able earn AUD 86 per week without any reduction of their age pension.46 Once that amount is exceeded, the age pension is abated by 50 cents for every dollar in excess of AUD 86 per week (AUD 172 per fortnight). An unusual feature of the income test is that for financial assets (shares, bonds, bank deposits and accounts, superannuation account balances) the amount of income is determined on a deemed basis and not what is actually earned. From 1 July 2017, for a single person the first AUD 50,200 of financial assets are deemed to earn 1.75 per cent and the excess 3.25 per cent. The deeming rates are reviewed annually to take into account changes in market interest rates and are lower than the rates applying in some earlier years.
The assets test is equally comprehensive. Nearly all assets owned by a claimant are included in the calculation (including potentially low value assets such as cars and household effects) but the claimant’s own home is excluded.47 Using the thresholds applying from 1 July 2018, a single person can own assets up to AUD 258,200 if they are a homeowner without any abatement but lose the right to a part-pension if their assets exceed AUD 564,000. The equivalent figures for a single person who does not own their own home are AUD 465,500 and AUD 751,500 reflecting an uplift which is very modest considering current real estate values in most major Australian cities. The rate of abatement when assets exceed the base threshold is AUD 3 per year for every AUD 1,000 of assets above the threshold.
The amounts payable under each of the benefits are as set out in Table 1.
44 The income upon which the Senior Australian and Pensioner Tax Offset is calculated is termed ‘rebate income’. It is a taxpayer’s assessable income increased by any reportable employer superannuation contributions and fringe benefits received as well as any investment losses are written back. 45 In practice it will be taxed as New Zealand taxes individuals from the first dollar of income and there are no tax reliefs available to senior citizens equivalent to the Senior Australian and Pensioner Tax Offset. 46 There is an additional exemption for earned income of AUD 125 per week. 47 This exclusion is claimed to create incentives to overinvest in owner-occupier housing. Any profit made from the sale of such housing is also exempt from capital gains tax. There are a range of provisions and concessions applying to claimants who do not own their own home to provide some equity with homeowners but it open to question whether these are sufficient.
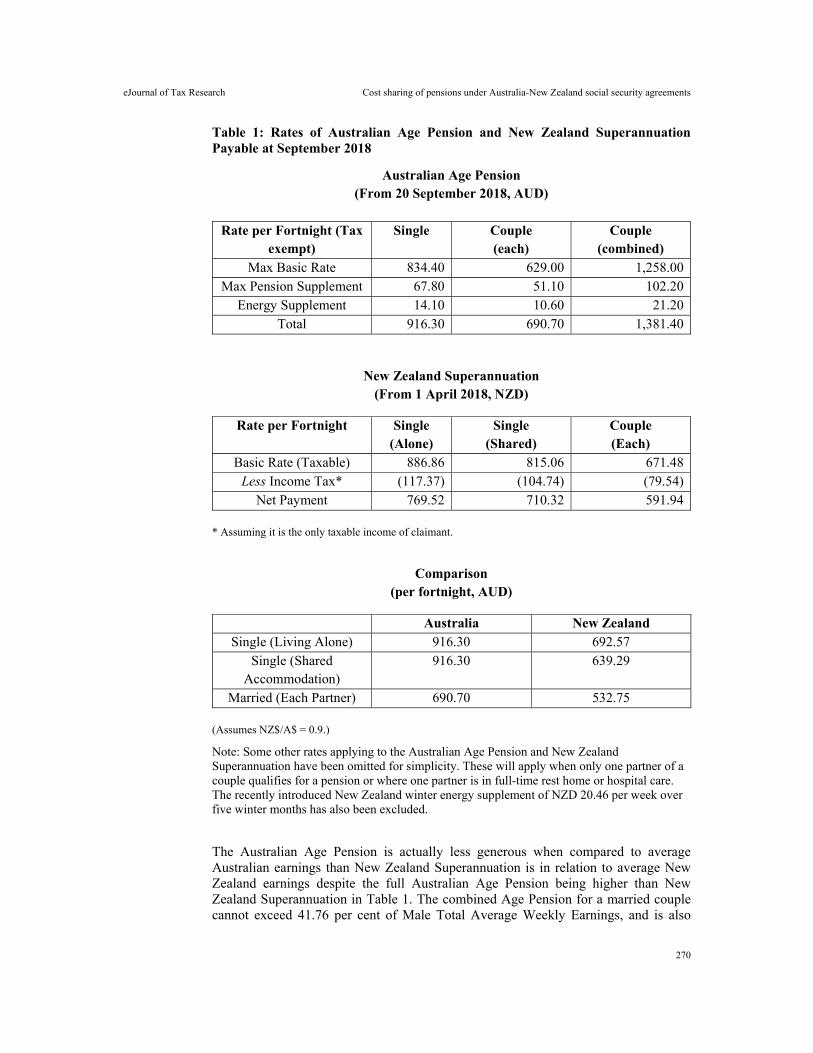
eJournal of Tax Research Cost sharing of pensions under Australia-New Zealand social security agreements
270
Table 1: Rates of Australian Age Pension and New Zealand Superannuation Payable at September 2018
Australian Age Pension (From 20 September 2018, AUD)
Rate per Fortnight (Tax
exempt) Single Couple
(each) Couple
(combined) Max Basic Rate 834.40 629.00 1,258.00
Max Pension Supplement 67.80 51.10 102.20 Energy Supplement 14.10 10.60 21.20
Total 916.30 690.70 1,381.40
New Zealand Superannuation (From 1 April 2018, NZD)
Rate per Fortnight Single (Alone)
Single (Shared)
Couple (Each)
Basic Rate (Taxable) 886.86 815.06 671.48 Less Income Tax* (117.37) (104.74) (79.54)
Net Payment 769.52 710.32 591.94 * Assuming it is the only taxable income of claimant.
Comparison (per fortnight, AUD)
Australia New Zealand Single (Living Alone) 916.30 692.57
Single (Shared Accommodation)
916.30 639.29
Married (Each Partner) 690.70 532.75 (Assumes NZ$/A$ = 0.9.)
Note: Some other rates applying to the Australian Age Pension and New Zealand Superannuation have been omitted for simplicity. These will apply when only one partner of a couple qualifies for a pension or where one partner is in full-time rest home or hospital care. The recently introduced New Zealand winter energy supplement of NZD 20.46 per week over five winter months has also been excluded.
The Australian Age Pension is actually less generous when compared to average Australian earnings than New Zealand Superannuation is in relation to average New Zealand earnings despite the full Australian Age Pension being higher than New Zealand Superannuation in Table 1. The combined Age Pension for a married couple cannot exceed 41.76 per cent of Male Total Average Weekly Earnings, and is also
eJournal of Tax Research Cost sharing of pensions under Australia-New Zealand social security agreements
271
adjusted by consumer price index (CPI) changes.48 Single persons receive 66.7 per cent of the married rate. By comparison, New Zealand Superannuation is set so that a married couple’s combined income is 66 per cent of the average net wage (after tax). The single rate is 60 per cent of that amount although a higher amount is payable to single people living alone. New Zealand Superannuation is the only benefit adjusted with reference to adult earnings; all other social security benefits in New Zealand are adjusted for the CPI only. Despite the Australian Age Pension being lower relative to Australian earnings than New Zealand Superannuation is to New Zealand earnings, the Australian Age Pension pays more than New Zealand Superannuation reflecting that average earnings are much higher in Australia than New Zealand. This difference will be a key influence in the results obtained in the modelling explained in the next section.
5.2 Modelling study
While the SSA incorporates specific formulas for the Australian and New Zealand Governments to share the cost of funding retirement benefits, it is not clear from a simple analysis of the formulas whether they produce an appropriate allocation of costs between the two countries. In order to determine this, a model was developed to see how the shared funding formulas work in practice and whether they result in a fair allocation of pension based on the underlying principle for allocating pension costs between the two states being periods of working age residency.
The basis of comparison adopted here in the analysis is a simple one. That is that a state assumes a liability to pay an old age pension based on the number of years the person spent in that state during their working age life, which is usually defined as the period of life between 20 and 65 years. The reason for adopting this basis is twofold. First, it is the foundation principle underpinning the 2001 and 2016 Australia-New Zealand SSAs, although the actual amounts paid under these SSAs are subject to caps which, as the results obtained in this study will show, ultimately lead to major departures from that principle. Secondly, it is a common principle underpinning many other SSAs found in the world today especially those negotiated by EU states.
This basis of costing sharing of pensions is open to criticism. It does not consider the capacity of each state to contribute paying pensions especially where there are significant differences in per capita incomes between two states or in the levels of overall taxation or the taxation mix (i.e., consumption taxes vs. direct taxes) in each state.
In making such a comparison, the simplest model that can be built is one assuming a claimant is a single person living alone. Including couples in the model will complicate it considerably because with couples it is very unusual for both of them to qualify for an age pension at the same date. Therefore the model would have to include couples where both are eligible for the pension as well as cases where only one of the two qualifies.
The modelling here assumes a hypothetical single person who has migrated between the two countries during their working life. It is also assumed that during their working lives
48 There is a specific CPI for pensioners used as well as the general CPI.
eJournal of Tax Research Cost sharing of pensions under Australia-New Zealand social security agreements
272
there has been no residency in a third country. The calculations are made at their initial application for an old age pension on their 65th birthday.49
The model has been built to take into account two key variables. The first is how many years of working age residency (being a total of 45 years between the ages of 20 and 65 years) respectively the person spent in each of the two countries. The second is the level of financial assets (which includes superannuation) a claimant has as this affects the amount of the Australian Age Pension payable.
A number of other variables have been assumed to be constant in the model. These are:
the amount of other assets the claimant owns (AUD 30,000 of personal property). If these were to increase the asset test would result in further abatement of the Age Pension even if the additional assets produced no income;
there are no other sources of income apart from pension income and returns from their financial assets. If these two variables were separated in the model different results could be obtained but the differences from the ones obtained may not be significant;50
the NZD/AUD exchange rate;
deeming rates for financial assets which are set with reference to prevailing interest rates - currently these are at historical lows (with probably little prospect of increase in the current environment).
In summary, the assumptions adopted in the model are as follows:
claimant: single person (living alone);
years lived the country of origin and the country of residency: one of 10/35 years, 20/25 years, 30/15 years and 45/0 years;
financial assets (including superannuation) – one of:
AUD 50,000;
AUD 100,000;
AUD 200,000;
AUD 300,000;
AUD 400,000;
AUD 500,000;
AUD 1 million;
49 The age of eligibility for the Australian Age Pension increased to 66 years on 1 July 2019; however this change does not affect the calculations in this study nor the validity of the results obtained or the conclusions made. 50 At higher levels of wealth it is usually the assets test that results in abatement of the Age Pension first not the income produced from these assets. There is also a concession for income from employment where the first AUD 250 per fortnight is exempt from the income test.
eJournal of Tax Research Cost sharing of pensions under Australia-New Zealand social security agreements
273
household and personal assets: AUD 30,000;
the claimant owns their own home and lives alone;51
the NZD/AUD exchange rate is 0.90;
no other sources of income other than Age Pension (and/or New Zealand Superannuation) and deemed income from their financial assets - i.e., no income from employment or from other assets.
A pension calculator site is used (http://yourpension.com.au/) to calculate the amount of Age Pension payable in Australia. However, it is not used to calculate the amount of the Age Pension payable to someone in New Zealand because the Pension52 and Energy Supplements are not paid offshore under Article 15(4) of the 2001 and 2016 SSAs.
The results are based on how much of the actual amounts payable under the SSAs by each of the Governments deviate from a strict proportional sharing of the total pension paid to a person under the SSAs based on their respective periods of working age residency. The issue is critical because the amount payable by one of the states to someone retired in the other state is determined by their domestic pension rules, while the total amount actually received by a claimant is determined by the pension rules of the state where they retired. There are significant differences in the pension rates set in the two countries leading to significant gaps between the proportions of the exported pension and the total pensions received.
There is also another issue to be considered. The amount of New Zealand Superannuation payable to someone who has retired is Australia is subject to a cap based upon the amount of Australian Age Pension payable to that person as if they had lived their whole life in Australia. This cap can reduce the liability of New Zealand to pay New Zealand Superannuation and results in a real gain to the New Zealand taxpayer. This absolute gain can only arise in one direction – when someone retires in Australia but has periods of working age residency in New Zealand. These savings can only accrue to the New Zealand Government. Similarly, the Australian Age Pension is taxable if paid to a New Zealand resident (although remaining exempt from tax in Australia) meaning that New Zealand gains from collecting income tax on Australian Age Pensions.
The results obtained for the situation where an individual migrates from New Zealand to Australia during their working life are shown in Tables 2 and 3. Table 2 shows the difference between the amounts actually payable by New Zealand to someone retired in Australia instead of an amount that would have been payable if New Zealand was required to pay a proportional of the Australian Age Pension actually payable to the
51 These assumptions are necessary as different thresholds apply to the assets test for the Australian Age Pension depending upon whether a claimant owns their own home or not. The assumption about living alone is necessary to determine which rate of New Zealand Superannuation is payable to someone in New Zealand. The living alone rate is not applied in calculating New Zealand Superannuation payable to a former resident retiring in Australia – refer Work and Income New Zealand website ‘Can I get extra financial help?’, at ‘Social security agreement with Australia’, https://www.workandincome.govt.nz/pensions/travelling-or-moving/social-security-agreements/australia.html. However the single living alone rate was required to be used in reimbursement calculations under the 1994 SSA, above n 8, art 12(2)(a)(ii)A. 52 Incorporates a number of allowances paid separately earlier including the Pharmaceutical Allowance, Utilities Allowance, GST Supplement and the Telephone Allowance.
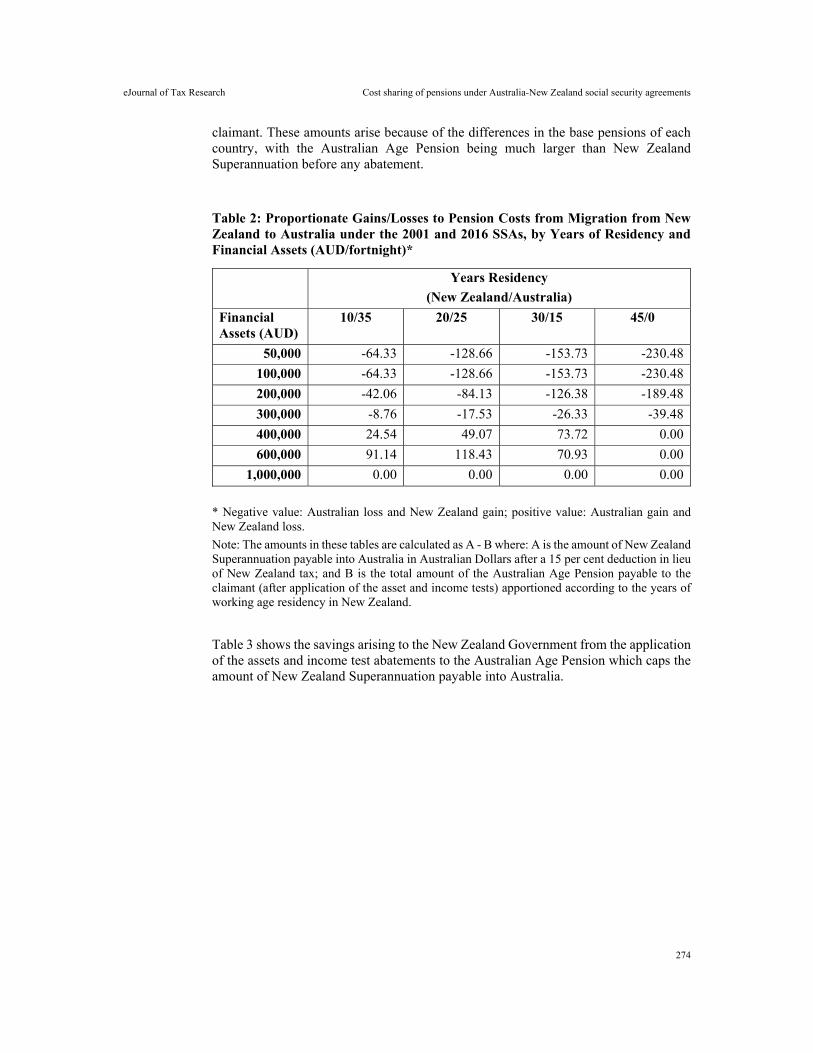
eJournal of Tax Research Cost sharing of pensions under Australia-New Zealand social security agreements
274
claimant. These amounts arise because of the differences in the base pensions of each country, with the Australian Age Pension being much larger than New Zealand Superannuation before any abatement.
Table 2: Proportionate Gains/Losses to Pension Costs from Migration from New Zealand to Australia under the 2001 and 2016 SSAs, by Years of Residency and Financial Assets (AUD/fortnight)*
Years Residency
(New Zealand/Australia)
Financial Assets (AUD)
10/35 20/25 30/15 45/0
50,000 -64.33 -128.66 -153.73 -230.48
100,000 -64.33 -128.66 -153.73 -230.48
200,000 -42.06 -84.13 -126.38 -189.48
300,000 -8.76 -17.53 -26.33 -39.48
400,000 24.54 49.07 73.72 0.00
600,000 91.14 118.43 70.93 0.00
1,000,000 0.00 0.00 0.00 0.00
* Negative value: Australian loss and New Zealand gain; positive value: Australian gain and New Zealand loss.
Note: The amounts in these tables are calculated as A - B where: A is the amount of New Zealand Superannuation payable into Australia in Australian Dollars after a 15 per cent deduction in lieu of New Zealand tax; and B is the total amount of the Australian Age Pension payable to the claimant (after application of the asset and income tests) apportioned according to the years of working age residency in New Zealand.
Table 3 shows the savings arising to the New Zealand Government from the application of the assets and income test abatements to the Australian Age Pension which caps the amount of New Zealand Superannuation payable into Australia.
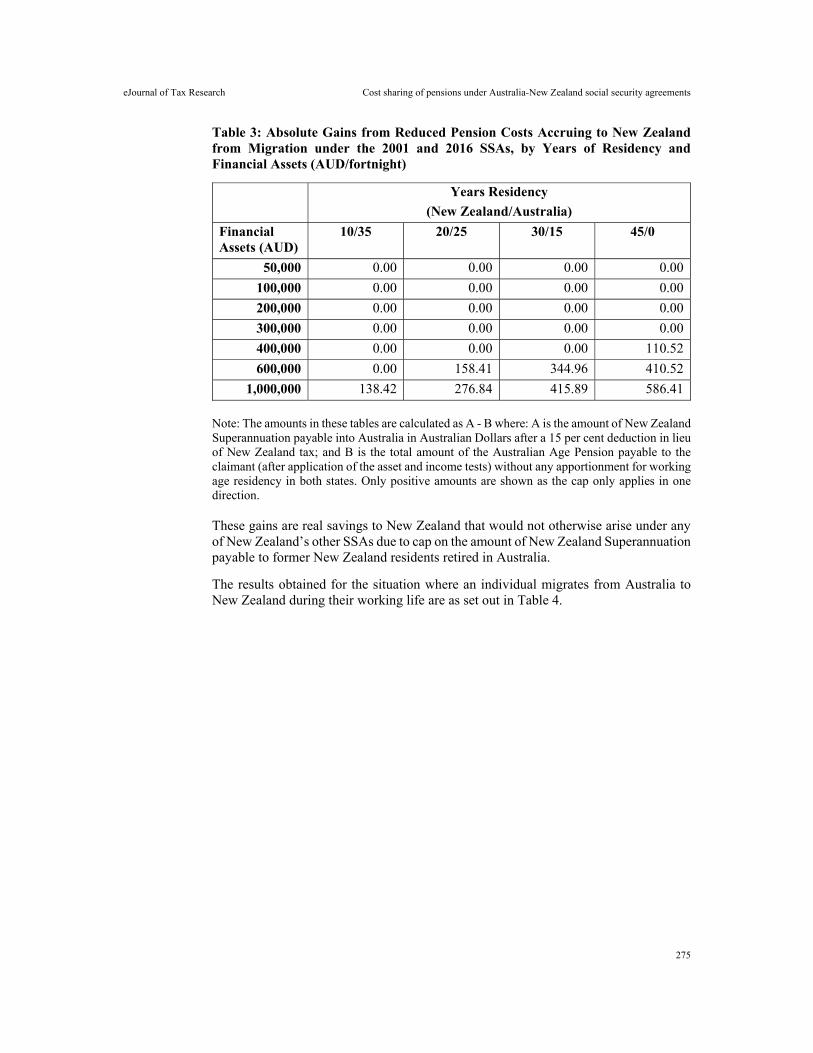
eJournal of Tax Research Cost sharing of pensions under Australia-New Zealand social security agreements
275
Table 3: Absolute Gains from Reduced Pension Costs Accruing to New Zealand from Migration under the 2001 and 2016 SSAs, by Years of Residency and Financial Assets (AUD/fortnight)
Years Residency
(New Zealand/Australia)
Financial Assets (AUD)
10/35 20/25 30/15 45/0
50,000 0.00 0.00 0.00 0.00
100,000 0.00 0.00 0.00 0.00
200,000 0.00 0.00 0.00 0.00
300,000 0.00 0.00 0.00 0.00
400,000 0.00 0.00 0.00 110.52
600,000 0.00 158.41 344.96 410.52
1,000,000 138.42 276.84 415.89 586.41
Note: The amounts in these tables are calculated as A - B where: A is the amount of New Zealand Superannuation payable into Australia in Australian Dollars after a 15 per cent deduction in lieu of New Zealand tax; and B is the total amount of the Australian Age Pension payable to the claimant (after application of the asset and income tests) without any apportionment for working age residency in both states. Only positive amounts are shown as the cap only applies in one direction.
These gains are real savings to New Zealand that would not otherwise arise under any of New Zealand’s other SSAs due to cap on the amount of New Zealand Superannuation payable to former New Zealand residents retired in Australia.
The results obtained for the situation where an individual migrates from Australia to New Zealand during their working life are as set out in Table 4.
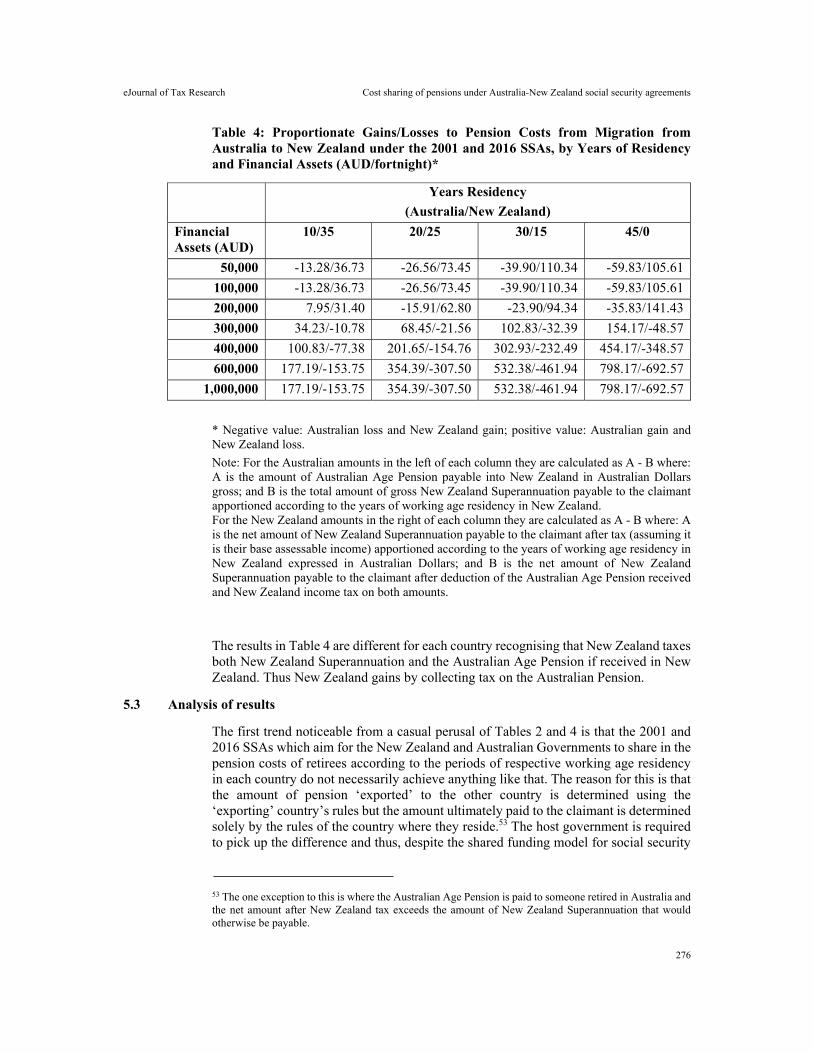
eJournal of Tax Research Cost sharing of pensions under Australia-New Zealand social security agreements
276
Table 4: Proportionate Gains/Losses to Pension Costs from Migration from Australia to New Zealand under the 2001 and 2016 SSAs, by Years of Residency and Financial Assets (AUD/fortnight)*
Years Residency
(Australia/New Zealand)
Financial Assets (AUD)
10/35 20/25 30/15 45/0
50,000 -13.28/36.73 -26.56/73.45 -39.90/110.34 -59.83/105.61
100,000 -13.28/36.73 -26.56/73.45 -39.90/110.34 -59.83/105.61
200,000 7.95/31.40 -15.91/62.80 -23.90/94.34 -35.83/141.43
300,000 34.23/-10.78 68.45/-21.56 102.83/-32.39 154.17/-48.57
400,000 100.83/-77.38 201.65/-154.76 302.93/-232.49 454.17/-348.57
600,000 177.19/-153.75 354.39/-307.50 532.38/-461.94 798.17/-692.57
1,000,000 177.19/-153.75 354.39/-307.50 532.38/-461.94 798.17/-692.57
* Negative value: Australian loss and New Zealand gain; positive value: Australian gain and New Zealand loss.
Note: For the Australian amounts in the left of each column they are calculated as A - B where: A is the amount of Australian Age Pension payable into New Zealand in Australian Dollars gross; and B is the total amount of gross New Zealand Superannuation payable to the claimant apportioned according to the years of working age residency in New Zealand. For the New Zealand amounts in the right of each column they are calculated as A - B where: A is the net amount of New Zealand Superannuation payable to the claimant after tax (assuming it is their base assessable income) apportioned according to the years of working age residency in New Zealand expressed in Australian Dollars; and B is the net amount of New Zealand Superannuation payable to the claimant after deduction of the Australian Age Pension received and New Zealand income tax on both amounts.
The results in Table 4 are different for each country recognising that New Zealand taxes both New Zealand Superannuation and the Australian Age Pension if received in New Zealand. Thus New Zealand gains by collecting tax on the Australian Pension.
5.3 Analysis of results
The first trend noticeable from a casual perusal of Tables 2 and 4 is that the 2001 and 2016 SSAs which aim for the New Zealand and Australian Governments to share in the pension costs of retirees according to the periods of respective working age residency in each country do not necessarily achieve anything like that. The reason for this is that the amount of pension ‘exported’ to the other country is determined using the ‘exporting’ country’s rules but the amount ultimately paid to the claimant is determined solely by the rules of the country where they reside.53 The host government is required to pick up the difference and thus, despite the shared funding model for social security
53 The one exception to this is where the Australian Age Pension is paid to someone retired in Australia and the net amount after New Zealand tax exceeds the amount of New Zealand Superannuation that would otherwise be payable.
eJournal of Tax Research Cost sharing of pensions under Australia-New Zealand social security agreements
277
coordination, there is still a host country liability which can be substantial and not recoverable from the other state. There are also fundamental differences in the design of each country’s pension scheme with one being asset and income tested while the other is largely universal. In addition, New Zealand’s pension payments are subject to income tax while Australia’s are effectively tax free which in some ways reflects the differences in income tax burden imposed upon lower income earners in each country.
Secondly, less wealthy pensioners (those with financial assets including superannuation balances below AUD 200,000) proportionately cost the Australian Government more with the effect more pronounced if the claimant has retired in Australia. Average superannuation balances in Australia have been reported at around AUD 271,000 for males aged 60 to 64 and around AUD 157,000 for females in 2015-1654 so that the thresholds used in the model at AUD 200,000 and AUD 300,000 are realistic in assessing the potential liability of Australia under the SSA. As the current Australian superannuation regime (the ‘superannuation guarantee’) has only been in place since 1992, not all workers have built up balances in their superannuation accounts over all of their working lives. Average balances will substantially increase in future decades (due to more contributions as well as the compounding effects of income earned on existing contributions) so that in two decades’ time average balances may be nearer to AUD 400,000 to AUD 500,000 for males at least. With average financial assets around those levels, the proportionate liability shifts to New Zealand more.
New Zealand proportionately gains from the migration of its less wealthy because Australia will pick up more of their pension costs if they retire there, while if they retire in New Zealand they will bring a substantial public pension with them (Australian Age Pension) which reduces New Zealand’s liability to pay New Zealand Superannuation as well as providing a tax revenue since the Australian Age Pension is taxable in New Zealand.
The migration of the wealthy and also those whose fortunes change through migration also has significant implications for both Governments but largely the reverse of those above. There is a substantial liability for New Zealand for wealthy retirees in New Zealand if they have lived most of their working lives in Australia. The irony is that their ability to accumulate substantial financial assets would have been driven by Australian retirement income policies supplemented by generous tax preferences.
Because the amount of New Zealand Superannuation payable in Australia is subject to a cap determined by the amounts of Australian Age Pension payable after the application of income and asset tests, New Zealand can enjoy substantial savings by not having to pay New Zealand Superannuation to more wealthy emigrants.55 This arises whether the individuals concerned brought wealth with them from New Zealand or instead it was accumulated in Australia after they arrived. Ironically New Zealand gains when its migrants are financially successful after they arrive in Australia and accumulate wealth there including the boost to their wealth accumulation from
54 Ross Clare, Superannuation Account Balances by Age and Gender (The Association of Superannuation Funds of Australia Limited Research and Resource Centre, Sydney, October 2017) 9, Table 1. 55 While wealthy individuals may forgo any public pension if they migrate to Australia from New Zealand, they may derive major income tax savings if they qualify as a temporary resident of Australia for income tax purposes as they will not be subject to Australian tax on any foreign sourced income. They will also be liable to tax on any Australian capital gains as a non-resident.
eJournal of Tax Research Cost sharing of pensions under Australia-New Zealand social security agreements
278
Australian tax preferences for superannuation accounts and for ‘negative gearing’ of rental property investments.
Concerns about a ‘brain drain’ to Australia from New Zealand and the losses to the latter might be tempered with knowledge of these gains from savings of New Zealand Superannuation, although this does not take into account the losses to the wider economy from the migration of skilled labour.
The figures obtained in the earlier Tables are based upon an NZD/AUD exchange rate of 0.90. As both currencies float in international markets and the exchange rate has shown considerable variability both within years and between years this rate is highly unlikely to apply over any period of time. The author varied the exchange rate used in the above model from 0.95 to 0.80 and repeated the above calculations. While the revised figures have not been included in this article in interests of brevity, the effect of the Australian dollar increasing in value vis-à-vis the New Zealand dollar results in New Zealand increasing its gains on a proportionate basis and also reducing its proportionate losses. Australia on the hand increases its proportionate losses and suffers a reduction in its proportionate losses. Given that the exchange rate of 0.90 initially used in the modelling is higher than the rates that have prevailed in earlier decades, the results obtained here in the model are likely to be more favourable to Australia than to New Zealand to some degree.
Given the current Australian Government policies concerning social security for New Zealand migrants in Australia who have migrated there under the TTTA, the fact that they still retain a disproportionate liability for the pension costs of these migrants may lead to pressures for a future review of the SSA between the two countries. New Zealand also has potentially very large liabilities if former Australian residents relocate to New Zealand. If the divergence in the economic performance of the two countries continues at the same rate as it has done in previous decades, the gains/losses to each respective government will be amplified. If the costs of this arrangement become too much for New Zealand, a question that arises is: will the price of sustaining some form of social security coordination with Australia means that it will be forced to harmonise its retirement income policies with Australia more, especially by raising the age of eligibility for New Zealand Superannuation and introducing targeting for this pension?
The results obtained also pose major questions concerning equity and fairness. While this article concerns the cost sharing of pensions for trans-Tasman migrants for the Australian and New Zealand Governments, there are clearly equity issues concerning the claimants themselves. Wealthy Australians can migrate to New Zealand to retire and receive full payment of New Zealand Superannuation even though they have contributed little or nothing by way of taxes to New Zealand during their working lives. Wealthy New Zealanders migrating to Australia forgo any publicly funded pension even though they may have substantially contributed to the New Zealand tax base during their working lives and would be able to receive full payment of New Zealand Superannuation under the portability rules if they retired outside New Zealand to any other country.
At the Governmental level there are also major equity issues. Australia is a much wealthier country than New Zealand both in size and on a per capita basis. Yet the results flowing from the cost sharing formulas found in the 2001 and 2016 SSAs leave New Zealand with substantial greater liabilities than Australia faces. The disparity in size also means that in any negotiations there is unequal bargaining power. Furthermore,
eJournal of Tax Research Cost sharing of pensions under Australia-New Zealand social security agreements
279
the factor that has enabled substantial levels of trans-Tasman migration and therefore makes the issue of cost sharing in respect of old age pensions so important, is the TTTA, which is nothing more than an ‘understanding’ between the two countries which can be unilaterally altered or terminated by either country. Given that the TTTA is probably more important to New Zealand than Australia, both economically and politically, the imbalance in bargaining power in respect of cost sharing over pensions is probably much greater than initially appears.
6. CONCLUSIONS
The 2001 and 2016 SSAs between Australia and New Zealand are of considerable importance to both countries given the substantial migration that has occurred for decades under the Trans-Tasman Travel Arrangement. The importance of these SSAs extends beyond just persons of retirement age who may decide to migrate between the two countries because it applies to anyone who has migrated between the two countries during their working life even if they have ultimately returned to their country of birth.
The model developed for the analysis in this article is simple but takes into account two key variables – the number of years during their working life a person has spent in each country and their wealth and income which affects the amount of Australian Age Pension payable. These two variables are the most critical in determining the amount of Age Pension payable under the SSA although other factors are relevant. Variations in the NZD/AUD exchange rate will also have effect as well as the deemed returns to financial assets set for the income test for the Australian Age Pension. At the moment with interest rates being at historic lows, a return to more normal interest rates will reduce the amount of the Australian Age Pension payable due to increased abatements under the income tests.
There are too many unknowns to answer the question in the title of this article, ‘should it be time for change?’, in a conclusive way. Each country can be viewed as gaining or losing under the SSA in respect of individuals with different circumstances. However, given that migration from New Zealand to Australia has been much greater than migration in the opposite direction, and that the average superannuation balances will continue to increase in the latter country in future decades, the balance of gains/losses under the SSA to New Zealand may move more into the ‘loss’ zone for New Zealand, although the cap upon the amount of New Zealand Superannuation payable in Australia provides a significant restraint upon the actual liability especially if New Zealand migrants do well there. There is a much greater liability if such migrants return to New Zealand to retire and this is where the greatest risk to New Zealand arises under the SSA. The results obtained from the modelling in this article however lead to questions as to whether the cap upon New Zealand Superannuation payable in Australia is really an imperative for Australian negotiators or whether New Zealand secretly promotes it in negotiations as it appears it is the net benefactor from the cap.
The approach of determining whether a country wins or loses in terms of old age pension costs can be also criticised in that it considers only one aspect of migration between the two countries. There is no consideration of the cost of meeting healthcare and other social supports for the elderly which continue to be met on a ‘host country’ basis. There is also no consideration of the wider benefits migrants bring to their country of adoption including higher economic growth. These might easily outweigh any increased pension costs.
eJournal of Tax Research (2020) vol. 17, no. 2, pp. 280-320
280
Value creation within multinational platform firms: a challenge for the international corporate tax system
Victoria Plekhanova
Abstract
This article uses the example of Google to discuss value creation within multinational platform firms and the tax challenges resulting from a disconnect between the current international corporate tax system and economic reality brought about by digitalisation.
Key words: multisided market, platform firm, user participation, synergy rent, Google
Lecturer, Business School, Massey University (Auckland, New Zealand), [email protected]. The author is grateful to three anonymous reviewers and Associate Professor Chris Noonan for valuable comments.
eJournal of Tax Research Value creation within multinational platform firms
281
1. INTRODUCTION
‘The challenge facing us now is to re-engineer the flow of information through the enterprise. And not only within the enterprise – the entire value chain is up for grabs’.1
‘[The] intangible nature of bits and their ability to be stored in any location that depends less on a physical as opposed to a logical determination, creates opportunities for policy arbitrage across jurisdictions and challenges policies that rely on the geographic location of the digital activity where value creation occurs. … Lastly, value mobility and the global reach of the Internet enable value creation, transaction and interaction regardless of location and borders, which may challenge traditional principles of territoriality, geographically based communities and sovereignty’.2
A platform firm, or digital ‘matchmaker’, is a relatively new business model that has become possible because of the invention, globalisation and commercialisation of the Internet. A new ‘platform economy’ brought about by digitalisation has arisen, and in this economy firms increasingly ‘will either operate “as” a platform or be “integrated” with a platform’.3 The rise of the platform economy has required the rethinking of laws and policies in many areas, including competition law, national security, privacy and taxation.
The idea that the business profits of multinationals should be taxed where value is created4 has been described as the ‘new gold standard’5 or the key ‘principle’ for the allocation of business profits among tax jurisdictions.6 The principle does not provide clear guidance for the international allocation of these profits.7 This article explains how
1 Hal R Varian, ‘Competition and Market Power’ in Hal R Varian, Joseph Farrell and Carl Shapiro, The Economics of Information Technology: An Introduction (Cambridge University Press, 2004) 1, 11. Varian is an academic and the chief economist at Google. 2 Organisation for Economic Co-operation and Development (OECD), Digital Economy Outlook 2017 (OECD Publishing, 2017) 27. 3 Mark Fenwick, Joseph A McCahery and Erik P M Vermeulen, ‘The End of “Corporate” Governance: Hello “Platform” Governance’ (Lex Research Topics in Corporate Law and Economics Working Paper No. 2018-5, 16 August 2018) 7-8. 4 The idea appeared in the framework of the Base Erosion and Profit Shifting (BEPS) project launched by the G20 and the OECD in 2013: see OECD, Action 1 – 2015 Final Report: Addressing the Tax Challenges of the Digital Economy, OECD/G20 Base Erosion and Profit Shifting Project (OECD Publishing, 2015) 136; OECD, Actions 8-10 – 2015 Final Reports: Aligning Transfer Pricing Outcomes with Value Creation, OECD/G20 Base Erosion and Profit Shifting Project (OECD Publishing, 2015). 5 Marcel Olbert and Christoph Spengel, ‘International Taxation in the Digital Economy: Challenge Accepted?’ (2007) 9(1) World Tax Journal 3, 9. 6 OECD, Tax Challenges Arising from Digitalisation – Interim Report 2018, Inclusive Framework on BEPS (OECD Publishing, 2018) paras 397-398. 7 For a critique of the value creation principle see, for instance, International Monetary Fund (IMF), ‘Corporate Taxation in the Global Economy’ (IMF Policy Paper, March 2019) 18-19 [31]. See also Wolfgang Schön, ‘One Answer to Why and How to Tax the Digitalized Economy’ (Max Planck Institute for Tax Law and Public Finance Working Paper No. 2019-10, 25 June 2019) 5-6, 13; Johannes Becker and Joachim Englisch, ‘Taxing Where Value is Created: What’s “User Involvement” Got to Do with It?’ (1 October 2018) 1, https://ssrn.com/abstract=3258387; Michael P Devereux and John Vella, ‘Value Creation As the Fundamental Principle of the International Corporate Tax System’ (European Tax Policy Forum Policy Paper, 31 July 2018), https://papers.ssrn.com/sol3/papers.cfm?abstract_id=3275759; Susan C Morse, ‘Value Creation: A Standard in Search of a Process’ (2018) 72(4/5) Bulletin for International Taxation 196, 197; Johanna Hey, ‘“Taxation Where Value is Created” and the OECD/G20 Base Erosion and Profit Shifting Initiative’ (2018) 72(4/5) Bulletin for International Taxation 203, 203-208; Michael P
eJournal of Tax Research Value creation within multinational platform firms
282
the value created by a multinational platform firm cannot be neatly divided into independent country-related segments under the existing international corporate tax system.8 The rise of the platform firms, it is argued, requires that the global community rethinks its approach to international tax policy.
A ‘platform firm’ can be defined in many ways. For the purposes of current discussion, the most useful definitions are: a ‘two-sided market with demand- and supply-side actors’,9 and an ‘intermediary that enable exchange between players’.10 In essence, the firm produces multiple products simultaneously and organises its business activities in such a way that the customers of one product will attract customers for another product produced by the same firm.11
Platform firms produce digital services and use ‘web platforms’ in their production and value creation processes. Web platforms (also known as ‘digital platforms’) are complex structures on the Web made up of linked web servers and software. These structures are designed for web interaction and processing of data and content provided by third parties on the Web.12 Platform firms use web platforms to facilitate web interactions with and among their customers. Some of these customers are individuals or ‘users’; other customers are businesses. Put slightly differently, platform firms use ‘places of interaction’13 to facilitate ‘exchanges between businesses and consumers’,14 to generate profit from providing ‘digital intermediation services’.15
Platform firms have become popular because their business structures are highly efficient.16
A platform firm generates a multisided market because it ‘creates value primarily by enabling direct interactions between two (or more) distinct types of affiliated customers’.17 This article distinguishes a platform firm, which is a commercial enterprise, from a multisided market, which is the business structure that a platform firm uses to generate value.
Devereux and John Vella, ‘Implications of Digitalization for International Corporate Tax Reform’ (Oxford Centre for Business Taxation Working Paper No. 17/07, July 2017) 8; Michael P Devereux and John Vella, ‘Are We Heading Towards a Corporate Tax System Fit for the 21st Century?’ (2014) 35(4) Fiscal Studies 449, 463-468. 8 See section 4 of this article. 9 Jean-Charles Rochet and Jean Tirole, ‘Platform Competition in Two-sided Markets’ (2003) 1(4) Journal of the European Economic Association 990. 10 Avi Goldfarb and Catherine Tucker, ‘Digital Economics’ (NBER Working Paper No. 23684, August 2017) 13. 11 See David S Evans and Richard Schmalensee, Matchmakers: The New Economics of Multisided Platforms (Harvard Business Review Press, 2016). 12 For more detail see Edward O’Connor, ‘The Web Platform: What It Is?’ (blog post of 21 May 2009), http://edward.oconnor.cx/2009/05/what-the-web-platform-is. 13 Joni Salminen, ‘Startup Dilemmas – Strategic Problems of Early-stage Platforms on the Internet’ (Working Paper Series A-12:2014, Turku School of Economics, 2014). 14 Australian Treasury, The Digital Economy and Australia’s Corporate Tax System (Discussion Paper, October 2018) 30. 15 OECD, Tax Challenges Arising from Digitalisation – Interim Report 2018, above n 6, 186, para 443. 16 Bruno Jullien, ‘Two-Sided B to B Platforms’ in Martin Peitz and Joel Waldfogel (eds), The Oxford Handbook of the Digital Economy (Oxford University Press, 2012) 161, 163. See also Simon P Anderson, ‘Advertising on the Internet’ in Martin Peitz and Joel Waldfogel (eds), The Oxford Handbook of the Digital Economy (Oxford University Press, 2012) 355, 357-393. 17 Andrei Hagiu and Julian Wright ‘Multi-Sided Platforms’ (Working Paper No. 12-024, Harvard Business School, 12 October 2011) 7.
eJournal of Tax Research Value creation within multinational platform firms
283
The digital economy has created many tax challenges.18 In this article, the focus is on the failure of the international corporate tax system to allocate profits from cross-border business activities of platform firms in accordance with value creation. It uses the example of Google19 to explain how platform firms create value and why this process of value creation results in the tax challenges when these firms operate in many states.
Not all entities that make up a multinational firm are necessarily involved in the operation of a multisided market. For instance, what is known as ‘Google’ or the ‘Google segment’20 is the largest part business unit of Alphabet Inc, a holding company incorporated in October 2015.21 This unit, but not Alphabet Inc in its entirety, can be referred as a ‘multinational platform firm’. For ease of exposition, this article refers to the entities of a multinational platform firm that are involved in the operation of such a firm’s multisided market as a ‘platform firm’.
Not all platform firms are multinational, but the ones that create the greatest tax challenges from an international tax perspective are multinational. This article examines multinational platform firms from both an economic (sections 2 and 3) and a tax perspective (sections 4 and 5).
Understanding value creation processes is critical to the design of international tax policy. In this context, the article discusses the structure of platform firms (section 2) and the typical process of value creation within a platform firm (section 3). This discussion is built upon several streams of economic thought. First, the article briefly considers strategic management theories of the firm and their evolution. The analysis assists in understanding why some firms are organised as platforms. Second, the platform theory of Rochet and Tirole,22 combined with the theory of network effects introduced by Katz and Shapiro,23 provides an explanation of the process of value
18 For a definition of ‘broader tax challenges’ in the digital economy see OECD, Action 1 – 2015 Final Report: Addressing the Tax Challenges of the Digital Economy, above n 4, 146-147, paras 376-380. 19 Google was created with the incorporation of Google Inc in California (the US) in September 1998. Google Inc, the ultimate parent company of the firm, was reincorporated in Delaware (the US) in August 2003. See Alphabet Inc and Google Inc, Annual Report Pursuant to Section 13 or 15 (d) of the Securities Exchange Act of 1934 (form 10-K) for the Fiscal Year Ended on December 31, 2015 (2015) 58, https://abc.xyz/investor/static/pdf/20151231_alphabet_10K.pdf?cache=5400095 (accessed 31 January 2020). 20 Google’s principal business is selling Internet advertising services and other digital products and intermediation services worldwide. The Google entities also produce goods (eg, virtual reality headsets) and technical infrastructure (eg, cloud infrastructure). See Alphabet Inc, Annual Report Pursuant to Section 13 or 15 (d) of the Securities Exchange Act of 1934 (form 10-K) for the Fiscal Year Ended on December 31, 2018 (2019) 26, https://abc.xyz/investor/static/pdf/20180204_alphabet_10K.pdf?cache=11336e3 (accessed 22 January 2020). 21 Amended and Restated Certificate of Incorporation of Alphabet Inc, https://abc.xyz/investor/static/pdf/alphabet-certificate-of-Incorporation.pdf?cache=89d188b (accessed 31 January 2020). 22 Rochet and Tirole, above n 9; Jean-Charles Rochet and Jean Tirole, ‘Two-sided Markets: A Progress Report’ (2006) 35(3) The Rand Journal of Economics 645. 23 Michael Katz and Carl Shapiro, ‘Network Externalities, Competition, and Compatibility’ (1985) 75(3) The American Economic Review 424. For further economic discussion of network effects and interconnection, see Jacques Crémer, Patrick Rey and Jean Tirole ‘Connectivity in the Commercial Internet’ (2000) 48(4) Journal of Industrial Economics 433; Jean-Jacques Laffont, Scott Marcus, Patrick Rey and Jean Tirole, ‘Internet Interconnection and the Off-Net-Cost Pricing Principle’ (2003) 34(2) The Rand Journal of Economics 370; Bernard Caillaud and Bruno Jullien, ‘Chicken & Egg: Competition among Intermediation Service Providers’ (2003) 34(2) The Rand Journal of Economics 309. See also David S
eJournal of Tax Research Value creation within multinational platform firms
284
creation within a platform firm. These theories show that customers on one side of the firm’s multisided market derive value from the presence of the customers on the other side of this market. This cross-demand affects the overall size of the pie (ie, the value created in the economy) and the firm’s share of this pie.
The subsequent sections of the article then draw on this economic analysis of platform firms. Section 4 provides a brief overview of the model applied under the current international corporate tax system for the international allocation of business profits. Section 5 brings the strands together. It shows that there is a disconnect between the current international corporate tax system and the economic reality of multinational platform firms. The article concludes (section 6) that the allocation of the business profits of multinational platform firms in accordance with value creation requires fundamental changes of the entire model applied for this allocation under the international corporate tax system.
2. PLATFORM FIRMS
2.1 How does a firm create value?
Michael Porter’s view of the firm and its value creation process24 remains highly influential.25 Under this view, in essence, a firm is an entity that operates on a market and converts inputs into final outputs.26 Professor Porter’s view of the firm and its value creation process provides a good explanation of the price and output decisions of the firm. His analysis, however, has been criticised for being too abstract and for focusing on markets rather than an organisation of a firm.27 It also fails to explain and deal with a firm’s growth.28 The discussion of the complex process of value exchanges within a multisided market shows that the Porter model is unable to fully account for the value creation process within platform firms.29
Another group of theories of the firm and value creation has become increasingly influential, especially with business managers dealing with firms operating in dynamic environments.30 These economic theories, which are based on the resource-based theory of the firm of Penrose31 and the dynamic capabilities theory of Teece,32 explain how firms grow and acquire sustainable competitive advantages.
Evans, ‘How Catalysts Ignite: The Economics of Platform-based Start-Ups’ in Annabelle Gawer (ed), Platforms, Markets and Innovation (Edward Elgar Publishing, 2011) ch 5; Jullien, above n 16. 24 Michael E Porter, Competitive Strategy: Techniques for Analyzing Industries and Competitors (The Free Press, 1980). 25 Christos N Pitelis, ‘Economic Theories of the Firm, Business, and Government’ in David Coen, Wyn Grant and Graham Wilson (eds), The Oxford Handbook of Business and Government (Oxford University Press, 2010) 35, 41. 26 Michael E Porter, Competitive Advantage: Creating and Sustaining Superior Performance (Free Press; Collier Macmillan, 1985) 39-40. 27 For a critique of Porter’s view of the firm, see Pitelis, above n 25, 37-42. See also John Kai, ‘Theories of the Firm’ (2018) 25(1) International Journal of the Economics of Business 11, 11-17. 28 Pitelis, above n 25, 37-42. 29 See section 3.3.1 of this article. 30 Pitelis, above n 25, 44-45. 31 Edith T Penrose, The Theory of the Growth of the Firm (Oxford University Press, 3rd ed, 1995). 32 David Teece, Gary Pisano and Amy Shuen, ‘Dynamic Capabilities and Strategic Management’ (1997) 18(7) Strategic Management Journal 509. See also David Teece, ‘Profiting from Technological Innovation: Implications for Integration, Collaboration, Licensing and Public Policy’ (1986) 15(6) Research Policy
eJournal of Tax Research Value creation within multinational platform firms
285
The resource-based view of the firm suggests that a firm’s competitive advantage evolves from its ability to exploit the strategic resources under its own control.33 The dynamic capabilities theory of the firm explains how a firm can have ‘invisible assets’, which are or give the firm its ‘capabilities’34 or ‘dynamic capabilities’,35 and how these assets can generate value in the form of economic rents.36 Capabilities ‘add to the value of the firm, but cannot be identified or priced specifically. As a result, their benefits can be observed in what appears to be a higher than fair market return on visible assets, but their exact workings are not observable’.37 The dynamic capability theory explains how value can be added through interactions within a firm. This theory also can explain how platform firms extract value from interactions of their own customers and network effects.38
2.2 Hierarchy vs. network
The commercialisation of the Internet and the rise of outsourcing have challenged the traditional view of the firm as an independent economic unit with a hierarchical internal structure. A view of the firm as a hierarchy has given way to a view of the firm as a network in the business organisations and strategy literature.39 In the network firm, a parent entity is in the centre (from its perspective) of an extended network of subsidiaries and business units, which are subject to different degrees of control from the centre, different interactive ties to each other and different degrees of dependency upon external relationships in order to function.40 The boundaries between the network firm and the world, especially in high-tech industries, are blurred.41
In the network firm relationships are based ‘on functional needs and efficiencies rather than ownership and formal specifications’.42 Each subsidiary or business unit of a network firm offers its unique capabilities to the entire network and, therefore, contributes to the general process of value creation. When a firm is seen as a network
285; David Teece, ‘Towards a Capability Theory of (Innovating) Firms: Implications for Management and Policy’ (2017) 41(3) Cambridge Journal of Economics 693. 33 Nick Wills‐Johnson, ‘The Networked Firm: A Framework for RBV’ (2008) 27(2) Journal of Management Development 214, 214. 34 Capabilities are ‘processes, systems, and structures that are at the core of the firm. While they involve the people of the firm, they are diffuse, not focused on any individual, and they are usually team-based, involving the interaction of many individuals’. Capabilities are tacit – ‘they cannot be fully described, and they are embedded in the firm and cannot be taken out of it with any individual’. Capabilities are unique – ‘the exact sequence of activities, set of ideas, or interaction of people that generates more efficient processes are not knowable – and therefore are not easily imitated, misappropriated, bought and sold, or replaced’. Stephen Tallman, ‘Dynamic Capabilities’ in Andrew Campbell and David O Faulkner (eds), The Oxford Handbook of Strategy: A Strategy Overview and Competitive Strategy (Oxford University Press, 2006) 378, 381-382. 35 Dynamic capability is ‘the firm’s ability to integrate, build, and reconfigure internal and external competences to address rapidly changing environments’. Teece, Pisano and Shuen, above n 32, 516. 36 Tallman, above n 34, 381-382. 37 Ibid 382-383. 38 See section 3.3.2 of this article. 39 Tallman, above n 34, 407. 40 Ibid 407-408. 41 Gary P Pisano and David J Teece, ‘How to Capture Value from Innovation: Shaping Intellectual Property and Industry Architecture’ (2007) 50(1) California Management Review 278; Ron Adner and Rahul Kapoor, ‘Value Creation in Innovation Ecosystems: How the Structure of Technological Interdependence Affects Firm Performance in New Technology Generations’ (2010) 31(3) Strategic Management Journal 306, 309-311, 327-329. 42 Tallman, above n 34, 407-408.
eJournal of Tax Research Value creation within multinational platform firms
286
and a part of a broader network, the firm’s unique capabilities add value to the final product offered to a customer and also increase the overall size of a value pie. This pie, which is a sum of value created for the firm and its customers, is discussed in section 3.2 and the value proposition in section 3.3 of this article.
2.3 A platform firm
The idea of a network firm has evolved further into the concept of a platform firm (or a ‘smart platform’). This is a firm that organises its ‘internal’ operations to facilitate collaboration amongst multiple stakeholders to deliver constant innovation in the functionality of the platform and related products and services. These various stakeholders are not limited to managers, employees, and investors, but also include (crucially) consumers, developers, content creators, other companies (both large and small), non-profits, educational institutions, governments, and others.43
Fenwick, McCahery, and Vermeulen have analysed the structure of the world’s largest tech companies and concluded that each of these companies is a platform firm that ‘creates value by facilitating exchanges between different but interdependent groups of “creators and extractors of value”’.44 As a result of this facilitation the platform firm generates profits for itself.45
Exchanges between different groups of customers are at the core of a platform firm. Therefore, it can be concluded that capabilities of a platform firm involve not only ‘the people of the firm’46 but also the firm’s own customers.
3. VALUE CREATION WITHIN A PLATFORM FIRM
This section analyses the process of value creation within a platform firm. This analysis includes a brief overview of pricing in a platform firm (subsection 3.1) and discussion of the value pie created by a platform firm (subsection 3.2). Finally, by using the example of Google (subsection 3.3), it explains how the participation of third parties (ie, platform users and nation states) affects dynamic capabilities of a platform firm and, as a result, affects the size of the firm’s share of the value pie.
3.1 Pricing in a platform firm
The way platform firms price their services is core to the very existence of these firms. Platform firms are, in effect, multisided markets and, therefore, need participants on all sides of their platforms. These firms bring the various participants together through specific pricing strategies. The pricing strategies in platform firms deal with the so-called chicken-and-egg problem where customers on one side of a platform are willing to participate in the platform activity only if there is a sufficient participation level on the other side.47 Consider, for example, that the ability of a newspaper to attract advertisers and the setting of the price of advertising is tied to the newspaper’s circulation, which is linked with the price (if any) for the newspaper.
43 Fenwick, McCahery and Vermeulen, above n 3, 7. 44 Ibid 6. 45 Ibid. 46 Tallman, above n 34, 381-382. 47 For more detail see Caillaud and Jullien, above n 23.
eJournal of Tax Research Value creation within multinational platform firms
287
Firms with a single-sided business need to decide only on prices for their products. In platform firms the process of value creation is more complicated. Platform firms often have a subsidy side and a money side.48 When platform firms are multisided markets with a subsidy side and a money side, these firms charge the customers on the subsidy side prices that do not cover the cost of the product being supplied. There are many different models of how services on each side of the multisided market are priced.49 Sometimes nothing is charged for the products or some reward is provided for using the product. At the same time, prices paid by customers on the money side are set so as to cover not only the costs of the product on this side, but also any losses on the subsidy side. Even if there is no subsidy side, the firm needs to decide on both an overall price level and price structure (ie, how much to charge and how much to earn on each side of the platform relative to the other side in light of the interaction between the two sides of the market).50
3.2 The value pie
Business activity is intended to create value – the value pie. In the case of the production of goods or services, it will usually create value for both the producers and consumers. The value pie, therefore, will be divided between a business and its customers. Value for businesses is created when revenue from an economic activity exceeds expenses incurred. At the same time, an economic activity, such as the production of goods or services, is also related to the creation of value for customers in two ways. First, customers receive value when they willingly exchange money for the goods or services. Second, creating value for customers helps sell products and increase revenue. Both the producer or supplier and the customer can be seen as sharing a single value pie. As Evans and Schmalensee have explained:
[a] regular business has to make sure that its customers are getting good value – that what they get is worth more than what they pay. And it has to ensure that it is making a profit – that the revenue it gets covers its costs and delivers a good rate of return for the business and its investors. It has to divide the value pie between itself and its customers so both it and its customers are happy.51
The share of the value pie left to the customers depends upon the price and the customers’ valuation of the product. The share of the value pie going to a firm depends on both its sales revenue and the costs of producing and selling its products to customers.52 Accordingly, sales revenue and the costs of production directly affect the size of a firm’s share of the value pie.
For a platform firm, like any other firm, not only the size of its share of the value pie, but also the size of the entire pie, is important. The difference is that a platform firm has customers on different sides of its multisided market. The size of the value pie produced by a platform firm should be large enough ‘to give every group [of customers] a large enough slice to convince them to stay, and to leave itself enough to cover its costs and
48 Evans and Schmalensee, above n 11, 33. 49 Jullien, above n 16, 165-166. 50 Evans and Schmalensee, above n 11, 91. 51 Ibid 57. 52 See ‘profit’ and ‘margin’ in Jonathan Law and John Smullen (eds), A Dictionary of Finance and Banking (Oxford University Press, 4th rev ed, 2008).
eJournal of Tax Research Value creation within multinational platform firms
288
provide a good rate of return’.53 As explained further in the next section, Google attracts customers on the money side of its multisided market by its attraction of customers on the subsidy side of this platform. The firm constantly improves services on both sides of the platform and spends a significant portion of its income on the acquisition of user traffic to web platforms and websites that are parts of Google’s global platform business.54
3.3 Value chain vs. value exchange
3.3.1 The external perspective of the value creation process: the value exchange
A firm, and the way that it generates value, can be viewed from external and internal perspectives. Both perspectives are helpful in understanding value creation in platform firms. The external perspective is reflected in the traditional structure-conduct-performance model of industrial organisation theory.55 This model focuses on the environment external to the firm and the interactions of the firm with its environment. From this perspective, a firm generates value as a result of its interaction with the environment or third parties operating within this environment.
The generation of value from business activity involves production and distribution processes. Production is the act of transforming inputs into outputs.56 Inputs, also known as factors of production, are the resources such as land (and other natural resources), labour (including all human work and skill), capital (including all money, assets, machinery, raw materials, etc.), and entrepreneurial ability (including organisational and management skills, inventiveness, and the willingness to take risks). Outputs are products (goods or services) produced with the use of inputs. The relationship between the quantity of inputs used to make a product and the quantity of output constitutes the production function.57 In general, the production function describes the maximum output obtainable from any given combination of inputs.58 Inputs add value, which contributes to the overall value creation, individually or in combination with other inputs. Distribution process, in the context of the current discussion, is the act of moving goods and services from producers to final consumers,59 which may also add value to the product, and again contribute to the overall value creation. Value added to the final
53 Evans and Schmalensee, above n 11, 57. 54 For instance, in the fiscal year 2018 traffic acquisition costs as a percentage of advertising revenue were 23.0 per cent, including through payments to web publishers participating in the Google AdSense program for access to their websites and web content, and payments to third parties for the distribution of Google’s browser Chrome and for redirecting search queries to Google websites. See Alphabet Inc, Annual Report Pursuant to Section 13 or 15 (d), above n 20, 32. 55 For explanations of the structure-conduct-performance model, see Michael E Porter, ‘The Contributions of Industrial Organization to Strategic Management’ (1981) 6(4) The Academy of Management Review 609. For the history of the origin of the structure-conduct-performance model, see Manuela Mosca, ‘Industrial Organization’ in Gilbert Faccarello and Heinz D Kurz (eds), Handbook on the History of Economic Analysis, Volume III: Developments in Major Fields of Economics (Edward Elgar Publishing, 2016) 291, 297-298. 56 See ‘production function’ in Craig Calhoun (ed), Dictionary of the Social Sciences (Oxford University Press, 2002). 57 Ibid. 58 David N Hyman, Public Finance: A Contemporary Application of Theory to Policy (Cengage Learning, 11th ed, 2014) 44. 59 See ‘distribution’ in John Black, Nigar Hashimzade and Gareth Myles (eds), A Dictionary of Economics (Oxford University Press, 5th ed, 2017).
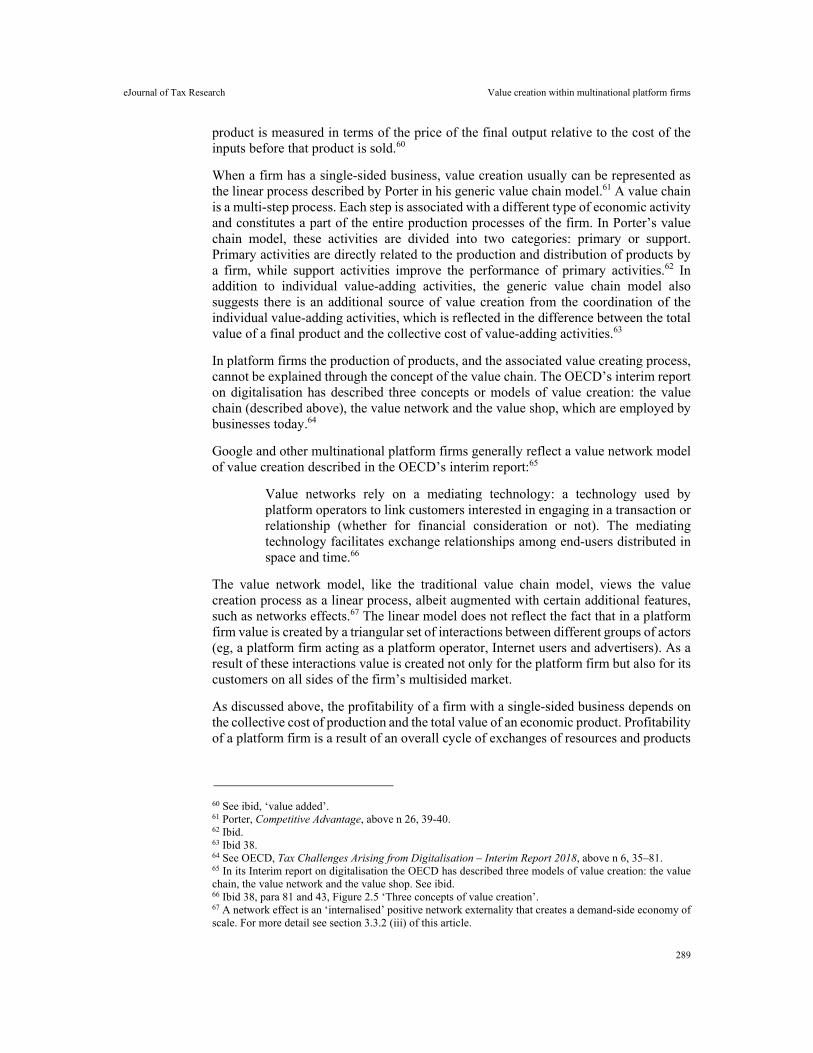
eJournal of Tax Research Value creation within multinational platform firms
289
product is measured in terms of the price of the final output relative to the cost of the inputs before that product is sold.60
When a firm has a single-sided business, value creation usually can be represented as the linear process described by Porter in his generic value chain model.61 A value chain is a multi-step process. Each step is associated with a different type of economic activity and constitutes a part of the entire production processes of the firm. In Porter’s value chain model, these activities are divided into two categories: primary or support. Primary activities are directly related to the production and distribution of products by a firm, while support activities improve the performance of primary activities.62 In addition to individual value-adding activities, the generic value chain model also suggests there is an additional source of value creation from the coordination of the individual value-adding activities, which is reflected in the difference between the total value of a final product and the collective cost of value-adding activities.63
In platform firms the production of products, and the associated value creating process, cannot be explained through the concept of the value chain. The OECD’s interim report on digitalisation has described three concepts or models of value creation: the value chain (described above), the value network and the value shop, which are employed by businesses today.64
Google and other multinational platform firms generally reflect a value network model of value creation described in the OECD’s interim report:65
Value networks rely on a mediating technology: a technology used by platform operators to link customers interested in engaging in a transaction or relationship (whether for financial consideration or not). The mediating technology facilitates exchange relationships among end-users distributed in space and time.66
The value network model, like the traditional value chain model, views the value creation process as a linear process, albeit augmented with certain additional features, such as networks effects.67 The linear model does not reflect the fact that in a platform firm value is created by a triangular set of interactions between different groups of actors (eg, a platform firm acting as a platform operator, Internet users and advertisers). As a result of these interactions value is created not only for the platform firm but also for its customers on all sides of the firm’s multisided market.
As discussed above, the profitability of a firm with a single-sided business depends on the collective cost of production and the total value of an economic product. Profitability of a platform firm is a result of an overall cycle of exchanges of resources and products
60 See ibid, ‘value added’. 61 Porter, Competitive Advantage, above n 26, 39-40. 62 Ibid. 63 Ibid 38. 64 See OECD, Tax Challenges Arising from Digitalisation – Interim Report 2018, above n 6, 35–81. 65 In its Interim report on digitalisation the OECD has described three models of value creation: the value chain, the value network and the value shop. See ibid. 66 Ibid 38, para 81 and 43, Figure 2.5 ‘Three concepts of value creation’. 67 A network effect is an ‘internalised’ positive network externality that creates a demand-side economy of scale. For more detail see section 3.3.2 (iii) of this article.
eJournal of Tax Research Value creation within multinational platform firms
290
that take place between the firm and its customers on all sides. This is illustrated by Figure 1 in relation to Internet advertising.
Fig. 1: Value Creation in a Platform Firm that Derives Income from Internet Advertising Services
Source: author.
The resources that a platform firm uses for the production of products in the multisided market in which it operates may not necessarily be wholly produced (or acquired) by the firm. For instance, in its global digital platform for Internet advertising,68 Google uses resources provided by or obtained from Internet users (eg, personal data, web content and web interaction). These resources are not merely incidental, but core to the provision of the digital services.69
In the case of Google, the collection and analysis of personal data makes possible the production of personalised Internet ads. Personal data is often a non-rivalrous capital good that, in theory, could be used simultaneously by many economic actors for the production of an unlimited number of goods and services.70 Google collects personal data either directly from Internet users (eg, through its web search platform) or through third party web publishers participating in Google’s ad network. Google often (but does not always) request that these third party web publishers install tracking software on Internet browsers or on the electronic devices belonging to the Internet users who visit their websites. Google may also acquire (at a price) personal data from data collecting agencies and operators of data exchange platforms.71 For Google, personal data is a vital
68 Google’s global digital platform for Internet advertising is a complex network of web platforms. This network operates in many states and sometimes is referred as ‘global digital platform’. For more detail see Victoria Plekhanova ‘Global Matchmakers: Tax Challenges and Responses in the Digital Economy’ (Doctoral Thesis, University of Auckland, 2017) section 3.2. 69 Eric A Posner and E Glen Weyl, Radical Markets: Uprooting Capitalism and Democracy for a Just Society (Princeton University Press, 2017) 214-218, 224-230. 70 OECD, Data-Driven Innovation: Big Data for Growth and Well-Being (OECD Publishing, 2015) 181-182. See also OECD, Measuring Capital: A Manual on Measurement of Capital Stocks, Consumption of Fixed Capital and Capital Services (OECD Publishing, 2001) 91. 71 For instance, Oracle BlueKai, – the leading big data management platform that aggregates data from interconnected smart devices, https://www.oracle.com/nz/marketingcloud/products/data-management-platform/.
eJournal of Tax Research Value creation within multinational platform firms
291
raw material, which needs to be analysed prior its use as an input into production of Internet advertising services.
Web content placed by Internet users on the web pages of open web platforms improves these web platforms and, therefore, makes them more attractive to other Internet users. Usually this web content can be placed only on central web platforms designed for display-related ads (eg, YouTube).
Another resource provided by Internet users is web interaction with or on a web platform. Interaction with a web platform can be illustrated with the example of Google’s web search platform. This web platform is designed for the interaction of Internet users with the web search platform only. Every time Internet users make search queries the users add value to Google itself because their searches improve the quality of search services provided by Google and, consequentially, the quality of the entire operation of Google’s global multisided platform for Internet advertising. The firm uses search queries as votes in the ranking process in its web search platform. Websites that have been searched more frequently will take a higher position on the organic list of a search engine results page (SERP) generated by Google’s web search platform in response to a search query from an Internet user.72
Also, the larger the number of search queries, the more precise the search results, in general, will be. The precision of search engines affects the popularity of the web platform among Internet users and, therefore, may strengthen the network effect on the side of the multisided platform where Google provides free search services. The strengthening of this effect enhances the network effect on the other side of the same platform where Google provides Internet advertising services. In other words, the popularity of the web search platform among Internet users, as well as the popularity of particular websites, enhances the competition among advertisers for ad slots available on the web search platform and other websites for the placement of search-related ads. While ad slots are usually sold through an ad price auction, the amount of revenue earned by Google from search-related ads depends directly on the popularity of its web search platform among Internet users and advertisers.
Interaction on a web platform assumes an exchange of information or web content between the users of the same web platform. Usually this type of interaction is triggered by the placement of web content on a web platform. For instance, when an Internet user uploads a video onto YouTube, this user provides Google with a resource in the form of web content. Other Internet users may leave comments on the YouTube web page about this video. In this case, Internet users are providing Google with a further resource in the form of interaction on its web platform.
As explained below, the levels of demand of groups of customers on different sides of a multisided market are interdependent.73 This effect is known as cross-sided demand.
72 When the Google web search platform receives a search query, the search algorithm checks the index for all web pages associated with the search query, ranks the results and creates a ‘search engine results page’ (SERP). A SERP usually includes ‘organic’ and ‘paid’ lists. The organic list is a result produced by a ranking algorithm of the web search platform in response to a search query. The paid list consists of search-related ads relevant to the key words used in a particular search query. See Vanessa Fox, Marketing in the Age of Google: Your Online Strategy Is Your Business Strategy (John Wiley & Sons, 2010) 114-116, 120-121. 73 See section 3.3.2 (iii) of this article.
eJournal of Tax Research Value creation within multinational platform firms
292
The firm needs customers on at least one side of its multisided market to interact on or with the firm’s web platform. This demand, together with the cross-demand between different groups of customers of a platform firm, keeps all participants in the value-generating cycle together.
3.3.2 The internal perspective of the value creation process: utilisation of synergies
(i) Synergies
The internal perspective on the value creation process builds on the resource-based view of a firm74 and the dynamic capabilities theory,75 which were discussed in section 2.1 of this article. From this perspective, the value creation process is the product of the ability of a firm to generate additional value by using internal synergies and synergies that involve third parties.
Internal synergies occur because a firm is a network of resources. The joining of these resources together within a firm can create the value for the firm. Some firms can also access an external network of resources and generate additional value by bringing together these resources with the firm’s own resources. In a platform firm, this occurs when the firm lets its customers access the firm’s web platform and facilitates interactions on or with its platform. In this case, synergies arise from individual interactions of customers on or with the firm’s web platform.
Synergies from individual interactions of customers on or with the firm’s web platform result from a combination of a technical factor (ie, interoperability) and a social factor (ie, willingness of customers to interact on or with a web platform). A platform firm and its customers need devices and software that allows these devices ‘to connect with each other and carry out their functions’.76 Therefore, a platform firm and its customers share responsibility for interoperability, which is a technical side of web interaction. The social side of web interaction sits with customers. On the other hand, this interaction is triggered by willingness of a customer to interact on or with the firm’s web platform.
Synergies from the individual interactions of customers on or with a web platform of a platform firm directly involve both the firm and its customers. In this sense, a firm does not merely access a network of external resources but provides a place (ie, web platform) where these resources can be created.
As discussed above, interactions on or with a web platform are inputs in the value creation process of the platform firm. These interactions give the firm personal data about people, and produce web content and improvements in the operation of an algorithm that the firm uses in its search web platform. The platform firm combines this data, web content and web platform improvements with its own resources. For instance, the firm may analyse personal data, and on the basis of this analysis produce personalised advertisements. These are advertisements which are displayed to individual Internet users who meet certain targeting criteria defined by an advertiser.
74 Penrose, above n 31. 75 Teece, Pisano and Shuen, above n 32. 76 See ‘interoperability’ in Darrel Ince (ed), Dictionary of the Internet (Oxford University Press, 3rd ed, 2003).
eJournal of Tax Research Value creation within multinational platform firms
293
(ii) Economies of scale and scope
Synergies can create economies. Platform firms utilise economies of scale and scope on both the supply and demand sides of an economic activity. This provides platform firms competitive advantages of two types: cost advantages and revenue advantages.77 An important consequence of this cost structure is that ‘if the biggest firm has the most significant cost advantages firms will compete to be biggest’.78
On the supply side, economies of scale and scope in both production and distribution processes are essential to value creation within a platform firm. The presence of economies of scale means that production at a larger scale can be achieved at a lower per unit cost.79 A group of firms, or entities that make up a firm, can achieve economies of scale jointly by sharing certain fixed costs. Economies of scale may also arise as a result of the specialisation of tasks performed by individual employees of a firm.
Platform firms, and most information- and technology-related businesses, have high fixed costs and low marginal costs.80 The costs of the invention of a new product or technology can be high. But these costs are often shared with governments, including when governments subsidise research and development directly or through tax instruments.81 The marginal cost of supplying services to a large number of customers may be low due to non-rivalry in the consumption of information. The same resources can be used an unlimited number of times without substantial costs. Production of many digital services can be automated. Once developed, the algorithm that collects and disseminates the information is operationalised, and digital services can be supplied automatically without – or with limited – human participation.
The size of an economy may limit economies of scale available to a firm. A firm may not be able to achieve maximum economies of scale because of the limited number of consumers in the economy. One of the benefits of international trade and economic globalisation is that firms and consumers may benefit from greater economies of scale. Multinational platform firms, such as Google, clearly benefit from their global reach.
Economies of scope arise where a firm produces a group of products or performs related economic activities and the production costs of this group of products or costs of related activities is less than the sum of producing individual products or conducting unrelated activities.82 Economies of scope are perhaps most visible in the ever-expanding range of products available through Amazon.
77 Varian, above n 1, 34. 78 Ibid 25-26. 79 Steven M Suranovic, ‘International Trade Theory and Policy, ch 80: Gains from Trade with Economies of Scale – A Simple Explanation’ (2007), http://internationalecon.com/Trade/Tch80/T80-3.php (accessed 22 January 2020). See also ‘economies of scale’ in Black, Hashimzade and Myles, above n 59; Charles E McLure, ‘Defining a Unitary Business: An Economist’s View’ (NBER Working Paper No. 1125, May 1983) 14-19; OECD, Data-Driven Innovation, above n 70, 184. 80 Varian, above n 77, 25. The marginal cost is the extra cost (or the increase in total cost) required to produce one extra unit of output (or the reduction in total cost from producing one unit less). See ‘cost, marginal’ in Paul A Samuelson and William D Nordhaus, Economics (McGraw-Hill-Education-Europe, 19th ed, 2011) Glossary of Terms, 652. 81 Marianna Mazzucato, Entrepreneurial State: Debunking Public vs. Private Sector Myths (Anthem Press, 2013). 82 See ‘economies of scope’ in Black, Hashimzade and Myles, above n 59. See also McLure, above n 79, 14-19; OECD, Data-Driven Innovation, above n 70, 184.
eJournal of Tax Research Value creation within multinational platform firms
294
(iii) Network effects
In addition to synergies from the individual interactions of customers on or with a web platform of a platform firm,83 there are also synergies such as network effects. Network effects lead to demand-side economies of scale.84 The larger the network of customers the more customers that will be attracted to the network, because customers wish to connect to many other customers.85 In such a case, economists say that the product exhibits network effects.86 The large number of customers also produces supply-side economies of scale where there are fixed costs involved in serving a group of customers.
In more technical terms, the network effect is based on the interdependent demand of customers.87 The more customers a firm has, the more it may charge for its products and the more products this firm can sell. When a firm is a platform firm, in addition to the interdependent demand within a group of customers on one side of its multisided market (eg, between users of YouTube platform), there is also a cross-sided interdependent demand. This means that the number of customers on one side of the market is interdependent with the demand on the other side of the market (eg, between users of the YouTube platform and advertisers). The more people that use the YouTube platform, the more Google may charge advertisers.
The cross-sided interdependent demand thus gives rise to an indirect network effect. The value of a multisided market to one group of customers depends upon how many customers of another group participate88 and want to interact with them.89 In platform firms an indirect network effect is, therefore, linked to interactions of the firm’s customers on or with the web platform of the firm. Sometimes there are more than two groups. In the case of Google, the firm’s customers involved in interactions are Internet users, advertisers, third party web publishers, developers of web apps.
The effective functioning of a multisided market of a platform firm depends on this firm’s ability to engage customers of each group in interaction with customers of the other group, to match the cross-demands of customers of different groups, and to maintain a sufficient number of customers in each group who are valuable to customers of the other group.
The effective functioning of a platform firm also depends upon the feedback effects. The concept of feedback has a variety of meanings. In the context of the current discussion, feedback is an output produced by the system and used by the system again as an input. In other words, the system feeds itself back. For instance, when interesting web content is placed on a web display platform,90 the more engaged in web interaction
83 See section 3.3.2(i) of this article. 84 Varian, above n 77, 33. 85 See explanation of networks effect in Katz and Shapiro, above n 23, 424. See also OECD, The Digital Economy 2012, Report of Hearings on the Digital Economy (OECD Publishing, 2013) 8. 86 Carl Shapiro and Hal R Varian, Information Rules: A Strategic Guide to the Network Economy (Harvard Business School Press, 1999) 13. 87 Jeffrey Rohlfs, ‘A Theory of Interdependent Demand for a Communications Service’ (1974) 5(1) The Bell Journal of Economics and Management Science 16, 16-37. 88 Evans and Schmalensee, above n 11, 25. 89 Ibid 30. 90 Web display platforms are designed for the publishing of display-related Internet ads. Users of these web platforms can interact not only with the platform, but also with each other on a web platform. Users can provide feedback related to the web content placed on the platform by other users of the web display
eJournal of Tax Research Value creation within multinational platform firms
295
on the web platform the existing users become, the greater number of new users the platform firm can attract. Web display platforms are designed for the publishing of display-related Internet ads. Users of these web platforms can interact not only with the platform, but also with each other on a web platform. Users can provide feedback related to the web content placed on the platform by other users of the web display platform or otherwise be involved in web communication with each other (eg, web communication may include web comments, clicks on hyperlinks or the ‘Like’ button, re-posts of web content or links related to this content, and so forth). Therefore, interaction on the web display platform creates the ‘self-reinforcing virtuous feedback loop’ that keeps old users engaged while also attracting new users.91
(iv) Synergy rents
Taxation of business income relies on the accounting definition of profit, which is ‘total revenue minus costs properly chargeable against the goods sold’ 92. From an economic perspective, accounting profit can comprise normal profit and economic rent (also known as ‘supernormal profit’, ‘abnormal profit’, ‘excess profit’ or ‘pure profit’) 93. Normal profit is a return (or equivalent of a return) to capital for capital owner plus a compensation for the risk.94 Normal profit is, therefore, an amount that covers the opportunity costs of entrepreneurial effort of a capital owner. Economic rent is an amount that exceeds the opportunity costs.95 It is in a sense ‘unearned income’.96
Economic rents take a variety of forms. For instance, so-called Ricardian rents are returns in excess of fair market returns due to the ownership of superior input factors that are in a permanent state of shortage, such as highly productive agricultural land.97 Schumpeterian rents arise from innovations.98 Another type of economic rent accrues to the owner of unique intangible assets if this owner is a single firm or small set of firms (often called rents to quasi-fixed assets).99 There are also quasi-rents, which are rents attributable to past investments, or to factors of production in temporarily fixed supply.100 In addition to all these types of rents, a firm may also generate network rents and synergy rents. 101Network rents arise from network effects. Synergy rents result
platform or otherwise be involved in web communication with each other (eg, web communication may include web comments, clicks on hyperlinks or the ‘Like’ button, re-posts of web content or links related to this content, and so forth). 91 Alag Satnam, ‘Understanding Collective Intelligence’ in Jörn Altmann, Ulrike Baumöl and Bernd J Krämer (eds), Advances in Collective Intelligence 2011 (Springer, 2012) 5, 7. 92 See ‘profits’ and ‘income statement’ in Samuelson and Nordhaus, above n 80, 664 and 671. 93 See ‘supernormal profit’, ‘excess profit’, and ‘economic rent’ in Black, Hashimzade and Myles, above n 59. 94 See ibid, ‘normal profit’. 95 See ibid, ‘supernormal profit’ and ‘excess profit’. 96 See ‘Economic Rent’, Henry George Foundation, https://www.henrygeorgefoundation.org/the-science-of-economics/economic-rent.html. 97 David Ricardo, On the Principles of Political Economy and Taxation (John Murray, 1817) 49-76. See also ‘rent, economic’ in Samuelson and Nordhaus, above n 80, 673. 98 Frederic Sautet, ‘Schumpeterian Rents’ in The Palgrave Encyclopedia of Strategic Management (Palgrave Macmillan, 2014) 1–3. 99 Margaret Peteraf, ‘The Cornerstones of Competitive Advantage’ (1993) 14(3) Strategic Management Journal 179. 100 IMF, Fiscal Affairs Department, ‘Fiscal Regimes for Extractive Industries: Design and Implementation’ (IMF, 15 August 2012) 5. 101 France Stratégie, Taxation and the Digital Economy: A Survey of Theoretical Models, Final Report (26 February 2015) 16,
eJournal of Tax Research Value creation within multinational platform firms
296
from economies. The firm effectively generates additional value that would not be generated if these economies were not present.
Synergy rents include rents to capabilities,102 sometimes called group synergy rents,103 which arise because of ‘combined purchasing power or economies of scale, combined and integrated computer and communication systems, integrated management, elimination of duplication, increased borrowing capacity, and numerous similar factors’.104 Group synergy rents are the product of supply-side economies of scale and/or scope.
Synergy rents also include what may be called customer synergy rents. Customer synergy rents are those that result from customers’ interactions on or with a firm’s web platform and network effects. In the case of platform firms, however, network effects generate not so-called ‘network rents’ but synergy rents – more precisely customer synergy rents. These rents arise not only because of the connection of customers with a single network, but also because of opportunity a platform firm provides to one group of its customers (eg, Internet advertisers) to reach another group of customers of the firm (ie, Internet users) through its own web platform.
A combination of resources of the firm with interactions of this firm’s customers or with network effects creates a synergy benefit. It is because an economic value of combined resources exceeds a sum of values of each resource provided by the firm and its customers individually or collectively as a network. For the firm the benefit from a combination of resources of customers with the firm’s own resources is a value added by the synergy rather than a value added directly by a customer.
Web interactions cost interacting customers their time. The platform firm often does not fully compensate its customers for the cost of their interactions on the firm’s web platform. This firm can provide a non-monetary compensation such as free services to some groups of its customers (eg, users); however, the cost of this compensation is often shifted to another group of the firm’s customers (eg, advertisers). Even if the firm bore the entire cost of web interactions, this firm would be able to generate a synergy rent from customers interactions if value added by synergy exceeded the cost of resources that have generated this synergy.
The platform firm does not share with its customers its profits from the value added by customer synergy rents. These profits are likely accumulated at a level of a parent company of the platform firm.105 However, from an economic perspective these profits cannot be associated with any of the legal entities of the multinational platform firm. If, as it is generally agreed, business profits of multinationals should be taxed where value is created, then some profits of a multinational platform firm from customer synergy rents should accrue to each state where this firm has customers.106
https://ec.europa.eu/futurium/en/system/files/ged/ficalite_du_numerique_9_mars_13_h.pdf. 102 Tallman, above n 34, 381–382. 103 Wills‐Johnson, above n 33, 214. See also a description of group synergies of a multinational firm result from in OECD, Transfer Pricing Guidelines for Multinational Enterprises and Tax Administrations (OECD Publishing, 2017) 89-90, para 1.157. 104 OECD, Transfer Pricing Guidelines, above n 103, 89-90, para 1.157. 105 See section 5.1.4 of this article. 106 See section 1 of this article.
eJournal of Tax Research Value creation within multinational platform firms
297
(v) Multinational groups
From an international corporate tax perspective, it is important to consider both supply-side and demand-side economies of a multinational platform firm. First, these economies affect the size of a value pie of the firm. Second, these economies can be used to establish a nexus between the business profits of a multinational platform firm and the source state, or in the development of a new instrument aimed at capturing some of the additional value generated by economies. It is also important to consider the participation of customers in a value creation process of a firm that happens through web interaction. The notion of a synergy rent helps to clarify the issues.
Supply-side economies of scale and scope generate value for a multinational platform firm. The additional value generated as a result of these economies may not have been able to be produced by a single entity of the firm in question. Each of the entities making up the firm will contribute more or less to the overall economies of the firm. The economies result from synergies between the entities of the group. Accordingly, the profits related to this additional value (the group synergy rent) are produced by a group of the firm’s entities.
Similarly, in the case of the demand-side economies of scale, the additional value generated by network effects, in principle, cannot be seen as produced by a single entity of the firm or solely by the firm. The same is true in relation to customer’s interactions on or with a web platform of a platform firm. Value from network effects and web interaction is co-produced by the firm and its customers. Therefore, the profits related to this additional value (the customer synergy rent) are also co-produced by the firm and its customers.
Multinational firms operate in a more or less globally integrated economic environment. When firms are both multinational and platform firms, the returns from both the supply-side economies of scale and scope and the demand-side economies of scale are enhanced because of the access to greater economies of scale on supply and demand sides. Of course, these opportunities for scaling depend upon the type of service the firm provides, because language, culture and other things may prevent there being a truly global market for most digital services.
4. THE INTERNATIONAL ALLOCATION OF BUSINESS PROFITS
This section provides a brief overview of the international allocation of business profits of multinational platform firms to set the stage for the analysis of the tax challenges created by multinational platform firms. From an international perspective, the current international corporate tax system performs two functions. First, it attributes the income (or loss) from the cross-border business activities of a multinational firm and related costs to the permanent establishments. Second, it allocates income (or loss) of a multinational firm and related costs among legal entities of the firm in some circumstances. The ‘attribution’ is the result of the application of source rules, while the ‘allocation’ is based on the transfer pricing rules of individual states (or more precisely nation states and dependent territories with their own tax jurisdiction).
Source rules included in tax statutes and tax treaties establish a nexus between a source state and the income of a non-resident. For that reason, source rules often are referred as ‘nexus rules’. These rules contain a definition of a taxable presence and a definition of income that is considered to be sourced in the jurisdiction. A taxable presence is
eJournal of Tax Research Value creation within multinational platform firms
298
usually defined using the model permanent establishment (PE) concept contained in Model Tax Treaties, which underpins the international corporate tax system. This model permanent establishment concept has traditionally linked business profits with a source state on the basis of a physical presence standard.107 The physical presence standard requires that the factors connecting business profits of an economic actor with a state (or, in the case of a dependent agent,108 its agent) should be physically located within that state’s territory.109 States have used the model permanent establishment concept to develop source rules in their statutes and tax treaties. The definition of income sourced in a jurisdiction needs to cover many types of income and usually includes profits of non-residents from business ‘carried on’ in the state’s territory.110
Transfer pricing rules allocate income (or losses) and associated costs to the legal entities making up a multinational firm when these entities are involved in commercial or financial transactions with each other (ie, controlled transactions). The transfer pricing rules apply to ensure these transactions are deemed to occur at prices that would prevail if the parties to the transactions were dealing with each other at arm’s length.111 The arm’s length principle requires a comparison of terms and conditions of transactions between entities under common control with similar transactions between independent enterprises and the adjustment of related party prices that tax administrations consider not to be made at arm’s length for the purposes of the assessment of income tax.112
The arm’s length price of each controlled transaction is determined under a particular transfer pricing method or a combination of transfer pricing methods. The choice of these methods is broadly based on the functional analysis which ensures the allocation of income (or loss) and associated costs to the parties of a controlled transaction in accordance with ‘functions performed, assets used and risks assumed’.113
The transfer pricing rules of individual states are harmonised to some extent under the OECD Transfer Pricing Guidelines114 and the United Nations Practical Manual on Transfer Pricing for Developing Countries.115 These guidelines are consistent with
107 See OECD, Model Tax Convention on Income and on Capital (OECD Publishing, 2017) art 5; UN, Model Double Taxation Convention between Developed and Developing Countries (UN Publishing, 2017) art 5. 108 OECD, Model Tax Convention on Income and on Capital, above n 107, art 5(5) and (6); UN, Model Double Taxation Convention between Developed and Developing Countries, above n 107, art 5(5) and (6). 109 OECD, Model Tax Convention on Income and on Capital, above n 107, art 5(1) and (2); UN, Model Double Taxation Convention between Developed and Developing Countries, above n 107, art 5(1) and (2). 110 OECD, Model Tax Convention on Income and on Capital, above n 107, art 7(1); UN, Model Double Taxation Convention between Developed and Developing Countries, above n 107, art 7(1). 111 ‘In the area of international taxation, transfer pricing under the ‘arm’s length’-standard serves the role of allocating profits to the different units of a multinational enterprise and of allocating taxing rights to the involved jurisdictions’: Wolfgang Schon, ‘Transfer Pricing – Business Incentives, International Taxation and Corporate Law’ in Wolfgang Schön and Kai A Konrad (eds), Fundamentals of International Transfer Pricing in Law and Economics (Springer, 2012) 47. See also OECD, Transfer Pricing Guidelines, above n 103. 112 See, for instance, ibid 33-34, paras 1.1-1.5. 113 See ‘functional analysis’ in OECD, Transfer Pricing Guidelines, above n 103, Glossary, 26. For a range of functions, assets and risks see ibid 51-74, paras 1.51-1.109. 114 OECD, Transfer Pricing Guidelines, above n 103. 115 UN, Practical Manual on Transfer Pricing for Developing Countries (UN Publishing, 2017).
eJournal of Tax Research Value creation within multinational platform firms
299
Porter’s view of the value creation process,116 and do not take account of the more modern forms of business organisation described in section 2 above.
The permanent establishment concept and transfer pricing rules apply in the framework of the so-called separate entity approach (or the separate accounting method).117 The separate entity approach, which 118is embraced in many soft law instruments and the national transfer pricing and source rules of many states, generally prevents the treatment of a multinational firm as a single taxpayer. The states where legal entities or permanent establishments of a multinational firm are located apply their own laws to these entities and treat them for tax purposes as if they are separate and independent enterprises.119
That said, the transfer pricing rules give some recognition to the fact that a multinational firm may generate not only the normal profits but also group synergy rents. Accordingly, the OECD’s Transfer Pricing Guidelines provide guidance for the allocation of the group synergy rents (so-called ‘synergistic benefits’) ‘from deliberate concrete group actions’.120 The Guidelines recommend using a functional and comparability analysis to define the nature and source of the synergistic benefit, and a connection between this benefit and deliberate concrete group actions.121 The amount of the synergy benefit should be determined and divided among entities of the firm in proportion to their contributions to this benefit.122
5. THE TAX CHALLENGES OF MULTINATIONAL PLATFORM FIRMS
Many of the tax challenges of multinational platform firms (and many multinational non-platform firms) are rooted in the fundamental structures of the international corporate tax system that allocates the right to tax business profits among states. This section uses the example of Google to illustrate the difficulties in the allocation of the business profits of a multinational platform firm to a state where value was created. These challenges are divided into two groups: ‘problems of price’ (section 5.1) and ‘problems of place’ (section 5.2). The article uses the terms ‘the price’ and ‘the place’ for ease of discussion.
5.1 Problems of price
The problems of price are related to the recognition and measurement in monetary terms of the costs of resources and the size of economies that platform firms use to generate business profits. These problems can be divided into four categories, which relate to intangibles; multisided market business structures; distribution centres; and customer participation in a value creation process.
116 Porter, Competitive Strategy, above n 24. 117 OECD, Model Tax Convention on Income and on Capital, above n 107, arts 9, 7, 3(1)(c), and 3(1)(d). 118 See, for instance, OECD, Model Tax Convention on Income and on Capital, above n 107, arts 9(1)(a) and 9(1)(b). 119 Ibid art 9; UN, Model Double Taxation Convention between Developed and Developing Countries, above n 107, art 9. See also Reuven S Avi-Yonah, ‘National Regulation of Multinational Enterprises: An Essay on Comity, Extraterritoriality, and Harmonization’ (2003) 42(1) Columbia Journal of Transnational Law 5, 8. 120 OECD, Transfer Pricing Guidelines, above n 103, 90, para 1.158. 121 Ibid. 122 Ibid 91, paras 1.161-1.162.
eJournal of Tax Research Value creation within multinational platform firms
300
5.1.1 Intangibles
Platform firms create value through the use of various intangibles. The allocation of the returns, costs and burdens related to intangibles is accomplished by compensating the entities of a multinational firm for functions each performed, assets each used, and risks each assumed in the development, enhancement, maintenance, protection and exploitation of intangibles according to the general principles of transfer pricing.123
For transfer pricing purposes, an ‘intangible’ means:
something which is not a physical asset or a financial asset, which is capable
of being owned or controlled for use in commercial activities, and whose use or transfer would be compensated had it occurred in a transaction between independent parties in comparable circumstances.124
Intangibles are often unique. They may also be created with the participation of more than one of the entities of a firm. These two facts significantly contribute to the difficulty in the allocation of income (or losses) from intangibles and the costs related to this income among the entities of a multinational firm. The transactional profit split method of transfer pricing has been designed to deal with this type of situation.125 This method, in particular, applies when each entity participating in a controlled transaction makes unique and valuable contributions,126 or the business operations of a multinational firm are highly integrated,127 or the entities of a multinational firm share the assumption of economically significant risks or have separately assumed closely related risks.128 All of these factors are present in the case of multinational platform firms.
On 21 June 2018 the OECD issued its Revised Guidance on the Application of the Transactional Profit Split Method.129 However, the new guidance contains no examples directly related to multinational platform firms and their use of intangible assets, despite (or perhaps because of) the prominence of tax issues associated with these firms.130
Many of the intangibles that platform firms, including Google, use to create value are ‘hard to value’ intangibles:
The term hard-to-value intangibles (HTVI) covers intangibles or rights in intangibles for which, at the time of their transfer between associated enterprises, (i) no reliable comparables exist, and (ii) at the time the
123 OECD, Transfer Pricing Guidelines, above n 103, 258, para 6.32. See also Celeste Black, ‘Australia’ in Guglielmo Maisto (ed), Taxation of Intellectual Property under Domestic Law, EU Law and Tax Treaties (IBFD Publications, 2018) 185. 124 OECD, Transfer Pricing Guidelines, above n 103, 249, para 6.6. 125 The transactional profit split method identifies the relevant profits (losses) to be split among the associated enterprises from a controlled transaction (or aggregated controlled transactions) and then splits those profits (or losses) among the associated enterprises in a way that approximates the division of profits that would have been agreed at arm’s length. The split is done by considering the relative contributions of each party and applying profit splitting factors. See ibid, Glossary. See also OECD, Revised Guidance on the Application of the Transactional Profit Split Method – BEPS Action 10 (OECD Publishing, 2018) 12 and 19, paras 2.115 and 2.149-2.150. 126 Ibid 14-15, paras 2.130-2.132. 127 Ibid 15-16, paras 2.133-2.138. 128 Ibid 17, paras 2.139-2.142. 129 Ibid. 130 Ibid 29-44, Annex II to Chapter II.
eJournal of Tax Research Value creation within multinational platform firms
301
transactions was entered into, the projections of future cash flows of income expected to be derived from the transferred intangible, or the assumptions used in valuing the intangible are highly uncertain, making it difficult to predict the level of ultimate success of the intangible at the time of the transfer.131
Hard to value intangibles have been viewed as a common tool for cross-border profit shifting. The OECD sought to address this type of profit-shifting in the framework of the BEPS project132 by adding section D.4 (‘Hard-to-Value Intangibles (HTVI)’) to chapter VI of its Transfer Pricing Guidelines.133 The new section:
protects tax administrations from the negative effects of information asymmetry by ensuring that tax administrations can consider ex post outcomes as presumptive evidence about the appropriateness of the ex-ante pricing arrangements.134
At the same time, the HTVI guidelines contain some exceptions from the presumption and would allow taxpayers to rebut the presumption created by evidence of ex post outcomes. One of these exemptions is where there is an ‘advance pricing arrangement in effect for the period in question between the countries of the transferee and the transferor’.135 Google entered into an advance pricing arrangement (APA) with the United States in 2006.136 Under this arrangement, the profits of Google Inc (Alphabet Inc since October 2015) earned from the use of intellectual property rights transferred to Google Ireland Holdings (a company incorporated in Ireland but a tax resident in Bermuda) are not subject to corporate income taxation in the United States.137 The inter-company licensing transaction between Google Inc and Google Ireland Holdings is at the heart of the global tax planning scheme of Google. Therefore, while the APA between Google and the tax authorities of the United States remains in force, the HTVI rules of the United States would not apply to Google.138
Whether or not other states can use their own HTVI rules against Google will depend on the tax policy of these states and quite possibly the cooperative audit efforts with other jurisdictions. Transfer pricing analysis requires a review of the functions performed, assets used, and risks assumed by local subsidiaries of Google in evaluating the development, enhancement, maintenance, protection and exploitation of intangibles.139 The tax authorities of the states wishing to apply the HTVI rules would need to obtain sufficient information to understand Google’s global business and the
131 OECD, Transfer Pricing Guidelines, above n 103, para 6.189. 132 OECD, Actions 8-10 – 2015 Final Reports: Aligning Transfer Pricing Outcomes with Value Creation, above n 4. 133 OECD, Transfer Pricing Guidelines, above n 103. 134 OECD, Guidance for Tax Administrations on the Application of the Approach to Hard-to-Value Intangibles – BEPS Action 8 (OECD Publishing, 2018) 9. 135 OECD, Transfer Pricing Guidelines, above n 103, para 6.193(ii). 136 Jesse Drucker, ‘IRS Auditing How Google Shifted Profits Offshore to Avoid Taxes’, The Bloomberg (13 October 2011), http://www.bloomberg.com/news/articles/2011-10-13/irs-auditing-how-google-shifted-profits-off shore-to-avoid-taxes (accessed 31 January 2020). See also Jesse Drucker, ‘Google for Audit on Avoidance of US Federal Taxes’, The Irish Times (14 October 2011), https://www.irishtimes.com/business/technology/google-for-audit-on-avoidance-of-us-federal-taxes-1.615756 (accessed 31 January 2020); OECD, Addressing Base Erosion and Profit Shifting (OECD Publishing, 2013) 74. 137 Ibid. 138 Analysis of transfer pricing legislation of the United States is beyond the topic of this article. 139 OECD, Transfer Pricing Guidelines, above n 103, 258, para 6.32.
eJournal of Tax Research Value creation within multinational platform firms
302
manner in which intangibles are used by the Google to add or create value across the entire supply chain of the firm.140 The business model of Google is very sophisticated, but it has now been closely examined by the OECD,141 tax authorities,142 and parliamentary committees of many states.143 The information exchange, reporting standards and transparency fostered by the OECD through a number of multilateral conventions144 and the International Compliance Assurance Programme (ICAP)145 can help tax authorities acquire and analyse information about local business activities of Google.
The HTVI rules of individual states, if uncoordinated, may create a risk of juridical double taxation for multinational platform firms (and multinationals in general). To prevent this risk, multinational platform firms now have a stronger incentive to enter into a multilateral advance pricing arrangement with all states where the firm’s digital platform operates.
5.1.2 Multisided markets
The current international corporate tax system has no rules specifically addressing issues of value creation within a multinational platform firm. This system was, of course, designed when digital platform businesses did not exist, let alone operate on a worldwide scale.
Consider, for instance, that when an Internet user makes a search query through Google web search platform, it triggers production and distribution of both free search services to this user and Internet advertising services to Google’s customers of Internet advertising services. Both services are produced and distributed at the same time through the ‘search engine results page’ (SERP) page. The technical production and
140 Ibid 247, para 6.3. 141 See, for instance, OECD, Action 1 – 2015 Final Report: Addressing the Tax Challenges of the Digital Economy, above n 4, Annex B, 171-175, paras 8-15; OECD,‘Tax Challenges Arising from Digitalisation – Interim Report 2018, above n 6, ch 2. 142 See, for instance, the UK, House of Commons Committee of Public Accounts, Tax Avoidance – Google, Ninth Report of Session 2013-14 (10 June 2013). 143 See, for instance, Michel Rose and Chine Labbe, ‘Investigators Raid Google Paris HQ in Tax Evasion Inquiry’ Reuters (24 May 2016), https://www.reuters.com/article/us-google-france-investigation/investigators-raid-google-paris-hq-in-tax-evasion-inquiry-idUSKCN0YF1CV (accessed 22 January 2020). 144 In particular: OECD and Council of Europe, Multilateral Convention on Mutual Administrative Assistance in Tax Matters of 25 January 1988 as Amended by the 2010 Protocol, concluded on 27 May 2010 (entered into force 1 June 2011), which is a key multilateral instrument for international assistance in tax matters, the exchange of tax information between states, and the enforcement of administrative foreign tax claims; Multilateral Competent Authority Agreement on the Exchange of Financial Account Information, approved June 2014 (CRS MCAA), which provides a standardised mechanism to facilitate the automatic exchange of information in accordance with the common reporting standard (CRS); Multilateral Competent Authority Agreement on the Exchange of Country-by-Country Reports, signed 27 January 2016 (CbC MCAA), which specifies the details of the exchange of the information between the home and host countries of some large multinationals. 145 The ICAP is a voluntary risk assessment and assurance program launched in Washington, DC in January 2018. The program brought together eight tax administrations, from Australia, Canada, Italy, Japan, the Netherlands, Spain, the United Kingdom and the United States, with a number of MNEs headquartered in these jurisdictions. The ICAP aims to facilitate open and co-operative multilateral engagements between MNEs and tax administrations in jurisdictions where these MNEs conduct their activities. For more detail see OECD, ‘International Compliance Assurance Programme (ICAP)’, https://www.oecd.org/tax/forum-on-tax-administration/international-compliance-assurance-programme.htm.
eJournal of Tax Research Value creation within multinational platform firms
303
distribution of search and advertising services supplied electronically146 is done in a single process.
With the lack of specific rules for platform firms, for tax purposes multinational platform firms can, and in fact must because of the separate entity approach, present their multisided markets as involving a series of independent single-sided businesses. In particular, the lack of rules addressing the special features of platform firms allows Google to legitimately separate the subsidy side of its multisided market from the money side. The firm allocates almost all income from profit-generating activities earned outside its home country (the United States) to the firm’s subsidiaries in Ireland (Google Ireland Ltd) and Singapore (Google Asia Pte Ltd).147 The profits derived from the money side are allocated to a few entities within the firm, while losses generated on the subsidy side are left with other entities of the firm and compensated under the cost-plus
148method of transfer pricing. This compensation is usually provided for sales and marketing services.
Google generates significant income from Internet advertising but receives no income from the many other digital services that the firm provides to its customers ‘for free’ as a part of the operation of its digital platform for Internet advertising. The costs related to the production of these ‘free’ digital services are usually not specified in the firm’s annual reports nor are they attributed to the ‘research and development’, ‘sales and marketing’ or ‘platform maintenance’ activities of the firm’s entities.149 Google may, and likely does, shift these costs to its money-side customers (customers of Internet advertising services) by increasing of prices of its money-side services. However, for accounting purposes the costs incurred by the firm are considered as the firm’s own costs even if they were later shifted to third parties.
5.1.3 Distribution centres
The current international corporate tax system fails to dis-incentivise tax-driven creation of distribution centres. As a result, income (or losses) and associated costs are divided unevenly between entities of a multinational platform firm that perform the same technical functions.
A data centre usually coordinates the entire technological process of supply of digital services to customers in a particular region or country. Therefore, digital services supplied to customers through or under the control of this data centre could be seen as originating from a state where the data centre is located. If a firm has multiple data centres it would be logical to assume that under the functional analysis of transfer
146 The supply of services electronically is different from the delivery of the results of services by electronic means (eg, when a document such as an engineering plan is digitised and sent over the Internet). The difference in production process is important for identification of the place of origin of a service for trade and tax purposes: see, for instance, Trans-Pacific Partnership Agreement (draft, Atlanta, 5 October 2015) art 14.2. 147 For an overview of the structure of Google’s business in New Zealand, see Victoria Plekhanova, ‘Taxation of Global Digital Matchmakers: A Tentative Step Forward?’ (2018) 24(1) New Zealand Business Law Quarterly 69, 71-72. 148 The method contains the cost and mark-up elements. The mark-up is measured by reference to margins computed after all costs incurred by a supplier in a transaction. See OECD, Transfer Pricing Guidelines, above n 103, 26 and 111-115. For an example of economic presence of Google in New Zealand, see Plekhanova, above n 147, 79. 149 Ibid.
eJournal of Tax Research Value creation within multinational platform firms
304
pricing the entities that operate these data centres should be seen as ‘suppliers’ of digital services of the firm.
However, Google legitimately supplies Internet advertising in Europe, the Middle East, Africa, Asia and the Pacific through its two foreign subsidiaries Google Ireland Ltd and Google Asia Pte Ltd. Google Ireland Ltd operates the firm’s data centre in Ireland; Google Asia Pte Ltd operates the firm’s data centre in Singapore. Ireland and Singapore are not only low tax jurisdictions but also have some specific rules in their national laws which allowed Google to reduce the total size of its overall corporate income tax burden.150
Google has other data centres outside the United States, including ones in the Netherlands, Finland and Belgium (the EMEA region) and in Taiwan (the APAC region).151 However, none of these data centres acts as a financial and distribution centre for Google.152
The fact that Google has many subsidiaries that operate data centres but treats only two of these subsidiaries as suppliers of the firm’s digital services outside the United States, and that both subsidiaries are located in low tax jurisdictions, suggests that the choice of distribution centres and their location are, to a great extent, tax-driven.
The example of Google demonstrates that the current international corporate tax system fails to ensure equal treatment of all of the subsidiaries of a multinational platform firm that perform similar technical functions. This is because this system relies on national transfer pricing rules that are applied on a state-by-state basis and premised on the separate entity approach.
5.1.4 Customers participation in a value creation process
The current international corporate tax system was designed with the view that only the entities of a firm, and the resources they have, are involved in the value creation process of the firm. However, the example of Google demonstrates that in platform firms significant resources come from customers. With the lack of rules related to the use of these resources by a platform firm, these resources are often treated by Google, for tax purposes, as having no value or adding no value, or both. All synergy benefits created with the use of these resources are seen as something that naturally ‘belongs’ to the firm.
150 For instance, even after Ireland’s amendment of its Taxes Consolidation Act 1997 in 2014, the Irish subsidiary of Google Ireland Holdings can be treated as a Bermudian tax resident until 31 December 2020. As a result, Google was able to use the ‘Double Irish’ scheme to shift its profits from high tax jurisdictions to Bermuda. See Ireland, Taxes Consolidation Act 1997 s 23A (as amended by Finance Act 2014 No. 37 of 23 December 2014, s 43(1)). See also Jesse Drucker, ‘Double Irish’s Slow Death Leaves Google Executives Calm’, The Bloomberg (15 October 2014), http://www.bloomberg.com/news/articles/2014-10-14/double-irish-s-slow-death-leaves-google-executives-calm (accessed 22 January 2020). On 31 December 2019 a Google spokesman confirmed that it would scrap the licensing structure that Google used in the ‘Double Irish’ scheme. See Toby Sterling, ‘Google to End “Double Irish, Dutch sandwich” Tax Scheme’, Reuters (1 January 2020). https://www.reuters.com/article/us-google-taxes-netherlands/google-to-end-double-irish-dutch-sandwich-tax-scheme-idUSKBN1YZ10Z (accessed 31 January 2020). 151 Google data centres, https://www.google.com/about/datacenters/locations/ (accessed 31 January 2020). 152 Jeremy Kahn, ‘Google’s ‘Dutch Sandwich’ Shielded 16 Billion Euros from Tax’, The Bloomberg (3 January 2018), https://www.bloomberg.com/news/articles/2018-01-02/google-s-dutch-sandwich-shielded-16-billion-euros-from-tax (accessed 22 January 2020).
eJournal of Tax Research Value creation within multinational platform firms
305
Internet users do not charge Google for the use of their personal data, the provision of web content or web interaction, which improves and, in a sense, drives the operation of the firm’s web platforms. Sometimes Google itself defines a price that the firm will pay for some resources obtained from Internet users. In particular, when videos uploaded onto the YouTube web platform that attract a significant number of viewers, Google considers these videos as valuable resources and pays for them. According to Google, the price paid for the resource obtained from its owner is a share of the advertising revenues earned from the web page where the resource (generally a video) was placed. Less popular videos, other web content and web interaction resources are not seen by Google as valuable for the purposes of revenue sharing and taxation. In most cases, Google bears no costs for the acquisition of these resources, or any cost is difficult to associate with a particular resource because the resource was acquired through exchanges within the multisided market. There are also significant supply-side economies of scale. The marginal costs of adding yet another YouTube video is therefore next to zero.
It is also difficult to evaluate resources provided by customers of a platform firm and to measure value added by these resources. First, the measurement is complicated because resources provided by the firm’s customers often add value only when used in conjunction with other resources (eg, personal data may have no value until it is analysed or associated with an individual or considered with data from other individuals). The value added by each resource that was used in conjunction with other resources may not be possible to define. For instance, Google combines pieces of ‘raw’ personal data obtained from Internet users with ‘new’ data produced by Google itself as a result of consolidation and analysis of the raw data. The firm uses this integrated resource but not the personal data itself (which is only a part of this resource) for production of Internet advertising services. However, there is currently no methodology in accounting or taxation that would allow the identification of the value added by raw data or the value added by new data.
Second, some resources provided by the firm’s customers add value to a final product indirectly, by making improvements to the process of production of this product. For instance, every search conducted on the Google search web platform improves the operation of the search algorithm of this platform. There is no methodology in accounting or taxation for the measurement of the value added in this case.
Finally, customers of Google not only provide resources to the firm but also contribute to demand-side economies. As explained in section 3.3.2, demand-side economies are the product of network effects. Again, there is no methodology in accounting or taxation for the measurement of both the value added by network effects and contributions the firm and its customers make to these effects.
The current international corporate tax system was intended to allocate the rights to tax business profits to a state where the economic activity that generates value is located. The lack of rules related to the use of resources provided by the customers of a platform firm makes it impossible, under the current international tax system, to allocate the profits of platform firms to states where the firm’s customers make their contributions to the value creation process of the firm.
Apart from transactional profit split method, the separate entity approach embraced in the OECD’s Transfer Pricing Guidelines provides no guidance as to how to allocate customer synergy rent. There is no suggestion in the OECD’s Guidance on the
eJournal of Tax Research Value creation within multinational platform firms
306
Transactional Profit Split Method153 that the transactional profit split method can be used to split the profits related to customers’ contributions to value created within a platform firm. Synergy rent is generated from inputs of the firm’s customers and entities of a firm.154 Customers are not entities of the firm and, therefore, are not participants in ‘controlled transactions’. Consequently, the transfer pricing rules do apply to customers in any event. Moreover, it follows from the considerations discussed in section 3.3 that customers often contribute to value creation at the whole-of-firm level rather than at the level of a particular entity of the firm.
Without specific guidance in relation to the allocation of the customer synergy rent (and nexus rules that would attribute a portion of this rent to the customer jurisdiction) the entire amount of this rent is likely to remain at the level of a parent company of the firm and, therefore, is allocated to the state where the company is incorporated. In the case of Google, this is the United States.
The issue of customers’ participation in a value creation process of a platform firm and its recognition for income tax purposes remains highly controversial. The debates revolve around participation of a particular type of customers, namely – ‘Internet users’ or ‘users’.155 As at March 2018 there was no consensus among states on whether, and the extent to which, user participation should be considered as contributing to a value creation of platform firms.156 User participation is related to individual inputs of the customers of platform firms. There has been no discussion about the international allocation of customer synergy rents from network effects. Therefore, the issue of customer synergy rents and their allocation under the current international corporate tax system (as well as an appropriateness of this system for this purpose) remains a challenge.
The international allocation of customer synergy rent has not been explicitly addressed in the BEPS documentation. Nevertheless, this rent (or its portion) can be allocated under so-called ‘pillar one’ proposals discussed in the OECD’s Public Consultation Document on the tax challenges of the digitalisation of the economy issued on 19 February 2019.157 In essence, these proposals suggest changes be made to nexus rules and profit allocation rules. The changes to the nexus rules will provide a solution to the virtual presence problem to be discussed later in this article.158 Changes to the profit allocation rules may result in the allocation of some customer synergy rent to the
153 OECD, Revised Guidance on the Application of the Transactional Profit Split Method, above n 125. 154 See section 3.3 of this article. 155 An argument about user participation in the value creation process was first made by France in 2013. See France, Ministry of Finance, Rapport sur la fiscalité du secteur numérique (18 January 2013) (the ‘Colin and Collin Report’), http://www.redressement-productif.gouv.fr/files/rapport-fiscalite-du-numerique_ 2013.pdf. See also France Stratégie, Taxation and the Digital Economy: A Survey of Theoretical Models, above n 101. This argument was further elaborated by the United Kingdom in 2018. See HM Treasury, Corporate Tax and the Digital Economy: Position Paper Update (13 March 2018). See also OECD, Tax Challenges Arising from Digitalisation – Interim Report 2018, above n 6, [390]; Australian Treasury, The Digital Economy and Australia’s Corporate Tax System, above n 14, 18. 156 OECD, Tax Challenges Arising from Digitalisation – Interim Report 2018, above n 6, 171, para 387. 157 OECD, Addressing the Tax Challenges of the Digitalisation of the Economy: Public Consultation Document, 13 February – 6 March 2019, OECD/G20 Base Erosion and Profit Shifting Project (OECD Publishing, 13 February 2019). 158 See section 5.2.2 of this article.
eJournal of Tax Research Value creation within multinational platform firms
307
customer jurisdiction under either a modified residual profit split method159 or a fractional apportionment method.160 All of the proposals discussed in the OECD’s Public Consultation Document deal with total rather than routine profits of multinational firms that have no physical presence in the source state.161 The OECD intends to use this new approach to the international allocation of profits in its efforts to develop a consensus-based solution.162
In attempt to find a compromise solution, the OECD has developed a so-called ‘Unified Approach under Pillar One’,163 which combines elements of earlier discussed proposals164 with the so-called ‘Johnson and Johnson’s’ proposal which defines a baseline profit in the market jurisdiction.165 Under the unified approach, routine and some residual profits will be allocated through a combination of transfer-pricing rules, formulary apportionment and a distribution-based approach.166 The routine profits will be allocated under transfer pricing rules. The difference between total group profits and the sum of its routine profits will constitute ‘deemed residual profits’ (‘Amount A’). A portion of Amount A will be apportioned under the sales-based formula,167 plus market countries will be allocated a ‘fixed remuneration for baseline marketing and distribution functions that take place in the market jurisdiction’ (‘Amount B’) and a compensation amount ‘where in-country functions exceed the baseline activity compensated under Amount B’ (‘Amount C’).168
The prospect of international support of the unified approach proposal is obscure because of this proposal’s overcomplexity, and an opposition of the United States.169
159 OECD, Programme of Work to Develop a Consensus Solution to the Tax Challenges Arising from the Digitalisation of the Economy, OECD/G20 Inclusive Framework on BEPS (OECD Publishing, 31 May 2019) 12-14, paras 28-29. 160 Ibid 14-15, paras 30-31. 161 See OECD, Addressing the Tax Challenges of the Digitalisation of the Economy, Public Consultation Document, above n 157, 10-11, paras 23-25, 14-15, paras 43-45, 16, paras 52-53. 162 OECD, Programme of Work, above n 159, 11, paras 23-24. 163 OECD, Secretariat Proposal for a ‘Unified Approach’ under Pillar One: Public Consultation Document, 9 October – 12 November 2019, OECD/G20 Base Erosion and Profit Shifting Project (OECD Publishing, 9 October 2019). 164 See OECD, Addressing the Tax Challenges of the Digitalisation of the Economy, Public Consultation Document, above n 157. 165 For more detail see Alexander Hartley, ‘Exclusive: Johnson & Johnson's Katherine Amos discusses her BEPS 2.0 proposal’, International Tax Review (23 April 2019), https://www.internationaltaxreview.com/article/b1fq9gdpl6lnl4/exclusive-johnson-amp-johnson39s-katherine-amos-discusses-her-beps-20-proposal (accessed 1 February 2020). 166 OECD, Secretariat Proposal for a ‘Unified Approach’ under Pillar One, above n 163, 8-9, paras 24-30 and Appendix A. 167 Ibid 9, para 30. 168 Ibid. For a recently amended version of the Unified Approach under Pillar One see the OECD, Statement by the OECD/G20 Inclusive Framework on BEPS on the Two-Pillar Approach to Address the Tax Challenges Arising from the Digitalisation of the Economy, OECD/G20 Base Erosion and Profit Shifting Project (OECD Publishing, 29-30 January 2020). 169 See also Julie Martin, ‘Paris Consultation Reveals Little Unity on OECD’s “Unified Approach” for Taxing Multinational Groups, MNE Tax (26 November 2019), https://mnetax.com/paris-consultation-reveals-little-unity-on-oecds-unified-approach-for-taxing-multinational-digital-and-tech-companies-36730 (accessed 1 February 2020). See also the exchange of views between the Secretary of the Treasury United States Mr Steven Mnuchin and the OECD’s Secretary-General Mr Jose Angel Gurrıa about the international allocation of business profits in the digitalised economy, which took place in December 2019: https://home.kpmg/content/dam/kpmg/us/pdf/2019/12/treasury-letter-oecd-digital-services-tax.pdf and
eJournal of Tax Research Value creation within multinational platform firms
308
The European Parliament has declared its commitment to propose an EU solution,170 should an international deal not be reached by the end of 2020.171
5.2 Problems of place
The problems of place embrace a number of difficulties with the identification of the geographical location of the place where economic value is created. The current international corporate tax system seeks not only to associate this place with a specific geographic territory, but also assumes that all relevant geographic territories are associated with states 172. Moreover, the current international corporate tax system was designed when the general assumption was that a final product is produced in a single place and the use of each resource that adds value to production of this product also occurs in a single place. In relation to the production of digital services, the production of those services ‘in a single state’ means the technical infrastructure (web servers, software, data centres, telecommunication infrastructure, etc.) located in a single state and inputs (human and non-human) made in the same state were used to produce the services.
It follows from the issues discussed in section 3 of this article that, when it comes to multinational platform firms, at least three practical problems related to identifying the place of economic value creation may arise because of a non-territorial nature of a value creation process; virtual presence in an economic life of a market state; and the ‘statelessness’ of income.
5.2.1 Non-territorial nature of a value creation process
From a tax perspective, value may be seen as being ‘added’ in the production of a product (or to the value pie of a firm) simultaneously in the territories of many states. First, value may be added simultaneously in multiple states because of the business structure of a firm, such as when the entities of a multinational platform firm and the firm’s customers are located in many states and participate in a single value creation process. Such a process may incorporate multiple transactions. However, as explained in section 3.3.1, in a platform firm a value creation process may be economically indivisible because of a multi-sided structure of the firm’s business. When the firm is a multinational, this indivisible process may span the territories of many states.
Second, economies of scale available to a firm are greater for firms operating in a globally integrated economic environment. As set out in section 3.3.2 economies affect the size of the value pie of a platform firm. Therefore, the economic environment matters for both the size of economies and the value pie. When the economic
http://www.oecd.org/tax/Letter-from-OECD-Secretary-General-Angel-Gurria-for-the-attention-of-The-Honorable-Steven-T-Mnuchin-Secretary-of-the-Treasury-United-States.pdf (accessed 1 February 2020). 170 EU Parliament, Parliament Keeps up Pressure to Tax Digital Economy More Fairly: Press Release (18 December 2019), https://www.europarl.europa.eu/news/en/press-room/20191212IPR68924/parliament-keeps-up-pressure-to-tax-digital-economy-more-fairly (accessed 1 February 2020). 171 For a brief overview of the current situation see Rasmus Corlin Christensen and Martin Hearson, ‘The Future of Global Corporate Taxation Is More Uncertain Than Ever’, Roosevelt Institute Blog (10 December 2019), https://rooseveltinstitute.org/the-future-of-global-corporate-taxation-is-more-uncertain-than-ever/ (accessed 1 February 2020). 172 A ‘state’ in this context means an autonomous tax jurisdiction whether or not it is recognised as a nation state.
eJournal of Tax Research Value creation within multinational platform firms
309
environment extends beyond national borders of a single state, a value adding effect of the economies occurs in many states.
Both situations are present in the activities of multinational platform firms. The value creation process of these firms is, therefore, non-territorial in the traditional international taxation sense where territory means the territory of a single state. If a value creation process is non-territorial, items of business profits cannot logically be attributed to a single permanent establishment or allocated to a single entity within a firm under the current international corporate tax system, even though they are so allocated as a matter of tax law. Problems with laws designed for a territorial system of
173nation states being applied to new technology are evident in many areas. In the international tax field, the problem of the ‘non-territoriality’ of a value creation process can be eased (if not solved) through the development of a new standalone nexus rule which would link business profits directly to a source state. The ‘user participation’ proposal developed by the United Kingdom174 and discussed in the OECD’s Public Consultation document175 contains this type of rule. The OECD has considered a possibility of the development of a standalone nexus rule, as an alternative to amendments to the permanent establishment concept, during its work on a consensus-based solution.176
5.2.2 Virtual presence
A platform firm can provide its digital services to customers worldwide without being present in a state where these customers are located (the ‘market state’) in the way which
177is required by the model permanent establishment concept, and national statutory and treaty rules based on this concept. In this case the virtual presence of the platform firm in the economic life of the market state cannot create a nexus with this state for income tax purposes.
The model permanent establishment concept is based on a physical presence standard. This standard is at odds with the structure of many economic activities in the digitalised economy. The storage of digital services in the market state, as an economic activity separate from production and distribution of those services, is often impossible. Multinational platform firms do not have data centres in most states where they operate.
173 For instance, the non-territorial nature of data stored in ‘the cloud’ composed of server farms located in many states was not recognised by the Court in the case Microsoft Corp v United States, 829 F 3d 197 (2d Cir 2016), vacated and remanded, United States v Microsoft Corp 584 US _ (2018). See Case note, ‘Microsoft Corp v United States 2d Cir 2016’ (2016) 130(2) Harvard Law Review 769. See also Andrew Keane Woods, ‘Litigating Data Sovereignty’ (2018) 128(2) Yale Law Journal 328. In similar cases against Google (No. 16-960-M-01 and No. 16-1061-M) the District Court of Pennsylvania did not comment on the non-territorial nature of data stored in ‘the cloud’. The Court ruled that copying of this data to web servers located in the United States under the FBI warrants will not be a ‘seizure of private information occurred abroad’. See Orin Kerr, ‘Google Must Turn Over Foreign-stored Emails Pursuant to a Warrant, Court Rules’, The Washington Post (4 February 2017), https://www.washingtonpost.com/news/volokh-conspiracy/wp/2017/02/03/google-must-turn-over-foreign-stored-e-mails-pursuant-to-a-warrant-court-rules/ (accessed 22 January 2020). 174 HM Treasury, Corporate Tax and the Digital Economy, Position Paper (November 2017); HM Treasury, Corporate Tax and the Digital Economy, Position Paper Update, above n 155. 175 OECD, Addressing the Tax Challenges of the Digitalisation of the Economy, Public Consultation Document, above n 157, 9–11 [2.2.1]. 176 OECD, Programme of Work, above n 159, 18, para 40. 177 OECD, Model Tax Convention on Income and on Capital, above n 107, art 5; UN, Model Double Taxation Convention between Developed and Developing Countries, above n 107, art 5.
eJournal of Tax Research Value creation within multinational platform firms
310
Virtually all of the contracts with customers in the market states are concluded online over websites, where forms can be submitted and online payments made. Virtually all of these websites are usually located on web servers outside the market state’s territory. Furthermore, contracts with customers in the market state are usually formally concluded by subsidiaries of multinational platform firms incorporated in a low or no tax jurisdiction. Therefore, it is almost impossible to make the case that, under tax legislation of most market states, multinational platform firms are subject to substantial (or any) corporate income tax in the market state.
The improvement of the permanent establishment concept was one of the set of ‘actions’ that were an outcome of the OECD’s BEPS project.178 This action, however, has focused on tax avoidance strategies of multinational firms and has not targeted the virtual presence of ‘highly digitalised businesses’179 in the economic life of many states. The OECD has referred to the inability of states to tax income from this virtual presence as a ‘problem with nexus’, which is part of the ‘broader tax challenge’ rather than ‘tax avoidance’.180 Some potential solutions to the nexus problem have been discussed in the framework of the BEPS project.181 However, comprehensive recommendations for a coordinated response to the nexus problem are yet to be made.182 Solutions to this problem can be sought through the development of a new nexus or a stand-alone withholding tax.
(i) New nexus
The G20 and the OECD expected that many of the broader tax challenges in the digitalised economy, including the problem with nexus, could be mitigated through modifications to the exceptions from permanent establishment status183 under the Multilateral Convention to Implement Tax Treaty Related Measures to Prevent Base Erosion and Profit Shifting (MLI).184 Paragraph 1 of Article 12 of the MLI gave effect to the recommendation of the final BEPS report to amend paragraph 5 of Article 5 of
178 See OECD, Action 7 – 2015 Final Report: Preventing the Artificial Avoidance of Permanent Establishment Status (OECD Publishing, 2015). 179 ‘Highly digitalised businesses’ is a broad concept that applies when business has some of the following characteristics: cross-jurisdictional scale without mass; the heavy reliance on intangible assets, especially intellectual property (IP); and the importance of data, user participation and their synergies with IP. For more detail see OECD, Tax Challenges Arising from Digitalisation – Interim Report 2018, above n 6, 24-25, paras 32-35. These businesses may be large and grow quickly in terms of revenue, market share and influence but not by traditional measures of mass (employees, capital equipment or buildings). See OECD, ‘Vectors of Digital Transformation’ (OECD Digital Economy Papers No. 273, January 2019) 12. 180 OECD, Action 1 – 2015 Final Report: Addressing the Tax Challenges of the Digital Economy, above n 4, 146-147, paras 376-380. 181 These options include a new permanent establishment nexus based on the concept of significant economic presence, a withholding tax on certain types of digital transactions, and an ‘equalisation levy’ on digitals services: see ibid 107-113, paras 277-292 and 115, para 302. 182 The final report on the implications of digitalisation for taxation is due in 2020: see ibid 13. 183 Ibid 148, para 383 and 144-146, paras 368-375. 184 Multilateral Convention to Implement Tax Treaty Related Measures to Prevent Base Erosion and Profit Shifting, signed 7 June 2017 (entered into force 1 July 2018). Sixty-eight jurisdictions initially signed this convention, and by 19 December 2019 it had been signed by 93 jurisdictions: OECD, Signatories and Parties to the Multilateral Convention to Implement Tax Treaty Related Measures to Prevent Base Erosion and Profit Shifting, status as of 19 December 2019, http://www.oecd.org/tax/treaties/beps-mli-signatories-and-parties.pdf.
eJournal of Tax Research Value creation within multinational platform firms
311
the OECD Model Tax Convention.185 The rule extends the meaning of a dependent agent permanent establishment by providing that such a permanent establishment would arise when a person:
[…] is acting in a Contracting State on behalf of an enterprise and has, and, in doing so, habitually concludes contracts, or habitually plays the principal role leading to the conclusion of contracts186 that are routinely concluded without material modification by the enterprise […].187
Significantly, the OECD has not recommended replacement of the physical presence standard of the permanent establishment concept with the obvious alternative – the economic presence standard.188 Moreover, the MLI itself turned out to be an instrument with a very limited scope because many of the states that signed the MLI have elected not to apply its Article 12 to their own double tax agreements. If contracts are concluded via an online automation process, no permanent establishment arises in the source state. The same result occurs if contracts are signed in states that have refused to sign the MLI or elected not to apply its Article 12 to their own double tax agreements. Among these states are Ireland189 and Singapore190 – states where mega-regional distributional centres of Google (and subsidiaries of many other multinational platform firms and other highly digitalised businesses) are located.
Many states did not accept that either the OECD recommendations made in its Final Report of 5 October 2015191 or the Interim Report on Digitalisation of 16 March 2018192 were sufficient to solve the tax challenges of digitalisation they faced.193 Many of these states have started seeking unilateral solutions to these challenges.194 These solutions
185 OECD, Action 1 – 2015 Final Report: Addressing the Tax Challenges of the Digital Economy, above n 4, 148, para 383 and 144-146, paras 368-375. 186 ‘The phrase “or habitually plays the principal role leading to the conclusion of contracts […]” is aimed at situations where the conclusion of a contract directly results from the actions that the person performs in a Contracting State on behalf of the enterprise even though, under the relevant law, the contract is not concluded by that person in that State’: See OECD, Action 7 – 2015 Final Report: Preventing the Artificial Avoidance of Permanent Establishment Status, above n 169, 18-19 on from the proposed amendment to paragraph 32 (ie, subparagraph 32.5); OECD, Commentaries on the Articles of the Model Tax Convention in OECD, Model Tax Convention on Income and on Capital, above n 107. 187 See OECD, Action 7 – 2015 Final Report: Preventing the Artificial Avoidance of Permanent Establishment Status, above n 178, 16, para 9. 188 OECD, Action 1 – 2015 Final Report: Addressing the Tax Challenges of the Digital Economy, above n 4, 107-113, paras 277-291. 189 Department of Finance, Ireland, Status of List of Reservations and Notifications at the Time of Signature of the MLI, http://www.oecd.org/tax/treaties/beps-mli-position-ireland.pdf (accessed 1 February 2020). List of Reservations and Notifications upon Deposit of the Instrument of Ratification of the MLI, http://www.oecd.org/tax/treaties/beps-mli-position-ireland-instrument-deposit.pdf (accessed 1 February 2020). 190 Singapore, Status of List of Reservations and Notifications at the Time of Signature of the MLI, http://www.oecd.org/tax/treaties/beps-mli-position-singapore.pdf (accessed 1 February 2020). List of Reservations and Notifications upon Deposit of the Instrument of Ratification of the MLI, http://www.oecd.org/tax/treaties/beps-mli-position-singapore-instrument-deposit.pdf (accessed 1 February 2020). 191 OECD, Action 1 – 2015 Final Report: Addressing the Tax Challenges of the Digital Economy, above n 4. 192 OECD, Tax Challenges Arising from Digitalisation – Interim Report 2018, above n 6. 193 Ibid 18-19, para 18, 24-26, paras 33-43, 51, para 132, 91-93, paras 262-267, 100, para 283 and 107, para 309. 194 For some examples of these unilateral responses see ibid, ch 4.
eJournal of Tax Research Value creation within multinational platform firms
312
generally range from developing a new permanent establishment nexus,195 imposing new withholding taxes,196 levying an excise tax on turnover from sales of some digital services or the ‘Digital Services Tax’,197 or enacting anti-BEPS legislation that forces large multinationals to attribute more income to their subsidiaries and permanent establishments in source states.198
The worldwide wave of unilateral responses has facilitated the search for a consensus-based solution by the members of the Inclusive Framework on BEPS – the global forum of 137 tax jurisdictions working together under the aegis of the OECD and the G20 on solutions to the cross-border tax base erosion problem.199 Since January 2019 the OECD has issued several documents that coordinate the search for a consensus-based solution.200 As a result of this work three proposals for changes to the nexus rules and the attribution rules have to date been outlined and analysed. These proposals include the ‘user participation’ proposal’, the ‘marketing intangible’ proposal, and a ‘significant
195 For instance, if a foreign supplier is not based in a country with which Israel has a double tax agreement but has ‘significant digital presence’ in Israel this supplier should pay tax in Israel on profits from significant digital presence. Suppliers based in a country with which Israel has a double tax agreement must not only have a significant digital presence in Israel, but must also conduct activity on the ground in Israel. See Israel Tax Authority, ‘Online Activities of Foreign Corporations in Israel’ (Circular No. 4/2016, 11 April 2016) (in Hebrew) https://taxes.gov.il/incometax/documents/hozrim/hoz_kalkala_2016.pdf (accessed 1 February 2020). See also OECD, Tax Challenges Arising from Digitalisation – Interim Report 2018, above n 6, 137. Another example is that a ‘business connection in India’ is a tax nexus with profits of foreign suppliers of digital services in India. This nexus is subject to India’s existing DTAs. See Finance Bill 2018 (India), ch III, cl 4 (Amendment of Section 9(1) of the Income Tax Act of 1961), 6-7, https://www.incometaxindia.gov.in/budgets%20and%20bills/2018/finance-bill-2018.pdf (accessed 1 February 2020). The amendment took effect from 1 April 2019. See Memorandum to Finance Bill 2018: Provisions Relating to Direct Taxes, 8-9, https://www.incometaxindia.gov.in/budgets%20and%20bills/2018/memo-2018.pdf (accessed 1 February 2020). See also OECD, Tax Challenges Arising from Digitalisation – Interim Report 2018, above n 6, 138. 196 Government of Turkey, Presidential Decree No. 476 (Official Gazette, 19 December 2018). See also EY, ‘Turkey Issues Guidance Regarding Withholding Taxes Imposed on Online Advertising Services’, Global Tax Alert (18 February 2019), https://www.ey.com/Publication/vwLUAssets/Turkey_issues_guidance_regarding_withholding_taxes_imposed_on_online_advertising_services/$FILE/2019G_000456-19Gbl_Turkey%20-%20WHT%20taxes%20on%20online%20advertising%20services.pdf (accessed 1 February 2020). 197 For more detail see section 6 of this article. 198 For instance, the UK’s Diverted Profits Tax (DPT) has applied since 1 April 2015. See Finance Act 2015 (UK) and HM Revenue and Customs, Diverted Profits Tax, Guidance (30 November 2015). See also the Australian Multinational Anti-Avoidance Law (MAAL) and the DPT. The MAAL came into effect on 11 December 2015. It applies to certain schemes in place on or after 1 January 2016, irrespective of when the scheme commenced. See Tax Laws Amendment (Combating Multinational Tax Avoidance) Act 2015 (Cth). See also Treasury Laws Amendment (Combating Multinational Tax Avoidance) Act 2017 (Cth) and Diverted Profits Tax Act 2017 (Cth). For a summary of Australia’s anti-BEPS actions see Australian Treasury, The Digital Economy and Australia’s Corporate Tax System, above n 14, 10-11. For an example of New Zealand anti-BEPS legislation see Taxation (Neutralising Base Erosion and Profit Shifting) Act 2018 (NZ). 199 OECD, ‘Members of the OECD/G20 Inclusive Framework on BEPS’ (December 2019), https://www.oecd.org/ctp/beps/inclusive-framework-on-beps-composition.pdf, (accessed 1 February 2020). 200 OECD, Addressing the Tax Challenges of the Digitalisation of the Economy, Policy Note (as approved by the Inclusive Framework on BEPS on 23 January 2019); OECD, Addressing the Tax Challenges of the Digitalisation of the Economy, Public Consultation Document, above n 157; OECD, ‘Tax and Digitalisation’, Policy Brief (March 2019); OECD, Programme of Work, above n 159.
eJournal of Tax Research Value creation within multinational platform firms
313
economic presence’ proposal.201 The nexus in each of these proposals is not based on physical presence.202 The OECD has decided to work on ‘the design of a new nexus rule that would capture a novel concept of business presence in a market jurisdiction, not constrained by physical presence requirement’.203 This new rule will either be incorporated in the permanent establishment concept or take the form of a standalone rule ‘establishing a new and separate nexus, either through a new taxable presence or a concept of source’.204
(ii) Standalone withholding tax
A standalone gross-basis final withholding tax is an alternative solution to changes of the nexus rules that could increase the income tax base in the source state.205 This tax can be used in three distinct ways. First, a source state can extend its definition of royalties to cover business profits from the supply of some services.206 Second, definition of royalties can cover foreign-to-foreign related-party payments connected to local sales.207 Third, a source state could levy a standalone gross-basis final withholding tax on fees for technical services (or services in general).208
In principle, levying a standalone gross-basis final withholding tax on services of highly digitalised businesses makes economic sense because these businesses often have low marginal costs, which makes gross income a reliable proxy for net income in many circumstances.209 This tax also can simplify the collection of tax revenue from business-to-business activities of non-resident suppliers.210
Use of a standalone gross-basis final withholding tax has, however, many limitations. First, this tax is a type of income tax and, therefore, is subject to withholding tax obligations and non-discrimination obligations211 that can be imposed by a double tax agreement on its participants. Second, this tax cannot be applied to interest and royalty payments made between associated companies of states that are members of the
201 See OECD, Addressing the Tax Challenges of the Digitalisation of the Economy, Public Consultation Document, above n 157, ch 2. 202 Ibid 9-12, paras 18-20 and 30-32, and 16, para 51. 203 OECD, Programme of Work, above n 159, 11, para 24. 204 Ibid 18, para 40. 205 See discussion about a withholding tax on digital transactions in OECD, Action 1 – 2015 Final Report: Addressing the Tax Challenges of the Digital Economy, above n 4, 113-115, paras 292-301. 206 See examples in OECD, Tax Challenges Arising from Digitalisation – Interim Report 2018, above n 6, 139-140, para 357. See also Finance Act 2017 (No. 785) (Malaysia). 207 See Finance Act 2019 (UK), Sch 3. See also HM Revenue and Customs and HM Treasury, ‘Offshore Receipts in Respect of Intangible Property (previously Royalties Withholding Tax). Summary of Responses’ (29 October 2018) 6, 18-19. 208 See Commentary to Article 12A in UN, Model Double Taxation Convention between Developed and Developing Countries, above n 107. In the context of the UN Model Double Taxation Convention technical services covered by Article 12A are those that include the application by the service provider of specialised knowledge, skill, or expertise on behalf of a client or the transfer of knowledge, skill, or expertise to the client, other than a transfer of information covered by the royalties definition in Article 12. 209 OECD, Action 1 – 2015 Final Report: Addressing the Tax Challenges of the Digital Economy, above n 4, 114-115, para 298. 210 Ibid 114, paras 295-296. 211 A non-discrimination provision of DTAs generally requires equal tax treatment for residents and non-residents. See OECD, Model Tax Convention on Income and on Capital, above n 107, art 24; UN, Model Double Taxation Convention between Developed and Developing Countries, above n 107, art 24.
eJournal of Tax Research Value creation within multinational platform firms
314
European Union.212 European Union law also imposes comparable obligations on some of its members. These obligations require non-discrimination between resident and non-resident businesses, which can make it impossible to levy a standalone gross-basis final withholding tax on non-resident suppliers.213 Third, a standalone gross-basis final withholding tax, if levied only on income derived by non-residents, can potentially violate national treatment provisions of trade agreements of member states,214 unless withholding taxes are exempt under Article XX of the General Agreement on Tariffs and Trade (GATT). Fourth, a non-resident supplier of goods or services can pass the burden of a standalone gross-basis final withholding tax on to its customers by ‘grossing up’ royalty payments or service fees. Suppliers with market power are not constrained by competition and, therefore, will not miss this opportunity. Finally, any withholding tax creates considerable administrative difficulties and increases administration and compliance costs when applied to business-to-customer activities.215 These difficulties mean that a standalone gross-basis final withholding tax has been found not to be a viable option for a consensus-based international solution to the virtual presence problem.216
5.2.3 ‘Statelessness’ of income
A problem known as ‘stateless income’ occurs when it is not possible to associate the place where a final product was produced, or where value to this product was added, with a territory of any state. The OECD suggests that income may become stateless when a multinational firm designs its tax arrangements around limitations imposed on the taxing rights of source states by double tax agreements or other international or national laws.217 In practice, to become truly stateless, income should also not be subject to tax in the taxpayer’s state of residence. Sometimes the combination of technological development and the international law principle of territoriality218 can also make business income stateless. There are extraterritorial zones free of the sovereign rights of any particular state.219 Hypothetically, if one day the United States (the home country
212 European Council, Council Directive 2003/49/EC on a Common System of Taxation Applicable to Interest and Royalty Payments Made between Associated Companies of Different Member States [2003] OJL 157, art 1(1): ‘Interest or royalty payments arising in a Member State shall be exempt from any taxes imposed on those payments in that State, whether by deduction at source or by assessment, provided that the beneficial owner of the interest or royalties is a company of another Member State or a permanent establishment situated in another Member State of a company of a Member State’. 213 OECD, Action 1 – 2015 Final Report: Addressing the Tax Challenges of the Digital Economy, above n 4, 115 [300]. 214 See, for instance, the General Agreement on Tariffs and Trade (GATT) Article III (national treatment on internal taxation and regulation) and the General Agreement on Trade in Services (GATS) Article XVII (national treatment). Unlike the GATT which provides no exceptions to national treatment obligations, the GATS contains broad exceptions related to DTAs and provisions aimed at ensuring the equitable or effective imposition of direct taxes. 215 OECD, Action 1 – 2015 Final Report: Addressing the Tax Challenges of the Digital Economy, above n 4, 114, paras 295-297. 216 Ibid 115, para 301. 217 Ibid 12, 82, 84 and 146. For discussion on stateless income see Edward D Kleinbard, ‘Stateless Income and its Remedies’ in Thomas Pogge and Krishen Mehta (eds), Global Tax Fairness (Oxford University Press, 2016) 129. 218 A worldwide system of taxation is premised on the international law principle of nationality expressed through the residence principle of taxation. A territorial system of taxation is premised on the international law principle of territoriality expressed through the source principle of taxation. See Reuven S Avi-Yonah, Advanced Introduction to International Tax Law (Edward Elgar Publishing, 2015) 8-11. 219 For instance, res communis are not subject of jurisdiction of a particular state. The res communis include high seas, together with exclusive economic zones, and outer space. See Malcolm N Shaw, International
eJournal of Tax Research Value creation within multinational platform firms
315
for Google) were to move entirely from a worldwide system of corporate income taxation to a system of territorial taxation,220 the use of technology developed by Google would allow Google to keep its web server farms and personnel in extraterritorial zones and thereby legally avoid taxation of corporate income originating from these zones. The example is rather futuristic, but not beyond the realms of possibility:
[t]he U.S. Patent and Trademark Office granted Google’s patent on a water-based data center on April 28, 2009. The data center would be made up of servers inside containers like those normally used for the carriage of goods by sea or rail. Cranes would place these containers on ships or barges. The containers would be linked together to form large data centers that would be located at sea wherever necessary. Ocean waves, tides, or currents would supply power to these floating data centers, and pumping the surrounding water through an onboard system would cool them.221
Another example was a Google initiative to launch hot air balloons carrying computer equipment to create a high-speed Internet infrastructure around the world.222 In a world where national tax systems are still largely autonomous and the right to tax is linked to sovereignty, while sovereignty is exercised only over a geographical territory other than an extraterritorial zone, there will always be gaps between tax jurisdictions and places for ‘stateless’ income. The ‘second pillar’ or the ‘global anti-base erosion proposal’ discussed in the framework of the BEPS project can ease the stateless income problem.223 This proposal contains two interrelated rules. An income inclusion rule would require taxation of the income of a foreign branch or a controlled entity if that income was subject to a low effective tax rate in the jurisdiction of establishment or residence. An undertaxed payments rule would deny a deduction or treaty relief for certain payments unless that payment was subject to an effective tax rate at or above a minimum rate.224 The global anti-base erosion proposal targets multinationals generally and would require an international agreement on a minimum rate of income tax.225
5.3 Consensus-based solutions
Proposals grouped by the OECD into two so-called ‘pillars’ and discussed in a number of documents226 could form the basis for the international consensus on two groups of
Law (Cambridge University Press, 6th ed, 2008) 492; Ian Brownlie, Principles of Public International Law (Clarendon Press, 5th ed, 1998) 105, 173-175. 220 For discussion of recent changes of the tax system of the United States see, for instance, Paul C Nylen, ‘We Once Had a Worldwide Tax System. What Do We Have Now?’ (2018) 90(8) Tax Notes International 859. 221 Steven R Swanson, ‘Google Sets Sail: Ocean-Based Server Farms and International Law’ (2011) 43(3) Connecticut Law Review 709, 716-717. 222Anna Turner, ‘Balloon-powered Internet Launches in [Christchurch]’, The Press (15 June 2013), http://www.stuff.co.nz/the-press/news/8800918/Balloon-powered-internet-launches-in-Chch (accessed 23 January 2020). See also ‘Google Balloon Crashes off Canterbury Coast’, Newshub (19 June 2014), http://www.newshub.co.nz/nznews/google-balloon-crashes-off-canterbury-coast-2014062012 (accessed 23 January 2020). 223 OECD, Addressing the Tax Challenges of the Digitalisation of the Economy, Public Consultation Document, above n 157, 24-29, paras 88-109. OECD, Programme of Work, above n 159, ch 3. 224 OECD, Addressing the Tax Challenges of the Digitalisation of the Economy, Public Consultation Document, above n 157, 25, para 92. For more detail see ibid 25-29, paras 96-108. 225 Ibid 24-29, paras 88-109. 226 OECD, Addressing the Tax Challenges of the Digitalisation of the Economy, Policy Note, above n 200; OECD, Addressing the Tax Challenges of the Digitalisation of the Economy, Public Consultation
eJournal of Tax Research Value creation within multinational platform firms
316
matters: the profit allocation and nexus (pillar one), and a minimum level of taxation of income derived by multinationals (pillar two). These proposals could potentially solve or ease all tax challenges discussed in this article.
A consensus-based solution is effectively the only solution to these problems. Unilateral responses will not solve these problems but will create new ones not only for multinational firms but for states themselves. First, states are bound by the international commitments these states made in their double tax agreements. These commitments make it impossible for one party to unilaterally make changes to the nexus rules it applies without an agreement of other parties to those agreements. The experience with the MLI has demonstrated that even small changes to the permanent establishment concept may be opposed by many, and even the vast majority of, states. The national legislation of some states allows them to override their double tax agreements. However, this override could be costly politically and economically if the trading partners of an overriding state with whom this state has double tax agreements do not support the override.
Second, any improvements to the nexus rules would require international coordination. International coordination reduces the risk of juridical double taxation and provides a basis for international requests for assistance in the enforcement of tax claims based on nexus rules. Coordination would be particularly important when it comes to multinational platform firms, because the business activities of these firms operate globally. Without international coordination multinational platform firms would have to either pay more tax or change their business models. It would be very costly for these firms to change own business models to avoid this double taxation. For states, uncoordinated ‘improvements’ of their profit attribution or nexus rules may make it very difficult (if not impossible) to enforce their tax claims against multinational firms outside these states’ territories.
Third, uncoordinated changes of profit attribution or nexus rules may not generate substantial, if any, tax revenue. Facing pressure from foreign governments, multinational platform firms, and Google in particular, are changing the structure of their operations in some states where the firm’s multisided market operates.227 However, the increase in corporate tax revenues paid by Google in the United Kingdom228 and Australia229 (two states that between 2015-2017 unilaterally introduced anti-BEPS
Document, above n 157; OECD, Tax and Digitalisation (Policy Brief, March 2019); OECD, Programme of Work, above n 159; OECD, Statement by the OECD/G20 Inclusive Framework on BEPS on the Two-Pillar Approach to Address the Tax Challenges Arising from the Digitalisation of the Economy, above n 168. 227 For details of the changes of business structures of Google and other large tech multinationals, see OECD, Tax Challenges Arising from Digitalisation – Interim Report 2018, above n 6, 91-92, para 262, and 107, para 309. 228 House of Commons, Committee of Public Accounts, United Kingdom, Corporate Tax Settlements, Twenty-fifth Report of Session 2015-16, HC 788 (23 February 2016). 229 See Nassim Khadem, ‘Google Restructures to Avoid Hefty Penalties in Australia, as Tax Bill hits $16 million’, The Sydney Morning Herald online (29 April 2016), https://www.smh.com.au/business/the-economy/google-restructures-to-avoid-hefty-penalties-in-australia-as-tax-bill-hits-16-million-20160429-goi8fl.html (accessed 23 January 2020); a media report in the following year noted that ‘Google and Facebook have reported only a third of their estimated Australian revenue under the first year of the Multinational Anti-Avoidance Legislation, while slashing payments they made to their local operations for services. The two tech giants, which account for more than three-quarters of all online advertising in the world, reported a combined $1.2 billion in ad revenue from Australian clients, but lifted their combined pre-tax profits by only $77 million. Thanks to MAAL, tax was up by $19 million’: Neil Chenoweth and
eJournal of Tax Research Value creation within multinational platform firms
317
measures such as the diverted profits tax and multinational anti-avoidance law) has turned out to be much less than was initially anticipated based these firms’ country gross profits and headline rates.230 Profits derived by Google before the changes in the structure of the firm’s business operations or national tax legislation entirely escaped the tax net of source states.231
Finally, and most importantly, unilateral improvements of the profit attribution and nexus rules are unable to tackle the tax challenges discussed in this article holistically and cannot guarantee single taxation of profits from cross-border business activities and their taxation at some minimum level. This failure is not (or not only) a problem with the nexus or profit attribution rules of individual states, but reflects broader dysfunctions in the international corporate tax system. In particular, the use of the separate entity approach upon which the international corporate tax system is premised often results in the existence of more than one nexus (and double taxation) or a lack of a nexus (and non-taxation) between states and items of income derived from cross-border business activities. In other words, the separate entity approach does not by itself provide a sufficient level of coordination between nexus rules of different states that would make both double taxation of income and its double non-taxation impossible. This lack of coordination is an intrinsic feature of the separate entity approach and, therefore, is a problem with the model underlying the international corporate tax system rather than a ‘problem of the nexus or profit allocation rules’.
Another intrinsic feature of the separate entity approach is its inability to assess the overall income tax liability of a multinational firm and provide a basis for rules that would set minimum and maximum levels of taxation of multinationals’ business profits. Each state, under the separate entity approach, is free to determine the tax base for business income and apply any statutory rate of a corporate income tax, including a tax rate of zero. This freedom encourages cross-border profit shifting, erodes the tax bases of states with high rates of income tax, and often is not very beneficial for states that tax income at a very low level (if it at all).232
Max Mason, ‘How Google, Facebook Dodged $1.2 billion MAAL Tax Bullet’, Australian Financial Review (28 April 2017), http://www.afr.com/technology/social-media/google/how-google-facebook-dodged--12-billion-maal-tax-bullet-20170428-gvuzjd (accessed 23 January 2020). 230 No information is available about New Zealand. The Taxation (Neutralising Base Erosion and Profit Shifting) Act 2018 (NZ) does not tackle virtual presence of multinational platform firms. Therefore, it is unlikely the Act will make these firms pay more corporate tax in New Zealand. For more detail see Plekhanova, ‘Taxation of Global Digital Matchmakers’, above n 147. 231 For instance, French tax authorities have lost the second round of litigation against the Irish subsidiary of Google. On 25 April 2019, the Paris Administrative Court of Appeal confirmed a decision of the Administrative Court of Paris issued on 12 July 2017 that Google Ireland Limited had had no permanent establishment in France from 2005-2010. See Decision of the Paris Administrative Court of Appeal No. 17PA03065, http://paris.cour-administrative-appel.fr/content/download/160497/1624543/version/1/file/ 17PA03065.pdf (accessed 1 February 2020). See also Pascal Luquet, Mickaël Duquenne, and Paul Bufort, ‘Google Doesn’t Owe French Tax on Sales to Advertisers, Court Rules’, MNE Tax (23 May 2019), https://mnetax.com/google-doesnt-owe-french-tax-on-sales-to-advertisers-court-rules-33887 (accessed 1 February 2020). 232 For instance, according to UNCTAD, multinationals from a sample of 25 developed states registered more profits as being earned in Bermuda than in China in 2014: the relative magnitude of the profits of these firms was 779.4 per cent of the gross domestic product (GDP) of the economy of Bermuda. At the same time in 2015-2016 the Bermudan economy was not growing and the territory was barely coping with the increasing costs for servicing of its financial debt. See UNCTAD, World Investment Report 2016. Investor Nationality: Policy Challenges (New York and Geneva, 2016) 21.
eJournal of Tax Research Value creation within multinational platform firms
318
Consensus-based international solutions to the tax challenges of digitalisation will not, however, be easy to reach. Many developing states traditionally support a full unitary apportionment for business profits of all multinationals;233 the United Kingdom seems to want new nexus and profit attribution rules only for multinational platform firms.234 The United States advocates new nexus rules for highly digitalised businesses but may be reluctant to support any rules that would allocate a substantial amount of economic rents to source states.235 Many low or no tax jurisdictions may find the global anti-base erosion proposal236 unappealing unless this proposal is coupled with aid programs to help these jurisdictions to recover from revenue losses that a disappearance of their ‘shelter’ industries will cause.
6. CONCLUSION
This article has discussed the nature of platform firms and the process of value creation within a platform firm. Drawing on this analysis and an examination of the model applied under the current international corporate tax system for the international allocation of business profits, a number of failures of the international corporate tax system to allocate the business profits of multinational platform firms in accordance with value creation were identified. These failures give rise to two key groups of tax challenges: problems with the measurement of value added (problems of price), and problems with the identification of location where value was added (problems of place).
The problems of price discussed in this article include measurement difficulties related to intangibles; multisided market business structures; the integrated nature of production and distribution of digital services; and customer participation in a value creation process. The problems of place embrace the difficulties with the identification of the geographical location of economic value creation when a value creation process is non-territorial, or suppliers of digital services are virtually present in the economic life of a market state, or income is stateless.
The ‘problems of price’ could be solved, or at least mitigated, by the development of some proxies for the value added or created. However, the ‘problems of place’ (ie, non-territoriality of the value creation process, the virtual presence in the economic life of a state, and stateless income) are more complicated. The solution to these problems would
233 A proposal recently made by the working group led by India, Colombia, and Ghana in the framework of Action 1 of the BEPS project is generally structured along this line. See G24 Working Group on Tax Policy and International Tax Cooperation, Proposal for Addressing Tax Challenges Arising from Digitalisation (17 January 2019) 6-7, paras 14-15, https://www.g24.org/wp-content/uploads/2019/03/G-24_proposal_for_Taxation_of_Digital_Economy_Jan17_Special_Session_2.pdf (accessed 1 February 2020). 234 HM Treasury, Corporate Tax and the Digital Economy, Position Paper, above n 174; HM Treasury, Corporate Tax and the Digital Economy, Position Paper Update, above n 155. 235 The US officials favour a global minimum rate of income tax and would support only granting relatively modest additional taxing rights to source states under the ‘marketing intangibles’ proposal. See Julie Martin, ‘“Marketing Intangibles” Solution to Global Digital Tax Dispute Should Apply Only to Consumer-facing Businesses, US Official Says’, MNE Tax (19 February 2019), https://mnetax.com/marketing-intangibles-solution-to-digital-tax-dispute-should-apply-only-to-consumer-facing-businesses-us-official-says-32441 (accessed 23 January 2020). See also Julie Martin, ‘Countries Won’t Abandon Arm’s Length Principle in Global Tax Overhaul, US Official Says’, MNE Tax (2 February 2019), https://mnetax.com/international-tax-overhaul-will-retain-arms-length-principle-us-official-assures-32257 (accessed 1 February 2020). 236 OECD, Addressing the Tax Challenges of the Digitalisation of the Economy, Public Consultation Document, above n 157, 24-29, paras 88-109. OECD, Programme of Work, above n 159, ch 3.
eJournal of Tax Research Value creation within multinational platform firms
319
require either a fundamentally new international corporate tax system or should be sought outside of this system.237
A fundamentally new international corporate tax system would require the recognition of three facts. First, a multinational platform firm, like any other multinational firm, operates as a single economic unit. For the purpose of the international corporate tax system this unit should be treated as a single taxpayer with corporate tax liabilities to all states where this firm generates value. Second, multinational platform firms (and certain other types of multinationals) create value in a single, integrated economic and technological environment that spans the territories of many states and extraterritorial zones. For the purpose of the recognition of the right to impose taxes in the international corporate tax system, all of the profit of a multinational platform firm should be divided among states where the firm operates. Profits that result from value that is added within a single state should be allocated to that state. Other profits (as well as losses) should be apportioned among all states that have contributed to the integrated economic and technological environment where the firm generates its profits. This could be all of the states in a region where the firm operates or (virtually) all states if the scale of the firm’s operations is truly global. Third, a multinational platform firm (and many other highly digitalised businesses) participate in the economic life of many states via the Internet. If the Internet remains a global network and a global marketplace, then the taxation of profits should reflect the virtual nature of economic activities conducted within the Internet infrastructure. Otherwise, for many states their contributions to the maintenance of this global marketplace will remain uncompensated and the global economic and technological infrastructure will be under-provided. Therefore, if states agreed that everyone should get their ‘fair share’ from Internet activities, the virtual presence in the economic life of a state should be recognised by the international corporate tax system.
States, however, are usually not prone to make fundamental changes of international systems. In the tax area there are a number of reasons for that, including uncertainty of states about future welfare and strategic effects of fundamental changes to the international corporate tax system, the cost and effort already invested in the existing system, and general sensitivity of states to any limitations of their tax autonomy.
If a fundamentally new international corporate tax system seems unlikely, at least in the foreseeable future, states should continue their search for alternatives and coordinate their implementation. The detailed discussion of the ‘Digital Services Tax’ (DST) in the OECD’s Interim Report on Digitalisation238 and the attempts of some European states to introduce this type of tax unilaterally239 or as part of the European Union
237 For discussion of these options in a broader context (ie, profits of multinationals) see Joseph Bankman, Mitchell Kane and Alan Sykes, ‘Collecting the Rent: The Global Battle to Capture MNE Profits’ (NYU Law and Economics Research Paper No. 18-38, November 2018). 238 See OECD, ‘Tax Challenges Arising from Digitalisation – Interim Report 2018, above n 6, ch 6. According to the report (para 421), the excise tax should be: (i) levied on the supply of a certain defined category or categories of e-services and imposed on the parties to the supply without reference to the particular economic or tax position of the supplier; (ii) charged at a fixed rate, calculated by reference to the consideration paid for those services (without reference to the net income of the supplier or the income from the supply); and (iii) not creditable or eligible for any other type of relief against income tax imposed on the same payment. 239 For instance, in France the DST applies from 26 July 2019 under Projet De Loi ‘Portant Creation D’une Taxe Sur les Services Numeriques et Modification de la trajectoire de baisse de l’impôt sur les societes’ (No. 2080/616). See Eglantine Lioret and Valérie Farez, ‘Insight: France’s Digital Services Tax Goes Ahead’, Bloomberg Tax (29 July 2019), https://news.bloombergtax.com/daily-tax-report-
eJournal of Tax Research Value creation within multinational platform firms
320
legislation,240 suggests that a DST could be a realistic alternative response to the current tax challenges.241 The DST will not entirely solve the problems of price and the problems of place discussed in this article. However, this tax will mitigate concerns of many states that they are losing significant tax revenue as a result of the lack of a recognised nexus with the business profits of multinational platform firms.
Another possible alternative could be a type of royalty charge or licence fee for access to digital data produced by or obtained from customers of a platform firm located in a state. Further work on such a royalty or fee is needed.
international/insight-frances-digital-services-tax-goes-ahead-1. In August 2019 the US and France reached a compromise which requires France to refund all DST once a new international system for taxing multinationals in the digital sector is in place. See Julie Martin, ‘US, France Reach Deal on Digital Services Tax’, MNE Tax (26 August 2019), https://mnetax.com/us-france-reach-deal-on-digital-services-tax-35466. However, in December the Trump administration threatened France with retaliatory tariffs on French goods based on findings of the Report on France’s Digital Services Tax Prepared in the Investigation under Section 301 of the Trade Act of 1974 on 2 December 2019 (Office of the US Trade Representative). France pushed back by suggesting its own retaliatory measures but later agreed to delay application of its DST until the end of 2020. See Dominique Vidalon, ‘France Warns US Against Digital Tax Retaliation’, Reuters (6 January 2020), https://www.reuters.com/article/us-france-usa-tax/france-warns-u-s-against-digital-tax-retaliation-idUSKBN1Z50OB (accessed 1 February 2020). See also BBC News, ‘France Agrees to Delay New Tax on Tech Giants’, BBC News (21 January 2020), https://www.bbc.com/news/business-51192369 (accessed 1 February 2020). Under Italian Budget Law 2020 (No.160/2019) the DST applies in Italy from 1 January 2020. Italy introduced DST in its Budget Law 2018 (No. 205/2017) and Budget Law 2019 (No. 145/2018). However, the DST provisions of these laws have never entered into force. See Toni Marciante, ‘Italy - Update on the Digital Services Tax’, Lexology (7 January 2020), https://www.lexology.com/library/detail.aspx?g=b1136f3c-4e88-4186-80b8-56b03e4060c2 (accessed 1 February 2020). The United Kingdom aims to apply the DST from April 2020. See HM Revenue and Customs, and HM Treasury, Overview of Tax Legislation and Rates (29 October 2018) 22, para 2.19. See also HM Treasury, and HM Revenue and Customs, Digital Services Tax: Consultation (November 2018). 240 France and Germany have been the main drivers of the DST for the EU. See European Commission, Proposal for a Council Directive on the Common System of a Digital Services Tax on Revenues Resulting from the Provision of Certain Digital Services (COM/2018/148, 21 March 2018). See also European Commission Note, Proposal for a Council Directive on the common system of a digital services tax on revenues resulting from the provision of certain digital services General approach. ST 14886 2018 INIT (29 November 2018). 241 In 2018 Australia invited public submissions on the DST legislation and later decided not to proceed with an interim measure. See Australian Treasury, The Digital Economy and Australia’s Corporate Tax System, above n 14, and Hon Josh Frydenberg (Treasurer), ‘Government response to Digital Economy Consultation’, Media Release (20 March 2019), https://joshfrydenberg.com.au/latest-news/government-response-to-digital-economy-consultation/ (accessed 23 January 2020). In June 2019 the New Zealand Inland Revenue Department invited public submissions on the New Zealand Government DST proposal. See Minister of Finance and Minister of Revenue, New Zealand, Options for Taxing the Digital Economy, A Government Discussion Document (4 June 2019).