efficient frequent sequence mining on taxi trip records using
TRANSCRIPT

Efficient Frequent Sequence Mining on Taxi Trip Records Using Road Network Shortcuts
Jianting Zhang
Department of Computer Science, the City College of New York
Abstract Huge amounts of geo-referenced spatial location data and moving object trajectory data are being generated at ever increasing rates. Patterns discovered from these data are valuable in understanding human mobility and facilitating traffic mitigation. In this study, we propose a new approach to mining frequent patterns from large-scale GPS trajectory data after mapping GPS traces to road network segments. Different from applying association rule-based frequent sequence mining algorithms directly, which generally have high computation overhead and are not scalable, our approach utilizes hierarchies of road networks. After contracting nodes and creating shortcuts by contraction hierarchies algorithms, the original road segment sequences are transformed into sequences of shortcuts with much smaller data volumes. By using computed shortest paths as simulated GPS trajectories, our experiments on 17,558 selected taxi trip records in NYC in January 2009 have shown that runtimes of frequent sequence mining on shortcut sequences are orders of magnitude faster than on original road segment sequences. In addition, frequent subsequences in shortcuts are more informative and interpretable based on the betweenness centralities of the shortcuts than visualizing betweenness centralities of individual road segments.
1 Introduction
Locating and navigation devices now are ubiquitous. Huge amounts of geo-referenced spatial location data and moving object trajectory data are being generated at ever increasing rates. Patterns discovered from these data are valuable in understanding human mobility and facilitating traffic mitigation. The state-of-the-art techniques in managing such data are based on spatial databases and moving object databases to index and query geometrical coordinates directly. However, as most of human movements are constrained by built infrastructures and road networks, an alternative approach to matching the location and trajectory data with infrastructure data for subsequent processing (Richter et al. 2012) can potentially be more efficient from a computing perspective. For example, a GPS trajectory can be transformed into a sequence of road segments and thus it becomes possible to apply well-studied frequent sequence mining algorithms (Agrawal and Srikant 1995) to identify popular routes for different groups of people at different scales for different purposes, e.g., rider sharing, hailing taxies for riders, making more profits for drivers and understanding functional zones in metropolitan areas to facilitate city planning and traffic mitigation.
While the idea is attractive, besides the technically challenge in accurate map matching, our preliminary results have shown that applying frequency counting based association rule
mining algorithms in a straightforward way may incur significant computing overheads due to the inherent combinatorial complexity of the algorithms. For big metropolitan areas such as New York City (NYC) with a road network of hundreds of thousands of intersections and segments and millions of trips a day, the computing overheads quickly become intractable even though parallel and distributed computing resources are becoming more accessible than ever. By taking advantage of the fact that many human trips follow shortest path principles in general (Eisner et al 2011), we propose to utilize street hierarchies through network contractions (Geisberger et al 2008) to effectively reduce the lengths of road segment sequences after map-matching of trip trajectories. Shortcuts derived from road networks naturally partition sequences of road segments into subsequences. These subsequences with high frequencies are likely to be the whole or part of frequent sequences. The complexity of counting the frequencies of the shortcuts, on the other hand, is linear with the number of original and shortcut road segments in the subsequences which is much more efficient than classic sequence mining algorithms. When appropriate, classic sequence mining algorithms can be applied on the frequent subsequences to discover longer frequent sequences. As numbers of segments in shortcut sequences are typically much smaller than the numbers of original sequences, the computing workloads of sequence mining algorithms on shortcut sequences are much lighter. We empirically evaluate the proposed approach on a subset of taxi trip records in NYC in 2009 (about 168 million records in total) and report our preliminary results.
The rest of the chapter is arranged as the following. Section 2 introduces background, motivation and related work. Section 3 presents the prototype system architecture and implementation details of several components. Section 4 provides experiment results. Finally Section 5 is the conclusion and future work directions. 2 Background, Motivation and Related Work
Processing GPS data for various purposes has attracted significant research interests, such as compression, segmentation, indexing, query processing and data mining (Zheng and Zhou 2011). Most existing research is focused on the geometrical aspects, such as range, nearest neighbor and similarity queries, clustering and data mining of individual and group-based patterns (e.g., convey and flock) (Zheng and Zhou 2011). Many approaches are generic for many types of moving object trajectory data but can incur heavy computation overheads. Approaches in map matching of GPS points to road network segments (Brakatsoulas et al. 2005), although mostly developed for navigation purposes, are particularly relevant to our research as our approach relies on such techniques to transform point sequences into road segment identifier sequences for frequent pattern mining. Several previous research efforts have proposed to develop semantic data models to derive individual activities from GPS trajectories (Yan et al. 2011, Richter et al. 2012). While our approach can be adapted to efficiently mine frequent sequences from GPS trajectories of individuals, our focus in this study is to understand frequently-used paths from large-scale taxi trip data at the city-level which is much more computationally demanding and efficiency is overwhelmingly important.
Existing work on city-level trajectory data analytics can be grouped into several categories. Research in the first category focuses on identifying popular routes from trajectories (Chen et al 2011, Wei et al 2012) with applications to ridesharing recommendations (He et al 2012). In contrast, the second category focuses on identifying anomalous trajectories (Zhang et al. 2011, Chen et al. 2013) with applications to taxi driving fraud detection (Ge et al. 2011). The third category is related to identifying Region of Interests (ROIs) and their functions (Uddin et al 2011, Qi et al 2011, Huang and Powell 2012, Yuan et al. 2012). The fourth category of research

mainly is interested in analyzing Origin-Destination (O-D) flows over space and time (Zheng et al. 2011, Jiang et al. 2012, Yuan 2012). Finally, research in the fifth category is interested in deriving sophisticated knowledge from taxi GPS traces for taxi drivers (Li et al. 2011, Powell et al 2011, Yuan et al. 2011a) and general drivers (Ziebart et al. 2008, Yuan et al 2010, Yuan et al 2011b). Among these studies, except for Chen et al. (2011) that adopted a network expansion approach, the majority of existing research adopted a uniform grid-based approach and many of the grids are quite coarse. Although using coarse resolution grids significantly reduces computing complexity, it may also significantly reduce accuracy. A possible improvement is to first use fine resolution grids and then to aggregate grid cells into regions to reduce computing overheads and maintain accuracy simultaneously (Yuan et al. 2012). It is somehow surprising that, while GPS trajectories are strongly constrained by road networks, very few works incorporate road network topology explicitly. Despite significant progress in map matching (Zheng and Zhou 2011, Ali et al. 2012), the technical difficulties, computing overheads and qualify of the matching results might be some key factors in slowing down their practical applications on large-scale GPS trajectory data. Nevertheless, we believe that the synergized hardware and software advances will significantly improve map matching accuracy. In this study, we assume GPS trajectories are matched to road segments and we will focus on frequent trajectory pattern mining from road segment identifier sequences.
Frequent trajectory pattern mining from road segment identifier sequences is naturally abstracted as a frequent pattern mining problem (Han et al. 2007). Since the Apriori-based association rule mining approaches for frequent sequence mining were developed nearly two decades ago (Agrawal and Srikant 1995), significant progress has been made in the important data mining area. New strategies such as Eclat and Fp-Growth, new variations such as closed and maximal itemsets and sequences, and new hardware platforms such as clusters, multi-core CPUs and many-core Graphics Processing Units (GPUs), have been extensively explored (Hipp et al 2000, Han et al 2007, Borgelt 2012). While Borgelt (2012) argued that there was little room left for speed improvements of existing efficient and optimized implementations of frequent pattern mining, we believe exploring domain knowledge to effectively reduce problem size and number of frequent patterns can be a new growing point for empowering existing data mining algorithms for large-scale datasets. Using road hierarchy derived from network contractions is our first attempt based on this idea. As our prototype system uses the Sequoiai open source frequent sequence mining package, we next provide a brief introduction to frequent sequence mining based on the implementation in Sequoia.
Given a set of sequences, frequent sequence mining algorithms aim at finding unique sets of ordered itemsets whose frequencies are above a predefined threshold termed as support value, which can be either an absolute value or a percentage. The task becomes simpler when only one item is allowed in the itemsets that are used as the building blocks for frequent sequences. While allowing multiple items in itemsets provides higher flexibility, using a single item per itemset may actually be more suitable for trajectory data where road segments are typically unique in simple frequent sequences. The Sequoia package by Borgelt is highly engineered from a software development perspective. It is designed to find both non-closed and closed frequent sequences with unique occurrences of items, which matches our need on mining frequent sequences of unique road segments very well. Sequoia adopts the FP-growth style strategy (Han et al. 2000) to efficiently prune the search space. Our experiments also show that Sequoia is faster than alternatives, likely due to incorporating proven-effective data structures and highly efficient memory and disk I/Os, in addition to adopting efficient mining algorithms.
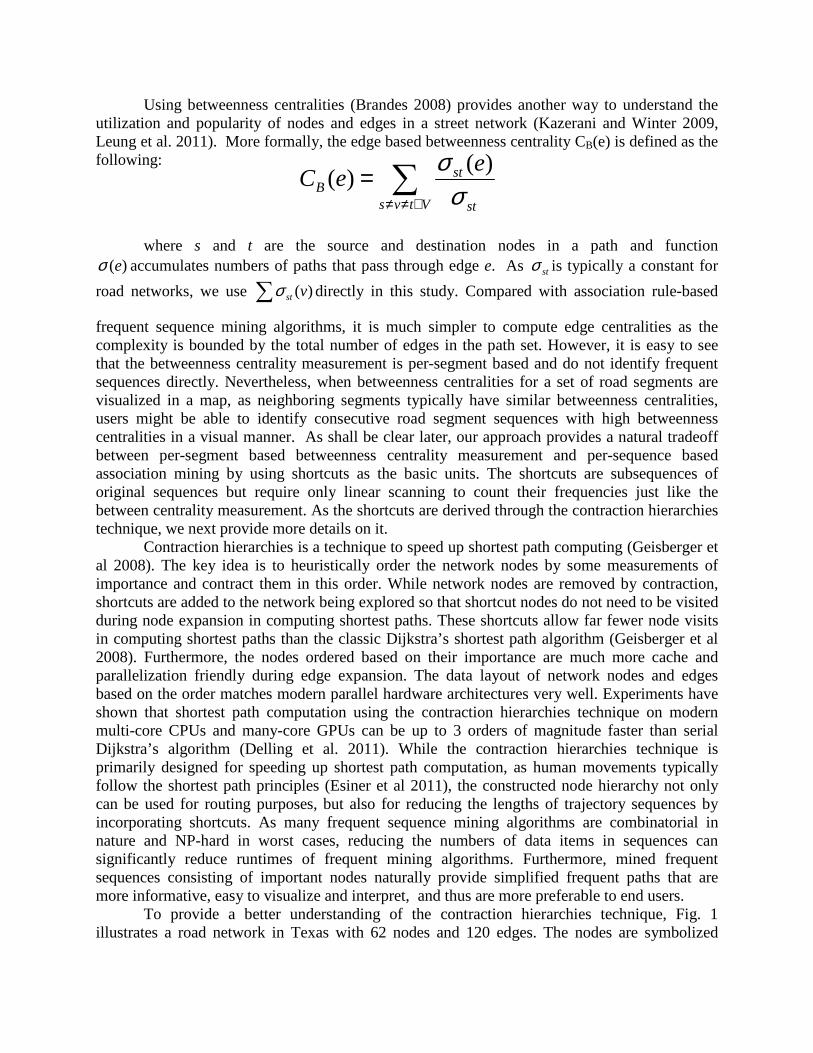
Using betweenness centralities (Brandes 2008) provides another way to understand the utilization and popularity of nodes and edges in a street network (Kazerani and Winter 2009, Leung et al. 2011). More formally, the edge based betweenness centrality CB(e) is defined as the following:
where s and t are the source and destination nodes in a path and function
)(eσ accumulates numbers of paths that pass through edge e. As stσ is typically a constant for
road networks, we use ∑ )(vstσ directly in this study. Compared with association rule-based
frequent sequence mining algorithms, it is much simpler to compute edge centralities as the complexity is bounded by the total number of edges in the path set. However, it is easy to see that the betweenness centrality measurement is per-segment based and do not identify frequent sequences directly. Nevertheless, when betweenness centralities for a set of road segments are visualized in a map, as neighboring segments typically have similar betweenness centralities, users might be able to identify consecutive road segment sequences with high betweenness centralities in a visual manner. As shall be clear later, our approach provides a natural tradeoff between per-segment based betweenness centrality measurement and per-sequence based association mining by using shortcuts as the basic units. The shortcuts are subsequences of original sequences but require only linear scanning to count their frequencies just like the between centrality measurement. As the shortcuts are derived through the contraction hierarchies technique, we next provide more details on it.
Contraction hierarchies is a technique to speed up shortest path computing (Geisberger et al 2008). The key idea is to heuristically order the network nodes by some measurements of importance and contract them in this order. While network nodes are removed by contraction, shortcuts are added to the network being explored so that shortcut nodes do not need to be visited during node expansion in computing shortest paths. These shortcuts allow far fewer node visits in computing shortest paths than the classic Dijkstra’s shortest path algorithm (Geisberger et al 2008). Furthermore, the nodes ordered based on their importance are much more cache and parallelization friendly during edge expansion. The data layout of network nodes and edges based on the order matches modern parallel hardware architectures very well. Experiments have shown that shortest path computation using the contraction hierarchies technique on modern multi-core CPUs and many-core GPUs can be up to 3 orders of magnitude faster than serial Dijkstra’s algorithm (Delling et al. 2011). While the contraction hierarchies technique is primarily designed for speeding up shortest path computation, as human movements typically follow the shortest path principles (Esiner et al 2011), the constructed node hierarchy not only can be used for routing purposes, but also for reducing the lengths of trajectory sequences by incorporating shortcuts. As many frequent sequence mining algorithms are combinatorial in nature and NP-hard in worst cases, reducing the numbers of data items in sequences can significantly reduce runtimes of frequent mining algorithms. Furthermore, mined frequent sequences consisting of important nodes naturally provide simplified frequent paths that are more informative, easy to visualize and interpret, and thus are more preferable to end users.
To provide a better understanding of the contraction hierarchies technique, Fig. 1 illustrates a road network in Texas with 62 nodes and 120 edges. The nodes are symbolized
∑∉≠≠
=Vtvs st
stB
eeC
σσ )(
)(

based on their importance after applying the technique. The more important the nodes are, the larger circles are used for symbolization. Clearly, node 46 in the center of the network is the most important node while many nodes that are close to the boundary are least important. This is understandable, as shortest paths will likely pass through node 46 and is least likely to be shortcut. When computing the shortest path between node 34 and node 60, the full path sequence would be 34,36,57,61,22,23,53,50,11,60 whose length is 9 hops. Using the derived contraction hierarchy, there will be a shortcut between node 57 and 22, and, node 61 is shortcut as it has a lower importance than the two nodes. Similarly, a shortcut between node 11 and node 53 is added as node 50 has a lower importance. It is also interesting to observe that there is also a shortcut between node 57 and node 23 where node 22 is shortcut in this case. The node sequence using the shortcuts turns out to be 34,36,57,23,53,11,60 whose length is 6 hops. While only 3 out of the 9 edges are reduced due to using shortcuts in this small network with a maximum level of 10, as the number of levels generally increase logarithmically with the number of nodes in a network (Abraham et al. 2010), the reduction can be significant for long path sequences in large networks, e.g., the North America road network with tens of millions of nodes and edges.
Fig.1 Illustration of Contraction Hierarchies Using a Texas Road Network
3 Prototype System Architecture Although there are some fundamental research opportunities in tightly integrating
frequent pattern mining and network contraction algorithms, as a first step, we integrate several existing packages to realize our approach in a short time in this study. Our prototype system architecture is shown in Fig. 2 where the shaded boxes indicate input data. The U2SOD-DB data management infrastructure (Zhang et al. 2012) is used in the prototype. We currently use the
57
22
61
23
Regular edge
Shortcut
61
Contracted node
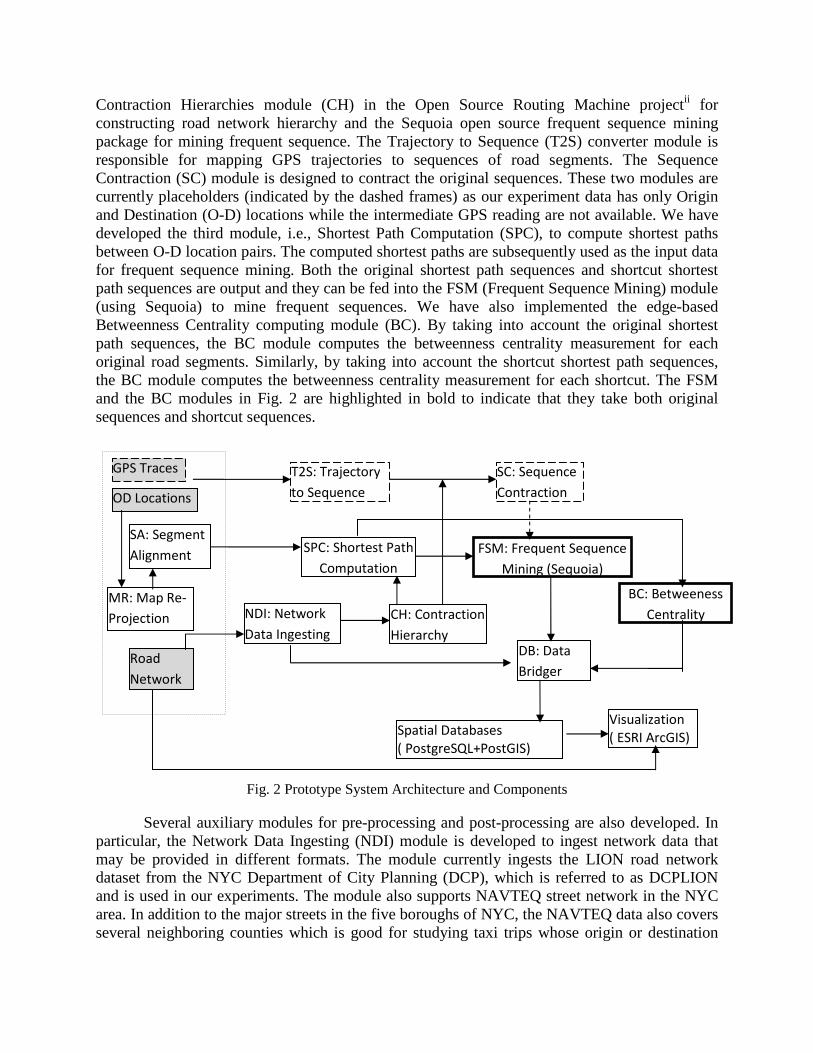
Contraction Hierarchies module (CH) in the Open Source Routing Machine projectii for constructing road network hierarchy and the Sequoia open source frequent sequence mining package for mining frequent sequence. The Trajectory to Sequence (T2S) converter module is responsible for mapping GPS trajectories to sequences of road segments. The Sequence Contraction (SC) module is designed to contract the original sequences. These two modules are currently placeholders (indicated by the dashed frames) as our experiment data has only Origin and Destination (O-D) locations while the intermediate GPS reading are not available. We have developed the third module, i.e., Shortest Path Computation (SPC), to compute shortest paths between O-D location pairs. The computed shortest paths are subsequently used as the input data for frequent sequence mining. Both the original shortest path sequences and shortcut shortest path sequences are output and they can be fed into the FSM (Frequent Sequence Mining) module (using Sequoia) to mine frequent sequences. We have also implemented the edge-based Betweenness Centrality computing module (BC). By taking into account the original shortest path sequences, the BC module computes the betweenness centrality measurement for each original road segments. Similarly, by taking into account the shortcut shortest path sequences, the BC module computes the betweenness centrality measurement for each shortcut. The FSM and the BC modules in Fig. 2 are highlighted in bold to indicate that they take both original sequences and shortcut sequences.
Fig. 2 Prototype System Architecture and Components
Several auxiliary modules for pre-processing and post-processing are also developed. In particular, the Network Data Ingesting (NDI) module is developed to ingest network data that may be provided in different formats. The module currently ingests the LION road network dataset from the NYC Department of City Planning (DCP), which is referred to as DCPLION and is used in our experiments. The module also supports NAVTEQ street network in the NYC area. In addition to the major streets in the five boroughs of NYC, the NAVTEQ data also covers several neighboring counties which is good for studying taxi trips whose origin or destination
T2S: Trajectory
to Sequence
SC: Sequence
Contraction
FSM: Frequent Sequence
Mining (Sequoia)
CH: Contraction
Hierarchy DB: Data
Bridger
Spatial Databases
( PostgreSQL+PostGIS)
Visualization
( ESRI ArcGIS)
OD Locations
NDI: Network
Data Ingesting
SPC: Shortest Path
Computation
Road
Network
GPS Traces
MR: Map Re-
Projection
SA: Segment
Alignment
BC: Betweeness
Centrality
locations are outside of NYC’s five boroughs. In addition to generating node and edge lists and computing different types of edge weights that are required by the CH module, the NI module also adds node and edge identifier columns so that nodes and edges in the sequence mining results can be mapped back to their geometry later for visualization purposes. Subsequently, a Data Bridger (DB) module is developed to combine the node and edge identifiers that are output by the Sequoia module and the related geometric data to generate SQL statements. The PostgreSQL/PostGISiii spatial database can take the SQL statements, populate tables and generate ESRI shapefilesiv that can be visualized in many Geographical Information System (GIS) software, including ESRI’s ArcGISv. The DB module will be replaced by an integrated module in the future to visualize frequent sequence mining results without relying on third party programs.
4 Experiments and Results
The more than 13,000 GPS-equipped medallion taxicabs in NYC generate nearly half a million taxi trips per day and more than 168 million trips per year serving 300 million passengers in 2009. The number of yearly taxi riders is about 1/5 of that of subway riders and 1/3 of that of bus riders in NYC, according to MTA ridership statisticsvi. Taxi trips play important roles in everyday lives of NYC residents (or any major city worldwide). Understanding the trip purposes is instrumental in transportation modeling and planning. In our previous work, we were able to compute the shortest paths between all the 168 million O-D pairs in within two hours using a single Intel Xeon E5405 CPU (2.0 GHZ) by utilizing the contraction hierarchies technique. The performance is orders of magnitude faster than the state-of-the-art (Zhang 2012). However, the computed shortest path sequences are too voluminous to manipulate (with respect to streaming disk-resident files among different modules) and too cumbersome for visualization (data and patterns are cluttered when displays have limited screen resolutions). As a result, we have selected a subset of 2009 data for a case study.
We are particularly interested in the taxi trips between Manhattan and the LaGuardia airport (LGA) located in Northern Queens, another borough of NYC. As one of the three major airports in the NYC metro area, the airport accommodated 24.1 and 25.7 million passengers in 2011 and 2012vii, respectively. We extracted all the taxi trips from all the 13 community districts in Manhattan to community district 403 in Queens (where LGA is located) in January 2009 and the number of trips is 17,558. As discussed in Section 3, we computed the shortest paths between the pickup and drop-off locations of the trips and output the segment identifiers in the computed shortest paths for association rule-based frequent sequence mining. We also apply the BC module to compute the edge-based betweenness centralities for all the edges using the original shortest path sequences. To test the effectiveness of our proposed approach, we output the shortcut sequences and apply the BC module to compute the edge-based betweenness centralities for all the shortcuts. These shortcuts are unpacked in the DB (Data Bridger) module for subsequent visualization purposes. We next present the experiments and results for the three modules and compare them where appropriate.
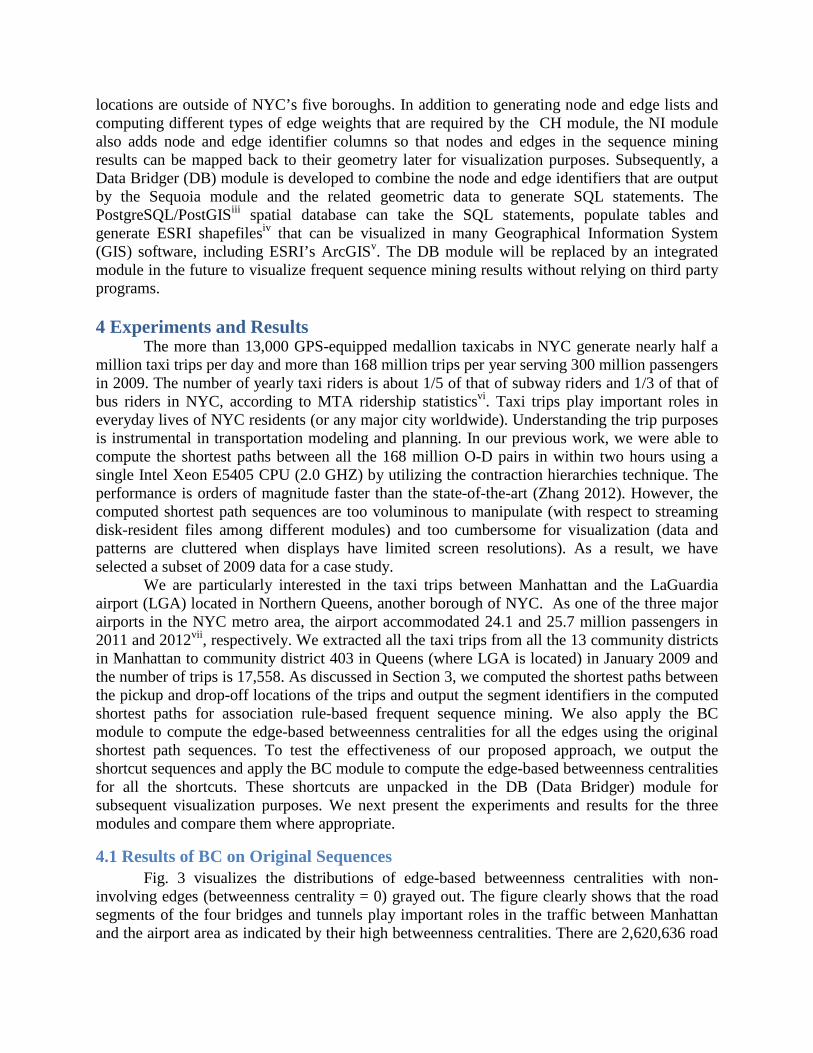
4.1 Results of BC on Original Sequences Fig. 3 visualizes the distributions of edge-based betweenness centralities with non-
involving edges (betweenness centrality = 0) grayed out. The figure clearly shows that the road segments of the four bridges and tunnels play important roles in the traffic between Manhattan and the airport area as indicated by their high betweenness centralities. There are 2,620,636 road
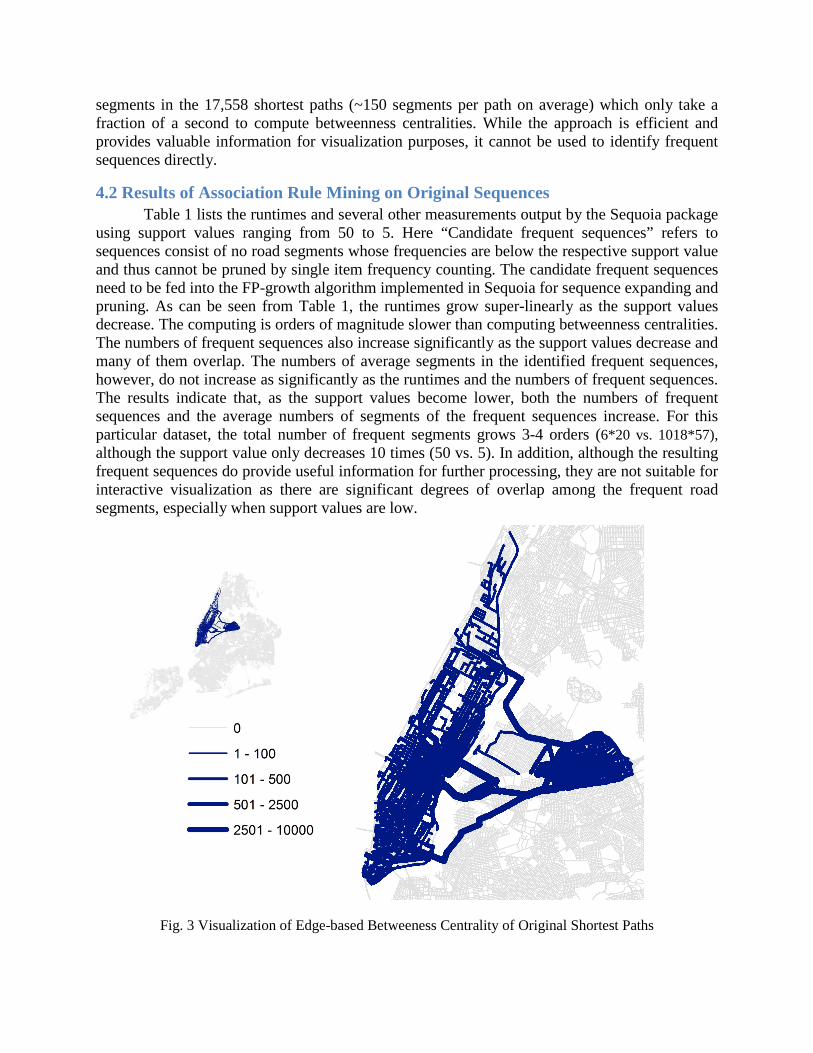
segments in the 17,558 shortest paths (~150 segments per path on average) which only take a fraction of a second to compute betweenness centralities. While the approach is efficient and provides valuable information for visualization purposes, it cannot be used to identify frequent sequences directly.
4.2 Results of Association Rule Mining on Original Sequences Table 1 lists the runtimes and several other measurements output by the Sequoia package
using support values ranging from 50 to 5. Here “Candidate frequent sequences” refers to sequences consist of no road segments whose frequencies are below the respective support value and thus cannot be pruned by single item frequency counting. The candidate frequent sequences need to be fed into the FP-growth algorithm implemented in Sequoia for sequence expanding and pruning. As can be seen from Table 1, the runtimes grow super-linearly as the support values decrease. The computing is orders of magnitude slower than computing betweenness centralities. The numbers of frequent sequences also increase significantly as the support values decrease and many of them overlap. The numbers of average segments in the identified frequent sequences, however, do not increase as significantly as the runtimes and the numbers of frequent sequences. The results indicate that, as the support values become lower, both the numbers of frequent sequences and the average numbers of segments of the frequent sequences increase. For this particular dataset, the total number of frequent segments grows 3-4 orders (6*20 vs. 1018*57), although the support value only decreases 10 times (50 vs. 5). In addition, although the resulting frequent sequences do provide useful information for further processing, they are not suitable for interactive visualization as there are significant degrees of overlap among the frequent road segments, especially when support values are low.
Fig. 3 Visualization of Edge-based Betweeness Centrality of Original Shortest Paths
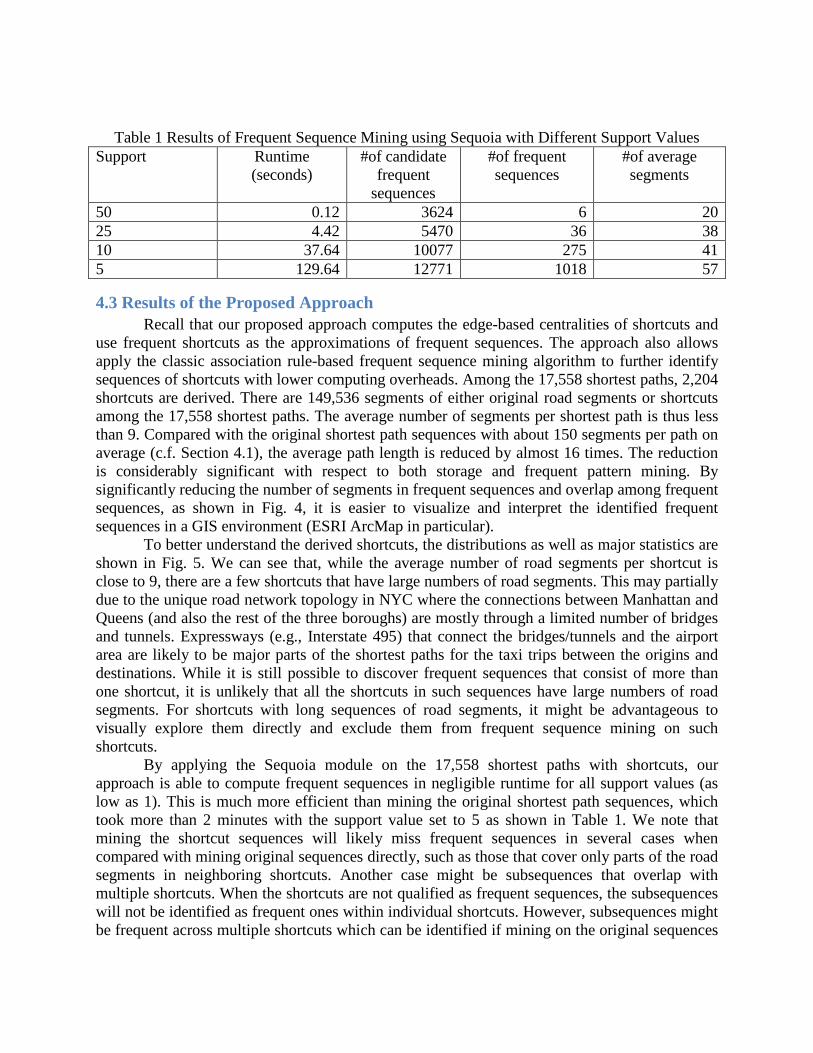
Table 1 Results of Frequent Sequence Mining using Sequoia with Different Support Values Support Runtime
(seconds) #of candidate
frequent sequences
#of frequent sequences
#of average segments
50 0.12 3624 6 20 25 4.42 5470 36 38 10 37.64 10077 275 41 5 129.64 12771 1018 57
4.3 Results of the Proposed Approach Recall that our proposed approach computes the edge-based centralities of shortcuts and
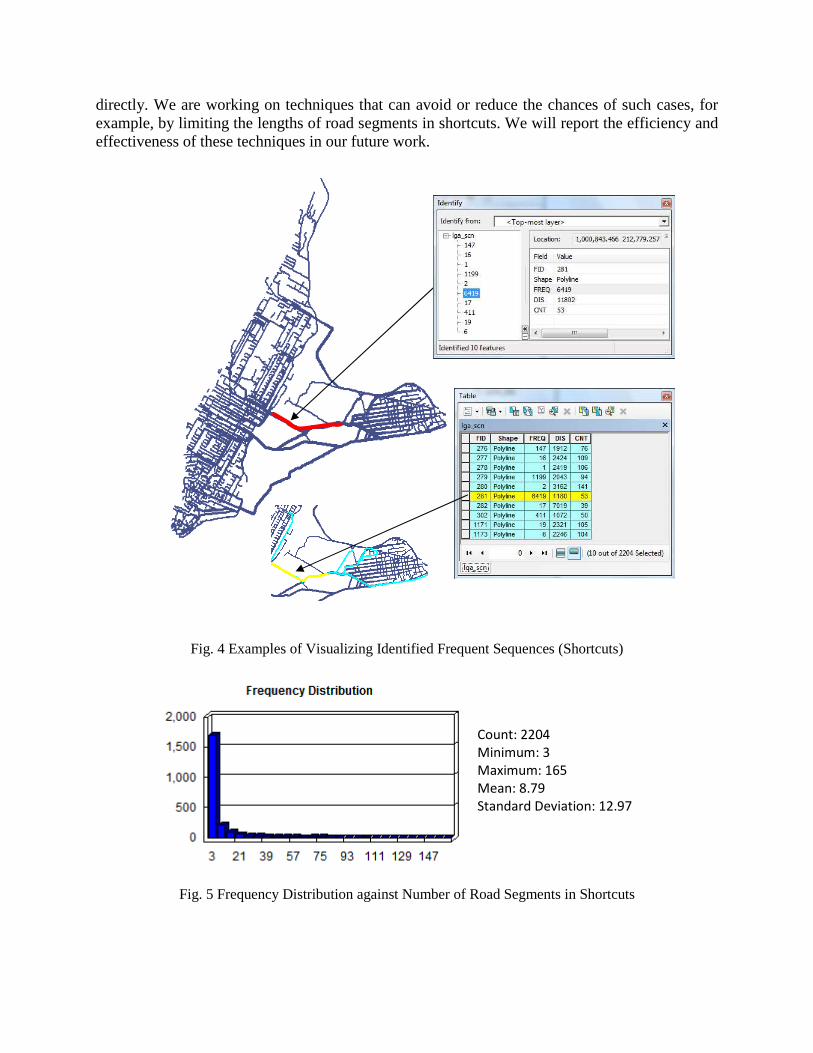
use frequent shortcuts as the approximations of frequent sequences. The approach also allows apply the classic association rule-based frequent sequence mining algorithm to further identify sequences of shortcuts with lower computing overheads. Among the 17,558 shortest paths, 2,204 shortcuts are derived. There are 149,536 segments of either original road segments or shortcuts among the 17,558 shortest paths. The average number of segments per shortest path is thus less than 9. Compared with the original shortest path sequences with about 150 segments per path on average (c.f. Section 4.1), the average path length is reduced by almost 16 times. The reduction is considerably significant with respect to both storage and frequent pattern mining. By significantly reducing the number of segments in frequent sequences and overlap among frequent sequences, as shown in Fig. 4, it is easier to visualize and interpret the identified frequent sequences in a GIS environment (ESRI ArcMap in particular).
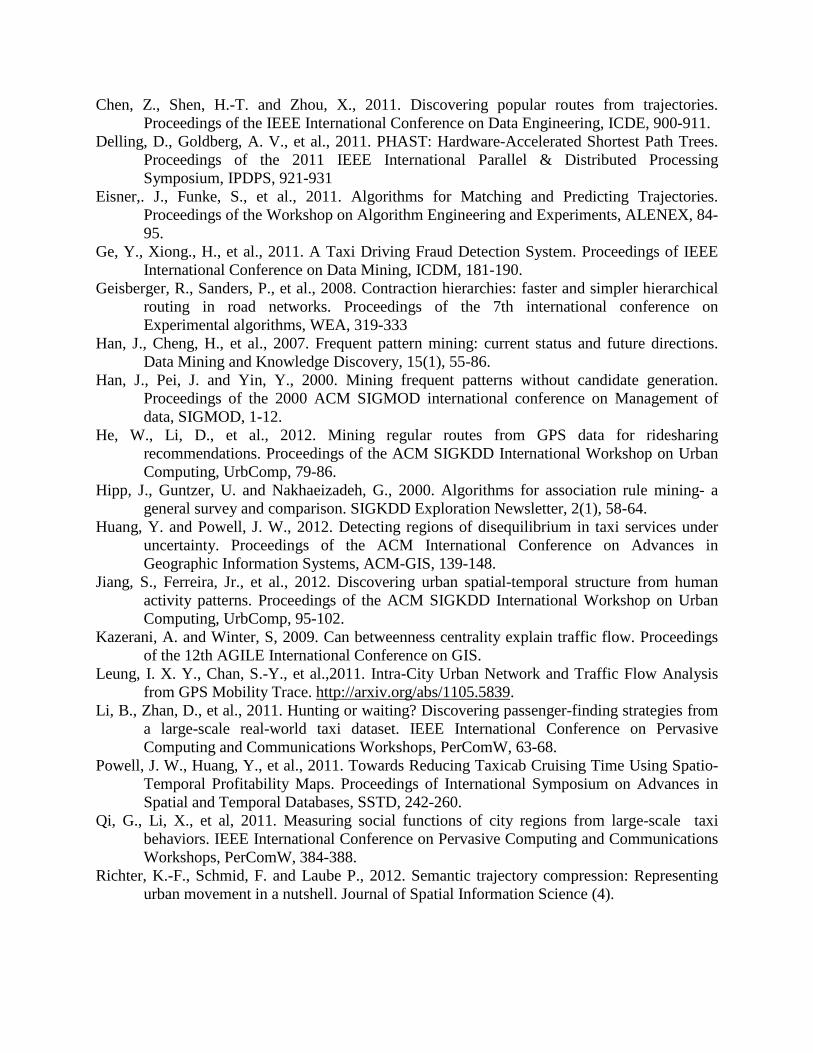
To better understand the derived shortcuts, the distributions as well as major statistics are shown in Fig. 5. We can see that, while the average number of road segments per shortcut is close to 9, there are a few shortcuts that have large numbers of road segments. This may partially due to the unique road network topology in NYC where the connections between Manhattan and Queens (and also the rest of the three boroughs) are mostly through a limited number of bridges and tunnels. Expressways (e.g., Interstate 495) that connect the bridges/tunnels and the airport area are likely to be major parts of the shortest paths for the taxi trips between the origins and destinations. While it is still possible to discover frequent sequences that consist of more than one shortcut, it is unlikely that all the shortcuts in such sequences have large numbers of road segments. For shortcuts with long sequences of road segments, it might be advantageous to visually explore them directly and exclude them from frequent sequence mining on such shortcuts.
By applying the Sequoia module on the 17,558 shortest paths with shortcuts, our approach is able to compute frequent sequences in negligible runtime for all support values (as low as 1). This is much more efficient than mining the original shortest path sequences, which took more than 2 minutes with the support value set to 5 as shown in Table 1. We note that mining the shortcut sequences will likely miss frequent sequences in several cases when compared with mining original sequences directly, such as those that cover only parts of the road segments in neighboring shortcuts. Another case might be subsequences that overlap with multiple shortcuts. When the shortcuts are not qualified as frequent sequences, the subsequences will not be identified as frequent ones within individual shortcuts. However, subsequences might be frequent across multiple shortcuts which can be identified if mining on the original sequences
directly. We are working on techniques that can avoid or reduce the chances of such cases, for example, by limiting the lengths of road segments in shortcuts. We will report the efficiency and effectiveness of these techniques in our future work.
Fig. 4 Examples of Visualizing Identified Frequent Sequences (Shortcuts)
Fig. 3
Fig. 5 Frequency Distribution against Number of Road Segments in Shortcuts
Count: 2204
Minimum: 3
Maximum: 165
Mean: 8.79
Standard Deviation: 12.97

5 Conclusion and Future Work In this study, we have proposed a new approach to mining frequent patterns from large-
scale GPS trajectory data after mapping GPS traces to road network segments. Instead of applying association rule-based frequent sequence mining algorithms directly which generally have high computation overhead and are not scalable, our approach utilizes the inherent hierarchies of road networks. After contracting nodes and creating shortcuts by applying contraction hierarchy algorithms, the original road segment sequences are transformed into sequences of shortcuts and the data volumes of the original sequences can be significantly reduced. Edge-based betweenness centrality measurements can be directly computed on shortcuts efficiently with a linear time complexity, and, frequent sequence mining algorithms can be applied to the shortcut sequences to identify frequent patterns with significantly reduced complexity. By using computed shortest paths as simulated GPS trajectories, our experiments on 17,558 taxi trip records have shown that computing betweenness centrality measurements of shortcuts and frequent sequence mining on shortcut sequences incur negligible computing overheads. The runtimes of frequent sequence mining on shortcut sequences are orders of magnitude faster than on original road segment sequences. In addition, frequent subsequences in shortcuts are more informative and interpretable based on the betweenness centralities of the shortcuts than visualizing betweenness centralities of individual road segments.
The reported work naturally leads to several future research directions. First, we would like to evaluate and validate the assumption that real world GPS trajectories in urban areas follow the shortest path principle with different metrics, especially for long trajectories. While we currently do not have access to complete GPS traces in NYC, we plan to use the publically available T-Drive datasetviii for this purpose. Second, among the 168 million taxi trips in NYC in 2009, we have used only a small fraction of the dataset and we plan to evaluate our proposed approach on larger subsets to test its efficiency and scalability. Finally, the prototype we have developed so far is loosely coupled in nature. We plan to tightly integrate the essential components in the prototype and automate the big-data analytics process. We strongly believe that by integrating road network hierarchies into frequent pattern mining algorithms, specialized and highly efficient trajectory frequent sequence mining algorithms can be developed and tailored for parallel computing.
References
Agrawal, R. and Srikant, R., 1995. Mining sequential patterns. Proceedings of the IEEE Eleventh International Conference on Data Engineering, ICDE, 3-14.
Ali, M., Krumm, J., et al., 2012. ACM SIGSPATIAL GIS Cup 2012. Proceedings of the ACM International Conference on Advances in Geographic Information Systems, ACM-GIS, 597-600.
Borgelt, C., 2012. Frequent item set mining. Wiley Interdisciplinary Reviews: Data Mining and Knowledge Discovery, 2(6), 437-456.
Brakatsoulas, S., Pfoser, D., et al., 2005. On map-matching vehicle tracking data. Proceedings of the 31st international conference on Very large data bases, VLDB, 853-864.
Brandes, U. 2008. On variants of shortest-path betweenness centrality and their generic computation. Social Networks 30, 136-145
Chen, C., Zhang, D., et al., 2013. iBOAT: Isolation-Based Online Anomalous Trajectory Detection. IEEE Transactions on Intelligent Transportation Systems (To Appear).
Chen, Z., Shen, H.-T. and Zhou, X., 2011. Discovering popular routes from trajectories. Proceedings of the IEEE International Conference on Data Engineering, ICDE, 900-911.
Delling, D., Goldberg, A. V., et al., 2011. PHAST: Hardware-Accelerated Shortest Path Trees. Proceedings of the 2011 IEEE International Parallel & Distributed Processing Symposium, IPDPS, 921-931
Eisner,. J., Funke, S., et al., 2011. Algorithms for Matching and Predicting Trajectories. Proceedings of the Workshop on Algorithm Engineering and Experiments, ALENEX, 84-95.
Ge, Y., Xiong., H., et al., 2011. A Taxi Driving Fraud Detection System. Proceedings of IEEE International Conference on Data Mining, ICDM, 181-190.
Geisberger, R., Sanders, P., et al., 2008. Contraction hierarchies: faster and simpler hierarchical routing in road networks. Proceedings of the 7th international conference on Experimental algorithms, WEA, 319-333
Han, J., Cheng, H., et al., 2007. Frequent pattern mining: current status and future directions. Data Mining and Knowledge Discovery, 15(1), 55-86.
Han, J., Pei, J. and Yin, Y., 2000. Mining frequent patterns without candidate generation. Proceedings of the 2000 ACM SIGMOD international conference on Management of data, SIGMOD, 1-12.
He, W., Li, D., et al., 2012. Mining regular routes from GPS data for ridesharing recommendations. Proceedings of the ACM SIGKDD International Workshop on Urban Computing, UrbComp, 79-86.
Hipp, J., Guntzer, U. and Nakhaeizadeh, G., 2000. Algorithms for association rule mining- a general survey and comparison. SIGKDD Exploration Newsletter, 2(1), 58-64.
Huang, Y. and Powell, J. W., 2012. Detecting regions of disequilibrium in taxi services under uncertainty. Proceedings of the ACM International Conference on Advances in Geographic Information Systems, ACM-GIS, 139-148.
Jiang, S., Ferreira, Jr., et al., 2012. Discovering urban spatial-temporal structure from human activity patterns. Proceedings of the ACM SIGKDD International Workshop on Urban Computing, UrbComp, 95-102.
Kazerani, A. and Winter, S, 2009. Can betweenness centrality explain traffic flow. Proceedings of the 12th AGILE International Conference on GIS.
Leung, I. X. Y., Chan, S.-Y., et al.,2011. Intra-City Urban Network and Traffic Flow Analysis from GPS Mobility Trace. http://arxiv.org/abs/1105.5839.
Li, B., Zhan, D., et al., 2011. Hunting or waiting? Discovering passenger-finding strategies from a large-scale real-world taxi dataset. IEEE International Conference on Pervasive Computing and Communications Workshops, PerComW, 63-68.
Powell, J. W., Huang, Y., et al., 2011. Towards Reducing Taxicab Cruising Time Using Spatio-Temporal Profitability Maps. Proceedings of International Symposium on Advances in Spatial and Temporal Databases, SSTD, 242-260.
Qi, G., Li, X., et al, 2011. Measuring social functions of city regions from large-scale taxi behaviors. IEEE International Conference on Pervasive Computing and Communications Workshops, PerComW, 384-388.
Richter, K.-F., Schmid, F. and Laube P., 2012. Semantic trajectory compression: Representing urban movement in a nutshell. Journal of Spatial Information Science (4).
Uddin, M.R. and Ravishankar, C. and Tsotras, V.J., 2011. Finding Regions of Interest from Trajectory Data. Proceedings of IEEE International Conference on Mobile Data Management, MDM, 39-48.
Wei, L.-Y., Zheng, Y., Peng, W-C, 2012. Constructing popular routes from uncertain trajectories. Proceedings of the ACM International Conference on Knowledge Discovery and Data Mining, KDD, 195-203.
Yan, Z., Chakraborty, D., et al., 2011. SeMiTri: a framework for semantic annotation of heterogeneous trajectories. Proceedings the International Conference on Extending Database Technology, EDBT, 259-270
Yuan, J., Zheng, Y. and Xie. X, 2012. Discovering regions of different functions in a city using human mobility and POIs. Proceedings of ACM International Conference on Knowledge Discovery and Data Mining, KDD, 186-194.
Yuan,J., Zheng,Y., et al., 2011a, Driving with knowledge from the physical world. Proceedings of the ACM International conference on Knowledge discovery and data mining, KDD, 316-324
Yuan, J., Zheng, Y., et al., 2011b. Where to find my next passenger. Proceedings of the 13th international conference on Ubiquitous computing, UbiComp, 109-118.
Yuan, J., Zheng, Y., et al., 2010. T-drive: driving directions based on taxi trajectories. Proceedings of the ACM International Conference on Advances in Geographic Information Systems, ACM-GIS, 99-108.
Zhang, D., Li, N., et al., 2011. iBAT: detecting anomalous taxi trajectories from GPS traces. Proceedings of the 13th international conference on Ubiquitous computing, UbiComp, 99-108.
Zhang, J., Camille, K. et al., 2012. U2SOD-DB: a database system to manage large-scale Ubiquitous Urban Sensing Origin-Destination Data. Proceedings of the 1st International workshop on Urban Computing, UrbComp,163-171.
Zhang, J. 2012. Smarter outlier detection and deeper understanding of large-scale taxi trip records: a case study of NYC. Proceedings of the 1st International workshop on Urban Computing, UrbComp, 157-162.
Zheng, Y., Liu, Y., et al., 2011. Urban computing with taxicabs. Proceedings of the 13th international conference on Ubiquitous computing, UbiComp, 89-98.
Zheng, Y. and Zhou, X., 2011. Computing with Spatial Trajectories. Springer. Ziebart, Brian D., et al., 2008. Navigate like a cabbie: probabilistic reasoning from observed
context-aware behavior. Proceedings of the 10th international conference on Ubiquitous computing, UbiComp, 322-331
i http://www.borgelt.net/sequoia.html ii http://project-osrm.org/ iii http://postgis.net/ iv http://en.wikipedia.org/wiki/Shapefile v http://www.esri.com/software/arcgis vi http://www.mta.info/nyct/facts/ridership/ vii http://en.wikipedia.org/wiki/LaGuardia_Airport viii http://research.microsoft.com/apps/pubs/?id=152883