effects of seasonal/monthly variation on runoff curve ... · effects of seasonal/monthly variation...
TRANSCRIPT

INTERNATIONAL JOURNAL OF ENVIRONMENTAL SCIENCES Volume 3, No 6, 2013
© Copyright by the authors - Licensee IPA- Under Creative Commons license 3.0
Research article ISSN 0976 – 4402
Received on March 2013 Published on June 2013 2019
Effects of Seasonal/Monthly Variation on Runoff Curve Number for
Selected Watersheds of Narmada Basin
Sarita Gajbhiye1, S.K. Mishra
1, Ashish Pandey
1
1- Department of Water Resources Development and Management, Indian Institute of
Technology Roorkee, Roorkee, U.K., India
doi: 10.6088/ijes.2013030600021
ABSTRACT
This study examined seasonal and monthly effects on the runoff Curve Number for four
watersheds of Narmada basin. The periods between April-June and October-December were
defined as the Pre-Monsoon and Post-Monsoon seasons, respectively. The Curve Number
method was used to determine Curve Numbers using these observed rainfall and runoff
values. Based on the date that rainfall and runoff volume were observed, the Curve Number
values were grouped to their respective seasons for statistical analysis. The results from all
watersheds showed monthly Curve number indicates a homogeneous pattern of variation in
all the four watersheds in the basin. The monthly curve number has peak (during July) and
valley (during August). However, at Shakkar watershed the peak is during August instead of
July in other watersheds. The maximum monthly curve number is recorded during the month
of September with the average value of 97.96 in Mohgaon watershed and the minimum
Curve Number is recorded during the month of September with the average value of 17.88 in
Bamhani watershed. Pre-monsoon contributes the major portion of the curve number with the
average value range 25.70-27.76% for all watersheds. However, Post-monsoon curve number
is almost negligible in Bamhani watershed (3.46 %). The average maximum and minimum
curve number is 97.43 and 95.74 for Manot and Bamhani watershed respectively. Because
the Cultivated lands to exhibit higher CN values than Forest land.
Keywords: Runoff Curve Number, CN variation, NEH-630, seasonal effect.
1. Introduction
The Soil Conservation Service (SCS) Curve Number (CN) method has gained general
acceptance in the engineering practice due to its simplicity in estimating storm water runoff
depth from rainfall depth and its endorsement by the United States Department of Agriculture
(USDA). Originally developed from daily rainfall data from small agricultural watersheds in
the Midwestern United States (Mockus 1949; Rallison 1980), this method was first
introduced 1954 (NRCS, 2001). the CN method continues to be updated and amended with
increasing data and research (Mishra and Singh 1999; Jain et al. 2006), as well as innovative
applications such as water quality modelling (Mishra and Singh 2003) and continuous
simulations (Williams and LaSeur 1976; Hawkins 1978; Arnold et al. 1990; Mishra and
Singh 2004; and others). Many researchers have demonstrated from rainfall and runoff data
that its key parameter CN has variable components and is not a constant for a watershed
(Hjelmfelt et al. 1982; McCuen 2002), and varies with rainfall. In many parts of the country
rainfall distribution is very uneven so this uneven distribution should also be considered
while determining CN. More than 80% of the annual rainfall occurs during the monsoon
Effects of Seasonal/Monthly Variation on Runoff Curve Number for Selected Watersheds of Narmada Basin
Sarita Gajbhiye, S.K. Mishra, Ashish Pandey
International Journal of Environmental Sciences Volume 3 No.6, 2013 2020
periods in Upper Narmada basin of Madhya Pradesh. Moreover, intensity of monsoon rainfall
is very uneven both in space and time, resulting in scarcity of availability of water in some
parts of the region during non monsoon periods. Thus, it is essential to analyse the variation
of curve number during various seasons.
In general, variation in CN between events can result from variations in storm
characteristics and surface conditions. Much of the variability in CN has been attributed to
antecedent runoff content (ARC) such that soils that are wetter have a higher curve number,
creating more runoff for a given amount of precipitation, than soils that are drier (Huang et
al., 2007; Shaw and Walter, 2009).A parameter that includes the effect of seasonal variation
on forecasting runoff volume has not been incorporated in the Curve Number method and as
a result ignores the impact of seasonal and monthly variation on evaporation, transpiration
and interception. Although the Curve Number method is well documented and widely used,
as Jacobs and Srinivasan (2005) pointed out, a need to use the method as a guideline and
interpret inputs on a more local and regional level combined with seasonal variation is
essential. Runoff simulation with annually consistent parameters has limited application
because watershed response varies remarkably from season to season (Paik et al. 2005). The
seasonal tank model developed by Paik et al. (2005) showed better performance compared to
the non seasonal tank model because it can successfully simulate runoff with little error.
Varying the Curve Number on a seasonal and monthly basis, therefore, may also
result in more accurate runoff estimation and improve the Curve Number performance. Some
of the previous works carried out in the seasonal variation of CN at various locations.
However, detailed study on the seasonal and monthly variation and distribution of CN in
Narmada sub-basin has not been included. So it is necessary to analyse the effect of seasonal
and monthly variation on the Curve Number for selected watersheds of Narmada basin based
on observed rainfall and runoff volume data.
THEORY: Estimation of runoff depth (Q) from rainfall depth (P) using the Curve Number
method is well established in hydrologic and environmental impact analyses for urban and
agricultural land use (Ponce and Hawkins, 1996; Schneider and McCuen, 2005; Garen and
Moore, 2005; and Michel et al. 2005; McCutcheon et al. 2006). The method can be based on
the water balance equation (1) and two other equations (2) and (3).
(1)
(2)
(3)
Where Ia is the initial abstraction (rainfall intercepted by vegetation, litter, and ground
surface expressions); F is the cumulative retention; λ is the initial abstraction ratio or
coefficient; and S is the maximum retention capacity.
As the method is practiced today, Q can be computed with the CN based on the land use and
hydrologic soil group, and rainfall depth by combining equations (1) and (2) as:
Effects of Seasonal/Monthly Variation on Runoff Curve Number for Selected Watersheds of Narmada Basin
Sarita Gajbhiye, S.K. Mishra, Ashish Pandey
International Journal of Environmental Sciences Volume 3 No.6, 2013 2021
(4)
Equation (4) is valid for P > Ia and Q = 0 otherwise. With the initial abstraction included in
equation (4), the actual retention P – Q asymptotically approaches a constant value of S + Ia
as the rainfall increases unbounded. Using the value of λ = 0.2, equation (4) becomes
For P > 0.2S
For P > 0.2S (5)
Equation (5) is subject to P > 0.2S and Q = 0 otherwise. Equation (4) now contains only one
parameter (potential retention, S), which ranges between 0 to . For convenience in practical
applications, S is defined in terms of a dimensionless parameter, CN (Curve Number), which
varies in a more restricted range 0-100.
(6)
CN = 100 represents a condition of zero potential retention (S = 0), that is an impermeable
watershed. Conversely, CN = 0 a theoretical upper bound to the potential retention (S = ),
which is an infinitely abstracting watershed. If an event rainfall depth and the CN of a
watershed are known, the runoff volume can easily be determined using equation (5) and (6).
The potential maximum retention (S) for each of the maximum annual storm volume Q, and
the rainfall volume P will be computed using
(7)
This equation is an algebraic rearrangement of the runoff equation (5). For gauged
watersheds where both rainfall and runoff volumes are known the Curve Number values can
be determined using equations (6) and (7).
2. Methodology
The study watersheds include four watersheds of Narmada basin. Table (1) summarizes the
selected watersheds. Monthly rainfall and runoff data for the period of ten years (1999
2009) has been collected from the Central Water Commission (CWC, Bhopal). A pair of
annual maximum rainfall-runoff volume was selected for each year based on the (C = Q/P) <
1. Sort the remaining P-Q data in the descending order of P and assign the probability to P
using Weibull’s plotting position formula and calculate CN using Eq. 6 and 7, sort the CN in
descending order and Describe CN for 10%, 50%, and 90% probability of exceedances (PE)
as to correspond to wet, normal, and dry conditions, respectively. Since these values are
estimate from daily filtered P-Q data, the estimates CN-values correspond to 1-d rain duration.
The collected rainfall data has been categorized into four major seasons as listed in Table 1.
Finally, the data has been interpreted by preparing various charts and diagrams using
software packages.

Effects of Seasonal/Monthly Variation on Runoff Curve Number for Selected Watersheds of Narmada Basin
Sarita Gajbhiye, S.K. Mishra, Ashish Pandey
International Journal of Environmental Sciences Volume 3 No.6, 2013 2022
Table - 1: Monsoon seasons and corresponding months
S.No Season Months
1 Pre-Monsoon April, May and June
2 Post- Monsoon October, November and December
3 Rainy (Monsoon) July, August, September and October
4 Summer March, April, May and June
5 Winter November, December, January and February
3. Study Area
Bamhani catchment- River Banjar is a tributary of River Narmada and its catchment is
geographically located in Mandla district between 21o65’55”N and 22
o29’00”N Latitudes and
80 o
22’00”E and 81o00’00”E longitudes. The watershed covers 2542 sq.km area. It is
situated in the eastern part of Madhya Pradesh. The climate of Mandla district is
characterized by a hot summer and general dryness except during the south-west monsoon
season. Climate of the basin can be classified as sub-tropical sub-humid with average annual
rainfall of 1,178 mm. About 90% of the annual rainfall is received during monsoon season
(June–October). The estimates of evapotranspiration vary from 4 mm/day in winter to 10
mm/day in summer. The area comprises of both flat and undulating lands covered with
timber, grasses, and cultivated land. Soils vary from black to mixed red soils. Nearly 65% of
the catchment area is covered with forest. Agricultural crops are grown in 29% area, and the
remaining area comes under degraded lands and water bodies. Soils of the area are
characterized by black grey, red, and yellow colours, often mixed with red and black
alluvium and ferruginous red ravel or lateritic soils. These soils are commonly known as
black soils.
Manot catchment-The Narmada catchment up to Manot lies between north latitudes 22°26′
to 23°18′ and east longitudes 80°24′ to 81°47′. The length of the river Narmada from its
origin up to Manot is about 269 km with the drainage area of 4884 km2. The catchment is
covered by forest and its topography is hilly. Its elevation ranges from 450 m near Manot site
to 1,110 m in the upper part of the catchment. It has continental type of climate classified as
sub-tropical and sub-humid with average annual rainfall of 1,596 mm. It is very hot in
summer and cold in winter. In the major part of the catchment, soils are red, yellow, and
medium black with shallow to very shallow depth. In some small pockets of plain land, soils
are moderately deep dark grayish clay. Approximately 52% of catchment area is under
cultivation, about 35% under forest, and 13% under wasteland.
Mohgaon catchment-The Burhner River rises in the Maikala range, south–east of Gwara
village in the Mandla district of Madhya Pradesh at an elevation of about 900 m at north
latitude 22° 32′ and east longitude 81° 22′. It flows in westerly direction for a total length of
177 km to join the Narmada near Manot. Its catchment area up to Mohegoan is about 3978
km2. The elevation at Mohegoan gauging site drops to 509 m. Climate of the basin can be
classified as sub-tropical and sub humid with average annual rainfall of 1,547 mm. The
evapotranspiration varies from 4 mm day in winter to 10 mm/day in summer. The catchment
area comprises both flat and undulating lands covered with forest and cultivated lands. Soils
are mainly red and yellow silty loam and silty clay loam. Forest and agricultural lands share
nearly 58 and 42% of the catchment area, respectively.
Effects of Seasonal/Monthly Variation on Runoff Curve Number for Selected Watersheds of Narmada Basin
Sarita Gajbhiye, S.K. Mishra, Ashish Pandey
International Journal of Environmental Sciences Volume 3 No.6, 2013 2023
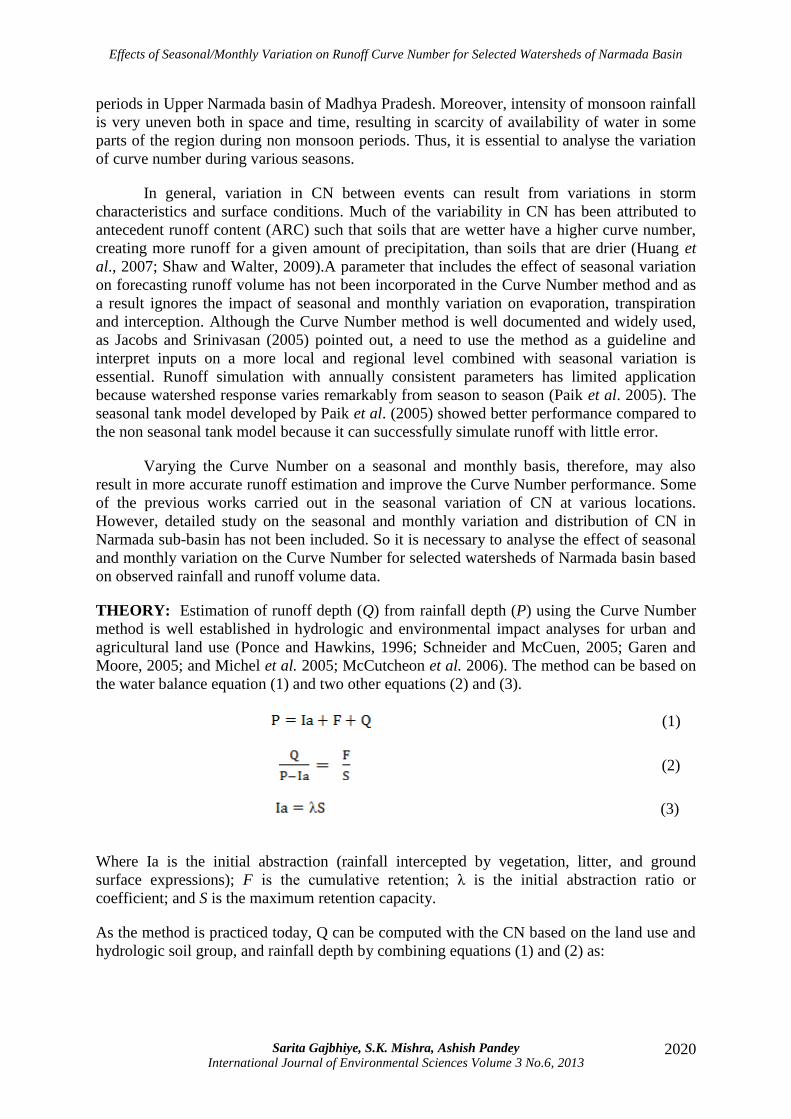
Shakkar catchment-The Shakkar river rises in the Satpura range, east of the Chhindi village,
Chhindwara district, Madhya Pradesh an elevation of about 600 m at latitude 22°23′ N
longitude 78°52′ E. The watershed covers 2220 km2 area. The climate of the basin is
generally dry except the southwest monsoon season. The southwest monsoon starts from
middle of June and lasts till end of September. October and middle of November constitute
the post monsoon or retreating monsoon season. The normal annual rainfall is 1192.1mm.
The normal maximum temperature received during the month of May is 42.50
C and
minimum during the month of January is 8.20
C. Soils are mainly clayey to loamy in texture
with calcareous concretions invariably present They are sticky and in summer, due to
shrinkage, develop deep cracks. They generally predominate in montmorillonite and
beidellite type of clays .In rest of alluvial areas , mixed clays , black to brown to reddish
brown, derived from sandstones and traps is observed which is sandy clay in nature with
calcareous concretions. Near the banks of the rivers and at the confluence, light yellow to
yellowish brown soils are noticed which were deposited during the recent past. These soils
are clayey to silt in nature.The location map of the study area is shown in Fig 1.
Fig. 1: Location map of the study area
4. Results and discussion
4.1 Monthly Variation of Curve Number
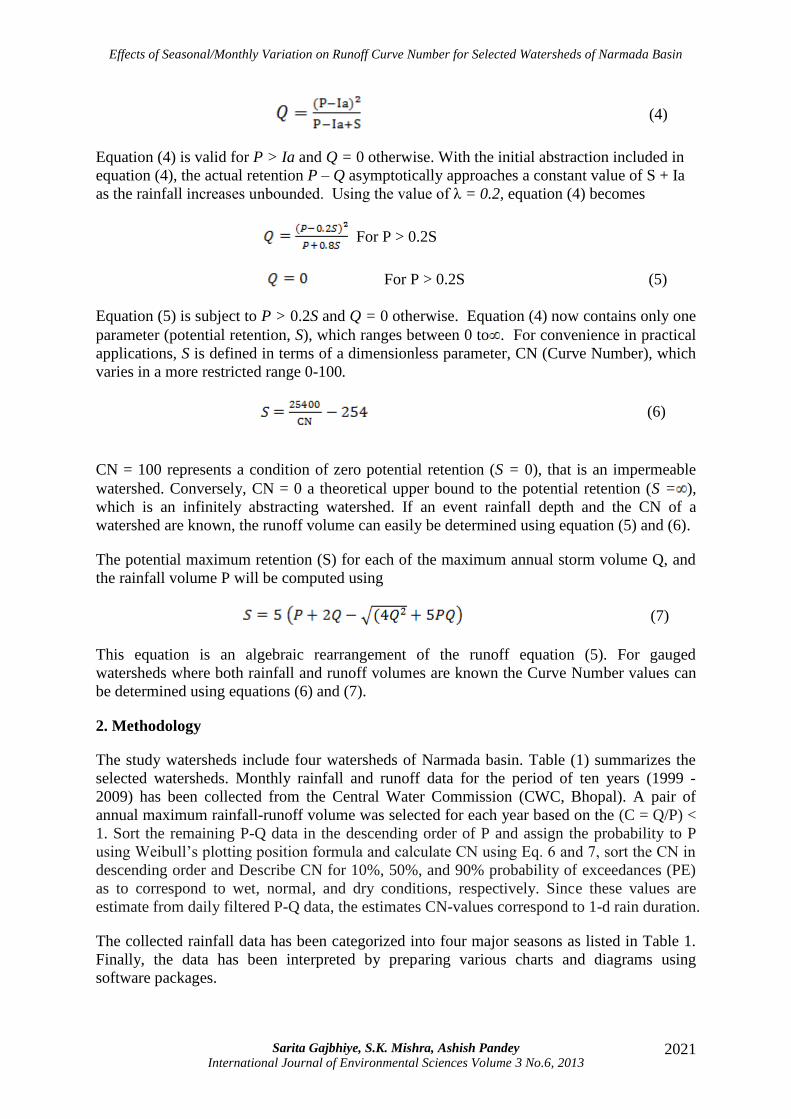
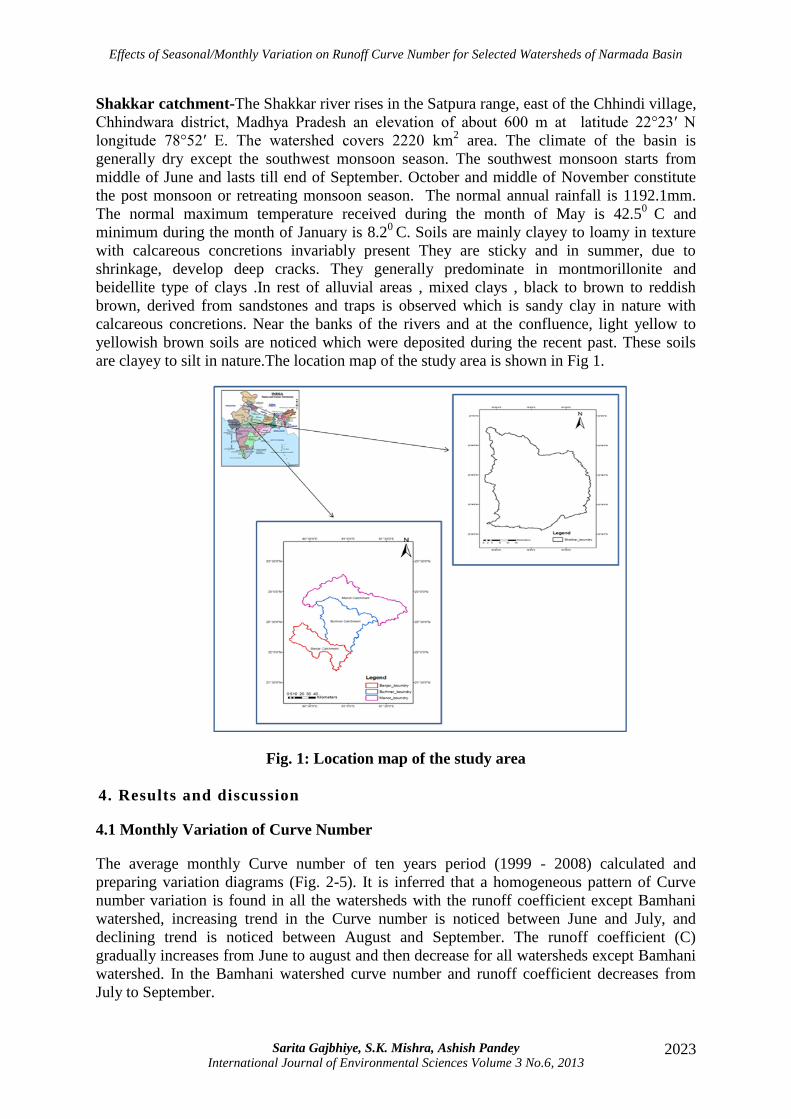
The average monthly Curve number of ten years period (1999 - 2008) calculated and
preparing variation diagrams (Fig. 2-5). It is inferred that a homogeneous pattern of Curve
number variation is found in all the watersheds with the runoff coefficient except Bamhani
watershed, increasing trend in the Curve number is noticed between June and July, and
declining trend is noticed between August and September. The runoff coefficient (C)
gradually increases from June to august and then decrease for all watersheds except Bamhani
watershed. In the Bamhani watershed curve number and runoff coefficient decreases from
July to September.
Effects of Seasonal/Monthly Variation on Runoff Curve Number for Selected Watersheds of Narmada Basin
Sarita Gajbhiye, S.K. Mishra, Ashish Pandey
International Journal of Environmental Sciences Volume 3 No.6, 2013 2024
Fig. 2: Monthly variation of CN (Bamhani
Watershed)
Fig. 3: Monthly variation of CN (Manot
Watershed)
Fig. 4: Monthly variation of CN (Mohgaon
Watershed)
Fig. 5: Monthly variation of CN (Shakkar
Watershed)
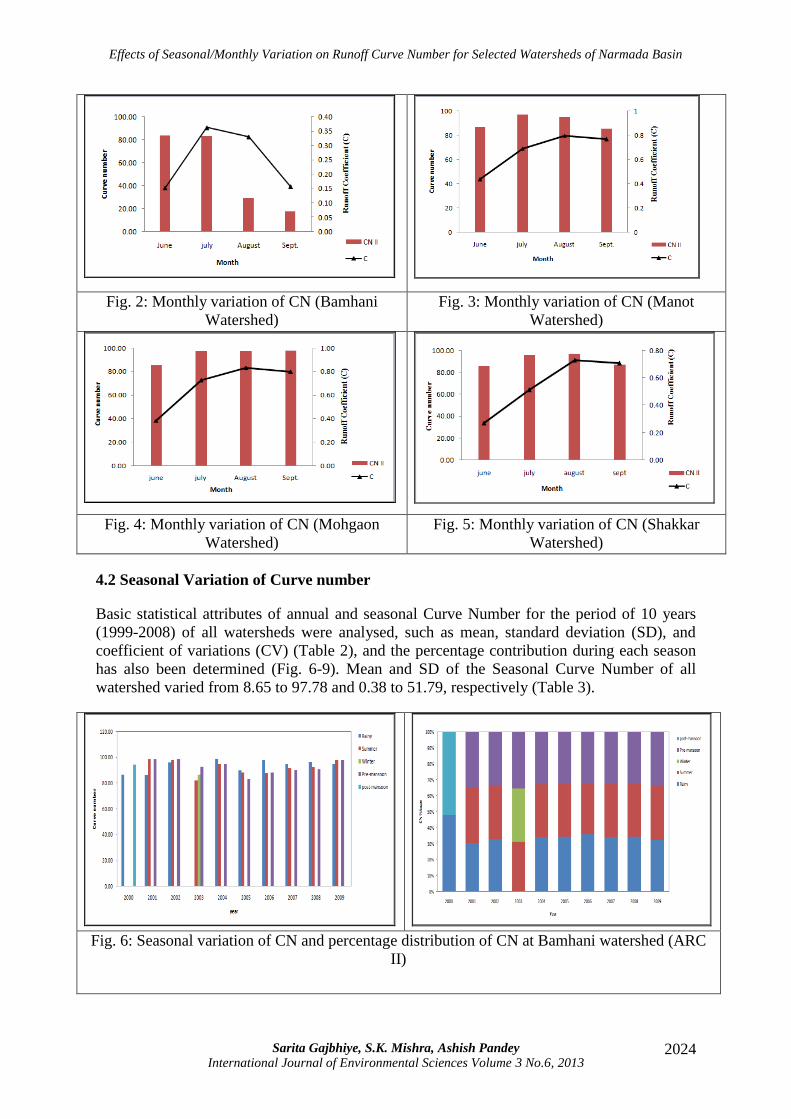
4.2 Seasonal Variation of Curve number
Basic statistical attributes of annual and seasonal Curve Number for the period of 10 years
(1999-2008) of all watersheds were analysed, such as mean, standard deviation (SD), and
coefficient of variations (CV) (Table 2), and the percentage contribution during each season
has also been determined (Fig. 6-9). Mean and SD of the Seasonal Curve Number of all
watershed varied from 8.65 to 97.78 and 0.38 to 51.79, respectively (Table 3).
Fig. 6: Seasonal variation of CN and percentage distribution of CN at Bamhani watershed (ARC
II)
Effects of Seasonal/Monthly Variation on Runoff Curve Number for Selected Watersheds of Narmada Basin
Sarita Gajbhiye, S.K. Mishra, Ashish Pandey
International Journal of Environmental Sciences Volume 3 No.6, 2013 2025
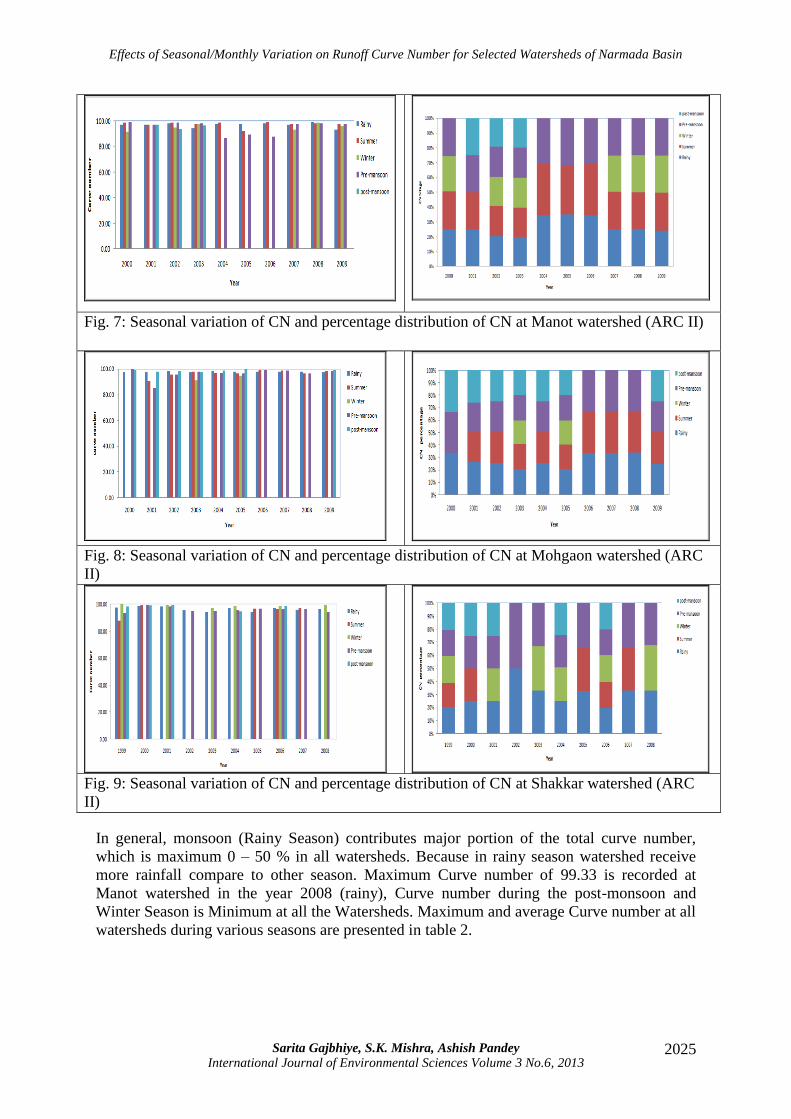
Fig. 7: Seasonal variation of CN and percentage distribution of CN at Manot watershed (ARC II)
Fig. 8: Seasonal variation of CN and percentage distribution of CN at Mohgaon watershed (ARC
II)
Fig. 9: Seasonal variation of CN and percentage distribution of CN at Shakkar watershed (ARC
II)
In general, monsoon (Rainy Season) contributes major portion of the total curve number,
which is maximum 0 – 50 % in all watersheds. Because in rainy season watershed receive
more rainfall compare to other season. Maximum Curve number of 99.33 is recorded at
Manot watershed in the year 2008 (rainy), Curve number during the post-monsoon and
Winter Season is Minimum at all the Watersheds. Maximum and average Curve number at all
watersheds during various seasons are presented in table 2.
Effects of Seasonal/Monthly Variation on Runoff Curve Number for Selected Watersheds of Narmada Basin
Sarita Gajbhiye, S.K. Mishra, Ashish Pandey
International Journal of Environmental Sciences Volume 3 No.6, 2013 2026
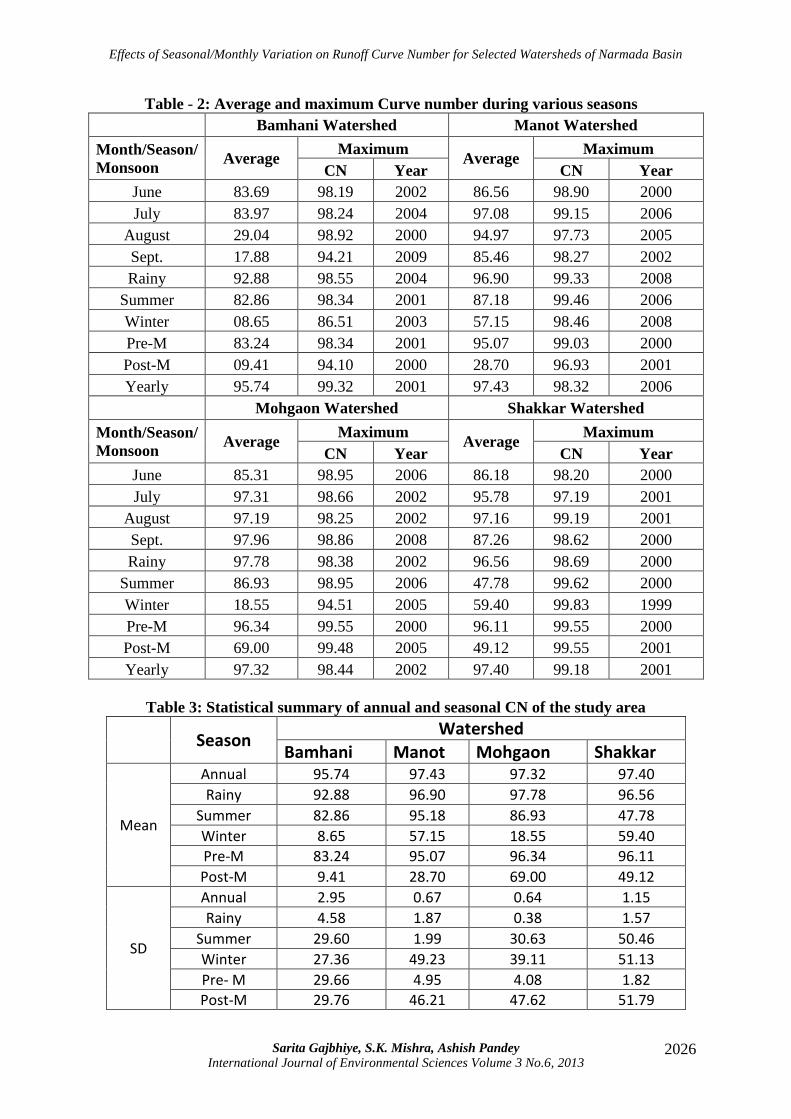
Table - 2: Average and maximum Curve number during various seasons
Bamhani Watershed Manot Watershed
Month/Season/
Monsoon Average
Maximum Average
Maximum
CN Year CN Year
June 83.69 98.19 2002 86.56 98.90 2000
July 83.97 98.24 2004 97.08 99.15 2006
August 29.04 98.92 2000 94.97 97.73 2005
Sept. 17.88 94.21 2009 85.46 98.27 2002
Rainy 92.88 98.55 2004 96.90 99.33 2008
Summer 82.86 98.34 2001 87.18 99.46 2006
Winter 08.65 86.51 2003 57.15 98.46 2008
Pre-M 83.24 98.34 2001 95.07 99.03 2000
Post-M 09.41 94.10 2000 28.70 96.93 2001
Yearly 95.74 99.32 2001 97.43 98.32 2006
Mohgaon Watershed Shakkar Watershed
Month/Season/
Monsoon Average
Maximum Average
Maximum
CN Year CN Year
June 85.31 98.95 2006 86.18 98.20 2000
July 97.31 98.66 2002 95.78 97.19 2001
August 97.19 98.25 2002 97.16 99.19 2001
Sept. 97.96 98.86 2008 87.26 98.62 2000
Rainy 97.78 98.38 2002 96.56 98.69 2000
Summer 86.93 98.95 2006 47.78 99.62 2000
Winter 18.55 94.51 2005 59.40 99.83 1999
Pre-M 96.34 99.55 2000 96.11 99.55 2000
Post-M 69.00 99.48 2005 49.12 99.55 2001
Yearly 97.32 98.44 2002 97.40 99.18 2001
Table 3: Statistical summary of annual and seasonal CN of the study area
Season
Watershed
Bamhani Manot Mohgaon Shakkar
Mean
Annual 95.74 97.43 97.32 97.40
Rainy 92.88 96.90 97.78 96.56
Summer 82.86 95.18 86.93 47.78
Winter 8.65 57.15 18.55 59.40
Pre-M 83.24 95.07 96.34 96.11
Post-M 9.41 28.70 69.00 49.12
SD
Annual 2.95 0.67 0.64 1.15
Rainy 4.58 1.87 0.38 1.57
Summer 29.60 1.99 30.63 50.46
Winter 27.36 49.23 39.11 51.13
Pre- M 29.66 4.95 4.08 1.82
Post-M 29.76 46.21 47.62 51.79
Effects of Seasonal/Monthly Variation on Runoff Curve Number for Selected Watersheds of Narmada Basin
Sarita Gajbhiye, S.K. Mishra, Ashish Pandey
International Journal of Environmental Sciences Volume 3 No.6, 2013 2027
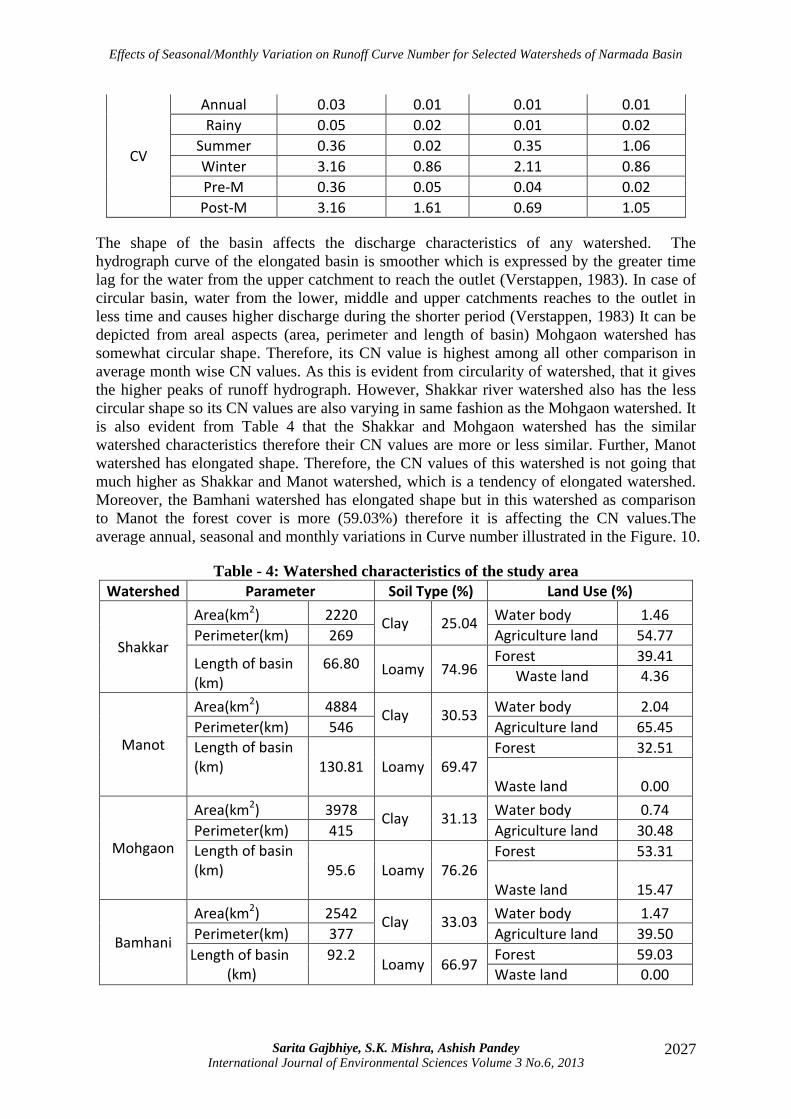
CV
Annual 0.03 0.01 0.01 0.01
Rainy 0.05 0.02 0.01 0.02
Summer 0.36 0.02 0.35 1.06
Winter 3.16 0.86 2.11 0.86
Pre-M 0.36 0.05 0.04 0.02
Post-M 3.16 1.61 0.69 1.05
The shape of the basin affects the discharge characteristics of any watershed. The
hydrograph curve of the elongated basin is smoother which is expressed by the greater time
lag for the water from the upper catchment to reach the outlet (Verstappen, 1983). In case of
circular basin, water from the lower, middle and upper catchments reaches to the outlet in
less time and causes higher discharge during the shorter period (Verstappen, 1983) It can be
depicted from areal aspects (area, perimeter and length of basin) Mohgaon watershed has
somewhat circular shape. Therefore, its CN value is highest among all other comparison in
average month wise CN values. As this is evident from circularity of watershed, that it gives
the higher peaks of runoff hydrograph. However, Shakkar river watershed also has the less
circular shape so its CN values are also varying in same fashion as the Mohgaon watershed. It
is also evident from Table 4 that the Shakkar and Mohgaon watershed has the similar
watershed characteristics therefore their CN values are more or less similar. Further, Manot
watershed has elongated shape. Therefore, the CN values of this watershed is not going that
much higher as Shakkar and Manot watershed, which is a tendency of elongated watershed.
Moreover, the Bamhani watershed has elongated shape but in this watershed as comparison
to Manot the forest cover is more (59.03%) therefore it is affecting the CN values.The
average annual, seasonal and monthly variations in Curve number illustrated in the Figure. 10.
Table - 4: Watershed characteristics of the study area
Watershed Parameter Soil Type (%) Land Use (%)
Shakkar
Area(km2) 2220 Clay 25.04
Water body 1.46
Perimeter(km) 269 Agriculture land 54.77
Length of basin (km)
66.80
Loamy 74.96 Forest 39.41
Waste land 4.36
Manot
Area(km2) 4884 Clay 30.53
Water body 2.04
Perimeter(km) 546 Agriculture land 65.45
Length of basin (km)
130.81
Loamy 69.47 Forest 32.51
Waste land 0.00
Mohgaon
Area(km2) 3978 Clay 31.13
Water body 0.74
Perimeter(km) 415 Agriculture land 30.48
Length of basin (km)
95.6
Loamy 76.26 Forest 53.31
Waste land 15.47
Bamhani
Area(km2) 2542 Clay 33.03
Water body 1.47
Perimeter(km) 377 Agriculture land 39.50
Length of basin (km)
92.2
Loamy 66.97 Forest 59.03
Waste land 0.00
Effects of Seasonal/Monthly Variation on Runoff Curve Number for Selected Watersheds of Narmada Basin
Sarita Gajbhiye, S.K. Mishra, Ashish Pandey
International Journal of Environmental Sciences Volume 3 No.6, 2013 2028
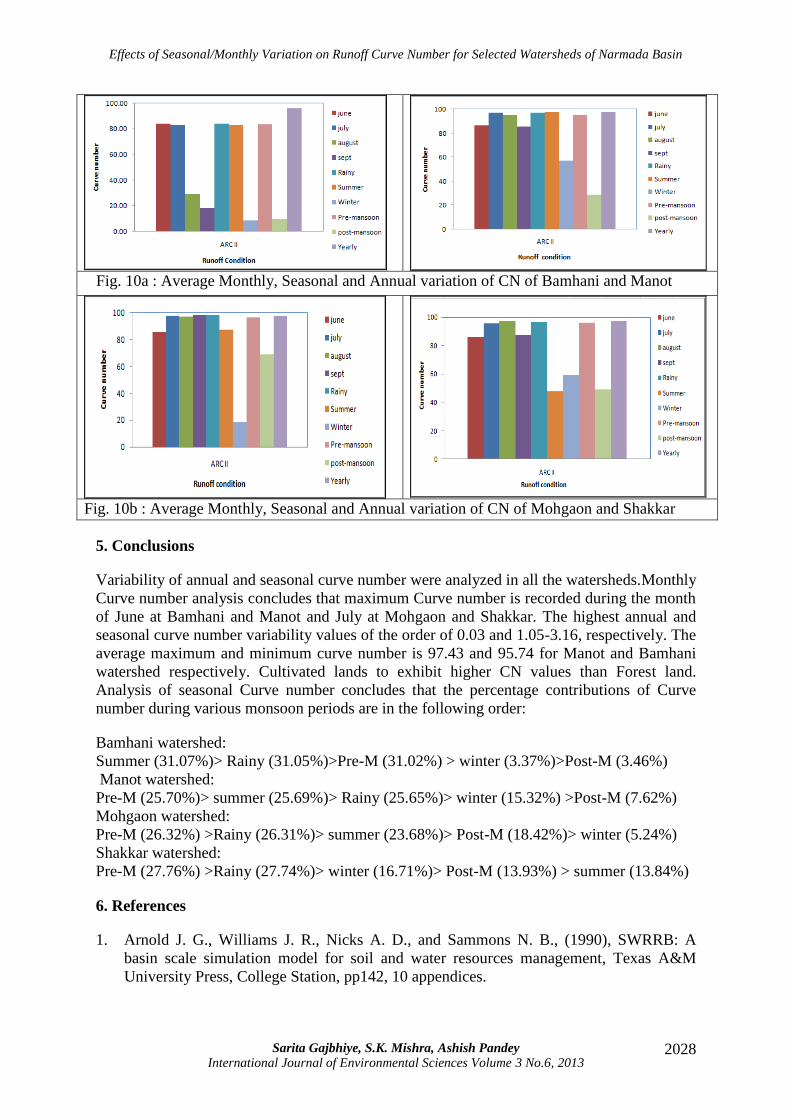
Fig. 10a : Average Monthly, Seasonal and Annual variation of CN of Bamhani and Manot
Fig. 10b : Average Monthly, Seasonal and Annual variation of CN of Mohgaon and Shakkar
5. Conclusions
Variability of annual and seasonal curve number were analyzed in all the watersheds.Monthly
Curve number analysis concludes that maximum Curve number is recorded during the month
of June at Bamhani and Manot and July at Mohgaon and Shakkar. The highest annual and
seasonal curve number variability values of the order of 0.03 and 1.05-3.16, respectively. The
average maximum and minimum curve number is 97.43 and 95.74 for Manot and Bamhani
watershed respectively. Cultivated lands to exhibit higher CN values than Forest land.
Analysis of seasonal Curve number concludes that the percentage contributions of Curve
number during various monsoon periods are in the following order:
Bamhani watershed:
Summer (31.07%)> Rainy (31.05%)>Pre-M (31.02%) > winter (3.37%)>Post-M (3.46%)
Manot watershed:
Pre-M (25.70%)> summer (25.69%)> Rainy (25.65%)> winter (15.32%) >Post-M (7.62%)
Mohgaon watershed:
Pre-M (26.32%) >Rainy (26.31%)> summer (23.68%)> Post-M (18.42%)> winter (5.24%)
Shakkar watershed:
Pre-M (27.76%) >Rainy (27.74%)> winter (16.71%)> Post-M (13.93%) > summer (13.84%)
6. References
1. Arnold J. G., Williams J. R., Nicks A. D., and Sammons N. B., (1990), SWRRB: A
basin scale simulation model for soil and water resources management, Texas A&M
University Press, College Station, pp142, 10 appendices.
Effects of Seasonal/Monthly Variation on Runoff Curve Number for Selected Watersheds of Narmada Basin
Sarita Gajbhiye, S.K. Mishra, Ashish Pandey
International Journal of Environmental Sciences Volume 3 No.6, 2013 2029
2. Garen, David C., Daniel S. Moore, (2005), Curve Number Hydrology in Water Quality
Modelling: Uses, Abuses, and Future Directions. Journal of the American Water
Resources Association, 41(2), pp 377-388.
3. Hawkins R. H., (1973), Improved prediction of storm runoff from mountain watershed,
Irrigation and Drainage Division., ASCE, 99 (4), pp 519-523.
4. Hawkins R. H., (1978), Runoff curve numbers with varying site moisture, Journal of
Irrigation and Drainage Division, 104 (4), pp 389–398.
5. Hjelmfelt A. T., (1980), Empirical Investigation of curve number technique Journal of
Hydrologic Division, ASCE, 106(9), pp 1471-1477.
6. Hjelmfelt A. T., Jr., Kramer L. A., and Burwell R. E., (1982), Curve numbers as random
variables. Proc. Int. Symposium on Rainfall-Runoff Modeling, Water Resources
Publishers, Littleton, Colo., pp 365–373.
7. Jacobs J.H. and Srinivasan R., (2005), Effects of Curve Number modification on runoff
estimation using WSR-88D rainfall data in Texas watersheds, Journal of Soil and Water
Conservation, 60 (5), pp 274-278.
8. Jain M. K., Mishra S. K., Babu P. S., Venugopal K., and Singh V. P., (2006), “Enhanced
Runoff Curve Number Model Incorporating Storm Duration and a Nonlinear I a -S
Relation.” Journal of Hydrologic Engineering, 11(6), pp 631-635.
9. Mingbin Huang, Jacques Gallichand, Cuiyun Dong, Zhanli Wang, (2007), Use of soil
moisture data and curve number method for estimating runoff in the Loess Plateau of
China, Hydrological Processes, 21, pp 1471-1481.
10. McCutcheon S.C., Tedela N.H., Adams M.B., Swank W., Campbell J.L., Hawkins R.H.,
Dye C.R., (2006), Rainfall-Runoff Relationships for Selected Eastern U.S. Forested
Mountain Watersheds: Testing of the Curve Number Method for Flood Analysis, Report
prepared for the West Virginia Division of Forestry, Charleston, West Virginia.
11. Michel C., Andreessen V., Perrin C., (2005), Soil Conservation Service Curve Number
method: How to mend a wrong soil moisture accounting procedure? Water Resources
Research, 41(W02011): pp 1-6.
12. McCuen R. H., (2002), Approach to Confidence Interval Estimation for Curve Numbers,
Journal of Hydrologic Engineering, 7(1), pp 43-48.
13. Mishra S. K. and Singh V. P. (1999). “Another look at SCS-CN method.” Journal of
Hydrologic Engineering, ASCE 4(3), Paper 5120, 257-264. (July)
14. Mishra S. K., and Singh V. P., (2003), Soil conservation service curve number (SCS-CN)
methodology, Kluwer Academic, Dordrecht, The Netherlands, ISBN 1-4020-1132-6.
15. Mishra S. K., and Singh V. P., (2004), Long-term hydrologic simulation based on Soil
Conservation Service curve number.” Hydrologic Processes 18, pp 121 -131.
Effects of Seasonal/Monthly Variation on Runoff Curve Number for Selected Watersheds of Narmada Basin
Sarita Gajbhiye, S.K. Mishra, Ashish Pandey
International Journal of Environmental Sciences Volume 3 No.6, 2013 2030
16. Mockus V., (1949), Estimation of total (peak rates of) surface runoff for individual
storms, Exhibit A of Appendix B, Interim Survey Rep. Grand (Neosho) River
Watershed, USDA, Washington, D.C.
17. NRCS, National Engineering Handbook, (2001), “Section-4 Hydrology” Soil
Conservation Service, USDA, Washington, DC.
18. Plummer A., and Woodward D. E., (2002), The origin and derivation of Ia /S in the
runoff curve number system.
19. Paik K, Kim J. H., Kim H. S., Lee D. R., (2005), A conceptual rainfall-runoff model
considering seasonal Variation, Hydrological Procesess, 19, pp 3837–3850.
20. Ponce V.M., Hawkins R.H., (1996), Runoff Curve Number: Has it Reached Maturity?
Journal of Hydrologic Engineering, 1(1), pp 11-19.
21. Rallison R. E., (1980), Origin and evolution of the SCS runoff equation, Proc., ASCE
Irrigation And Drainage Division Symposium On Watershed Mgmt., ASCE, New York,
N.Y., Vol. II, pp 912-924.
22. Rallison R. E., and Cronshey R. C., (1979), Discussion of runoff curve number with
varying site moisture, by Richard H. Hawkins Journal of Irrigation and Drainage
Engineering, 105(IR4), 439 – 441.
23. Schneider L.E., McCuen R. H., (2005), Statistical guideline for Curve Number
Generation, Journal of Irrigation and Drainage Engineering, 131(3), pp 282-290.
24. Shaw S.B. and Walter M.T., (2009), Estimating storm runoff risk using bivariate
frequency analyses of rainfall and antecedent watershed wetness, Water Resources
Research. 45: W03404 [doi: 10.1029/2008WR006900].
25. USDA, NRCS (2009), National Engineering Handbook, Part 630, Chapter 9, Hydrologic
Soil Cover Complexes, USDA, NRCS, Washington, D.C.
26. Verstappen H.Th., (1983), Applied Geomorphology- Geomorphology Surveys for
Environmental Development. Elsevier Science Publishers B.V. Amsterdam, the
Netherland, pp 66-71.
27. Williams J. D., and LaSeur W. V., (1976), Water yield model using SCS curve numbers,
Journal of the Hydraulics Division, Americans Society of Civil Engineers 102(HY9),
1241 -1253 (September).