effects of predation risk on elk (cervus elaphus...
TRANSCRIPT

ARTICLE
Effects of predation risk on elk (Cervus elaphus) landscape use ina wolf (Canis lupus) dominated systemCristina Eisenberg, David E. Hibbs, and William J. Ripple
Abstract: Food acquisition and predation avoidance are key drivers of herbivore behaviour. We investigated the interaction oftop-down (predator) and bottom-up (food, fire, thermal) effects by measuring the relationship between wolf (Canis lupus L., 1758)predation risk perceived by elk (Cervus elaphus L., 1758) and elk landscape use. We conducted fecal pellet and wolf scat surveys inthree valleys with three wolf population levels (Saint Mary: low; Waterton: moderate; North Fork: high). In the North Fork, 90% ofquaking aspen (Populus tremuloides Michx.) stands burned recently; the other valleys had no fire. We created predictive models ofelk pellet density that incorporated bottom-up and top-down variables. All valleys had a high elk pellet density (≥10 per 100 m2).Wolf scat density was similar where there was no fire, but one order of magnitude greater in burned areas. Elk pellet density waslower in the North Fork, a predation-related response. In all valleys, site-specific elk density declined as impediments to detectingor escaping wolves increased, and elk avoided aspen, except for North Fork unburned areas. Models that best predicted elkdensity contained bottom-up and top-down effects. At local scales, high predation risk negatively influence elk occurrence,suggesting that even with minimal wolf exposure elk avoid risky sites.
Key words: elk, Cervus elaphus, predation risk, wolves, Canis lupus, trophic cascades.
Résumé : L’acquisition de nourriture et l’évitement de la prédation sont des moteurs clés du comportement des herbivores. Nousavons examiné l’interaction d’effets descendants (prédateur) et ascendants (nourriture, feu, chaleur) en mesurant le lien entreles risques de prédation par des loups (Canis lupus L., 1758) perçus par les wapitis (Cervus elaphus L., 1758) et l’utilisation du paysagepar ces derniers. Nous avons effectué des levés de boulettes fécales et de fèces de loup dans trois vallées présentant despopulations de loups de trois niveaux différents (Saint Mary : faible; Waterton : modérée; North Fork : élevée). Dans la vallée dela North Fork, 90 % des peuplements de trembles (Populus tremuloides Michx.) avaient brûlé récemment; aucun feu n’avait eu lieudans les deux autres vallées. Nous avons créé des modèles prédictifs de la densité des boulettes de wapiti qui intègrent desvariables ascendantes et descendantes. Toutes les vallées présentaient des densités de boulettes de wapiti élevées (≥10 par 100 m2).La densité des fèces de loup était semblable la où il n’y avait pas eu de feu, mais d’un ordre de grandeur plus élevée dans les zonesbrûlées. La densité des boulettes de wapiti était plus faible dans la vallée de la North Fork, une réaction reliée a la prédation. Danstoutes les vallées, la densité de wapitis propres a des sites précis diminuait inversement a l’augmentation des entraves a ladétection des loups ou a la fuite de ces derniers, et les wapitis évitaient les trembles, sauf dans les zones non brûlées de la NorthFork. Les modèles qui prédisaient le mieux la densité des wapitis contenaient des effets ascendants et descendants. Aux échelleslocales, un risque de prédation élevé exerce une influence négative sur la présence de wapitis, donnant a penser que, même sil’exposition aux loups est très faible, les wapitis évitent les sites a risque. [Traduit par la Rédaction]
Mots-clés : wapiti, Cervus elaphus, risque de prédation, loup, Canis lupus, cascades trophiques.
IntroductionAnimals select habitat and move within a landscape using com-
plex decision-making strategies. Food acquisition and quality, aswell as predation, are important drivers of animal behaviourand landscape use (Brown et al. 1999). The ability of an animalto assess and behaviourally control its risk of being preyed uponstrongly influences feeding decisions (Lima and Dill 1990). In a lowpredator-density system, herbivores will eat the most nutrition-ally profitable foods before browsing foods of lower nutritionalvalue. In a high predator-density system, herbivore decisionsabout food consumption are mediated by avoidance of predation(Stephens and Krebs 1986). Landscape features can increase therisk of predation (Ripple and Beschta 2004; Hebblewhite et al.2005a; Kauffman et al. 2007; Painter et al. 2015) and can cause preyto alter foraging decisions (Laundré et al. 2001; Hebblewhite et al.2005b). For example, in Yellowstone National Park (YNP), Fortin
et al. (2005) found that as the risk of encountering wolves (Canislupus L., 1758) increased, elk (Cervus elaphus L., 1758) spent less timeforaging in stands of quaking aspen (Populus tremuloides Michx.;hence referred to aspen). These authors found that elk respond towolves by shifting habitat selection, utilizing more open areaswhen wolves are present, and spending less time browsing inaspen stands, despite the highly nutritional value of aspen for elk(Cook 2002).
The above studies suggest that by altering prey utilization ofvegetation and thus changing vegetation dynamics, predation caninitiate trophic cascades. Paine (1980) defined trophic cascades asfood-web relationships in which a dominant (e.g., “apex”) preda-tor influences the density and (or) behaviour of its prey, and indoing so indirectly affects other taxa. Apex predators thereby cre-ate top-down influences in ecosystems (Hairston et al. 1960; Paine1980; Schmitz et al. 2000).
Received 28 May 2014. Accepted 17 December 2014.
C. Eisenberg and D.E. Hibbs. College of Forestry, Oregon State University, Corvallis, OR 97331, USA.W.J. Ripple. Department of Forest Ecosystems and Society, College of Forestry, Oregon State University, Corvallis, OR 97331, USA.Corresponding author: Cristina Eisenberg (e-mail: [email protected]).
99
Can. J. Zool. 93: 99–111 (2015) dx.doi.org/10.1139/cjz-2014-0138 Published at www.nrcresearchpress.com/cjz on 18 December 2014.
Can
. J. Z
ool.
Dow
nloa
ded
from
ww
w.n
rcre
sear
chpr
ess.
com
by
Ore
gon
Stat
e U
nive
rsity
on
02/0
4/15
For
pers
onal
use
onl
y.
In addition to the top-down effects in ecosystems describedabove, energy flows through ecosystems from the bottom-up.Bottom-up effects include factors that can increase or decreasethe abundance and productivity of plants, such as moisture, dis-turbance (e.g., fire), and solar radiation (Murdoch 1966; Mengeet al. 1999). Because plants have primacy in energy production,these dynamics also structure ecosystems by influencing herbi-vore abundance and landscape use (Power 1992).
In North America, among the most studied wildlife habitat-selection relationships are those that focus on ungulates. Elk havebeen the subject of many such studies because of the economicvalue of this species and its impact on habitat for other taxa due tointensive consumption of resources (Wagner 2006). Factors histor-ically linked to elk habitat use include food, climate, topography(Skovlin et al. 2002), and human disturbance (Frair et al. 2005).Scientists have linked predator presence to elk behaviour andhabitat use (Ripple et al. 2001; Ripple and Beschta 2006), focusingon the potential influence of the gray wolf, the leading predator ofelk (Geist 2002; Soulé et al. 2003).
The mid-1990s northern Rocky Mountain wolf reintroductioncreated opportunities to test these relationships observationally(Smith et al. 2003). Emerging research from YNP stimulated ascientific debate about whether wolves create behavioural changesin elk via predation risk, and if so, whether these effects are indi-rectly influencing other trophic levels (Creel and Christianson2009; Kauffman et al 2010; Ripple and Beschta 2012). Optimalforaging theory predicts a shift of elk away from foraging in highpredation risk sites, despite the presence of nutritious foods(Stephens and Krebs 1986). Some authors have documented, usingfecal pellet counts, elk avoidance and differential use of aspenhabitat in areas with a wolf population and avoidance of placeswith impediments to detecting and escaping wolves (White et al.2003; Kuijper et al. 2013). Other YNP research alternatively sug-gests that topography and vegetation characteristics that mayincrease wolf predation risk have no influence on elk use of hab-itat (Creel and Christianson 2009; Kauffman et al 2010). A recentreview highlights the complexity of wolf-related trophic cascadesin YNP and Isle Royale National Park and suggests that thesemulticausal ecological relationships do not generate definitiveanswers to research questions (Peterson et al. 2014).
The objective of this study was to determine whether risk ofpredation by wolves influences how elk use a winter range land-scape. In all ecological settings, top-down (predator-driven) effectsoperate along with bottom-up (resource-driven) effects, which in-clude factors that increase or decrease plant abundance, thuschanging herbivore habitat (Polis and Strong 1996). Therefore, wedesigned our hypotheses to explore top-down and bottom-upeffects together. First, we investigated whether predation riskwould be a strong driver of elk habitat use. We then examined theinteraction of observed elk responses to bottom-up and top-downfactors in their use of habitat on a landscape scale. We predictedthat elk occurrence would increase with food palatability andlandscape radiant heat, and decrease with an increase in putativeimpediments to detecting and escaping wolves. These hypotheseswere used to generate models that contained predictive variablesthat best described the data collected, using an information-theoretic approach. We used these models to explore the influ-ence of cover types (e.g., grass, aspen, shrub, conifer, bare mineralsoil) on our response variable, elk pellet pile density.
Materials and methods
Study areaThe study setting spans the US–Canada border within Glacier
National Park (GNP), Montana, USA, and Waterton Lakes NationalPark (WLNP), Alberta, Canada, in the Crown of the ContinentEcosystem. Within these parks we studied three geographicallyseparate valleys (Fig. 1), all of which are elk winter range: (1) the
Saint Mary Valley, in eastern GNP; (2) the Waterton Valley, ineastern WLNP; and (3) the North Fork Valley in western GNP.Ecological resources are comparable in all valleys (e.g., climate,soil, elevation), as is precipitation quantity and temporal distribu-tion (Achuff et al. 2005; Hop et al. 2007; Parks Canada 2010;Western Regional Climate Center 2010), resulting in similar bioticcommunities. The valleys consist of low-elevation (1024–1700 m)grasslands dominated by rough fescue (Festuca scabrella Torr.) andprovide elk with snow depths <0.7 m and wind protection in thewinter. Secondary foods include aspen, shrubs, and conifers(Singer 1979; Achuff et al. 2005). In the North Fork, 90% of aspenstands have burned between 1988 and 2003. Measured areas in-cluded 1392, 2741, and 5705 ha for Saint Mary, Waterton, and theNorth Fork study areas, respectively (ArcGIS version 10.1).
Wolves are the dominant predator of elk in our study area(Kunkel et al. 1999). Other species that prey on elk include cougar(Puma concolor (L., 1771)), grizzly bear (Ursus arctos horribilis Ord,1815), and black bear (Ursus americanus Pallas, 1780). However,these species did not have a large impact on elk in our study,because bears hibernate when elk are on their winter range andcougars prey mostly on deer (genus Odocoileus Rafinesque, 1832) inthe Crown of the Continent Ecosystem (Kunkel and Pletscher2001; Banfield 2010).
While all valleys offer similar wolf habitat, past wildlife man-agement policies and practices have varied. This has resulted in arange of wolf population sizes among the valleys. Wolf abundancein the Crown of the Continent Ecosystem was very low from the1880s until the mid-1970s, due to wolf extirpation. In the mid-1970s, wolves from Canada began to recolonize the ecosystemnaturally and were confirmed denning in the North Fork in 1986(Ream et al. 1990).
The three valleys had three different wolf population levels(a coarse-scale measure of wolf presence), based on breeding dynam-ics. We used agency reports and field observations that took placeduring the course of our study to characterize wolf population.We also based our assessment of wolf population level on Mechand Boitani (2003, pp. 2–29) and Fuller et al. (2003, pp. 181–191), whichcharacterized an established population as one in which a wolfpair produces pups each year. Saint Mary had a low wolf popula-tion; although wolves have attempted to recolonize Saint Marysince the 1980s, no breeding pair or pack of wolves occurred thereduring our study (Sime et al. 2010), but wolves were observedoccasionally passing through the area. Waterton had a moderateand variable wolf population; wolves were confirmed denning inWLNP in 1992 (Fox and Van Tieghem 1994) and have denned inthat park consistently since then. Wolves are subject to legal takeoutside the park. During our study, wolves in Waterton averagedsix individuals in the single pack that denned inside the park(Watt 2009). We characterized the North Fork as having a highwolf population. During our study, North Fork wolves averaged38 individuals in two packs that produced multiple litters (Simeet al. 2010). These wolf population levels provided a very coarsemeasure of wolf activity in the three valleys. To provide a furtherindex of wolf presence that could help inform our interpretationof our investigation of factors that influence elk habitat use, wemeasured wolf relative density at the same scale as the elk datathat we gathered (100 m2), as described below in the section Fecalsampling methods.
Fecal sampling methodsWe used counts of ungulate fecal pellets and wolf scats to derive
an index of ungulate and wolf occurrence, density, and utilizationof the landscape in each valley. Pellet counts are the process ofestimating, using fecal pellet piles, the relative numbers of mam-mals in a given area (Neff 1968). Scat counts are used to survey forcarnivores (Gompper et al. 2006). While similar information canbe derived via radio-collar data, the benefit of pellet-count surveysis that they can inexpensively estimate the entire observable
100 Can. J. Zool. Vol. 93, 2015
Published by NRC Research Press
Can
. J. Z
ool.
Dow
nloa
ded
from
ww
w.n
rcre
sear
chpr
ess.
com
by
Ore
gon
Stat
e U
nive
rsity
on
02/0
4/15
For
pers
onal
use
onl
y.

population inhabiting a site. If observer and detection bias areaddressed, a sample of sufficient size is used, and counts in rapiddecomposition sites (e.g., in areas of high moisture) are avoided,fecal pellet survey methods provide a reliable manner to evaluatespecies density and habitat use (White and Eberhardt 1980; Fuller1991; Kunkel 1997; Sanchez et al. 2004; McComb et al. 2010).
Our surveys took place between snowmelt and green-up becausesnow cover and tall grass can diminish detectability of pellets andscats (Lehmkuhl et al. 1994). We surveyed Waterton and SaintMary in spring 2007 and the North Fork in spring 2008. To reduceobserver bias, a single observer conducted all counts. We con-firmed identification of carnivore scats using a DNA test of ran-domly selected carnivore scats (n = 11 scats) and obtained results of100% detection accuracy.
Decomposition rates and manipulation or consumption of scatsby animals could bias studies that use scat to investigate life-history parameters (Sanchez et al. 2004). To test persistence, weobserved wolf scat near known wolf dens in a variety of terrain.Wolf scats tended to persist for 1 year. They were not moved byother species during the period of observation. We assumed thatcarnivore scats would have similar detectability and persistenceacross cover types, because these scats were very large (e.g., >2 cmin diameter) and because data were collected in spring betweensnowmelt and green-up when vegetation did not interfere withdetectability.
We sampled all patches of elk winter range within the valleys.We defined elk winter range as discrete grasslands that containwell-distributed aspen stands <1 ha in area and shrub patches<1 ha in area and have a low elevation (<1800 m) and mean snowdepth of <0.7 m (Skovlin et al. 2002). Pellets were counted alongtransects 2 m wide and 1 km long. We refer to these transects as“pellet transects”. We used transects versus circular or squareplots to best capture landscape heterogeneity and match methods
used by Parks Canada in Banff National Park, Alberta (Neff 1968;Thomson 2003). Transects encompassed a variety of cover types(e.g., grass, aspen, shrubs) and geographic variation (e.g., prairie,benchland), to capture habitat available to elk.
Pellet transects were oriented on a chosen azimuth (measuredwith a sighting compass, 1°–360°) parallel to the elevational gra-dient of the landscape (Neff 1968), which trended east–west through-out all valleys. Transects began from a random start <25 m from thenorthern or southern edge (randomly determined) of each elkwinter range patch. Thereafter, transects were positioned system-atically, parallel to one another every 50 m in each patch. Alltransects were straight and 1 km in length. We subdivided tran-sects into 20 contiguous 50 m subtransects and defined the sam-pling unit as the 50 m subtransect. At the start of each count, atransect tape was positioned along the center of the subtransect,lengthwise. From the starting end of the tape, we measured Uni-versal Trans Mercator (UTM) grid coordinates and elevation (inmetres, error ± 2–6 m), aspect (arcsine transformation rangingfrom 1° to 360°), and slope (percentage).
Sampling intensity was determined by our need to accuratelycapture data from species whose presence in the landscape mayhave been low (e.g., the carnivores) (Elton 2001). A post hoc poweranalysis conducted on similar pellet transect data in Banff Na-tional Park suggested a minimum sample size of one hundred andsixty 2 m × 50 m subtransects. The potential overdispersion ofpellet-count data and the complexity of the models we intended tofit further indicated a robust sample size (White and Eberhardt1980). The number of subtransects surveyed within each valleyvaried: 1820 subtransects (91 full transects), 2200 subtransects(110 full transects), 740 subtransects (37 full transects) for NorthFork, Waterton, and Saint Mary, respectively. We evenly sampledall elk winter range in the valleys, using the same sampling inten-sity. The pellet and scat data that we collected in these transects
Fig. 1. Study areas in Glacier National Park, Montana, USA, and Waterton Lakes National Park, Alberta, Canada.
Eisenberg et al. 101
Published by NRC Research Press
Can
. J. Z
ool.
Dow
nloa
ded
from
ww
w.n
rcre
sear
chpr
ess.
com
by
Ore
gon
Stat
e U
nive
rsity
on
02/0
4/15
For
pers
onal
use
onl
y.
represented an index of these species’ relative density at a scale of100 m2. This index enabled us to determine trends in wolf pres-ence within the valleys on a scale of 100 m2 (McComb et al. 2010,p. 144). For example, we noted predator–prey use of habitat (e.g.,grass and aspen, burned and unburned sites) by examining elkand wolf scats/100 m2 subtransects in grass and aspen habitat andin burned and unburned sites.
Each count consisted of a pile of ungulate pellets, which corre-sponded to a single defecation incident, or a single wolf scat. Wedefined a pile as five or more pellets (Neff 1968) within a transect.While diet can greatly influence elk pellet colour when fresh, aspellets age and decompose, they turn gray. In high ungulate den-sity areas, we were reliably able to identify discrete pellet piles bycolour. We did not count pellets when they were wet, as moisturedarkens their colour, rendering old and new pellets indistinguish-able. We only counted intact pellets. We were unable to differen-tiate deer pellets by species (e.g., mule deer, Odocoileus hemionus(Rafinesque, 1817), versus white-tailed deer, Odocoileus virginianus(Zimmermann, 1780)). We defined a wolf scat as a single, unbro-ken tubular piece of wolf fecal matter. In the event that a wolf scatwas broken into two or more pieces, we counted it as one scat.
Habitat samplingWe assigned each subtransect a cover type based on a subjective
estimate of the cover type most common within it (grass, aspen,shrub, and other, which are listed here in order of palatability).These cover types denoted broad food types utilized by elk inwinter in the Rocky Mountains (Canon et al. 1987; Cook 2002), andspecifically in Crown of the Continent Ecosystem (Wasem 1963;Singer 1979). Shrubs occurred in a mix of western serviceberry(Amelanchier alnifolia (Nutt.) Nutt. ex M. Roem.), western snow-berry (Symphoricarpos occidentalis Hook.), common snowberry(Symphoricarpos albus (L.) S.F. Blake), and rose (genus Rosa L.). Thisshrub mix was palatable to elk but lower in palatability thanaspen (Cook 2002). The “other” level was designated for covertypes that offer low to negligible nutrition (Skovlin et al. 2002) andconsisted of lodgepole pine (Pinus contorta Douglas ex Loudon),spruce (genus Picea A. Dietr.), rocks, and bare mineral soil.
We estimated the effect of landscape radiant heat input on elkresource utilization, heat load, which incorporates the subtran-sect slope, aspect, and latitude (McCune and Keon 2002). Heat loaddoes not account for cloud cover and shading by adjacent vegeta-tion or topography.
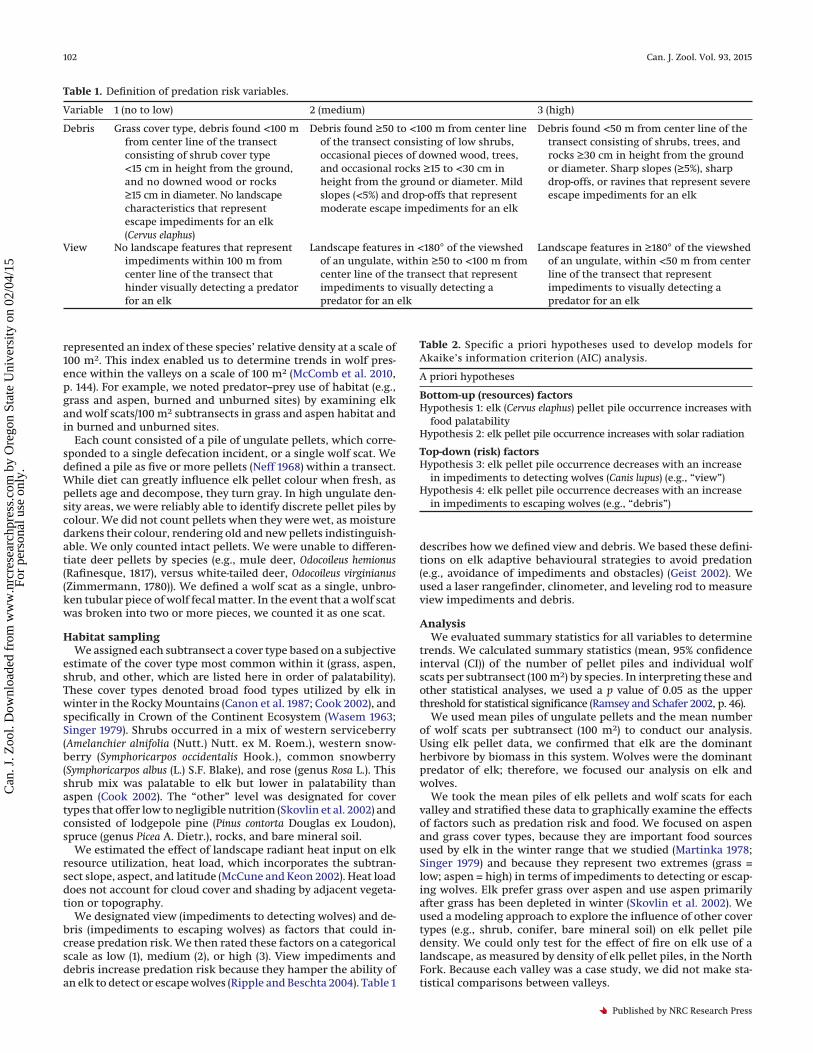
We designated view (impediments to detecting wolves) and de-bris (impediments to escaping wolves) as factors that could in-crease predation risk. We then rated these factors on a categoricalscale as low (1), medium (2), or high (3). View impediments anddebris increase predation risk because they hamper the ability ofan elk to detect or escape wolves (Ripple and Beschta 2004). Table 1
describes how we defined view and debris. We based these defini-tions on elk adaptive behavioural strategies to avoid predation(e.g., avoidance of impediments and obstacles) (Geist 2002). Weused a laser rangefinder, clinometer, and leveling rod to measureview impediments and debris.
AnalysisWe evaluated summary statistics for all variables to determine
trends. We calculated summary statistics (mean, 95% confidenceinterval (CI)) of the number of pellet piles and individual wolfscats per subtransect (100 m2) by species. In interpreting these andother statistical analyses, we used a p value of 0.05 as the upperthreshold for statistical significance (Ramsey and Schafer 2002, p. 46).
We used mean piles of ungulate pellets and the mean numberof wolf scats per subtransect (100 m2) to conduct our analysis.Using elk pellet data, we confirmed that elk are the dominantherbivore by biomass in this system. Wolves were the dominantpredator of elk; therefore, we focused our analysis on elk andwolves.
We took the mean piles of elk pellets and wolf scats for eachvalley and stratified these data to graphically examine the effectsof factors such as predation risk and food. We focused on aspenand grass cover types, because they are important food sourcesused by elk in the winter range that we studied (Martinka 1978;Singer 1979) and because they represent two extremes (grass =low; aspen = high) in terms of impediments to detecting or escap-ing wolves. Elk prefer grass over aspen and use aspen primarilyafter grass has been depleted in winter (Skovlin et al. 2002). Weused a modeling approach to explore the influence of other covertypes (e.g., shrub, conifer, bare mineral soil) on elk pellet piledensity. We could only test for the effect of fire on elk use of alandscape, as measured by density of elk pellet piles, in the NorthFork. Because each valley was a case study, we did not make sta-tistical comparisons between valleys.
Table 1. Definition of predation risk variables.
Variable 1 (no to low) 2 (medium) 3 (high)
Debris Grass cover type, debris found <100 mfrom center line of the transectconsisting of shrub cover type<15 cm in height from the ground,and no downed wood or rocks≥15 cm in diameter. No landscapecharacteristics that representescape impediments for an elk(Cervus elaphus)
Debris found ≥50 to <100 m from center lineof the transect consisting of low shrubs,occasional pieces of downed wood, trees,and occasional rocks ≥15 to <30 cm inheight from the ground or diameter. Mildslopes (<5%) and drop-offs that representmoderate escape impediments for an elk
Debris found <50 m from center line of thetransect consisting of shrubs, trees, androcks ≥30 cm in height from the groundor diameter. Sharp slopes (≥5%), sharpdrop-offs, or ravines that represent severeescape impediments for an elk
View No landscape features that representimpediments within 100 m fromcenter line of the transect thathinder visually detecting a predatorfor an elk
Landscape features in <180° of the viewshedof an ungulate, within ≥50 to <100 m fromcenter line of the transect that representimpediments to visually detecting apredator for an elk
Landscape features in ≥180° of the viewshedof an ungulate, within <50 m from centerline of the transect that representimpediments to visually detecting apredator for an elk
Table 2. Specific a priori hypotheses used to develop models forAkaike’s information criterion (AIC) analysis.
A priori hypotheses
Bottom-up (resources) factorsHypothesis 1: elk (Cervus elaphus) pellet pile occurrence increases with
food palatabilityHypothesis 2: elk pellet pile occurrence increases with solar radiation
Top-down (risk) factorsHypothesis 3: elk pellet pile occurrence decreases with an increase
in impediments to detecting wolves (Canis lupus) (e.g., “view”)Hypothesis 4: elk pellet pile occurrence decreases with an increase
in impediments to escaping wolves (e.g., “debris”)
102 Can. J. Zool. Vol. 93, 2015
Published by NRC Research Press
Can
. J. Z
ool.
Dow
nloa
ded
from
ww
w.n
rcre
sear
chpr
ess.
com
by
Ore
gon
Stat
e U
nive
rsity
on
02/0
4/15
For
pers
onal
use
onl
y.
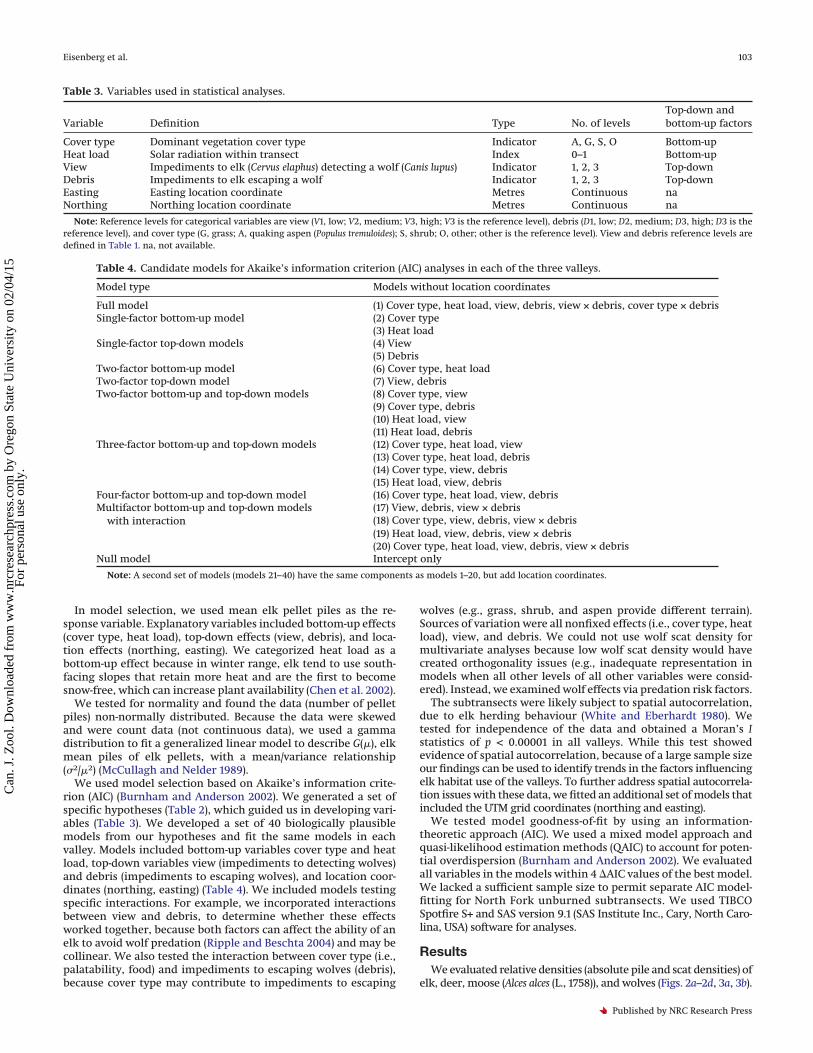
In model selection, we used mean elk pellet piles as the re-sponse variable. Explanatory variables included bottom-up effects(cover type, heat load), top-down effects (view, debris), and loca-tion effects (northing, easting). We categorized heat load as abottom-up effect because in winter range, elk tend to use south-facing slopes that retain more heat and are the first to becomesnow-free, which can increase plant availability (Chen et al. 2002).
We tested for normality and found the data (number of pelletpiles) non-normally distributed. Because the data were skewedand were count data (not continuous data), we used a gammadistribution to fit a generalized linear model to describe G(�), elkmean piles of elk pellets, with a mean/variance relationship(�2/�2) (McCullagh and Nelder 1989).
We used model selection based on Akaike’s information crite-rion (AIC) (Burnham and Anderson 2002). We generated a set ofspecific hypotheses (Table 2), which guided us in developing vari-ables (Table 3). We developed a set of 40 biologically plausiblemodels from our hypotheses and fit the same models in eachvalley. Models included bottom-up variables cover type and heatload, top-down variables view (impediments to detecting wolves)and debris (impediments to escaping wolves), and location coor-dinates (northing, easting) (Table 4). We included models testingspecific interactions. For example, we incorporated interactionsbetween view and debris, to determine whether these effectsworked together, because both factors can affect the ability of anelk to avoid wolf predation (Ripple and Beschta 2004) and may becollinear. We also tested the interaction between cover type (i.e.,palatability, food) and impediments to escaping wolves (debris),because cover type may contribute to impediments to escaping
wolves (e.g., grass, shrub, and aspen provide different terrain).Sources of variation were all nonfixed effects (i.e., cover type, heatload), view, and debris. We could not use wolf scat density formultivariate analyses because low wolf scat density would havecreated orthogonality issues (e.g., inadequate representation inmodels when all other levels of all other variables were consid-ered). Instead, we examined wolf effects via predation risk factors.
The subtransects were likely subject to spatial autocorrelation,due to elk herding behaviour (White and Eberhardt 1980). Wetested for independence of the data and obtained a Moran’s Istatistics of p < 0.00001 in all valleys. While this test showedevidence of spatial autocorrelation, because of a large sample sizeour findings can be used to identify trends in the factors influencingelk habitat use of the valleys. To further address spatial autocorrela-tion issues with these data, we fitted an additional set of models thatincluded the UTM grid coordinates (northing and easting).
We tested model goodness-of-fit by using an information-theoretic approach (AIC). We used a mixed model approach andquasi-likelihood estimation methods (QAIC) to account for poten-tial overdispersion (Burnham and Anderson 2002). We evaluatedall variables in the models within 4 �AIC values of the best model.We lacked a sufficient sample size to permit separate AIC model-fitting for North Fork unburned subtransects. We used TIBCOSpotfire S+ and SAS version 9.1 (SAS Institute Inc., Cary, North Caro-lina, USA) software for analyses.
ResultsWe evaluated relative densities (absolute pile and scat densities) of
elk, deer, moose (Alces alces (L., 1758)), and wolves (Figs. 2a–2d, 3a, 3b).
Table 3. Variables used in statistical analyses.
Variable Definition Type No. of levelsTop-down andbottom-up factors
Cover type Dominant vegetation cover type Indicator A, G, S, O Bottom-upHeat load Solar radiation within transect Index 0–1 Bottom-upView Impediments to elk (Cervus elaphus) detecting a wolf (Canis lupus) Indicator 1, 2, 3 Top-downDebris Impediments to elk escaping a wolf Indicator 1, 2, 3 Top-downEasting Easting location coordinate Metres Continuous naNorthing Northing location coordinate Metres Continuous na
Note: Reference levels for categorical variables are view (V1, low; V2, medium; V3, high; V3 is the reference level), debris (D1, low; D2, medium; D3, high; D3 is thereference level), and cover type (G, grass; A, quaking aspen (Populus tremuloides); S, shrub; O, other; other is the reference level). View and debris reference levels aredefined in Table 1. na, not available.
Table 4. Candidate models for Akaike’s information criterion (AIC) analyses in each of the three valleys.
Model type Models without location coordinates
Full model (1) Cover type, heat load, view, debris, view × debris, cover type × debrisSingle-factor bottom-up model (2) Cover type
(3) Heat loadSingle-factor top-down models (4) View
(5) DebrisTwo-factor bottom-up model (6) Cover type, heat loadTwo-factor top-down model (7) View, debrisTwo-factor bottom-up and top-down models (8) Cover type, view
(9) Cover type, debris(10) Heat load, view(11) Heat load, debris
Three-factor bottom-up and top-down models (12) Cover type, heat load, view(13) Cover type, heat load, debris(14) Cover type, view, debris(15) Heat load, view, debris
Four-factor bottom-up and top-down model (16) Cover type, heat load, view, debrisMultifactor bottom-up and top-down models
with interaction(17) View, debris, view × debris(18) Cover type, view, debris, view × debris(19) Heat load, view, debris, view × debris(20) Cover type, heat load, view, debris, view × debris
Null model Intercept only
Note: A second set of models (models 21–40) have the same components as models 1–20, but add location coordinates.
Eisenberg et al. 103
Published by NRC Research Press
Can
. J. Z
ool.
Dow
nloa
ded
from
ww
w.n
rcre
sear
chpr
ess.
com
by
Ore
gon
Stat
e U
nive
rsity
on
02/0
4/15
For
pers
onal
use
onl
y.
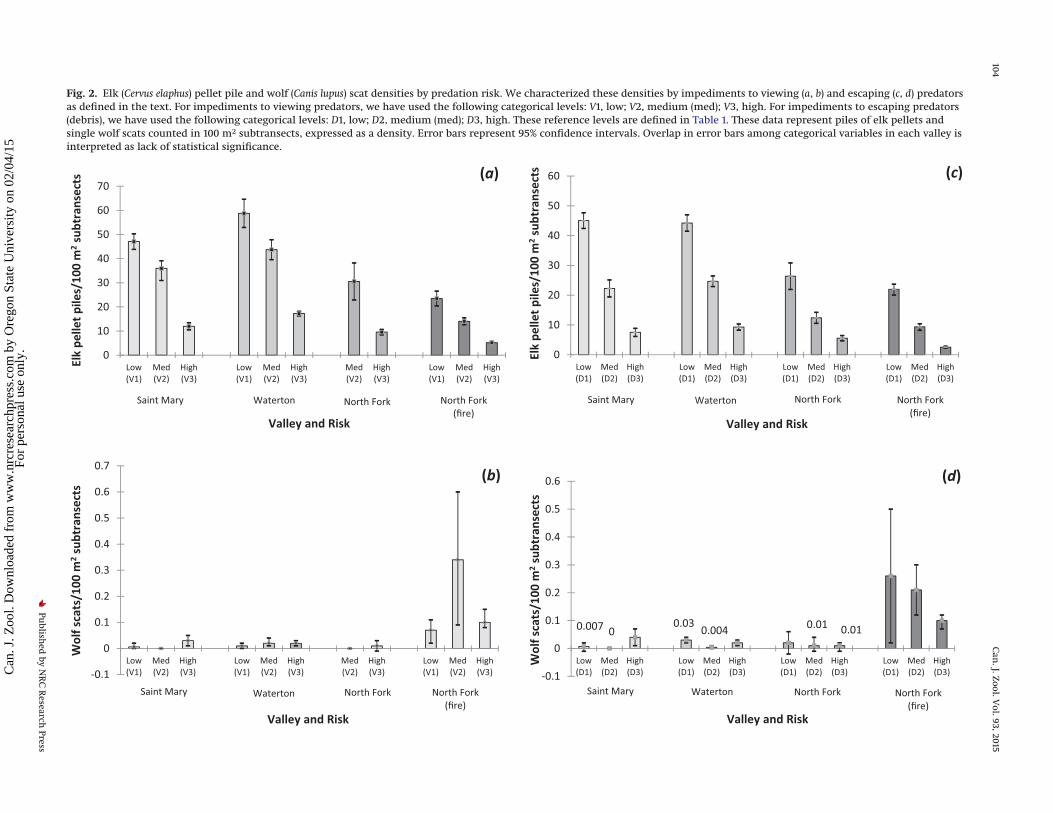
Fig. 2. Elk (Cervus elaphus) pellet pile and wolf (Canis lupus) scat densities by predation risk. We characterized these densities by impediments to viewing (a, b) and escaping (c, d) predatorsas defined in the text. For impediments to viewing predators, we have used the following categorical levels: V1, low; V2, medium (med); V3, high. For impediments to escaping predators(debris), we have used the following categorical levels: D1, low; D2, medium (med); D3, high. These reference levels are defined in Table 1. These data represent piles of elk pellets andsingle wolf scats counted in 100 m2 subtransects, expressed as a density. Error bars represent 95% confidence intervals. Overlap in error bars among categorical variables in each valley isinterpreted as lack of statistical significance.
0
10
20
30
40
50
60
70
Low(V1)
Med(V2)
High(V3)
Low(V1)
Med(V2)
High(V3)
Med(V2)
High(V3)
Low(V1)
Med(V2)
High(V3)
Elk
pelle
t pi
les/
100
m2
subt
rans
ects
Valley and Risk
(a)
Saint Mary Waterton North Fork North Fork(fire)
0
10
20
30
40
50
60
Low(D1)
Med(D2)
High(D3)
Low(D1)
Med(D2)
High(D3)
Low(D1)
Med(D2)
High(D3)
Low(D1)
Med(D2)
High(D3)
Elk
pelle
t pi
les/
100
m2
subt
rans
ects
Valley and Risk
(c)
Waterton North Fork North Fork (fire)
Saint Mary
0.007 00.03
0.004 0.01 0.01
-0.1
0
0.1
0.2
0.3
0.4
0.5
0.6
Low(D1)
Med(D2)
High(D3)
Low(D1)
Med(D2)
High(D3)
Low(D1)
Med(D2)
High(D3)
Low(D1)
Med(D2)
High(D3)
Wol
f sca
ts/1
00 m
2su
btra
nsec
ts
Valley and Risk
(d)
WatertonSaint Mary North Fork North Fork(fire)
-0.1
0
0.1
0.2
0.3
0.4
0.5
0.6
0.7
Low(V1)
Med(V2)
High(V3)
Low(V1)
Med(V2)
High(V3)
Med(V2)
High(V3)
Low(V1)
Med(V2)
High(V3)
Wol
f sca
ts/1
00 m
2su
btra
nsec
ts
Valley and Risk
Saint Mary Waterton North Fork North Fork(fire)
(b)
104C
an.J.Zool.V
ol.93,2015
Publish
edby
NR
CR
esearchPress
Can
. J. Z
ool.
Dow
nloa
ded
from
ww
w.n
rcre
sear
chpr
ess.
com
by
Ore
gon
Stat
e U
nive
rsity
on
02/0
4/15
For
pers
onal
use
onl
y.
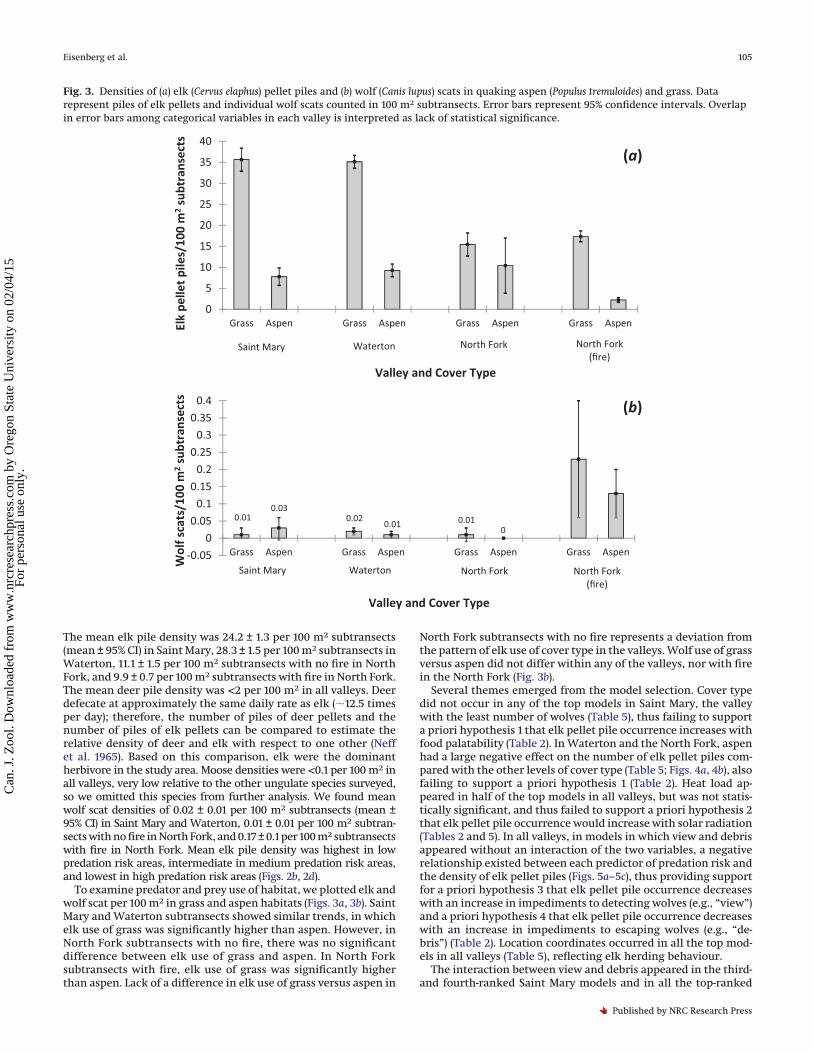
The mean elk pile density was 24.2 ± 1.3 per 100 m2 subtransects(mean ± 95% CI) in Saint Mary, 28.3 ± 1.5 per 100 m2 subtransects inWaterton, 11.1 ± 1.5 per 100 m2 subtransects with no fire in NorthFork, and 9.9 ± 0.7 per 100 m2 subtransects with fire in North Fork.The mean deer pile density was <2 per 100 m2 in all valleys. Deerdefecate at approximately the same daily rate as elk (�12.5 timesper day); therefore, the number of piles of deer pellets and thenumber of piles of elk pellets can be compared to estimate therelative density of deer and elk with respect to one other (Neffet al. 1965). Based on this comparison, elk were the dominantherbivore in the study area. Moose densities were <0.1 per 100 m2 inall valleys, very low relative to the other ungulate species surveyed,so we omitted this species from further analysis. We found meanwolf scat densities of 0.02 ± 0.01 per 100 m2 subtransects (mean ±95% CI) in Saint Mary and Waterton, 0.01 ± 0.01 per 100 m2 subtran-sects with no fire in North Fork, and 0.17 ± 0.1 per 100 m2 subtransectswith fire in North Fork. Mean elk pile density was highest in lowpredation risk areas, intermediate in medium predation risk areas,and lowest in high predation risk areas (Figs. 2b, 2d).
To examine predator and prey use of habitat, we plotted elk andwolf scat per 100 m2 in grass and aspen habitats (Figs. 3a, 3b). SaintMary and Waterton subtransects showed similar trends, in whichelk use of grass was significantly higher than aspen. However, inNorth Fork subtransects with no fire, there was no significantdifference between elk use of grass and aspen. In North Forksubtransects with fire, elk use of grass was significantly higherthan aspen. Lack of a difference in elk use of grass versus aspen in
North Fork subtransects with no fire represents a deviation fromthe pattern of elk use of cover type in the valleys. Wolf use of grassversus aspen did not differ within any of the valleys, nor with firein the North Fork (Fig. 3b).
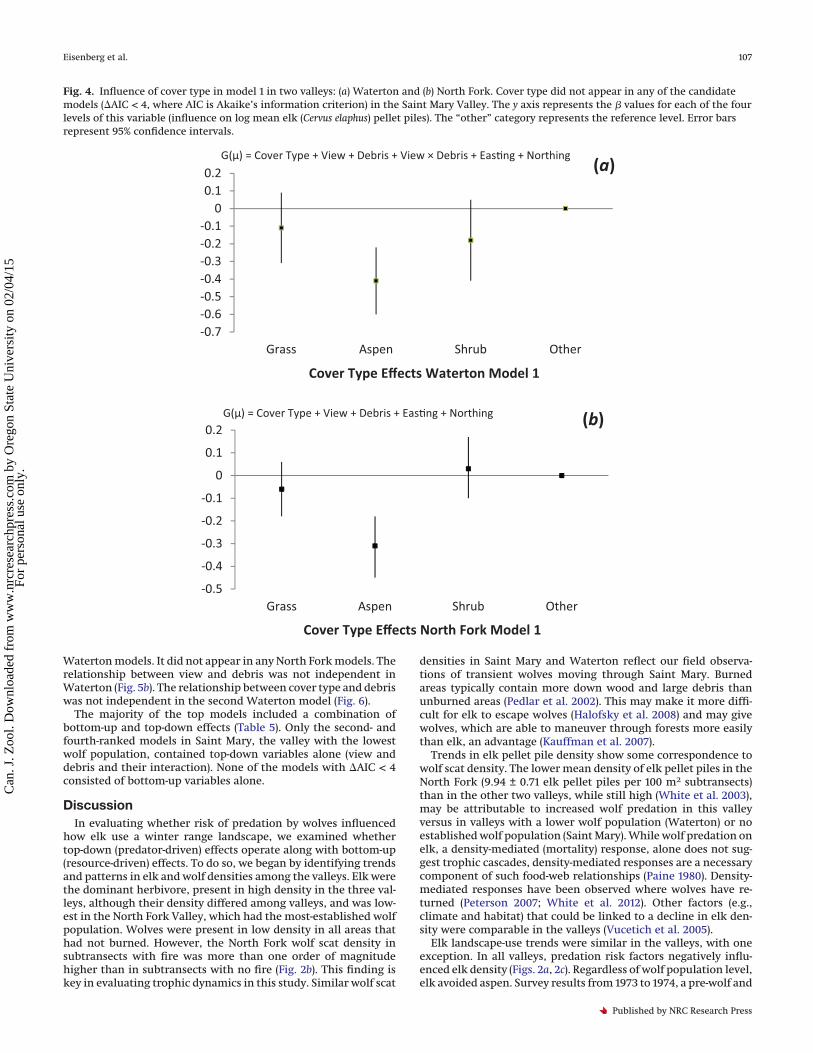
Several themes emerged from the model selection. Cover typedid not occur in any of the top models in Saint Mary, the valleywith the least number of wolves (Table 5), thus failing to supporta priori hypothesis 1 that elk pellet pile occurrence increases withfood palatability (Table 2). In Waterton and the North Fork, aspenhad a large negative effect on the number of elk pellet piles com-pared with the other levels of cover type (Table 5; Figs. 4a, 4b), alsofailing to support a priori hypothesis 1 (Table 2). Heat load ap-peared in half of the top models in all valleys, but was not statis-tically significant, and thus failed to support a priori hypothesis 2that elk pellet pile occurrence would increase with solar radiation(Tables 2 and 5). In all valleys, in models in which view and debrisappeared without an interaction of the two variables, a negativerelationship existed between each predictor of predation risk andthe density of elk pellet piles (Figs. 5a–5c), thus providing supportfor a priori hypothesis 3 that elk pellet pile occurrence decreaseswith an increase in impediments to detecting wolves (e.g., “view”)and a priori hypothesis 4 that elk pellet pile occurrence decreaseswith an increase in impediments to escaping wolves (e.g., “de-bris”) (Table 2). Location coordinates occurred in all the top mod-els in all valleys (Table 5), reflecting elk herding behaviour.
The interaction between view and debris appeared in the third-and fourth-ranked Saint Mary models and in all the top-ranked
Fig. 3. Densities of (a) elk (Cervus elaphus) pellet piles and (b) wolf (Canis lupus) scats in quaking aspen (Populus tremuloides) and grass. Datarepresent piles of elk pellets and individual wolf scats counted in 100 m2 subtransects. Error bars represent 95% confidence intervals. Overlapin error bars among categorical variables in each valley is interpreted as lack of statistical significance.
0
5
10
15
20
25
30
35
40
Grass Aspen Grass Aspen Grass Aspen Grass AspenElk
pelle
t pi
les/
100
m2
subt
rans
ects
(a)
Valley and Cover Type
North ForkWaterton North Fork(fire)
Saint Mary
0.010.03
0.020.01 0.01
0
-0.05
0
0.05
0.1
0.15
0.2
0.25
0.3
0.35
0.4
Grass Aspen Grass Aspen Grass Aspen Grass Aspen
Wol
f sca
ts/1
00 m
2su
btra
nsec
ts (b)
Valley and Cover Type
Waterton North Fork(fire)
Saint Mary North Fork
Eisenberg et al. 105
Published by NRC Research Press
Can
. J. Z
ool.
Dow
nloa
ded
from
ww
w.n
rcre
sear
chpr
ess.
com
by
Ore
gon
Stat
e U
nive
rsity
on
02/0
4/15
For
pers
onal
use
onl
y.
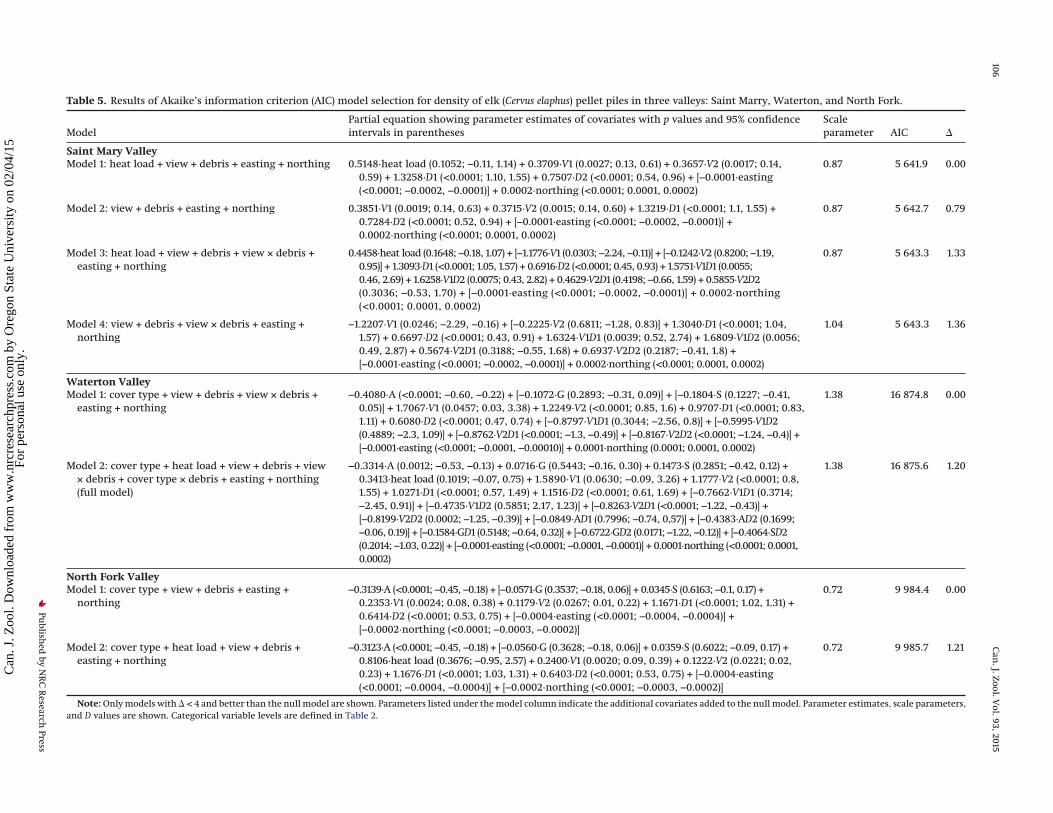
Table 5. Results of Akaike’s information criterion (AIC) model selection for density of elk (Cervus elaphus) pellet piles in three valleys: Saint Marry, Waterton, and North Fork.
ModelPartial equation showing parameter estimates of covariates with p values and 95% confidenceintervals in parentheses
Scaleparameter AIC �
Saint Mary ValleyModel 1: heat load + view + debris + easting + northing 0.5148·heat load (0.1052; −0.11, 1.14) + 0.3709·V1 (0.0027; 0.13, 0.61) + 0.3657·V2 (0.0017; 0.14,
0.59) + 1.3258·D1 (<0.0001; 1.10, 1.55) + 0.7507·D2 (<0.0001; 0.54, 0.96) + [−0.0001·easting(<0.0001; −0.0002, −0.0001)] + 0.0002·northing (<0.0001; 0.0001, 0.0002)
0.87 5 641.9 0.00
Model 2: view + debris + easting + northing 0.3851·V1 (0.0019; 0.14, 0.63) + 0.3715·V2 (0.0015; 0.14, 0.60) + 1.3219·D1 (<0.0001; 1.1, 1.55) +0.7284·D2 (<0.0001; 0.52, 0.94) + [−0.0001·easting (<0.0001; −0.0002, −0.0001)] +0.0002·northing (<0.0001; 0.0001, 0.0002)
0.87 5 642.7 0.79
Model 3: heat load + view + debris + view × debris +easting + northing
0.4458·heat load (0.1648; −0.18, 1.07) + [−1.1776·V1 (0.0303; −2.24, −0.11)] + [−0.1242·V2 (0.8200; −1.19,0.95)] + 1.3093·D1 (<0.0001; 1.05, 1.57) + 0.6916·D2 (<0.0001; 0.45, 0.93) + 1.5751·V1D1 (0.0055;0.46, 2.69) + 1.6258·V1D2 (0.0075; 0.43, 2.82) + 0.4629·V2D1 (0.4198; −0.66, 1.59) + 0.5855·V2D2(0.3036; −0.53, 1.70) + [−0.0001·easting (<0.0001; −0.0002, −0.0001)] + 0.0002·northing(<0.0001; 0.0001, 0.0002)
0.87 5 643.3 1.33
Model 4: view + debris + view × debris + easting +northing
−1.2207·V1 (0.0246; −2.29, −0.16) + [−0.2225·V2 (0.6811; −1.28, 0.83)] + 1.3040·D1 (<0.0001; 1.04,1.57) + 0.6697·D2 (<0.0001; 0.43, 0.91) + 1.6324·V1D1 (0.0039; 0.52, 2.74) + 1.6809·V1D2 (0.0056;0.49, 2.87) + 0.5674·V2D1 (0.3188; −0.55, 1.68) + 0.6937·V2D2 (0.2187; −0.41, 1.8) +[−0.0001·easting (<0.0001; −0.0002, −0.0001)] + 0.0002·northing (<0.0001; 0.0001, 0.0002)
1.04 5 643.3 1.36
Waterton ValleyModel 1: cover type + view + debris + view × debris +
easting + northing−0.4080·A (<0.0001; −0.60, −0.22) + [−0.1072·G (0.2893; −0.31, 0.09)] + [−0.1804·S (0.1227; −0.41,
0.05)] + 1.7067·V1 (0.0457; 0.03, 3.38) + 1.2249·V2 (<0.0001; 0.85, 1.6) + 0.9707·D1 (<0.0001; 0.83,1.11) + 0.6080·D2 (<0.0001; 0.47, 0.74) + [−0.8797·V1D1 (0.3044; −2.56, 0.8)] + [−0.5995·V1D2(0.4889; −2.3, 1.09)] + [−0.8762·V2D1 (<0.0001; −1.3, −0.49)] + [−0.8167·V2D2 (<0.0001; −1.24, −0.4)] +[−0.0001·easting (<0.0001; −0.0001, −0.00010)] + 0.0001·northing (0.0001; 0.0001, 0.0002)
1.38 16 874.8 0.00
Model 2: cover type + heat load + view + debris + view× debris + cover type × debris + easting + northing(full model)
−0.3314·A (0.0012; −0.53, −0.13) + 0.0716·G (0.5443; −0.16, 0.30) + 0.1473·S (0.2851; −0.42, 0.12) +0.3413·heat load (0.1019; −0.07, 0.75) + 1.5890·V1 (0.0630; −0.09, 3.26) + 1.1777·V2 (<0.0001; 0.8,1.55) + 1.0271·D1 (<0.0001; 0.57, 1.49) + 1.1516·D2 (<0.0001; 0.61, 1.69) + [−0.7662·V1D1 (0.3714;−2.45, 0.91)] + [−0.4735·V1D2 (0.5851; 2.17, 1.23)] + [−0.8263·V2D1 (<0.0001; −1.22, −0.43)] +[−0.8199·V2D2 (0.0002; −1.25, −0.39)] + [−0.0849·AD1 (0.7996; −0.74, 0,57)] + [−0.4383·AD2 (0.1699;−0.06, 0.19)] + [−0.1584·GD1 (0.5148; −0.64, 0.32)] + [−0.6722·GD2 (0.0171; −1.22, −0.12)] + [−0.4064·SD2(0.2014; −1.03, 0.22)] + [−0.0001·easting (<0.0001; −0.0001, −0.0001)] + 0.0001·northing (<0.0001; 0.0001,0.0002)
1.38 16 875.6 1.20
North Fork ValleyModel 1: cover type + view + debris + easting +
northing−0.3139·A (<0.0001; −0.45, −0.18) + [−0.0571·G (0.3537; −0.18, 0.06)] + 0.0345·S (0.6163; −0.1, 0.17) +
0.2353·V1 (0.0024; 0.08, 0.38) + 0.1179·V2 (0.0267; 0.01, 0.22) + 1.1671·D1 (<0.0001; 1.02, 1.31) +0.6414·D2 (<0.0001; 0.53, 0.75) + [−0.0004·easting (<0.0001; −0.0004, −0.0004)] +[−0.0002·northing (<0.0001; −0.0003, −0.0002)]
0.72 9 984.4 0.00
Model 2: cover type + heat load + view + debris +easting + northing
−0.3123·A (<0.0001; −0.45, −0.18) + [−0.0560·G (0.3628; −0.18, 0.06)] + 0.0359·S (0.6022; −0.09, 0.17) +0.8106·heat load (0.3676; −0.95, 2.57) + 0.2400·V1 (0.0020; 0.09, 0.39) + 0.1222·V2 (0.0221; 0.02,0.23) + 1.1676·D1 (<0.0001; 1.03, 1.31) + 0.6403·D2 (<0.0001; 0.53, 0.75) + [−0.0004·easting(<0.0001; −0.0004, −0.0004)] + [−0.0002·northing (<0.0001; −0.0003, −0.0002)]
0.72 9 985.7 1.21
Note: Only models with � < 4 and better than the null model are shown. Parameters listed under the model column indicate the additional covariates added to the null model. Parameter estimates, scale parameters,and D values are shown. Categorical variable levels are defined in Table 2.
106C
an.J.Zool.V
ol.93,2015
Publish
edby
NR
CR
esearchPress
Can
. J. Z
ool.
Dow
nloa
ded
from
ww
w.n
rcre
sear
chpr
ess.
com
by
Ore
gon
Stat
e U
nive
rsity
on
02/0
4/15
For
pers
onal
use
onl
y.
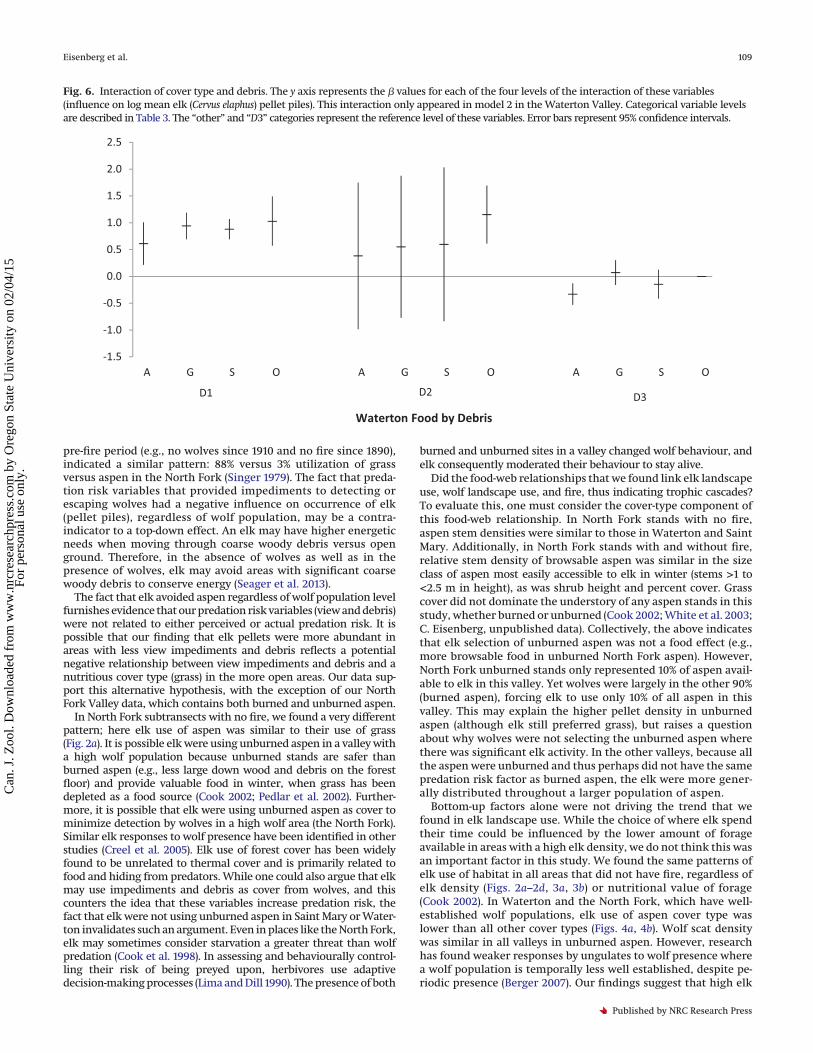
Waterton models. It did not appear in any North Fork models. Therelationship between view and debris was not independent inWaterton (Fig. 5b). The relationship between cover type and debriswas not independent in the second Waterton model (Fig. 6).
The majority of the top models included a combination ofbottom-up and top-down effects (Table 5). Only the second- andfourth-ranked models in Saint Mary, the valley with the lowestwolf population, contained top-down variables alone (view anddebris and their interaction). None of the models with �AIC < 4consisted of bottom-up variables alone.
DiscussionIn evaluating whether risk of predation by wolves influenced
how elk use a winter range landscape, we examined whethertop-down (predator-driven) effects operate along with bottom-up(resource-driven) effects. To do so, we began by identifying trendsand patterns in elk and wolf densities among the valleys. Elk werethe dominant herbivore, present in high density in the three val-leys, although their density differed among valleys, and was low-est in the North Fork Valley, which had the most-established wolfpopulation. Wolves were present in low density in all areas thathad not burned. However, the North Fork wolf scat density insubtransects with fire was more than one order of magnitudehigher than in subtransects with no fire (Fig. 2b). This finding iskey in evaluating trophic dynamics in this study. Similar wolf scat
densities in Saint Mary and Waterton reflect our field observa-tions of transient wolves moving through Saint Mary. Burnedareas typically contain more down wood and large debris thanunburned areas (Pedlar et al. 2002). This may make it more diffi-cult for elk to escape wolves (Halofsky et al. 2008) and may givewolves, which are able to maneuver through forests more easilythan elk, an advantage (Kauffman et al. 2007).
Trends in elk pellet pile density show some correspondence towolf scat density. The lower mean density of elk pellet piles in theNorth Fork (9.94 ± 0.71 elk pellet piles per 100 m2 subtransects)than in the other two valleys, while still high (White et al. 2003),may be attributable to increased wolf predation in this valleyversus in valleys with a lower wolf population (Waterton) or noestablished wolf population (Saint Mary). While wolf predation onelk, a density-mediated (mortality) response, alone does not sug-gest trophic cascades, density-mediated responses are a necessarycomponent of such food-web relationships (Paine 1980). Density-mediated responses have been observed where wolves have re-turned (Peterson 2007; White et al. 2012). Other factors (e.g.,climate and habitat) that could be linked to a decline in elk den-sity were comparable in the valleys (Vucetich et al. 2005).
Elk landscape-use trends were similar in the valleys, with oneexception. In all valleys, predation risk factors negatively influ-enced elk density (Figs. 2a, 2c). Regardless of wolf population level,elk avoided aspen. Survey results from 1973 to 1974, a pre-wolf and
Fig. 4. Influence of cover type in model 1 in two valleys: (a) Waterton and (b) North Fork. Cover type did not appear in any of the candidatemodels (�AIC < 4, where AIC is Akaike’s information criterion) in the Saint Mary Valley. The y axis represents the � values for each of the fourlevels of this variable (influence on log mean elk (Cervus elaphus) pellet piles). The “other” category represents the reference level. Error barsrepresent 95% confidence intervals.
-0.7-0.6-0.5-0.4-0.3-0.2-0.1
00.10.2
Grass Aspen Shrub Other
Cover Type Effects Waterton Model 1
G(μ) = Cover Type + View + Debris + View × Debris + Eas�ng + Northing(a)
-0.5
-0.4
-0.3
-0.2
-0.1
0
0.1
0.2
Grass Aspen Shrub Other
Cover Type Effects North Fork Model 1
(b)G(μ) = Cover Type + View + Debris + Eas�ng + Northing
Eisenberg et al. 107
Published by NRC Research Press
Can
. J. Z
ool.
Dow
nloa
ded
from
ww
w.n
rcre
sear
chpr
ess.
com
by
Ore
gon
Stat
e U
nive
rsity
on
02/0
4/15
For
pers
onal
use
onl
y.
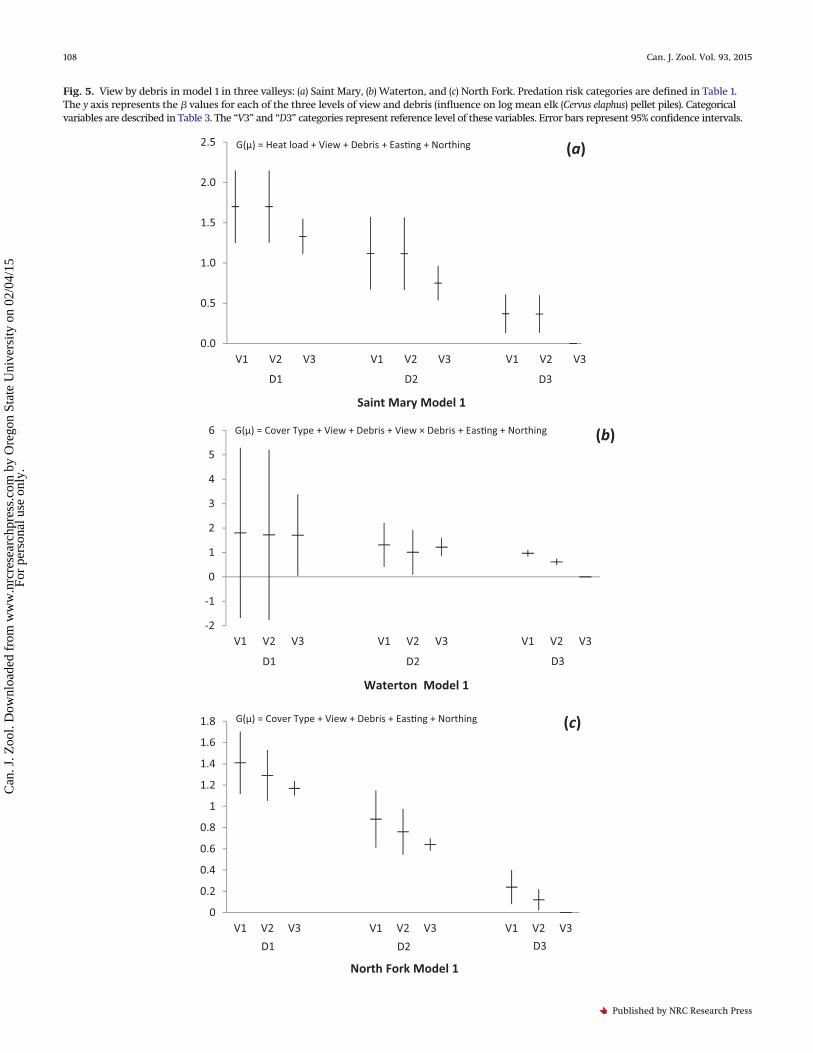
Fig. 5. View by debris in model 1 in three valleys: (a) Saint Mary, (b) Waterton, and (c) North Fork. Predation risk categories are defined in Table 1.The y axis represents the � values for each of the three levels of view and debris (influence on log mean elk (Cervus elaphus) pellet piles). Categoricalvariables are described in Table 3. The “V3” and “D3” categories represent reference level of these variables. Error bars represent 95% confidence intervals.
0.0
0.5
1.0
1.5
2.0
2.5
Saint Mary Model 1
G(μ) = Heat load + View + Debris + Eas�ng + Northing (a)
D1 D2 D3
-2
-1
0
1
2
3
4
5
6
V1 V2 V3 V1 V2 V3 V1 V2 V3
Waterton Model 1
2D1D D3
(b)G(μ) = Cover Type + View + Debris + View × Debris + Eas�ng + Northing
0
0.2
0.4
0.6
0.8
1
1.2
1.4
1.6
1.8
V1 V2 V3 V1 V2 V3 V1 V2 V3
North Fork Model 1
D3
G(μ) = Cover Type + View + Debris + Eas�ng + Northing (c)
D2D1
108 Can. J. Zool. Vol. 93, 2015
Published by NRC Research Press
Can
. J. Z
ool.
Dow
nloa
ded
from
ww
w.n
rcre
sear
chpr
ess.
com
by
Ore
gon
Stat
e U
nive
rsity
on
02/0
4/15
For
pers
onal
use
onl
y.
pre-fire period (e.g., no wolves since 1910 and no fire since 1890),indicated a similar pattern: 88% versus 3% utilization of grassversus aspen in the North Fork (Singer 1979). The fact that preda-tion risk variables that provided impediments to detecting orescaping wolves had a negative influence on occurrence of elk(pellet piles), regardless of wolf population, may be a contra-indicator to a top-down effect. An elk may have higher energeticneeds when moving through coarse woody debris versus openground. Therefore, in the absence of wolves as well as in thepresence of wolves, elk may avoid areas with significant coarsewoody debris to conserve energy (Seager et al. 2013).
The fact that elk avoided aspen regardless of wolf population levelfurnishes evidence that our predation risk variables (view and debris)were not related to either perceived or actual predation risk. It ispossible that our finding that elk pellets were more abundant inareas with less view impediments and debris reflects a potentialnegative relationship between view impediments and debris and anutritious cover type (grass) in the more open areas. Our data sup-port this alternative hypothesis, with the exception of our NorthFork Valley data, which contains both burned and unburned aspen.
In North Fork subtransects with no fire, we found a very differentpattern; here elk use of aspen was similar to their use of grass(Fig. 2a). It is possible elk were using unburned aspen in a valley witha high wolf population because unburned stands are safer thanburned aspen (e.g., less large down wood and debris on the forestfloor) and provide valuable food in winter, when grass has beendepleted as a food source (Cook 2002; Pedlar et al. 2002). Further-more, it is possible that elk were using unburned aspen as cover tominimize detection by wolves in a high wolf area (the North Fork).Similar elk responses to wolf presence have been identified in otherstudies (Creel et al. 2005). Elk use of forest cover has been widelyfound to be unrelated to thermal cover and is primarily related tofood and hiding from predators. While one could also argue that elkmay use impediments and debris as cover from wolves, and thiscounters the idea that these variables increase predation risk, thefact that elk were not using unburned aspen in Saint Mary or Water-ton invalidates such an argument. Even in places like the North Fork,elk may sometimes consider starvation a greater threat than wolfpredation (Cook et al. 1998). In assessing and behaviourally control-ling their risk of being preyed upon, herbivores use adaptivedecision-making processes (Lima and Dill 1990). The presence of both
burned and unburned sites in a valley changed wolf behaviour, andelk consequently moderated their behaviour to stay alive.
Did the food-web relationships that we found link elk landscapeuse, wolf landscape use, and fire, thus indicating trophic cascades?To evaluate this, one must consider the cover-type component ofthis food-web relationship. In North Fork stands with no fire,aspen stem densities were similar to those in Waterton and SaintMary. Additionally, in North Fork stands with and without fire,relative stem density of browsable aspen was similar in the sizeclass of aspen most easily accessible to elk in winter (stems >1 to<2.5 m in height), as was shrub height and percent cover. Grasscover did not dominate the understory of any aspen stands in thisstudy, whether burned or unburned (Cook 2002; White et al. 2003;C. Eisenberg, unpublished data). Collectively, the above indicatesthat elk selection of unburned aspen was not a food effect (e.g.,more browsable food in unburned North Fork aspen). However,North Fork unburned stands only represented 10% of aspen avail-able to elk in this valley. Yet wolves were largely in the other 90%(burned aspen), forcing elk to use only 10% of all aspen in thisvalley. This may explain the higher pellet density in unburnedaspen (although elk still preferred grass), but raises a questionabout why wolves were not selecting the unburned aspen wherethere was significant elk activity. In the other valleys, because allthe aspen were unburned and thus perhaps did not have the samepredation risk factor as burned aspen, the elk were more gener-ally distributed throughout a larger population of aspen.
Bottom-up factors alone were not driving the trend that wefound in elk landscape use. While the choice of where elk spendtheir time could be influenced by the lower amount of forageavailable in areas with a high elk density, we do not think this wasan important factor in this study. We found the same patterns ofelk use of habitat in all areas that did not have fire, regardless ofelk density (Figs. 2a–2d, 3a, 3b) or nutritional value of forage(Cook 2002). In Waterton and the North Fork, which have well-established wolf populations, elk use of aspen cover type waslower than all other cover types (Figs. 4a, 4b). Wolf scat densitywas similar in all valleys in unburned aspen. However, researchhas found weaker responses by ungulates to wolf presence wherea wolf population is temporally less well established, despite pe-riodic presence (Berger 2007). Our findings suggest that high elk
Fig. 6. Interaction of cover type and debris. The y axis represents the � values for each of the four levels of the interaction of these variables(influence on log mean elk (Cervus elaphus) pellet piles). This interaction only appeared in model 2 in the Waterton Valley. Categorical variable levelsare described in Table 3. The “other” and “D3” categories represent the reference level of these variables. Error bars represent 95% confidence intervals.
-1.5
-1.0
-0.5
0.0
0.5
1.0
1.5
2.0
2.5
Waterton Food by Debris
D1 D2 D3
Eisenberg et al. 109
Published by NRC Research Press
Can
. J. Z
ool.
Dow
nloa
ded
from
ww
w.n
rcre
sear
chpr
ess.
com
by
Ore
gon
Stat
e U
nive
rsity
on
02/0
4/15
For
pers
onal
use
onl
y.

use of unburned aspen in the North Fork may be a top-down effectmoderated by bottom-up effects.
The fact that wolves were spending far more time in North Forksubtransects that had burned is not fully indicative of top-downeffects. Elk densities were not lower overall in the North Forkwhere there were more wolves, although their density was lowerin aspen that had burned (Figs. 3a, 3b). As predicted by optimalforaging theory, wolves may have been capitalizing on elk vulner-ability in such sites (Stephens and Krebs 1986). Wolves make hunt-ing decisions based on minimizing effort involved in killing prey(Mech and Boitani 2003). However, beyond this, we did not findfood-web patterns in which wolves spent more time in high-riskareas in any valley (Fig. 2d). Thus, wolf decision making may havebeen influenced by a combination of elk vulnerability and elkdensity, or factors that we did not measure (Fig. 3b).
Taken together, our findings create a picture of differential useof landscapes by elk driven by a suite of factors. Elk decisionmaking appeared to be influenced by both top-down (predationrisk) and bottom-up (food availability) factors. For example, elkavoided aspen, a valuable food source, with the exception of un-burned aspen stands in a valley where wolves spent most of theirtime in burned areas—a bottom-up effect that produces a top-down effect on elk. Had we only studied the North Fork, we wouldhave possibly concluded that in this valley, we observed a strongtop-down effect. However, because we studied three valleys whosedifferences (e.g., fire, elk density, wolf density) were quantifiable,we were able to observe the complexity of what on the surfaceseemed like a simple food-web relationship (e.g., elk using un-burned aspen versus burned aspen) (Fig. 3a). In summary, ourresults suggest that a suite of bottom-up and top-down factorswork together in valleys that contain well-established wolf popu-lations. These factors may work together to a lesser degree in avalley with a low wolf population (Table 5). Alternatively, theseputative risk factors may not really function as risk factors for elk.For example, avoiding the interior of an aspen stand could be aninnate foraging response by elk. We note that our low wolf area,Saint Mary, may have had enough of a wolf presence to generate abehavioural response by elk, thus potentially explaining the sim-ilar view and debris risk factor results among the three valleys(Figs. 2a–2d). Saint Mary and Waterton had exactly the same meanwolf scat densities (0.02 ± 0.01 wolf scats per 100 m2 subtransects;mean ± 95% CI) and both were higher than the unburned area ofthe North Fork (0.01 ± 0.01 wolf scats per 100 m2 subtransects;mean ± 95% CI). Further research is needed to determine riskfactors and associated elk behaviour in the presence of wolves.
One of our objectives was to determine the effect of wolf popula-tion on elk landscape use. We are not certain that wolves had astrong effect on elk landscape use because of the many similaritiesthat we found between elk landscape use and the models that hadthe best fit in all valleys. Elk response to predation risk variables wassimilar in all models in all valleys (Figs. 2a, 2c). This suggests that (i) alow number of wolves may alter elk landscape use via predation risk,(ii) what have been identified as risk factors in the scientific literature(e.g., impediments) are not really risk factors, and (iii) other factors,such as fire, moderate the effects of wolf population.
Studies in other ecosystems have found a variety of elk re-sponses to predation risk. In YNP, elk moved into forested areaswhen wolves were present. This reduced their use of grasslands,which contained preferred forage and high predation risk whenwolves where moving through the area (Creel et al. 2005). Also inYNP, predation risk from wolves to elk may operate at multiplespatial scales (Painter et al. 2015). In Banff National Park and theYa-Ha-Tinda Ranch of central Alberta, elk avoided predation riskduring the day by staying far from timber in open grassland areas,which had high human activity and low wolf presence during theday. At night, when wolves moved into the grasslands, some elkmoved into the timber for cover from wolves (Robinson et al.2010). These human-habituated elk utilized a different set of strat-
egies at different times to avoid being preyed on by wolves. (Theelk in our study site were not human-habituated, so did not approachareas with high human activity for safety.) These examples illustratethat assessing predation risk may be a complicated challenge.
Food webs involve highly complex energy flows (Strong 1992).Accordingly, we did not find a simple explanation of elk landscapeuse. While the structure of the food web that we studied (apexpredator ¡ dominant herbivore ¡ plants) was simple, the influ-ences along the pathways that link these components were not. Aswith any faunal species in any setting, the threat of predationalone did not drive elk landscape-use decisions (Borer et al. 2005).Further study is needed to elucidate these complex interactions.
AcknowledgementsWe gratefully acknowledge statistical support from L. Ganio
and financial support from the Boone and Crockett Club. Wethank the Southwest Alberta Montane Research Program, GlacierNational Park, Parks Canada, and the Alberta Division of Fish andGame for supporting this project logistically and technologically.We are grateful to L. Magalska for technical support and toD. Moskowitz, D. Hansche, R. Watt, J. Russell, A. Lowrey, andB. Lowrey for field support.
ReferencesAchuff, P.L., McNeil, R.L., Coleman, M.L., Wallis, C., and Wershler, C. 2005.
Ecological land classification of Waterton Lakes National Park, Alberta. ParksCanada, Ottawa, Ont.
Banfield, J. 2010. Waterton–Castle Cougar Research Project annual report. Wa-terton Lakes National Park, Alta.
Berger, J. 2007. Carnivore repatriation and Holarctic prey: narrowing the deficitin ecological effectiveness. Conserv. Biol. 21(4): 1105–1116. doi:10.1111/j.1523-1739.2007.00729.x. PMID:17650259.
Borer, E.T., Seabloom, E.W., Shurin, J.B., Anderson, K.E., Blanchette, C.A.,Broitman, B., Cooper, S.D., and Halpern, B.S. 2005. What determines thestrength of a trophic cascade? Ecology, 86: 528–537. doi:10.1890/03-0816.
Brown, J.S., Laundré, J.W., and Gurung, M. 1999. The ecology of fear: optimalforaging, game theory, and trophic interactions. J. Mammal. 80(2): 385–399.doi:10.2307/1383287.
Burnham, K.P., and Anderson, D.R. 2002. Model selection and multimodelinference: a practical information-theoretic approach. 2nd ed. Springer Sci-ence Business Media, New York.
Canon, S.K., Urness, P.J., and DeByle, N.V. 1987. Habitat selection, foraging be-havior, and dietary nutrition of elk in burned aspen forest. J. Range Manage.40(5): 433–438. doi:10.2307/3899605.
Chen, H.Y.H., Krestov, P.V., and Klinka, K. 2002. Trembling aspen site index inrelation to environmental measures of site quality at two spatial scales. Can.J. For. Res. 32(1): 112–119. doi:10.1139/x01-179.
Cook, J.G. 2002. Nutrition and food. In North American elk: ecology and man-agement. Edited by D. Toweill and J.W. Thomas. Smithsonian InstitutionPress, Washington, D.C. pp. 344–345.
Cook, J.G., Irwin, L.L., Bryant, L.D., Riggs, R.A., and Thomas, J.W. 1998. Relationsof forest cover and condition of elk: a test of the thermal cover hypothesis insummer and winter. Wildl. Monogr. 141: 1–61.
Creel, S., and Christianson, D. 2009. Wolf presence and increased willow con-sumption by Yellowstone elk: implications for trophic cascades. Ecology, 90:2454–2466. doi:10.1890/08-2017.1. PMID:19769124.
Creel, S., Winnie, J.A., Maxwell, B., Hamlin, K., and Creel, M. 2005. Elk alterhabitat selection as an antipredator response to wolves. Ecology, 86: 3387–3397. doi:10.1890/05-0032.
Elton, C. 2001. Animal ecology. University of Chicago Press, Chicago, Ill.Fortin, D., Beyer, H.L., Boyce, M.S., Smith, D.W., Duchesne, T., and Mao, J.S. 2005.
Wolves influence elk movements: behavior shapes a trophic cascade in Yel-lowstone National Park. Ecology, 86(5): 1320–1330. doi:10.1890/04-0953.
Fox, E., and Van Tieghem, K. 1994. The Belly River wolf study, six month interimreport, Waterton Lakes National Park. Parks Canada, Waterton, Alta.
Frair, J.L., Merrill, E.H., Visscher, D.R., Fortin, D., Beyer, H.L., and Morales, J.M.2005. Scales of movement by elk (Cervus elaphus) in response to heterogeneityin forage resources and predation risk. Landsc. Ecol. 20: 273–287. doi:10.1007/s10980-005-2075-8.
Fuller, T.K. 1991. Do pellet counts index white-tailed deer numbers and popula-tion change? J. Wildl. Manage. 55(3): 393–396. doi:10.2307/3808966.
Fuller, T.K., Mech, L.D., and Cochrane, J.F. 2003. Wolf population dynamics. InWolves: behaviour, ecology, and conservation. Edited by D. Mech and L. Boitani.University of Chicago Press, Chicago, Ill. pp. 161–191.
Geist, V. 2002. Adaptive behavioural strategies. In North American elk: ecologyand management. Edited by D. Toweill and J.W. Thomas. Smithsonian Insti-tution Press, Washington, D.C. pp. 389–433.
Gompper, M.R., Kays, R.W., Ray, J.C., LaPoint, S.D., Bogan, D.A., and Cryan, J.R.
110 Can. J. Zool. Vol. 93, 2015
Published by NRC Research Press
Can
. J. Z
ool.
Dow
nloa
ded
from
ww
w.n
rcre
sear
chpr
ess.
com
by
Ore
gon
Stat
e U
nive
rsity
on
02/0
4/15
For
pers
onal
use
onl
y.
2006. A comparison of noninvasive techniques to survey carnivore commu-nities in northeastern North America. Wildl. Soc. Bull. 34(4): 1142–1151. doi:10.2193/0091-7648(2006)34[1142:ACONTT]2.0.CO;2.
Hairston, N.G., Smith, F.E., and Slobodkin, L.B. 1960. Community structure,population control, and competition. Am. Nat. 94: 421–425. doi:10.1086/282146.
Halofsky, J.S., Ripple, W.J., and Beschta, R.L. 2008. Recoupling fire and aspenrecruitment after wolf reintroduction in Yellowstone National Park, USA.For. Ecol. Manage. 256: 1004–1008. doi:10.1016/j.foreco.2008.06.002.
Hebblewhite, M., Merrill, E.H., and McDonald, T.L. 2005a. Spatial decompositionof predation risk using resource selection functions: an example in a wolf–elkpredator–prey system. Oikos, 111: 101–111. doi:10.1111/j.0030-1299.2005.13858.x.
Hebblewhite, M., White, C.A., Nietvelt, C.G., McKenzie, J.A., Hurd, T.E.,Fryxell, J.M., Bayley, S.E., and Paquet, P.C. 2005b. Human activity mediates atrophic cascade caused by wolves. Ecology, 86: 2135–2144. doi:10.1890/04-1269.
Hop, K., Reid, M., Dieck, J., Lubinski, S., and Cooper, S. 2007. US GeologicalSurvey–National Park Service vegetation mapping program: Waterton–Glacier International Peace Park. US Geological Survey, Upper Midwest Envi-ronmental Sciences Center, La Crosse, Wisc.
Kauffman, M.J., Varley, N., Smith, D.W., Stahler, D.R., MacNulty, D.R., andBoyce, M.S. 2007. Landscape heterogeneity shapes predation in a newly re-stored predator–prey system. Ecol. Lett. 10: 690–700. doi:10.1111/j.1461-0248.2007.01059.x. PMID:17594424.
Kauffman, M., Brodie, J.F., and Jules, E.S. 2010. Are wolves saving Yellowstone’saspen? A landscape-level test of a behaviourally mediated trophic cascade.Ecology, 91(9): 2742–2755. doi:10.1890/09-1949.1.
Kuijper, D.P.J., de Kleine, C., Churski, M., van Hooft, P., Bubnicki, J., andJedrzejewska, B. 2013. Landscape of fear in Europe: wolves affect spatialpatterns of ungulate browsing in Białowieza Primeval Forest, Poland.Ecography, 36(12): 1263–1275. doi:10.1111/j.1600-0587.2013.00266.x.
Kunkel, K.E. 1997. Predation by wolves and other large carnivores in northwest-ern Montana and southeastern British Columbia. M.Sc. thesis, University ofMontana, Missoula.
Kunkel, K., and Pletscher, D.J. 2001. Winter hunting patterns of wolves in andnear Glacier National Park, Montana. J. Wildl. Manage. 65: 520–530. doi:10.2307/3803105.
Kunkel, K.E., Ruth, T.K., Pletscher, D.H., and Hornocker, M.G. 1999. Winter preyselection by wolves and cougars in and near Glacier National Park, Montana.J. Wildl. Manage. 63: 901–910. doi:10.2307/3802804.
Laundré, J.W., Hernández, L., and Altendorf, K.B. 2001. Wolves, elk, and bison:reestablishing the “landscape of fear” in Yellowstone National Park, U.S.A.Can. J. Zool. 79(8): 1401–1409. doi:10.1139/z01-094.
Lehmkuhl, J.F., Hansen, C.A., and Sloan, K. 1994. Elk pellet group decompositionand detectability in coastal forests of Washington. J. Wildl. Manage. 58:664–669. doi:10.2307/3809679.
Lima, S.L., and Dill, L.M. 1990. Behavioral decisions made under the risk ofpredation: a review and prospectus. Can. J. Zool. 68(4): 619–640. doi:10.1139/z90-092.
Martinka, C.J. 1978. Ungulate winter ecology studies in Glacier National Park.Glacier National Park Archives, West Glacier, Mont., Martinka Box 4-1.99.
McComb, B., Zuckerberg, B., Vesely, D., and Jordan, C. 2010. Monitoring wildlifepopulations and their habitats: a practitioner’s guide. CRC Press, New York.
McCullagh, P., and Nelder, J.A. 1989. Generalized linear models. 2nd ed. Chap-man & Hall/CRC Monographs on Statistics and Applied Probability. Chapman& Hall/CRC, New York.
McCune, B., and Keon, D. 2002. Equations for potential annual direct incidentradiation and heatload. J. Veg. Sci. 13: 603–606. doi:10.1111/j.1654-1103.2002.tb02087.x.
Mech, L.D., and Boitani, L. (Editors). 2003. Wolf social ecology. In Wolves: behavior,ecology, and conservation. University of Chicago Press, Chicago, Ill. pp. 1–30.
Mech, L.D., and Peterson, R.O. 2003. Wolf–prey relations. In Wolves: behavior,ecology, and conservation. Edited by D. Mech and L. Boitani. University ofChicago Press, Chicago, Ill. pp. 131–160.
Menge, B.A., Daley, B.A., Lubchenco, J., Sanford, E., Dahlhoff, E., Halpin, P.M.,Hudson, G., and Burnaford, J.L. 1999. Top-down and bottom-up regulation ofNew Zealand rocky intertidal communities. Ecol. Monogr. 69(3): 297–330.doi:10.1890/0012-9615(1999)069[0297:TDABUR]2.0.CO;2.
Murdoch, W.W. 1966. “Community structure, population control, andcompetition”—a critique. Am. Nat. 100(912): 219–226. doi:10.1086/282415.
Neff, D.J. 1968. The pellet-group count technique for big game trend, census, anddistribution: a review. J. Wildl. Manage. 32(3): 597–614. doi:10.2307/3798941.
Neff, D.J., Wallmo, O.C., and Morrison, D.C. 1965. A determination of defecationrate for elk. J. Wildl. Manage. 29(2): 406–407. doi:10.2307/3798454.
Paine, R.T. 1980. Food webs: linkage, interaction strength and community infra-structure. J. Anim. Ecol. 49: 667–685. doi:10.2307/4220.
Painter, L.E., Beschta, R.L., Larsen, E.J., and Ripple, W.J. 2015. Recovering aspenfollow changing elk dynamics in Yellowstone: evidence of a trophic cascade?Ecology. [In press.] doi:10.1890/14-0712.1.
Parks Canada. 2010. Waterton Lakes National Park climate. Available fromhttp://www.pc.gc.ca/pn-np/ab/waterton/natcul/natcul1/d.aspx [accessed12 December 2010].
Pedlar, J.H., Pearce, J.L., Venier, L.A., and McKenney, D.W. 2002. Coarse woody
debris in relation to disturbance and forest type in boreal Canada. For. Ecol.Manage. 158(1–3): 189–194. doi:10.1016/S0378-1127(00)00711-8.
Peterson, R.O. 2007. The wolves of Isle Royale: a broken balance. University ofMichigan Press, Ann Arbor.
Peterson, R.O., Vucetich, J.A., Bump, J.M., and Smith, D.W. 2014. Trophic cas-cades in a multicausal world: Isle Royale and Yellowstone. Annu. Rev. Ecol.Evol. Syst. 45: 325–345. doi:10.1146/annurev-ecolsys-120213-091634.
Polis, G.A., and Strong, D.R. 1996. Food web complexity and community dynam-ics. Am. Nat. 147: 813–846. doi:10.1086/285880.
Power, M.E. 1992. Top-down and bottom-up forces in food webs: do plants haveprimacy? Ecology, 73(3): 733–746. doi:10.2307/1940153.
Ramsey, F., and D.W. Schafer. 2002. The statistical sleuth: a course in methods ofdata analysis. 2nd ed. Duxbury, Pacific Grove, Calif.
Ream, R.R., Pletscher, D.H., Boyd, D.K., and Fairchild, M.W. 1990. Populationdynamics and movements of recolonizing wolves in the Glacier NationalPark area. Annual report, University of Montana, Missoula.
Ripple, W.J., and Beschta, R.L. 2004. Wolves and the ecology of fear: can preda-tion risk structure ecosystems? BioScience, 54: 755–766. doi:10.1641/0006-3568(2004)054[0755:WATEOF]2.0.CO;2.
Ripple, W.J., and Beschta, R.L. 2006. Linking wolves to willows via risk-sensitiveforaging by ungulates in the northern Yellowstone ecosystem. For. Ecol.Manage. 230: 96–106. doi:10.1016/j.foreco.2006.04.023.
Ripple, W.J., and Beschta, R.L. 2012. Trophic cascades in Yellowstone: the first15 years after wolf reintroduction. Biol. Conserv. 145: 205–213. doi:10.1016/j.biocon.2011.11.005.
Ripple, W.J., Larsen, E.J., Renkin, R.A., and Smith, D.W. 2001. Trophic cascadesamong wolves, elk, and aspen on Yellowstone National Park’s NorthernRange. Biol. Conserv. 102: 227–234. doi:10.1016/S0006-3207(01)00107-0.
Robinson, B.G., Hebblewhite, M., and Merrill, E.H. 2010. Are migrant and resi-dent elk (Cervus elaphus) exposed to similar forage and predation risk on theirsympatric winter range? Oecologia, 164(1): 265–275. doi:10.1007/s00442-010-1620-6. PMID:20372929.
Sanchez, D.M., Krausman, P.R., Livingston, T.R., and Gipson, P.S. 2004. Persis-tence of carnivore scat in the Sonoran Desert. Wildl. Soc. Bull. 32(2): 366–372.doi:10.2193/0091-7648(2004)32[366:POCSIT]2.0.CO;2.
Schmitz, O.J., Hambäck, P.A., and Beckerman, A.P. 2000. Trophic cascades interrestrial systems: a review of the effects of carnivore removals on plants.Am. Nat. 155(2): 141–153. doi:10.1086/303311. PMID:10686157.
Seager, S.T., Eisenberg, C., and St. Clair, S.B. 2013. Patterns and consequences ofungulate herbivory on aspen in western North America. For. Ecol. Manage.299: 80–90. doi:10.1016/j.foreco.2013.02.017.
Sime, C.A., Asher, V., Bradley, L., Laudon, K., Lance, N., Ross, M., and Steuber, J.2010. Montana gray wolf conservation and management 2009. Annual re-port, Montana Fish, Wildlife and Parks, Helena.
Singer, F.J. 1979. Habitat partitioning and wildfire relationships of cervids inGlacier National Park, Montana. J. Wildl. Manage. 43(2): 437–444. doi:10.2307/3800353.
Skovlin, J.M., Zager, P., and Johnson, B.K. 2002. Elk habitat and selection andevaluation. In North American elk: ecology and management. Edited byD. Toweill and J.W. Thomas. Smithsonian Institution Press, Washington, D.C.pp. 531–433.
Smith, D.W., Peterson, R.O., and Houston, D.B. 2003. Yellowstone after wolves.BioScience, 53(4): 330–340. doi:10.1641/0006-3568(2003)053[0330:YAW]2.0.CO;2.
Soulé, M.E., Estes, J.A., Berger, J., and Martinez Del Rio, C. 2003. Ecologicaleffectiveness: conservation goals for interactive species. Conserv. Biol. 17(5):1238–1250. doi:10.1046/j.1523-1739.2003.01599.x.
Stephens, D.W., and Krebs, J.R. 1986. Foraging theory. Princeton UniversityPress, Princeton, N.J.
Strong, D. 1992. Are trophic cascades all wet? Differentiation and donor controlin speciose systems. Ecology, 73(3): 745–754.
Thomson, D. 2003. Ungulate pellet-group survey summary report. Banff Na-tional Park, Parks Canada, Banff, Alta.
Vucetich, J.A., Smith, D.W., and Stahler, D.R. 2005. Influence of harvest, climateand wolf predation on Yellowstone elk, 1961–2004. Oikos, 111: 259–270. doi:10.1111/j.0030-1299.2005.14180.x.
Wagner, F.H. 2006. Yellowstone’s destabilized ecosystem. Oxford UniversityPress, Oxford, UK.
Wasem, C.R. 1963. History of elk and elk management in Glacier National Park.Report submitted on June 10, 1963. Glacier National Park Archives, WestGlacier, Mont., Martinka Box 1-2.
Watt, R.A. 2009. Wildlife reports, Waterton Lakes National Park. Parks Canada,Waterton, Alta.
Western Regional Climate Center. 2010. Montana climate summaries. Avail-able from http://www.wrcc.dri.edu/summary/climsmmt.html [accessed22 December 2010].
White, C.A., Feller, M.C., and Bayley, S. 2003. Predation risk and the functionalresponse of elk–aspen herbivory. For. Ecol. Manage. 18: 77–97.
White, G.C., and Eberhardt, L.E. 1980. Statistical analysis of deer and elk pellet-group data. J. Wildl. Manage. 44(1): 121–131. doi:10.2307/3808358.
White, P.J., Proffitt, K.M., and Lemke, T.O. 2012. Changes in elk distribution andgroup sizes after wolf restoration. Am. Midl. Nat. 167: 174–187. doi:10.1674/0003-0031-167.1.174.
Eisenberg et al. 111
Published by NRC Research Press
Can
. J. Z
ool.
Dow
nloa
ded
from
ww
w.n
rcre
sear
chpr
ess.
com
by
Ore
gon
Stat
e U
nive
rsity
on
02/0
4/15
For
pers
onal
use
onl
y.