effects of activated carbon surface ...ufdcimages.uflib.ufl.edu/uf/e0/04/40/41/00001/faulconer...1...
TRANSCRIPT
1
EFFECTS OF ACTIVATED CARBON SURFACE CHEMISTRY MODIFICATION ON THE ADSORPTION OF MERCURY FROM AQUEOUS SOLUTION
By
EMILY KAYE FAULCONER
A DISSERTATION PRESENTED TO THE GRADUATE SCHOOL OF THE UNIVERSITY OF FLORIDA IN PARTIAL FULFILLMENT
OF THE REQUIREMENTS FOR THE DEGREE OF DOCTOR OF PHILOSOPHY
UNIVERSITY OF FLORIDA
2012

2
© 2012 Emily Kaye Faulconer

3
To my mother and father
4
ACKNOWLEDGMENTS
I am thankful to my twin sister, Laura Faulconer, for blazing the trail to a Ph.D.
and offering support and advice from her journey. I deeply respect her achievements,
both academically and professionally. For my mother and father, with their unwavering
support and unconditional love, I feel overwhelmed with thankfulness. I recognize my
fortune in having such dedicated, supportive, and loving parents.
I would like to thank my graduate advisor, David Mazyck, for his mentorship and
for pushing me to perform my best. I am also grateful for the guidance provided by my
advisory committee, Dr. Treavor Boyer, Dr. Paul Chadik, and Dr. Lena Ma.
I am grateful for the support of former and present members of my research
group: Amy Borello, Heather Byrne, Timothy English, Alec Gruss, Ana Maria Hagan,
Sanaa Jaman, and Taccara Williams. My research was also greatly benefited by
interactions with David Baum and Rick Loftis of Environmental Performance Solutions.
I would like to extend warm appreciation for the laboratory assistance of Ross
Beardsley, Kenneth Sherman, and particularly Natalia Hoogesteijn. I am excited to see
her do wonderful things in her pursuit of a graduate degree.
Without the constant support of my friends, I would never have persevered to
achieve such challenging goals. I express sincere appreciation for the friendship of
Katrina Indarawis, Victoria McCloud, Emi Lenes, Heather Byrne, Audra Kelly, Regena
Hudson, Judy Walden, and Clinton Williams. Their words of encouragement and
emotional support when I encountered seemingly impossible challenges were
invaluable. In their own way, each showed me my strength. Those close to me know
that I do not shy away from a challenge – but I cannot imagine achieving my goals
without these individuals that provided support, love, and energy.
5
TABLE OF CONTENTS page
ACKNOWLEDGMENTS................................................................................................. 4
LIST OF TABLES........................................................................................................... 8
LIST OF FIGURES ........................................................................................................ 9
ABSTRACT.................................................................................................................. 11
CHAPTER
1 INTRODUCTION ................................................................................................... 13
Problem Statement ................................................................................................ 13
Hypotheses ........................................................................................................... 14
Objectives.............................................................................................................. 14
2 LITERATURE REVIEW ......................................................................................... 16
Mercury ................................................................................................................. 16
History ............................................................................................................. 16
Mercury Chemistry .......................................................................................... 16
Physical and chemical properties .............................................................. 16
Mercury speciation .................................................................................... 17
Mobility and solubility of Hg complexes ..................................................... 21
Health Impacts ................................................................................................ 22
Human health impacts .............................................................................. 22
Environmental health impacts ................................................................... 24
Mercury Emissions .......................................................................................... 24
Chlor-alkali industry .................................................................................. 25
Flue gas desulphurization ......................................................................... 26
Mercury emission regulations ................................................................... 27
Aqueous mercury removal technologies ................................................... 28
Activated Carbon ................................................................................................... 29
Synthesis of Activated Carbon ........................................................................ 29
Thermal activation .................................................................................... 30
Chemical activation ................................................................................... 31
Activated Carbon Modification ......................................................................... 31
Enhanced surface oxygen functionality ..................................................... 31
Iron impregnation ...................................................................................... 32
Adsorption ....................................................................................................... 34
Adsorption theory ...................................................................................... 34
Isotherm theory ......................................................................................... 36
Aqueous phase metal adsorption .............................................................. 38
Mercury adsorption from aqueous solution ............................................... 39
6
3 MATERIALS AND METHODS ............................................................................... 51
Chemicals and Materials ....................................................................................... 51
Materials Synthesis ............................................................................................... 51
Iron Impregnation ............................................................................................ 51
Surface Oxygen Modification........................................................................... 53
Activated Carbon Characterization Methods .......................................................... 54
Porosity ........................................................................................................... 54
Instrumentation ......................................................................................... 54
Surface area ............................................................................................. 54
Pore volume ............................................................................................. 55
Pore size ................................................................................................... 56
Point of Zero Charge ....................................................................................... 56
Total Acidity Titration ....................................................................................... 57
Elemental Analysis .......................................................................................... 58
X-Ray Diffraction ............................................................................................. 58
Vibrating Sample Magnetometry ..................................................................... 59
Magnetic Adsorbent Recovery ........................................................................ 59
Adsorbent Stability .......................................................................................... 60
Aqueous Mercury Removal ................................................................................... 61
Labware Preparation ....................................................................................... 61
Mercury Quantification Methods ...................................................................... 61
Test Stand ....................................................................................................... 62
Hg Mass Balance ............................................................................................ 63
Batch Studies .................................................................................................. 63
Investigation of Adsorption Mechanisms ......................................................... 64
Influence of pH and pCl ............................................................................ 64
Sequential chemical extraction ................................................................. 64
Data Analysis ........................................................................................................ 66
4 CHARACTERIZATION OF MODIFIED ACTIVATED CARBON ............................. 71
MPAC Characterization ......................................................................................... 71
Porosity ........................................................................................................... 71
Magnetic Characteristics ................................................................................. 72
X-ray diffraction ......................................................................................... 72
Vibrating sample magnetometry ............................................................... 74
Magnetic adsorbent recovery .................................................................... 75
Adsorbent Stability: Iron .................................................................................. 75
C(O) Modified Carbon Characterization ................................................................. 76
Porosity ........................................................................................................... 76
Surface Oxygen Functionality.......................................................................... 76
5 TRACE LEVEL AQUEOUS MERCURY REMOVAL USING MODIFIED ACTIVATED CARBON .......................................................................................... 84
MPAC Results ....................................................................................................... 84
7
Controls........................................................................................................... 84
Pseudo Equilibrium Adsorption ....................................................................... 85
Contact time ............................................................................................. 85
Batch testing of synthetic waters ............................................................... 85
Adsorption Isotherms ...................................................................................... 87
Kinetics Studies............................................................................................... 88
Adsorbent Stability: Hg .................................................................................... 89
C(O) Results .......................................................................................................... 89
Controls........................................................................................................... 89
Batch Testing of Synthetic Waters .................................................................. 90
Effect of C(O) on Hg adsorption ................................................................ 90
Effect of porosity on Hg adsorption ........................................................... 91
Adsorption Isotherms ...................................................................................... 92
Kinetic Studies ................................................................................................ 92
Adsorbent Stability .......................................................................................... 93
6 ADSORPTION MECHANISMS ............................................................................ 104
Proposed Adsorption Mechanisms ...................................................................... 104
Mechanisms of Hg(0) Adsorption .................................................................. 105
Influence of pH and pCl on Hg(II) adsorption ....................................................... 105
Sequential Chemical Extraction ........................................................................... 106
Protocol Verification ...................................................................................... 106
Application .................................................................................................... 107
7 CONCLUSIONS AND RECOMMENDATIONS .................................................... 111
Magnetic Powdered Activated Carbon ................................................................. 111
Surface Oxygen Modified Carbon ........................................................................ 112
Contributions to Science ...................................................................................... 113
Future Recommendations ................................................................................... 114 APPENDIX
A MODIFICATION OF SURFACE OXYGEN FUNCTIONALITY OF BIOCHAR FOR HG ADSORPTION ...................................................................................... 115
LIST OF REFERENCES ............................................................................................ 118
BIOGRAPHICAL SKETCH ......................................................................................... 129
8
LIST OF TABLES
Table page 2-1 Stability constant values for Hg-OH and Hg-Cl compounds ............................... 43
2-2 Select anthropogenic sources of Hg .................................................................. 44
2-3 Reported ranges of chlor-alkali wastewater constituents ................................... 44
2-4 Reported ranges of FGD wastewater constituents ............................................ 45
3-1 Surface Area Calculation Methods by P/P0 range utilized.................................. 68
4-1 Porosity of various MPACs ................................................................................ 78
4-2 Magnetic characteristics of various MPACs ....................................................... 78
4-3 Magnetic solid phase extraction results for various MPACs............................... 78
4-4 Characterization of various C(O) modified carbons ........................................... 79
5-1 Hg leaching from various carbons under landfill conditions ............................... 94
6-1 Variation of Hg-DI contact pH with pHpzc of C(O) modified carbons ................. 108
6-2 Predicted Hg speciation and SCE extraction fraction for given pH and pCl values .............................................................................................................. 109
6-3 Hg distribution in SCE extraction fractions ....................................................... 109
A-1 Biochar characterization data .......................................................................... 116
A-2 Adsorption of aqueous Hg(II) by raw and modified biochar ............................. 117
9
LIST OF FIGURES
Figure page 2-1 Hydration of Hg2+ ion in water............................................................................ 46
2-2 3-dimensional geometry of Hg2+
hydration ........................................................ 46
2-3 Distribution of Hg(II) at different pH values ........................................................ 46
2-4 Mercury Eh-pH diagram for Hg-O-H-S-Cl system .............................................. 47
2-5 Distribution of Hg(II) at various chloride concentrations ..................................... 47
2-6 Hg(II) Speciation at varying pH and chloride concentrations.............................. 48
2-7 IUPAC gas adsorption isotherm classifications .................................................. 49
2-8 Nitrogen adsorption isotherm on micro- and mesoporous carbon exhibiting a closed hysteresis loop ....................................................................................... 49
2-9 Types of hysteresis loops observed during adsorption. ..................................... 50
3-1 Common acidic surface oxygen groups on activated carbon with pH above the pHpzc .......................................................................................................... 69
3-2 Vibrating Sample Magnetometer Schematic ...................................................... 69
3-3 Hysteresis loop resulting from VSM analysis ..................................................... 69
3-4 Cold Vapor Atomic Absorption Spectroscopy Schematic ................................... 70
3-5 Schematic of batch adsorption test stand .......................................................... 70
4-1 MPAC nitrogen adsorption-desorption isotherms .............................................. 80
4-2 Effect of thermal oxidation on porosity of 1:1 C:Fe ............................................ 81
4-3 BJH pore size distribution of select MPACs ....................................................... 82
4-4 Powder XRD patterns of MPAC particles before and after thermal oxidation ..... 82
4-5 BJH pore size distribution of select C(O) modified carbons ............................... 83
5-1 Background Hg mass balance ........................................................................... 95
5-2 Effect of contact time on Hg(II) adsorption ......................................................... 95
5-3 Effect of iron loading on pseudo-equilibrium adsorption of 100μg/L Hg(II) ......... 96
10
5-4 Influence of 3h oxidation at 250°C and 450°C on aqueous Hg(II) removal ........ 96
5-5 Mass balance distribution .................................................................................. 97
5-6 Hg mass balance for 3:1 C:Fe adsorbent .......................................................... 97
5-7 Hg(II) adsorption isotherm onto 3:1 MPAC ........................................................ 98
5-8 Kinetic models for the adsorption of Hg(II) onto 3:1 MPAC ................................ 99
5-9 Hg leaching from 3:1 C:Fe at various loading rates under landfill conditions ... 100
5-10 Background Hg(0) mass balance for a 30 s contact time ................................. 100
5-11 Hg removal through adsorption and volatilization for various surface-modified carbons ............................................................................................. 101
5-12 Hg(II) adsorption isotherm onto NAC-1M ......................................................... 102
5-13 Kinetic models for the adsorption of Hg(II) onto C(O)-modified carbons .......... 103
6-1 Influence of pH on aqueous Hg(II) adsorption ................................................. 110
6-2 Influence of pCl on Hg(II) volatilization ........................................................... 110
11
Abstract of Dissertation Presented to the Graduate School of the University of Florida in Partial Fulfillment of the Requirements for the Degree of Doctor of Philosophy
EFFECTS OF ACTIVATED CARBON SURFACE CHEMISTRY MODIFICATION ON
THE ADSORPTION OF MERCURY FROM AQUEOUS SOLUTION
By
Emily Kaye Faulconer
May 2012
Chair: David Mazyck Major: Environmental Engineering Sciences
Mercury (Hg), a naturally occurring element, is toxic and can lead to negative
health impacts for humans and ecosystems. Activated carbon adsorption is effective in
treating Hg-laden aqueous effluent for safe discharge. Two modifications of
commercially available activated carbon were investigated: iron impregnation to allow
for magnetic sorbent recapture and wet chemical oxidation to enhance aqueous Hg
capture. The modified carbons were characterized by nitrogen adsorption-desorption,
XRD, pHpzc, vibrating sample magnetometry, elemental analysis, and total acidity
titration. The 3:1 C:Fe magnetic powdered activated carbon (MPAC) retained a high
surface area of 790 m2/g and was 95% magnetically recoverable, with the iron present
primarily as maghemite. The characteristics of the surface oxygen modified carbons
varied based on the nature of the modifying reagent and its concentration.
The modified carbons were applied to trace level Hg solutions (100 μg/L). The 3:1
MPAC achieved the highest adsorption capacity, reaching 91% Hg removal with 2%
volatilized and 84% adsorbed. Adsorption occurs primarily as chemisorption, thus
allowing for non-hazardous residuals disposal until reaching a loading of greater than
12
800 μg Hg/ g MPAC. Surface area and point of zero charge were identified as primary
variables influencing adsorption in this system.
Hg(II) adsorption was strongly correlated with oxygen content of the C(O)-modified
activated carbons. Carbons with the highest oxygen content achieved the highest Hg(II)
removal. Contrary to expectations, a strong correlation with oxygen content was not
seen in Hg(0) adsorption. Rather, these data best fit a four variable model that identified
surface area, pore volume, pHpzc, and oxygen content, with the pHpzc being the primary
variable influencing results. Using the standardized EPA TCLP protocol, it was found
that no carbons leached Hg at levels requiring disposal as a hazardous waste at the
experimental loading rate. Kinetic models indicated both physisorption and
chemisorption adsorption mechanisms.
Hg speciation and binding mechanisms was predicted using sorbent and matrix
characteristics. The use of sequential chemical extraction to verify these operational
binding mechanisms was unsuccessful due to extraction inefficiencies and phase
transformation.
13
CHAPTER 1 INTRODUCTION
Problem Statement
Mercury (Hg) is a naturally occurring element found in air, water, and soil. The
U.S. EPA lists Hg and Hg compounds as toxic pollutants under section 307(a) of the
Clean Water Act. In aquatic ecosystems, inorganic mercury undergoes chemical and
microbial transformation to methylmercury. Methylmercury is a serious environmental
concern due to its high toxicity and ability to bioaccumulate and biomagnify [1].
Hg enters the environment from sources such as volcanoes or anthropogenically
from sources such as the chlor-alkali industry, coal-fired power plants, battery
manufacturing, metal mining, and the pharmaceutical industry. The toxic nature of Hg
was fully realized in the late 1950’s, when the industrial release of methylmercury into
Minamata Bay resulted in Hg poisoning of the local population through consumption of
contaminated fish and shellfish. Industrial Hg release continues today. The EPA’s
Toxics Release Inventory stated that the total disposal or release of Hg in the United
States increased by 1.9 million pounds from 2006 to 2007, a 38% increase [1]. Current
Hg discharge limits for industrial effluent vary by region [2].
As Hg regulations become increasingly strict, new effluent control technologies will
be required to treat trace levels of aqueous Hg. The traditional technologies for aqueous
Hg treatment, including precipitation and adsorption, have struggled to treat to ng/L
effluent levels that are required to ensure the health of the environment and humans.
Any residual Hg that remains in the wastewater upon discharge can persist in its
dissolved or particulate form and may undergo transformation to methylmercury [3].
14
Thus, it is vital to control Hg discharges wherever possible in order to protect the health
of humans and the environment.
Activated carbon, a high surface area sorbent, has been used for many
applications in aqueous treatment. Recent research has focused on enhancing the
effectiveness of activated carbon by modifying specific properties, chemically and
physically. It is possible to tailor the surface chemistry of activated carbon to increase
adsorption capacity and selectivity for Hg. Modification by iron impregnation can provide
the carbon with magnetic properties, allowing for magnetic capture and thus easier
residuals disposal. This study focuses on understanding the surface chemistry reactions
between aqueous Hg and activated carbon, in order to develop a sorbent that can be
applied to water with varying characteristics, is recoverable from aqueous solution, and
can treat trace levels of Hg.
Hypotheses
1. The impregnation of activated carbon with ferrimagnetic iron oxides (magnetite and maghemite) would allow for magnetic separation and thus more responsible residuals disposal.
2. Iron impregnation would not significantly impact the adsorption capacity of the composite sorbent.
3. Matrix characteristics such as pH and pCl would influence Hg speciation and thus adsorption mechanisms.
4. Wet chemical oxidation of activated carbon would increase surface oxygen functionality; increased surface oxygen functionality would increase Hg adsorption capacity.
Objectives
1. Synthesize magnetic carbons that are at least 95% recoverable through magnetic separation.
2. Increase acidic C(O) on activated carbon surfaces with minimal pore degradation.
15
3. Characterize carbons with various techniques including nitrogen adsorption-desorption, point of zero charge, and total acidity.
4. Determine which experimental conditions yield the highest removal of aqueous Hg.
5. Predict the influence of matrix pH and pCl on Hg speciation; propose Hg adsorption mechanisms.
16
CHAPTER 2 LITERATURE REVIEW
Mercury
History
Mercury (Hg) has been used by humans throughout history for various purposes
including mirror production and medicines, despite awareness of its poisonous
properties. In 1527, Paracelsus wrote of the occupational disease “mercurialism” that
appeared among workers in Idrija, Slowenia [3]. As mercury toxicity became better
understood, its use in dental amalgams and pharmaceuticals diminished, with a few
exceptions. Even with the current understanding of mercury toxicity, some cultures
continue to use mercury for rituals as well as cosmetic and pharmaceutical purposes.
Artisanal gold mining, which often uses elemental Hg-Au amalgamation for gold
recovery, has been increasing over the past few decades, leading to a resurgence in
mercury use.
Mercury Chemistry
Physical and chemical properties
The heavy metal mercury has an atomic number of 80, an atomic mass of 200.59,
and a density of 13.55 g/cm3. Mercury has an electron configuration of [Xe]5s2p6d106s2,
with the highest energy electron occupying a d-orbital. With a melting point of -39.8°C,
Mercury is the only metal that is a liquid at standard temperature and pressure (STP).
Mercury has three oxidation states, Hg(0) (elemental Hg), Hg(I) (mercurous Hg), and
Hg(II) (mercuric Hg).
17
Mercury speciation
Three broad categories of Hg speciation are elemental (Hg(0)), inorganic (Hg(I)
and Hg(II)), and organic mercury. These chemical forms impact its solubility and
reactivity as well as its mobility, bioavailability, toxicity, bioaccumulation, and
biomagnification [4]. Elemental mercury has a high vapor pressure (14 mg/m3 at 20°C)
and is soluble in water up to approximately 60 μg/L. Inorganic mercury occurs as Hg(I)
and Hg(II) salts. Many Hg(II) salts are readily soluble in water and thus are highly
mobile and toxic. A notable exception is HgS, which has a solubility of ~10 ng/L.
Inorganic mercury has a high affinity for selenium, which can explain the protective role
it plays in mercury toxicity. Inorganic mercury also has a high affinity for sulfur, including
amino acids such as cysteine and methionine, which explains its high toxicity. Hg(I) is
less stable than Hg(II) and is only sparingly soluble, resulting in lower toxicity. Organic
mercury consists of a covalent bond between a divalent Hg atom and carbon. These
compounds can react with biologically important ligands and can easily cross biological
membranes.
Mercury can cycle between the atmosphere (air), hydrosphere (water), and
lithosphere (land), as well as transfer through the food chain. The most common forms
of Hg found in the environment are metallic Hg, mercuric sulfide, mercuric chloride, and
methylmercury. The main dissolved Hg species in aquatic environments are Hg(0),
Hg(II) complexes, and organic Hg forms, primarily as monomethylmercury cation and
dimethylmercury [3]. For the purposes of this work, the focus will be on aqueous Hg
chemistry, excluding methylmercury.
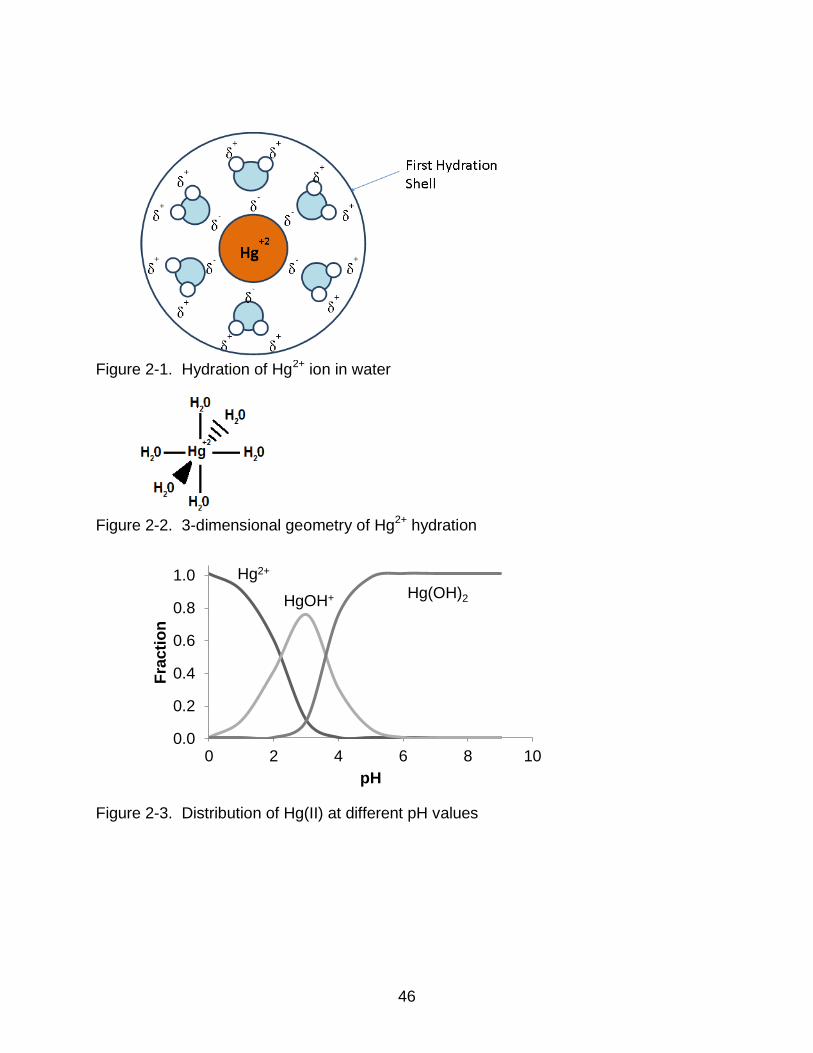
Formation of hydration spheres. When an Hg2+ ion is placed in water, the
hydrogen bonding network of the water is altered as the water molecules rotate so that
18
their negative dipoles face the opposite charge of the Hg ion, thus breaking hydrogen
bonds. This group of water molecules is called a hydration shell. The new orientation
results in a net charge of the same sign as the ion on the outside of this hydration shell
(Figure 2-1). This charge then tends to orient nearby water molecules, causing a
second hydration shell and resulting in further disruption of the hydrogen bonding
network.
In the first hydration sphere, the attraction of the water’s negative dipole to the
metal cation causes a distortion in the water’s O-H electron cloud, weakening the bond
and allowing for easier dissociation of the water molecule. This phenomenon results in
the metal ion acting as a polyprotic acid as the complexed water deprotonates [5].
Mercury complexation with H2O. Without complexing ligands present, hydrolysis
plays a large role in speciation. At a low pH (below pH 2), the hexaqua ion, Hg(H2O)62+,
is octahedrally coordinated by water molecules with equal Hg – O bond lengths (Figure
2-2). As the pH increases, the octahedral coordination is distorted. This results in two
axial oxygen atoms with a shortened Hg – O bond length and four equatorial oxygen
atoms with lengthened Hg – O bond lengths [6]. Up to two protons can be released from
the waters of hydration surrounding the Hg2+ ion (Equations 2-1 to 2-2 [7]) as Hg2+
hydrolyzes to HgOH+ and Hg(OH)2 (Figure 2-3). In the absence of complexing ligands,
Hg(OH)2 is the dominant inorganic species at pH 6 [8].
Hg2+ + H2O ⇄ HgOH+ + H+ *K1 = 10-3.4 = {H+}{HgOH+}/{Hg2+} (2-1)
HgOH+ + H2O ⇄ Hg(OH)2 + H+ *K2 = 10-2.7 = {H+}{Hg(OH)2}/{HgOH+} (2-2)
Hg2+ + 2H2O ⇄ Hg(OH)2 + 2H+ Koverall = 10-6.1 = {H+}2{Hg(OH)2}/{HgOH+} (2-3)
19
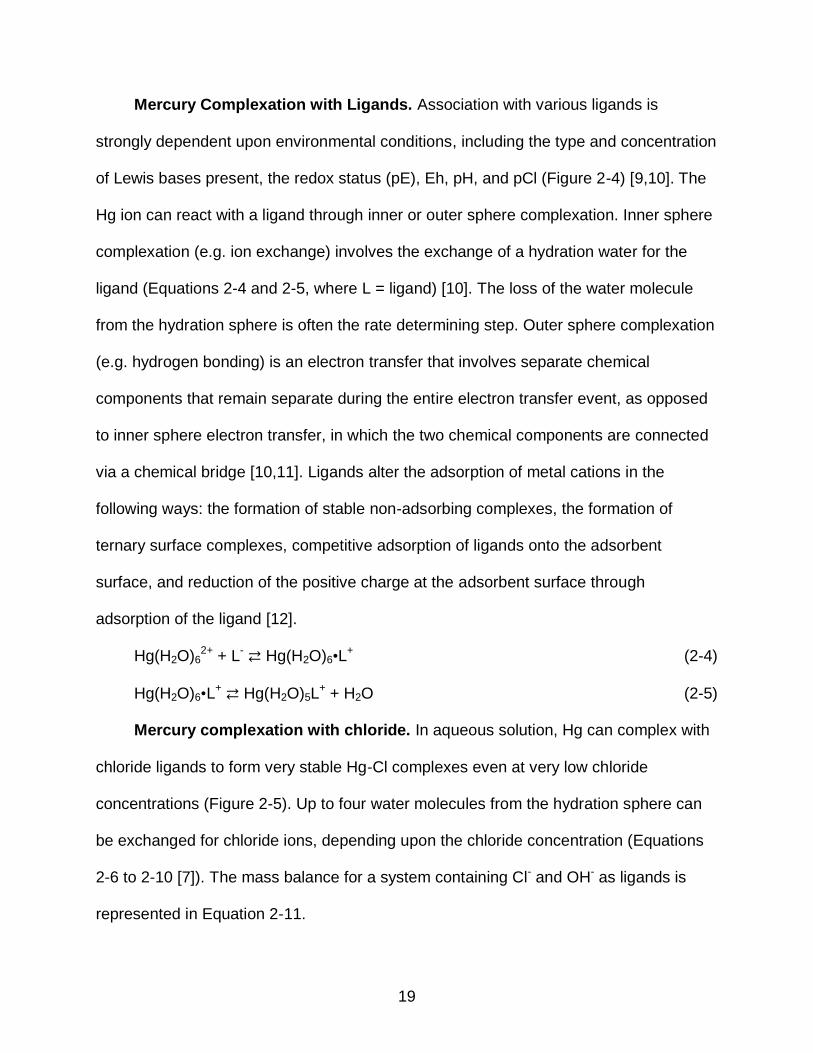
Mercury Complexation with Ligands. Association with various ligands is
strongly dependent upon environmental conditions, including the type and concentration
of Lewis bases present, the redox status (pE), Eh, pH, and pCl (Figure 2-4) [9,10]. The
Hg ion can react with a ligand through inner or outer sphere complexation. Inner sphere
complexation (e.g. ion exchange) involves the exchange of a hydration water for the
ligand (Equations 2-4 and 2-5, where L = ligand) [10]. The loss of the water molecule
from the hydration sphere is often the rate determining step. Outer sphere complexation
(e.g. hydrogen bonding) is an electron transfer that involves separate chemical
components that remain separate during the entire electron transfer event, as opposed
to inner sphere electron transfer, in which the two chemical components are connected
via a chemical bridge [10,11]. Ligands alter the adsorption of metal cations in the
following ways: the formation of stable non-adsorbing complexes, the formation of
ternary surface complexes, competitive adsorption of ligands onto the adsorbent
surface, and reduction of the positive charge at the adsorbent surface through
adsorption of the ligand [12].
Hg(H2O)62+ + L- ⇄ Hg(H2O)6•L
+ (2-4)
Hg(H2O)6•L+ ⇄ Hg(H2O)5L
+ + H2O (2-5)
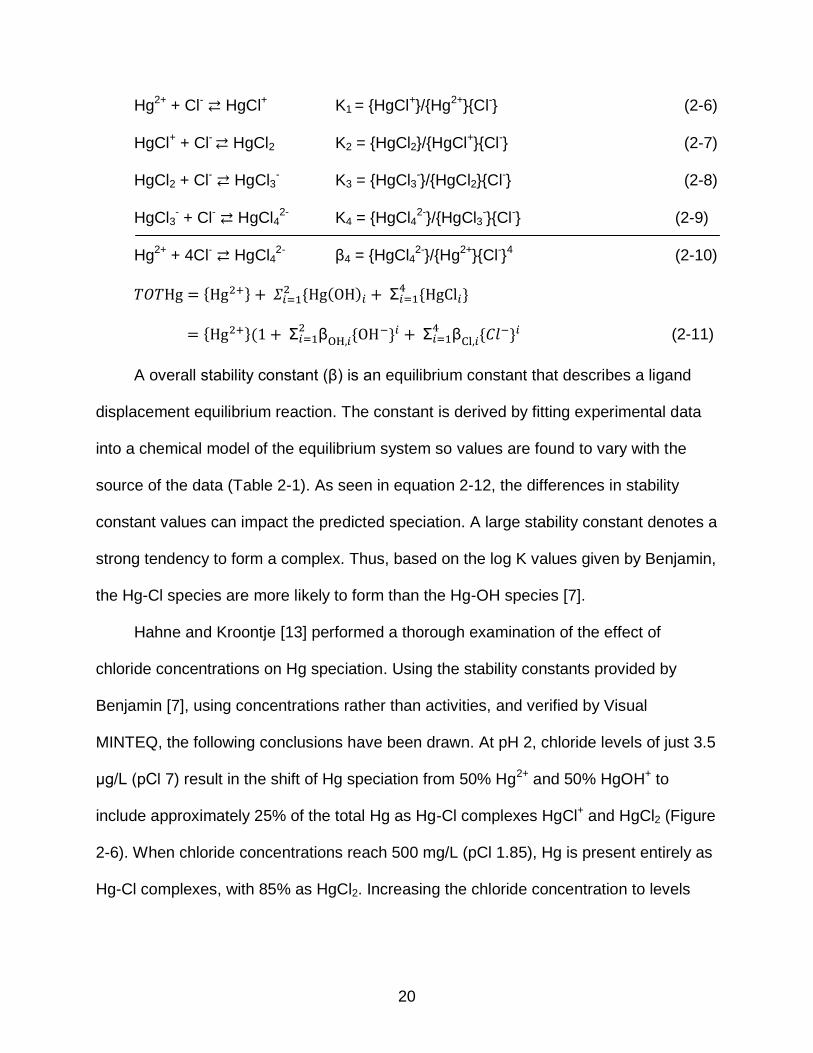
Mercury complexation with chloride. In aqueous solution, Hg can complex with
chloride ligands to form very stable Hg-Cl complexes even at very low chloride
concentrations (Figure 2-5). Up to four water molecules from the hydration sphere can
be exchanged for chloride ions, depending upon the chloride concentration (Equations
2-6 to 2-10 [7]). The mass balance for a system containing Cl- and OH- as ligands is
represented in Equation 2-11.
20
Hg2+ + Cl- ⇄ HgCl+ K1 = {HgCl+}/{Hg2+}{Cl-} (2-6)
HgCl+ + Cl- ⇄ HgCl2 K2 = {HgCl2}/{HgCl+}{Cl-} (2-7)
HgCl2 + Cl- ⇄ HgCl3- K3 = {HgCl3
-}/{HgCl2}{Cl-} (2-8)
HgCl3- + Cl- ⇄ HgCl4
2- K4 = {HgCl42-}/{HgCl3
-}{Cl-} (2-9)
Hg2+ + 4Cl- ⇄ HgCl42- β4 = {HgCl4
2-}/{Hg2+}{Cl-}4 (2-10)
{ } { ( )
{ }
{ }(
β { } β { } (2-11)
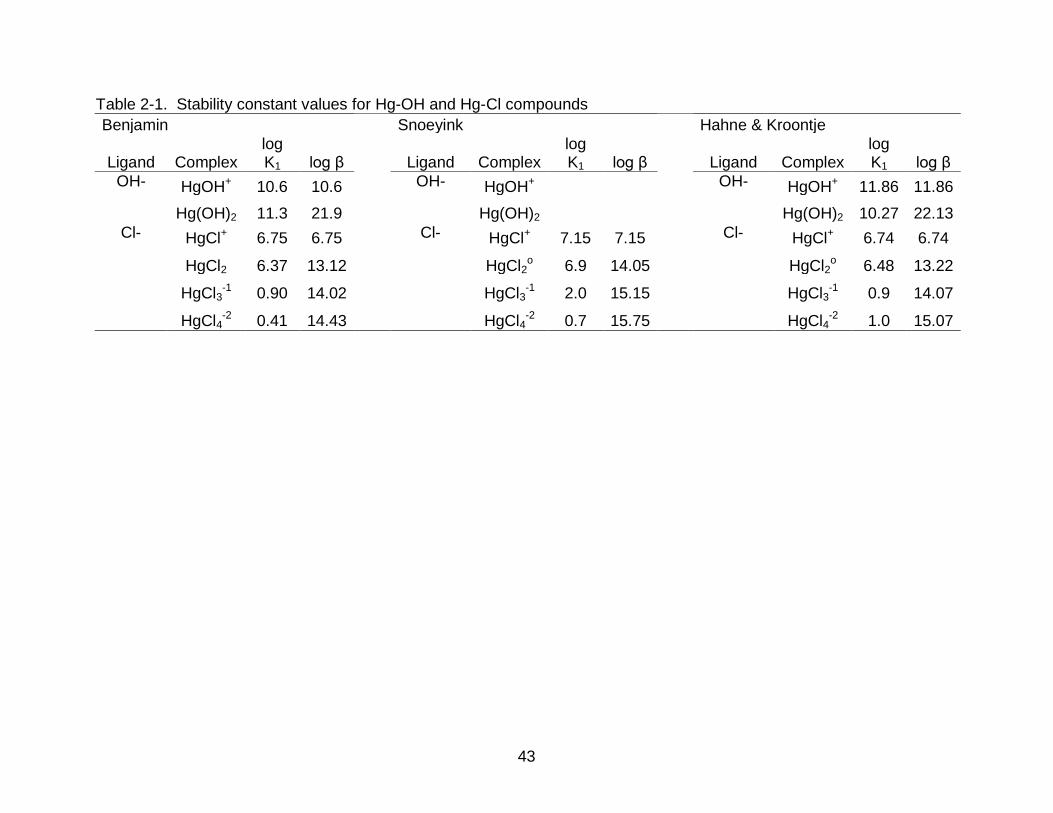
A overall stability constant (β) is an equilibrium constant that describes a ligand
displacement equilibrium reaction. The constant is derived by fitting experimental data
into a chemical model of the equilibrium system so values are found to vary with the
source of the data (Table 2-1). As seen in equation 2-12, the differences in stability
constant values can impact the predicted speciation. A large stability constant denotes a
strong tendency to form a complex. Thus, based on the log K values given by Benjamin,
the Hg-Cl species are more likely to form than the Hg-OH species [7].
Hahne and Kroontje [13] performed a thorough examination of the effect of
chloride concentrations on Hg speciation. Using the stability constants provided by
Benjamin [7], using concentrations rather than activities, and verified by Visual
MINTEQ, the following conclusions have been drawn. At pH 2, chloride levels of just 3.5
μg/L (pCl 7) result in the shift of Hg speciation from 50% Hg2+ and 50% HgOH+ to
include approximately 25% of the total Hg as Hg-Cl complexes HgCl+ and HgCl2 (Figure
2-6). When chloride concentrations reach 500 mg/L (pCl 1.85), Hg is present entirely as
Hg-Cl complexes, with 85% as HgCl2. Increasing the chloride concentration to levels
21
commonly found in chlor-alkali wastewater (25,000 mg/L) further alters the speciation to
primarily HgCl42- [13].
The major difference between Hg speciation at pH 2 and pH 4 is present at 3.5
μg/L Cl-. At pH 2, Hg exists as 25% Hg-Cl complexes, while at pH 4 all Hg is hydrolyzed
as mono- and dihydroxy species and no chloro-complexes are present. At the other
chloride concentrations investigated, the speciation did not differ much between the two
pH values [13]. At pH 6, 100% of the Hg at pCl 12 and 7 exists as fully hydrolyzed
Hg(OH)2. The speciation of Hg at higher chloride concentrations remains similar to the
distribution at the more acidic pH values of 2 and 4 [13]. Increasing to an alkaline pH
value of 8, the fully hydrolyzed Hg species is dominant, constituting 100% of the total
Hg for pCl 12 and pCl 7. At pCl 1.85, Hg(OH)2 accounts for 70% of the Hg. At this point,
HgCl2 accounts for 28% of total Hg, as opposed to the 85-89% at pH 2, 4, and 6 [13].
Mercury complexation with sulfur. Mercury is sulfophilic, with a strong affinity
for ligands containing sulfur [10]. Mercuric sulfide, HgS, is one of the least soluble salts
known and readily precipitates from aqueous solution. In the presence of chloride ions
and oxidizing conditions, Hg-Cl complexes will predominate, while reducing conditions
allow for Hg-S complexes to predominate. More soluble than mercuric sulfide, HgS22-
forms at high pH and Hg(SH)2 forms at low pH.
Mercuric complexation with nitrate. Hg(NO3)2 completely ionizes in solution to
form Hg2+ and 2 NO3-.In this system, no complexation occurs beyond Hg hydrolysis.
This reaction is relevant due to the laboratory use of Hg(NO3)2 standards.
Mobility and solubility of Hg complexes
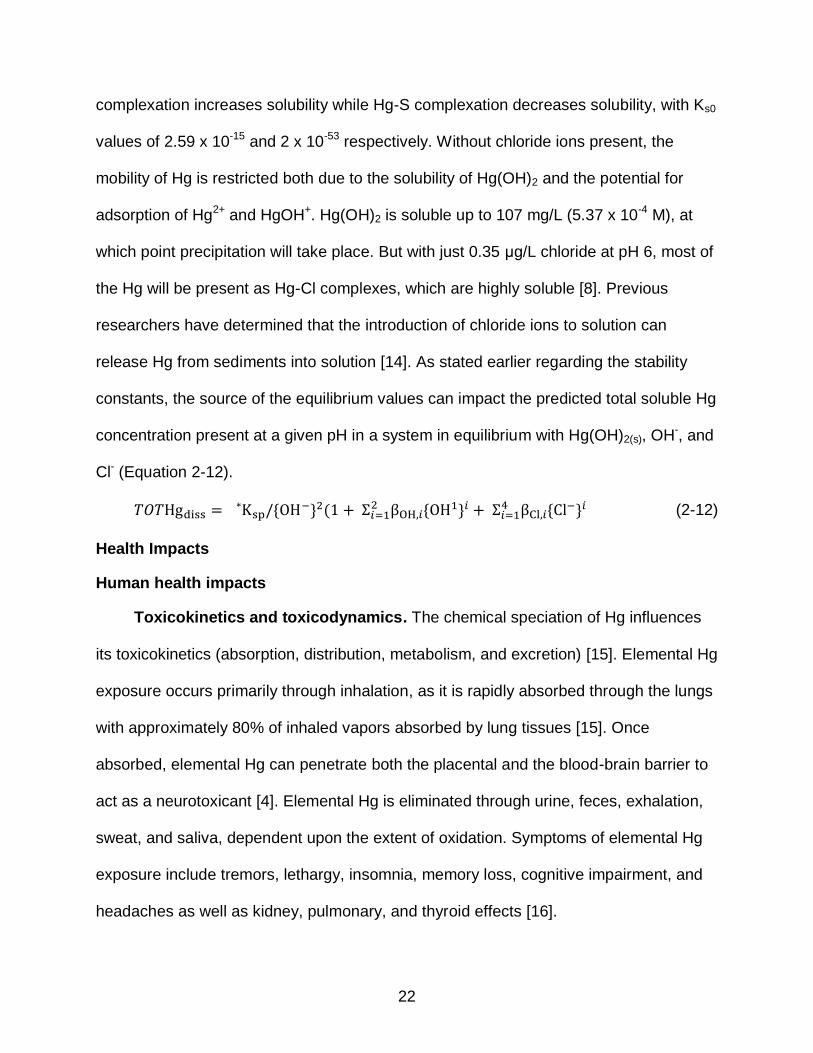
Speciation can determine the solubility and mobility of Hg in the environment, with
the degree of mobilization depending upon the degree of complexation. Hg-Cl
22
complexation increases solubility while Hg-S complexation decreases solubility, with Ks0
values of 2.59 x 10⁻¹⁵ and 2 x 10-53 respectively. Without chloride ions present, the
mobility of Hg is restricted both due to the solubility of Hg(OH)2 and the potential for
adsorption of Hg2+ and HgOH+. Hg(OH)2 is soluble up to 107 mg/L (5.37 x 10⁻⁴ M), at
which point precipitation will take place. But with just 0.35 μg/L chloride at pH 6, most of
the Hg will be present as Hg-Cl complexes, which are highly soluble [8]. Previous
researchers have determined that the introduction of chloride ions to solution can
release Hg from sediments into solution [14]. As stated earlier regarding the stability
constants, the source of the equilibrium values can impact the predicted total soluble Hg
concentration present at a given pH in a system in equilibrium with Hg(OH)2(s), OH-, and
Cl- (Equation 2-12).
{ } ( { }
{ } (2-12)
Health Impacts
Human health impacts
Toxicokinetics and toxicodynamics. The chemical speciation of Hg influences
its toxicokinetics (absorption, distribution, metabolism, and excretion) [15]. Elemental Hg
exposure occurs primarily through inhalation, as it is rapidly absorbed through the lungs
with approximately 80% of inhaled vapors absorbed by lung tissues [15]. Once
absorbed, elemental Hg can penetrate both the placental and the blood-brain barrier to
act as a neurotoxicant [4]. Elemental Hg is eliminated through urine, feces, exhalation,
sweat, and saliva, dependent upon the extent of oxidation. Symptoms of elemental Hg
exposure include tremors, lethargy, insomnia, memory loss, cognitive impairment, and
headaches as well as kidney, pulmonary, and thyroid effects [16].
23
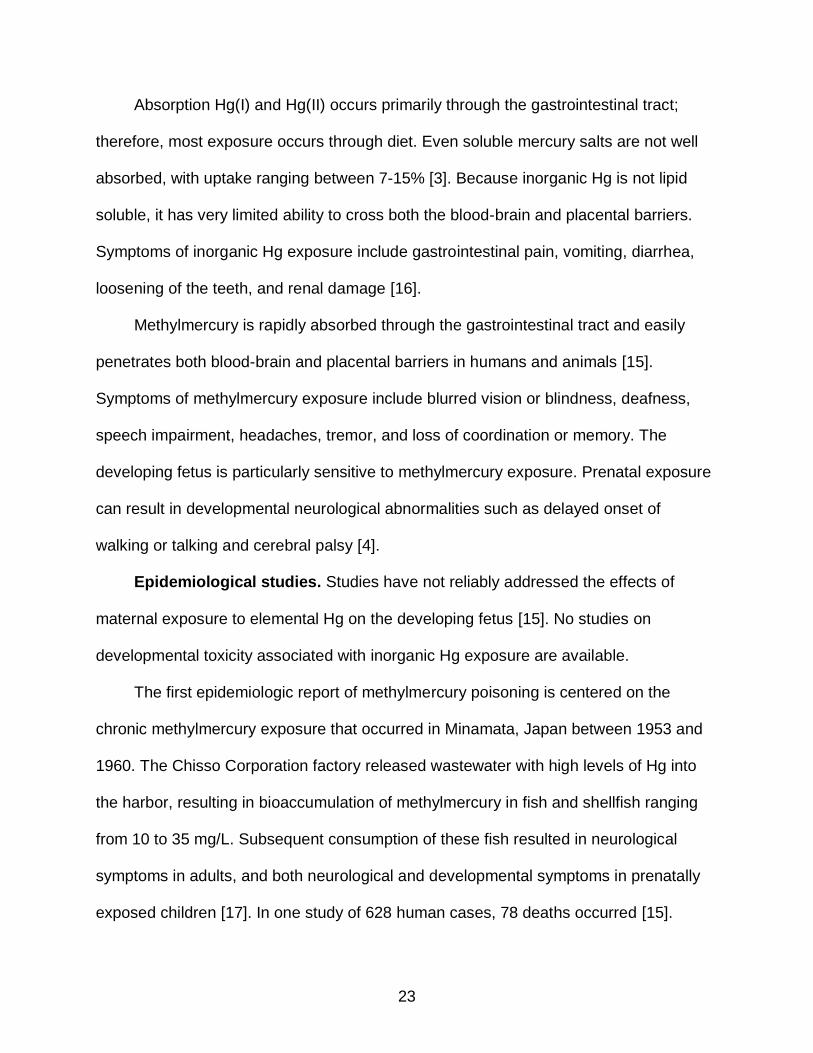
Absorption Hg(I) and Hg(II) occurs primarily through the gastrointestinal tract;
therefore, most exposure occurs through diet. Even soluble mercury salts are not well
absorbed, with uptake ranging between 7-15% [3]. Because inorganic Hg is not lipid
soluble, it has very limited ability to cross both the blood-brain and placental barriers.
Symptoms of inorganic Hg exposure include gastrointestinal pain, vomiting, diarrhea,
loosening of the teeth, and renal damage [16].
Methylmercury is rapidly absorbed through the gastrointestinal tract and easily
penetrates both blood-brain and placental barriers in humans and animals [15].
Symptoms of methylmercury exposure include blurred vision or blindness, deafness,
speech impairment, headaches, tremor, and loss of coordination or memory. The
developing fetus is particularly sensitive to methylmercury exposure. Prenatal exposure
can result in developmental neurological abnormalities such as delayed onset of
walking or talking and cerebral palsy [4].
Epidemiological studies. Studies have not reliably addressed the effects of
maternal exposure to elemental Hg on the developing fetus [15]. No studies on
developmental toxicity associated with inorganic Hg exposure are available.
The first epidemiologic report of methylmercury poisoning is centered on the
chronic methylmercury exposure that occurred in Minamata, Japan between 1953 and
1960. The Chisso Corporation factory released wastewater with high levels of Hg into
the harbor, resulting in bioaccumulation of methylmercury in fish and shellfish ranging
from 10 to 35 mg/L. Subsequent consumption of these fish resulted in neurological
symptoms in adults, and both neurological and developmental symptoms in prenatally
exposed children [17]. In one study of 628 human cases, 78 deaths occurred [15].
24
The effects of acute high level methylmercury poisoning were demonstrated in Iraq
in 1971 when methylmercury fungicide-treated seed designated for planting was instead
ground into flour and baked into bread for human consumption. Prenatally exposed
children exhibited symptoms including blindness, deafness, and paralysis [18].
Environmental health impacts
Methylmercury can be formed in aquatic ecosystems through microbial
metabolism and chemical processes. Sulfate-reducing bacteria take up Hg in its
inorganic form and convert it to methylmercury. Methylmercury moves through the food
chain when these bacteria are consumed or release the methylmercury into the aquatic
ecosystem. Top predators in the aquatic food chain, such as large fish, otter, mink, and
raptors have the highest tissue levels of Hg [19]. The process of Hg bioaccumulation is
complex and involves biogeochemical cycling and ecological interactions [4].
Natural unpolluted surface waters are reported to have total Hg levels ranging
between 0.1 and 5 ng/L. Assuming 1 ng/L total Hg and recognizing that methylmercury
accounts for 1 to 10% of total Hg, the methylmercury concentration will range from 10 to
100 pg/L, which could easily exceed the Wildlife Criteria [4].
Mercury Emissions
Mercury release can occur from natural sources such as volcanic activity and
weathering of rocks and, to a greater degree, from anthropogenic activity, both current
and historic (Table 2-2). The average abundance of Hg in the Earth’s crust is 50mg/kg
[3]. Coal-fired power production is the single largest global source of atmospheric Hg
emissions, due to both an increasing global demand for power production and
decreasing intentional use of Hg in industrialized countries.
25
The chemical form of released Hg depends upon its source, the environment, and
other minor factors. As an element, Hg is persistent and cannot be broken down to less
toxic substances. It is important to recognize that local releases of Hg have a global
effect. Mercury can transport long distances through ocean and air currents. Elemental
Hg has an atmospheric residence time of several months to one year. Some models
suggest that up to 50% of Hg deposited in North America is from external sources [4].
Major pathways of anthropogenic Hg sources to water include direct discharge,
indirect discharge, atmospheric deposition, and surface run-off and leachate from
contaminated soil and landfills. The majority of Hg in surface waters is due to air
deposition related to anthropogenic activities, both domestic and international [20].
Major point sources of Hg release to water in western countries include chlor-alkali
facilities, pharmaceutical industries, metal processing plants, offshore oil activities, and
coal-fired power plants.
Chlor-alkali industry
The chlor-alkali industry manufactures chlorine, hydrogen, and sodium hydroxide
(caustic soda). The manufacturing process involves electrolysis of a salt solution to
convert chloride ions to elemental chlorine. Three basic process variations for
electrolytic production of chlorine are diaphragm cell, Hg cell, and membrane cell, with
each using a different method to keep the chlorine product separate from the hydrogen
and caustic soda. In the Hg cell process, Hg is used as the cathode where elemental
sodium will accumulate, while the chlorine will migrate to the anode. The chlorine is
treated for sale and the sodium forms an amalgam with Hg. This amalgam is then used
to produce hydrogen gas and caustic soda [21]. Approximately 1 kg of Hg per 1000 kg
chlorine produced is lost from the process, including atmospheric losses and effluent
26
waste stream [22]. Although reliance on Hg cells at chlor-alkali facilities is diminishing, 5
Hg cell facilities are still in operation in the United States and contribute approximately
7.1 tons per year anthropogenic Hg release [19].
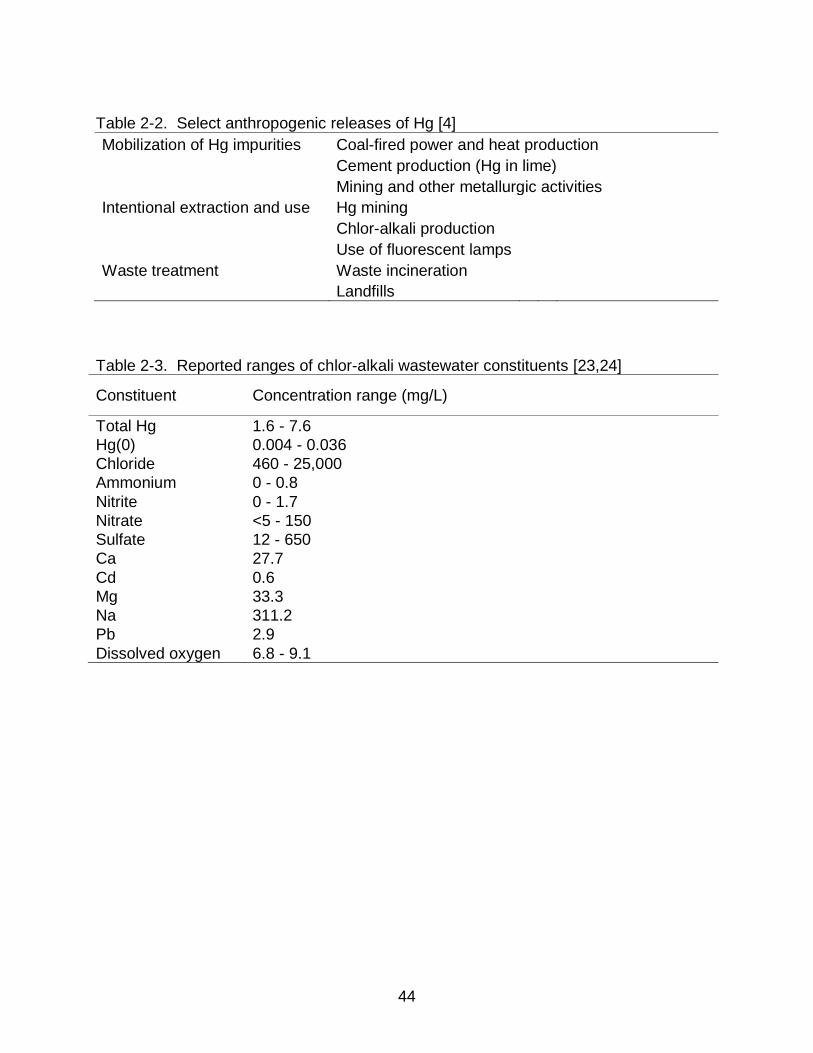
The reported constituent concentration ranges for chlor-alkali wastewater are
listed in Table 2-3. There is potential for a portion of the total Hg in chlor-alkali
wastewater to be in the elemental state. Due to the influence of pH on Hg speciation, it
is important to note that the pH of chlor-alkali wastewater tends to be either acidic (~pH
2) or basic (~pH 12) [23,24].
In 2003, the EPA lowered the Hg national emission standard for hazardous air
pollutants (NESHAP) by 3,068 kg per year, applicable to Hg cell chlor-alkali plants, Hg
ore processing facilities, and sludge incineration and drying plants. Specifically, the final
rule limited Hg emissions from Hg cell chlor-alkali plants to 2.3 kg Hg/day [25]. In March
2011, the EPA proposed further reduction of Hg NESHAP by either eliminating the use
of Hg fuel cell technology or improving work practices to reduce fugitive Hg emissions
from the cell room to near-zero levels.
Flue gas desulphurization
Hg occurs naturally in coal in varying concentrations. COALQUAL, a database that
contains analyses of over 7,000 coal samples, identifies the mean Hg concentration in
coal as 0.17 μg/g [26]. When the coal is burned, Hg is released as an air pollutant,
contributing 13-26% of the total airborne emissions of Hg in the United States [26]. This
necessitates the use of pollution control devices, such as activated carbon injection that
directly targets Hg, or flue gas desulphurization (FGD) scrubbers that target sulfur
dioxide but also co-capture oxidized Hg.
27
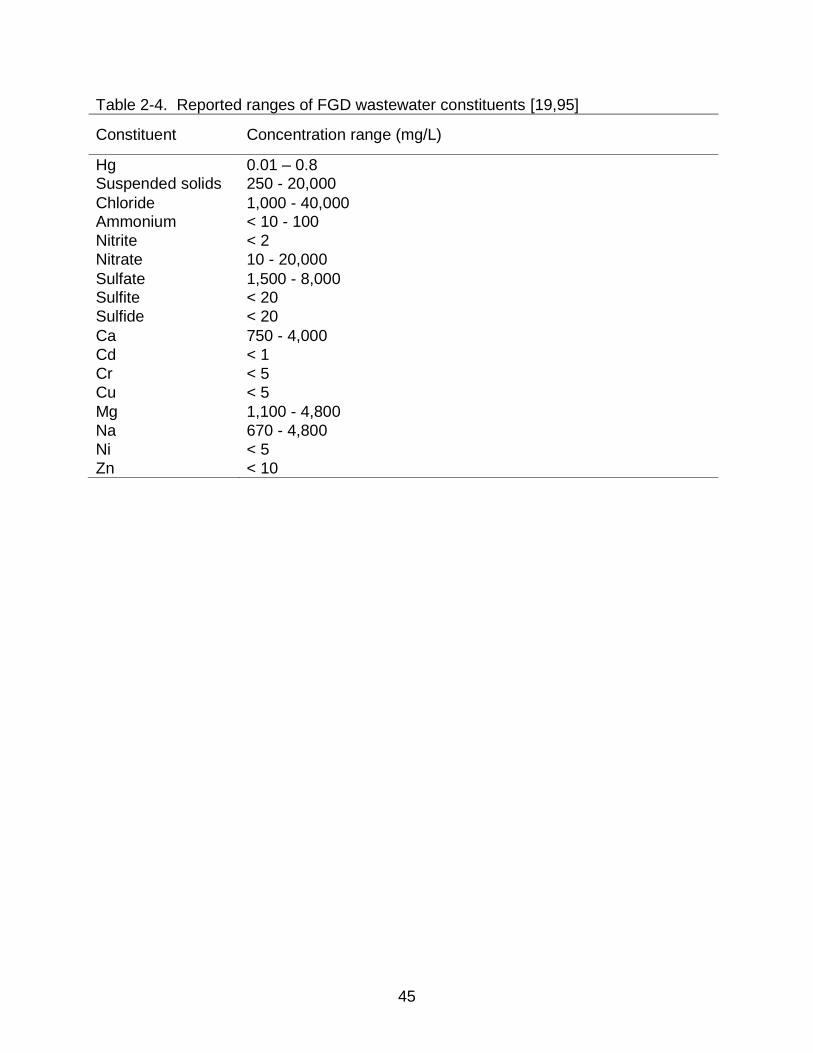
FGD wastewater typically contains 10-800 μg/L Hg, primarily in the oxidized state
[19, 27, 95]]. The wastewater also tends to contain high levels of dissolved solids,
suspended solids, and organic compounds (Table 2-4). The pH of FGD wastewater
typically falls within the range of 4.5 to 9.
The EPA is currently working to revise the effluent limitations guidelines and
standards for the steam electric power generating point source category. This category
includes FGD wastewater effluent. These new guidelines will likely address discharge
limits for a variety of metals, including Hg [28].
Mercury emission regulations
Mercury discharge is regulated under the Clean Water Act (CWA) and the
Resource Conservation and Recovery Act (RCRA). Mercury is listed as a toxic pollutant
under section 307(a) of the Clean Water Act. For the protection of aquatic life, the Clean
Water Act established mercury water quality standards (WQS) of 1.4 µg/L for an acute
dose and 0.77 µg/L for chronic exposure. Over 8,000 bodies of water in the United
States exceed WQS for Hg [20]. Some regions of the U.S. has established more strict
Hg regulations. The maximum ambient water concentration is an average 1.3 ng/L,
according to the Great Lakes Initiative Wildlife Criteria
RCRA requires that the EPA manage hazardous waste with a cradle to grave
responsibility. Because of its toxicity, Hg is considered a hazardous waste. The EPA
has established standards for the generation, transportation, storage, treatment,
disposal, and recycling of hazardous waste, including mercury-containing waste. Land
disposal restrictions exist that may require waste to be treated prior to landfilling.
28
Aqueous mercury removal technologies
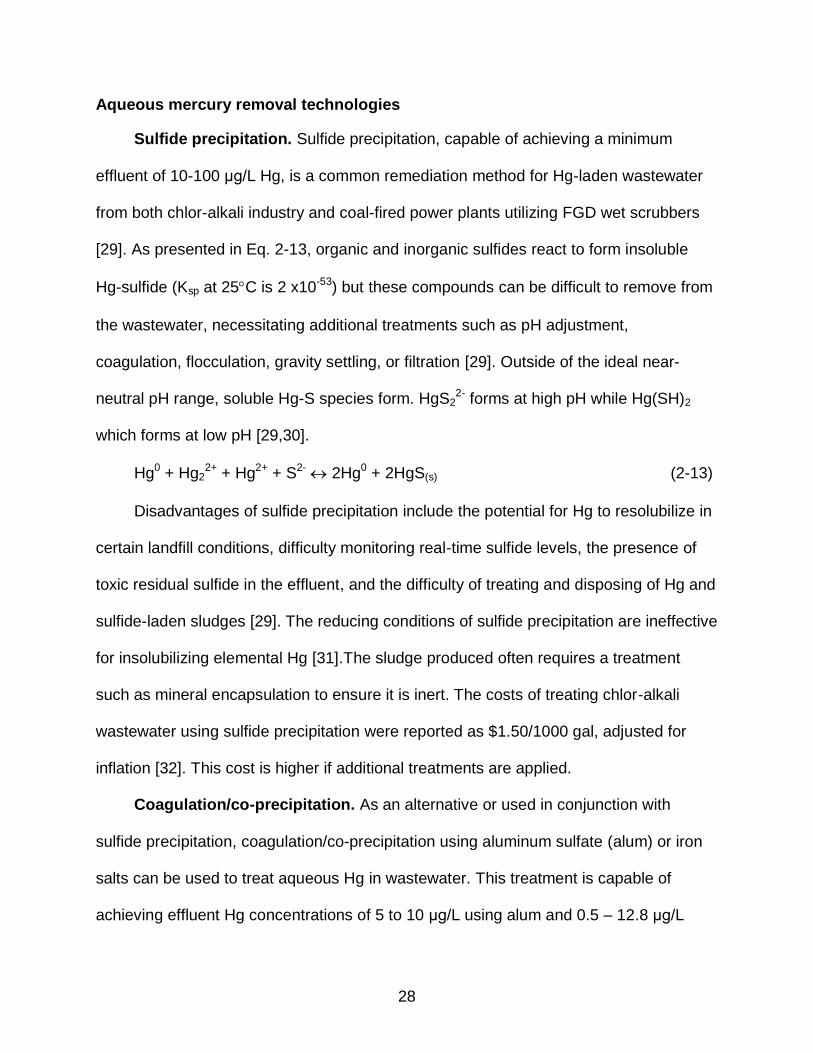
Sulfide precipitation. Sulfide precipitation, capable of achieving a minimum
effluent of 10-100 μg/L Hg, is a common remediation method for Hg-laden wastewater
from both chlor-alkali industry and coal-fired power plants utilizing FGD wet scrubbers
[29]. As presented in Eq. 2-13, organic and inorganic sulfides react to form insoluble
Hg-sulfide (Ksp at 25C is 2 x10-53) but these compounds can be difficult to remove from
the wastewater, necessitating additional treatments such as pH adjustment,
coagulation, flocculation, gravity settling, or filtration [29]. Outside of the ideal near-
neutral pH range, soluble Hg-S species form. HgS22- forms at high pH while Hg(SH)2
which forms at low pH [29,30].
Hg0 + Hg22+ + Hg2+ + S2- 2Hg0 + 2HgS(s) (2-13)
Disadvantages of sulfide precipitation include the potential for Hg to resolubilize in
certain landfill conditions, difficulty monitoring real-time sulfide levels, the presence of
toxic residual sulfide in the effluent, and the difficulty of treating and disposing of Hg and
sulfide-laden sludges [29]. The reducing conditions of sulfide precipitation are ineffective
for insolubilizing elemental Hg [31].The sludge produced often requires a treatment
such as mineral encapsulation to ensure it is inert. The costs of treating chlor-alkali
wastewater using sulfide precipitation were reported as $1.50/1000 gal, adjusted for
inflation [32]. This cost is higher if additional treatments are applied.
Coagulation/co-precipitation. As an alternative or used in conjunction with
sulfide precipitation, coagulation/co-precipitation using aluminum sulfate (alum) or iron
salts can be used to treat aqueous Hg in wastewater. This treatment is capable of
achieving effluent Hg concentrations of 5 to 10 μg/L using alum and 0.5 – 12.8 μg/L
29
using iron salts [29]. Coagulation is most efficient when used in conjunction with pH
adjustment and filtration.
Adsorption Processes. Adsorbents have the potential to achieve high Hg
removal efficiencies. Activated carbon, the predominantly applied adsorbent, is known
to adsorb Hg(II) from aqueous solutions and can reach effluent levels of 0.5 to 20 μg/L
[22,29,33-37]. However, removal levels depend highly upon the initial concentrations,
the pH, and the concentration of other pollutants competing for adsorption sites [29].
Due to isothermal behavior of the adsorbent, incremental adsorbent dosage results in
increased treatment efficiency but, unless recovery of the adsorbent is feasible, this
increases the wastewater treatment residuals that require ultimate disposal. Granular
activated carbon (GAC) is often applied as a fixed-bed unit with columns in parallel or
series. Powdered activated carbon (PAC) is often applied as a slurry and requires
subsequent solids separation. Modification of activated carbon, such as impregnation
with carbon disulfide, bromine, or ozone, have been shown to enhance Hg removal
[29,38,39]. In anticipation of new and more stringent water quality based standards,
adsorption can be used as a polishing technique to reach lower Hg concentrations in
industrial wastewater effluent [40].
Activated Carbon
Synthesis of Activated Carbon
Activated carbon is made in two steps by first heating a carbonaceous precursor in
an inert atmosphere to eliminate light and heavy carbon-based oils and non-carbon
elements as volatile gases and then activating thermally (physically) or chemically. After
activation, the surface of the carbon is heterogeneous with a typical elemental
composition of 88% C, 0.5% H, 0.5% N, 1% S, 6-7% O, and ash constituents [41]. The
30
amount of oxygen can range from 1-20% depending on raw material, activation, and
additional treatments. The heteroatoms typically occur at edges and corners of the
graphene sheet and behave similarly to the functional groups commonly found in
aromatic compounds [35,42]. The properties of activated carbon, such as surface area
and pore size, are affected by the nature of the activation method as well as the source
material [35].
Thermal activation
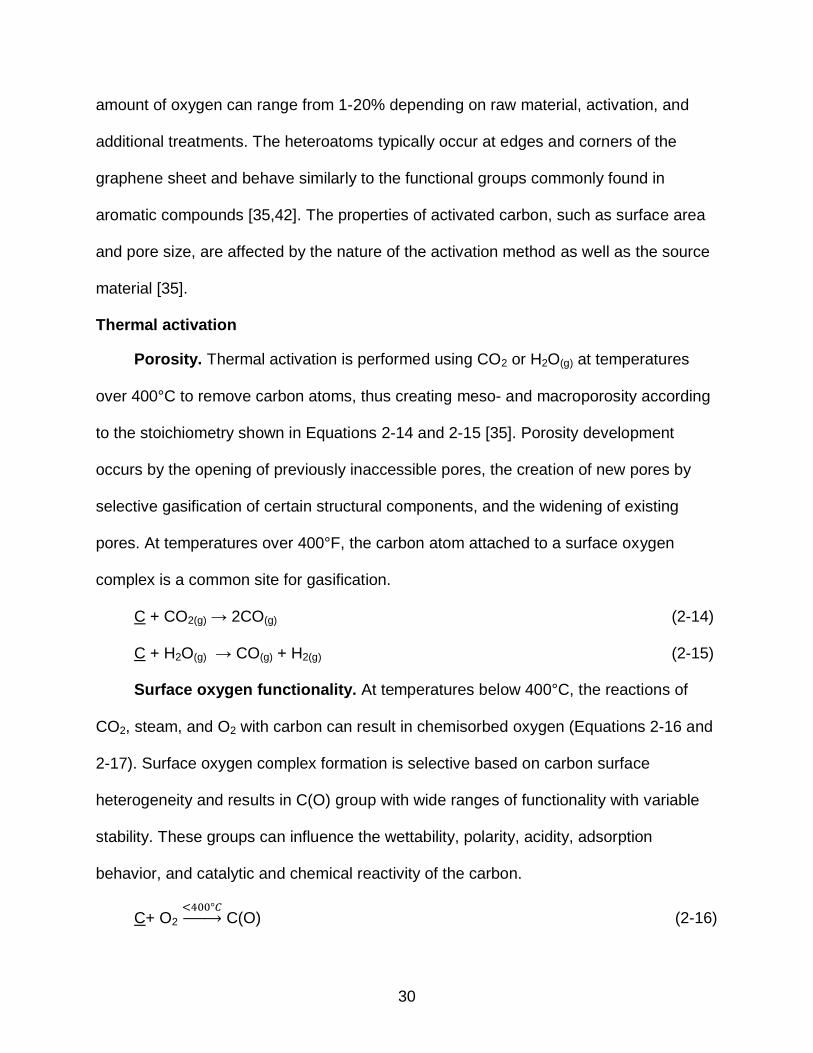
Porosity. Thermal activation is performed using CO2 or H2O(g) at temperatures
over 400°C to remove carbon atoms, thus creating meso- and macroporosity according
to the stoichiometry shown in Equations 2-14 and 2-15 [35]. Porosity development
occurs by the opening of previously inaccessible pores, the creation of new pores by
selective gasification of certain structural components, and the widening of existing
pores. At temperatures over 400°F, the carbon atom attached to a surface oxygen
complex is a common site for gasification.
C + CO2(g) → 2CO(g) (2-14)
C + H2O(g) → CO(g) + H2(g) (2-15)
Surface oxygen functionality. At temperatures below 400°C, the reactions of
CO2, steam, and O2 with carbon can result in chemisorbed oxygen (Equations 2-16 and
2-17). Surface oxygen complex formation is selective based on carbon surface
heterogeneity and results in C(O) group with wide ranges of functionality with variable
stability. These groups can influence the wettability, polarity, acidity, adsorption
behavior, and catalytic and chemical reactivity of the carbon.
C+ O2 → C(O) (2-16)
31
C + H2O(g) → C(O) (2-17)
Possible basic C(O) groups formed are pyrone, first proposed by Boehm and Voll
in 1970, and chromene, first proposed by Garten and Weiss in 1957 [42]. Although the
main source of carbon basicity is a result of these basic groups, π-basicity can weakly
contribute to the basic nature of a carbon [42].
Possible acidic groups are carboxyl, quinone, hydroxyl, carbonyl, carboxylic
anhydride, and lactone [35]. Acidic surface groups cause the carbon surface to be
hydrophilic and polar. [22] Usually, both acidic and basic groups are present on the
carbon surface. Consequently, activated carbon is amphoteric.
Chemical activation
As thermal activation primarily creates meso- and macro-pores, controlled wet
chemical activation can be used to create microporosity. Chemical activation is
commonly performed by carbonizing the precursor at 450 to 600°C in the presence of
ZnCl2, KOH, or H3PO4 [35].
Activated Carbon Modification
Modification of existing activated carbon surface chemistry features can be
performed chemically (acidic treatment or impregnation) or physically (heat treatment).
Acidic treatment enhances C(O) [43]. Physical modification enhances surface area,
pore volume, and C(O). Activated carbon surface chemistry can be manipulated using
these techniques to produce adsorbents that are tailored for a particular function.
Enhanced surface oxygen functionality
C(O) groups can be formed through acid treatment with the amount of oxygen
gained dependent upon the method and the precursor used [44-49]. Wet chemical
32
oxidation uses oxidizing aqueous solutions such as ozone [50], nitric acid [43,45,48,51],
and hydrogen peroxide [45,51]. Nitric acid is the most widely used method of increasing
the total acidity in a wet chemical oxidation [48,50]. Wet oxidations are generally
thought to minimally alter other surface chemistry characteristics such as pore size
distribution [43,45,47,49,52,52] but several researchers have found that concentrated
nitric acid oxidation reduced the BET surface area and total pore volume while the pore
width increased due to pore collapse [53-57]. Salame noted a loss in mesopore volume
specifically associated with oxidation using concentration nitric acid and ammonium
persulfate [58]. Oxidation with hydrogen peroxide increases the volume of pores having
a diameter of ~6A [45,47,59].
Iron impregnation
Researchers have previously experimented with magnetic adsorbents. Oliveira et
al. [60] created an activated carbon/iron oxide magnetic composite via fast hydrolysis at
pH 10 of a 2:1 Fe(III) : Fe(II) and 1:1, 2:1, and 3:1 C:Fe. Magnetization, X-ray diffraction,
and Mossbauer data suggest that the main magnetic phase present in the composite is
maghemite. Temperature programmed reduction (TPR) data suggests that the iron
oxides present can be reduced to magnetite, enhancing the magnetization. The
experiment also determined that the surface area loss was proportional to the iron
loading. The composites did not significantly lose magnetic strength in the pH range of
5-11. Oliveira et al. [61] also synthesized a magnetic zeolite for Cr3+, Cu2+, and Zn2+
removal from water. Gorria et al. [62] synthesized a magnetic adsorbent by depositing
nickel nanoparticles on activated carbon.
Magnetism. Iron (Fe) is a malleable transition metal with an atomic number of 26,
atomic mass of 55.85, and an electron configuration of [Ar]4s23d6. Iron exists in two
33
main oxidation states, Fe(II) (Fe2+, ferrous Fe) and Fe(III) (Fe3+, ferric Fe). Ferrous iron
spontaneously oxidizes to ferric iron, reducing solubility. The 3d electrons determine
magnetic properties. Each d orbital occupies a different orientation in space: dxy dyz dxz
dz2 dx2-y2. Coordination to oxygen or hydroxyl causes unequal energy distribution in the
d-orbitals [63].
Magnetic properties arise because of interactions between the spin moments of
the electrons and the orbital moment. Ferromagnetic materials possess parallel electron
spins, resulting in an overall net magnetic moment with large permeability (ratio of
magnetic flux density to external field strength) and large positive susceptibility (strong
attraction) to an external magnetic field. Ferromagnetic materials are spontaneously
magnetic and retain their magnetic properties after the external field has been removed
[63]. Antiferromagnetic materials possess electron spins of equal magnetic moment with
antiparallel alignment, resulting in zero overall magnetic moment, positive permeability,
and a small positive susceptibility.
Magnetite. Magnetite (Iron (II,III) Oxide) is a naturally occurring ferrimagnetic iron
oxide with inverse spinel structure and a face-centered cubic unit cell based on 32 O2-
ions. The tetrahedral sublattice (A) contains one Fe3+ atom surrounded by four oxygen
atoms while the octahedral sublattice (B) contains one iron atom, either Fe3+ or Fe2+,
surrounded by six oxygen atoms, thus forming the two interpenetrating magnetic
sublattices. The saturation magnetism of magnetite ranges from 92 to 100 Am2/kg.
Magnetite contains eight formula units, Y[XY]O4 (X=Fe2+, Y = Fe3+), per unit cell. The
unit cell edge length is 0.839 nm and surface area ranges between 4 and 100 m2/g.
Magnetite is frequently non-stoichiometric and iron can be partly of fully replaced by
34
other metal ions depending upon steric hinderance (based on atomic radii and valence).
Substitution changes the unit cell edge length and therefore can be identified via XRD
analysis [63]. Cation substitution of mercury for iron in the iron oxide structure can be
ruled out based on Goldschmidt’s rules of isomorphous substitution; The ionic radius of
mercury is too large to substitute for either ferrous or ferric ions [64].
Maghemite. Maghemite, a structural polymorph of magnetite, is a naturally
occurring ferrimagnetic iron oxide with spinel ferrite structure. Maghemite has a cubic
unit cell based on 32 O2- ions and a unit cell length of 0.834 nm. Each unit cell contains
32 O2- ions, 21 ⅓ Fe3+ ions, and 2 ⅓ vacancies. Maghemite can be considered an Fe2+
deficient magnetite. The iron cations are randomly distributed over 8 tetrahedral (A) and
16 octahedral (B) sublattices with randomly distributed vacancies limited to the
octahedral sites. Due to the structure of maghemite, the saturation magnetism can vary
from 60 to 80 Am2/kg. Maghemite has a surface area ranging from 8 to130 m2/g [63].
Adsorption
Adsorption theory
The current understanding identifies adsorption as a surface phenomenon that
results from unsaturated and unbalanced molecular forces on a solid surface that are
satisfied by attracting adsorbate molecules, atoms, or ions, resulting in a higher
concentration of these particles on the solid surface relative to the bulk solution.
Activated carbon adsorption can by physical or chemical.
Physisorption occurs through van der Waals attraction (dispersion forces).
Asymmetry of the electron distribution in the adsorbate particle causes a transient
dipole moment that, when it is approaching the solid adsorbent surface, can induce an
appropriately oriented dipole moment in a surface molecule, producing instantaneous
35
attraction. These forces are greater in the micropores where the adsorbate molecules
can be closer to each other than in the bulk aqueous phase [35]. Physisorption is a
reversible exothermic process that is not site-specific and can result in multimolecular
thickness of the adsorbed phase.
Chemisorption forces arise from redistribution of electrons between the adsorbent
and adsorbate, resulting in a site-specific irreversible chemical bond [65]. Chemisorption
results in unimolecular thickness of the adsorbed phase. Due to the nature of
chemisorption, it is much stronger than physisorption.
Three successive steps are commonly proposed to describe adsorption dynamics
on porous adsorbents. First, the solute is transported from bulk solution through a liquid
film to the carbon’s external surface (external diffusion). Next, most of the solute that
was transported from the bulk solution diffuses into the pores while a small quantity
remains on the external surface (internal diffusion). This is the rate limiting step. Finally,
the solute is adsorbed on the interior surface of the pores and capillary spaces of the
adsorbent, reaching equilibrium. These steps are influenced by the affinity of the solute
for the surface, the solvent for the surface, and the solute for the solvent [66].
Adsorption is an equilibrium process. Initially, adsorption proceeds at a rapid rate
due to the availability of surface sites for adsorption but, as adsorption sites fill, the rate
of adsorption slows while the rate of desorption increases until reaching equilibrium
where the rate of adsorption equals the rate of desorption. At a constant temperature,
adsorption equilibrium can be represented as an adsorption isotherm. Two common
isotherm equations applied to liquid phase adsorption, Freundlich and Langmuir, apply
to both chemisorption and physisorption.
36
Isotherm theory
Adsorption isotherms utilize controlled physisorption and desorption onto a
sorbent. An adsorption isotherm is the graphical representation of the relationship
between the bulk adsorbate and the amount adsorbed at a given temperature [67]. The
International Union of Pure and Applied Chemistry (IUPAC) classifies adsorption
isotherms into six categories as follows (Figure 2-7) [35,68]:
1. Type I isotherms, also referred to as Langmuir isotherms, are concave with respect to P/P0. This isotherm reaches a maximum value of adsorption. The steepness of the slope of the isotherm from P/P0 values of zero to 0.05 indicates the narrowness of the micropores. It is generally accepted that Type I isotherms represent microporous solids with a small external surface area such as activated carbon and zeolites.
2. Type II isotherms describe adsorption in the presence of both micropores and open surface. This isotherm contains an inflection point where the curve changes from concave to convex, representing where monolayer coverage ends and multilayer adsorption begins. These isotherms represent solids that are either non-porous or macroporous.
3. Type III isotherms are convex and are typical of adsorption at sites with low adsorption potential, such as organic polymeric systems.
4. Type IV isotherms are similar to Type II isotherms but includes mesoporosity. Activated carbons will not typically present a plateau in the high relative pressure region.
5. Type V isotherms are characteristic of a low energy, homogeneous, mesoporous solid.
6. Type VI isotherms characterize extremely homogeneous surfaces such as pyrolytic graphite. Measurement is performed using argon or methane rather than nitrogen.
Desorption can be slower than adsorption due to a higher activation energy, forming a
hysteresis in which the adsorption and desorption curves of the isotherms do not follow
the same path (Figure 2-8). Line PQ describes adsorption in microporosity and open
surface; smaller pore size results in a steeper PQ line. Line QR indicates reversible
37
adsorption in the smallest mesopores. Line RS indicates capillary condensation. Upon
lowering the pressure, desorption follows the line SUR.
IUPAC has established four categories of hysteresis loops (Figure 2-9). When a
hysteresis loop occurs within the multilayer range of a gas adsorption isotherm (relative
pressure of >0.2), it is usually associated with capillary condensation in mesopores,
shown as H1 and H4. The H2 and H3 hysteresis loops are intermediate between these
two extremes. The dashed lines represent low pressure hysteresis due to microporosity.
Hysteresis shape is often identified with specific pore structures. Type H1 loops are
often associated with porous materials consisting of approximately uniform spheres in a
regular array and thus a narrow pore size distribution. Type H2 loops do not have a well
defined pore size distribution or shape. This hysteresis at one point was attributed to ink
bottle pores but this view is now recognized as over-simplified. Type H3 loops is
associated with slit-shaped pores due to plate-like particles. Type H4 is also associated
with slit-shaped pores but the Type I isotherm character indicates microporosity [68].
Langmuir Isotherm equation. The Langmuir equation was the first adsorption
isotherm equation developed (Equation 2-18). This equation relates the amount
adsorbed to the equilibrium concentration of the adsorbate in the bulk solution where
Y/M is the concentration of adsorbate adsorbed (mg/L) divided by the carbon
concentration (mg/L); C is the equilibrium concentration (mg/L), and a and b are
constants, determined graphically. The assumptions in this equation are 1) adsorbate is
attached to the surface at definite localized sites, 2) each site accepts one adsorbate
particle 3) the energy state of the adsorbate is equal at all sites (energetically
38
homogenous surface with negligible lateral interactions). This equation is idealized and
thus its significance in interpreting adsorption data can be limited.
( ) (2-18)
Freundlich Isotherm equation. The Freundlich equation relates the solute
concentration on the adsorbent surface to the concentration of the solute in the bulk
solution where Y/M is the concentration of adsorbate adsorbed (mg/L) divided by the
carbon concentration (mg/L), C is the equilibrium concentration of the adsorbate in the
bulk solution (mg/L), and both k and 1/n are constants. (Equation 2-19). A plot of log
Y/M versus log C yields a straight line with a slope of 1/n and a y-intercept of k, which
holds true over a wide range of concentration values including dilute solutions [69]. The
Freundlich equation is often applied to physisorption and adsorption of solids of limited
solubility.
Y/M = kC1/n (2-19)
Aqueous phase metal adsorption
Aqueous phase adsorption involves interactions between the solute and surface,
the solvent and surface, and the solute and the solvent. Issues that must be considered
are competitive adsorption, chemical changes of the solute, and concentration changes
of the solute. The solution pH can play a large role in adsorption as the concentration of
acidic molecules is function of pH and both the dissociated and the non-dissociated
forms may adsorb. In general, low solubility favors aqueous adsorption. [42]
There are several theories regarding adsorption of metal ions. The first theory is
electrostatic adsorbate-adsorbent interaction (ion exchange). This process is entirely
dependent upon the functionality of the carbon, particularly the C(O) complexes. The
39
second theory is that enhanced adsorption potentials (dispersion forces in the narrowest
micropores) are strong enough to retain metal ions. The third theory is that of hard and
soft acids and bases (HSAB) in response to the amphoteric nature of the carbon
surface [35].
Metal adsorption can be influenced by various characteristics of the adsorbent,
matrix, and adsorbate. Adsorbent surface chemistry characteristics that influence
adsorption include surface area, pore size distribution, as well as C(O) and other
heteroatom functionality. The role C(O) complexes is determined by a correlation
between the amount of ion adsorbed and the amount of participating oxygen
functionality. Matrix characteristics that can influence metal ion adsorption include the
pH, temperature, and presence of competitively binding ions. Chemical and physical
properties of the metal ion adsorbate influence on adsorption; adsorption is affected by
ionic radius (access to porosity), solubility (hydrophobic interactions), and pKa (controls
dissociation) [35].
Mercury adsorption from aqueous solution
Hg(0) adsorption by activated carbon. While the low solubility of Hg(OH)2
allowed for removal of Hg via preferential precipitation, Hg(0) does not precipitate and
its low solubility and high volatility result in more difficult aqueous removal than oxidized
species [22,56,70,71]. Vapor phase Hg(0) adsorption by activated carbon is known to
be affected by various matrix and sorbent characteristics, including surface oxygen
functionality [22,27,56,70,71].
Gas phase research implicates C(O) complexes, reporting that two carbons with
similar sulfur, chlorine, bromine, and iodine distribution displayed very different sorption
capacities for Hg(0), most likely due to differences in surface oxygen functionality [72].
40
Li et al. [56] proposed that C(O) complexes, particularly the reducible lactone and
carbonyl groups, are possible active sites for gas phase Hg(0) adsorption, potentially
involving electron transfer from the Hg(0) to the lactone or carbonyl, followed by
subsequent adsorption of Hg(II) through well studied mechanisms. Adsorbed Hg(0) was
desorbed as Hg(II), lending support to the oxidation hypothesis. In a theoretical study,
Liu et al. [73] concluded that lactone and carbonyl favor gas phase Hg(0) adsorption
while phenol and carboxyl reduced Hg(0) capture [73]. The role of C(O) complexes in
aqueous Hg(0) adsorption is not defined in literature.
Hg(II) adsorption by activated carbon. Activated carbon is known to have a high
affinity for Hg (II). Multiple factors can influence Hg(II) adsorption, including
temperature, surface area and pore volume, and particle size [22,72,74-76].
Aqueous Hg(II) can be removed from solution by physisorption, ion exchange,
hydrogen bonding, surface precipitation, or reduction/volatilization. C(O) functionality
can contribute to Hg removal from solution [75,77]. When the pH < pzc, cationic Hg
must overcome electrostatic repulsion to exchange with the H+ of a surface oxygen
group (Equation 2-20) while anionic Hg is electrostatically attracted to the positive
carbon surface [22,35,75]. When the pH > pzc, cationic Hg is electrostatically attracted
to the deprotonated C(O) group (Equation 2-21) while mercury anions are
electrostatically repelled by the negative sorbent surface [78].
2 C-COOH + Hg2+ → (C-COO)2•Hg + 2H+ (2-20)
2 C-COO- + Hg2+ → (C-COO)2•Hg (2-21)
41
Hydrogen bonding can take place between an H atom on hydrolyzed Hg and an
electronegative surface oxygen. When Hg(OH)2 has reached its intrinsic solubility, it will
preferentially precipitate on the carbon surface rather than in solution [79].
Activated carbon has been shown at high pH values to remove mercury via
reduction and volatilization as Hg(0) [33,80]. Phenolic and hydroquinonic surface
oxygen groups have been proposed as reduction sites (Equation 2-22) [36]. Confirmed
by scanning electron microscopy, HgCl2 reduction to the sparingly Hg2Cl2 will cause
preferential precipitation onto the carbon surface while a complete reduction to Hg(0)
result in Hg volatilization from solution [81]. Many researchers do not attempt to
distinguish the mercury removed via adsorption from the mercury removed via reduction
and volatilization. The amount of Hg adsorbed can be determined by the mass balance
equation (Equation 2-23).
2(-OH) + 2HgCl2 → 2(=O) + Hg2 Cl2 + 2HCl (2-22)
[TOTHg] = [Hg(II)aq] + [Hg(0)g] + [Hg(II)ads] + [Hg(0)ads] (2-23)
Hg adsorption by iron oxides. Iron oxides including magnetite, goethite, and
ferrihydrite have been shown to adsorb aqueous Hg(II) [82-84]. The ion loading, as with
activated carbon, is a function of matrix pH (Equation 2-24 and 2-25) [63,83]. Ternary
surface complexes can also form between the surface, Hg2+,, and OH- or Cl- (Equations
2-26 and 2-27) [85]. Hg is likely to chemisorb onto Fe-oxides than to physisorb [63].
FeOH + Hg2+ → Fe-O-Hg+ + H+ (2-24)
(FeOH)2 + Hg2+ → (Fe-O)2 • Hg + 2H+ (2-25)
FeOH + Hg2+ + H2O → Fe-O-Hg-OH + 2H+ (2-26)
FeOH+ Hg2+ + Cl- → Fe-OH-Hg-Cl + H+ (2-27)

42
The presence of specific ligands can influence the adsorption of mercury onto iron
oxides [86]. Sulfate has been shown to increase Hg(II) sorption onto iron oxides by
reducing the positive surface charge and thereby reducing the electrostatic repulsion
that can inhibit adsorption of Hg cations onto the oxide surface [12].
Hg reduction by iron oxides. Oxidation of iron oxides can occur with the
reduction of an aqueous transition metal [64,87-90]. In anoxic conditions, Hg(II) is lost
as Hg(0) in the presence of magnetite, shown in Equation 2-28, in which n is the charge
transfer number and z is the valence state of the transition metal [82,90]. Reduction
rates decrease with pH.
3[Fe2+ Fe23+]O4 +
mz → 4[Fe2
3+]O3 + Fe2+ +
mz-1 (2-28)
Hg oxidation by iron oxides. In the air phase, magnetite and maghemite have
been shown to oxidize Hg(0) to Hg(II) [91]. The water content and surface area have
been shown to impact the Hg(0) oxidation [92,93]. Indirect evidence for Hg(0) oxidation
is seen in reduced adsorption in the presence of chloride ions; Elemental mercury must
ionize in order to complex with chloride ions [83,84].
43
Table 2-1. Stability constant values for Hg-OH and Hg-Cl compounds
Benjamin
Snoeyink
Hahne & Kroontje
Ligand Complex log K1 log β Ligand Complex
log K1 log β Ligand Complex
log K1 log β
OH- HgOH+ 10.6 10.6 OH- HgOH+
OH- HgOH+ 11.86 11.86
Hg(OH)2 11.3 21.9 Hg(OH)2
Hg(OH)2 10.27 22.13
Cl- HgCl+ 6.75 6.75 Cl- HgCl+ 7.15 7.15 Cl- HgCl+ 6.74 6.74
HgCl2 6.37 13.12 HgCl2o 6.9 14.05 HgCl2
o 6.48 13.22
HgCl3-1 0.90 14.02 HgCl3
-1 2.0 15.15 HgCl3-1 0.9 14.07
HgCl4-2 0.41 14.43 HgCl4
-2 0.7 15.75 HgCl4-2 1.0 15.07
44
Table 2-2. Select anthropogenic releases of Hg [4]
Mobilization of Hg impurities Coal-fired power and heat production
Cement production (Hg in lime)
Mining and other metallurgic activities
Intentional extraction and use Hg mining
Chlor-alkali production
Use of fluorescent lamps
Waste treatment Waste incineration Landfills
Table 2-3. Reported ranges of chlor-alkali wastewater constituents [23,24]
Constituent Concentration range (mg/L)
Total Hg 1.6 - 7.6
Hg(0) 0.004 - 0.036
Chloride 460 - 25,000
Ammonium 0 - 0.8
Nitrite 0 - 1.7
Nitrate <5 - 150
Sulfate 12 - 650
Ca 27.7
Cd 0.6
Mg 33.3
Na 311.2
Pb 2.9
Dissolved oxygen 6.8 - 9.1
45
Table 2-4. Reported ranges of FGD wastewater constituents [19,95]
Constituent Concentration range (mg/L)
Hg 0.01 – 0.8 Suspended solids 250 - 20,000
Chloride 1,000 - 40,000 Ammonium < 10 - 100
Nitrite < 2
Nitrate 10 - 20,000
Sulfate 1,500 - 8,000 Sulfite < 20
Sulfide < 20
Ca 750 - 4,000
Cd < 1
Cr < 5
Cu < 5
Mg 1,100 - 4,800
Na 670 - 4,800
Ni < 5
Zn < 10
46
Figure 2-1. Hydration of Hg2+ ion in water
Figure 2-2. 3-dimensional geometry of Hg2+ hydration
Figure 2-3. Distribution of Hg(II) at different pH values
0.0
0.2
0.4
0.6
0.8
1.0
0 2 4 6 8 10
Fra
cti
on
pH
Hg2+
HgOH+ Hg(OH)2
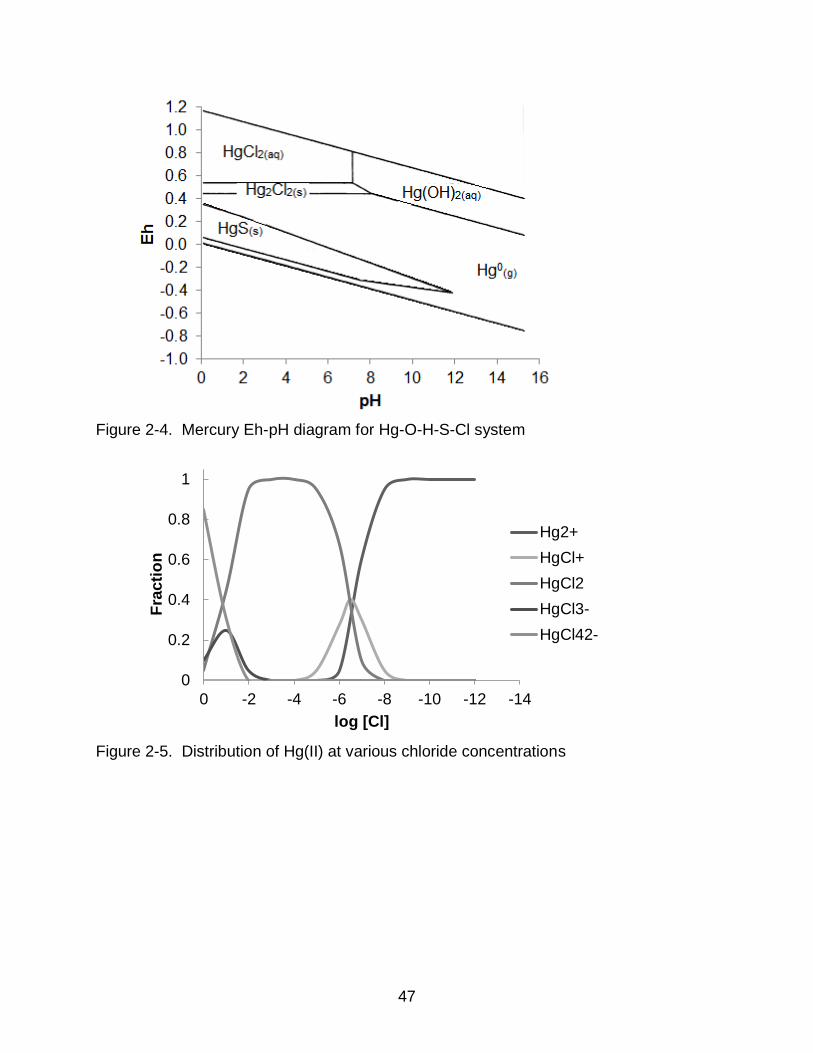
47
Figure 2-4. Mercury Eh-pH diagram for Hg-O-H-S-Cl system
Figure 2-5. Distribution of Hg(II) at various chloride concentrations
0
0.2
0.4
0.6
0.8
1
-14-12-10-8-6-4-20
Fra
cti
on
log [Cl]
Hg2+
HgCl+
HgCl2
HgCl3-
HgCl42-
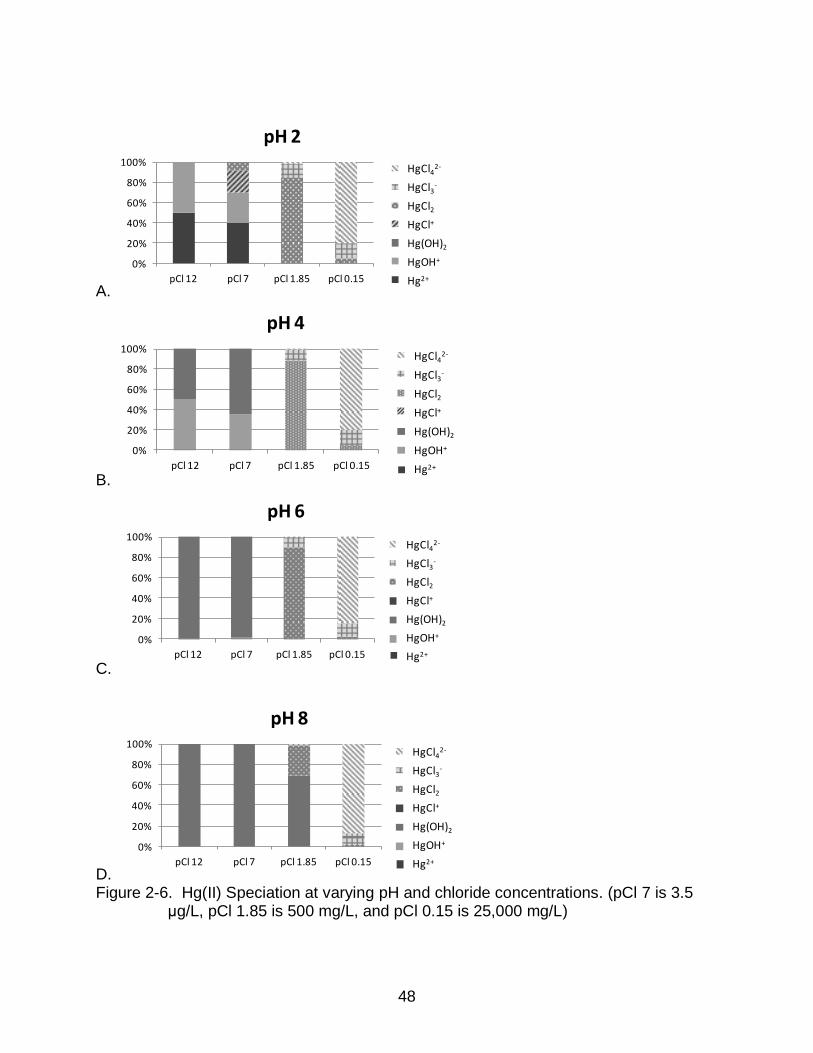
48
A.
B.
C.
D. Figure 2-6. Hg(II) Speciation at varying pH and chloride concentrations. (pCl 7 is 3.5
μg/L, pCl 1.85 is 500 mg/L, and pCl 0.15 is 25,000 mg/L)
0%
20%
40%
60%
80%
100%
pCl 12 pCl 7 pCl 1.85 pCl 0.15
pH 2
HgCl4-2
HgCl3-
HgCl2
HgCl+
Hg(OH)2
HgOH+
Hg²
HgCl42-
HgCl3-
HgCl2
HgCl+
Hg(OH)2
HgOH+
Hg2+
0%
20%
40%
60%
80%
100%
pCl 12 pCl 7 pCl 1.85 pCl 0.15
pH 4
HgCl4-2
HgCl3-
HgCl2
HgCl+
Hg(OH)2
HgOH+
Hg+2
HgCl42-
HgCl3-
HgCl2
HgCl+
Hg(OH)2
HgOH+
Hg2+
0%
20%
40%
60%
80%
100%
pCl 12 pCl 7 pCl 1.85 pCl 0.15
pH 6
HgCl4-2
HgCl3-
HgCl2
HgCl+
Hg(OH)2
HgOH+
Hg+2
HgCl42-
HgCl3-
HgCl2
HgCl+
Hg(OH)2
HgOH+
Hg2+
0%
20%
40%
60%
80%
100%
pCl 12 pCl 7 pCl 1.85 pCl 0.15
pH 8
HgCl4-2
HgCl3-
HgCl2
HgCl+
Hg(OH)2
HgOH+
Hg+2
HgCl42-
HgCl3-
HgCl2
HgCl+
Hg(OH)2
HgOH+
Hg2+
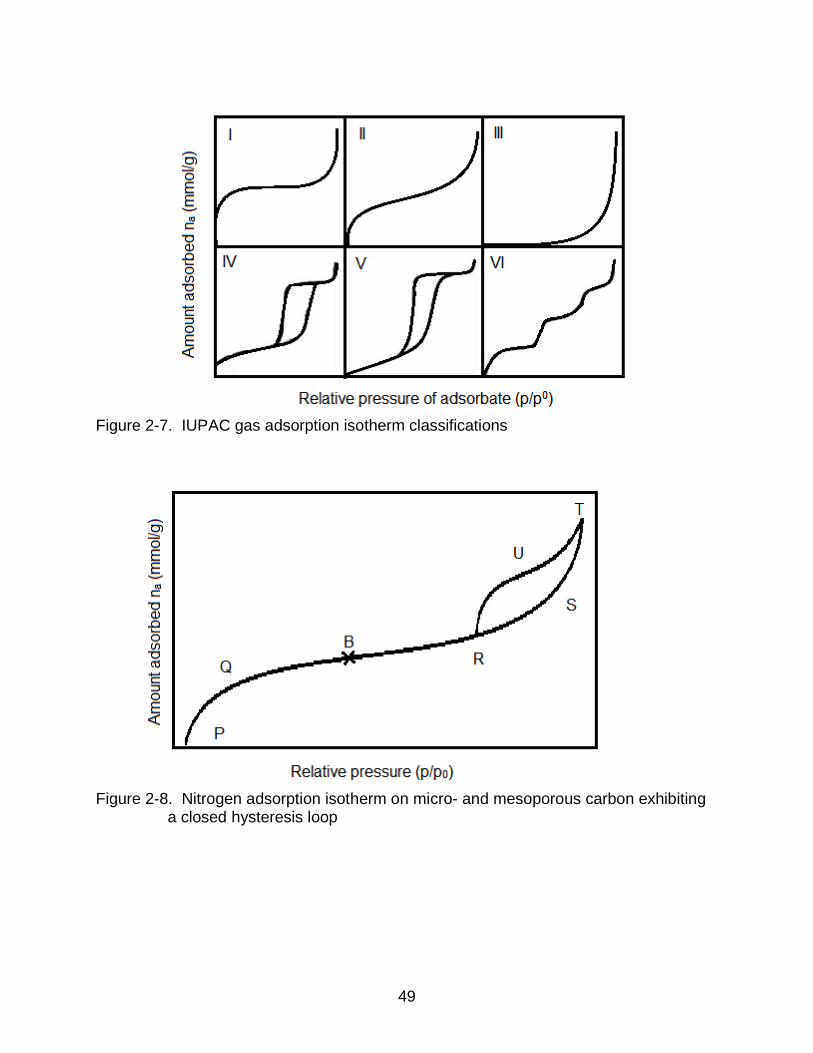
49
Figure 2-7. IUPAC gas adsorption isotherm classifications
Figure 2-8. Nitrogen adsorption isotherm on micro- and mesoporous carbon exhibiting
a closed hysteresis loop
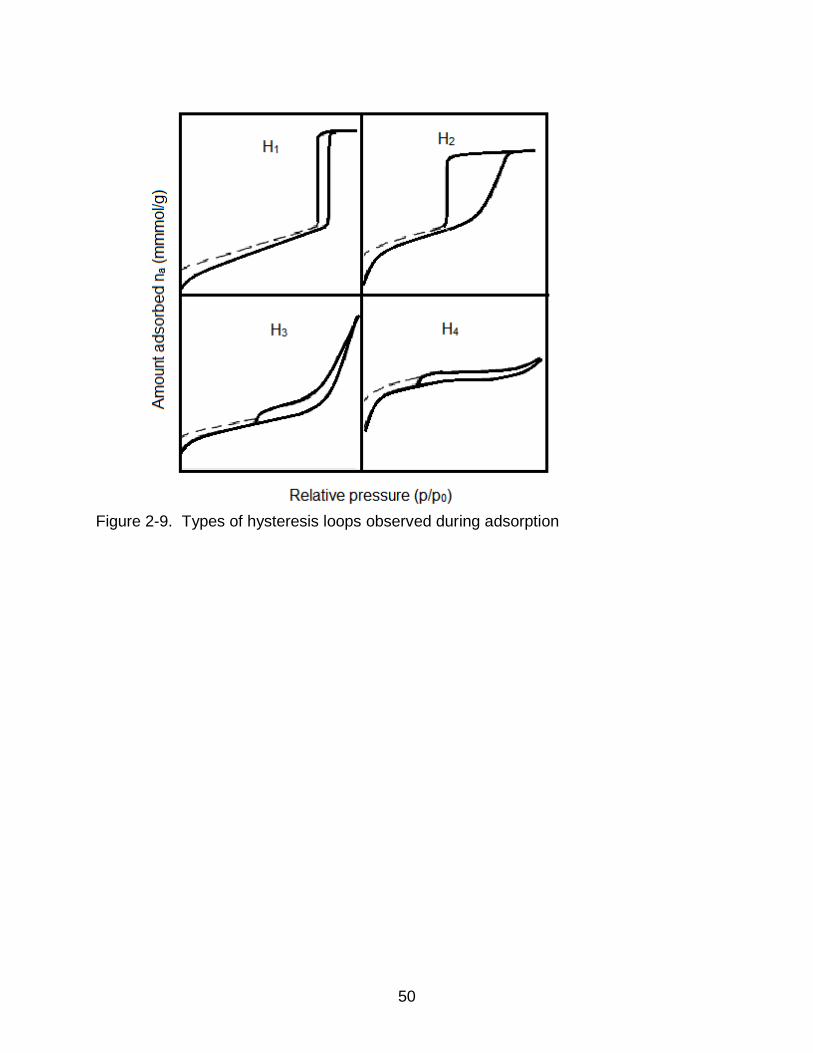
50
Figure 2-9. Types of hysteresis loops observed during adsorption
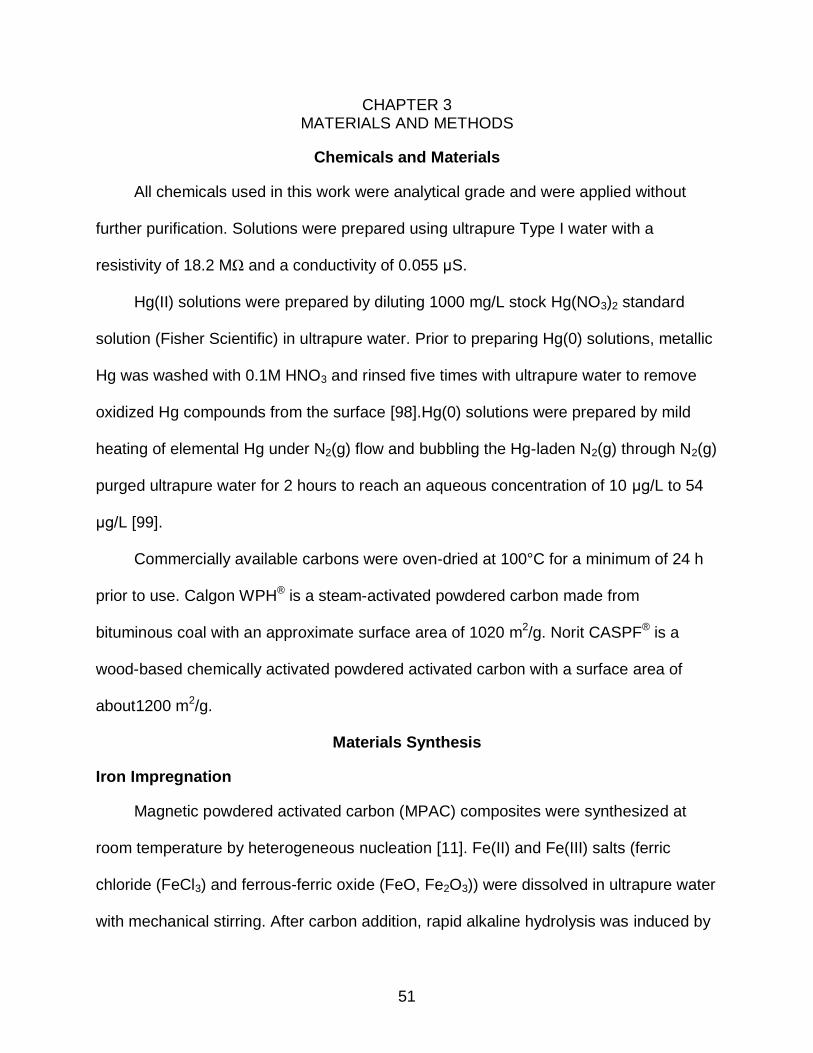
51
CHAPTER 3 MATERIALS AND METHODS
Chemicals and Materials
All chemicals used in this work were analytical grade and were applied without
further purification. Solutions were prepared using ultrapure Type I water with a
resistivity of 18.2 MΩ and a conductivity of 0.055 μS.
Hg(II) solutions were prepared by diluting 1000 mg/L stock Hg(NO3)2 standard
solution (Fisher Scientific) in ultrapure water. Prior to preparing Hg(0) solutions, metallic
Hg was washed with 0.1M HNO3 and rinsed five times with ultrapure water to remove
oxidized Hg compounds from the surface [98].Hg(0) solutions were prepared by mild
heating of elemental Hg under N2(g) flow and bubbling the Hg-laden N2(g) through N2(g)
purged ultrapure water for 2 hours to reach an aqueous concentration of 10 μg/L to 54
μg/L [99].
Commercially available carbons were oven-dried at 100°C for a minimum of 24 h
prior to use. Calgon WPH® is a steam-activated powdered carbon made from
bituminous coal with an approximate surface area of 1020 m2/g. Norit CASPF® is a
wood-based chemically activated powdered activated carbon with a surface area of
about1200 m2/g.
Materials Synthesis
Iron Impregnation
Magnetic powdered activated carbon (MPAC) composites were synthesized at
room temperature by heterogeneous nucleation [11]. Fe(II) and Fe(III) salts (ferric
chloride (FeCl3) and ferrous-ferric oxide (FeO, Fe2O3)) were dissolved in ultrapure water
with mechanical stirring. After carbon addition, rapid alkaline hydrolysis was induced by
52
adding 5 M NaOH dropwise to the solution to reach pH 10. The hydrolysis products,
Fe(OH)+ and Fe(OH)2+, reacted to form ferrihydrite which preferentially precipitated onto
the WPH® carbon surface but, due to thermodynamic instability, transformed into
magnetite (Fe3O4) (Equations 3-1 and 3-2) [100]. In the presence of atmospheric
oxygen, the magnetite is susceptible to oxidation to maghemite [63].
2Fe(OH)2+ + Fe(OH)+ + 3OH−→ (Fe3+)2(Fe2+)(OH−)8 (3-1)
(Fe3+)2(Fe2+)(OH−)8→ Fe3O4 + 4H2O (3-2)
The amount of activated carbon was adjusted to obtain 1:1, 2:1, and 3:1 C:Fe
mass ratios. Samples were rinsed with ultrapure water to remove residual NaOH until a
constant water contact pH was achieved and subsequently oven-dried at 100°C
overnight.
Although maghemite is likely the predominant iron species present on the MPAC
surface due to the synthesis technique used, small amounts of non-magnetic iron
oxides (e.g. hematite or amorphous iron oxides) may occur. Thermal oxidation may
convert some of these amorphous iron oxides to magnetic iron oxides such as
magnetite or maghemite [63]. To compare the initial synthesis product to one having
undergone thermal oxidation, representative portions of the original MPAC were
subjected to oxidation in a programmable muffle furnace (Barnstead Thermolyne
47925-80) under atmospheric air flow. The program increased the temperature by 5°C
until the desired temperature was reached (250°C, 350°C, and 450°C), held for the
desired duration (3 or 6 h), and then gradually cooled.
53
Nomenclature for the materials is based on carbon to iron ratio, the oxidation
temperature and time. For example,1:1-450-6h represents a WPH® carbon sample
impregnated with a 1:1 mass ratio of Fe prior to a 6h thermal oxidation at 450°C.
Surface Oxygen Modification
Commercially available carbons were modified by wet chemical oxidation at room
temperature by exposure to 1M, 5M, and 10M solutions of HNO3, H2SO4, and NaOH for
6h. Samples were then rinsed with ultrapure water until reaching a constant water
contact pH and subsequently oven-dried at 100°C overnight.
As a control, a sample of the virgin WPH® carbon was stripped of its surface
oxygen groups at 950°C under 150 mL/min H2(g) flow for 180 min [56,101-103]. While
temperatures under 400°C result in the formation of C(O), temperatures over 400°C
decompose acidic C(O) groups to CO2 while basic groups decompose to CO (Equations
2-17 to 2-20) [22] [101]. Anhydrides are removed at 550°C, phenols at 630°C, lactones
at 670°C, and 810°C for carbonyls and quinones [52]. The resulting carbon is basic due
to Lewis base sites, primarily delocalized π electrons on the basal planes but also
localized electron pairs at the edges of the graphene layers [101,101,104]. Using H2
rather than N2, He, or another inert gas flow minimizes O2 chemisorption after stripping
by producing relatively stable edge carbons without unpaired electrons, thus
maintaining a hydrophobic carbon surface [50,101,105]. This treatment minimally
influences porosity [49,52,56,106].
The modification process has the potential to form humic substances which may
block adsorbent porosity, reducing Hg adsorption. A humic substance removal wash of
0.1 M NaOH followed by a 0.1 M HCl rinse was investigated [107].
54
Nomenclature for the materials is based on the activated carbon used and both
the concentration and the identity of the modifying reagent. Nitric acid, sulfuric acid, and
sodium hydroxide modified carbons are identified as NAC, SAC, and SHAC,
respectively. For example, CASPF® carbon that was modified with 5M HNO3 is
represented as CASPF® NAC-5M. The H2(g) stripped carbon is identified as ACH. The
feasibility of modifying biochar rather than commercially activated carbon was also
investigated (Appendix A).
Activated Carbon Characterization Methods
Porosity
Instrumentation
Nitrogen adsorption-desorption analyses were performed using a Quantachrome
NOVA 2200e. The operating theory, based on ideal conditions, states that the moles of
nitrogen transferred from the manifold of a given volume (Vm) at temperature Ta into an
empty sample cell partly immersed in liquid nitrogen is equal to the moles of nitrogen
transferred to the cell cold zone plus the moles transferred to the warm cell zone [108].
Each sample was outgassed at 110°C under vacuum for 24 h to removed
physisorbed substances. Then, nitrogen was added and removed in finite volumes at
specific pressures with temperature held constant at approximately 77K using a liquid
nitrogen bath. The quantity of adsorbed gas plotted against the relative equilibrium
pressure results in a hysteresis loop.
Surface area
The surface area of each sample was calculated by the Brunauer–Emmett–Teller
(BET) equation (Equation 3-3 [109]) for P/P0 = 0.1 to 0.3, in which W is the weight of the
adsorbed gas at P/P0, Wm is the weight of the adsorbed gas at monolayer coverage,
55
and C is the BET constant. The BET method is the most widely used procedure for
surface area analysis of solids.
(
⁄ )
(
) (3-3)
The C constant, related to the enthalpy of adsorption of the monolayer, indicates the
degree of attraction between the adsorbed gas and the solid is sufficient to achieve
monolayer coverage. A C constant value over 200 indicates micropore filling. The BET
method assumes adsorption sites are uniform and randomly occupied, monolayer
molecules serve as sites for subsequent layer adsorption, and subsequent layers have
liquid-like properties.
When analyzing data using the BET equation, it is important to use the following
parameters to reduce the potential for error. The correlation coefficient (R2) should be
no less than 0.9975 and the C constant, calculated from the slope and y-intercept, must
never be negative. Additionally, the P/P0 value with the maximum single point BET
value should be used as the upper limit for the multipoint BET range. A minimum of
three, preferably five, relatively equally spaced data points should be used in the
multipoint BET calculation. Finally, data points that curve upward from the straight line
at low relative pressure and data points that curve downward from the straight line at
high relative pressure should not be used in the multipoint BET calculation [108].
Pore volume
Total pore volume is calculated from the amount of vapor adsorbed at the limiting
pressure, P/P0 = 0.99. This assumes that all pore space is filled with adsorbate. If no
macropores are present, the isotherm will remain nearly horizontal over the range of
P/P0 approaching unity. If macropores are present, the isotherm will rise rapidly as the
56
P/P0 nears unity. If mesopores are present, the slope should plateau near the limiting
pressure, indicating the all pore space is filled. The average pore size is estimated from
the pore volume.
Pore size
Pore volume is distributed over various pore sizes, represented by a pore size
distribution. IUPAC classifies pores according to width [68]. Macropores have a pore
diameter over 500 Å (50nm) while micropores fall under 20 Å (2nm); Mesopores fall in
between the two. Various relative pressures correspond to the sequence of gas
adsorption (Table 3-1).
Pore size calculations were based upon the Kelvin equation, which relates the
vapor pressure above a liquid to the pore diameter (Equation 3-4) [35] where γ is the
surface tension, υ is the molar volume of the liquid, R is the molar gas constant (8.314 x
107 J/mol•K), and rk is the effective radius of curvature. The equation is based on the
principle that equilibrium vapor pressure over a concave meniscus of a liquid adsorbent
is less than the saturation vapor pressure at the same temperature. Therefore, a gas
can condense as a liquid inside the porosity of a solid with sufficiently small pore radii
filling with liquid at lower equilibrium vapor pressure values, describing capillary
condensation. The pore size distributions over the mesopore region were calculated
using the Barrett–Joyner–Halenda (BJH) equation [110].
(
)
(3-4)
Point of Zero Charge
The surface chemistry of activated carbon is dominated by its amphoteric nature
which is dependent upon heteroatom content, mainly oxygen. When immersed in water,
57
carbon develops a surface charge from the dissociation of surface groups or the
adsorption of ions from solution. A negative charge can result from dissociation of acidic
C(O) while a positive charge may be due to basic C(O). When the pH is lower than the
pzc value, water donates more H+ than OH- groups so the adsorbent surface is
positively charged and attracts anions. When the pH is above the pzc value, surface
groups will dissociate, leaving the sorbent surface negatively charged, attracting cations
(Figure 3-1). Ion loading as a function of pH has also been demonstrated for the
adsorption of many heavy metals ions by activated carbon [49,111,112].
The point of zero charge (pHpzc) was determined using the abbreviated version
(10% by weight). Ultrapure water was purged with N2(g) for 20 min before carbon
addition for a 24 h contact time, after which the solution pH was obtained in duplicate
under N2(g) headspace flow using an Accumet AB 15 pH meter. The manufacturer
satted instrument sensitivity is between -1.99 and 19.99 with an accuracy of 0.01 pH
units.
Total Acidity Titration
The Boehm titration technique is a classical equilibrium acid-base titration that
provides information regarding acid/base features of the carbon surface [41,113].
Carbon samples were prepared for total acidity titration using the Boehm titration
method by adding 0.5 g carbon and 0.1 g KCl to 25 mL of 0.05 N NaOH and 0.05 N
HCl, respectively, and rotating end-over-end for 48 h [22,46,47]. The KCl was added to
increase the ionic strength of the solution. The titration is performed against a blank with
any base consumed due to neutralization of surface functional groups. Blank solutions
were prepared using 25 mL 0.05 N NaOH and 0.05 N HCl, each with 0.1g KCl. After the
elapsed contact time, carbon solutions were filtered using 0.45 μm mixed cellulose
58
filters (Fisher Scientific). Filtrate was purged with N2(g) for 10 min prior to titration. 0.05N
NaOH samples were titrated with 0.1N H2SO4 to pH 4.5 while 0.05 N HCl solutions were
titrated with 0.05 N NaOH to pH 11. Total acidity was calculated as the difference
between the volume of titrant consumed in the sample titrations and the volume of
titrant consumed in the appropriate blank titrations with the difference being due to
neutralization of surface functional groups.
Elemental Analysis
Moisture content of the carbons was determined by the mass difference before
and after heating at 90°C for 16 h. Ash content was determined by the mass difference
after heating to 650°C for 16h. Elemental composition (C,H,N) was determined by a
Carlo Erba EA 1108 elemental analyzer. Assuming negligible presence of other
elements, oxygen content was determined by mass difference.
X-Ray Diffraction
X-ray diffraction (XRD) can be used to determine purity, crystal size, disorder, and
degree of isomorphous substitution. XRD observes the interaction of electromagnetic
waves with atoms of a crystal. Common radiation sources are CoKα (0.178890nm) or
FeKα (0.193604nm). When the x-rays pass through a crystal, each atom in the structure
scatters the waves uniformly in space but in certain directions all the waves combine for
enhanced intensity. The direction of this occurrence is related to the distance between
atomic planes and the angle that the x-rays enter and leave the crystal (Bragg angle).
The XRD diagram is a plot of the observed diffracted intensity vs. Bragg angle [63].
X-ray diffraction (XRD) patterns of the MPAC were recorded using a Philips APD
3720 X-ray unit with Cu Kα radiation. XRD patterns were analyzed to identify the iron
speciation on the MPAC surface. Components were identified using the powder
59
diffraction identification number according to the International Center for Diffraction
Data. Peaks greater than 3σ of the baseline noise were used.
Vibrating Sample Magnetometry
Vibrating Sample Magnetometry (VSM) is used to measure magnetic properties as
a function of the external magnetic field strength, temperature, and time. The theory of
operation is based upon Faraday’s law of induction where if a sample is placed in a
uniform magnetic field (H), a magnetic moment (m) will be induced in the sample,
producing a voltage in stationary sensing coils proportional to the magnetic moment
induced (Figure 3-2). The data is presented as a hysteresis loop that shows the
relationship between the induced magnetic flux density (B) and the magnetizing force
(H) (Figure 3-3). Magnetic characteristics of the MPAC composites were measured
using Princeton Measurements Co. MicroMag VSM 3900.
Saturation (value of B at points a and d), occurs when almost all magnetic
domains are aligned. Therefore, increasing the magnetizing force will not significantly
increase the magnetic flux. Retentivity (value of B at point b) indicates the remanence
(level of residual magnetism) of the material when the magnetizing force is reduced to
zero. This occurs as some magnetic domains remain aligned but others have lost their
alignment. Coercivity, Hc, (value of H at point c) is the amount of reverse magnetic field
required to return magnetic flux to zero. Permeability (μ), the ratio of flux density to
magnetizing force, describes the ease with which a magnetic flux is established in the
material [114].
Magnetic Adsorbent Recovery
MPAC, easily dispersed in aqueous solution, can be retrieved using a strong
magnet such as neodymium, a rare-earth magnet. The recovery (%) of MPAC from
60
aqueous solution and adsorbent mass balance was determined using the dry mass
captured by the magnet, the dry mass retained by a 0.45 μm nitrocellulose filter after
vacuum filtration, and the dry mass of the initial MPAC dose. The contact time (5 min)
and carbon dose (1 g/L) were held constant while the MPAC species varied based on
synthesis variables. Preliminary experimentation indicated the use of a 5 min contact
time because the results did not significantly vary above this contact time while a 1 min
contact time produced considerably lower magnetic sorbent recovery from aqueous
solution.
Adsorbent Stability
Iron. As Fe is redox sensitive with ferrous iron being highly soluble, Fe effluent
levels were quantified using a spectrophotometer (Hach DR/4000 Spectrophotometer)
and Hach’s TPTZ powder pillow method 2190. This method requires 10 mL aqueous
sample to which the TPTZ Iron Reagent Powder Pillow is added, shaken for 30 s, and
allowed to react for 3 min prior to measurement. Each run was performed with
standards including a blank. The manufacturer stated estimated detection limit is 0.022
mg/L total Fe.
Mercury. As the modified carbons have adsorbed toxic Hg, their disposal is
potentially regulated under the Resource Conservation and Recovery Act. The Code of
Federal Regulations (40 CFR §261.24) identifies Hg as a contaminant that must be
tested for using the toxicity characteristic leaching procedure (TCLP; EPA method
1311). Resulting leaching must have an Hg level under 0.2mg/L in order to be
considered non-hazardous. Higher leachate levels necessitate the treatment of the
spent adsorbent as a hazardous waste, greatly increasing disposal costs as it cannot be
disposed of in a sanitary landfill.
61
The appropriate extraction fluid is determined by the water contact pH. Because
the water contact pH of the Hg-loaded sorbent was under pH 5, the following extraction
fluid was prepared: 5.7 mL glacial acetic acid, 64.3 mL 1N NaOH, to 930 mL of
ultrapure water. Ten ml of this extraction fluid was applied to 0.5 g Hg-loaded carbon
and rotated at 30 rpm for 18 h. After the elapsed contact time, the carbon was
separated from aqueous solution by vacuum filtration and the pH of the extract was
obtained before processing for Hg quantification.
Aqueous Mercury Removal
Labware Preparation
All labware used in adsorption experiments was prepared by soaking for a
minimum of 2 h in 20% HNO3 and subsequently rinsing with ultrapure water a minimum
of three times before air drying. Vessel blanks were performed on each batch of
cleaned glassware to ensure labware was free from residual mercury contamination by
exposing randomly selected labware items to a 20% HNO3 solution for 5 min and
processing as sample for analysis.
Mercury Quantification Methods
Cold vapor atomic absorption (CVAA) spectrometry is often used to quantify
aqueous Hg concentrations due to its ease of use, rapidity, selectivity, and accuracy
compared to other technologies [3]. CVAA has a detection limit of 0.1 μg/L. Atomic
fluorescence spectrometry is used to reach ng/L detection limits. The EPA has
developed several standardized methods associated with this technology.
The total mercury is determined for each aqueous sample by reducing all Hg
species present to Hg(0) with SnCl2 before transporting the vapor into the path of
radiation from a cathode ray tube (Figure 3-4). The ground state of elemental mercury
62
atoms absorb radiation from the lamp in proportion to the concentration. The reduced
signal reaching the detector is recorded. This process is based on the Beer-Lambert
Law.
In this study, total aqueous Hg concentrations were measured on a Teledyne
Hydra Atomic Absorption Mercury Analyzer using EPA method 245.1, which uses a
thermal digestion and SnCl2 reduction technique. The EPA method has a detection
range between 0.2 μg/L and 100 μg/L, which may be extended based upon sample
size, matrix characteristics, operating conditions, and instrumentation configuration. The
manufacturer-stated instrumentation detection limit is 0.2 μg/L but the operating method
detection limit (MDL) was determined to be 0.4 μg/L.
Within 24 h of collection, each sample was acidified to under pH 2 using 0.5 mL
HNO3 and 1mL H2SO4. Standards were prepared with each run. According to EPA
method 245.1, each sample was thermally digested prior to analysis using 3mL of 0.32
M KMnO4 (Fisher Scientific), 1.6 mL of 0.18 M K2S2O8 (Fisher Scientific), and 1.2 mL of
NaCl–hydroxylamine sulfate solution (2.1M NaCl, 0.73M hydroxylamine sulfate) (Fisher
Scientific).
Test Stand
The batch reactor contained a sealed Teflon mercury-carbon contact chamber with
0.8 L/min headspace N2(g) flow through an inlet/outlet port to an oxidizing purge trap
(Figure 3-5). The oxidizing purge trap to capture volatilized Hg was prepared using 0.25
M KMnO4 (Fisher Scientific) in 10% H2SO4 (Fisher Scientific) solution. All Hg(0)
experiments were performed in a glove bag under N2(g) flow. The carbons were applied
as a slurry at a 1g/L dose to Hg-spiked ultrapure water for a specified contact time, after
63
which the adsorbent was separated from solution via vacuum filtration using 0.45μm
mixed cellulose filter (Fisher Scientific).
Hg Mass Balance
An integral Hg mass balance verifies the Hg-removal performance of an
adsorbent. Based on published aqueous Hg(II) mass balances, acceptable mass
balance closure was determined to be within approximately ±15% [115,116]. This was
achieved by quantifying the residual aqueous Hg, adsorbed Hg extracted from MPAC
by HF digestion (or sequential chemical extraction where specified), and volatilized Hg
captured in the KMnO4 trap.
A total digestion was applied to quantify total adsorbed Hg. This digestion was
also applied to virgin carbons to determine trace levels of Hg contamination in the
activated carbon from the raw source material. These trace levels of contamination
were accounted for in the mass balance calculations. The HF digestion was performed
using 400 μL aqua regia (3:1, v/v concentrated HCl (J.T. Baker) to concentrated HNO3
(Fisher Scientific)), 2 mL of concentrated HF (Acros Organics), and 20 mL of saturated
H3BO3 (Acros Organics).
Batch Studies
Identifying a contact time is essential in order to reach adsorption equilibrium
during the isotherm assay. Based on the protocol described by Calgon, a 1 g/L dose of
carbon was applied to 100 μg/L Hg solution for 0–180 min [69].
Isotherm analysis is useful in evaluating the capacity of the carbon for adsorption
of specific contaminants. Isotherm analysis was performed by applying varying weights
of dried powdered activated carbon to constant volumes of Hg solution for the
equilibrium contact time previously identified, after which samples were vacuum filtered
64
using 0.45μm mixed cellulose filter (Fisher Scientific). Results were analyzed using both
the Freundlich and Langmuir isotherms.
MPAC adsorption experiments were performed at the pseudo-equilibrium contact
time of 180 min with a carbon dose of 1g/L and a mercury concentration of 100 μg/L.
Surface modified carbon adsorption experiments were performed with a contact time of
30 s due to the volatile nature of Hg(0). The carbon dose applied was lowered to
150mg/L as higher doses resulted in nearly 100% removal for most carbons. Controlled
by the solubility of Hg(0), Hg(0) doses ranged between 40 and 60 μg/L; Hg(II) solution
concentration was 50 μg/L.
Investigation of Adsorption Mechanisms
Influence of pH and pCl
Mercury speciation in the presence of a known chloride concentration at given pH
values is well understood. By manipulating these variables, Hg speciation can be
controlled and binding mechanisms can be predicted. This concept can be used to
investigate the efficiency of the SCE for predicting binding mechanisms based on
extraction fraction. Hg speciation at the identified pH and pCl values was predicted
using Visual MINTEQ. The pCl was adjusted using NaCl while pH was adjusted using
0.25M H2SO4 or 0.25 NaOH. Ionic strength, calculated using the Debye-Huckel
equation, was held constant using Na2SO4. The optimal pH and pCl for Hg(II)
adsorption by MPAC was found using a fractional factorial approach by manipulating
the pH (2, 6, and 10) and pCl (12, 6, and 0).
Sequential chemical extraction
Sequential chemical extractions (SCEs), first becoming popular in the 1980s, are
used to provide information regarding the speciation, bioavailability, and mobility of
65
metals by applying selective extractants with increasing strength to the same sample
aliquot [117,118]. The goal is to convert the bound metal into a soluble form using
specific extractants as to elucidate the binding mechanism and speciation. Once
extracted, the metals are analyzed by the appropriate analytical technique. If the
chemistry of the adsorbate is understood, extractants can be meticulously applied to
elucidating the operating binding mechanisms.
When designing an SCE, major factors to consider include the chemical nature of
the extractant, efficiency and selectivity of extractants, matrix effects such as re-
adsorption, order of extractants, and the nature of the targeted metal [118,119].
Problems with sequential extractions include selectivity less than 100%, control of
reaction conditions, and inconsistencies between extraction protocols [118,120]. It is
also possible that in removing a fraction of the metal ion, the ion may then redistribute
itself among the remaining phases (phase transformation) [121].
Several factors have been experimentally determined to have significant affects on
the results. Shaking speed should be maintained at 30 rpm [99]. The temperature
during extractions should remain at 20°C ± 2°C [99,120]. Extraction times should reach
18 ± 4 hours [99,120]. Samples should be dried until constant weight and the sample
slurries should be formulated with a 1:100 solid to extractant ratio [99,117,120,122].
When properly designed, an SCE can reach detection levels as low as 0.5 μg/L [120].
In this study, sequential chemical extraction was performed by applying the
following extractants with increasing strength to the same sample aliquot: water soluble,
ion exchangeable, surface precipitated, surface bound, poorly reducible (iron-
associated), and residual. The water soluble fraction used ultrapure water to target the
66
labile non-adsorbed Hg within the pores. The ion exchangeable fraction used 1M
ammonium nitrate to target weakly electrostatically adsorbed Hg. Ammonium nitrate
was selected because nitrate will not complex with mercury; therefore, any mercury
mobilized will be due to cation exchange with ammonium on the carbon surface. The
surface precipitated fraction was targeted using 0.11M acetic acid. At higher pH values,
acetic acid has been shown to have little to no effect on organic carbon or free iron
concentrations [122]. The surface bound mercury was targeted using 0,1M 2,3-meso-
dimercaptosuccinic acid (DMSA), a chelating agent that sequesters Hg. The poorly
reducible fraction used 0.128M diothinite, 0.3M citrate, and 1M bicarbonate (DCB) to
target the metals associated with the iron oxides by reducing Fe3+ to the more soluble
Fe2+ form, thus releasing chemisorbed Hg [118]. Due to potential metal impurities in this
reagent, a reagent blank was performed to prevent Hg contamination [122]. Residual
Hg was quantified in the final fraction using aqua regia, HF, and H3BO3 as described
above for total digestion.
Data Analysis
All experiments were performed in triplicate and average values reported. All
replicate data falls within the 95% confidence interval. Error bars represent the standard
error of the mean. The Box Behnken experimental design for response surface
methodology was used to identify the optimal MPAC for Hg removal according to the
three variables specified. The design required 17 total runs with 12 experiments and 5
replicates of the center point. The experimental design was analyzed using Design-
Expert software (version 6.0.5). Visual MINTEQ 2.61, a chemical equilibrium model,
was used to calculate metal speciation, complexation reactions, and solubility equilibria.
67
Linear regression and ANOVA analyses were performed using the statistical software
R, version 2.14.1.
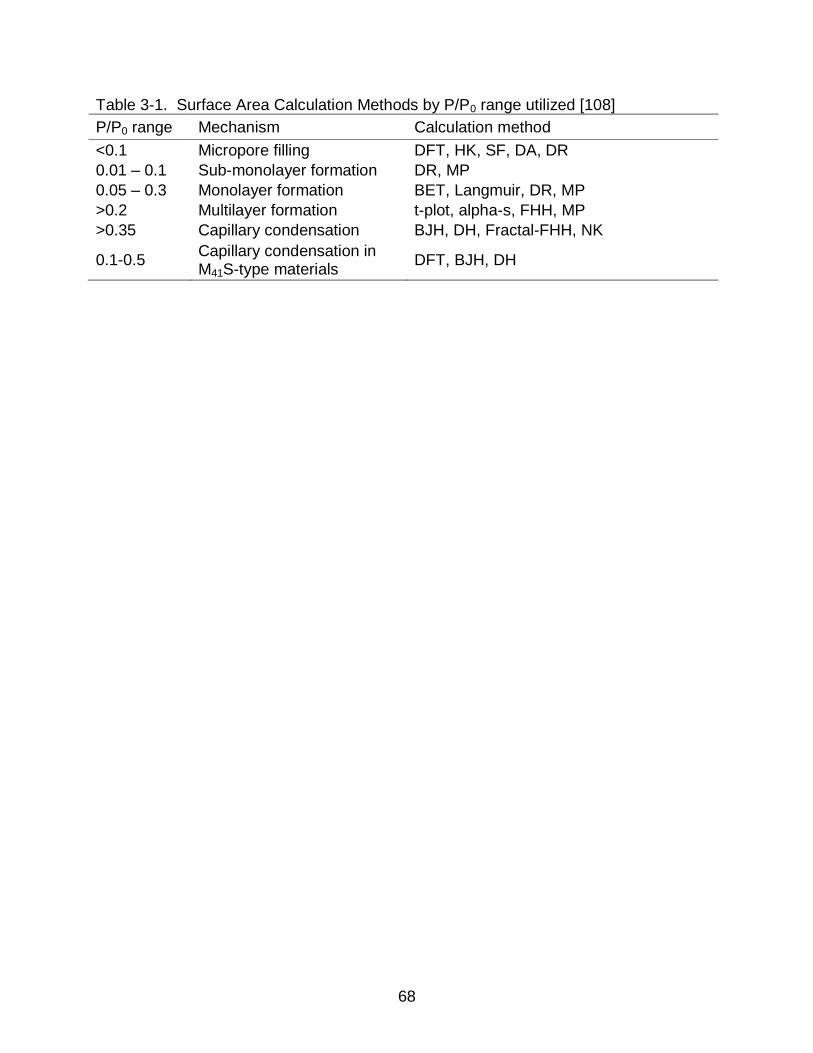
68
Table 3-1. Surface Area Calculation Methods by P/P0 range utilized [108]
P/P0 range Mechanism Calculation method
<0.1 Micropore filling DFT, HK, SF, DA, DR
0.01 – 0.1 Sub-monolayer formation DR, MP
0.05 – 0.3 Monolayer formation BET, Langmuir, DR, MP
>0.2 Multilayer formation t-plot, alpha-s, FHH, MP
>0.35 Capillary condensation BJH, DH, Fractal-FHH, NK
0.1-0.5 Capillary condensation in M41S-type materials
DFT, BJH, DH
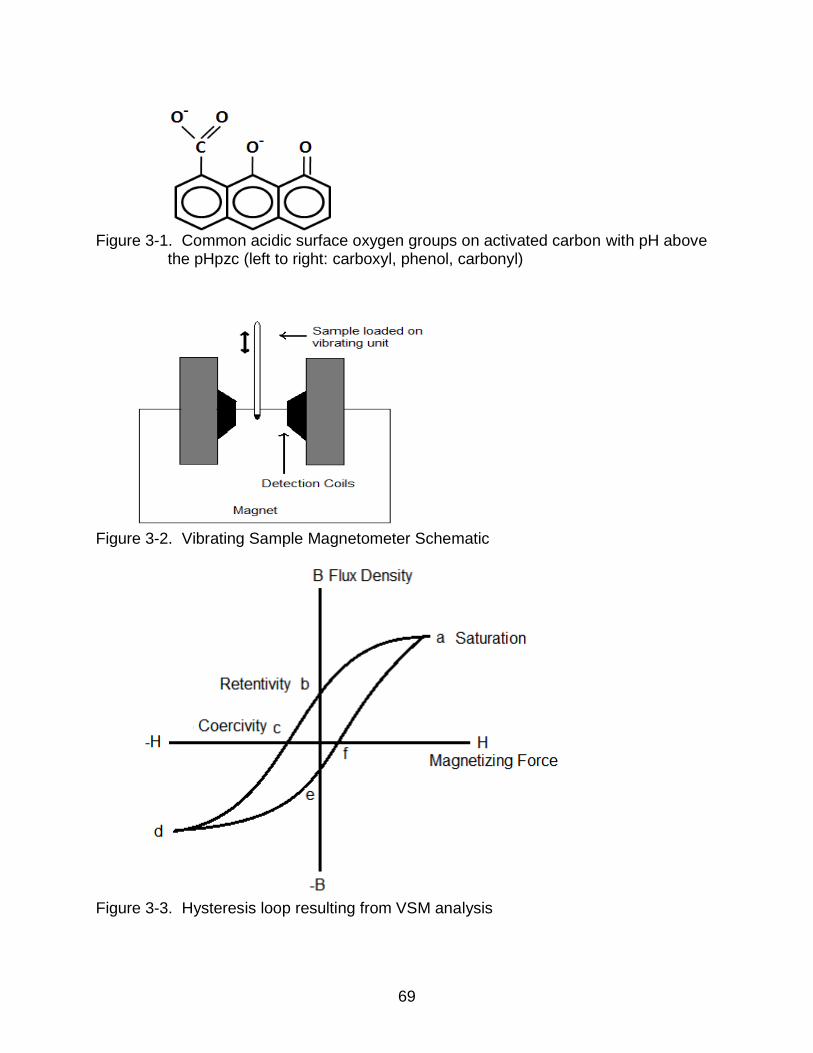
69
Figure 3-1. Common acidic surface oxygen groups on activated carbon with pH above
the pHpzc (left to right: carboxyl, phenol, carbonyl)
Figure 3-2. Vibrating Sample Magnetometer Schematic
Figure 3-3. Hysteresis loop resulting from VSM analysis
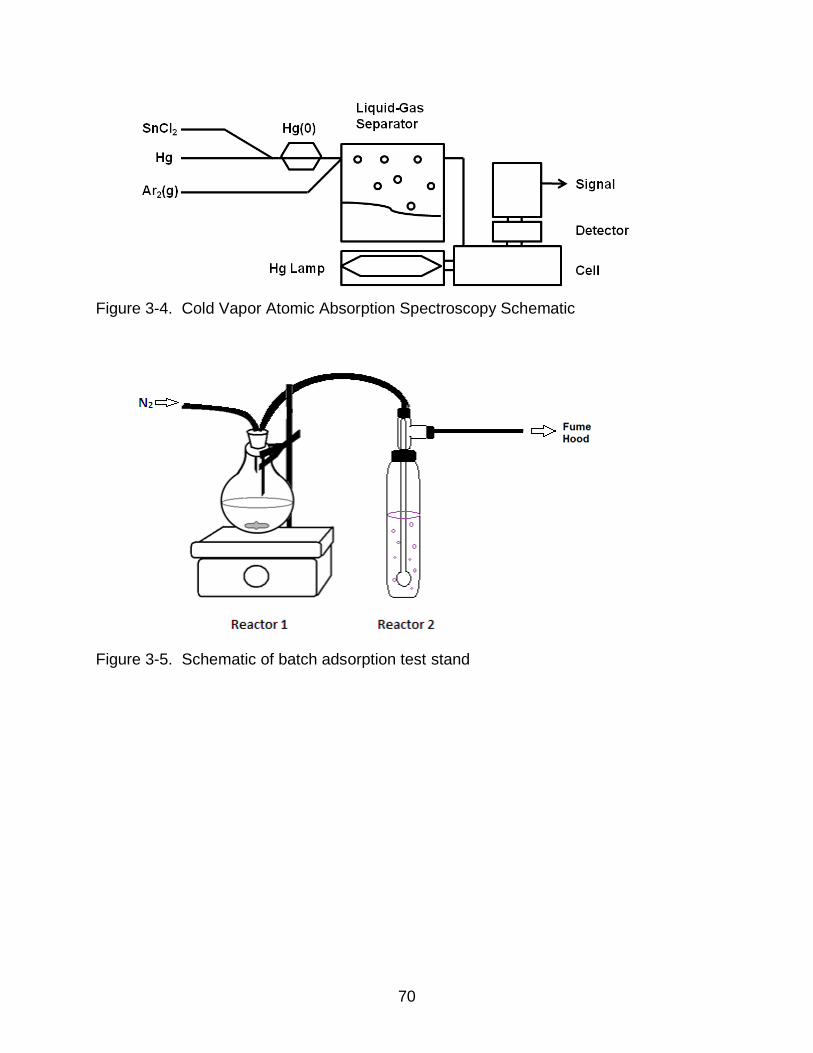
70
Figure 3-4. Cold Vapor Atomic Absorption Spectroscopy Schematic
Figure 3-5. Schematic of batch adsorption test stand
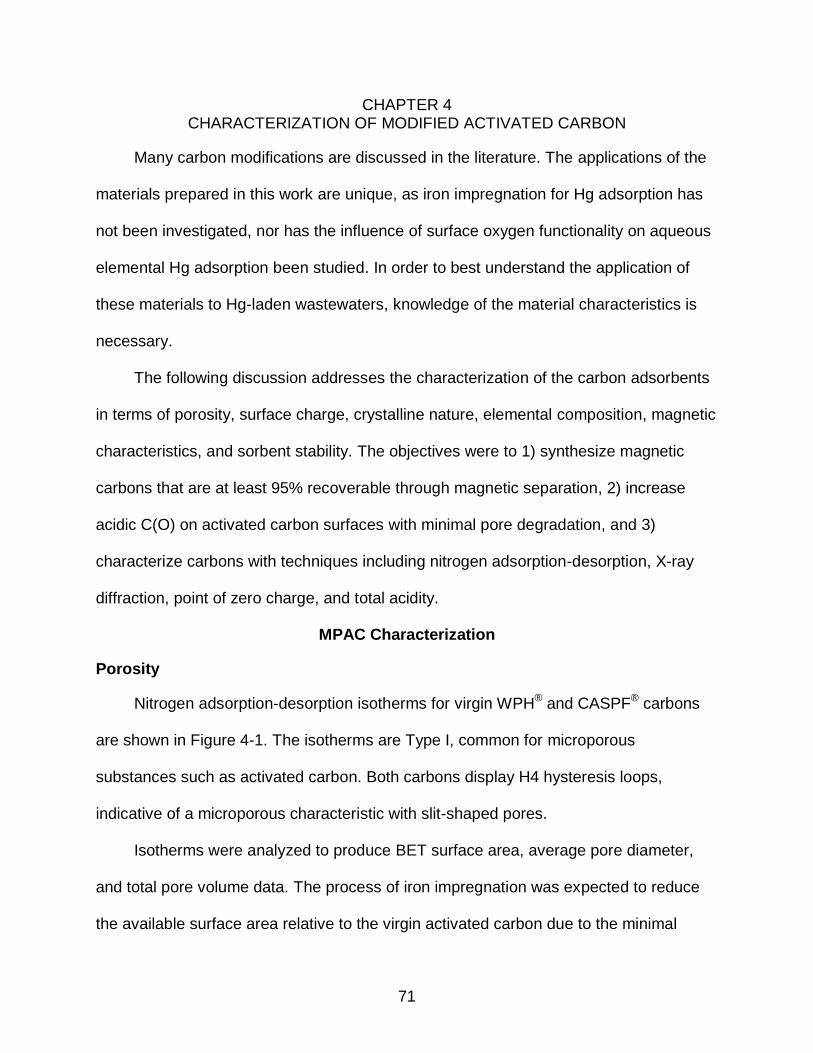
71
CHAPTER 4 CHARACTERIZATION OF MODIFIED ACTIVATED CARBON
Many carbon modifications are discussed in the literature. The applications of the
materials prepared in this work are unique, as iron impregnation for Hg adsorption has
not been investigated, nor has the influence of surface oxygen functionality on aqueous
elemental Hg adsorption been studied. In order to best understand the application of
these materials to Hg-laden wastewaters, knowledge of the material characteristics is
necessary.
The following discussion addresses the characterization of the carbon adsorbents
in terms of porosity, surface charge, crystalline nature, elemental composition, magnetic
characteristics, and sorbent stability. The objectives were to 1) synthesize magnetic
carbons that are at least 95% recoverable through magnetic separation, 2) increase
acidic C(O) on activated carbon surfaces with minimal pore degradation, and 3)
characterize carbons with techniques including nitrogen adsorption-desorption, X-ray
diffraction, point of zero charge, and total acidity.
MPAC Characterization
Porosity
Nitrogen adsorption-desorption isotherms for virgin WPH® and CASPF® carbons
are shown in Figure 4-1. The isotherms are Type I, common for microporous
substances such as activated carbon. Both carbons display H4 hysteresis loops,
indicative of a microporous characteristic with slit-shaped pores.
Isotherms were analyzed to produce BET surface area, average pore diameter,
and total pore volume data. The process of iron impregnation was expected to reduce
the available surface area relative to the virgin activated carbon due to the minimal
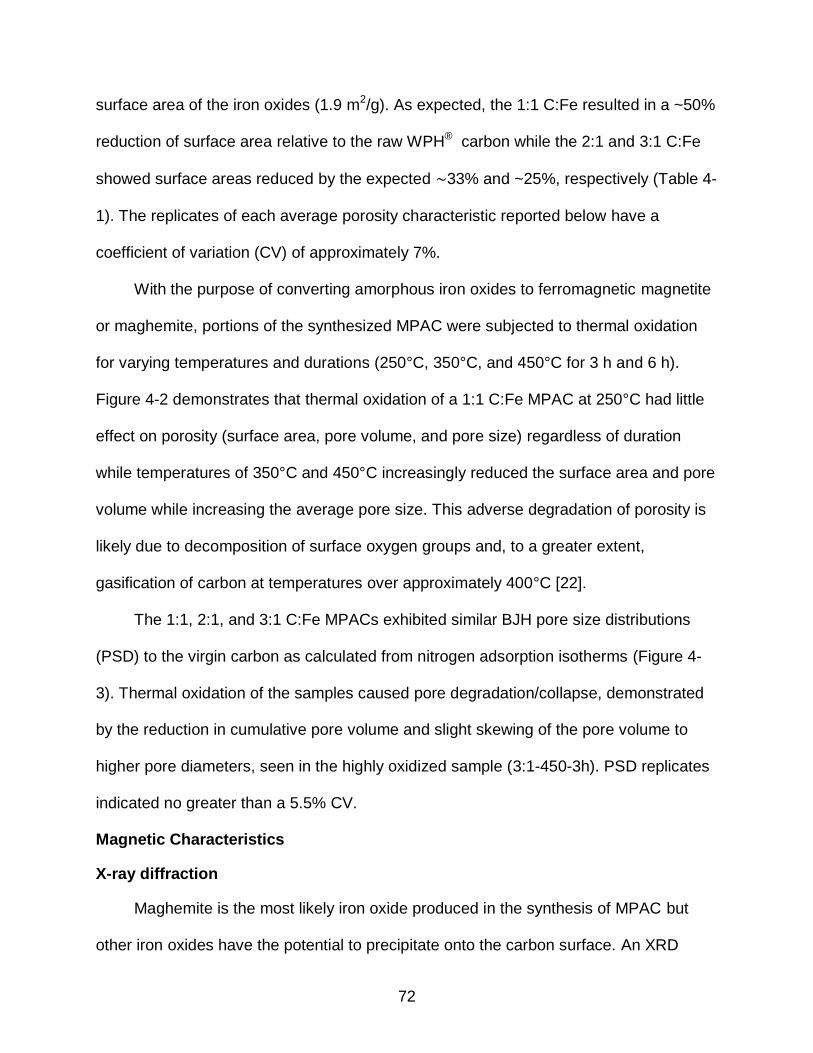
72
surface area of the iron oxides (1.9 m2/g). As expected, the 1:1 C:Fe resulted in a ~50%
reduction of surface area relative to the raw WPH® carbon while the 2:1 and 3:1 C:Fe
showed surface areas reduced by the expected ∼33% and ~25%, respectively (Table 4-
1). The replicates of each average porosity characteristic reported below have a
coefficient of variation (CV) of approximately 7%.
With the purpose of converting amorphous iron oxides to ferromagnetic magnetite
or maghemite, portions of the synthesized MPAC were subjected to thermal oxidation
for varying temperatures and durations (250°C, 350°C, and 450°C for 3 h and 6 h).
Figure 4-2 demonstrates that thermal oxidation of a 1:1 C:Fe MPAC at 250°C had little
effect on porosity (surface area, pore volume, and pore size) regardless of duration
while temperatures of 350°C and 450°C increasingly reduced the surface area and pore
volume while increasing the average pore size. This adverse degradation of porosity is
likely due to decomposition of surface oxygen groups and, to a greater extent,
gasification of carbon at temperatures over approximately 400°C [22].
The 1:1, 2:1, and 3:1 C:Fe MPACs exhibited similar BJH pore size distributions
(PSD) to the virgin carbon as calculated from nitrogen adsorption isotherms (Figure 4-
3). Thermal oxidation of the samples caused pore degradation/collapse, demonstrated
by the reduction in cumulative pore volume and slight skewing of the pore volume to
higher pore diameters, seen in the highly oxidized sample (3:1-450-3h). PSD replicates
indicated no greater than a 5.5% CV.
Magnetic Characteristics
X-ray diffraction
Maghemite is the most likely iron oxide produced in the synthesis of MPAC but
other iron oxides have the potential to precipitate onto the carbon surface. An XRD
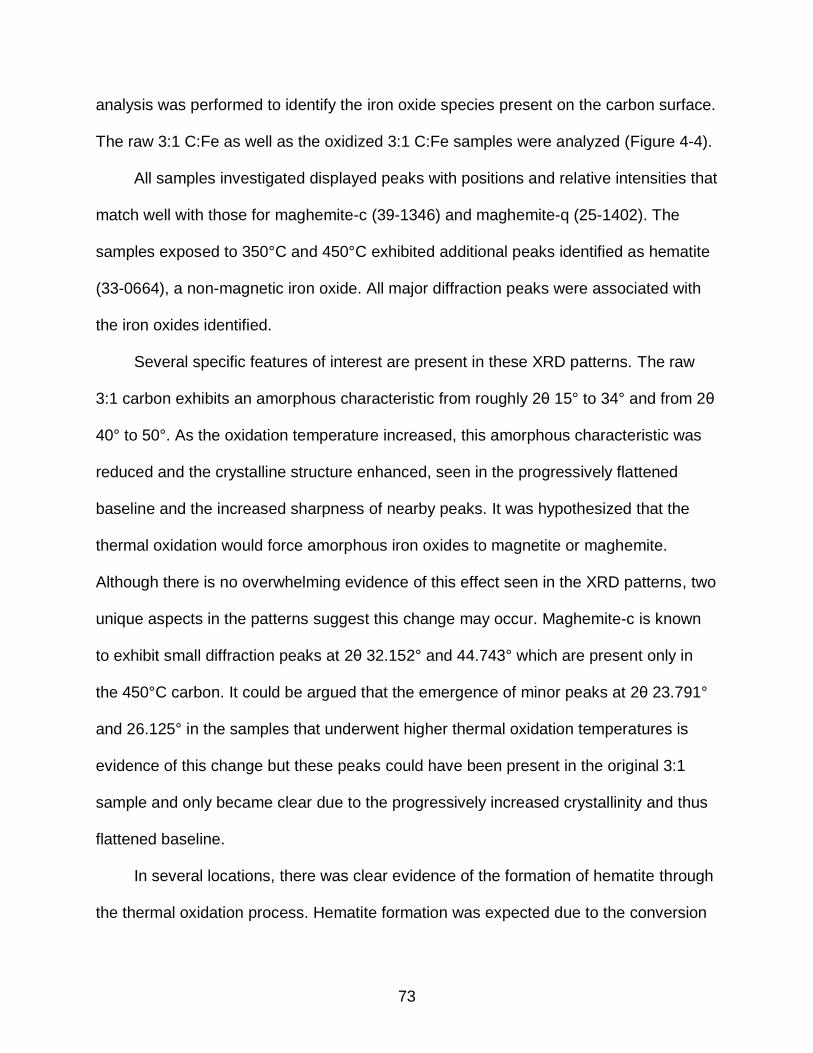
73
analysis was performed to identify the iron oxide species present on the carbon surface.
The raw 3:1 C:Fe as well as the oxidized 3:1 C:Fe samples were analyzed (Figure 4-4).
All samples investigated displayed peaks with positions and relative intensities that
match well with those for maghemite-c (39-1346) and maghemite-q (25-1402). The
samples exposed to 350°C and 450°C exhibited additional peaks identified as hematite
(33-0664), a non-magnetic iron oxide. All major diffraction peaks were associated with
the iron oxides identified.
Several specific features of interest are present in these XRD patterns. The raw
3:1 carbon exhibits an amorphous characteristic from roughly 2θ 15° to 34° and from 2θ
40° to 50°. As the oxidation temperature increased, this amorphous characteristic was
reduced and the crystalline structure enhanced, seen in the progressively flattened
baseline and the increased sharpness of nearby peaks. It was hypothesized that the
thermal oxidation would force amorphous iron oxides to magnetite or maghemite.
Although there is no overwhelming evidence of this effect seen in the XRD patterns, two
unique aspects in the patterns suggest this change may occur. Maghemite-c is known
to exhibit small diffraction peaks at 2θ 32.152° and 44.743° which are present only in
the 450°C carbon. It could be argued that the emergence of minor peaks at 2θ 23.791°
and 26.125° in the samples that underwent higher thermal oxidation temperatures is
evidence of this change but these peaks could have been present in the original 3:1
sample and only became clear due to the progressively increased crystallinity and thus
flattened baseline.
In several locations, there was clear evidence of the formation of hematite through
the thermal oxidation process. Hematite formation was expected due to the conversion
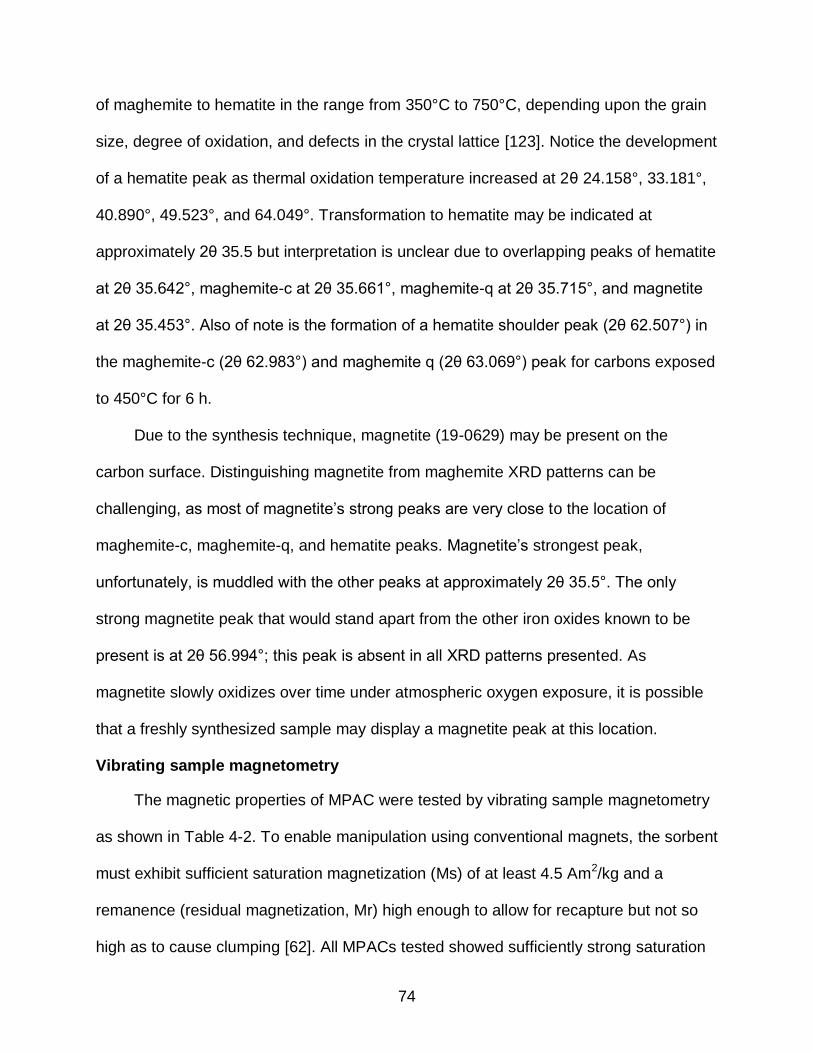
74
of maghemite to hematite in the range from 350°C to 750°C, depending upon the grain
size, degree of oxidation, and defects in the crystal lattice [123]. Notice the development
of a hematite peak as thermal oxidation temperature increased at 2θ 24.158°, 33.181°,
40.890°, 49.523°, and 64.049°. Transformation to hematite may be indicated at
approximately 2θ 35.5 but interpretation is unclear due to overlapping peaks of hematite
at 2θ 35.642°, maghemite-c at 2θ 35.661°, maghemite-q at 2θ 35.715°, and magnetite
at 2θ 35.453°. Also of note is the formation of a hematite shoulder peak (2θ 62.507°) in
the maghemite-c (2θ 62.983°) and maghemite q (2θ 63.069°) peak for carbons exposed
to 450°C for 6 h.
Due to the synthesis technique, magnetite (19-0629) may be present on the
carbon surface. Distinguishing magnetite from maghemite XRD patterns can be
challenging, as most of magnetite’s strong peaks are very close to the location of
maghemite-c, maghemite-q, and hematite peaks. Magnetite’s strongest peak,
unfortunately, is muddled with the other peaks at approximately 2θ 35.5°. The only
strong magnetite peak that would stand apart from the other iron oxides known to be
present is at 2θ 56.994°; this peak is absent in all XRD patterns presented. As
magnetite slowly oxidizes over time under atmospheric oxygen exposure, it is possible
that a freshly synthesized sample may display a magnetite peak at this location.
Vibrating sample magnetometry
The magnetic properties of MPAC were tested by vibrating sample magnetometry
as shown in Table 4-2. To enable manipulation using conventional magnets, the sorbent
must exhibit sufficient saturation magnetization (Ms) of at least 4.5 Am2/kg and a
remanence (residual magnetization, Mr) high enough to allow for recapture but not so
high as to cause clumping [62]. All MPACs tested showed sufficiently strong saturation
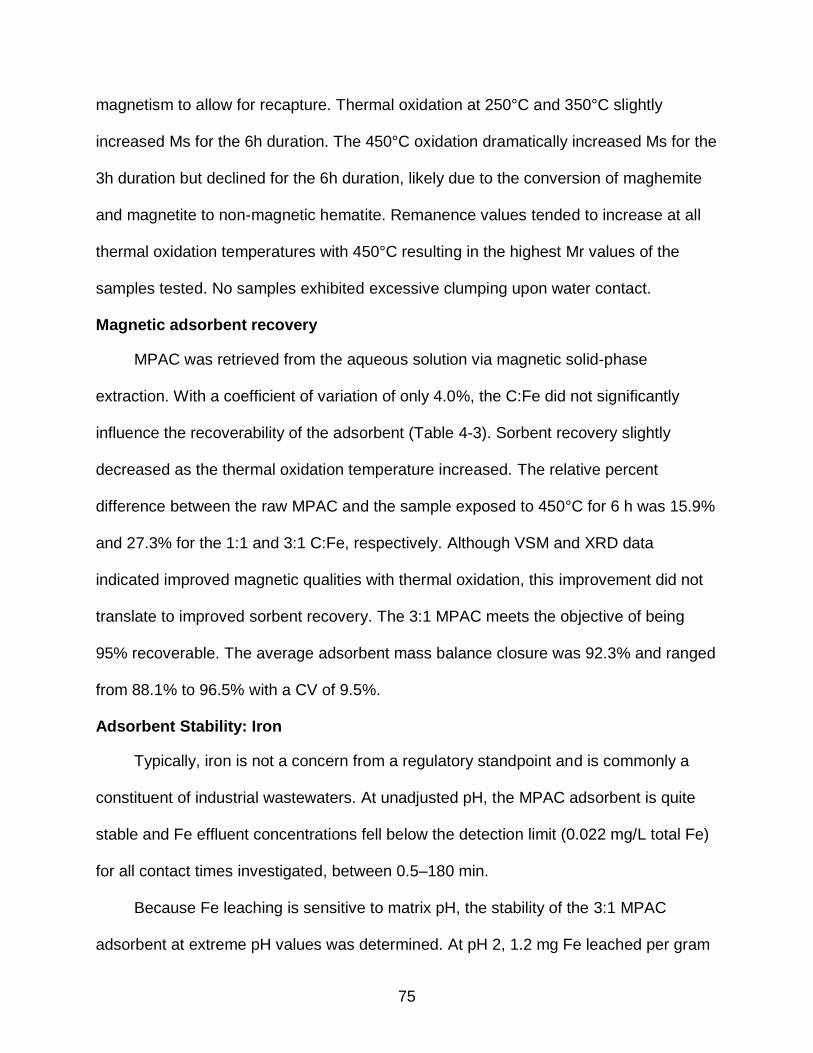
75
magnetism to allow for recapture. Thermal oxidation at 250°C and 350°C slightly
increased Ms for the 6h duration. The 450°C oxidation dramatically increased Ms for the
3h duration but declined for the 6h duration, likely due to the conversion of maghemite
and magnetite to non-magnetic hematite. Remanence values tended to increase at all
thermal oxidation temperatures with 450°C resulting in the highest Mr values of the
samples tested. No samples exhibited excessive clumping upon water contact.
Magnetic adsorbent recovery
MPAC was retrieved from the aqueous solution via magnetic solid-phase
extraction. With a coefficient of variation of only 4.0%, the C:Fe did not significantly
influence the recoverability of the adsorbent (Table 4-3). Sorbent recovery slightly
decreased as the thermal oxidation temperature increased. The relative percent
difference between the raw MPAC and the sample exposed to 450°C for 6 h was 15.9%
and 27.3% for the 1:1 and 3:1 C:Fe, respectively. Although VSM and XRD data
indicated improved magnetic qualities with thermal oxidation, this improvement did not
translate to improved sorbent recovery. The 3:1 MPAC meets the objective of being
95% recoverable. The average adsorbent mass balance closure was 92.3% and ranged
from 88.1% to 96.5% with a CV of 9.5%.
Adsorbent Stability: Iron
Typically, iron is not a concern from a regulatory standpoint and is commonly a
constituent of industrial wastewaters. At unadjusted pH, the MPAC adsorbent is quite
stable and Fe effluent concentrations fell below the detection limit (0.022 mg/L total Fe)
for all contact times investigated, between 0.5–180 min.
Because Fe leaching is sensitive to matrix pH, the stability of the 3:1 MPAC
adsorbent at extreme pH values was determined. At pH 2, 1.2 mg Fe leached per gram
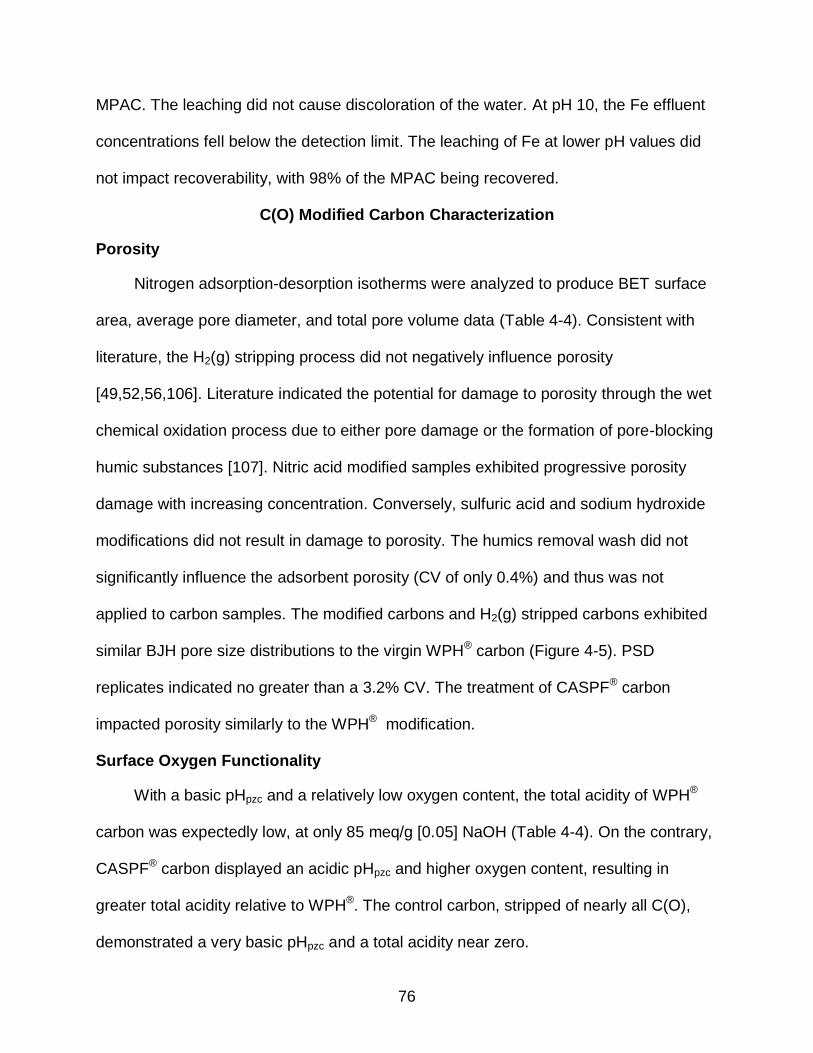
76
MPAC. The leaching did not cause discoloration of the water. At pH 10, the Fe effluent
concentrations fell below the detection limit. The leaching of Fe at lower pH values did
not impact recoverability, with 98% of the MPAC being recovered.
C(O) Modified Carbon Characterization
Porosity
Nitrogen adsorption-desorption isotherms were analyzed to produce BET surface
area, average pore diameter, and total pore volume data (Table 4-4). Consistent with
literature, the H2(g) stripping process did not negatively influence porosity
[49,52,56,106]. Literature indicated the potential for damage to porosity through the wet
chemical oxidation process due to either pore damage or the formation of pore-blocking
humic substances [107]. Nitric acid modified samples exhibited progressive porosity
damage with increasing concentration. Conversely, sulfuric acid and sodium hydroxide
modifications did not result in damage to porosity. The humics removal wash did not
significantly influence the adsorbent porosity (CV of only 0.4%) and thus was not
applied to carbon samples. The modified carbons and H2(g) stripped carbons exhibited
similar BJH pore size distributions to the virgin WPH® carbon (Figure 4-5). PSD
replicates indicated no greater than a 3.2% CV. The treatment of CASPF® carbon
impacted porosity similarly to the WPH® modification.
Surface Oxygen Functionality
With a basic pHpzc and a relatively low oxygen content, the total acidity of WPH®
carbon was expectedly low, at only 85 meq/g [0.05] NaOH (Table 4-4). On the contrary,
CASPF® carbon displayed an acidic pHpzc and higher oxygen content, resulting in
greater total acidity relative to WPH®. The control carbon, stripped of nearly all C(O),
demonstrated a very basic pHpzc and a total acidity near zero.
77
In the modification of WPH® with nitric acid, as the acid concentration increased,
the oxygen content and total acidity increased while the pHpzc fell. Relative to 10M
HNO3 treatment, the 10M H2SO4 treatment was less effective at adding surface oxygen
groups, seen in the reduced oxygen content and the lower total acidity. Interestingly, the
pHpzc of SAC-10M was slightly lower than NAC-10M for both WPH® and CASPF®
carbons. Also note the lack of response in SAC and SHAC carbons to acid
concentration; total acidity, pHpzc, and oxygen content remained relatively stable.
The CASPF® modified carbons interestingly showed an increase in pHpzc upon
modification though the values remained very acidic. Modification with 10 M HNO3
resulted in an oxygen content of 21.2% and a high total acidity of 425 meq/g, a 37%
increase from raw CASPF® carbon. Modification with 10 M H2SO4 actually reduced the
oxygen content and total acidity relative to the raw CASPF®.
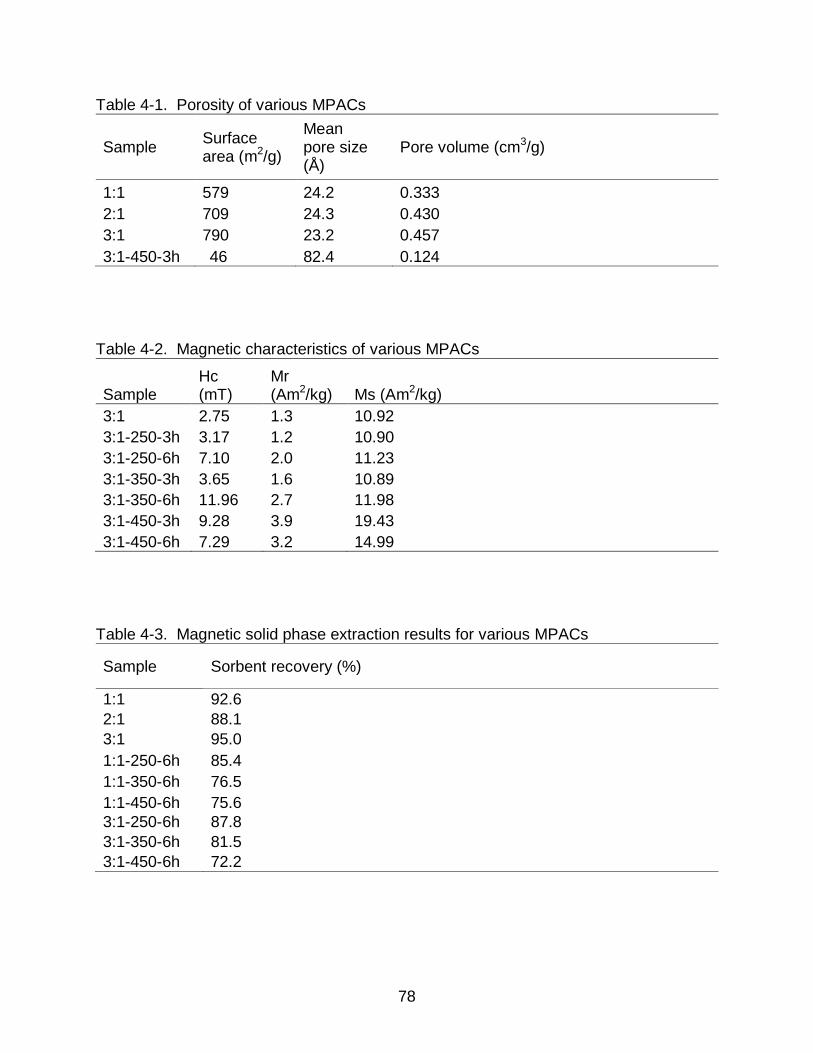
78
Table 4-1. Porosity of various MPACs
Sample Surface area (m2/g)
Mean pore size (Å)
Pore volume (cm3/g)
1:1 579 24.2 0.333
2:1 709 24.3 0.430
3:1 790 23.2 0.457
3:1-450-3h 46 82.4 0.124
Table 4-2. Magnetic characteristics of various MPACs
Sample Hc (mT)
Mr (Am2/kg) Ms (Am2/kg)
3:1 2.75 1.3 10.92
3:1-250-3h 3.17 1.2 10.90
3:1-250-6h 7.10 2.0 11.23
3:1-350-3h 3.65 1.6 10.89
3:1-350-6h 11.96 2.7 11.98
3:1-450-3h 9.28 3.9 19.43
3:1-450-6h 7.29 3.2 14.99
Table 4-3. Magnetic solid phase extraction results for various MPACs
Sample Sorbent recovery (%)
1:1 92.6
2:1 88.1
3:1 95.0
1:1-250-6h 85.4
1:1-350-6h 76.5
1:1-450-6h 75.6
3:1-250-6h 87.8
3:1-350-6h 81.5
3:1-450-6h 72.2
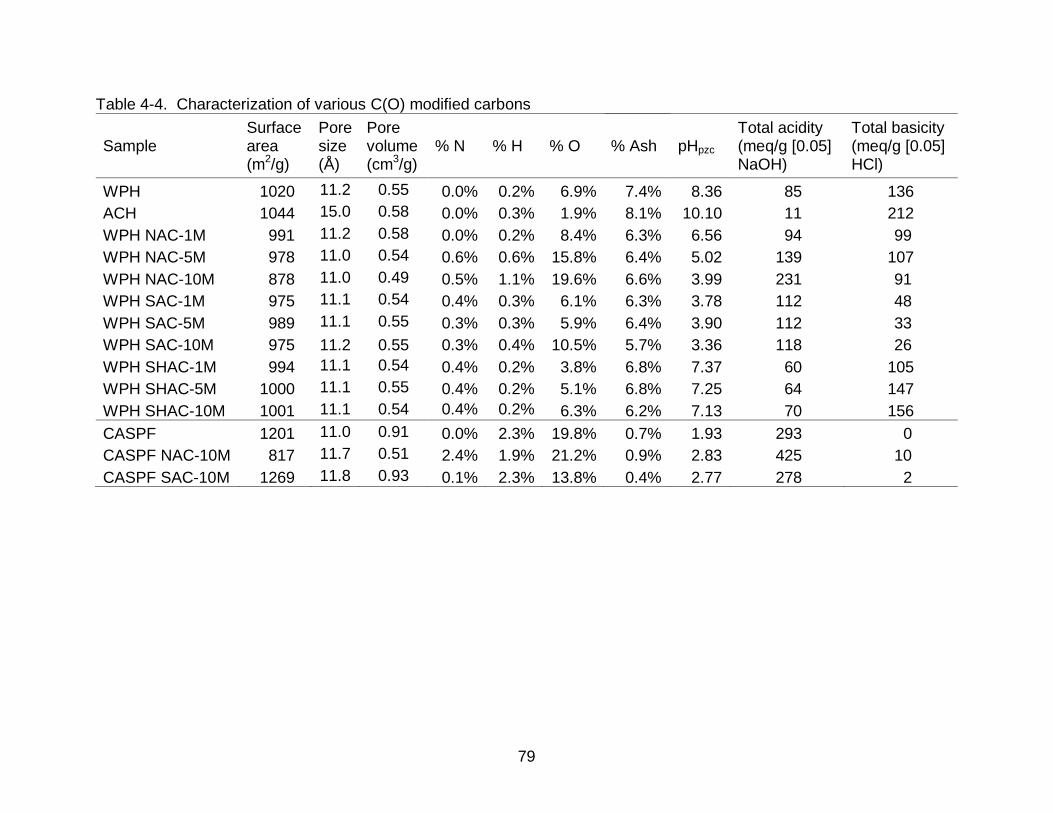
79
Table 4-4. Characterization of various C(O) modified carbons
Sample Surface area (m2/g)
Pore size (Å)
Pore volume (cm3/g)
% N % H % O % Ash pHpzc Total acidity (meq/g [0.05] NaOH)
Total basicity (meq/g [0.05] HCl)
WPH 1020 11.2 0.55 0.0% 0.2% 6.9% 7.4% 8.36 85 136
ACH 1044 15.0 0.58 0.0% 0.3% 1.9% 8.1% 10.10 11 212
WPH NAC-1M 991 11.2 0.58 0.0% 0.2% 8.4% 6.3% 6.56 94 99
WPH NAC-5M 978 11.0 0.54 0.6% 0.6% 15.8% 6.4% 5.02 139 107
WPH NAC-10M 878 11.0 0.49 0.5% 1.1% 19.6% 6.6% 3.99 231 91
WPH SAC-1M 975 11.1 0.54 0.4% 0.3% 6.1% 6.3% 3.78 112 48
WPH SAC-5M 989 11.1 0.55 0.3% 0.3% 5.9% 6.4% 3.90 112 33
WPH SAC-10M 975 11.2 0.55 0.3% 0.4% 10.5% 5.7% 3.36 118 26
WPH SHAC-1M 994 11.1 0.54 0.4% 0.2% 3.8% 6.8% 7.37 60 105
WPH SHAC-5M 1000 11.1 0.55 0.4% 0.2% 5.1% 6.8% 7.25 64 147
WPH SHAC-10M 1001 11.1 0.54 0.4% 0.2% 6.3% 6.2% 7.13 70 156
CASPF 1201 11.0 0.91 0.0% 2.3% 19.8% 0.7% 1.93 293 0
CASPF NAC-10M 817 11.7 0.51 2.4% 1.9% 21.2% 0.9% 2.83 425 10
CASPF SAC-10M 1269 11.8 0.93 0.1% 2.3% 13.8% 0.4% 2.77 278 2
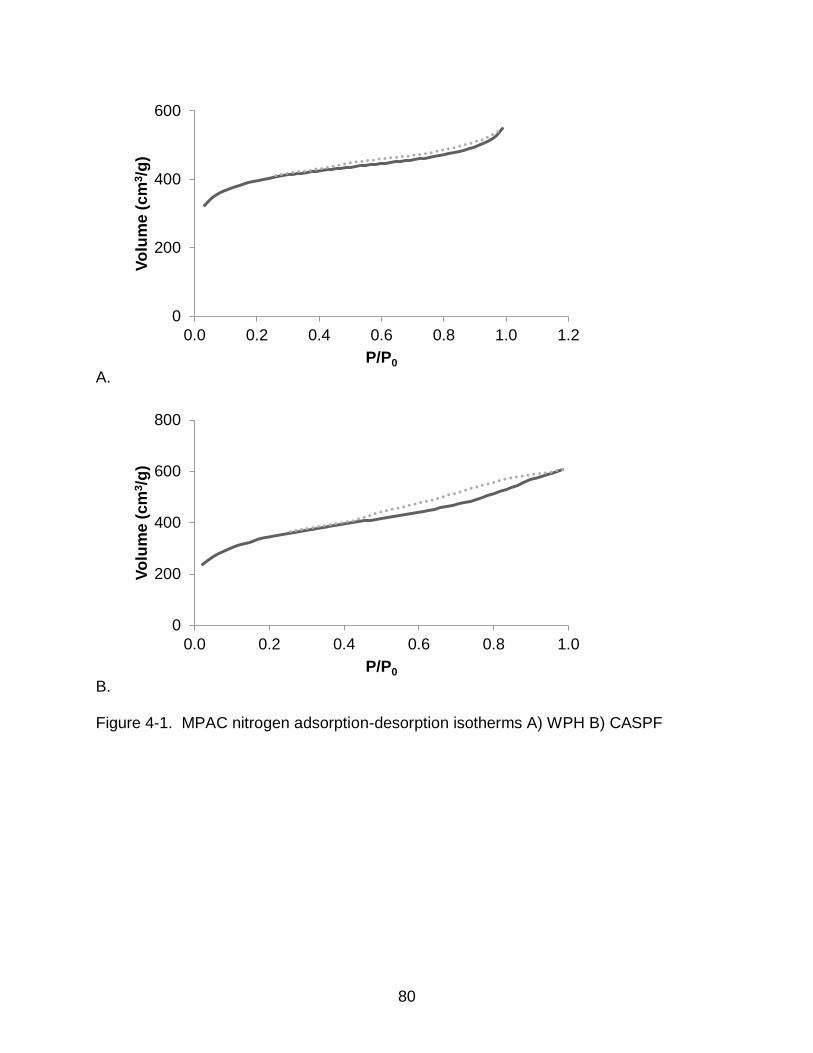
80
A.
B.
Figure 4-1. MPAC nitrogen adsorption-desorption isotherms A) WPH B) CASPF
0
200
400
600
0.0 0.2 0.4 0.6 0.8 1.0 1.2
Vo
lum
e (
cm
3/g
)
P/P0
0
200
400
600
800
0.0 0.2 0.4 0.6 0.8 1.0
Vo
lum
e (
cm
3/g
)
P/P0
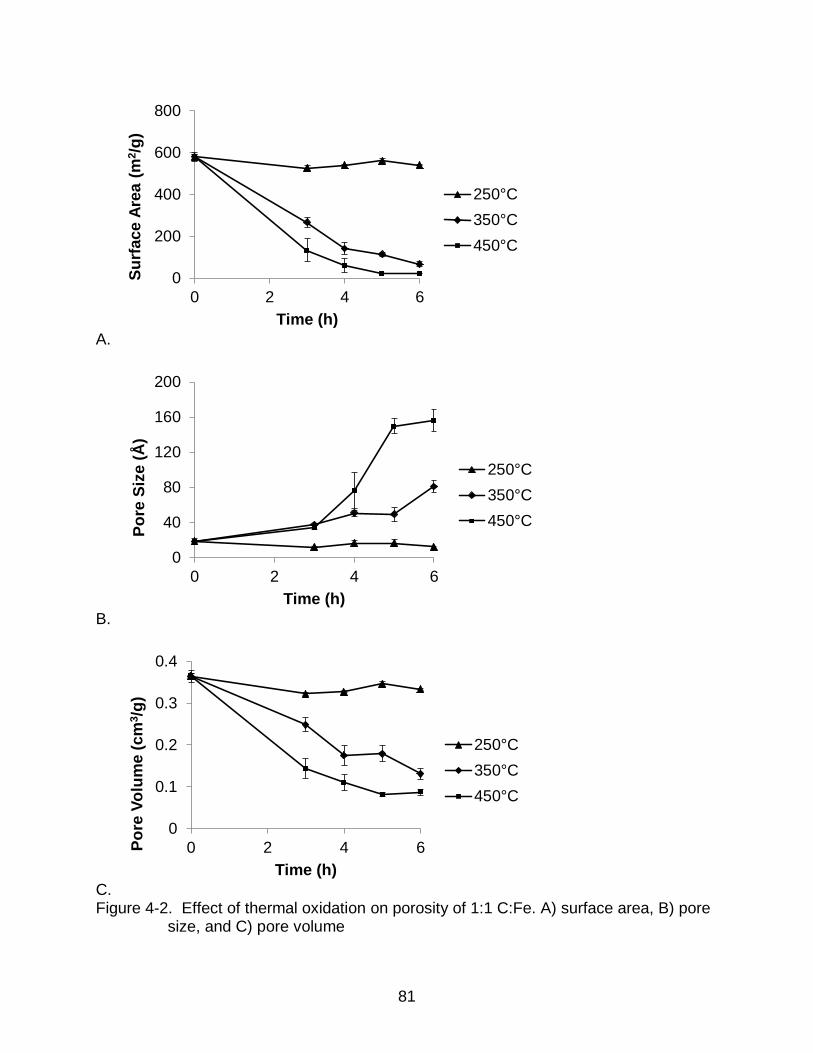
81
A.
B.
C. Figure 4-2. Effect of thermal oxidation on porosity of 1:1 C:Fe. A) surface area, B) pore
size, and C) pore volume
0
200
400
600
800
0 2 4 6
Su
rface A
rea (
m2/g
)
Time (h)
250°C
350°C
450°C
0
40
80
120
160
200
0 2 4 6
Po
re S
ize (
Å)
Time (h)
250°C
350°C
450°C
0
0.1
0.2
0.3
0.4
0 2 4 6Po
re V
olu
me (
cm
3/g
)
Time (h)
250°C
350°C
450°C
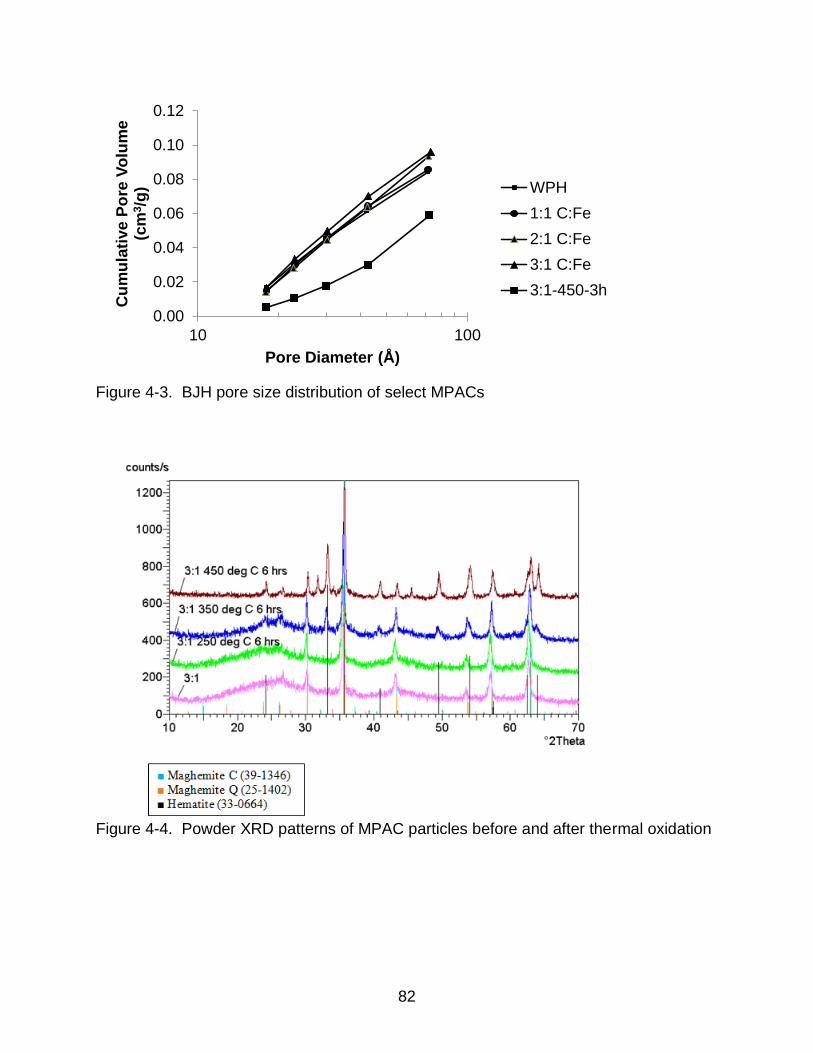
82
Figure 4-3. BJH pore size distribution of select MPACs
Figure 4-4. Powder XRD patterns of MPAC particles before and after thermal oxidation
0.00
0.02
0.04
0.06
0.08
0.10
0.12
10 100
Cu
mu
lati
ve P
ore
Vo
lum
e
(cm
3/g
)
Pore Diameter (Å)
WPH
1:1 C:Fe
2:1 C:Fe
3:1 C:Fe
3:1-450-3h
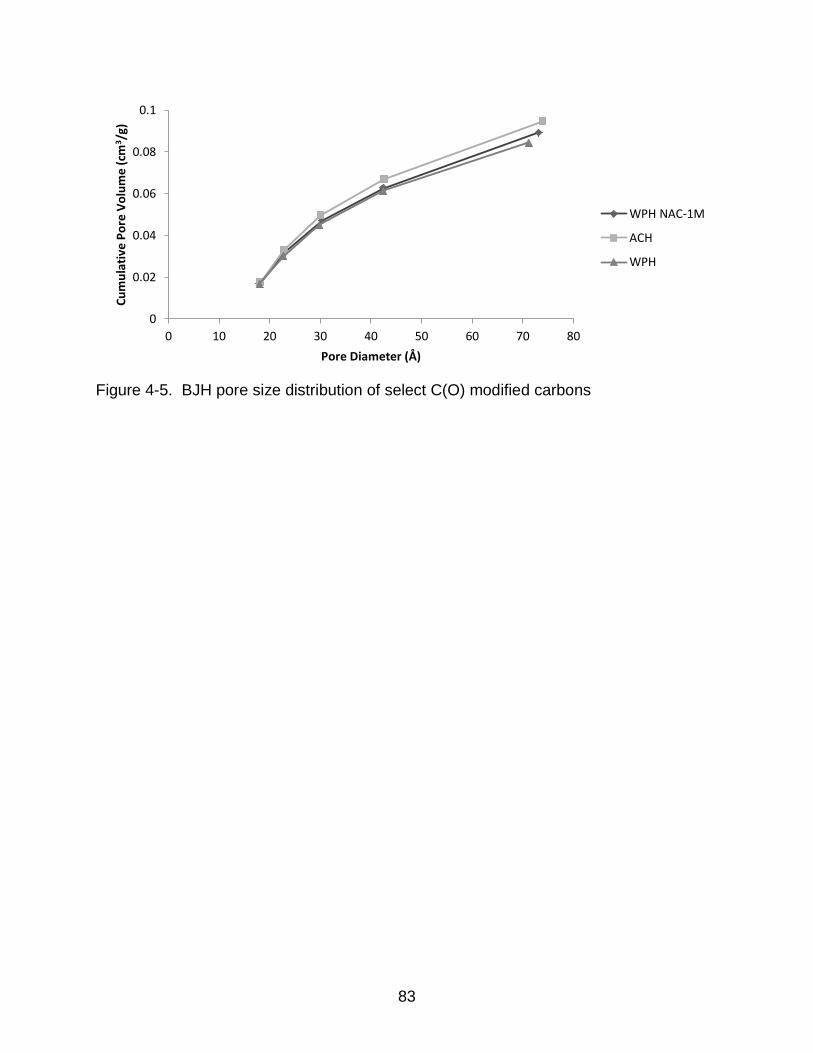
83
Figure 4-5. BJH pore size distribution of select C(O) modified carbons
0
0.02
0.04
0.06
0.08
0.1
0 10 20 30 40 50 60 70 80
Cu
mu
lati
ve P
ore
Vo
lum
e (c
m3/g
)
Pore Diameter (Å)
WPH NAC-1M
ACH
WPH
84
CHAPTER 5 TRACE LEVEL AQUEOUS MERCURY REMOVAL USING MODIFIED ACTIVATED
CARBON
The following discussion investigates the adsorption of Hg using commercially
available activated carbon modified by several approaches. Previous literature has
investigated the application of activated carbon to aqueous Hg adsorption [22,72,74,75].
However, the literature has not addressed aqueous Hg removal using a magnetic
adsorbent. The literature is scarce regarding aqueous Hg adsorption using an activated
carbon with enhanced surface oxygen functionality [36,75,77]. In fact, little is known
regarding aqueous adsorption of Hg(0) or the role of surface oxygen groups in its
adsorption. The objective of this study was to determine which experimental conditions
yielded the highest removal of aqueous Hg.
MPAC Results
Controls
Prior to performing Hg adsorption experiments, it was imperative to perform
control runs. To verify that the batch reactor was free from residual Hg contamination,
an air blank was performed periodically. This was accomplished by running the test
stand with only ultrapure water, in the absence of carbon and mercury. Hg levels were
quantified in the mercury-carbon contact chamber and volatilization trap. A sorbent
blank, determined via aqua regia and hydrofluoric acid digestion, identified trace levels
of Hg in the adsorbent averaging 0.125 μg Hg/g virgin WPH®. Bituminous coal is the
raw material used in the production of WPH® activated carbon; coal is known to contain
trace levels of Hg. These values were considered in the mass balance calculations. A
background analysis was performed by running Hg-spiked ultrapure water through the
batch reactor in the absence of carbon. The analysis revealed the following: low levels
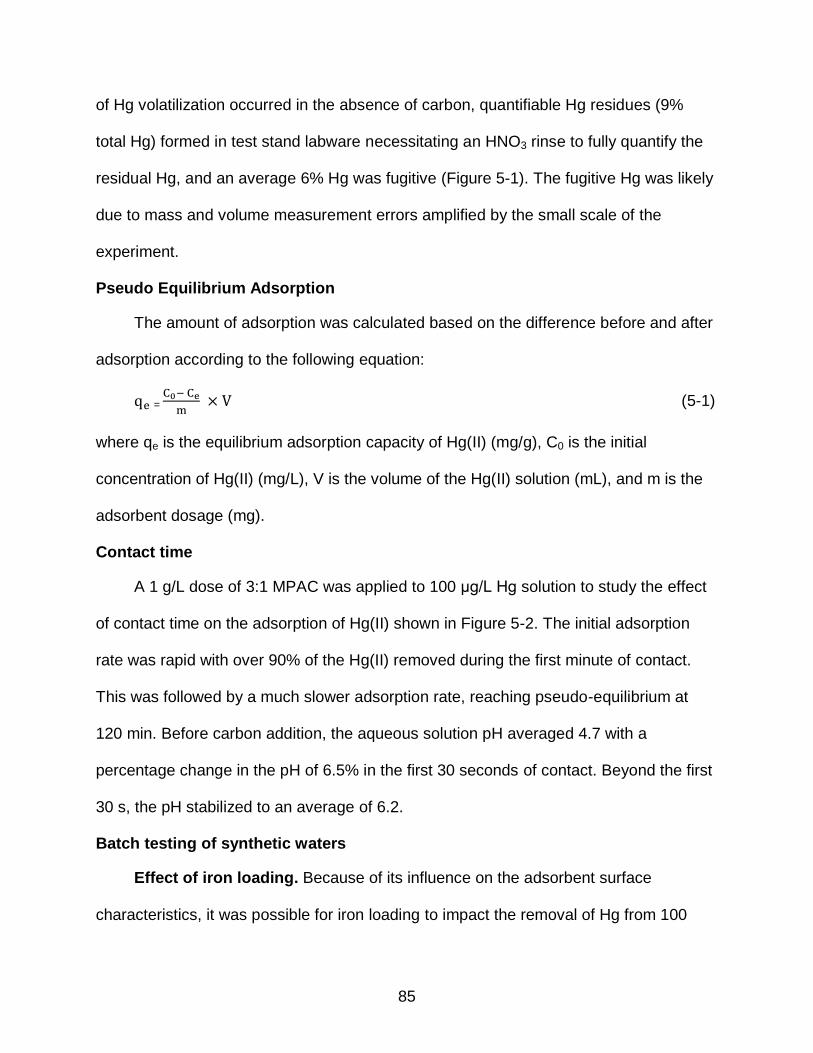
85
of Hg volatilization occurred in the absence of carbon, quantifiable Hg residues (9%
total Hg) formed in test stand labware necessitating an HNO3 rinse to fully quantify the
residual Hg, and an average 6% Hg was fugitive (Figure 5-1). The fugitive Hg was likely
due to mass and volume measurement errors amplified by the small scale of the
experiment.
Pseudo Equilibrium Adsorption
The amount of adsorption was calculated based on the difference before and after
adsorption according to the following equation:
=
(5-1)
where qe is the equilibrium adsorption capacity of Hg(II) (mg/g), C0 is the initial
concentration of Hg(II) (mg/L), V is the volume of the Hg(II) solution (mL), and m is the
adsorbent dosage (mg).
Contact time
A 1 g/L dose of 3:1 MPAC was applied to 100 μg/L Hg solution to study the effect
of contact time on the adsorption of Hg(II) shown in Figure 5-2. The initial adsorption
rate was rapid with over 90% of the Hg(II) removed during the first minute of contact.
This was followed by a much slower adsorption rate, reaching pseudo-equilibrium at
120 min. Before carbon addition, the aqueous solution pH averaged 4.7 with a
percentage change in the pH of 6.5% in the first 30 seconds of contact. Beyond the first
30 s, the pH stabilized to an average of 6.2.
Batch testing of synthetic waters
Effect of iron loading. Because of its influence on the adsorbent surface
characteristics, it was possible for iron loading to impact the removal of Hg from 100
86
μg/L aqueous solution (Figure 5-3). 1:1 and 2:1 C:Fe performed similarly, with a CV of
2.78%. The 3:1 C:Fe exhibited the best Hg removal. As the iron loading influenced
porosity (Table 4-1), the effect of surface area changes due to both Fe loading and
thermal oxidation is discussed below.
Effect of thermal oxidation. Figure 5-4 demonstrates that the thermal oxidation
temperatures investigated in this study minimally influenced the aqueous mercury
removal capabilities of MPAC despite the pore damage incurred at oxidation
temperatures over 250°C. For each C:Fe, the CV between the raw samples and
oxidized samples only varied between 0% and 4.5%. At all oxidation temperatures, the
3:1 MPAC achieved the highest mercury removal. The 1:1 and 2:1 C:Fe performed
similarly for Hg removal, with CV values under 2.8% at each temperature.
Effect of surface area. This work does not show a strong correlation between
surface area alone and mercury removal. The experimental data best fit a three variable
model with an adjusted R2 of 0.464, identifying surface area, pore volume, and point of
zero charge as the variables influencing Hg(II) adsorption in the system. An ANOVA test
identified the sums of squares for the surface area, pore volume, and pHpzc of 113.1,
2.1, and 341.1, respectively. The pHpzc is the primary variable influencing results. As the
R2 is not close to 1, there are likely other variables influencing the efficiency of Hg(II)
removal; Hg adsorption can be influenced by other sorbent characteristics such as
surface oxygen functionality [35,76].
Mercury mass balance. The average Hg mass balance closure for experiments
was 99.5% with a standard deviation of 8.8%. The mass balance closures ranged from
88.3% to 116.8% but many runs did not fall within the 95% confidence intervals; the
87
observed distribution fits a random distribution curve (Figure 5-5). The challenge in
obtaining mass balance closure was likely due to HF extraction inefficiency in
quantifying the adsorbed Hg, mechanical loss of C resulting in lower Hg masses
extracted in the HF digestion, and volumetric measurement errors amplified due to the
small scale of the experiment.
The mass balance for Hg adsorption onto 3:1 C:Fe MPAC is presented in Figure
5-6. At unadjusted pH, approximately 95% of the Hg was removed from aqueous
solution with 2% volatilized and 87% adsorbed while 6% remained fugitive.
Optimization. Box Behnken fractional factorial design was used to identify the
optimal MPAC for both Hg removal and MPAC recovery (equally weighted in the
experimental design) according to the following variables: C:Fe and thermal oxidation
temperature and time. The following criteria were used in the numerical optimization:
C:Fe within range, minimized oxidation temperature and time, maximized magnetic
recovery, and maximized Hg removal. Oxidation parameters were minimized to reduce
the cost of MPAC synthesis. Based on these criteria, the optimal synthesis variables of
3:1 C:Fe with no thermal oxidation would achieve a predicted sorbent recovery of 92.5%
(±8.3%) and Hg removal of 96.3% (±9%).
Adsorption Isotherms
The effect of the dose of MPAC on Hg(II) adsorption was investigated by varying
the MPAC dose from 0.5 to 10 g/L (Figure 5-7). The Langmuir equation is derived from
the assumption of monolayer adsorption on specific homogenous sites, while the
Freundlich model represents physical adsorption on heterogeneous surfaces. The good
fitting results of both models, seen in Figure 5-7A, implied that both chemisorption and
physisorption mechanisms took place in the adsorption system. The term 1/n was
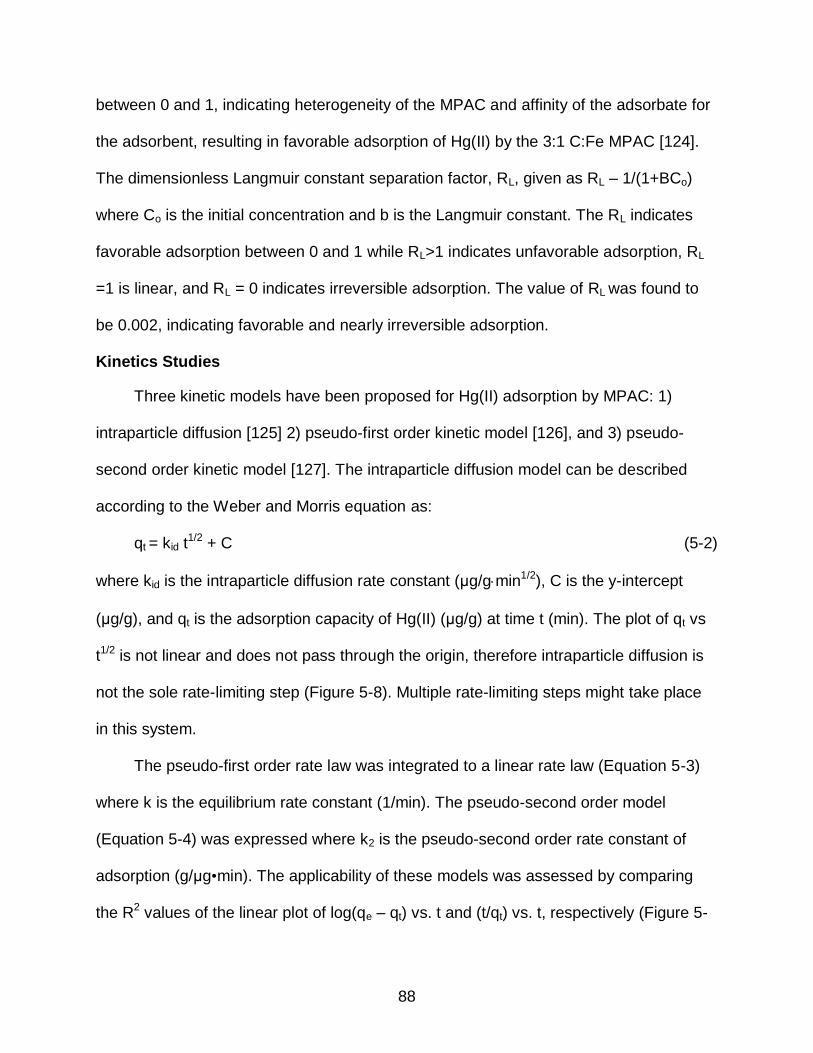
88
between 0 and 1, indicating heterogeneity of the MPAC and affinity of the adsorbate for
the adsorbent, resulting in favorable adsorption of Hg(II) by the 3:1 C:Fe MPAC [124].
The dimensionless Langmuir constant separation factor, RL, given as RL – 1/(1+BCo)
where Co is the initial concentration and b is the Langmuir constant. The RL indicates
favorable adsorption between 0 and 1 while RL>1 indicates unfavorable adsorption, RL
=1 is linear, and RL = 0 indicates irreversible adsorption. The value of RL was found to
be 0.002, indicating favorable and nearly irreversible adsorption.
Kinetics Studies
Three kinetic models have been proposed for Hg(II) adsorption by MPAC: 1)
intraparticle diffusion [125] 2) pseudo-first order kinetic model [126], and 3) pseudo-
second order kinetic model [127]. The intraparticle diffusion model can be described
according to the Weber and Morris equation as:
qt = kid t1/2 + C (5-2)
where kid is the intraparticle diffusion rate constant (μg/gmin1/2), C is the y-intercept
(μg/g), and qt is the adsorption capacity of Hg(II) (μg/g) at time t (min). The plot of qt vs
t1/2 is not linear and does not pass through the origin, therefore intraparticle diffusion is
not the sole rate-limiting step (Figure 5-8). Multiple rate-limiting steps might take place
in this system.
The pseudo-first order rate law was integrated to a linear rate law (Equation 5-3)
where k is the equilibrium rate constant (1/min). The pseudo-second order model
(Equation 5-4) was expressed where k2 is the pseudo-second order rate constant of
adsorption (g/μg•min). The applicability of these models was assessed by comparing
the R2 values of the linear plot of log(qe – qt) vs. t and (t/qt) vs. t, respectively (Figure 5-
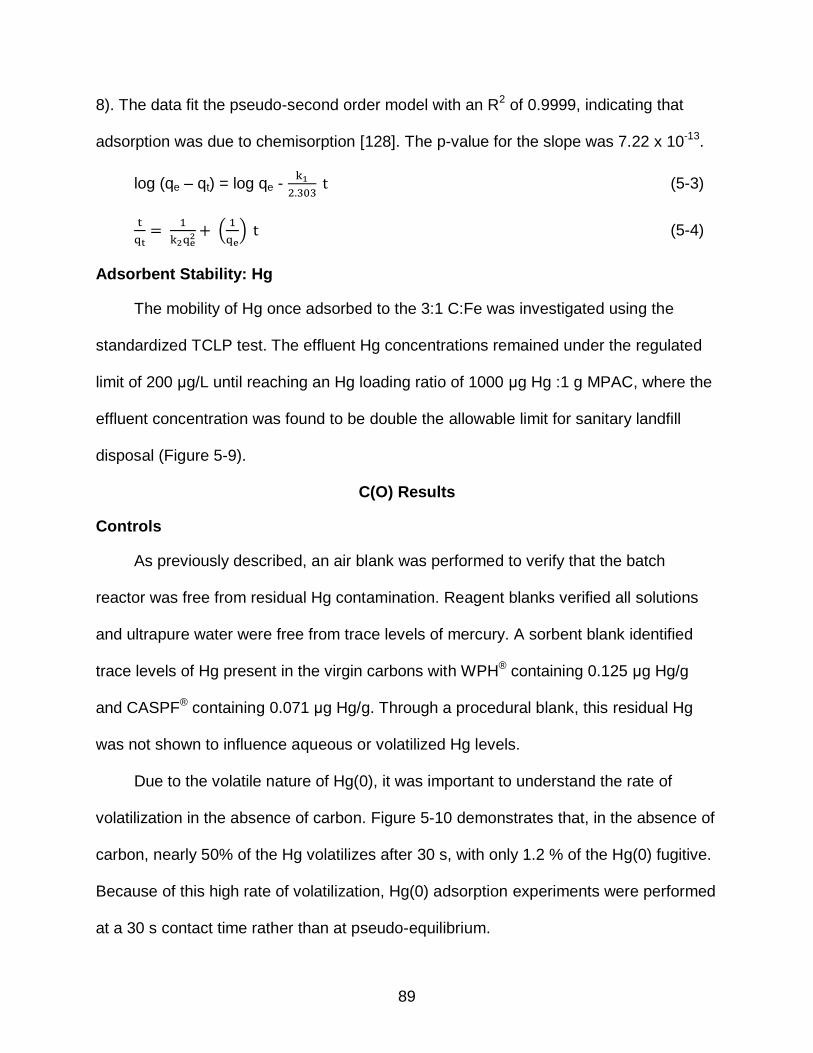
89
8). The data fit the pseudo-second order model with an R2 of 0.9999, indicating that
adsorption was due to chemisorption [128]. The p-value for the slope was 7.22 x 10⁻¹³.
log (qe – qt) = log qe -
(5-3)
(
) (5-4)
Adsorbent Stability: Hg
The mobility of Hg once adsorbed to the 3:1 C:Fe was investigated using the
standardized TCLP test. The effluent Hg concentrations remained under the regulated
limit of 200 μg/L until reaching an Hg loading ratio of 1000 μg Hg :1 g MPAC, where the
effluent concentration was found to be double the allowable limit for sanitary landfill
disposal (Figure 5-9).
C(O) Results
Controls
As previously described, an air blank was performed to verify that the batch
reactor was free from residual Hg contamination. Reagent blanks verified all solutions
and ultrapure water were free from trace levels of mercury. A sorbent blank identified
trace levels of Hg present in the virgin carbons with WPH® containing 0.125 μg Hg/g
and CASPF® containing 0.071 μg Hg/g. Through a procedural blank, this residual Hg
was not shown to influence aqueous or volatilized Hg levels.
Due to the volatile nature of Hg(0), it was important to understand the rate of
volatilization in the absence of carbon. Figure 5-10 demonstrates that, in the absence of
carbon, nearly 50% of the Hg volatilizes after 30 s, with only 1.2 % of the Hg(0) fugitive.
Because of this high rate of volatilization, Hg(0) adsorption experiments were performed
at a 30 s contact time rather than at pseudo-equilibrium.
90
The HF/H3BO3 total digestion employed when quantifying adsorbed Hg for the
MPAC carbons did not produce replicable results with the C(O) modified carbons. For
these experiments, mass balance was determined by assuming Hg that did not either
volatilize or remain in aqueous solution was adsorbed.
Batch Testing of Synthetic Waters
Effect of C(O) on Hg adsorption
Due to the multitude of variables that can influence adsorption, the influence of
one specific variable requires regression analysis. A t-test with a significance level of α
= 0.05 revealed oxygen content as a good regression parameter for Hg(II) adsorption
(p-value = 0.00328) but the same does not hold true for Hg(0) adsorption (p-value =
0.28850). This could be due, in part, to water cluster formation. Acidic C(O) groups tend
to adsorb water by hydrogen bonding and dispersion forces, followed by clustering of
additional water molecules at these adsorption sites [129]. These water clusters can
block adsorbate access to the activated carbon porosity [130]. Studies have shown a
drop in adsorption capacity of organic pollutants with an increase in the amount of C(O)
groups, evidence of the water adsorption effect [131,132]. As Hg(0) is uncharged, it is
possible that there are not sufficient attractive forces to overcome the pore blocking
effect due to water cluster formation. Although the speciation in the Hg(II) system exists
primarily as the uncharged Hg(OH)2, the carbon particles serve as a nucleation point for
the precipitation of solid Hg(OH)2 which may be able to overcome the pore blocking of
the water clusters.
As seen in Figure 5-11, the virgin WPH® carbon performed fairly well for Hg(II)
removal, but when applied to Hg(0) adsorption resulted in relatively high levels of
volatilization. SAC and SHAC carbons achieved high levels of Hg(0) adsorption with
91
minimal losses through volatilization. The annealed carbon, with the lowest oxygen
content, displayed the lowest Hg (0) and Hg(II) removal.
Effect of porosity on Hg adsorption
Hg(II). A t-test revealed that surface area alone was poorly correlated to Hg(II)
removal, with an R2 value of 0.004. An ANOVA test on the influence of surface area,
pore size, and pore volume on Hg(II) removal revealed that pore volume had
significantly more influence than surface area and pore size, with a sums of squares
value of 569.75 compared to 5.31 and 97.47, respectively.
The two-variable model that best fits the Hg(II) removal data indicates oxygen
content and pHpzc as important variables, resulting in an R2 value of 0.499. An ANOVA
test indicated oxygen content to be the primary variable influencing adsorption with
sums of squares of 666.82 while the pHpzc sums of squares was only 62.06.
Hg(0). Surface area also poorly correlated to Hg(0) removal, with an R2 value of
0.093. A t-test analysis of the influence of surface area, pore size, and pore volume on
Hg(0) removal resulted in a negative adjusted R2, making an ANOVA test impractical.
The best regression model to fit the Hg(0) data indicates that surface area, pore
volume, surface oxygen functionality, and the point of zero charge as important
variables, resulting in an R2 value of 0.5886. The t-test identified the pHpzc as a good
regression parameter (>95% confidence). An ANOVA test indicated the point of zero
charge as the primary variable influencing adsorption with sums of squares of 1041.72.
As no model using the measured variables achieved a strong R2 value, it is possible
that an unquantified variable was influencing the results of both Hg(II) and Hg(0)
adsorption.
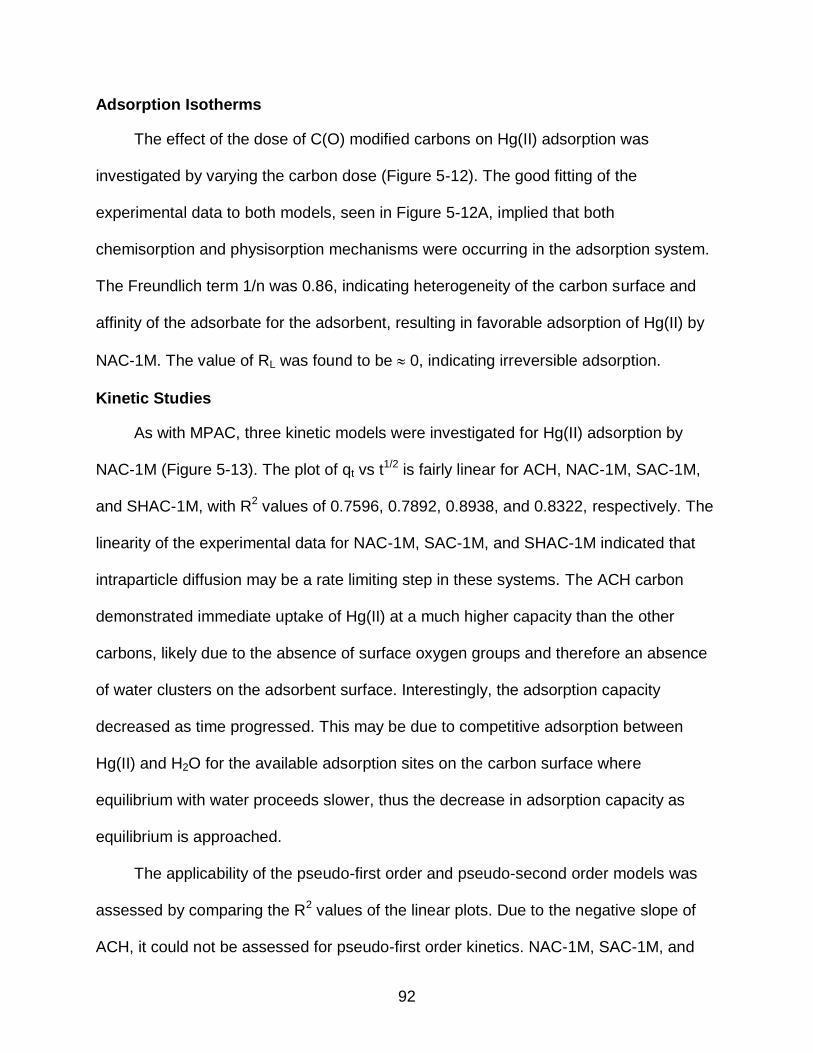
92
Adsorption Isotherms
The effect of the dose of C(O) modified carbons on Hg(II) adsorption was
investigated by varying the carbon dose (Figure 5-12). The good fitting of the
experimental data to both models, seen in Figure 5-12A, implied that both
chemisorption and physisorption mechanisms were occurring in the adsorption system.
The Freundlich term 1/n was 0.86, indicating heterogeneity of the carbon surface and
affinity of the adsorbate for the adsorbent, resulting in favorable adsorption of Hg(II) by
NAC-1M. The value of RL was found to be 0, indicating irreversible adsorption.
Kinetic Studies
As with MPAC, three kinetic models were investigated for Hg(II) adsorption by
NAC-1M (Figure 5-13). The plot of qt vs t1/2 is fairly linear for ACH, NAC-1M, SAC-1M,
and SHAC-1M, with R2 values of 0.7596, 0.7892, 0.8938, and 0.8322, respectively. The
linearity of the experimental data for NAC-1M, SAC-1M, and SHAC-1M indicated that
intraparticle diffusion may be a rate limiting step in these systems. The ACH carbon
demonstrated immediate uptake of Hg(II) at a much higher capacity than the other
carbons, likely due to the absence of surface oxygen groups and therefore an absence
of water clusters on the adsorbent surface. Interestingly, the adsorption capacity
decreased as time progressed. This may be due to competitive adsorption between
Hg(II) and H2O for the available adsorption sites on the carbon surface where
equilibrium with water proceeds slower, thus the decrease in adsorption capacity as
equilibrium is approached.
The applicability of the pseudo-first order and pseudo-second order models was
assessed by comparing the R2 values of the linear plots. Due to the negative slope of
ACH, it could not be assessed for pseudo-first order kinetics. NAC-1M, SAC-1M, and
93
SHAC-1M all fit the pseudo-first order model with R2 values of 0.9188, 0.9822, and
0.8975, respectively. Even so, the data showed a stronger fit with the pseudo-second
order kinetic model, with R2 values higher than 0.99, indicating that chemisorption
played a large role in Hg(II) removal. The p-values for the slopes were very low, ranging
from 1.2 x 10⁻⁵ to 6.7 x 10⁻⁷.
Adsorbent Stability
The mobility of Hg(II) once adsorbed to the surface modified carbons was
investigated using the standardized TCLP test (Table 5-1). After loading the carbons
with 100 μg Hg/ g C, the effluent remained under the regulated limit of 200 μg/L for all
carbons tested.
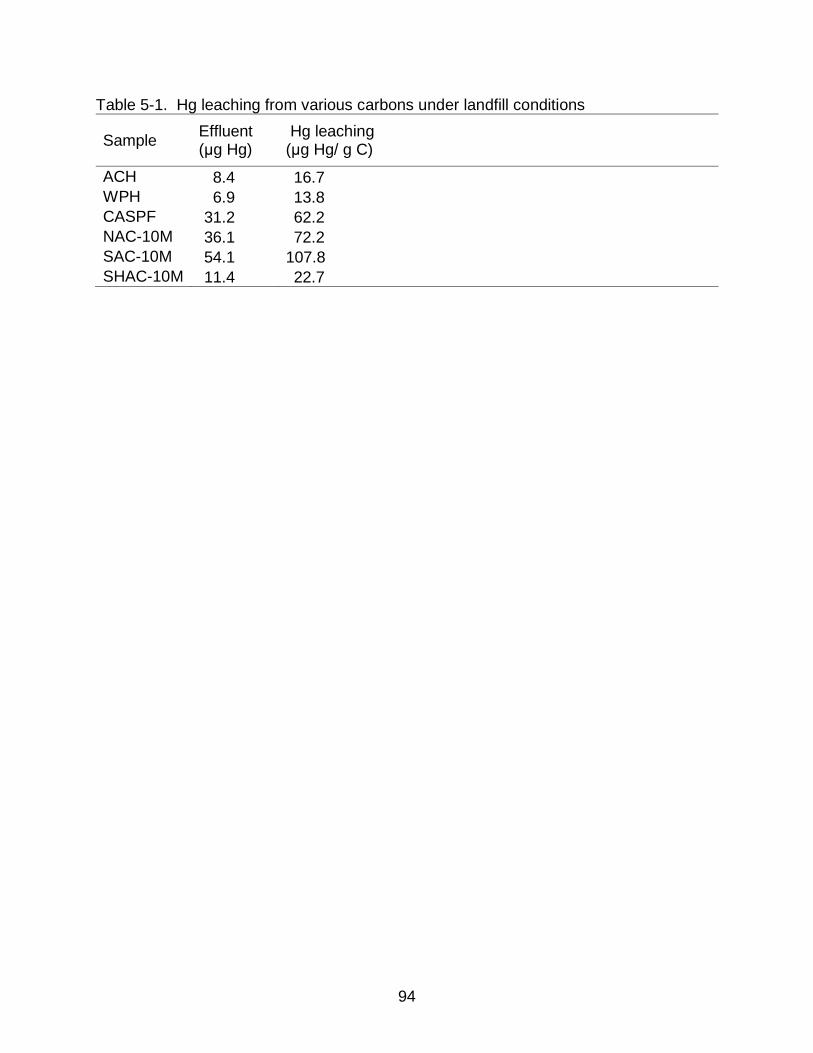
94
Table 5-1. Hg leaching from various carbons under landfill conditions
Sample Effluent (μg Hg)
Hg leaching (μg Hg/ g C)
ACH 8.4 16.7
WPH 6.9 13.8
CASPF 31.2 62.2
NAC-10M 36.1 72.2
SAC-10M 54.1 107.8
SHAC-10M 11.4 22.7
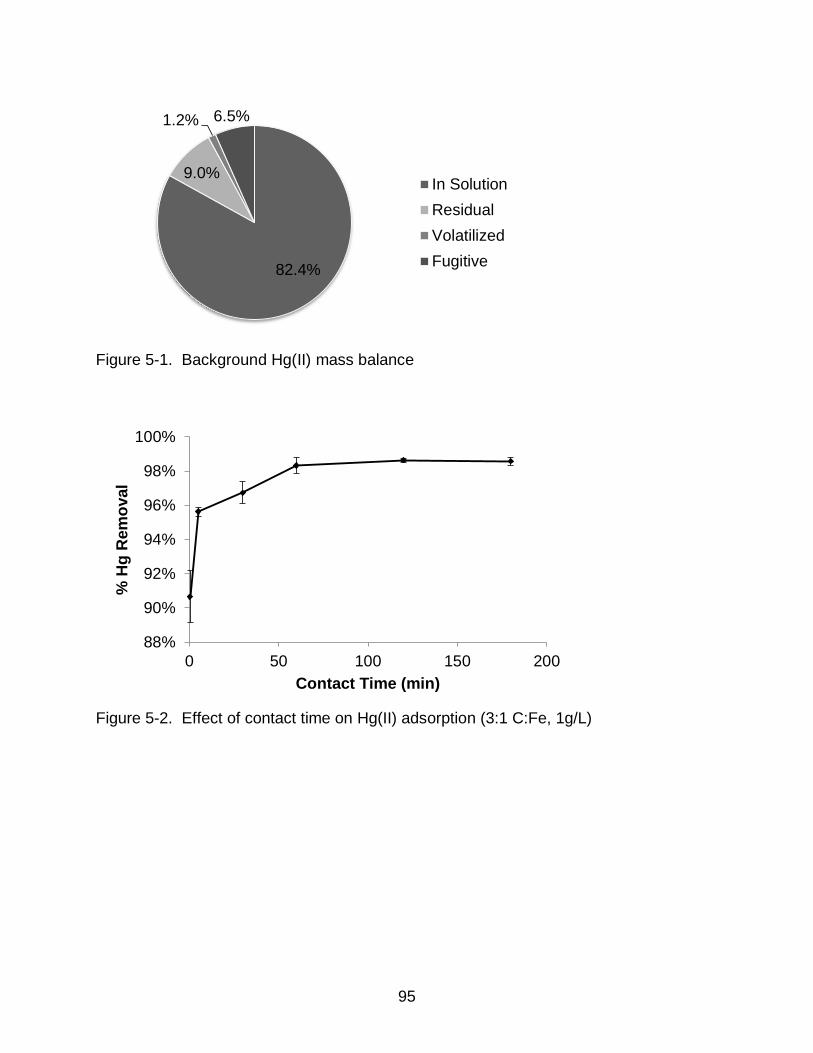
95
Figure 5-1. Background Hg(II) mass balance
Figure 5-2. Effect of contact time on Hg(II) adsorption (3:1 C:Fe, 1g/L)
82.4%
9.0%
1.2% 6.5%
In Solution
Residual
Volatilized
Fugitive
88%
90%
92%
94%
96%
98%
100%
0 50 100 150 200
% H
g R
em
oval
Contact Time (min)
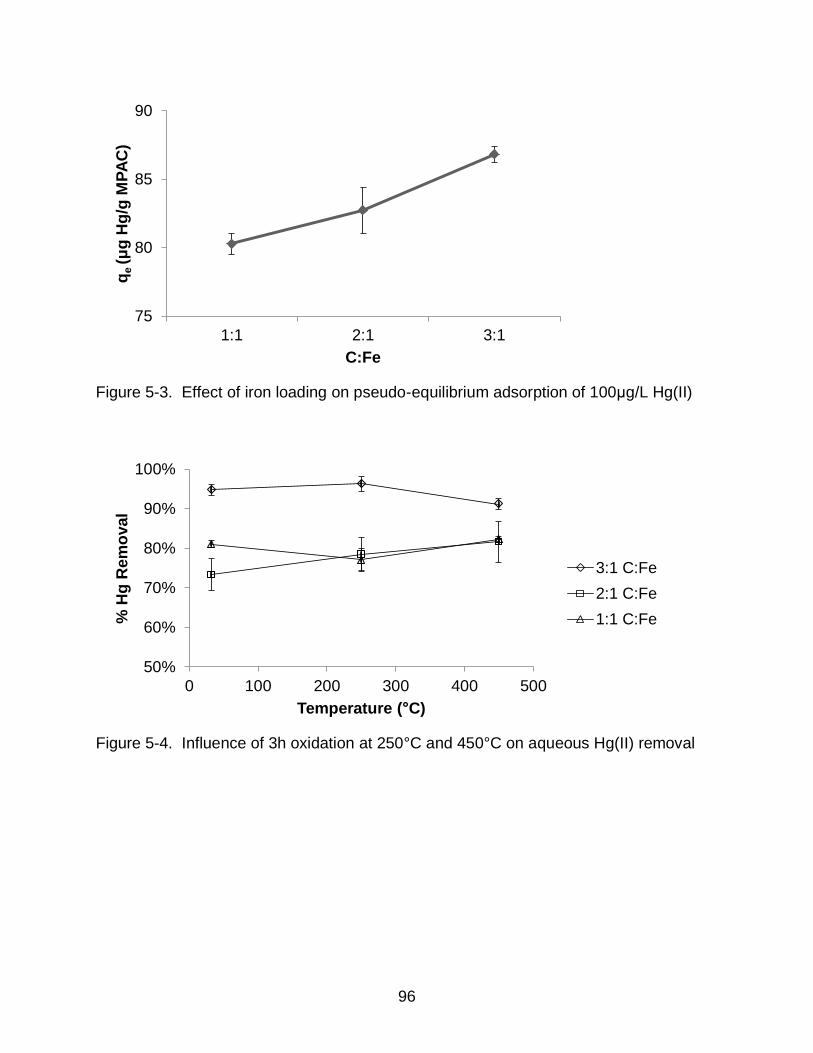
96
Figure 5-3. Effect of iron loading on pseudo-equilibrium adsorption of 100μg/L Hg(II)
Figure 5-4. Influence of 3h oxidation at 250°C and 450°C on aqueous Hg(II) removal
75
80
85
90
1:1 2:1 3:1
qe (μ
g H
g/g
MP
AC
)
C:Fe
50%
60%
70%
80%
90%
100%
0 100 200 300 400 500
% H
g R
em
oval
Temperature (°C)
3:1 C:Fe
2:1 C:Fe
1:1 C:Fe
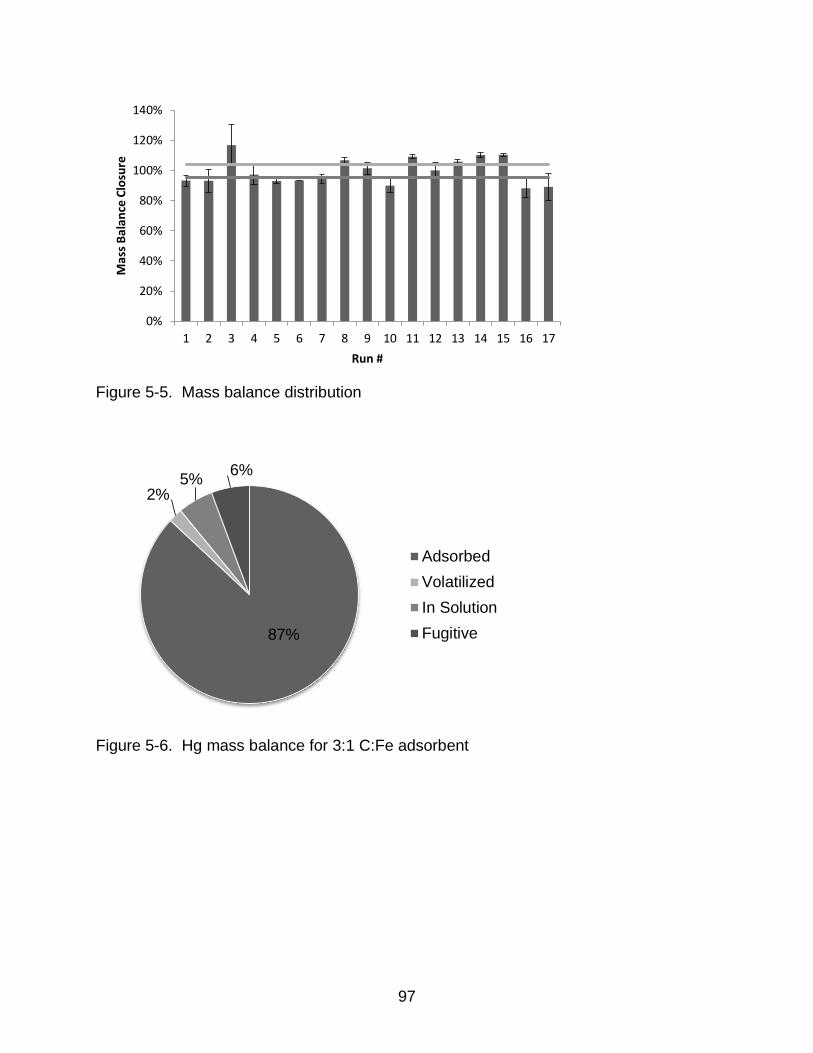
97
Figure 5-5. Mass balance distribution
Figure 5-6. Hg mass balance for 3:1 C:Fe adsorbent
0%
20%
40%
60%
80%
100%
120%
140%
1 2 3 4 5 6 7 8 9 10 11 12 13 14 15 16 17
Mas
s B
alan
ce C
losu
re
Run #
87%
2% 5%
6%
Adsorbed
Volatilized
In Solution
Fugitive
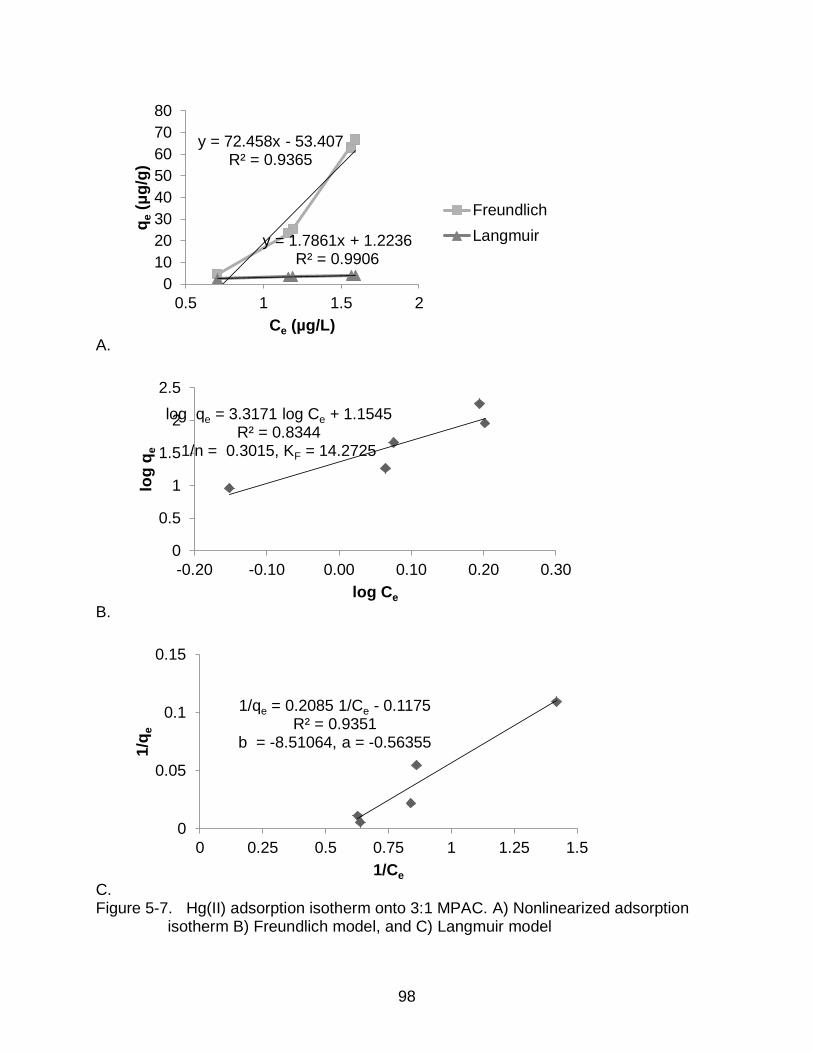
98
A.
B.
C. Figure 5-7. Hg(II) adsorption isotherm onto 3:1 MPAC. A) Nonlinearized adsorption
isotherm B) Freundlich model, and C) Langmuir model
y = 72.458x - 53.407 R² = 0.9365
y = 1.7861x + 1.2236 R² = 0.9906
0
10
20
30
40
50
60
70
80
0.5 1 1.5 2
qe (μ
g/g
)
Ce (µg/L)
Freundlich
Langmuir
log qe = 3.3171 log Ce + 1.1545 R² = 0.8344
1/n = 0.3015, KF = 14.2725
0
0.5
1
1.5
2
2.5
-0.20 -0.10 0.00 0.10 0.20 0.30
log
qe
log Ce
1/qe = 0.2085 1/Ce - 0.1175 R² = 0.9351
b = -8.51064, a = -0.56355
0
0.05
0.1
0.15
0 0.25 0.5 0.75 1 1.25 1.5
1/q
e
1/Ce
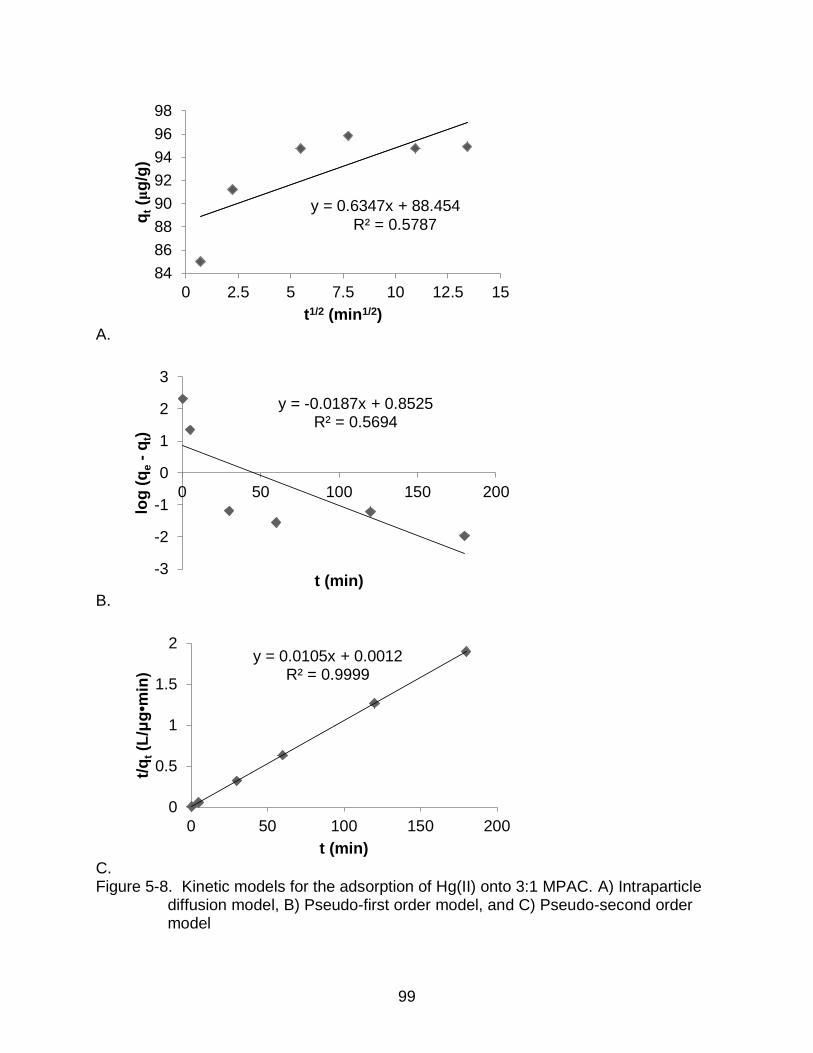
99
A.
B.
C. Figure 5-8. Kinetic models for the adsorption of Hg(II) onto 3:1 MPAC. A) Intraparticle
diffusion model, B) Pseudo-first order model, and C) Pseudo-second order model
R² = 0.5787
y = 0.6347x + 88.454
84
86
88
90
92
94
96
98
0 2.5 5 7.5 10 12.5 15
qt (μ
g/g
)
t1/2 (min1/2)
y = -0.0187x + 0.8525 R² = 0.5694
-3
-2
-1
0
1
2
3
0 50 100 150 200
log
(q
e -
qt)
t (min)
y = 0.0105x + 0.0012 R² = 0.9999
0
0.5
1
1.5
2
0 50 100 150 200
t/q
t (L
/μg•m
in)
t (min)
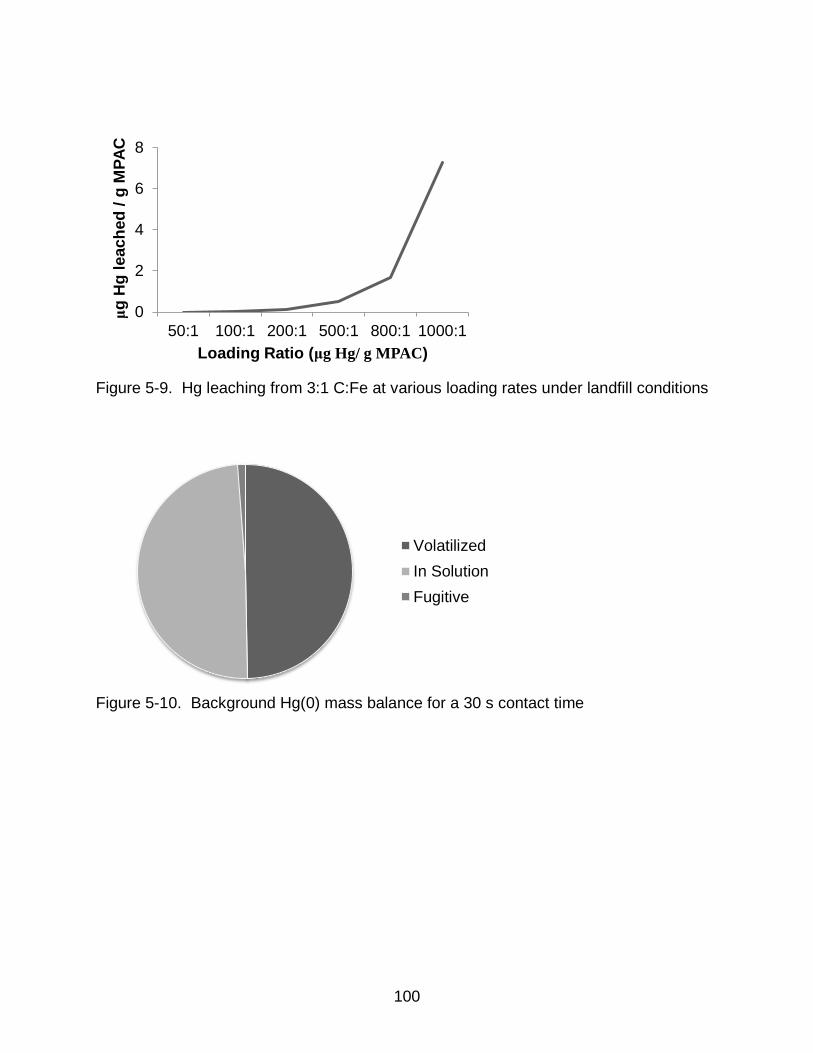
100
Figure 5-9. Hg leaching from 3:1 C:Fe at various loading rates under landfill conditions
Figure 5-10. Background Hg(0) mass balance for a 30 s contact time
0
2
4
6
8
50:1 100:1 200:1 500:1 800:1 1000:1
μg
Hg
leach
ed
/ g
MP
AC
Loading Ratio (μg Hg/ g MPAC)
Volatilized
In Solution
Fugitive
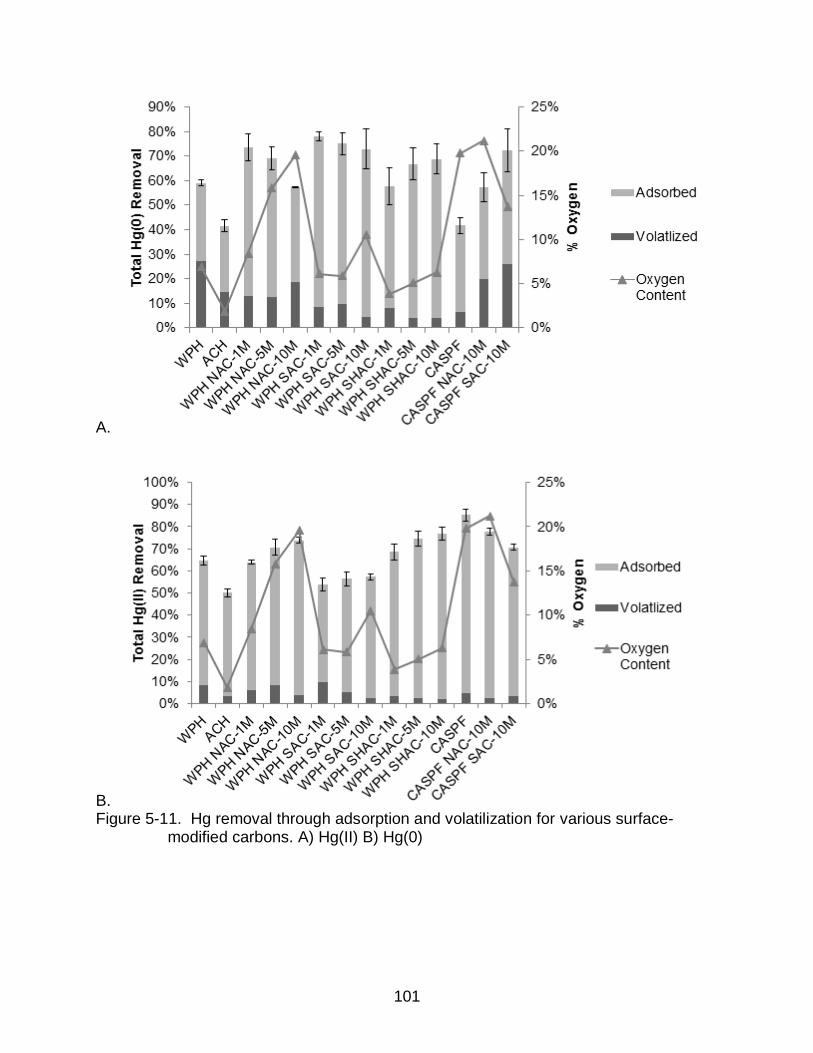
101
A.
B. Figure 5-11. Hg removal through adsorption and volatilization for various surface-
modified carbons. A) Hg(II) B) Hg(0)
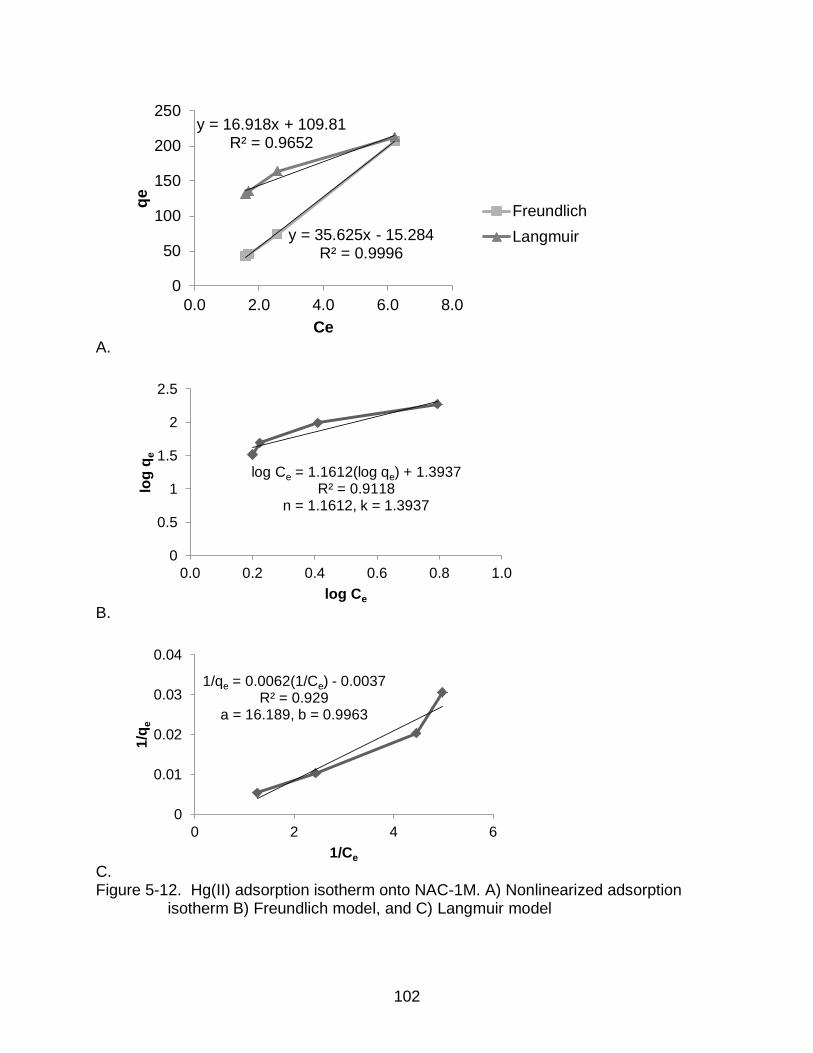
102
A.
B.
C. Figure 5-12. Hg(II) adsorption isotherm onto NAC-1M. A) Nonlinearized adsorption
isotherm B) Freundlich model, and C) Langmuir model
y = 35.625x - 15.284 R² = 0.9996
y = 16.918x + 109.81 R² = 0.9652
0
50
100
150
200
250
0.0 2.0 4.0 6.0 8.0
qe
Ce
Freundlich
Langmuir
log Ce = 1.1612(log qe) + 1.3937 R² = 0.9118
n = 1.1612, k = 1.3937
0
0.5
1
1.5
2
2.5
0.0 0.2 0.4 0.6 0.8 1.0
log
qe
log Ce
1/qe = 0.0062(1/Ce) - 0.0037 R² = 0.929
a = 16.189, b = 0.9963
0
0.01
0.02
0.03
0.04
0 2 4 6
1/q
e
1/Ce
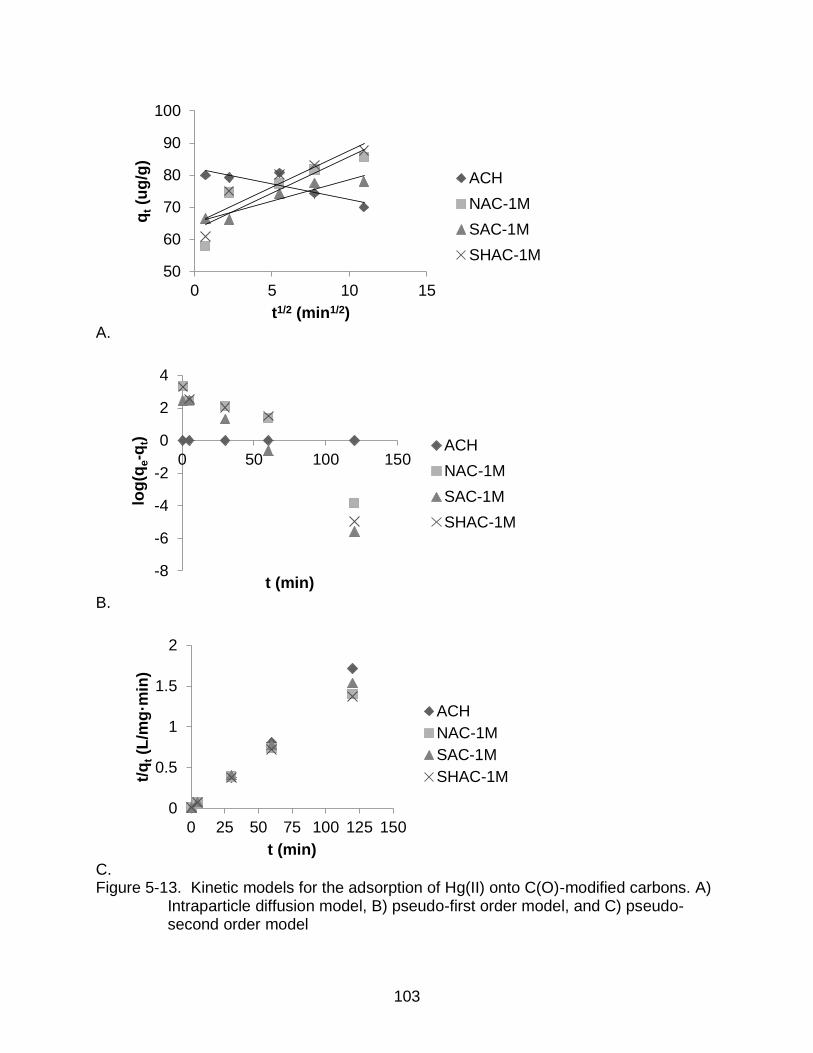
103
A.
B.
C. Figure 5-13. Kinetic models for the adsorption of Hg(II) onto C(O)-modified carbons. A)
Intraparticle diffusion model, B) pseudo-first order model, and C) pseudo-second order model
50
60
70
80
90
100
0 5 10 15
qt (u
g/g
)
t1/2 (min1/2)
ACH
NAC-1M
SAC-1M
SHAC-1M
-8
-6
-4
-2
0
2
4
0 50 100 150
log
(qe-q
t)
t (min)
ACH
NAC-1M
SAC-1M
SHAC-1M
0
0.5
1
1.5
2
0 25 50 75 100 125 150
t/q
t (L
/mg
·min
)
t (min)
ACH
NAC-1M
SAC-1M
SHAC-1M
104
CHAPTER 6 ADSORPTION MECHANISMS
One objective of this study was to determine the influence of Hg speciation on
adsorption mechanisms. The Hg speciation in each system was determined using
Visual MINTEQ. The binding mechanisms were predicted based on this speciation. A
sequential chemical extraction was designed with the goal of verifying these binding
mechanisms. Prior to applying the SCE to the MPAC and C(O)-modified carbon
systems, its performance was evaluated by forcing Hg to known speciation through
manipulation of pH and pCl and quantifying Hg desorbed in each phase.
Proposed Adsorption Mechanisms
Mechanisms of Hg(II) Adsorption
The unadjusted matrix pH ranged between 4.4 and 4.7. Using the speciation
program Visual MINTEQ 2.61, the mercury speciation in the given matrix conditions was
predicted to be 96.5-99% Hg(OH)2 and 1-3.5% HgOH+.
MPAC. Upon addition of 3:1 C:Fe MPAC, the pH of the aqueous solution reached
an equilibrium value of 6.2. Under these conditions, the Hg speciation was nearly 100%
Hg(OH)2 which was likely removed from aqueous solution by preferential precipitation
onto the MPAC surface once maximum solubility was reached.
C(O)-modified carbons. The pH of the aqueous solution varied between 3.41 and
5.45, depending on the modification of the carbon (Table 6-1). The more basic systems
contained Hg primarily as Hg(OH)2 while the more acidic systems contained Hg in
various states of hydrolysis, including Hg2+, HgOH+, and Hg(OH)2. Hg(OH)2 was likely
removed due to preferential precipitation onto the carbon surface. For the systems with
a contact pH below the pzc, the carbon surface was positively charged and
105
electrostatically repelled the Hg cations. The systems with a contact pH above the pzc,
such as NAC 10M, SAC carbons, and CASPF® modified carbons, the carbon surface
was negatively charged and thus Hg cations were electrostatically attracted to the
surface.
Mechanisms of Hg(0) Adsorption
Aqueous Hg(0) can undergo physisorption. The matrix pH and pCl do not
influence its adsorption. Gas phase research proposed Hg(0) oxidation by carbonyl-
containing C(O) groups and subsequent adsorption via known Hg(II) adsorption
mechanisms, while phenolic groups have been shown to decrease Hg(0) adsorption
[72,73]. The lack of correlation of Hg adsorption with C(O) does not support this
occurrence in the aqueous phase. Ideally, individual surface oxygen groups would be
quantified in order to determine their specific relationship, if any, to adsorption. A
chemical sequential extraction may provide more insight into the speciation of the
elemental Hg, once adsorbed.
Influence of pH and pCl on Hg(II) adsorption
The adsorption of Hg by 3:1 MPAC was investigated at various pH and pCl values.
Previously published literature reported a decrease in Hg adsorption onto activated
carbon with an increase in chloride concentration [133]. This study supports those
findings. As the pH increased from pH 2 to pH 10, Hg adsorption decreased for the
three pCl values investigated (Figure 6-1). The system with the highest chloride
concentration showed the most significant decrease in adsorption with increasing pH.
The average mass balance closure of these runs was 95% ± 5%. With an adjusted R2 of
0.557, a two variable model indicated both pH and pCl are good regression parameters
with p-values of 0.0254 and 0.0096, respectively. An ANOVA test showed pH and pCl
106
have similar influence on the Hg(II) adsorption, with sum of squares of 34.2 and 50.8,
respectively.
The influence of pH and pCl on Hg volatilization from the Hg(II) system is
presented in Figure 6-2. At pH 2, little volatilization occurred at any chloride
concentration. Regression analysis revealed that pH and pCl do not significantly
influence Hg(0) volatilization, with an adjusted R2 of -0.02.
Sequential Chemical Extraction
Protocol Verification
In order to ensure the extractant selections were sufficiently specific and efficient
to predict speciation, the pH and pCl was adjusted to control speciation (Table 6-2). If
properly designed, the distribution of Hg among the extraction fractions can be
predicted.
Free Hg(II), although predicted to desorb in the ammonium nitrate fraction due to
ion exchange, primarily desorbed in the acetic acid, DMSA, and HF residual fractions,
indicating ion exchange was not the only primary binding mechanism (Table 6-3).
Potential causes include: phase transformation that altered the adsorption mechanisms,
the ammonium nitrate extractant was inefficient at targeting ion exchange, or if the Hg
was not present as the predicted species. Surprisingly, a large amount of the Hg
remained in solution, unadsorbed.
As predicted, the largest portion of uncharged Hg(OH)2 desorbed in the acetic acid
fraction, indicating surface precipitation. Although minimal, detectable levels were found
in other extraction fractions, demonstrating phase transformation or non-ideal extractant
performance due to a lack of specificity or poor extraction efficiency. Of note, a large
107
amount of Hg volatilized from this system, indicating an Hg(II) reduction mechanism that
was not expected at the pH and pCl of the system.
HgCl2 was expected to desorb in the surface bound fraction and to volatilize from
solution as Hg(0). Although Hg desorbed in the expected fraction, a significant portion
also desorbed in the acetic acid fraction. It is possible that HgCl2 was reduced to Hg(0)
and the highly insoluble Hg2Cl2, preferentially precipitating on the carbon surface [81].
Hg-Cl anions were expected to desorb primarily in the surface bound phase. With
the adsorbent pHpzc of 9.3, the sorbent was positively charged, and should have
resulted in an electrostatic attraction between the negatively charged Hg and the
positively charged surface, enhancing adsorption. This was not realized as
approximately 14% of the Hg remained in solution at equilibrium. While a large portion
of the Hg desorbed in the DMSA extraction fraction, significant desorption also occurred
in the acetic acid fraction. A very small percentage of the Hg was predicted to be
present as HgCl2 so reduction to Hg2Cl2 was not expected to largely influence the
results. The low rate of volatilization, 1%, further indicates that this reduction does not
account for the Hg association with the surface bound fraction.
Application
Although the results were interesting, it was clear that the SCE described could
not accurately predict the speciation of Hg that was adsorbed from aqueous solution. It
was beyond the scope of this study to pursue a stronger extraction scheme.
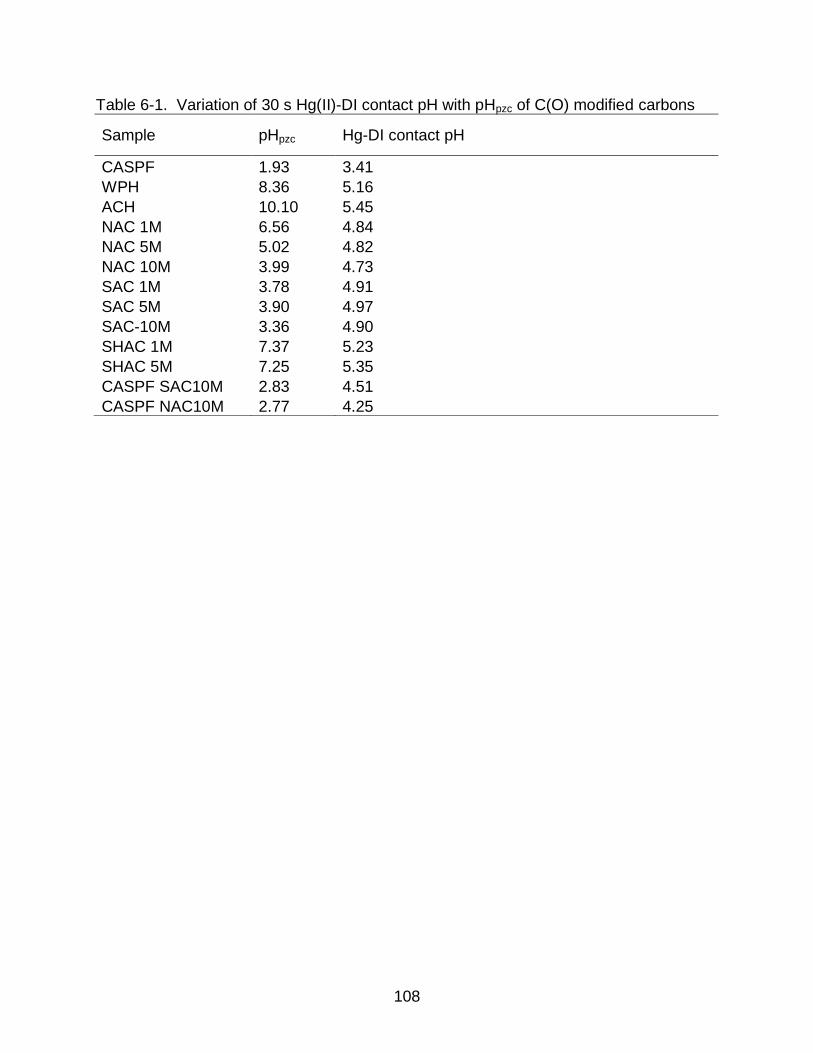
108
Table 6-1. Variation of 30 s Hg(II)-DI contact pH with pHpzc of C(O) modified carbons
Sample pHpzc Hg-DI contact pH
CASPF 1.93 3.41
WPH 8.36 5.16
ACH 10.10 5.45
NAC 1M 6.56 4.84
NAC 5M 5.02 4.82
NAC 10M 3.99 4.73
SAC 1M 3.78 4.91
SAC 5M 3.90 4.97
SAC-10M 3.36 4.90
SHAC 1M 7.37 5.23
SHAC 5M 7.25 5.35
CASPF SAC10M 2.83 4.51
CASPF NAC10M 2.77 4.25
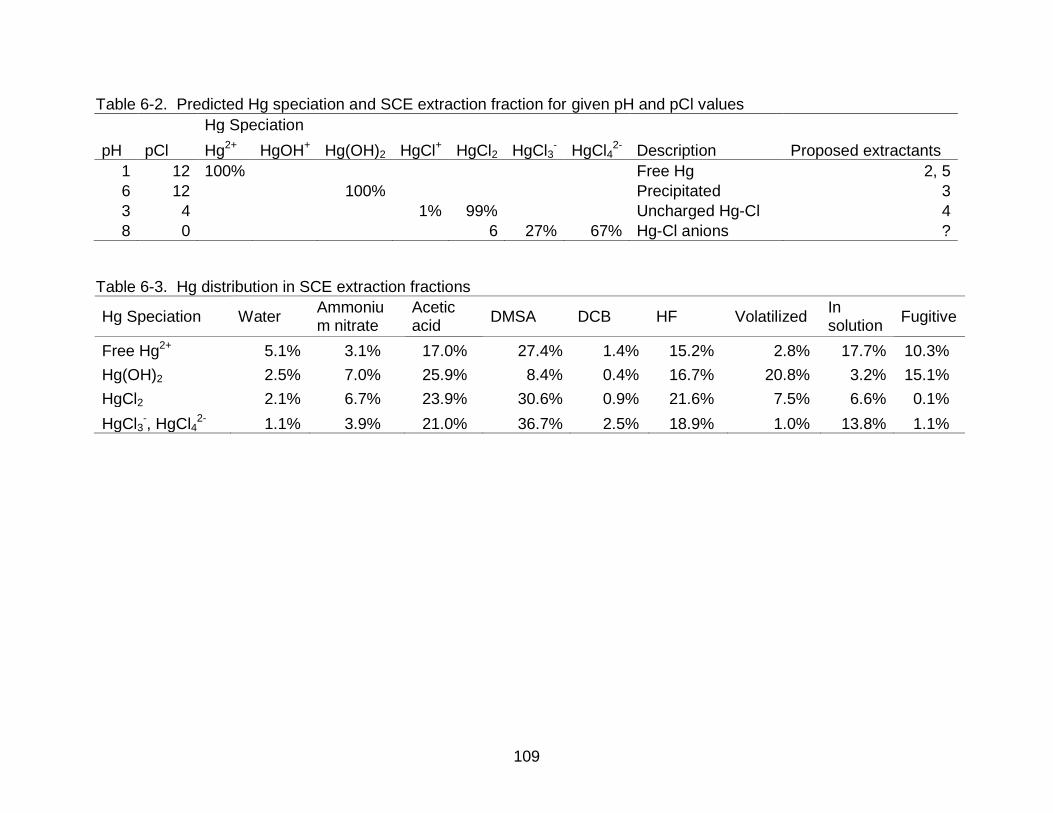
109
Table 6-2. Predicted Hg speciation and SCE extraction fraction for given pH and pCl values
pH pCl
Hg Speciation
Description Proposed extractants Hg2+ HgOH+ Hg(OH)2 HgCl+ HgCl2 HgCl3- HgCl4
2-
1 12 100%
Free Hg 2, 5
6 12
100%
Precipitated 3
3 4
1% 99%
Uncharged Hg-Cl 4
8 0 6 27% 67% Hg-Cl anions ?
Table 6-3. Hg distribution in SCE extraction fractions
Hg Speciation Water Ammonium nitrate
Acetic acid
DMSA DCB HF Volatilized In solution
Fugitive
Free Hg2+ 5.1% 3.1% 17.0% 27.4% 1.4% 15.2% 2.8% 17.7% 10.3%
Hg(OH)2 2.5% 7.0% 25.9% 8.4% 0.4% 16.7% 20.8% 3.2% 15.1%
HgCl2 2.1% 6.7% 23.9% 30.6% 0.9% 21.6% 7.5% 6.6% 0.1%
HgCl3-, HgCl4
2- 1.1% 3.9% 21.0% 36.7% 2.5% 18.9% 1.0% 13.8% 1.1%
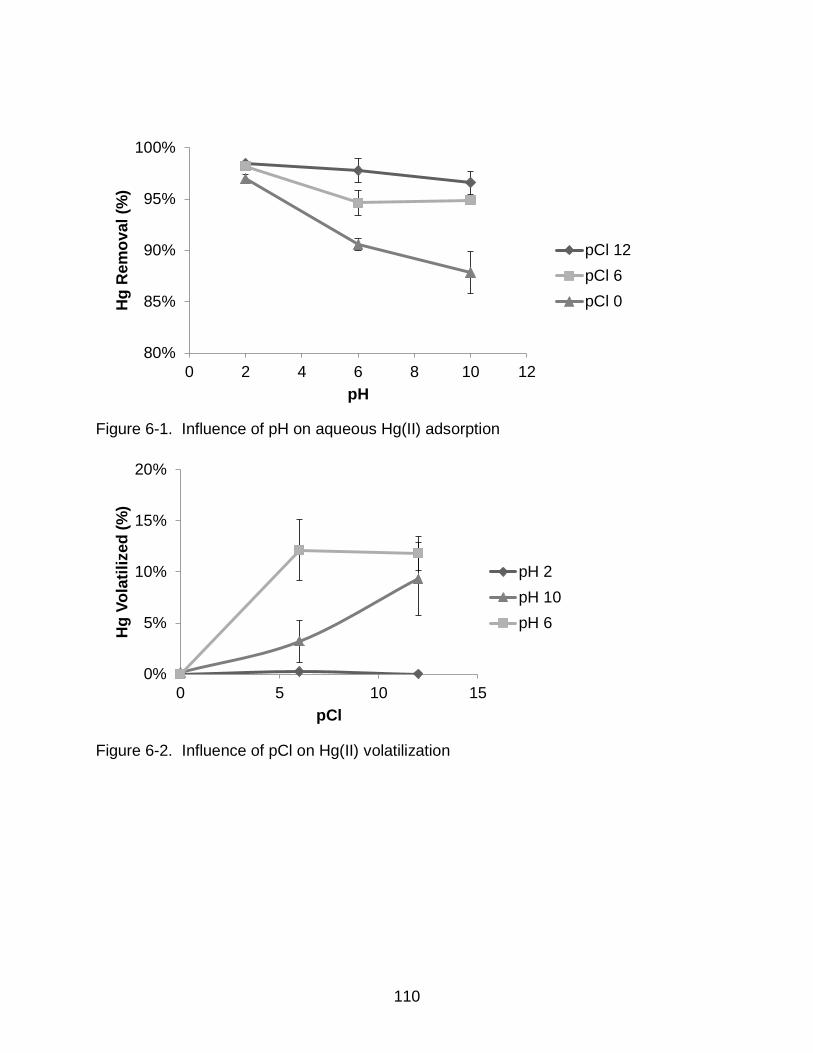
110
Figure 6-1. Influence of pH on aqueous Hg(II) adsorption
Figure 6-2. Influence of pCl on Hg(II) volatilization
80%
85%
90%
95%
100%
0 2 4 6 8 10 12
Hg
Rem
oval
(%)
pH
pCl 12
pCl 6
pCl 0
0%
5%
10%
15%
20%
0 5 10 15
Hg
Vo
lati
lized
(%
)
pCl
pH 2
pH 10
pH 6
111
CHAPTER 7 CONCLUSIONS AND RECOMMENDATIONS
Magnetic Powdered Activated Carbon
The magnetic powdered activated carbon, synthesized by iron impregnation and
thermal oxidation, was optimized for mercury removal. The 3:1 C:Fe MPAC reached the
goal of 95% sorbent recovery, with only a 25% decrease from the virgin carbon surface
area. The presence of maghemite and amorphous iron oxides was confirmed on the 3:1
C:Fe MPAC. Thermal oxidation succeeded in decreasing the amorphous characteristic
of the MPACs but did not provide a significant increase in magnetic recovery or Hg-
removal performance. The potential benefits of thermal oxidation are not realized and
are outweighed by the damaged porosity and increased cost in production. When
exposed to an acidic matrix pH, the 3:1 MPAC leached low concentrations of Fe. Iron is
not a concern from a regulatory standpoint and this leaching did not cause coloration of
the water nor did it influence the sorbent recoverability.
In addition to ideal magnetic recovery, the 3:1 C:Fe MPAC outperformed other
MPACs for Hg(II) removal. The 3:1 MPAC exhibited the highest adsorption capacity. At
a pseudo-equilibrium contact time of 120 min with a 100 μg/L Hg solution at unadjusted
pH, the 3:1 MPAC performed optimally, achieving 91% Hg removal with 2% volatilized,
84% adsorbed, while 4% remained fugitive. The average Hg mass balance closure for
all 17 runs was 99.5% with a standard deviation of 8.8%, verifying the MPAC Hg
removal performance. Surface area appears to influence adsorption in this system but,
with a correlation of only 0.47, another factor is also influencing the system. The
adsorption data fits both the Freundlich and Langmuir models, indicating that Hg
adsorption proceeds both as chemisorption and physisorption. As the data strongly fits
112
the pseudo-second order model, chemisorption is clearly involved in this system. Once
adsorbed, the Hg is strongly bound to the MPAC surface. Hg leaching does not
necessitate special residuals handling until a loading of greater than 800 μg Hg/ g
MPAC.
Matrix pH and pCl are known to influence Hg speciation. Both pH and pCl were
shown to influence Hg adsorption onto 3:1 C:Fe MPAC. This influence was used
investigate the use of a sequential chemical extraction to predict Hg speciation and
binding mechanisms. The results clearly showed that the SCE described could not
accurately predict the speciation of Hg that was adsorbed from aqueous solution.
Surface Oxygen Modified Carbon
Commercially available activated carbons underwent wet chemical oxidation with
HNO3, H2SO4, and NaOH, increasing surface oxygen functionality with the goal of
increased Hg(II) and Hg(0) adsorption. Nitric acid modification produced the most
surface oxygen groups but resulted in slight damage to porosity. Sulfuric acid and
sodium hydroxide modification did not damage porosity but were less effective than
nitric acid at increasing the surface oxygen functionality.
The model that best fit Hg(II) adsorption identified oxygen content and pHpzc as
important variables, with oxygen content being the primary variable influencing the
results. Hg(0) adsorption data best fit a four variable model, indicating that surface area,
pore volume, surface oxygen functionality, and the pHpzc as good regression
parameters, with the pHpzc as the primary variable influencing the results. Neither model
achieved a strong R2 value. It is possible that an unquantified variable influenced these
results. Due to the uncharged nature of Hg(0), it is possible that water cluster formation,
due to C(O) groups, limited adsorption. A minimum of surface oxygen groups are
113
required for the surface to be sufficiently hydrophilic, allowing the surface to be wetted
by water and thus useful for water treatment applications. Therefore, a moderate
amount of surface oxygen groups are optimal for Hg(0) adsorption from aqueous
solution.
As no carbons violated TCLP effluent limits, it can be inferred that the Hg is
strongly bound to the surface. Hg(II) adsorption onto the C(O) modified carbons fit both
the Freundlich and Langmuir models, indicating that both physisorption and
chemisorption occur. The data fit both pseudo-first order and pseudo-second order
models very well, also supporting the occurrence of both physisorption and
chemisorption.
In summary, it is possible to tailor activated carbon to allow for magnetic
recapture. It also possible to enhance aqueous Hg(II) capture through surface oxygen
modification, although Hg(0) adsorption is not influenced by these surface groups. Both
carbons produced are stable and, under the experimental loading conditions applied, do
not require special handling or disposal as a hazardous waste. The most effective
aqueous Hg treatment method will depend on water chemistry, sorbent surface
chemistry, and Hg speciation.
Contributions to Science
Demonstrated that magnetic recovery is possible with low C:Fe without significant changes to surface area, pore size, and pore volume.
Found that thermal oxidation, although achieving the goal of converting amorphous iron oxides to more crystalline form, did not result in improved sorbent recapture.
Identified 3:1 C:Fe without thermal oxidation as the optimal synthesis parameters for trace level aqueous Hg removal.
Increased understanding of Hg adsorption mechanisms by:
114
o Suggesting the influence of water cluster formation on aqueous Hg(0) adsorption.
o Demonstrated that surface oxygen functionality alone is not strongly correlated to aqueous Hg(0) adsorption.
o Identified porosity, adsorbent surface charge, and oxygen content as significant variables in aqueous Hg(0) adsorption.
o Demonstrated that, although porosity was not exerting a large influence on aqueous Hg(II) adsorption, pore volume influenced the results to a greater degree than surface area.
Determined that pH and pCl do not significantly influence Hg volatilization from solution.
Demonstrated that activated carbon can be used to adsorb aqueous Hg(0); improved aqueous capture is beneficial by reducing Hg losses to the atmosphere due to volatility.
Future Recommendations
Combine the magnetic and surface oxygen group modification techniques.
Apply the modified carbons to real wastewaters.
Confirm oxidation of Hg(0) using SEM and XRD.
Determine the identity and concentration of surface oxygen functional groups developed with the wet chemical oxidation methods; determine any correlation between these groups and Hg(II) and removal.
115
APPENDIX A MODIFICATION OF SURFACE OXYGEN FUNCTIONALITY OF BIOCHAR FOR HG
ADSORPTION
In addition to wood and coal-based carbons, recent literature investigates the use
of more sustainable biomass carbon sources [75,134,135]. Biochar, a sustainable and
affordable pyrolyzed carbon commonly applied to soils to increase fertility and water
retention, can exhibit high surface area and may act as a surface sorbent similar to
activated carbon. Adsorption of Cu, Ni, Cd, and Pb onto biochar has been correlated
with the amount of C(O) groups present, determined by O/C ratio, pHpzc, total acidity,
and 1H NMR analysis [136].
This study utilized the same surface oxygen modification applied to activated
carbon. Table A-1 shows the biochar characterization results. No biochars investigated
demonstrated high surface area. Modification did not significantly alter porosity or
surface charge.
Table A-2 shows the Hg removal performance. Batch adsorption studies were
performed at room temperature with a 150mg/L dose of biochar to 50 μg/L Hg-DI for a
30 s contact time. No biochars performed as well as the activated carbons previously
discussed. The modification did not influence the Hg(II) adsorption efficiency. It is of
interest that Hg does have an affinity for biochar, even if this affinity is lower than
activated carbon and is not influenced by C(O) groups.
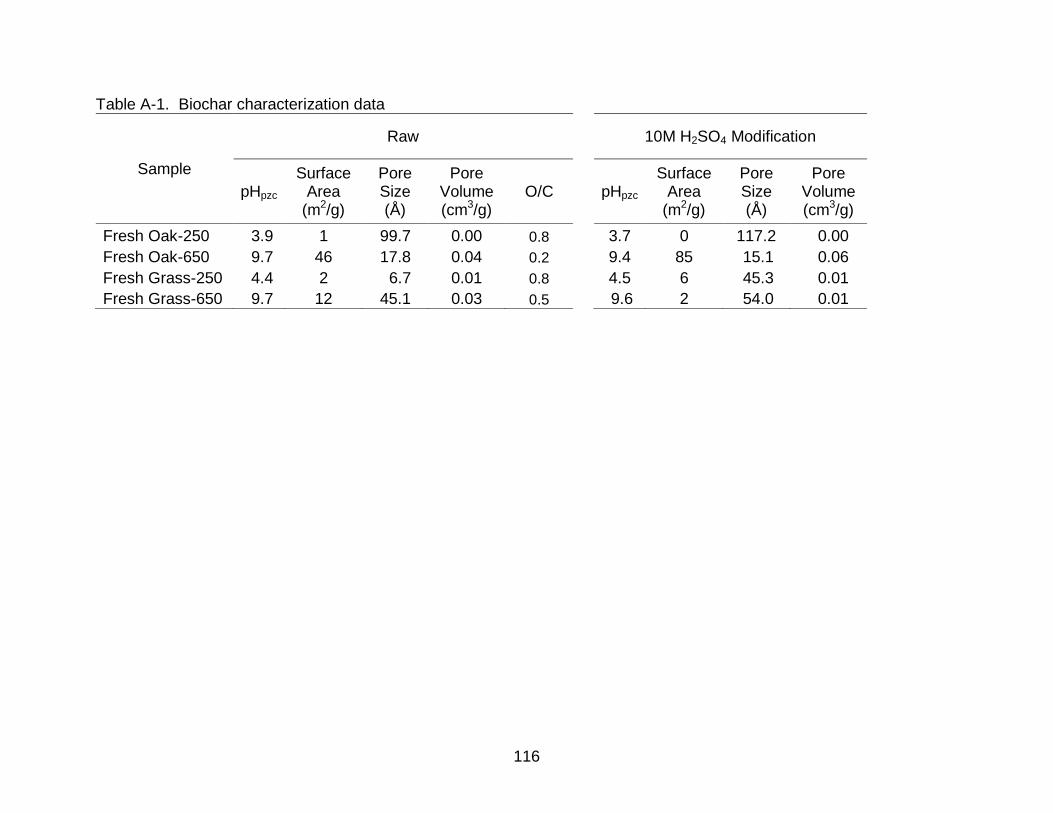
116
Table A-1. Biochar characterization data
Sample
Raw
10M H2SO4 Modification
pHpzc Surface
Area (m2/g)
Pore Size (Å)
Pore Volume (cm3/g)
O/C
pHpzc Surface
Area (m2/g)
Pore Size (Å)
Pore Volume (cm3/g)
Fresh Oak-250 3.9 1 99.7 0.00 0.8
3.7 0 117.2 0.00
Fresh Oak-650 9.7 46 17.8 0.04 0.2
9.4 85 15.1 0.06
Fresh Grass-250 4.4 2 6.7 0.01 0.8
4.5 6 45.3 0.01
Fresh Grass-650 9.7 12 45.1 0.03 0.5
9.6 2 54.0 0.01
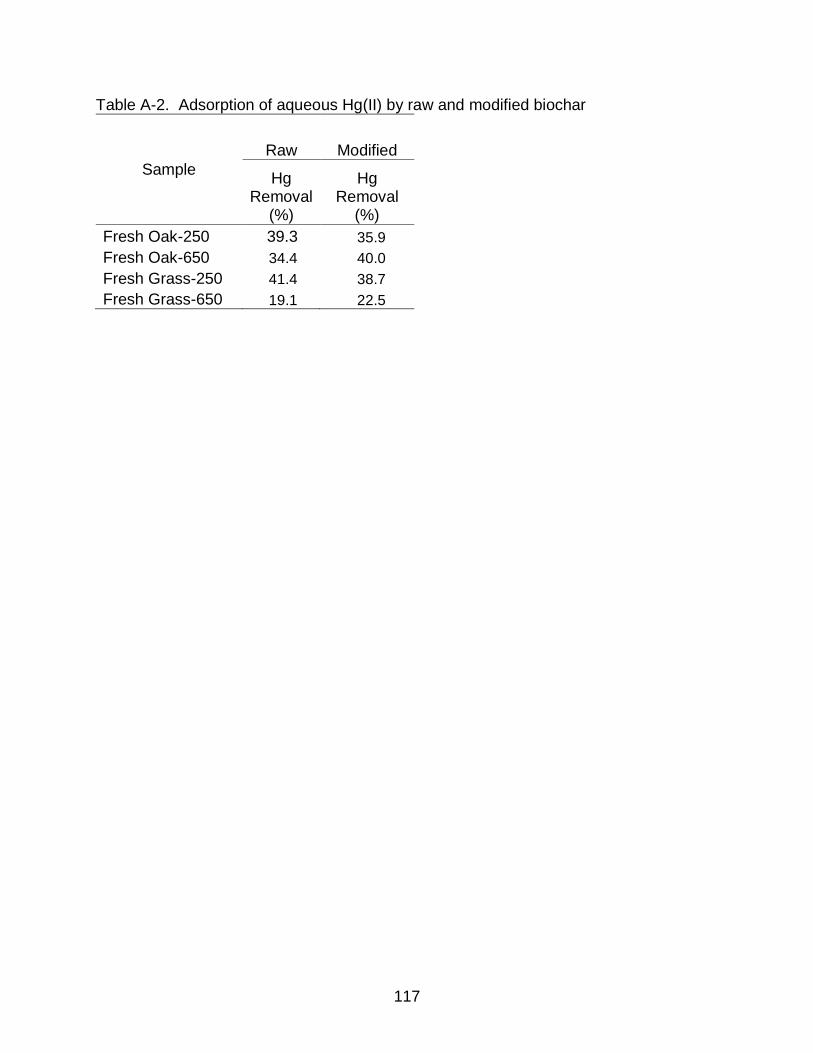
117
Table A-2. Adsorption of aqueous Hg(II) by raw and modified biochar
Sample
Raw Modified
Hg Removal
(%)
Hg Removal
(%)
Fresh Oak-250 39.3 35.9
Fresh Oak-650 34.4 40.0
Fresh Grass-250 41.4 38.7
Fresh Grass-650 19.1 22.5
118
LIST OF REFERENCES
[1] U.S. Environmental Protection Agency. Toxics release inventory: Reporting year 2007 public data release summary of key findings. 260-R-09-001, 2009.
[2] U.S. Code of Federal Regulations. Water quality criteria for the protection of wildlife. 40CFR132 Table 4, 2010.
[3] Drasch, Horvat M, Stoeppler M. Mercury. In: Merian E, Anke M, Ihnat M, Stoeppler M, editors. Elements and their compounds in the environment, . 2nd ed., Weinheim; Wiley-VCH; 2004 p. 931-1006.
[4] U.N.E.P Chemicals. Global mercury assessment. Geneva, Switzerland, 54790-01, 2002.
[5] Burgess J. Ions in solution: Basic principles of chemical interactions. 2nd ed. Coll House, England: Horwood Publishing; 1999.
[6] Kim CS, Rytuba JJ, Brown GE. EXAFS study of mercury(II) sorption to Fe- and Al-(hydr)oxides I. effects of pH. J Colloid Interface Sci 2004; 271(1): 1-15.
[7] Benjamin M. Water chemistry. Boston MA: McGraw-Hill; 2002.
[8] Hahne HC, Kroontje W. Significance of pH and chloride concentration on behavior of heavy metal pollutants: Mercury(II), cadmium(II), zinc(II), and lead(II). J Environ Qual. 1973; 2(4): 444-450.
[9] Davis A, Bloom NS, Hee SS. The environmental geochemistry and bioaccessibility of mercury in soils and sediments: A review. Risk Analysis 1997; 17(5): 557-569.
[10] Merian E editor. Metals and their compounds in the environment. Weinheim NY: VCH; 1999.
[11] Schwertmann U, Cornell RM. Iron oxides in the laboratory: Preparation and characterization. 2nd ed. Weinheim NY: Wiley-VCH; 2000.
[12] Kim CS, Rytuba JJ, Brown GE. EXAFS study of mercury(II) sorption to Fe- and Al-(hydr)oxides: II. effects of chloride and sulfate. J Colloid Interface Sci 2004; 270(1): 9-20.
[13] Hahne HCH, Kroontje W. The simultaneous effect of pH and chloride concentrations upon mercury(II) as a pollutant. Soil Sci Soc Am J 1973; 37(6): 838-843.
119
[14] Feick G, Yeaple D, Horne RA. Release of mercury from contaminated freshwater sediments by runoff of road deicing salt. Science 1972; 175(4026): 1142-1143.
[15] U.S. Environmental Protection Agency. Mercury study report to congress, volulme V: Health effects of mercury and mercury compounds. EPA-452/R-97-007, 1997.
[16] Langford N, Ferner R. Toxicity of mercury. J Hum Hypertens 1999; 13(10): 651-656.
[17] Harada H. Congenital Minimata disease: Intraeuterine methyl mercury poisoning. Teratology 1978(18): 285-288.
[18] Bakir F, Damluji S, Amin-Zski L. Methyl mercury poisoning in Iraq. Science 1973(181): 230-241.
[19] U.S. Environmental Protection Agency. Mercury study report to congress, volume II: An inventory of anthropogenic mercury emissions in the United States. Washington DC, EPA-452/R-97-004, 1997.
[20] U.S. Environmental Protection Agency. Roadmap for mercury. Washington DC, EPA-HW-QPPT-2005-0013, 2006.
[21] U.S. Environmental Protection Agency. Compilation of air pollutant emission factors, chapter 8: inorganic chemical industry. Research Triangle park NC, AP-42, 1995.
[22] Bansal R, Goyal M. Activated carbon adsorption. Boca Raton: CRC Press; 2005.
[23] Anirudhan TS, Divya L, Ramachandran M. Mercury(II) removal from aqueous solutions and wastewaters using a novel cation exchanger derived from coconut coir pith and its recovery. J Hazard Mater 2008; 157(2-3): 620-627.
[24] von Canstein H, Li Y, Timmis KN, Deckwer WD, Wagner-Dobler I. Removal of mercury from chloralkali electrolysis wastewater by a mercury-resistant pseudomonas putida strain. Appl Environ Microbiol 1999; 65(12): 5279-5284.
[25] U.S. Environmental Protection Agency. National emission standards for hazardous air pollutants: mercury emissions from mercury cell chlor-alkali plants; final rule. 40CFR63, 2003.
[26] Tewalt SJ, Bragg LJ, Finkelman, RB. Mercury in U.S. coal - abundance, distribution, and modes of occurrence. Washington DC, FS-095-01, 2001.
120
[27] Chang J, Ghorishi S. Simulation and evaluation of elemental mercury concentration increase in flue gas across a wet scrubber. Environ Sci Technol 2003; 37(24): 5763-5766.
[28] U.S. Environmental Protection Agency. Steam electric power generating effluent guidelines rulemaking, supplemental information package #2 for federalism and unfunded mandates reform act consultations, Washington DC, EPA 821-R-09-008, 2011.
[29] U.S. Environmental Protection Agency. Capsule report: Aqueous mercury treatment. Washington DC, EPA/625/R-97/004, 1997.
[30] Patterson, Luo B, Petropoulou C, Gasca E. Toxicity reduction methodologies. In: Ford D, editor. Toxicity reduction, evaluation, and control, . 2nd ed., Lancaster, PA; Technomic Publishing Co.; 1998 p. 109.
[31] Findlay DM, McLean RAN. Removal of elemental mercury from wastewaters using polysulfides. Environ Sci Technol 1981; 15(11): 1388-1390.
[32] Moorhouse J. Modern chlor-alkali technology, vol. 8. Oxford: Blackwell Science Ltd.; 2001.
[33] Huang CP, Blankenship DW. The removal of mercury(II) from dilute aqueous-solution by activated carbon. Water Res 1984; 18(1): 37-46.
[34] Humenick MJ, Schnoor JL. Improving mercury (II) removal by activated carbon. J Environ Eng-ASCE 1974; 100(NEE6): 1249-1262.
[35] Marsh H, Rodriguez-Reinoso F. Activated carbon. Amsterdam: Elsevier; 2006.
[36] Lopez-Gonzalez J, Moreno-Castilla C, Guerrero-Ruiz A, Rodriguez-Reinoso F. Effect of carbon-oxygen and carbon-sulphur surface complexed on the adsorption of mercuric chloride in aqueous solutions by activated carbons. J Chem Tech Biotechnol 1982; 32: 575-579.
[37] Krishnan KA, Anirudhan TS. Removal of mercury(II) from aqueous solutions and chlor-alkali industry effluent by steam activated and sulphurised activated carbons prepared from bagasse pith: Kinetics and equilibrium studies. J Hazard Mater 2002; 92(2): 161-183.
[38] Manchester S, Wang X, Kulaots I, Gao Y, Hurt RH. High capacity mercury adsorption on freshly ozone-treated carbon surfaces. Carbon 2008; 46(3): 518-524.
[39] Tong S, Fan M, Mao L, Jia CQ. Sequential extraction study of stability of adsorbed mercury in chemically modified activated carbons. Environ Sci Technol 2011; 45(17): 7416-7421.
121
[40] US Environmental Protection Agency, Office of Superfund Remediation and Technology Innovation. Treatment technologies for mercury removal from soil, waste, and water. Washington DC, EPA-542-R-07-003, 2007.
[41] Boehm HP. Surface oxides on carbon and their analysis: A critical assessment. Carbon 2002; 40(2): 145-149.
[42] Yang RT. Adsorbents: Fundamentals and applications. Hoboken NJ. Wiley; 2003.
[43] Yin CY, Aroua MK, Daud WMAW. Review of modifications of activated carbon for enhancing contaminant uptakes from aqueous solutions. Sep Purif Technol 2007; 52(3): 403-415.
[44] Puri BR. Surface complexes on carbons. Chem Phys Carbon 1970; 6: 191-282.
[45] Zhao NQ, Wei N, Li JJ, Qiao ZJ, Cui J, He F. Surface properties of chemically modified activated carbons for adsorption rate of cr(VI). Chem. Eng. J. 2005; 115(1-2): 133-138.
[46] Saha B, Tai MH, Streat M. Metal sorption performance of an activated carbon after oxidation and subsequent treatment. Process Saf. Environ. Prot. 2001; 79(B6): 345-351.
[47] Biniak S, Szymanski G, Siedlewski J, Swiatkowski A. The characterization of activated carbons with oxygen and nitrogen surface groups. Carbon 1997; 35(12): 1799-1810.
[48] Shim JW, Park SJ, Ryu SK. Effect of modification with HNO3 and NaOH on metal adsorption by pitch-based activated carbon fibers. Carbon 2001; 39(11): 1635-1642.
[49] Biniak S, Pakula M, Szymanski GS, Swiatkowski A. Effect of activated carbon surface oxygen- and/or nitrogen-containing groups on adsorption of copper(II) ions from aqueous solution. Langmuir 1999; 15(18): 6117-6122.
[50] Shen W, Li Z, Liu Y. Surface chemical functional groups modification of porous carbon. Recent Patents on Chemical Engineering 2008; 1: 27-40.
[51] Santiago M, Stuber F, Fortuny A, Fabregat A, Font J. Modified activated carbons for catalytic wet air oxidation of phenol. Carbon 2005; 43(10): 2134-2145.
[52] Figueiredo JL, Pereira MFR, Freitas MMA, Orfao JJM. Modification of the surface chemistry of activated carbons. Carbon 1999; 37(9): 1379-1389.
122
[53] Maroto-Valer MM, Dranca I, Lupascu T, Nastas R. Effect of adsorbate polarity on thermodesorption profiles from oxidized and metal-impregnated activated carbons. Carbon 2004; 42(12-13): 2655-2659.
[54] Rios RRVA, Alves DE, Dalmazio I, Fernando S, Bento V, Donnici CL, et al. Tailoring activated carbon by surface chemical modification with O, S, and N containing molecules. Mat Res 2001; 6(2): 129-135.
[55] Moreno-Castilla C, Carrasco-Marin F, Maldonado-Hodar FJ, Rivera-Utrilla J. Effects of non-oxidant and oxidant acid treatments on the surface properties of an activated carbon with very low ash content. Carbon 1998; 36(1-2): 145-151.
[56] Li YH, Lee CW, Gullett BK. Importance of activated carbon's oxygen surface functional groups on elemental mercury adsorption. Fuel 2003; 82(4): 451-457.
[57] Moreno-Castilla C, Ferrogarcia MA, Joly JP, Bautistatoledo I, Carrascomarin F, Riverautrilla J. Activated carbon surface modifications by nitric-acid, hydrogen-peroxide, and ammonium peroxydisulfate treatments. Langmuir 1995; 11(11): 4386-4392.
[58] Salame II, Bandosz TJ. Study of water adsorption on activated carbons with different degrees of surface oxidation. J Colloid Interface Sci 1999; 210(2): 367-374.
[59] Salame II, Bandosz TJ. Surface chemistry of activated carbons: Combining the results of temperature-programmed desorption, boehm, and potentiometric titrations. J Colloid Interface Sci 2001; 240(1): 252-258.
[60] Oliveira LCA, Rios RVRA, Fabris JD, Garg V, Sapag K, Lago RM. Activated carbon/iron oxide magnetic composites for the adsorption of contaminants in water. Carbon 2002; 40(12): 2177-2183.
[61] Oliveira LCA, Petkowicz DI, Smaniotto A, Pergher SBC. Magnetic zeolites: A new adsorbent for removal of metallic contaminants from water. Water Res 2004; 38(17): 3699-3704.
[62] Gorria P, Sevilla M, Blanco JA, Fuertes AB. Synthesis of magnetically separable adsorbents through the incorporation of protected nickel nanoparticles in an activated carbon. Carbon 2006; 44(10): 1954-1957.
[63] Cornell R, Schwertmann U. The iron oxides. Weinheim: VCH; 1996.
[64] Okamoto S. Iron hydroxides as magnetic scavengers. IEEE Trans Magn 1974; MA10(3): 923-926.
123
[65] Masel RI. Principles of adsorption and reaction on solid surfaces. New York: Wiley; 1996.
[66] Faust S, Aly O. Adsorption processes for water treatment. Boston: Butterworth Publishers; 1987.
[67] Stumm W, Morgan J. Aquatic chemistry : Chemical equilibria and rates in natural waters 3rd ed. ed. New York: Wiley; 1996.
[68] International Union of Pure and Applied Chemistry. Manual of Symbols and Terminology, Part 1, Colloid and Surface Chemistry. 2002; Available at: http://www.iupac.org/reports/2001/colloid_2001/manual_of_s_and_t/. Accessed February, 2009.
[69] Calgon Carbon Corporation. Laboratory evaluation of granular activated carbons for liquid phase applications. Pittsburg PA, IB-1002-0907, 2007; .
[70] Coolidge AS. The adsorption of mercury vapor by charcoal. J Am Chem Soc 1927; 49: 1949-1952.
[71] Shiels DO. The adsorption of mercury vapor by activated charcoal. J Phys Chem 1929; 33: 1398-1402.
[72] Krishnan SV, Gullett BK, Jozewicz W. Sorption of elemental mercury by activated carbons. Environ Sci Technol 1994; 28(8): 1506-1512.
[73] Liu J, Cheney MA, Wu F, Li M. Effects of chemical functional groups on elemental mercury adsorption on carbonaceous surfaces. J Hazard Mater 2011; 186(1): 108-113.
[74] Goel J, Kadirvelu K, Rajagopal C, Garg VK. Removal of mercury(II) from aqueous solution by adsorption on carbon aerogel: Response surface methodological approach. Carbon 2005; 43(1): 197-200.
[75] Kadirvelu K, Kavipriya M, Karthika C, Vennilamani N, Pattabhi S. Mercury(II) adsorption by activated carbon made from sago waste. Carbon 2004; 42(4): 745-752.
[76] Carrott PJM, Carrott MMLR, Nabais JMV. Influence of surface ionization on the adsorption of aqueous mercury chlorocomplexes by activated carbons. Carbon 1998; 36(1-2): 11-17.
[77] Sato S, Yoshihara K, Moriyama K, Machida M, Tatsumoto H. Influence of activated carbon surface acidity on adsorption of heavy metal ions and aromatics from aqueous solution. Appl Surf Sci 2007; 253(20): 8554-8559.
124
[78] Xiao B, Thomas KM. Competitive adsorption of aqueous metal ions on an oxidized nanoporous activated carbon. Langmuir 2004; 20(11): 4566-4578.
[79] SenGupta A. Environmental separation of heavy metals: Engineering processes. Boca Raton: CRC Press; 2002.
[80] Radovic LR, Moreno-Castilla C, Rivera-Utrilla J. Carbon materials as adsorbents in aqueous solutions. Chem Phys Carbon 2001; 27: 227-405.
[81] Cox M, El-Shafey E, Pichugin AA, Appleton Q. Removal of mercury(II) from aqueous solution on a carbonaceous sorbent prepared from flax shive. J Chem Technol Biotechnol 2000; 75(6): 427-435.
[82] Wiatrowski HA, Das S, Kukkadapu R, Ilton E, Barkay T, Yee N. Reduction of hg(II) to hg(0) by magnetite. Environ Sci Technol 2009; 73(14): 5307-5313.
[83] Newton DW, Ellis R, Paulsen GM. Effect of ph and complex-formation on mercury (II) adsorption by bentonite. J Environ Qual 1976; 5(3): 251-254.
[84] Sarkar D. Preliminary studies on mercury solubility in the presence of iron oxide phases using static headspace analysis. Environ Geo 2003; 10(4): 151-155.
[85] Tiffreau C, Lutzenkirchen J, Behra P. Modeling the adsorption of mercury (II) on (hydr)oxides. J Colloid Interf Sci 1995; 172: 82-93.
[86] Fauconnier N, Bee A, Roger J, Pons JN. Synthesis of aqueous magnetic liquids by surface complexation of maghemite nanoparticles. J Mol Liq 1999; 83(1-3): 233-242.
[87] O'Loughlin EJ, Kelly SD, Kemner KM, Csencsits R, Cook RE. Reduction of Ag-I, Au-III, Cu-II, and Hg-II by Fe-II/Fe-III hydroxysulfate green rust. Chemosphere 2003; 53(5): 437-446.
[88] Charlet L, Bosbach D, Peretyashko T. Natural attenuation of TCE, as, Hg linked to the heterogeneous oxidation of Fe(II): An AFM study. Chem Geol 2002; 190(1-4): 303-319.
[89] Scheinost AC, Charlet L. Selenite reduction by mackinawite, magnetite and siderite: XAS characterization of nanosized redox products. Environ Sci Technol 2008; 42(6): 1984-1989.
[90] White AF, Peterson ML. Reduction of aqueous transition metal species on the surfaces of fe(II)-containing oxides. Geochim Cosmochim Acta 1996; 60(20): 3799-3814.
125
[91] Senior C, editor. Behavior of mercury in air pollution control devices on coal-fired utility boilers. Engineering Foundation Conference; 2001; Salt Lake City, UT.
[92] Lighty, Silcox and Fry. Fundamentals of mercury oxidation in flue gas. Pittsburg PA, DE-FG26-03NT41797, 2004.
[93] Dunham GE, DeWall RA, Senior CL. Fixed-bed studies of the interactions between mercury and coal combustion fly ash. Fuel Process Technol 2003; 82(2-3): 197-213.
[94] Snoeyink V, Jenkins D. Water chemistry. New York: John Wiley & Sons; 1980.
[95] Elliot P, Hartenstein H, editors. Selective Separation of Mercury and Other Heavy Metals During FGD Wastewater Treatment. APC Round Table and Expo; July 8-10, 2007; Chattanooga, TN; 2007.
[96] Hahne HCH, Kroontje W. Simultaneous effect of ph and chloride concentrations upon mercury (ii) as a pollutant. Soil Sci Soc Am J 1973; 37(6): 838-843.
[97] Sing K, Everett D, Haul R, Moscou L, Pierotti R, Rouquerol J, et al. Reporting physisorption data for gas solid systems with special reference to the determination of surface-area and porosity. Pure Appl Chem 1985; 57(4): 603-619.
[98] Sanemasa I. Solubility of elemental mercury-vapor in water. Bull Chem Soc Jpn 1975; 48(6): 1795-1798.
[99] Bloom NS, Preus E, Katon J, Hiltner M. Selective extractions to assess the biogeochemically relevant fractionation of inorganic mercury in sediments and soils. Anal Chim Acta 2003; 479(2): 233-248.
[100] Perez OP, Umetsu Y, Sasaki H. Precipitation and densification of magnetic iron compounds from aqueous solutions at room temperature. Hydrometallurgy 1998; 50(3): 223-242.
[101] Menendez JA, Phillips J, Xia B, Radovic LR. On the modification and characterization of chemical surface properties of activated carbon: In the search of carbons with stable basic properties. Langmuir 1996; 12(18): 4404-4410.
[102] Laine NR, Vastola FJ, Walker PL. Importance of active surface area in carbon-oxygen reaction. J Phys Chem 1963; 67(10): 2030-&.
[103] Aggarwal D, Goyal M, Bansal RC. Adsorption of chromium by activated carbon from aqueous solution. Carbon 1999; 37(12): 1989-1997.
126
[104] Menendez JA, Xia B, Phillips J, Radovic LR. On the modification and characterization of chemical surface properties of activated carbon: Microcalorimetric, electrochemical, and thermal desorption probes. Langmuir 1997; 13(13): 3414-3421.
[105] Dastgheib SA, Karanfil T. Adsorption of oxygen by heat-treated granular and fibrous activated carbons. J Colloid Interface Sci 2004; 274(1): 1-8.
[106] Li YH, Lee CW, Gullett BK. The effect of activated carbon surface moisture on low temperature mercury adsorption. Carbon 2002; 40(1): 65-72.
[107] Chingombe P, Saha B, Wakeman RJ. Surface modification and characterisation of a coal-based activated carbon. Carbon 2005; 43(15): 3132-3143.
[108] Quantachrome Instruments. Nova e series: High speed surface area and pore size analyzers. 2008; Available at: http://www.quantachrome.com/pdf_brochures/07122.pdf. Accessed 08/07, 2009.
[109] Brunauer S, Emmett PH, Teller E. Adsorption of gases in multimolecular layers. J Am Chem Soc 1938; 60: 309-319.
[110] Barrett EP, Joyner LG, Halenda PP. The determination of pore volume and area distributions in porous substances .1. computations from nitrogen isotherms. J Am Chem Soc 1951; 73(1): 373-380.
[111] Cho D, Chon C, Kim Y, Jeon B, Schwartz FW, Lee E, et al. Adsorption of nitrate and cr(VI) by cationic polymer-modified granular activated carbon. Chem Eng J 2011; 175: 298-305.
[112] Al-Rashdi B, Somerfield C, Hilal N. Heavy metals removal using adsorption and nanofiltration techniques. Sep Purif Rev 2011; 40(3): 209-259.
[113] Laszlo K, Josepovits K, Tombacz E. Analysis of active sites on synthetic carbon surfaces by various methods. Anal Sci 2001; 17: i1741-i1744.
[114] Moskowitz B. Hitchhikers guide to magnetism. 1991; Available at: http://www.irm.umn.edu/hg2m/hg2m_index.html. Accessed 9/18, 2009.
[115] Looney BB, Denham ME, Vangelas KM, Bloom NS. Removal of mercury from low-concentration aqueous streams using chemical reduction and air stripping. J Environ Eng-ASCE 2003; 129(9): 819-825.
[116] Balogh SJ, Nollet YH. Mercury mass balance at a wastewater treatment plant employing sludge incineration with offgas mercury control. Sci Total Environ 2008; 389(1): 125-131.
127
[117] Rauret G, Lopez-Sanchez JF, Sahuquillo A, Barahona E, Lachica M, Ure AM, et al. Application of a modified BCR sequential extraction (three-step) procedure for the determination of extractable trace metal contents in a sewage sludge amended soil reference material (CRM 483), complemented by a three-year stability study of acetic acid and EDTA extractable metal content. J Environ Monit 2000; 2(3): 228-233.
[118] Filgueiras AV, Lavilla I, Bendicho C. Chemical sequential extraction for metal partitioning in environmental solid samples. J Environ Monit 2002; 4(6): 823-857.
[119] Hall G, Gauthier G, Pelchat J, Pelchat P, Vaive J. Application of a sequential extraction scheme to ten geological certified reference materials for the determination of 20 elements. J Anal At Spectrom 1996; 11(9): 787-796.
[120] Kim CS, Bloom NS, Rytuba JJ, Brown GE. Mercury speciation by X-ray absorption fine structure spectroscopy and sequential chemical extractions: A comparison of speciation methods. Environ Sci Technol 2003; 37(22): 5102-5108.
[121] Fergusson J. The heavy elements: Chemistry, environmental impacts, and health effects. Oxford: Pergamon Press; 1990.
[122] Tessier A, Campbell PGC, Bisson M. Sequential extraction procedure for the speciation of particulate trace-metals. Anal Chem 1979; 51(7): 844-851.
[123] Gubbins D, Herrero Bervera E, SpringerLink (Online service). Encyclopedia of geomagnetism and paleomagnetism [electronic resource]. Dordrecht: Springer; 2007.
[124] Zhang F, Itoh H. Adsorbents made from waste ashes and post-consumer PET and their potential utilization in wastewater treatment. J Hazard Mater 2003; 101(3): 323-337.
[125] Annadurai G, Juang R, Lee D. Use of cellulose-based wastes for adsorption of dyes from aqueous solutions. J Hazard Mater 2002; 92(3): 263-274.
[126] Ho Y, McKay G. The sorption of lead(II) ions on peat RID C-8624-2009. Water Res 1999; 33(2): 578-584.
[127] Ho Y, McKay G. Pseudo-second order model for sorption processes RID C-8624-2009. Process Biochem 1999; 34(5): 451-465.
[128] Ho Y. Review of second-order models for adsorption systems RID C-8624-2009. J Hazard Mater 2006; 136(3): 681-689.
128
[129] Nan Q, LeVan M. Adsorption equilibrium modeling for water on activated carbons. Carbon 2005; 43(11): 2258-2263.
[130] Li L, Quinlivan P, Knappe D. Effects of activated carbon surface chemistry and pore structure on the adsorption of organic contaminants from aqueous solution. Carbon 2002; 40(8): 2085-2100.
[131] Mahajan O, Moreno-Castilla C, Walker P. Surface-treated activated carbon for removal of phenol from water. Sep Sci Technol 1980; 15(10): 1733-1752.
[132] Lee W, Reucroft P. Vapor adsorption on coal- and wood-based chemically activated carbons: surface oxidation states and adsorption of H2O. Carbon 1999; 37(1): 7-14.
[133] Ranganathan K. Adsorption of hg(II) ions from aqueous chloride solutions using powdered activated carbons. Carbon 2003; 41(5): 1087-1092.
[134] Goel J, Kadirvelu K, Rajagopal C. Mercury (II) removal from water by coconut shell based activated carbon: Batch and column studies. Environ Technol 2004; 25(2): 141-153.
[135] Khalkhali RA, Omidvari R. Adsorption of mercuric ion from aqueous solutions using activated carbon. Polish J Environ Studies 2005; 14(2): 185-188.
[136] Uchimiya M, Chang S, Klasson KT. Screening biochars for heavy metal retention in soil: Role of oxygen functional groups. J Hazard Mater 2011; 190(1-3): 432-441.
129
BIOGRAPHICAL SKETCH
Emily Kaye Faulconer is the daughter of Charles and Susan Faulconer born in
Galax, VA in 1982. The family relocated to Lynchburg, VA in 1984. Following the
footsteps of both her mother and her uncle, Jim Davis, Emily graduated from
Shenandoah Valley Academy in 1999. Emily achieved her associate’s degree from
Central Virginia Community College in 2002 and continued on to Virginia
Commonwealth University, graduating cum laude with her bachelor’s degree in Forensic
Science in 2004. After working as a certifying scientist at a forensic drug testing facility
and teaching high school sciences for three years, Emily began her pursuit of an
Environmental Engineering Sciences graduate degree at the University of Florida in
2008, under the guidance of David Mazyck, Ph.D. She received her Ph.D. in
Environmental Engineering Sciences in the spring of 2012.