effective virtual teams
TRANSCRIPT
Scientific Research and Essays Vol. 7(21), pp. 1971-1985, 7 June, 2012 Available online at http://www.academicjournals.org/SRE DOI: 10.5897/SRE10.1005 ISSN 1992-2248 © 2012 Academic Journals
Full Length Research Paper
Effective virtual teams for new product development
Nader Ale Ebrahim1*, Shamsuddin Ahmed1, Salwa Hanim Abdul Rashid1 and Zahari Taha2
1Department of Engineering Design and Manufacture, Faculty of Engineering, University of Malaya,
50603, Kuala Lumpur, Malaysia. 2Faculty of Manufacturing Engineering and Management Technology, University Malaysia Pahang,
26300 Gambang, Pahang, Malaysia.
Accepted March 29, 2012
At present, the existing literature shows that the factors which influence the effectiveness of virtual teams for new product development are still ambiguous. To address this problem, a research design was developed, which includes detailed literature review, preliminary model and field survey. From literature review, the factors which influence the effectiveness of virtual teams are identified and these factors are modified using a field survey. The relationship between knowledge workers (people), process and technology in virtual teams is explored in this study. The results of the study suggest that technology and process are tightly correlated and need to be considered early in virtual teams. The use of software as a service, web solution, report generator and tracking system should be incorporated for effectiveness virtual teams. Key words: Virtual teams, collaboration, questionnaires, communication, information, integration, performance, success, cross-functional teams, product development.
INTRODUCTION Nowadays, virtual teams enable work to be carried out over computer networks and reduce the need for teams to be collocated. Virtual teams are defined as “small temporary groups of geographically, organizationally and/or time dispersed knowledge workers who coordinate their work, mainly with electronic information and communication technologies to carry out one or more organization tasks” (Ale Ebrahim et al., 2009b). The statement “We are becoming more virtual all the time!” is often heard in many global corporations today (Chudoba et al., 2005). New product development (NPD) is widely recognized as a key to corporate prosperity (Lam et al., 2007). Different products may need different processes. A new product idea needs to be conceived, selected, developed, tested and launched to the market (Martinez-Sanchez et al., 2006). The specialized skills and talents required for the development of new products often *Corresponding author E-mail: [email protected]
reside (and develop) locally in pockets of excellence around the company or even around the world. Therefore, firms have no choice but to disperse their new product units to access such dispersed knowledge and skills (Kratzer et al., 2005). Consequently, firms are faced with the problem that the internal development of all technologies required for new products and processes are difficult or impossible. Firms must increasingly receive technology from external sources (Stock and Tatikonda, 2004).
Virtualization in NPD has recently started to make a serious headway due to developments in technology - virtuality in NPD is now technically possible (Leenders et al., 2003). Supply chains need to collaborate more closely compared with the past as prodcu development becomes more complex. These collaborations almost always involve individuals from different locations, and therefore, virtual teamwork supported by information technology (IT) offer notable potential benefits (Anderson et al., 2007). Although the use of the internet in NPD has received considerable attention in the literature, little is known regarding collaborative tools and effective virtual
1972 Sci. Res. Essays
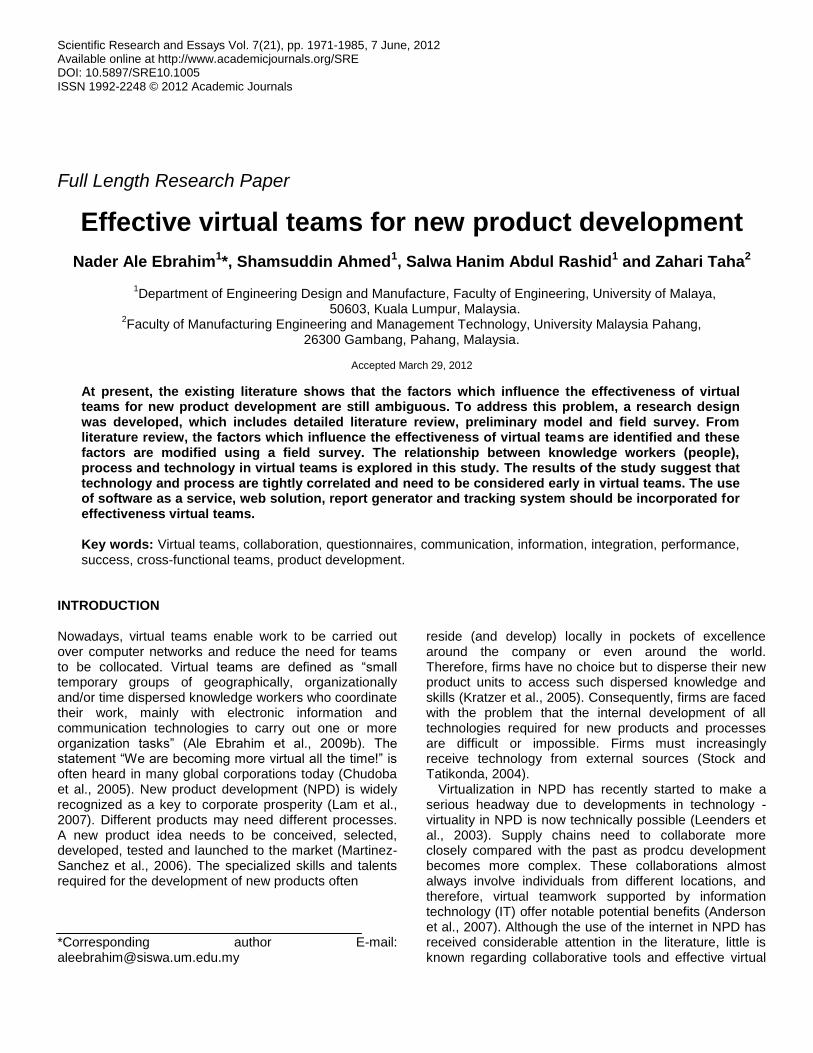
Figure 1. Model for effective virtual teamwork (Source (Bal and Gundry, 1999)).
teams for NPD (Ale Ebrahim et al., 2009a).
THE NEED FOR EFFECTIVE VIRTUAL TEAMS A review of the literature reveals that the factors which influence the effectiveness of virtual teams are still ambiguous (Ale Ebrahim et al., 2009d). One of the notable challenges for effective virtual teams is ensuring good communication amongst all members of the distributed teams (Anderson et al., 2007). Jarvenpaa and Leidner (1999) found that regular and timely communication feedback is a key to building trust and commitment in distributed teams. A study by Lin et al. (2008) suggested that social dimensional factors need to be considered early during the virtual team creation process, and are critical to the effectiveness of the team. Communication is a tool that directly influences the social dimensions of the team, which improves team performance and has a positive impact on satisfaction within the virtual team.
For teams moving from collocation to virtual environments, an ability to adapt and change can be a long process riddled with trial and error scenarios. This process is seen as necessary to encourage effective virtual teams (Kirkman et al., 2002). Despite weak ties between virtual team members, ensuring lateral communication may be adequate for effective virtual team performance. In terms of implementation, lateral communication in both virtual context and composition teams can be increased by reducing the hierarchical structure of the team (that is, a flatter reporting structure and/or decentralization) and the use of computer-mediated communication tools (Wong and Burton, 2000).
Malhotra and Majchrzak’s (2004) study of 54 effective virtual teams found that creating a state of shared understanding about goals and objectives, task requirements and interdependencies, roles and responsibilities, and member expertise had a positive effect on output quality. Hertel et al. (2005) collected effectiveness ratings from team managers both at the individual team levels. The results of the field study showed good reliability of task work-related attributes, teamwork-related attributes, and attributes related to tele-cooperative work.
Shachaf and Hara (2005) proposed four dimensions of effective virtual team leadership:
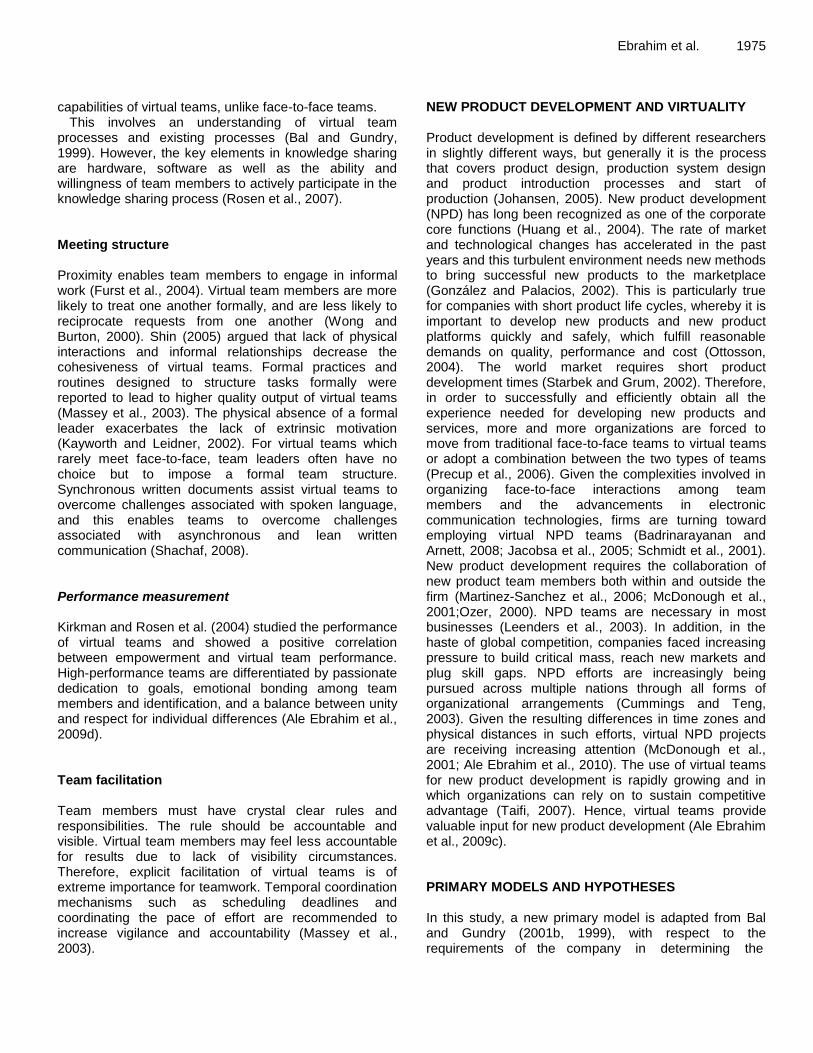
1. Communication: the leader provides continuous feedback, engages in regular and prompt communication and clarifies tasks. 2. Understanding: the leader is sensitive to the members’ schedules, appreciates their opinions and suggestions, cares about their problems, gets to know them and expresses a personal interest in them. 3. Role clarity: the leader clearly defines responsibilities of all members, exercises authority, and mentors virtual team members. 4. Leadership attitude: the leader is assertive yet not too “bossy,” caring, relates to members at their own levels, and upholds a consistent attitude over the life of the project. From observations and interviews, Bal et al. (2001b, 1999) identified 12 elements for effective virtual teamwork, as illustrated in Figure 1. The Bal and Gundry (2001b, 1999) model was used as the basic framework in this paper.
Ebrahim et al. 1973 Table 1. Tools for virtual teams.
Tool Examples Uses and Advantages Immediacy Sensory Modes
Instant Messaging and
Chat
• Yahoo Messenger
• MSN Messenger
• AOL Instant Messenger
• Skype
• Instant interaction
• Less intrusive than a phone call
• View who is available
• Low cost
• Low setup effort
• Synchronous or asynchronous
• Visual
• Text and limited
graphics
Groupware /
Shared Services
• Lotus Notes
• Microsoft Exchange
• Novell Groupwise
• Calendars
• Contact Lists
• Arrange meetings
• Cost and setup effort vary
• Asynchronous • Visual
Remote Access and Control
• NetMeeting
• WebEx
• Remote Desktop
• pcAnywhere
• User controls a PC without being on-site
• Cost varies
• Setup varies
• Synchronous • Visual
• Audio
• Tactile
Web Conferencing
• NetMeeting
• WebEx
• Meeting Space
• GoToMeeting
• Live audio
• Dynamic video
• Whiteboard
• Application sharing
• Moderate cost and setup effort
• Synchronous • Visual
• Unlimited graphics
• Optional audio
File Transfer • File Transfer Protocol (FTP)
• Collaborative Websites
• Intranets
• Share files of any type
• Cost varies
• Moderate setup effort
• Asynchronous • Varies with file
content
Email • Many vendors and • free applications
• Send messages or files
• Cost and setup effort vary
• Asynchronous • Visual
• Audio in attached
files
Telephone • “Plain Old Telephone Service” (POTS)
• Voice Over Internet Protocol (VOIP)
• Direct calls
• Conference calls
• Cost varies
• Low setup effort
• Synchronous
• Asynchronous for voice mail
• Audio
Adopted from Thissen et al. (2007).
Virtual teamwork: Technology point of view
Selection
A simple transmission of information from point A to point B is insufficient as the virtual environment presents significant challenges for effective communication (Walvoord et al., 2008). Being equipped with even the most advanced technology is inadequate to make a virtual team effective, since the internal group dynamics and external support mechanisms must also be present for a team to succeed in the virtual world (Lurey and Raisinghani, 2001). Information richness seems to be the most important criterion for technology selection and the greatest impediment to the effectiveness of virtual teams is the implementation of technology (Mikkola et al., 2005). Virtual teams are technology-mediated groups of people from different disciplines that work on common tasks (Dekker et al., 2008). Hence, the way the technology is
implemented appears to be a factor which makes a virtual team’s outcome more or less likely successful (Anderson et al., 2007). The matrix in Table 1 assists the virtual team facilitator in choosing the suitable technology based upon the purpose of the meeting.
Location
Virtual teams enable organizations to access the most qualified individuals for a particular job regardless of their locations and provide greater flexibility to individuals working from home or on the road (Bell and Kozlowski, 2002). Table 2 shows the relationship between tools, time and space in virtual teams.
Training
Suggestions for training remote managers and virtual
1974 Sci. Res. Essays Table 2. Time /Space matrix.
Same space Different space
Same time
Synchronous
Face-to-face meeting, Brainstorming,
Vote, PC and projector Electronic white
board, GDSS, Chat
Chat, Tele-conference, Video-conference,
Liaison satellite, Audio-conference, Shared white
board, Shared application
Different time
Asynchronous
Team room, Document management
system, Discussion forum, E-mail,
Workflow, Project management
E-mail, Workflow, Document sharing ,
Discussion forum, Group agenda Cooperative hypertext and organizational memory, Version control Meeting scheduler
Adapted from Bouchard and Cassivi (2004).
team development can be found in (Hertel et al., 2005). The results of Anderson et al.’s (2007) systematic lab study confirmed many observations, including explicit preparation and training for virtual teams as a way of working collaboratively. In the case of computer collective efficacy, Fuller et al. (2006) indicated that computer training which is related to more advanced skills sets may be useful in building virtual team efficacy. Hertel et al. (2005) suggested that training leads to increased cohesiveness and team satisfaction.
Security
Since virtual teamwork involves exchanging and manipulating sensitive information and data via the Internet, security is always an important issue of concern (Bal and Teo, 2001b). Team leaders should identify the special technological and security level needs of the virtual team and their team members (Hunsaker and Hunsaker, 2008).
Virtual teamwork: People point of view
Team selection
Team selection is one of the key factors which distinguish successful teams from unsuccessful ones (Ale Ebrahim et al., 2009d). Virtual teams can be designed to include people who are most suited for a particular project (Bell and Kozlowski, 2002). In this manner, the project will be clearly defined, and the outcome priorities and supportive team climate will be established. Selection of members with the necessary skills is crucial for virtual teams (Hunsaker and Hunsaker, 2008). Selection of virtual team members is particularly difficult due to the geographical and organizational separation involved (Bal and Gundry, 1999).
Reward structure
Developing a fair and motivating reward system is another significant issue at the beginning of virtual
teamwork (Bal and Teo, 2001a; Hertel et al., 2005). Virtual team performance must be recognized and rewarded (Bal and Gundry, 1999). Lurey and Raisinghani (2001) found that reward systems ranked strongly among the external support mechanisms for virtual teams in a survey to determine the factors that contribute to the success of a virtual team.
Meeting training
Comparing teams with little and extensive training, Bal and Gundry (1999) noted a significant drop in performance as both teams went live using the system. However, the latter then improved its performance at a faster rate than the former. Training is a key aspect which cannot be neglected in team building. Virtual team members require different types of training compared to ordinary teams. The training includes self-managing skills, communication and meeting training, project management skills, technology training, et cetera (Bal and Teo, 2001b).
Specify an objective
While direct leadership strategies are possible in conventional teams, members of virtual teams may be managed more effectively by empowerment and by delegating managerial functions to the members (Hertel et al., 2005). Such an approach changes the role of a team manager from traditional controlling into more coaching and moderating functions (Kayworth and Leidner, 2002).
Virtual team leaders should identify commonalities among members early on, while focusing the team on achieving key performance objectives (Ale Ebrahim et al., 2009d).
Virtual teamwork: Process point of view
Alignment The company’s processes need to be re-aligned with the
capabilities of virtual teams, unlike face-to-face teams.
This involves an understanding of virtual team processes and existing processes (Bal and Gundry, 1999). However, the key elements in knowledge sharing are hardware, software as well as the ability and willingness of team members to actively participate in the knowledge sharing process (Rosen et al., 2007). Meeting structure Proximity enables team members to engage in informal work (Furst et al., 2004). Virtual team members are more likely to treat one another formally, and are less likely to reciprocate requests from one another (Wong and Burton, 2000). Shin (2005) argued that lack of physical interactions and informal relationships decrease the cohesiveness of virtual teams. Formal practices and routines designed to structure tasks formally were reported to lead to higher quality output of virtual teams (Massey et al., 2003). The physical absence of a formal leader exacerbates the lack of extrinsic motivation (Kayworth and Leidner, 2002). For virtual teams which rarely meet face-to-face, team leaders often have no choice but to impose a formal team structure. Synchronous written documents assist virtual teams to overcome challenges associated with spoken language, and this enables teams to overcome challenges associated with asynchronous and lean written communication (Shachaf, 2008). Performance measurement Kirkman and Rosen et al. (2004) studied the performance of virtual teams and showed a positive correlation between empowerment and virtual team performance. High-performance teams are differentiated by passionate dedication to goals, emotional bonding among team members and identification, and a balance between unity and respect for individual differences (Ale Ebrahim et al., 2009d). Team facilitation Team members must have crystal clear rules and responsibilities. The rule should be accountable and visible. Virtual team members may feel less accountable for results due to lack of visibility circumstances. Therefore, explicit facilitation of virtual teams is of extreme importance for teamwork. Temporal coordination mechanisms such as scheduling deadlines and coordinating the pace of effort are recommended to increase vigilance and accountability (Massey et al., 2003).
Ebrahim et al. 1975 NEW PRODUCT DEVELOPMENT AND VIRTUALITY Product development is defined by different researchers in slightly different ways, but generally it is the process that covers product design, production system design and product introduction processes and start of production (Johansen, 2005). New product development (NPD) has long been recognized as one of the corporate core functions (Huang et al., 2004). The rate of market and technological changes has accelerated in the past years and this turbulent environment needs new methods to bring successful new products to the marketplace (González and Palacios, 2002). This is particularly true for companies with short product life cycles, whereby it is important to develop new products and new product platforms quickly and safely, which fulfill reasonable demands on quality, performance and cost (Ottosson, 2004). The world market requires short product development times (Starbek and Grum, 2002). Therefore, in order to successfully and efficiently obtain all the experience needed for developing new products and services, more and more organizations are forced to move from traditional face-to-face teams to virtual teams or adopt a combination between the two types of teams (Precup et al., 2006). Given the complexities involved in organizing face-to-face interactions among team members and the advancements in electronic communication technologies, firms are turning toward employing virtual NPD teams (Badrinarayanan and Arnett, 2008; Jacobsa et al., 2005; Schmidt et al., 2001). New product development requires the collaboration of new product team members both within and outside the firm (Martinez-Sanchez et al., 2006; McDonough et al., 2001;Ozer, 2000). NPD teams are necessary in most businesses (Leenders et al., 2003). In addition, in the haste of global competition, companies faced increasing pressure to build critical mass, reach new markets and plug skill gaps. NPD efforts are increasingly being pursued across multiple nations through all forms of organizational arrangements (Cummings and Teng, 2003). Given the resulting differences in time zones and physical distances in such efforts, virtual NPD projects are receiving increasing attention (McDonough et al., 2001; Ale Ebrahim et al., 2010). The use of virtual teams for new product development is rapidly growing and in which organizations can rely on to sustain competitive advantage (Taifi, 2007). Hence, virtual teams provide valuable input for new product development (Ale Ebrahim et al., 2009c). PRIMARY MODELS AND HYPOTHESES In this study, a new primary model is adapted from Bal and Gundry (2001b, 1999), with respect to the requirements of the company in determining the
1976 Sci. Res. Essays
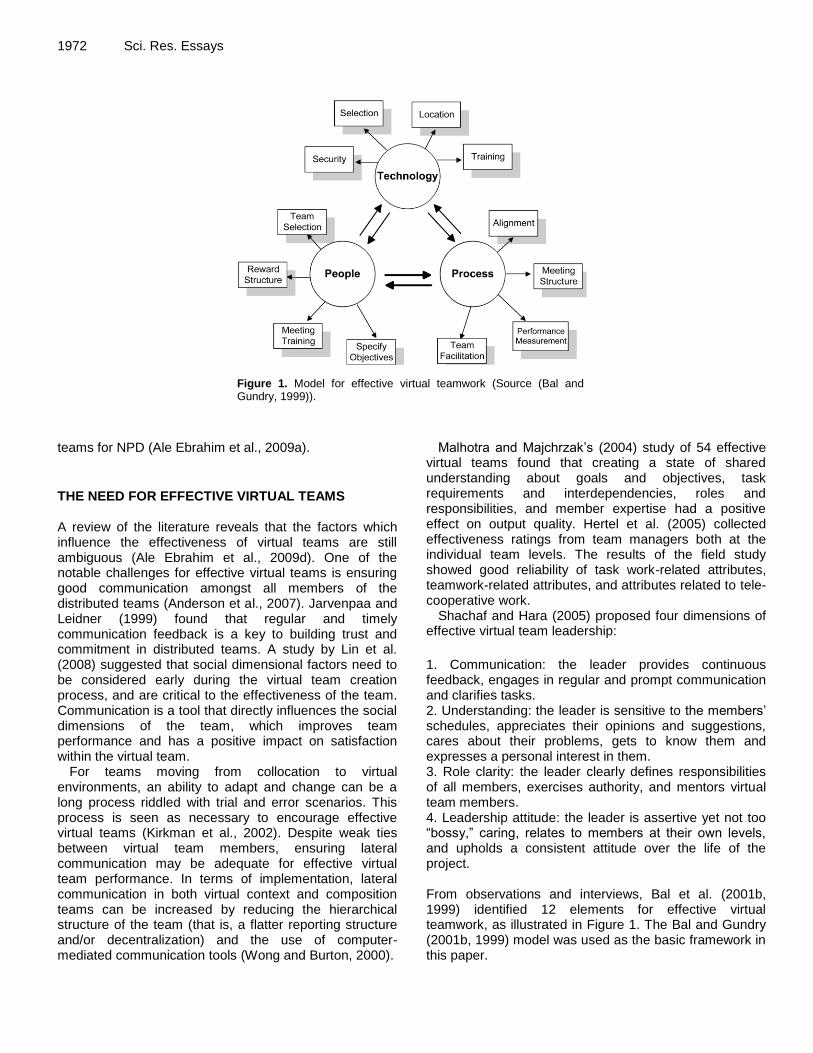
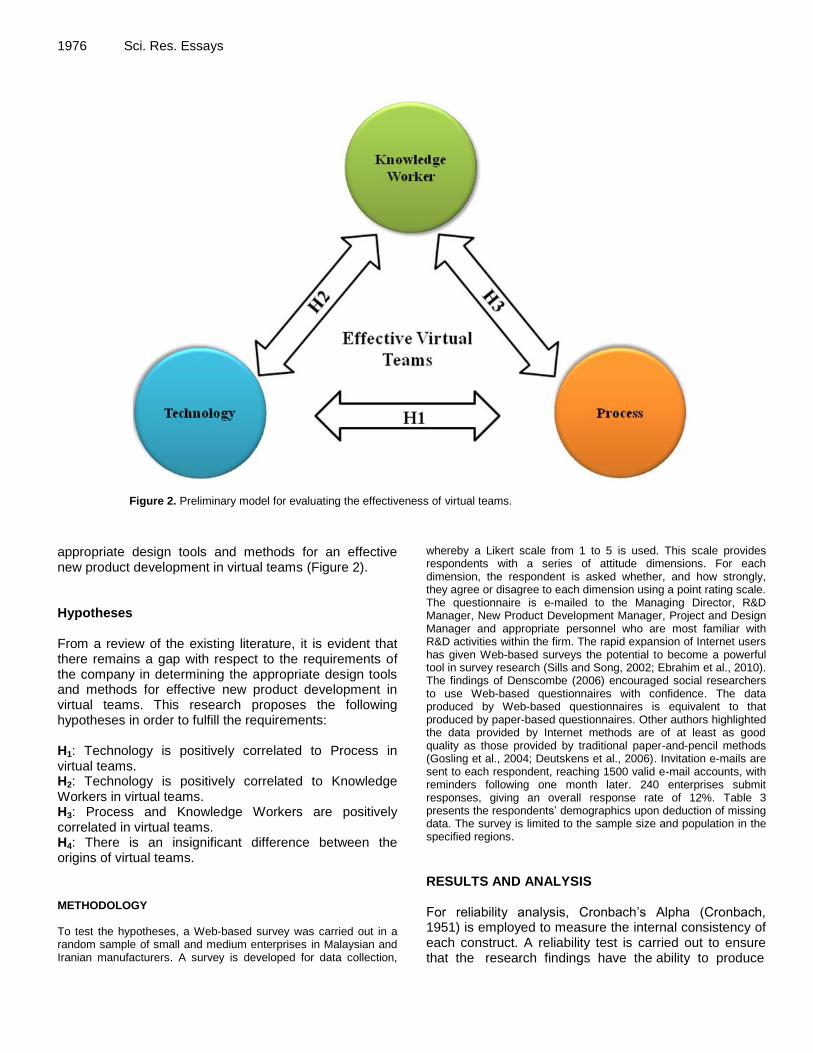
Figure 2. Preliminary model for evaluating the effectiveness of virtual teams.
appropriate design tools and methods for an effective new product development in virtual teams (Figure 2). Hypotheses From a review of the existing literature, it is evident that there remains a gap with respect to the requirements of the company in determining the appropriate design tools and methods for effective new product development in virtual teams. This research proposes the following hypotheses in order to fulfill the requirements: H1: Technology is positively correlated to Process in virtual teams. H2: Technology is positively correlated to Knowledge Workers in virtual teams. H3: Process and Knowledge Workers are positively correlated in virtual teams. H4: There is an insignificant difference between the origins of virtual teams.
METHODOLOGY To test the hypotheses, a Web-based survey was carried out in a random sample of small and medium enterprises in Malaysian and Iranian manufacturers. A survey is developed for data collection,
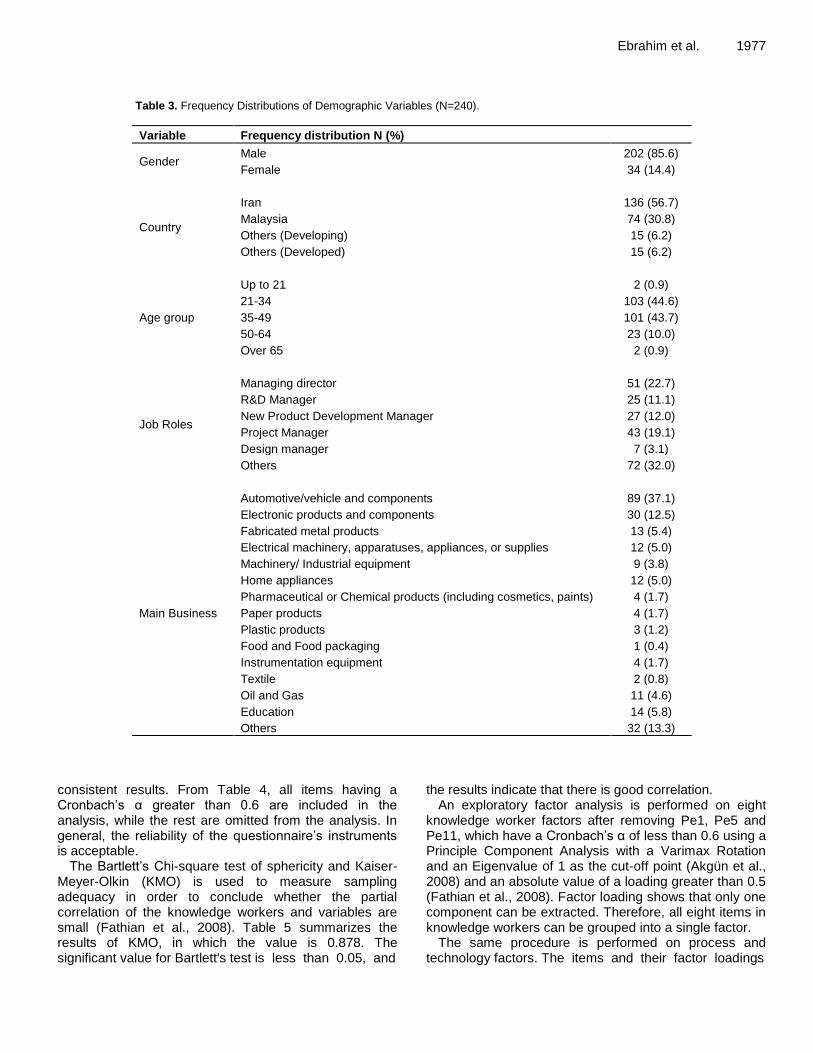
whereby a Likert scale from 1 to 5 is used. This scale provides respondents with a series of attitude dimensions. For each dimension, the respondent is asked whether, and how strongly, they agree or disagree to each dimension using a point rating scale. The questionnaire is e-mailed to the Managing Director, R&D Manager, New Product Development Manager, Project and Design Manager and appropriate personnel who are most familiar with R&D activities within the firm. The rapid expansion of Internet users has given Web-based surveys the potential to become a powerful tool in survey research (Sills and Song, 2002; Ebrahim et al., 2010). The findings of Denscombe (2006) encouraged social researchers to use Web-based questionnaires with confidence. The data produced by Web-based questionnaires is equivalent to that produced by paper-based questionnaires. Other authors highlighted the data provided by Internet methods are of at least as good quality as those provided by traditional paper-and-pencil methods (Gosling et al., 2004; Deutskens et al., 2006). Invitation e-mails are sent to each respondent, reaching 1500 valid e-mail accounts, with reminders following one month later. 240 enterprises submit responses, giving an overall response rate of 12%. Table 3 presents the respondents’ demographics upon deduction of missing data. The survey is limited to the sample size and population in the specified regions. RESULTS AND ANALYSIS For reliability analysis, Cronbach’s Alpha (Cronbach, 1951) is employed to measure the internal consistency of each construct. A reliability test is carried out to ensure that the research findings have the ability to produce
Ebrahim et al. 1977
Table 3. Frequency Distributions of Demographic Variables (N=240).
Variable Frequency distribution N (%)
Gender Male 202 (85.6)
Female 34 (14.4)
Country
Iran 136 (56.7)
Malaysia 74 (30.8)
Others (Developing) 15 (6.2)
Others (Developed) 15 (6.2)
Age group
Up to 21 2 (0.9)
21-34 103 (44.6)
35-49 101 (43.7)
50-64 23 (10.0)
Over 65 2 (0.9)
Job Roles
Managing director 51 (22.7)
R&D Manager 25 (11.1)
New Product Development Manager 27 (12.0)
Project Manager 43 (19.1)
Design manager 7 (3.1)
Others 72 (32.0)
Main Business
Automotive/vehicle and components 89 (37.1)
Electronic products and components 30 (12.5)
Fabricated metal products 13 (5.4)
Electrical machinery, apparatuses, appliances, or supplies 12 (5.0)
Machinery/ Industrial equipment 9 (3.8)
Home appliances 12 (5.0)
Pharmaceutical or Chemical products (including cosmetics, paints) 4 (1.7)
Paper products 4 (1.7)
Plastic products 3 (1.2)
Food and Food packaging 1 (0.4)
Instrumentation equipment 4 (1.7)
Textile 2 (0.8)
Oil and Gas 11 (4.6)
Education 14 (5.8)
Others 32 (13.3)
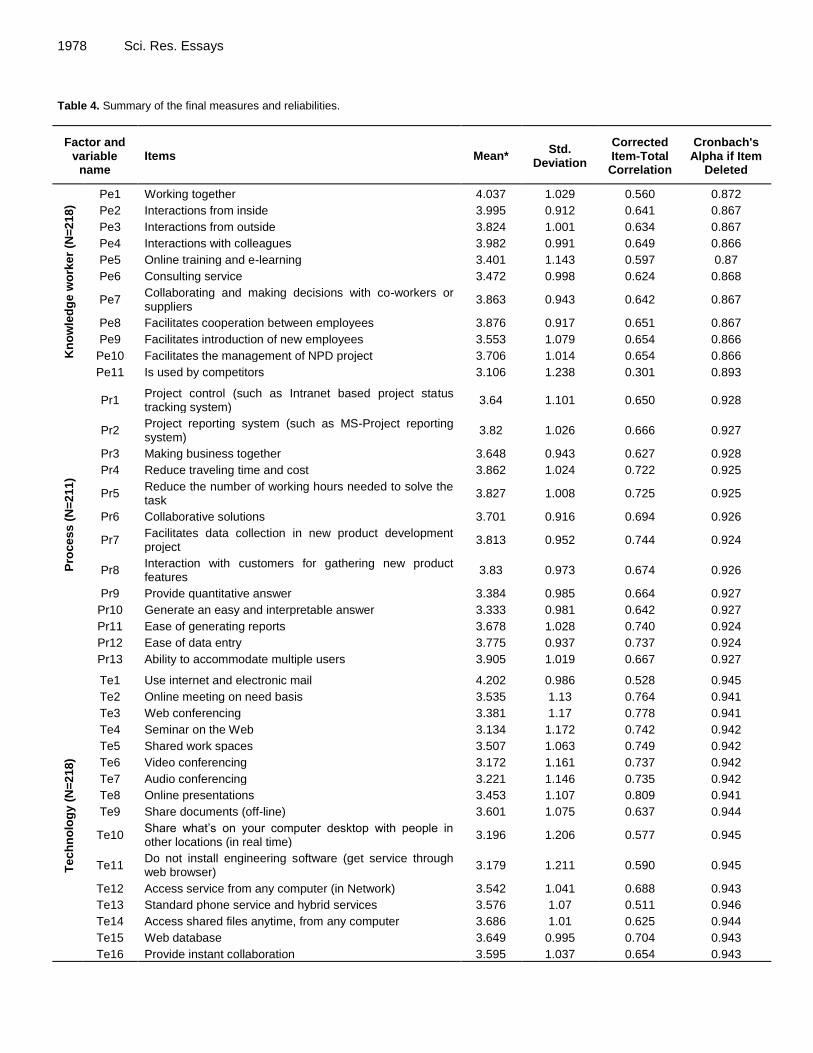
consistent results. From Table 4, all items having a Cronbach’s α greater than 0.6 are included in the analysis, while the rest are omitted from the analysis. In general, the reliability of the questionnaire’s instruments is acceptable.
The Bartlett’s Chi-square test of sphericity and Kaiser- Meyer-Olkin (KMO) is used to measure sampling adequacy in order to conclude whether the partial correlation of the knowledge workers and variables are small (Fathian et al., 2008). Table 5 summarizes the results of KMO, in which the value is 0.878. The significant value for Bartlett's test is less than 0.05, and
the results indicate that there is good correlation. An exploratory factor analysis is performed on eight
knowledge worker factors after removing Pe1, Pe5 and Pe11, which have a Cronbach’s α of less than 0.6 using a Principle Component Analysis with a Varimax Rotation and an Eigenvalue of 1 as the cut-off point (Akgün et al., 2008) and an absolute value of a loading greater than 0.5 (Fathian et al., 2008). Factor loading shows that only one component can be extracted. Therefore, all eight items in knowledge workers can be grouped into a single factor.
The same procedure is performed on process and technology factors. The items and their factor loadings
1978 Sci. Res. Essays Table 4. Summary of the final measures and reliabilities.
Factor and variable
name Items Mean*
Std. Deviation
Corrected Item-Total
Correlation
Cronbach's Alpha if Item
Deleted
Kn
ow
led
ge
wo
rke
r (N
=2
18
)
Pe1 Working together 4.037 1.029 0.560 0.872
Pe2 Interactions from inside 3.995 0.912 0.641 0.867
Pe3 Interactions from outside 3.824 1.001 0.634 0.867
Pe4 Interactions with colleagues 3.982 0.991 0.649 0.866
Pe5 Online training and e-learning 3.401 1.143 0.597 0.87
Pe6 Consulting service 3.472 0.998 0.624 0.868
Pe7 Collaborating and making decisions with co-workers or suppliers
3.863 0.943 0.642 0.867
Pe8 Facilitates cooperation between employees 3.876 0.917 0.651 0.867
Pe9 Facilitates introduction of new employees 3.553 1.079 0.654 0.866
Pe10 Facilitates the management of NPD project 3.706 1.014 0.654 0.866
Pe11 Is used by competitors 3.106 1.238 0.301 0.893
Pro
ce
ss
(N
=2
11
)
Pr1 Project control (such as Intranet based project status tracking system)
3.64 1.101 0.650 0.928
Pr2 Project reporting system (such as MS-Project reporting system)
3.82 1.026 0.666 0.927
Pr3 Making business together 3.648 0.943 0.627 0.928
Pr4 Reduce traveling time and cost 3.862 1.024 0.722 0.925
Pr5 Reduce the number of working hours needed to solve the task
3.827 1.008 0.725 0.925
Pr6 Collaborative solutions 3.701 0.916 0.694 0.926
Pr7 Facilitates data collection in new product development project
3.813 0.952 0.744 0.924
Pr8 Interaction with customers for gathering new product features
3.83 0.973 0.674 0.926
Pr9 Provide quantitative answer 3.384 0.985 0.664 0.927
Pr10 Generate an easy and interpretable answer 3.333 0.981 0.642 0.927
Pr11 Ease of generating reports 3.678 1.028 0.740 0.924
Pr12 Ease of data entry 3.775 0.937 0.737 0.924
Pr13 Ability to accommodate multiple users 3.905 1.019 0.667 0.927
Te
ch
no
log
y (
N=
21
8)
Te1 Use internet and electronic mail 4.202 0.986 0.528 0.945
Te2 Online meeting on need basis 3.535 1.13 0.764 0.941
Te3 Web conferencing 3.381 1.17 0.778 0.941
Te4 Seminar on the Web 3.134 1.172 0.742 0.942
Te5 Shared work spaces 3.507 1.063 0.749 0.942
Te6 Video conferencing 3.172 1.161 0.737 0.942
Te7 Audio conferencing 3.221 1.146 0.735 0.942
Te8 Online presentations 3.453 1.107 0.809 0.941
Te9 Share documents (off-line) 3.601 1.075 0.637 0.944
Te10 Share what’s on your computer desktop with people in other locations (in real time)
3.196 1.206 0.577 0.945
Te11 Do not install engineering software (get service through web browser)
3.179 1.211 0.590 0.945
Te12 Access service from any computer (in Network) 3.542 1.041 0.688 0.943
Te13 Standard phone service and hybrid services 3.576 1.07 0.511 0.946
Te14 Access shared files anytime, from any computer 3.686 1.01 0.625 0.944
Te15 Web database 3.649 0.995 0.704 0.943
Te16 Provide instant collaboration 3.595 1.037 0.654 0.943
Ebrahim et al. 1979 Table 4. Contd.
Te17 Software as a service (eliminating the need to install and run the application on the own computer)
3.531 1.07 0.666 0.943
Te18 Virtual research center for product development 3.455 1.078 0.681 0.943
Te19 Can be integrated/compatible with the other tools and systems
3.688 1.139 0.613 0.944
*Frequency values - 1: Not important; 2: Slightly important; 3: Important; 4: Quite important; 5: Extremely important.
Table 5. KMO and Bartlett’s Test results.
Kaiser-Meyer-Olkin Measure of Sampling Adequacy. 0. 878
Bartlett's Test of Sphericity
Approx. Chi-Square 679.744
df 28
Sig. 0.000
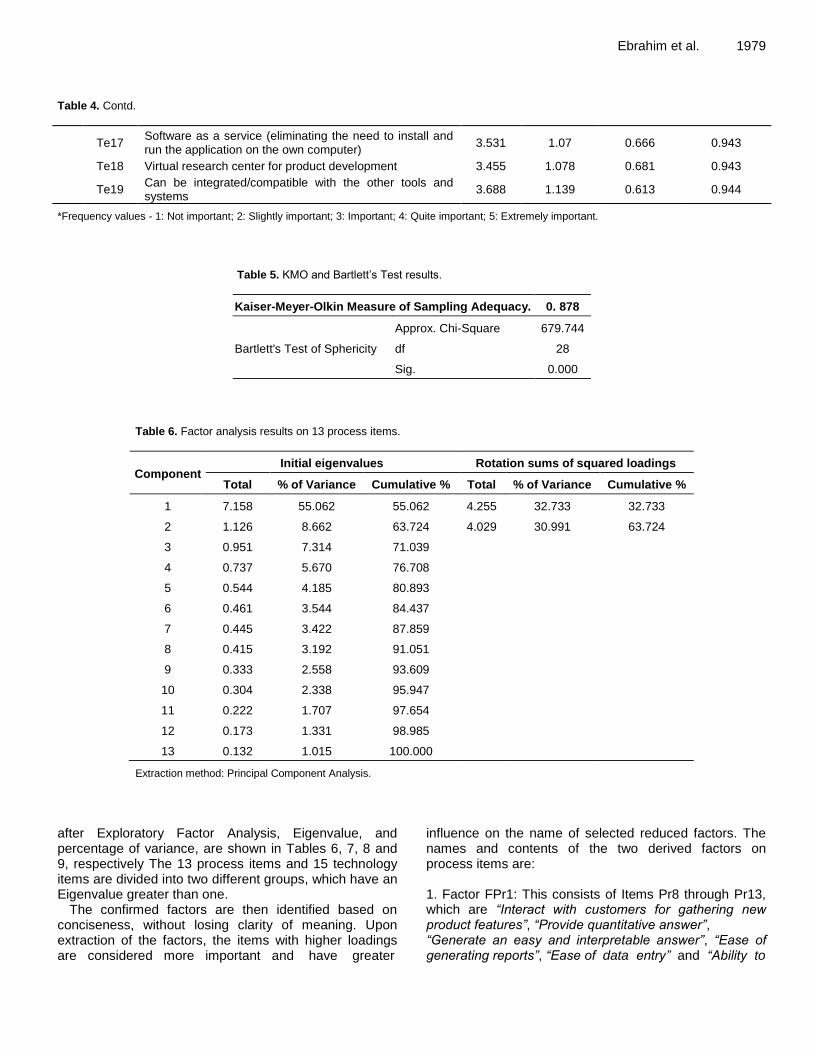
Table 6. Factor analysis results on 13 process items.
Component Initial eigenvalues Rotation sums of squared loadings
Total % of Variance Cumulative % Total % of Variance Cumulative %
1 7.158 55.062 55.062 4.255 32.733 32.733
2 1.126 8.662 63.724 4.029 30.991 63.724
3 0.951 7.314 71.039
4 0.737 5.670 76.708
5 0.544 4.185 80.893
6 0.461 3.544 84.437
7 0.445 3.422 87.859
8 0.415 3.192 91.051
9 0.333 2.558 93.609
10 0.304 2.338 95.947
11 0.222 1.707 97.654
12 0.173 1.331 98.985
13 0.132 1.015 100.000
Extraction method: Principal Component Analysis.
after Exploratory Factor Analysis, Eigenvalue, and percentage of variance, are shown in Tables 6, 7, 8 and 9, respectively The 13 process items and 15 technology items are divided into two different groups, which have an Eigenvalue greater than one.
The confirmed factors are then identified based on conciseness, without losing clarity of meaning. Upon extraction of the factors, the items with higher loadings are considered more important and have greater
influence on the name of selected reduced factors. The names and contents of the two derived factors on process items are: 1. Factor FPr1: This consists of Items Pr8 through Pr13, which are “Interact with customers for gathering new product features”, “Provide quantitative answer”, “Generate an easy and interpretable answer”, “Ease of generating reports”, “Ease of data entry” and “Ability to
1980 Sci. Res. Essays
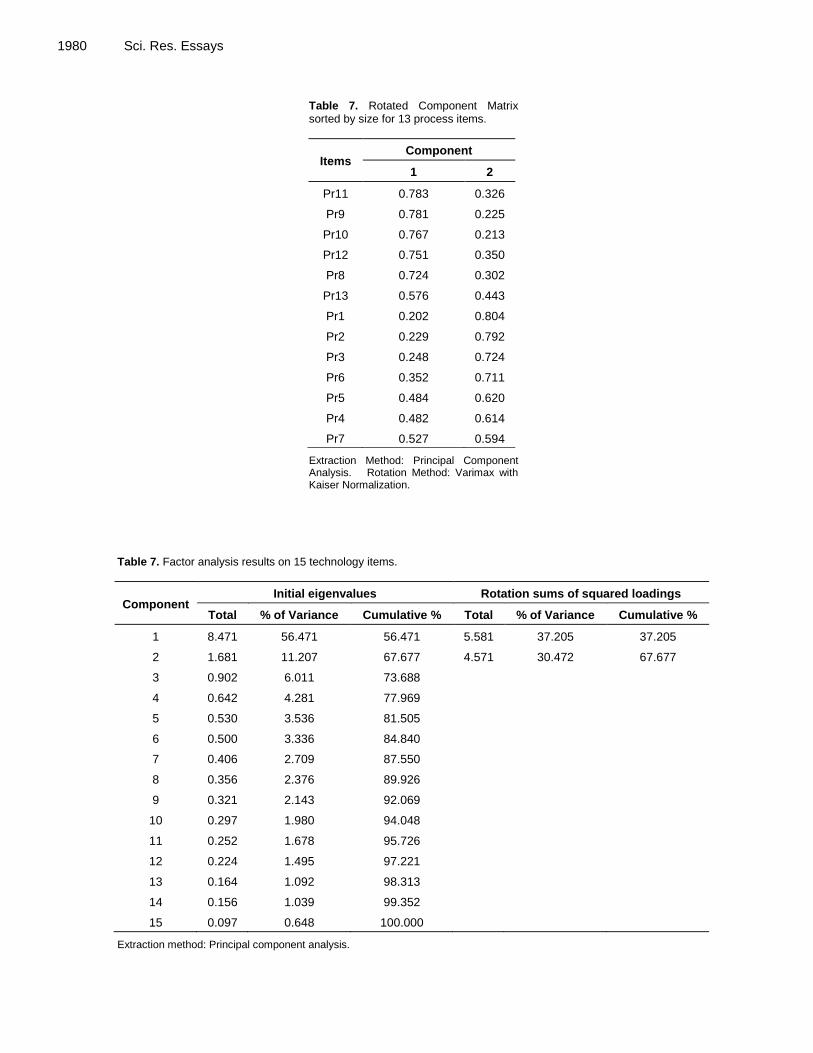
Table 7. Rotated Component Matrix sorted by size for 13 process items.
Items Component
1 2
Pr11 0.783 0.326
Pr9 0.781 0.225
Pr10 0.767 0.213
Pr12 0.751 0.350
Pr8 0.724 0.302
Pr13 0.576 0.443
Pr1 0.202 0.804
Pr2 0.229 0.792
Pr3 0.248 0.724
Pr6 0.352 0.711
Pr5 0.484 0.620
Pr4 0.482 0.614
Pr7 0.527 0.594
Extraction Method: Principal Component Analysis. Rotation Method: Varimax with Kaiser Normalization.
Table 7. Factor analysis results on 15 technology items.
Component Initial eigenvalues Rotation sums of squared loadings
Total % of Variance Cumulative % Total % of Variance Cumulative %
1 8.471 56.471 56.471 5.581 37.205 37.205
2 1.681 11.207 67.677 4.571 30.472 67.677
3 0.902 6.011 73.688
4 0.642 4.281 77.969
5 0.530 3.536 81.505
6 0.500 3.336 84.840
7 0.406 2.709 87.550
8 0.356 2.376 89.926
9 0.321 2.143 92.069
10 0.297 1.980 94.048
11 0.252 1.678 95.726
12 0.224 1.495 97.221
13 0.164 1.092 98.313
14 0.156 1.039 99.352
15 0.097 0.648 100.000
Extraction method: Principal component analysis.
Ebrahim et al. 1981
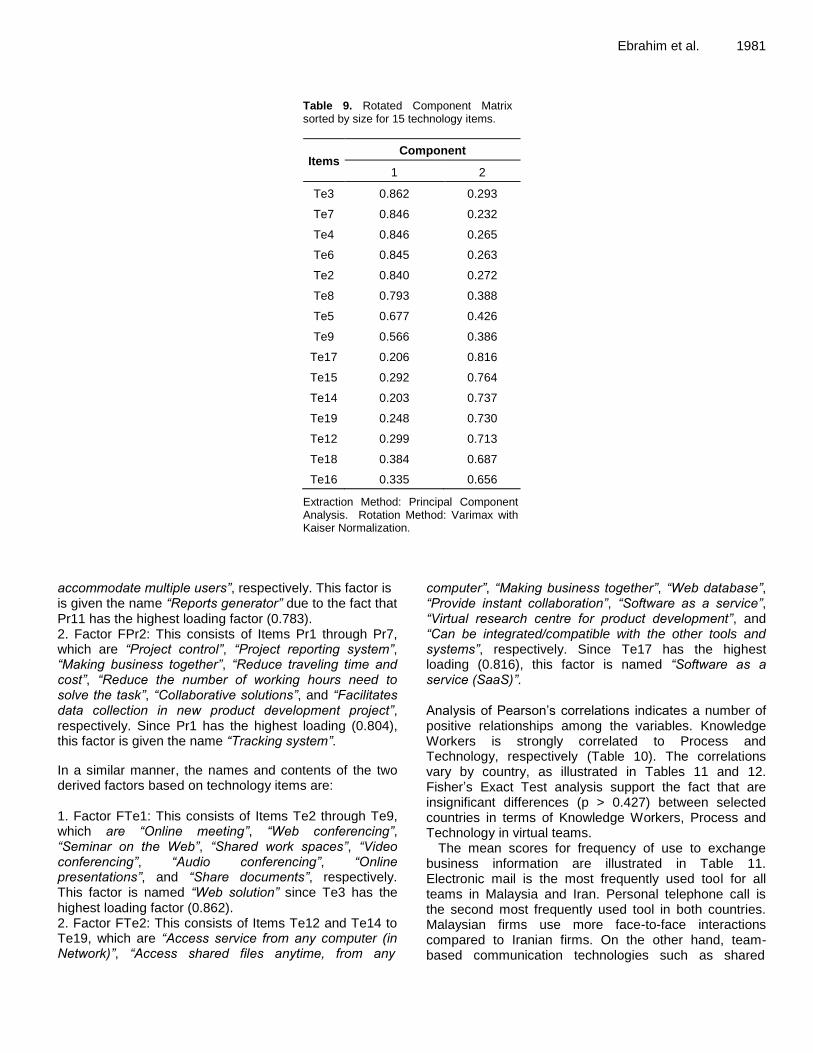
Table 9. Rotated Component Matrix sorted by size for 15 technology items.
Items Component
1 2
Te3 0.862 0.293
Te7 0.846 0.232
Te4 0.846 0.265
Te6 0.845 0.263
Te2 0.840 0.272
Te8 0.793 0.388
Te5 0.677 0.426
Te9 0.566 0.386
Te17 0.206 0.816
Te15 0.292 0.764
Te14 0.203 0.737
Te19 0.248 0.730
Te12 0.299 0.713
Te18 0.384 0.687
Te16 0.335 0.656
Extraction Method: Principal Component Analysis. Rotation Method: Varimax with Kaiser Normalization.
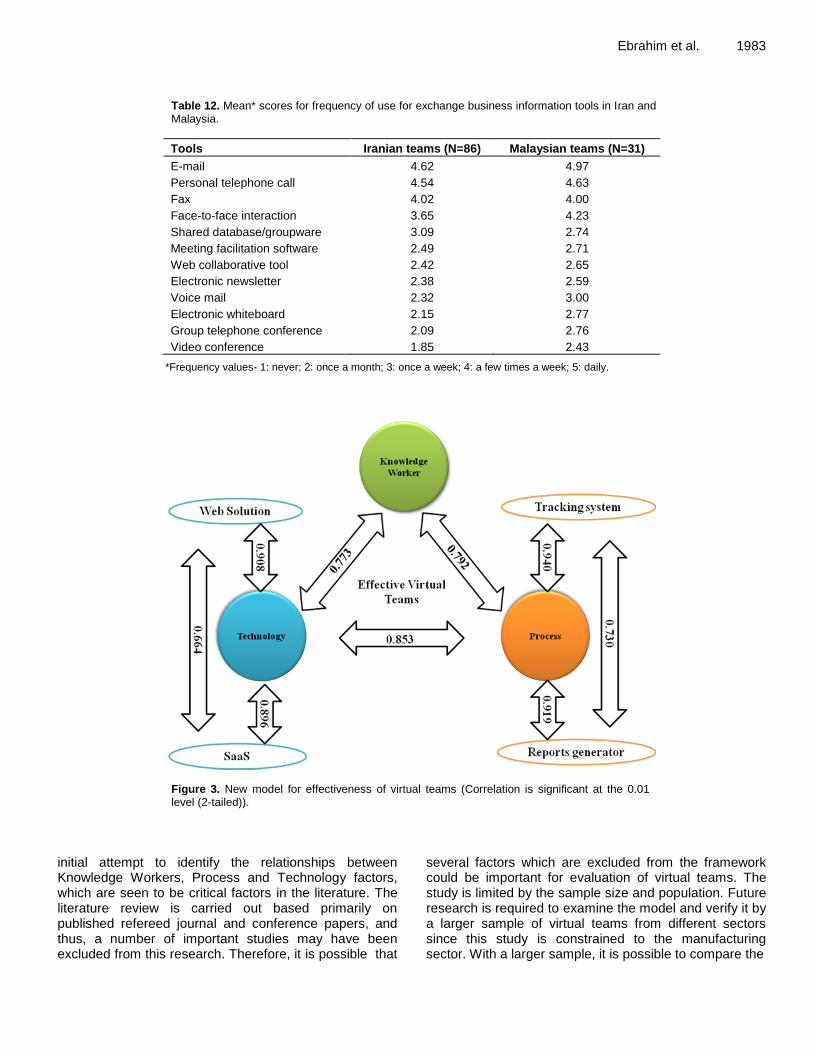
accommodate multiple users”, respectively. This factor is is given the name “Reports generator” due to the fact that Pr11 has the highest loading factor (0.783). 2. Factor FPr2: This consists of Items Pr1 through Pr7, which are “Project control”, “Project reporting system”, “Making business together”, “Reduce traveling time and cost”, “Reduce the number of working hours need to solve the task”, “Collaborative solutions”, and “Facilitates data collection in new product development project”, respectively. Since Pr1 has the highest loading (0.804), this factor is given the name “Tracking system”.
In a similar manner, the names and contents of the two derived factors based on technology items are: 1. Factor FTe1: This consists of Items Te2 through Te9, which are “Online meeting”, “Web conferencing”, “Seminar on the Web”, “Shared work spaces”, “Video conferencing”, “Audio conferencing”, “Online presentations”, and “Share documents”, respectively. This factor is named “Web solution” since Te3 has the highest loading factor (0.862). 2. Factor FTe2: This consists of Items Te12 and Te14 to Te19, which are “Access service from any computer (in Network)”, “Access shared files anytime, from any
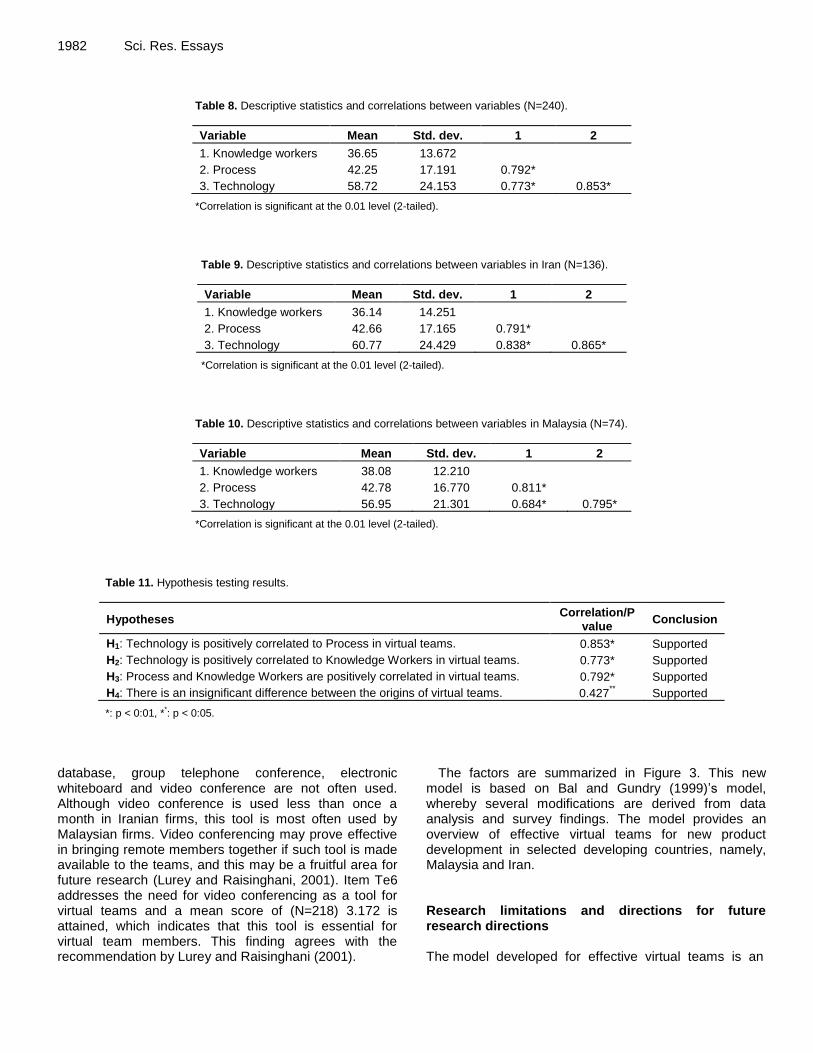
computer”, “Making business together”, “Web database”, “Provide instant collaboration”, “Software as a service”, “Virtual research centre for product development”, and “Can be integrated/compatible with the other tools and systems”, respectively. Since Te17 has the highest loading (0.816), this factor is named “Software as a service (SaaS)”. Analysis of Pearson’s correlations indicates a number of positive relationships among the variables. Knowledge Workers is strongly correlated to Process and Technology, respectively (Table 10). The correlations vary by country, as illustrated in Tables 11 and 12. Fisher’s Exact Test analysis support the fact that are insignificant differences (p > 0.427) between selected countries in terms of Knowledge Workers, Process and Technology in virtual teams.
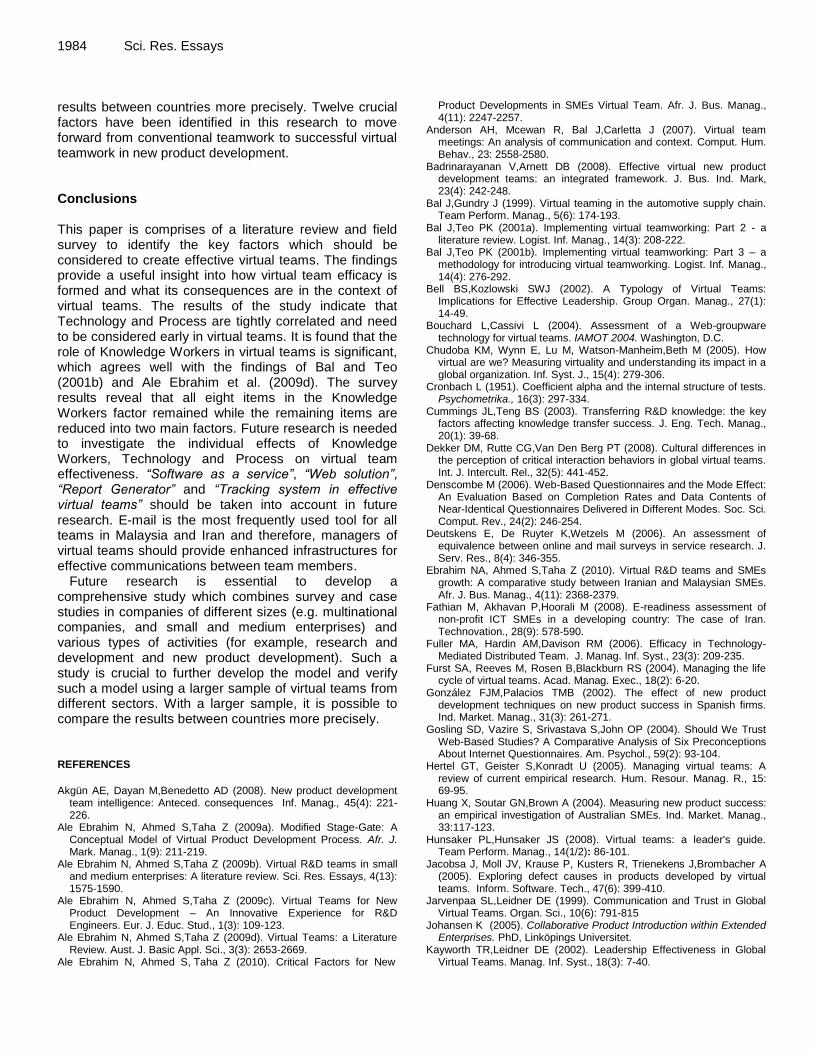
The mean scores for frequency of use to exchange business information are illustrated in Table 11. Electronic mail is the most frequently used tool for all teams in Malaysia and Iran. Personal telephone call is the second most frequently used tool in both countries. Malaysian firms use more face-to-face interactions compared to Iranian firms. On the other hand, team-based communication technologies such as shared
1982 Sci. Res. Essays
Table 8. Descriptive statistics and correlations between variables (N=240).
Variable Mean Std. dev. 1 2
1. Knowledge workers 36.65 13.672
2. Process 42.25 17.191 0.792*
3. Technology 58.72 24.153 0.773* 0.853*
*Correlation is significant at the 0.01 level (2-tailed).
Table 9. Descriptive statistics and correlations between variables in Iran (N=136).
Variable Mean Std. dev. 1 2
1. Knowledge workers 36.14 14.251
2. Process 42.66 17.165 0.791*
3. Technology 60.77 24.429 0.838* 0.865*
*Correlation is significant at the 0.01 level (2-tailed).
Table 10. Descriptive statistics and correlations between variables in Malaysia (N=74).
Variable Mean Std. dev. 1 2
1. Knowledge workers 38.08 12.210
2. Process 42.78 16.770 0.811*
3. Technology 56.95 21.301 0.684* 0.795*
*Correlation is significant at the 0.01 level (2-tailed).
Table 11. Hypothesis testing results.
Hypotheses Correlation/P
value Conclusion
H1: Technology is positively correlated to Process in virtual teams. 0.853* Supported
H2: Technology is positively correlated to Knowledge Workers in virtual teams. 0.773* Supported
H3: Process and Knowledge Workers are positively correlated in virtual teams. 0.792* Supported
H4: There is an insignificant difference between the origins of virtual teams. 0.427**
Supported
*: p < 0:01, **: p < 0:05.
database, group telephone conference, electronic whiteboard and video conference are not often used. Although video conference is used less than once a month in Iranian firms, this tool is most often used by Malaysian firms. Video conferencing may prove effective in bringing remote members together if such tool is made available to the teams, and this may be a fruitful area for future research (Lurey and Raisinghani, 2001). Item Te6 addresses the need for video conferencing as a tool for virtual teams and a mean score of (N=218) 3.172 is attained, which indicates that this tool is essential for virtual team members. This finding agrees with the recommendation by Lurey and Raisinghani (2001).
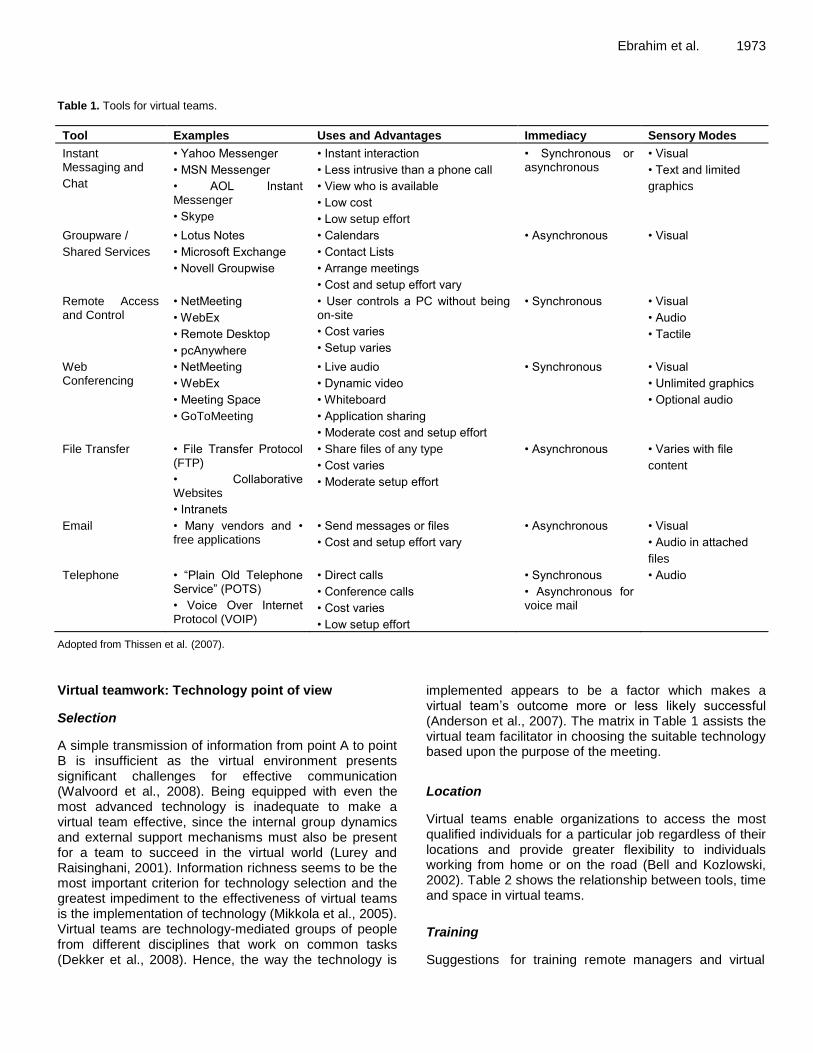
The factors are summarized in Figure 3. This new model is based on Bal and Gundry (1999)’s model, whereby several modifications are derived from data analysis and survey findings. The model provides an overview of effective virtual teams for new product development in selected developing countries, namely, Malaysia and Iran. Research limitations and directions for future research directions The model developed for effective virtual teams is an
Ebrahim et al. 1983
Table 12. Mean* scores for frequency of use for exchange business information tools in Iran and Malaysia.
Tools Iranian teams (N=86) Malaysian teams (N=31)
E-mail 4.62 4.97
Personal telephone call 4.54 4.63
Fax 4.02 4.00
Face-to-face interaction 3.65 4.23
Shared database/groupware 3.09 2.74
Meeting facilitation software 2.49 2.71
Web collaborative tool 2.42 2.65
Electronic newsletter 2.38 2.59
Voice mail 2.32 3.00
Electronic whiteboard 2.15 2.77
Group telephone conference 2.09 2.76
Video conference 1.85 2.43
*Frequency values- 1: never; 2: once a month; 3: once a week; 4: a few times a week; 5: daily.
Figure 3. New model for effectiveness of virtual teams (Correlation is significant at the 0.01 level (2-tailed)).
initial attempt to identify the relationships between Knowledge Workers, Process and Technology factors, which are seen to be critical factors in the literature. The literature review is carried out based primarily on published refereed journal and conference papers, and thus, a number of important studies may have been excluded from this research. Therefore, it is possible that
several factors which are excluded from the framework could be important for evaluation of virtual teams. The study is limited by the sample size and population. Future research is required to examine the model and verify it by a larger sample of virtual teams from different sectors since this study is constrained to the manufacturing sector. With a larger sample, it is possible to compare the
1984 Sci. Res. Essays results between countries more precisely. Twelve crucial factors have been identified in this research to move forward from conventional teamwork to successful virtual teamwork in new product development. Conclusions This paper is comprises of a literature review and field survey to identify the key factors which should be considered to create effective virtual teams. The findings provide a useful insight into how virtual team efficacy is formed and what its consequences are in the context of virtual teams. The results of the study indicate that Technology and Process are tightly correlated and need to be considered early in virtual teams. It is found that the role of Knowledge Workers in virtual teams is significant, which agrees well with the findings of Bal and Teo (2001b) and Ale Ebrahim et al. (2009d). The survey results reveal that all eight items in the Knowledge Workers factor remained while the remaining items are reduced into two main factors. Future research is needed to investigate the individual effects of Knowledge Workers, Technology and Process on virtual team effectiveness. “Software as a service”, “Web solution”, “Report Generator” and “Tracking system in effective virtual teams” should be taken into account in future research. E-mail is the most frequently used tool for all teams in Malaysia and Iran and therefore, managers of virtual teams should provide enhanced infrastructures for effective communications between team members.
Future research is essential to develop a comprehensive study which combines survey and case studies in companies of different sizes (e.g. multinational companies, and small and medium enterprises) and various types of activities (for example, research and development and new product development). Such a study is crucial to further develop the model and verify such a model using a larger sample of virtual teams from different sectors. With a larger sample, it is possible to compare the results between countries more precisely.
REFERENCES
Akgün AE, Dayan M,Benedetto AD (2008). New product development
team intelligence: Anteced. consequences Inf. Manag., 45(4): 221-226.
Ale Ebrahim N, Ahmed S,Taha Z (2009a). Modified Stage-Gate: A Conceptual Model of Virtual Product Development Process. Afr. J. Mark. Manag., 1(9): 211-219.
Ale Ebrahim N, Ahmed S,Taha Z (2009b). Virtual R&D teams in small and medium enterprises: A literature review. Sci. Res. Essays, 4(13): 1575-1590.
Ale Ebrahim N, Ahmed S,Taha Z (2009c). Virtual Teams for New Product Development – An Innovative Experience for R&D Engineers. Eur. J. Educ. Stud., 1(3): 109-123.
Ale Ebrahim N, Ahmed S,Taha Z (2009d). Virtual Teams: a Literature Review. Aust. J. Basic Appl. Sci., 3(3): 2653-2669.
Ale Ebrahim N, Ahmed S, Taha Z (2010). Critical Factors for New
Product Developments in SMEs Virtual Team. Afr. J. Bus. Manag., 4(11): 2247-2257.
Anderson AH, Mcewan R, Bal J,Carletta J (2007). Virtual team meetings: An analysis of communication and context. Comput. Hum. Behav., 23: 2558-2580.
Badrinarayanan V,Arnett DB (2008). Effective virtual new product development teams: an integrated framework. J. Bus. Ind. Mark, 23(4): 242-248.
Bal J,Gundry J (1999). Virtual teaming in the automotive supply chain. Team Perform. Manag., 5(6): 174-193.
Bal J,Teo PK (2001a). Implementing virtual teamworking: Part 2 - a literature review. Logist. Inf. Manag., 14(3): 208-222.
Bal J,Teo PK (2001b). Implementing virtual teamworking: Part 3 – a methodology for introducing virtual teamworking. Logist. Inf. Manag., 14(4): 276-292.
Bell BS,Kozlowski SWJ (2002). A Typology of Virtual Teams: Implications for Effective Leadership. Group Organ. Manag., 27(1): 14-49.
Bouchard L,Cassivi L (2004). Assessment of a Web-groupware technology for virtual teams. IAMOT 2004. Washington, D.C.
Chudoba KM, Wynn E, Lu M, Watson-Manheim,Beth M (2005). How virtual are we? Measuring virtuality and understanding its impact in a global organization. Inf. Syst. J., 15(4): 279-306.
Cronbach L (1951). Coefficient alpha and the internal structure of tests. Psychometrika., 16(3): 297-334.
Cummings JL,Teng BS (2003). Transferring R&D knowledge: the key factors affecting knowledge transfer success. J. Eng. Tech. Manag., 20(1): 39-68.
Dekker DM, Rutte CG,Van Den Berg PT (2008). Cultural differences in the perception of critical interaction behaviors in global virtual teams. Int. J. Intercult. Rel., 32(5): 441-452.
Denscombe M (2006). Web-Based Questionnaires and the Mode Effect: An Evaluation Based on Completion Rates and Data Contents of Near-Identical Questionnaires Delivered in Different Modes. Soc. Sci. Comput. Rev., 24(2): 246-254.
Deutskens E, De Ruyter K,Wetzels M (2006). An assessment of equivalence between online and mail surveys in service research. J. Serv. Res., 8(4): 346-355.
Ebrahim NA, Ahmed S,Taha Z (2010). Virtual R&D teams and SMEs growth: A comparative study between Iranian and Malaysian SMEs. Afr. J. Bus. Manag., 4(11): 2368-2379.
Fathian M, Akhavan P,Hoorali M (2008). E-readiness assessment of non-profit ICT SMEs in a developing country: The case of Iran. Technovation., 28(9): 578-590.
Fuller MA, Hardin AM,Davison RM (2006). Efficacy in Technology-Mediated Distributed Team. J. Manag. Inf. Syst., 23(3): 209-235.
Furst SA, Reeves M, Rosen B,Blackburn RS (2004). Managing the life cycle of virtual teams. Acad. Manag. Exec., 18(2): 6-20.
González FJM,Palacios TMB (2002). The effect of new product development techniques on new product success in Spanish firms. Ind. Market. Manag., 31(3): 261-271.
Gosling SD, Vazire S, Srivastava S,John OP (2004). Should We Trust Web-Based Studies? A Comparative Analysis of Six Preconceptions About Internet Questionnaires. Am. Psychol., 59(2): 93-104.
Hertel GT, Geister S,Konradt U (2005). Managing virtual teams: A review of current empirical research. Hum. Resour. Manag. R., 15: 69-95.
Huang X, Soutar GN,Brown A (2004). Measuring new product success: an empirical investigation of Australian SMEs. Ind. Market. Manag., 33:117-123.
Hunsaker PL,Hunsaker JS (2008). Virtual teams: a leader's guide. Team Perform. Manag., 14(1/2): 86-101.
Jacobsa J, Moll JV, Krause P, Kusters R, Trienekens J,Brombacher A (2005). Exploring defect causes in products developed by virtual teams. Inform. Software. Tech., 47(6): 399-410.
Jarvenpaa SL,Leidner DE (1999). Communication and Trust in Global Virtual Teams. Organ. Sci., 10(6): 791-815
Johansen K (2005). Collaborative Product Introduction within Extended Enterprises. PhD, Linköpings Universitet.
Kayworth TR,Leidner DE (2002). Leadership Effectiveness in Global Virtual Teams. Manag. Inf. Syst., 18(3): 7-40.
Kirkman BL, Rosen B, Gibson CB, Tesluk PE,Mcpherson SO (2002).
Five challenges to virtual team success: lessons from Sabre Inc. Acad. Manag. Exec., 16(3): 67-79.
Kirkman BL, Rosen B, Tesluk PE,Gibson CB (2004). The Impact of Team Empowerment on Virtual Team Performance: the Moderating Role oF Face-To-Face Interaction. Acad. Manag. J., 47(2): 175-192.
Kratzer J, Leenders R,Engelen JV (2005). Keeping Virtual R&D Teams Creative. Res. Technol. Manag., 1:13-16.
Lam P-K, Chin K-S, Yang J-B,Liang W (2007). Self-assessment of conflict management in client-supplier collaborative new product development. Ind. Manag. Data Syst., 107(5): 688-714.
Leenders RTaJ, Engelen JMLV,Kratzer J (2003). Virtuality, communication, and new product team creativity: a social network perspective. J. Eng. Technol. Manage., 20: 69-92.
Lin C, Standing C,Liu Y-C (2008). A model to develop effective virtual teams. Decis. Support. Syst., 45(4): 1031-1045.
Lurey JS,Raisinghani MS (2001). An empirical study of best practices in virtual teams. Inf. Manag., 38(8): 523-544.
Malhotra A,Majchrzak A (2004). Enabling knowledge creation in far-flung teams: best practices for IT support and knowledge sharing. J. Knowl. Manag., 8(4): 75 - 88.
Martinez-Sanchez A, Pérez-Pérez M, De-Luis-Carnicer P,Vela-Jiménez MJ (2006). Teleworking and new product development. Eur. J. Innovat. Manag., 9(2): 202-214.
Massey AP, Montoya-Weiss MM,Yu-Ting H (2003). Because Time Matters: Temporal Coordination in Global Virtual Project Teams. J. Manag. Inf. Syst., 19(4): 129-155.
Mcdonough EF, Kahn KB,Barczak G (2001). An investigation of the use of global, virtual, and collocated new product development teams. J. Prod. Innovat. Manag., 18(2): 110-120.
Mikkola JH, Maclaran P,Wright S (2005). Book reviews. R&D. Manag., 35(1): 104-109.
Ottosson S (2004). Dynamic product development -- DPD. Technovation., 24(3): 207-217.
Ozer M (2000). Information Technology and New Product Development Opportunities and Pitfalls. Ind. Market. Manag., 29(5): 387-396.
Precup L, O'sullivan D, Cormican K,Dooley L (2006). Virtual team environment for collaborative research projects. Int. J. Innov. Learn., 3(1): 77 - 94
Rosen B, Furst S,Blackburn R (2007). Overcoming Barriers to Knowledge Sharing in Virtual Teams. Organ. Dyn., 36(3): 259-273.
Schmidt JB, Montoya-Weiss MM,Massey AP (2001). New product development decision-making effectiveness: Comparing individuals, face-to-face teams, and virtual teams. Decis. Sci., 32(4): 1-26.
Shachaf P (2008). Cultural diversity and information and communication technology impacts on global virtual teams: An exploratory study. Inf. Manag., 45(2): 131-142.
Ebrahim et al. 1985 Shachaf P,Hara N (2005). Team Effectiveness in Virtual Environments:
An Ecological Approach. In: FERRIS PAG, S., (ed.) Teaching and Learning with Virtual Teams. Idea Group Publishing.
Shin Y (2005). Conflict Resolution in Virtual Teams. Organ. Dyn., 34(4): 331-345.
Sills SJ,Song C (2002). Innovations in Survey Research: An Application of Web-Based Surveys. Soc. Sci. Comput. Rev., 20(1): 22-30.
Starbek M,Grum J (2002). Concurrent engineering in small companies. Int. J. Mach. Tool. Man., 42(3): 417-426.
Stock GN,Tatikonda MV (2004). External technology integration in product and process development. Int. J. Oper. Prod. Man., 24(7): 642-665.
Taifi N (2007). Organizational Collaborative Model of Small and Medium Enterprises in the Extended Enterprise Era: Lessons to Learn from a Large Automotive Company and its dealers’ Network. Proceedings of the 2nd PROLEARN Doctoral Consortium on Technology Enhanced Learning, in the 2nd European Conference on Technology Enhanced Learning. Crete, Greece: CEUR Workshop Proceedings.
Thissen MR, Jean MP, Madhavi CB,Toyia LA (2007). Communication tools for distributed software development teams. Proceedings of the 2007 ACM SIGMIS CPR conference on Computer personnel research: The global information technology workforce. St. Louis, Missouri, USA: ACM.
Walvoord AaG, Redden ER, Elliott LR,Coovert MD (2008). Empowering followers in virtual teams: Guiding principles from theory and practice. Comput. Hum. Behav., 24(5): 1884-1906.
Wong SS,Burton RM (2000). Virtual Teams: What are their Characteristics, and Impact on Team Performance? Comput. Math. Organ. Theor., 6(4): 339-360.