effective supervision: loan portfolio analysis microfinance management development workshop
TRANSCRIPT
Effective Supervision:Effective Supervision:
Loan Portfolio AnalysisLoan Portfolio Analysis
MICROFINANCE MANAGEMENT MICROFINANCE MANAGEMENT DEVELOPMENT WORKSHOPDEVELOPMENT WORKSHOP
Session ObjectivesSession ObjectivesBy the end of the session, the trainees are expected to:By the end of the session, the trainees are expected to:
• Read and analyze the portfolio-at-risk aging report
• Use portfolio analysis as a tool for middle managers to better monitor and manage the microfinance clients
• Apply skills in loan portfolio management
Rationale
Loan portfolio is the largest income-generating asset of the bank
Loan portfolio has inherent risks that should be minimized
It requires attention!
….. Through regular portfolio analysis
Why do portfolio analysis?
It is key to identifying, controlling and managing PAR
It helps in planning the work of supervisors and BMs with every AO
It helps in planning the work of the product manager with Branches
MIS: Essential Element in Portfolio Analysis
• A good MIS should be able to provide portfolio performance information on a daily basis.
• All portfolio information must be broken down by branch and AO.
• Reports must be updated, simple, easy to access, accurate and reliable.
• Portfolio performance reports must be easily accessible to all AOs, supervisors and BMs.
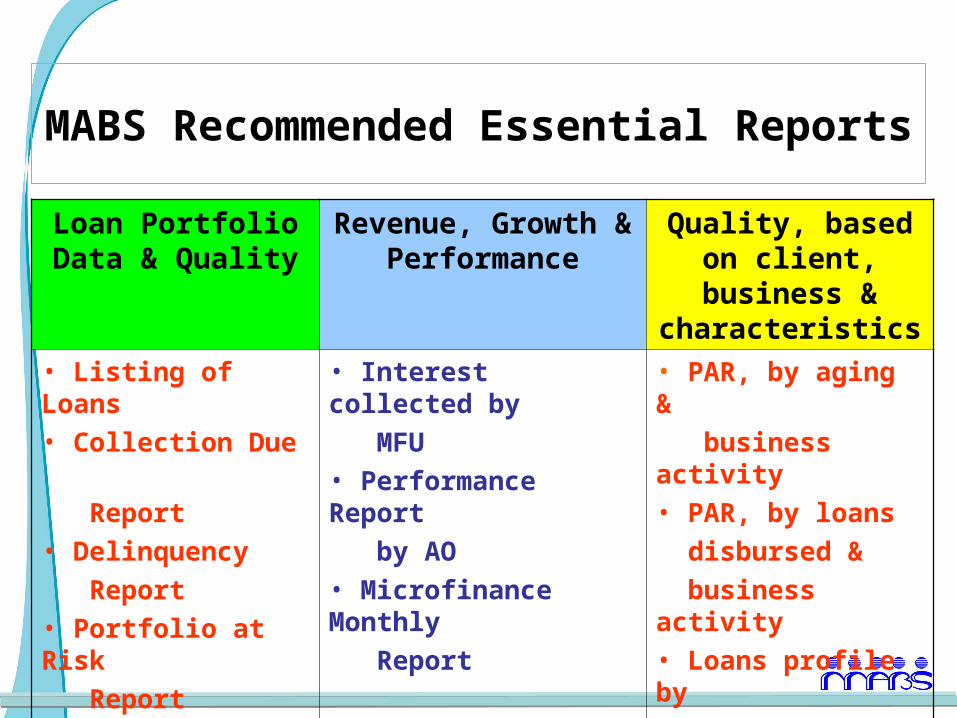
MABS Recommended Essential Reports
Loan Portfolio Data & Quality
Revenue, Growth & Performance
Quality, based on client, business &
characteristics• Listing of Loans• Collection Due Report• Delinquency Report• Portfolio at Risk Report• Client Status Report
• Interest collected by MFU• Performance Report by AO• Microfinance Monthly Report
• PAR, by aging & business activity• PAR, by loans disbursed & business activity• Loans profile by Gender
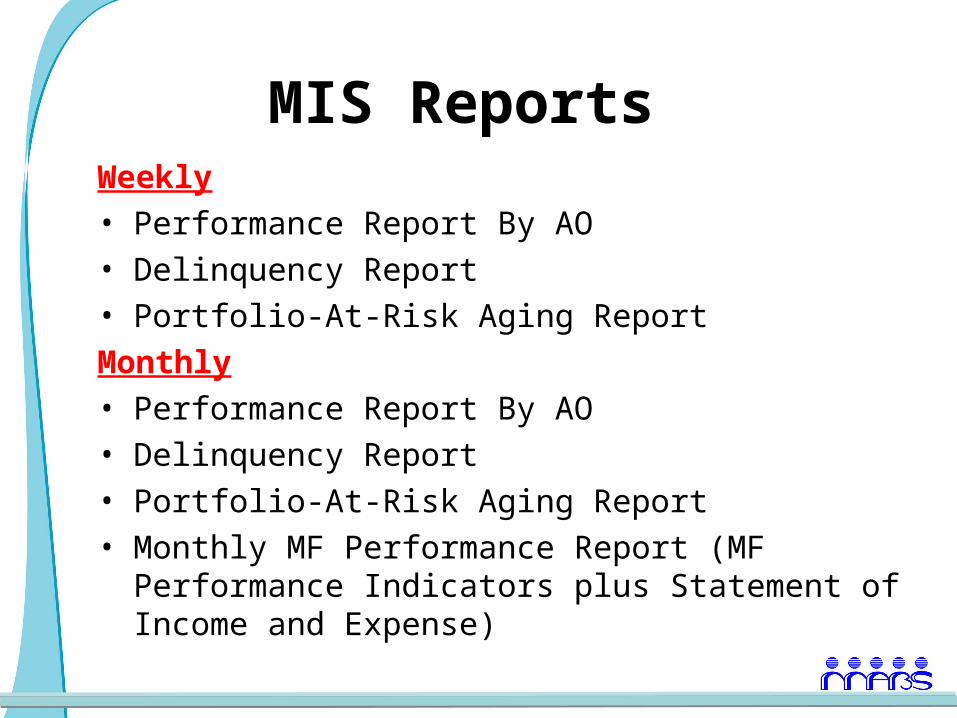
MIS Reports Weekly• Performance Report By AO• Delinquency Report• Portfolio-At-Risk Aging ReportMonthly• Performance Report By AO• Delinquency Report• Portfolio-At-Risk Aging Report• Monthly MF Performance Report (MF
Performance Indicators plus Statement of Income and Expense)
Definition of Terms
• Loans outstanding – refers to the balance of all loan releases that remain outstanding
• Loans disbursed – refers to the total loans released
• Arrears – refers to loan installments not paid
Definition of Terms
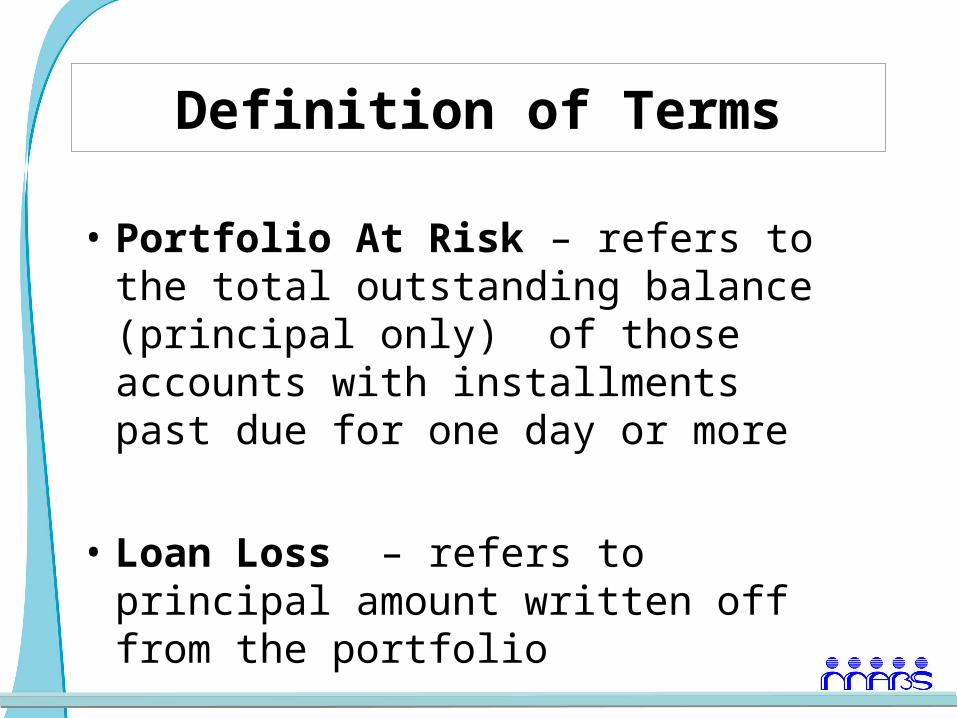
• Portfolio At Risk – refers to the total outstanding balance (principal only) of those accounts with installments past due for one day or more
• Loan Loss – refers to principal amount written off from the portfolio
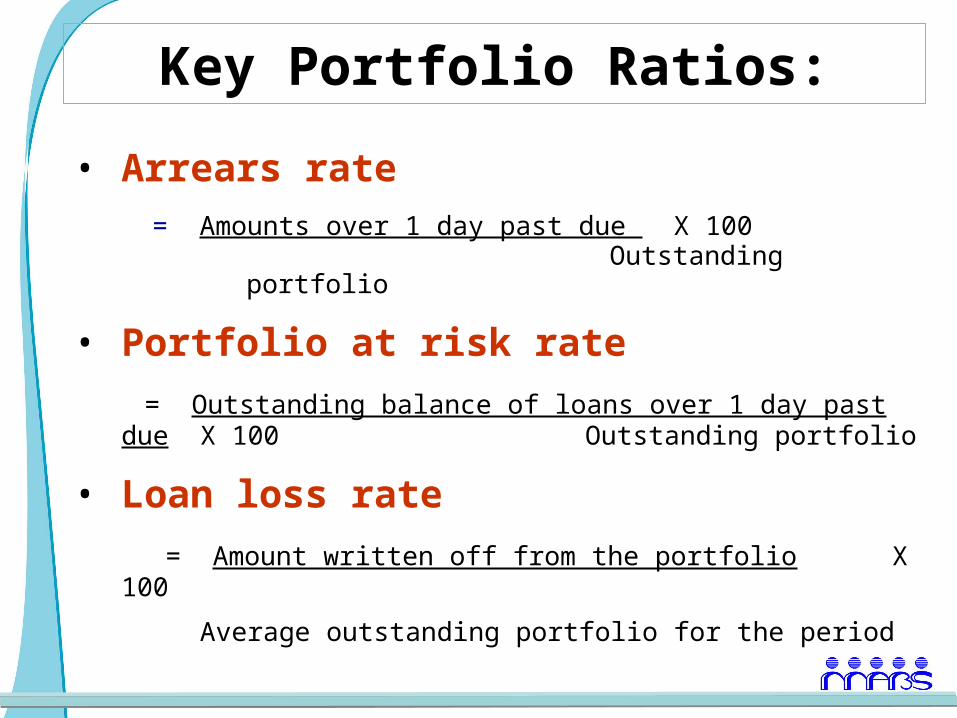
Key Portfolio Ratios:
• Arrears rate = Amounts over 1 day past due X 100
Outstanding portfolio
• Portfolio at risk rate
= Outstanding balance of loans over 1 day past due X 100 Outstanding portfolio
• Loan loss rate
= Amount written off from the portfolio X 100
Average outstanding portfolio for the period
Portfolio At Risk Aging Report
A tool that allows managers, supervisors and account officers to identify and assess the quality and risk in their loan portfolios.
Provides a “window” into the portfolio so management can see how much principal is at risk and whether risk is serious, moderate, or minor.
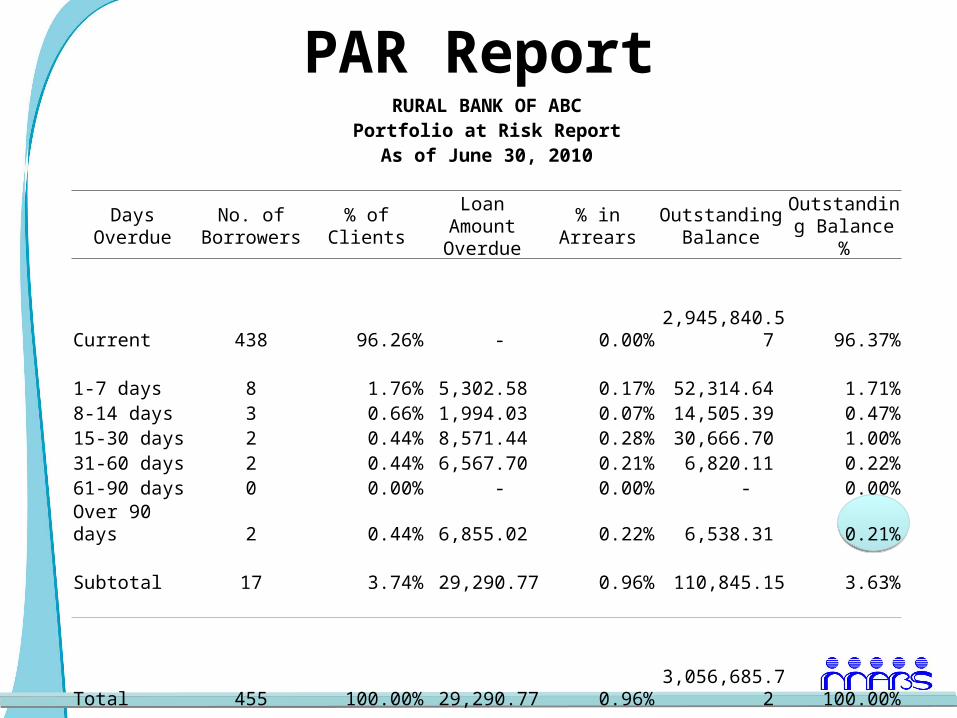
PAR ReportRURAL BANK OF ABCPortfolio at Risk Report
As of June 30, 2010
Days Overdue
No. of Borrowers
% of ClientsLoan Amount
Overdue% in Arrears
Outstanding Balance
Outstanding Balance %
Current 438 96.26% - 0.00% 2,945,840.57 96.37%
1-7 days 8 1.76% 5,302.58 0.17% 52,314.64 1.71%8-14 days 3 0.66% 1,994.03 0.07% 14,505.39 0.47%15-30 days 2 0.44% 8,571.44 0.28% 30,666.70 1.00%31-60 days 2 0.44% 6,567.70 0.21% 6,820.11 0.22%61-90 days 0 0.00% - 0.00% - 0.00%Over 90 days 2 0.44% 6,855.02 0.22% 6,538.31 0.21%
Subtotal 17 3.74% 29,290.77 0.96% 110,845.15 3.63%
Total 455 100.00% 29,290.77 0.96% 3,056,685.72 100.00%
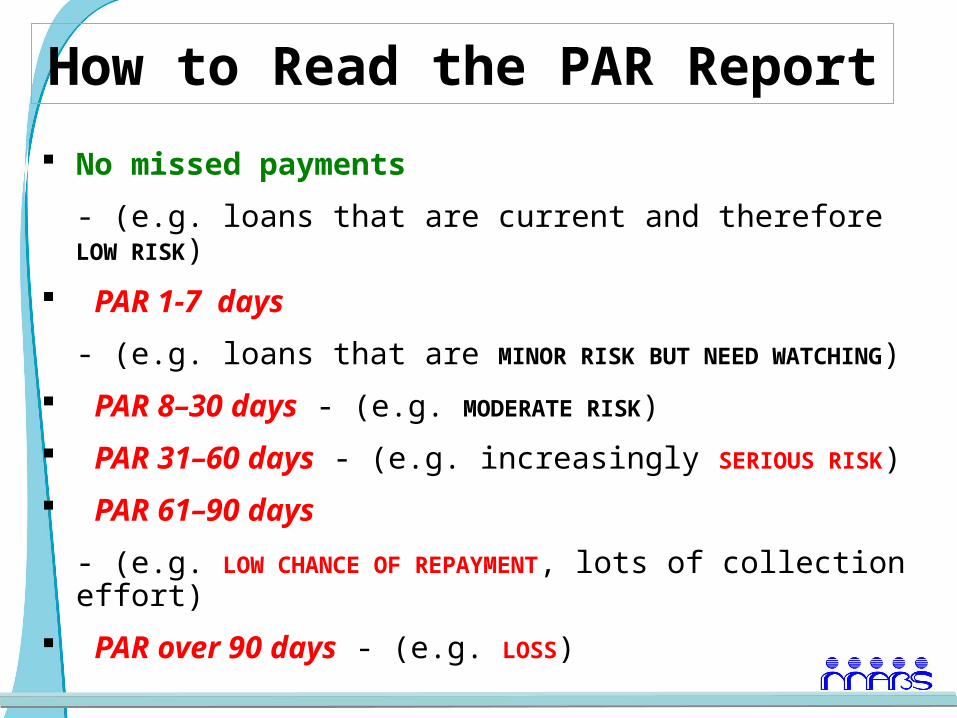
How to Read the PAR Report
No missed payments
- (e.g. loans that are current and therefore LOW RISK)
PAR 1-7 days
- (e.g. loans that are MINOR RISK BUT NEED WATCHING)
PAR 8–30 days - (e.g. MODERATE RISK)
PAR 31–60 days - (e.g. increasingly SERIOUS RISK)
PAR 61–90 days
- (e.g. LOW CHANCE OF REPAYMENT, lots of collection effort)
PAR over 90 days - (e.g. LOSS)
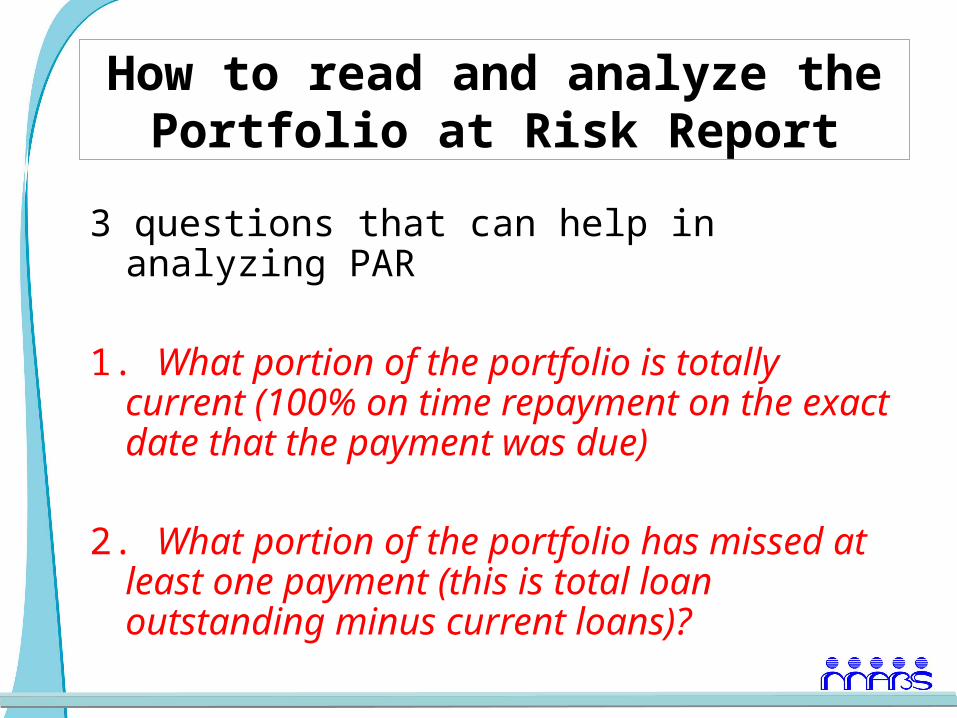
How to read and analyze the Portfolio at Risk Report
3 questions that can help in analyzing PAR
1. What portion of the portfolio is totally current (100% on time repayment on the exact date that the payment was due)
2. What portion of the portfolio has missed at least one payment (this is total loan outstanding minus current loans)?
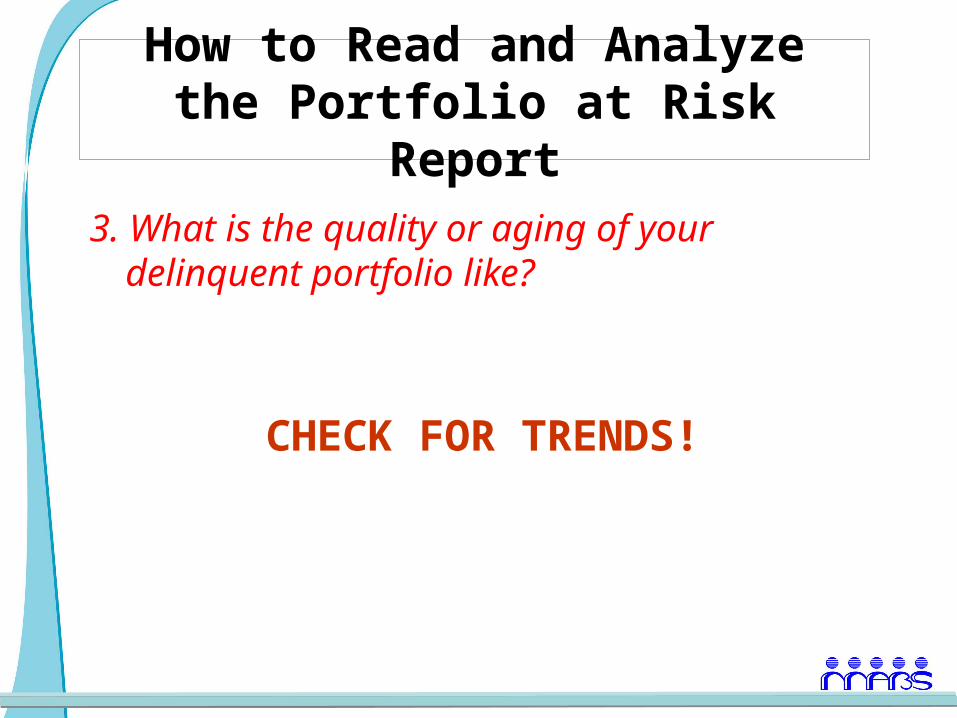
How to Read and Analyze the Portfolio at Risk Report
3. What is the quality or aging of your delinquent portfolio like?
CHECK FOR TRENDS!
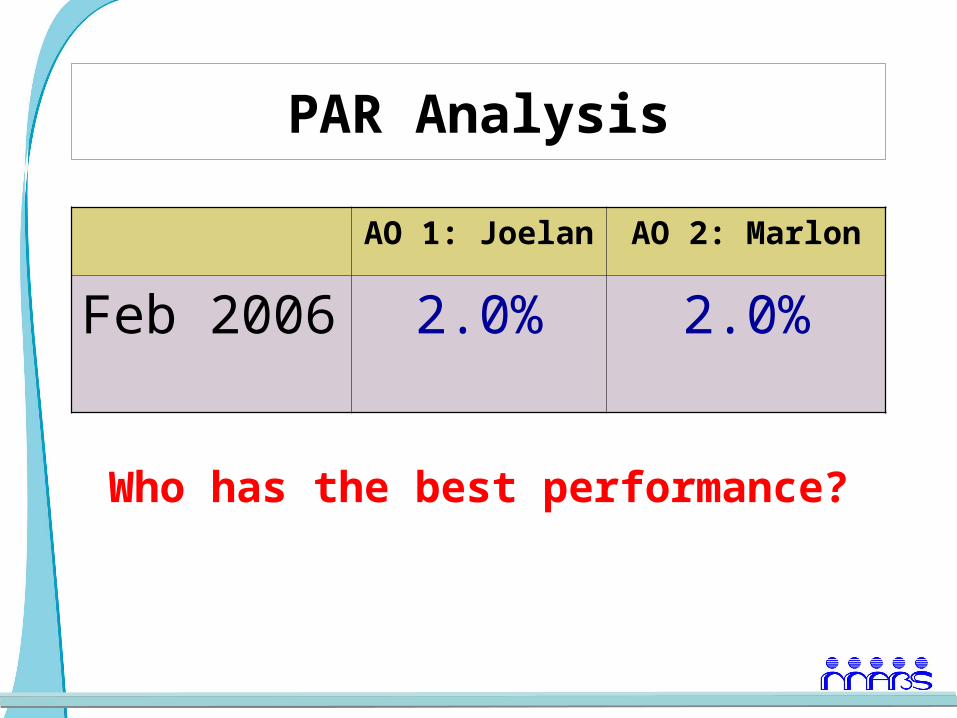
PAR Analysis
AO 1: Joelan AO 2: Marlon
Feb 2006 2.0% 2.0%
Who has the best performance?
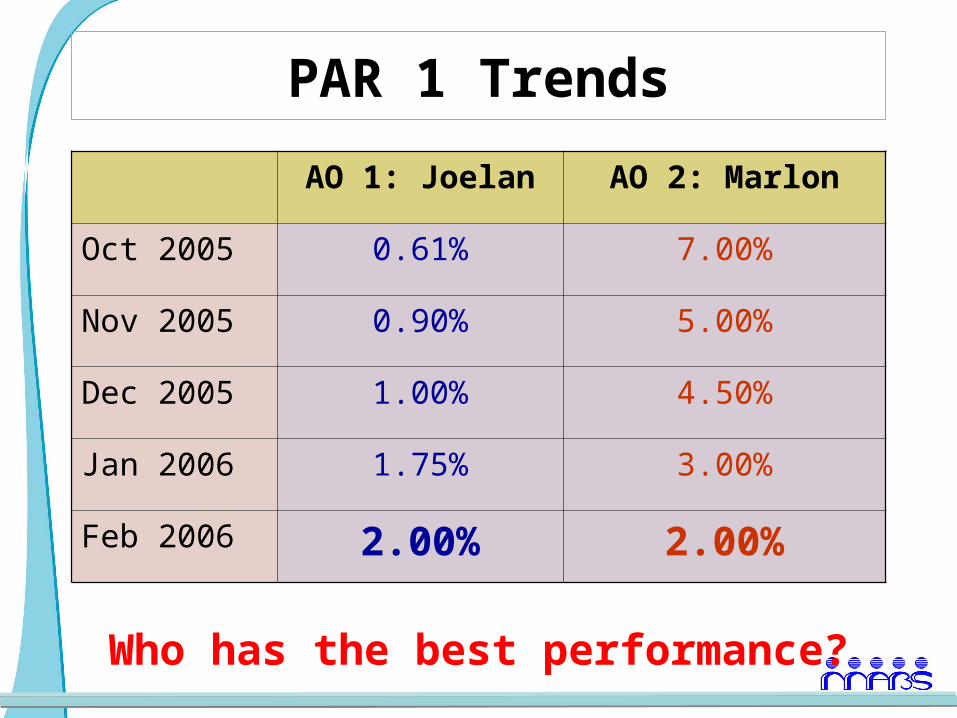
PAR 1 Trends
AO 1: Joelan AO 2: Marlon
Oct 2005 0.61% 7.00%
Nov 2005 0.90% 5.00%
Dec 2005 1.00% 4.50%
Jan 2006 1.75% 3.00%
Feb 2006 2.00% 2.00%
Who has the best performance?

PAR by AGE
AOs 1-7 8-15
16-30
31-60
60-90 90+
Luis 2%
Jose 2%
Ben 2%
Marlon 2%
Joelan 2%
Who has the best performance?

PAR by AGE
AOs PAR1 1-7 8-15 16-30
31-60 60-90 90+
Luis 6%
Jose 3%
Ben 3%
Marlon 7%
Joelan 4%
Who has the best performance?
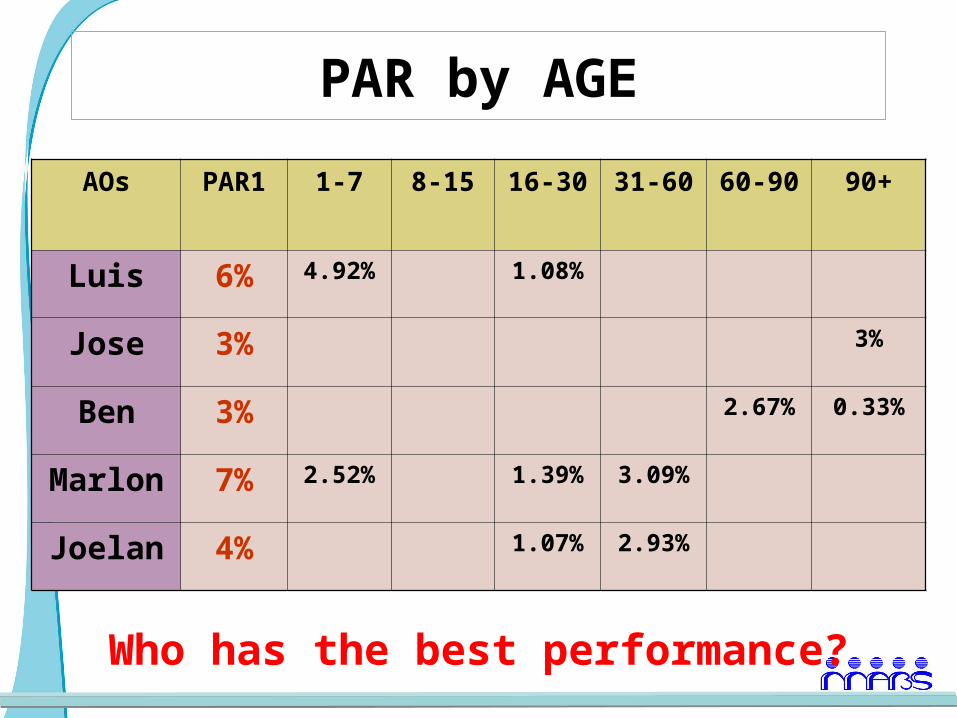
PAR by AGE
AOs PAR1 1-7 8-15 16-30 31-60 60-90 90+
Luis 6% 4.92% 1.08%
Jose 3% 3%
Ben 3% 2.67% 0.33%
Marlon 7% 2.52% 1.39% 3.09%
Joelan 4% 1.07% 2.93%
Who has the best performance?
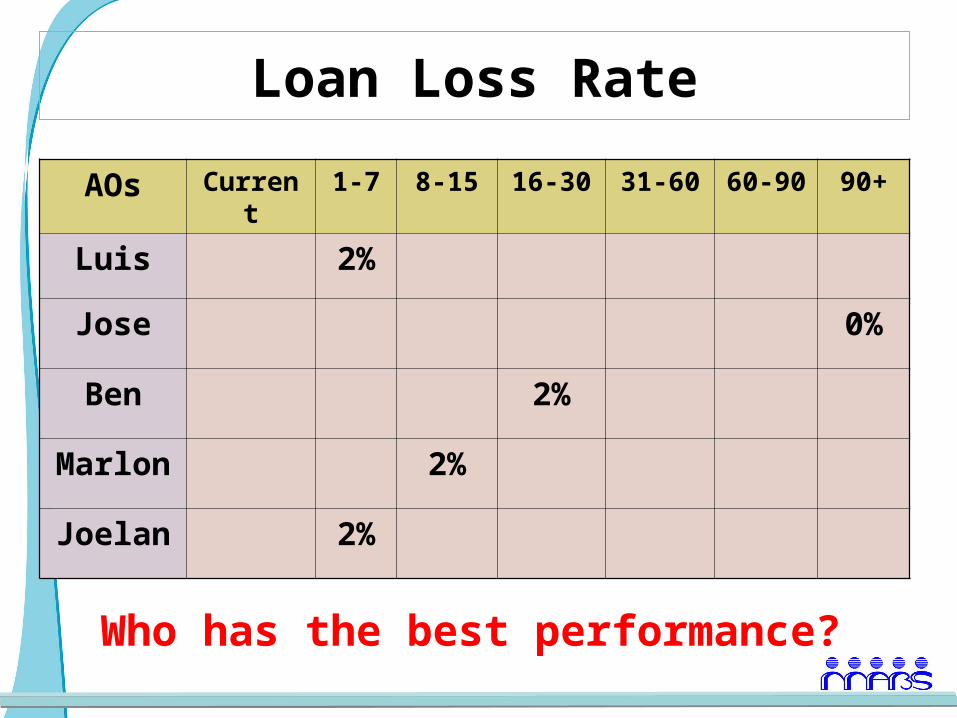
Loan Loss Rate
AOs Current
1-7 8-15 16-30 31-60 60-90
90+
Luis 2%
Jose 0%
Ben 2%
Marlon 2%
Joelan 2%
Who has the best performance?
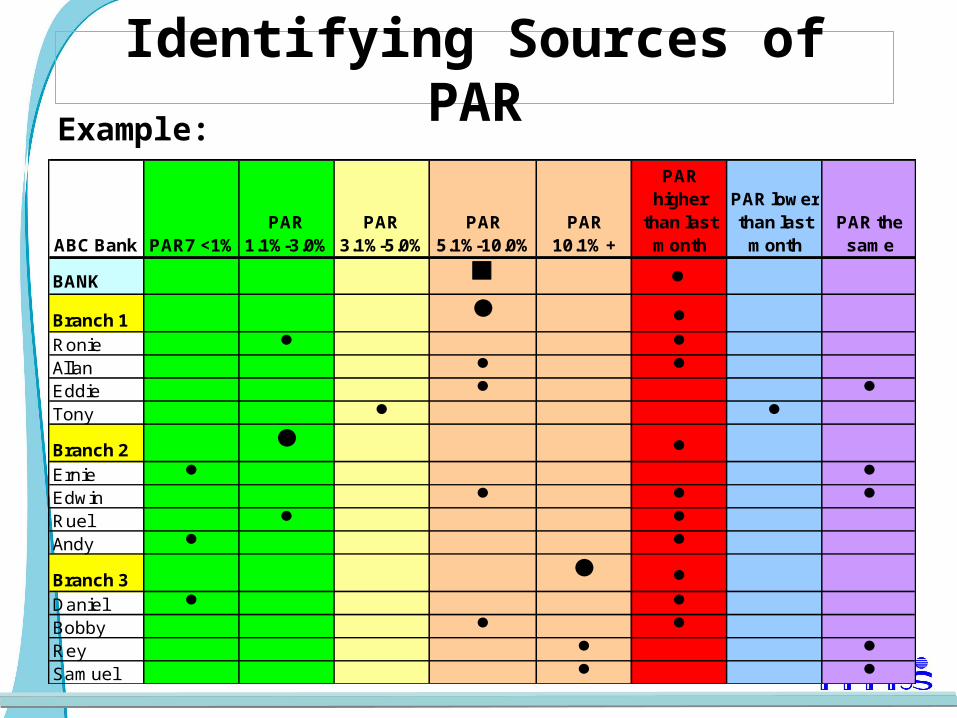
Identifying Sources of PAR
ABC Bank PAR7 <1%PAR
1.1%-3.0%PAR
3.1%-5.0%PAR
5.1%-10.0%PAR
10.1% +
PAR higher
than last month
PAR lower than last
monthPAR the
same
BANK
Branch 1 Ronie Allan Eddie Tony
Branch 2 Ernie Edwin Ruel Andy
Branch 3 Daniel Bobby Rey Samuel
Example:
Identifying Sources of PAR
ABC BANK PAR30 = 10%
Identifying Sources of PAR
• Before any bank wide PAR fighting is undertaken, Managers must isolate/ identify what are the main sources of PAR.
• The first step is looking at the PAR by branch in order to identify if the problem is endemic to all branches or affecting one branch (or a few) only.
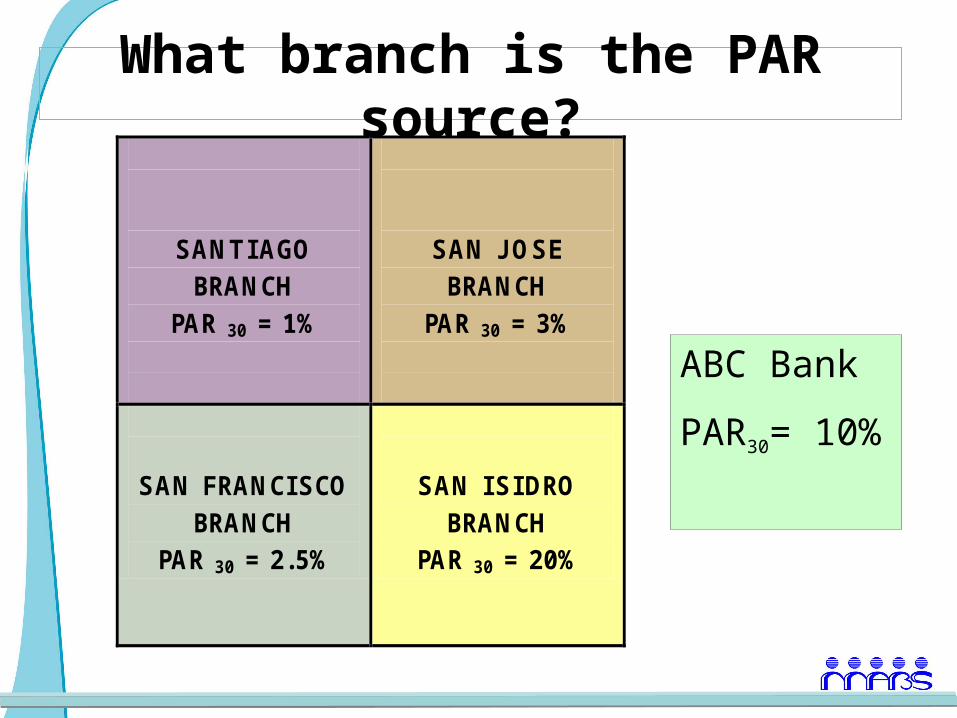
What branch is the PAR source?
SANTI AGO BRANCH
PAR 30 = 1%
SAN J OSE BRANCH
PAR 30 = 3%
SAN FRANCI SCO
BRANCH PAR 30 = 2.5%
SAN I SI DRO BRANCH
PAR 30 = 20%
ABC Bank
PAR30= 10%
Identifying Sources of PAR
• San Isidro Branch with PAR30 = 20% is the main source
• Before any action is taken against San Isidro Branch, Managers must isolate/ identify which AOs within the Branch are the main sources of PAR
• The next step is looking at the PAR by AO in order to identify if the problem is endemic to all AOs or one AO (or a few) only
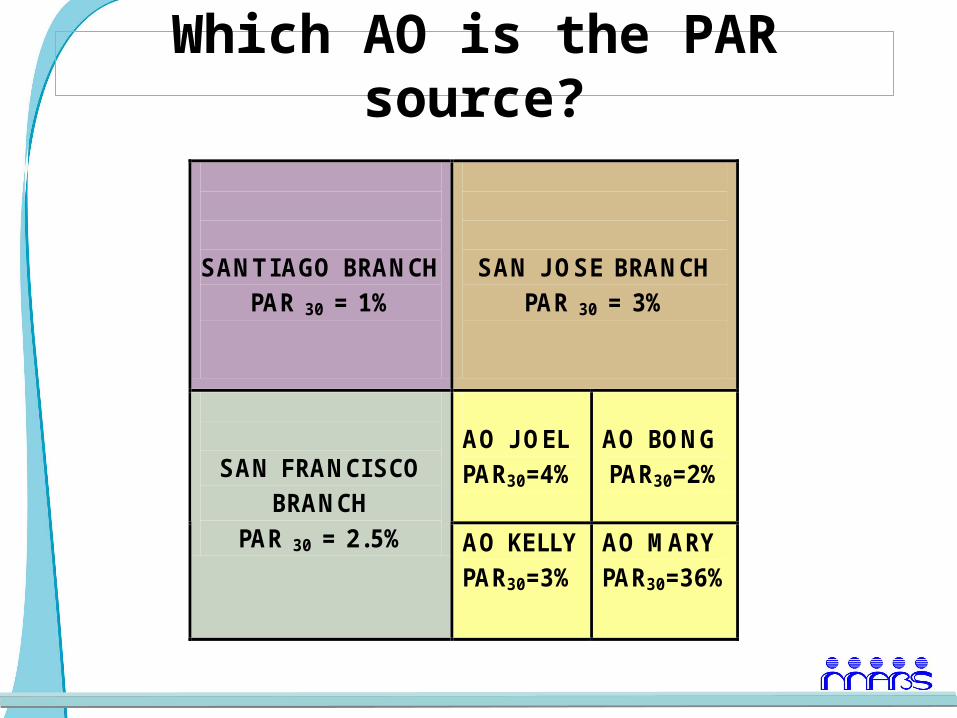
Which AO is the PAR source?
SANTI AGO BRANCH
PAR 30 = 1%
SAN J OSE BRANCH
PAR 30 = 3%
AO J OEL PAR30=4%
AO BONG PAR30=2%
SAN FRANCI SCO BRANCH
PAR 30 = 2.5% AO KELLY PAR30=3%
AO MARY PAR30=36%
Identifying Sources of PAR
• AO Mary with PAR30 = 36% is the main source
• Before any action is taken against AO Mary, Managers must isolate/ identify in her portfolio what are the main causes of PAR
Identifying Sources of PAR
• A break down of her PAR will further isolate PAR sources
– First vs. Repeat Loans
– Concentration on Cycle III and IV
Identifying Sources of PAR
• Because her PAR rate is so high (relative to the rest of the bank and the AOs within the same branch) the Branch Manager must first look into the possibility of FRAUD.
Identifying Sources of PAR
• A break down of her PAR will further isolate PAR sources into
– First vs. Repeat Loans– Repeat Loans III and IV– Loans with Increases above 30%– Loans granted under exceptional cases– A particular economic activity
Identifying Sources of PAR
Isolating/identifying the source of PAR, will enable Branch Managers and Supervisors to:
– Implement measures tailored specifically to the cause identified with the AO identified
– Improve productivity – Improve portfolio quality– Improve time management

Thank you!End of Presentation