effective sealing and monitoring of small movement expansion joints in connecticut bridges ·...
TRANSCRIPT
i
EFFECTIVE SEALING AND MONITORING OF
SMALL MOVEMENT EXPANSION JOINTS
IN CONNECTICUT BRIDGES
March 2017
Ramesh B. Malla, Ph.D. (Principal Investigator)
Montgomery T. Shaw, Ph.D. (Co-Principal Investigator)
and
Dominic Kruszewski (Graduate Research Assistant)
JHR 17-329 Project 15-02
This research was sponsored by the Joint Highway Research Advisory Council (JHRAC)
of the University of Connecticut and the Connecticut Department of Transportation and
was performed through the Connecticut Transportation Institute of the University of
Connecticut.
The contents of this report reflect the views of the authors who are responsible for the
facts and accuracy of the data presented herein. The contents do not necessarily reflect
the official views or policies of the University of Connecticut or the Connecticut
Department of Transportation. This report does not constitute a standard, specification, or
regulation.
ii
1. Report No. 2. Government Accession No. 3. Recipient’s Catalog No.
JHR 17-329 N/A
4. Title and Subtitle 5. Report Date
Effective Sealing and Monitoring of Small Movement
Expansion Joints in Connecticut Bridges
March 2017 6. Performing Organization Code
CCTRP 15-02 7. Author(s) 8. Performing Organization Report No.
Ramesh B. Malla, Ph.D. (Principal Investigator),
Montgomery T. Shaw, Ph.D. (Co-Principal Investigator), and
Dominic Kruszewski (Graduate Research Assistant)
JHR 17-329
9. Performing Organization Name and Address 10. Work Unit No. (TRAIS)
University of Connecticut
Connecticut Transportation Institute
Storrs, CT 06269-5202
N/A 11. Contract or Grant No.
N/A
12. Sponsoring Agency Name and Address 13. Type of Report and Period Covered
Connecticut Department of Transportation
2800 Berlin Turnpike
Newington, CT 06111
Final 14. Sponsoring Agency Code
CCTRP 15-02 15. Supplementary Notes
This study was conducted under the Connecticut Cooperative Transportation Research Program
(CCTRP), http://www.cti.uconn.edu/cctrp/.
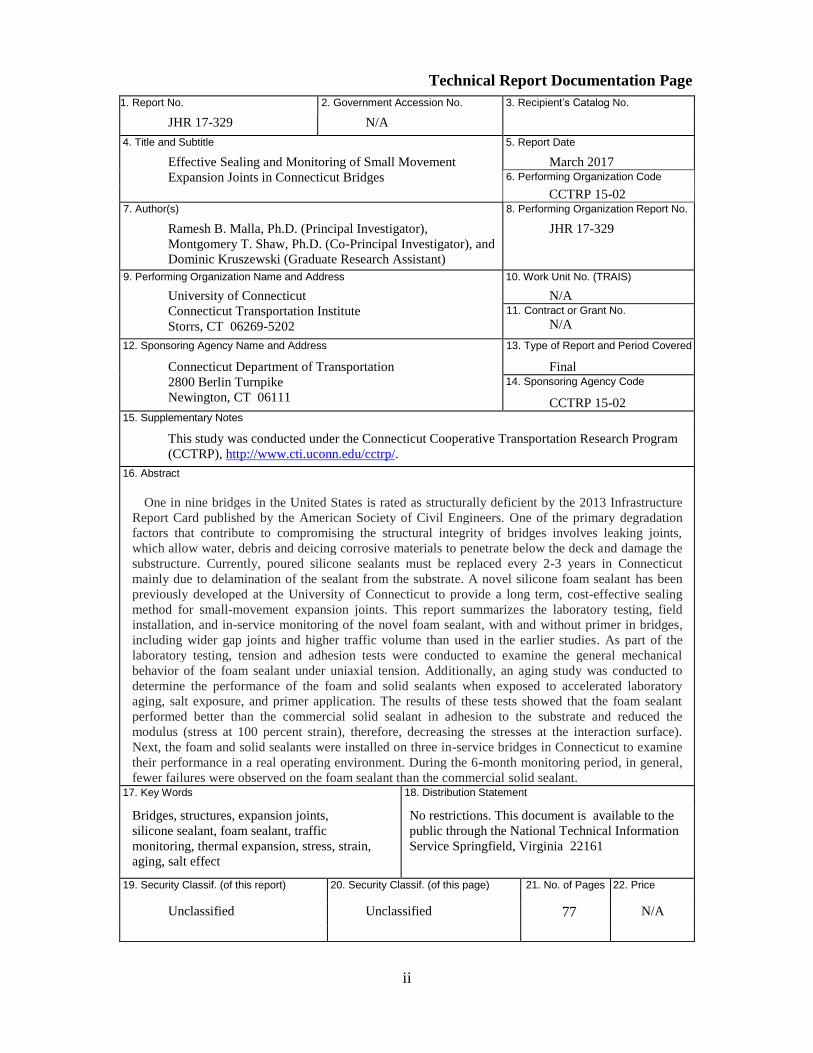
16. Abstract
One in nine bridges in the United States is rated as structurally deficient by the 2013 Infrastructure
Report Card published by the American Society of Civil Engineers. One of the primary degradation
factors that contribute to compromising the structural integrity of bridges involves leaking joints,
which allow water, debris and deicing corrosive materials to penetrate below the deck and damage the
substructure. Currently, poured silicone sealants must be replaced every 2-3 years in Connecticut
mainly due to delamination of the sealant from the substrate. A novel silicone foam sealant has been
previously developed at the University of Connecticut to provide a long term, cost-effective sealing
method for small-movement expansion joints. This report summarizes the laboratory testing, field
installation, and in-service monitoring of the novel foam sealant, with and without primer in bridges,
including wider gap joints and higher traffic volume than used in the earlier studies. As part of the
laboratory testing, tension and adhesion tests were conducted to examine the general mechanical
behavior of the foam sealant under uniaxial tension. Additionally, an aging study was conducted to
determine the performance of the foam and solid sealants when exposed to accelerated laboratory
aging, salt exposure, and primer application. The results of these tests showed that the foam sealant
performed better than the commercial solid sealant in adhesion to the substrate and reduced the
modulus (stress at 100 percent strain), therefore, decreasing the stresses at the interaction surface).
Next, the foam and solid sealants were installed on three in-service bridges in Connecticut to examine
their performance in a real operating environment. During the 6-month monitoring period, in general,
fewer failures were observed on the foam sealant than the commercial solid sealant. 17. Key Words 18. Distribution Statement
Bridges, structures, expansion joints,
silicone sealant, foam sealant, traffic
monitoring, thermal expansion, stress, strain,
aging, salt effect
No restrictions. This document is available to the
public through the National Technical Information
Service Springfield, Virginia 22161
19. Security Classif. (of this report) 20. Security Classif. (of this page) 21. No. of Pages 22. Price
Unclassified Unclassified 77 N/A
Technical Report Documentation Page

iii
ACKNOWLEDGEMENTS
The research team would like to thank all organizations and individuals, who have
contributed to making this research possible. First of all, sincere thanks are due to the
Connecticut Department of Transportation (CT DOT) and the State of Connecticut for the
financial support. The research team acknowledges and deeply appreciates the support
and advice from the following members of CT DOT:
(1) David Hiscox, Bradley Overturf, Anne-Marie McDonnell, Michael Connors,
Richard C, Van Allen, and James Fallon, for coordinating requests by the research team
and providing advice on the research project;
(2) Technical Advisory Committee (TAC) members, David Hiscox, Douglas Harz,
Jeffrey Cheng, Matthew Carr, James Bedard, and James Mahoney for providing
technical advice towards successful completion of this project;
(3) Seth Burgess, Awni Allamadani, and James Bedard for coordinating the field
installation and logistical planning with maintenance crews throughout their respective
districts in the state; and,
(4) all other Conn DOT staff who provided support for field work.
Sincere thanks appreciation are also due to members of the Connecticut Cooperative
Transportation Research Program (CCTRP)/ Joint Highway Research Council (JHRAC)
for their support and advice.
Additionally, the research team acknowledges the generous support provided by the
Connecticut Transportation Institute (CTI) to providing lab space and administrative help
throughout this project. A special thanks to members of CTI administration, including
James Mahoney (Executive Director), Stephanie Merrall, John DaDalt, Scott Zenke,
Anthony Lorenzetti, Carolyn Ward, and Lori Judd. Thanks to other graduate students,
Suvash Dhakal, Surendra Baniya, Rishav Aryal, and Bryant Heimbach, who assisted in
field installation of the bridge joint sealants.
The research team also gratefully acknowledges the material and in-kind support
from BASF/Watson Bowman Acme Corp., Amherst, NY, who supplied generous
quantities of its Wabo commercial silicone sealant, and also United Steel Corp., Hartford,
CT, who provided steel to the research team to assemble the prototype joint.
Finally, sincere thanks and appreciation are due to the University of Connecticut and
the Civil and Environmental Engineering Department for supporting and encouraging this
work.
iv

v
TABLE OF CONTENTS
Title Page i
Technical Report Documentation Page ii
Acknowledgements iii
SI (Modern Metric) Conversion Factors iv
Table of Contents v
List of Figures vi
List of Tables ix
Executive Summary 1
1.0 Introduction 3
1.1 Background and Research Motivation 3
1.2 Project Objectives 4
1.3 Literature Review 5
1.4 Design of Bridge Expansion Joints 10
1.5 Structure of Report 11
2.0 Laboratory Testing 12
2.1 Background 12
2.2 Experimental Motivation 12
2.3 Overview of Foam Sealant Formulation 13
2.4 Mixing Protocol for Experiments 14
2.5 Fabrication of Test Coupons 15
2.6 Application of Primer 17
2.7 Tension/Adhesion Test and Results 18
2.8 Aging/Salt Water Test and Results 24
2.9 Volume Expansion Test and Results 38
3.0 Field Installation 41
3.1 Route 6 Bridge 41
3.2 Route 291 Bridge 45
3.3 Route 22 Bridge 49
4.0 Field Monitoring 52
4.1 Route 6 Bridge 52
4.1.1 Joint Gap History 52
4.1.2 Traffic Counter 53
4.2 Route 291 Bridge 58
4.2.1 Joint Gap History 59
4.3 Route 22 Bridge 59
4.3.1 Joint Gap History 60
4.4 Visual Inspection of Sealants 61
5.0 Summary, Conclusions and Recommendation for Future Work 63
6.0 References 65

vi
LIST OF FIGURES
Figure 1: Typical butt joint (Burke 1989) 6
Figure 2: Typical sliding plate joint (Lesa Systems 2016) 6
Figure 3: Typical compression seal joint (MM Systems 2015) 7
Figure 4: Typical asphaltic plug joint (USC 2015) 7
Figure 5: Typical poured silicone sealant joint (BASF/WBA 2015) 8
Figure 6: Typical strip seal joint (DSB 2015) 8
Figure 7: Typical finger joint (Tensa 2015) 9
Figure 8: Typical modular bridge joint (DSB 2015) 10
Figure 9: Schematic of foam sealant reaction (Malla et al. 2007) 13
Figure 10: (Left to right) Wabo, Crosslinker, water, platinum 14
Figure 11: Mixing procedure for foam sealant 15
Figure 12: Fabrication of coupons for experimental testing 16
Figure 13: Formwork for polymer modified concrete casting 17
Figure 14: Typical test specimen (Malla et al. 2007) 17
Figure 15: Primer for steel (left) and concrete (right) 18
Figure 16: Concrete and steel coupons prepared for pouring of sealant 18
Figure 17: Tensile testing using Instron machine. 19
Figure 18. Results for specimens containing foam sealant, steel substrate
(top) and foam sealant, concrete substrate (bottom) 20
Figure 19: Results for specimens containing solid sealant, steel substrate
(top) and solid sealant, concrete substrate (bottom) 21
Figure 20: Concrete specimens containing (a) solid sealant with no primer;
(b) solid sealant with primer. 21
Figure 21: Steel specimens containing (a) solid sealant with no primer;
(b) solid sealant with primer. 22
Figure 22: Concrete specimens containing (a) foam sealant with no primer;
(b) foam sealant with primer 22
Figure 23: Steel specimens containing (a) foam sealant with no primer;
(b) foam sealant with primer 22
Figure 24: Average ultimate stress for specimens with a concrete substrate 23
Figure 25: Average ultimate stress for specimens with a steel substrate 24
Figure 26: Curing of specimens with concrete substrate for aging experiment 25
Figure 27: Temperature profile of water tanks 25
Figure 28: (a) Placement of heater and air pumps, (b) water tank containing
140 specimens 26
Figure 29: Experimental setup containing Instron machine and data
acquisition system 27
Figure 30: Condition of extended specimens containing (a) foam sealant
and (b) solid sealant 28
Figure 31: Ultimate stress for specimens exposed to salt and primer treatment 29
Figure 32: Ultimate stress for specimens exposed to salt without primer
treatment 29
Figure 33: Ultimate stress for specimens not exposed to salt with primer
treatment 30

vii
Figure 34: Ultimate stress for specimens not exposed to salt and with no primer
treatment 30
Figure 35: Stress at 100% strain for specimens exposed to salt and primer
treatment 31
Figure 36: Stress at 100% strain for specimens exposed to salt without primer
treatment 31
Figure 37: Stress at 100% strain for specimens not exposed to salt and with primer
treatment 32
Figure 38: Stress at 100% strain for specimens not exposed to salt and with no
primer treatment 32
Figure 39: Ultimate strain (elongation) for specimens exposed to salt without
primer treatment 33
Figure 40: Ultimate strain (elongation) for specimens exposed to salt with
primer treatment 33
Figure 41: Ultimate strain (elongation) for specimens not exposed to salt and
with no primer treatment 34
Figure 42: Ultimate strain (elongation) for specimens not exposed to salt and
with primer treatment 34
Figure 43: Expansion test assembly 39
Figure 44: Expansion vs. time for foam sealant 40
Figure 45: Map location of Route 6 Bridge in Windham, CT 41
Figure 46: Route 6 Bridge (a) Span and center pier, (b) support at abutment 42
Figure 47: Plan schematic of Route 6 Bridge 42
Figure 48: Sandblasting and primer application onto the Route 6 Bridge joint 43
Figure 49: Overview of the joint on Route 6 Bridge (a) before backer rod
installation and (b) after installation 43
Figure 50: Sealant and primer placement plan, Route. 6 Bridge 44
Figure 51: Installation of the sealant, Route 6 Bridge 45
Figure 52: Location of the Route 291 candidate bridge 46
Figure 53: Plan schematic of Route 291 Bridge 46
Figure 54: Joint preparation on Route 291 Bridge 47
Figure 55: Installation of backer rod and duct tape lining, Route 291Bridge 48
Figure 56: Sealant and primer placement plan, Route 291 Bridge 48
Figure 57: Map location of Route 22 Bridge in North Haven, CT 49
Figure 58: Joint on Route 22 Bridge (a) air blasting the joint and (b) cutting
of the header surface 50
Figure 59: Sealant and primer placement plan, Route 22 Bridge 51
Figure 60: Joint gap history for Route 6 Bridge 53
Figure 61: Joint gap as a function of temperature change for Route 6 Bridge 53
Figure 62: Location of traffic counter s on Route 6 Bridge 54
Figure 63: Classification of vehicles entering Route 6 Bridge over monitoring
Period 55
Figure 64: Average speed record for Route 6 Bridge: class bin chart (top)
and speed histogram (bottom) 56
Figure 65: LVDT placement for axial displacement measurement on Route 6
Bridge 57

viii
Figure 66: Joint gap movement record of Route 6 Bridge (Windham, CT) 57
Figure 67: Joint gap history for Route 291 Bridge 59
Figure 68: Joint gap vs. change in temperature for Route 291 Bridge 60
Figure 69: Joint gap history of Route 22 Bridge (North Haven, CT) 61
Figure 70: Location of damage on Route 291 Bridge 62
Figure 71: Visual observation of damage on Route 291 Bridge 62

ix
LIST OF TABLES
Table 1: Coefficient of thermal expansion for various materials 11
Table 2: Mix proportions for foam sealant 14
Table 3: Results for tension/adhesion test 23
Table 4: Saltwater aging test – average ultimate stresses and strains
(salt treated specimens) 35
Table 5: Saltwater aging test – average ultimate stresses and strains
(non-salt treated specimens) 36
Table 6: Parameter and interaction terms for LSQ model 37
Table 7: Initial thicknesses of specimens for expansion test 39
Table 8: Sample vehicle count output on Route 6 Bridge 58

1
EXECUTIVE SUMMARY
Expansion joints are one of the most critical components of a bridge structure, as they
allow for the bridge to expand and contract due to inherent temperature fluctuations.
However, it has been widely known that water and deicing chemicals leakage through the
joints is a major cause for corrosion and damage of the bridge structure underneath the
deck. In general, one in nine bridges of the United States is rated as structurally deficient,
according to the 2013 Infrastructure Report Card of the American Society of Civil
Engineers. Without any doubt, leaky joints can be attributed to have played a major role
in this. The poured silicone sealant joint is a very common type of bridge joint sealant
because of its advantages, including: a) good durability; b) self-leveling action; c) strong
elastic performance for a wide range of temperatures and UV exposures; d) ease of
installation and maintenance; e) minimal cost; f) rapid curing; and, g) little to no
structural impact to the bridge. Although several advantages are present, poured silicone
sealant joints must be replaced every 2-3 years in Connecticut due to delamination of the
sealant from the substrate.
A novel silicone foam sealant has been previously developed by the University of
Connecticut (UConn) research team to remedy the current problems commonly
experienced by silicone joints. This new sealant is comprised of a commercially available
sealant which is chemically altered to produce more favorable mechanical properties. The
chemical additives used in the sealant produce a softer, foam-like sealant. Additionally, it
has been observed that the silicone foam sealant expands upon placement, which could
lead to significant material savings. The main idea behind chemically modifying the
sealant is to reduce its modulus of elasticity, thus reducing the stresses generated at the
interface of the sealant and the substrate header.
To further evaluate the behavior and performance of the silicone foam sealant and
compare them with a commercially available silicone sealant (termed here under as the
solid sealant) under additional real-life practical conditions, this research project
performed laboratory testing, field installation, and in-service monitoring of the foam
sealant, with and without primer. For field installation, bridges were selected to include a
wider gap joint and higher traffic volume than those used in the previous studies. First,
tension/adhesion testing was conducted on the foam sealant using the commercially
available sealant as a baseline. The failure mode and stress vs. strain of each sample was
recorded, showing that the foam sealant mostly failed via cohesive rupture (i.e., rupture
of the sealant itself) and maintained its bond to the header. The solid sealant, on the other
hand, primarily failed via adhesive debonding from the header substrate. Next, an
extensive accelerated aging study was conducted to determine and how the failure mode
and stress vs. strain response is affected by laboratory aging. A large number of samples
containing foam and solid sealant were aged under road salt water for several periods of
time. This allowed for testing of samples at various aging times. It was observed that the
foam sealant withstood the effect of aging better than the solid sealant, as the solid
sealant demonstrated a more significant reduction in elastic modulus and ultimate failure
stress and strain. An expansion test was also conducted to determine the effect of
2
expansion as a function of initial layer thickness. It was observed that a thicker layer of
sealant usually expands more than a thin layer sealant.
Finally, both sealants were installed in a total of seven joints on three different
bridges in the State of Connecticut to monitor their performance and allow for a realistic
comparison of both sealants’ in-service performance. The first bridge selected was Bridge
No. 02570 on Route 6 in Windham, CT, with an average joint gap opening of 1.5 - 2
inches. The second bridge selected was bridge No. 06226 in Windsor, CT, with an
average gap opening of 2.5 – 4 inches and heavier traffic volume. The third bridge
selected was bridge No. 03830 on Route 22 in North Haven, CT, with an average joint
gap opening of 0.75 – 2 inches. Several site visits were conducted during the next six
months after installation of the sealant to assess their condition on each bridge joint.
During the monitoring period, overall, fewer failures were observed on the foam sealant
than the commercial solid sealant.

3
1.0 INTRODUCTION
This chapter discusses the motivation, objectives and scope for this research project.
A literature review on various types of bridge expansion joints is also presented.
1.1 Background and Research Motivation
According to the American Society of Civil Engineers’ 2013 Infrastructure Report
Card, about 200 million trips are taken daily over structurally deficient bridges in the 102
largest metropolitan regions of the United States (ASCE 2013). Overall, one in nine of
the nation’s bridges are rated as structurally deficient. The rapidly deteriorating
conditions of bridges can be largely attributed to leaky expansion joints. Expansion joints
are important components in bridge structures, which are used to accommodate bridge
movements due to temperature fluctuations, traffic loading, creep and shrinkage of
concrete, and uneven settlement, without imposing significant secondary stress to the
superstructure (Lee 1994; Dornsife 2000). Not only should expansion joints provide a
watertight seal to protect the substructure from deicing chemicals and water, but they
should also maintain this seal under the various movements that the bridge may
experience.
Two failure modes are most often observed in bridge joints. One failure mode
involves a compromise of the joint seal itself, allowing water and corrosive agents to
flow under the deck and deteriorate the substructure (FHWA 1980). The other failure
mode involves failure of the joint to accommodate the bridge deck movement, often due
to thermal contraction and expansion. This failure is largely attributed to an improper
design of the joint system. Expansion failure may result in upheaving of the road, damage
to the abutment, and composite failure of the superstructure and the deck. When
considering contraction failure, however, the entire deck can shift off the abutment,
resulting in disaster.
Many hazards exist that, when in contact with the substructure, can degrade the
integrity of the bridge itself. These include deicing salts and chemicals; cyclic
movements due to vehicular loading; thermal contraction and expansion; vibrations of the
structure; seismic hazards; and earth pressures/settlement (Hamilton 1985; Purvis 2003).
In order for a bridge to accommodate induced movement and protect its substructure at
the same time, a high-quality, long-lasting expansion joint must be installed to seal the
joint effectively.
Poured silicone sealant expansion joints are one of the more popular sealing systems
used in Connecticut bridges, as most bridges found in Connecticut comprise spans less
than 120 feet. Spans, this small, correlate to joint gaps of less than 2 inches. The
Connecticut Department of Transportation (CT DOT) reported that the average lifespan
of a poured silicone sealant expansion joint when used in new construction is
approximately seven years. However, when used for repairs or maintenance of old joints,
poured silicone sealants joints last about three years (Milner and Shenton 2014).
Common issues with poured silicone sealant joints stem from inadequate surface

4
preparation and poor installation procedures by maintenance crews. However, due to the
low cost and easy installation of this type of joint, the silicone sealant remains an
attractive option for state transportation agencies, especially when repairing small
movement joints which can accommodate movements up to 1.5 inches.
Due to this continuous demand, a novel foam sealant formulation was developed to
improve on the shortcomings of the currently used product (Malla et al. 2005a,b; 2006;
2007; 2011a-d; Shrestha et al. 2006). The sealant, termed “foam sealant” herein, is a
chemically modified version of Wabo SiliconeSeal (WBA 2008a), the brand most
commonly used by CT DOT, termed “solid sealant,” herein. The research study discussed
in this report summarizes the following four major tasks that were carried out as part of
this study:
Tension and adhesion testing was performed to gain a better understanding of the
tensile and adhesive properties of the foam sealant and compare them to those of
the commercially available silicone sealant, Wabo SiliconeSeal (WBA 2008a).
The influence of primer was examined in order to gain a better understanding of
whether it provides improved adhesion to the substrate under a laboratory setting.
Further laboratory testing was performed to compare the tensile and adhesive
properties of the foam and solid sealant under laboratory aging conditions.
Specimens were fabricated and submersed in warm oxygenated water to simulate
extended aging. Specimens were also exposed to deicing chemicals commonly
found on Connecticut state roads in order to observe any deteriorating effects
from both aging and salt. The influence of primer was also a variable in this
experiment.
A general application procedure was developed for in-service bridges and was
used to install the joint sealing system onto three Connecticut bridges with various
traffic volumes and joint gaps. The expansion joints were sealed in a systematic
manner to allow for an in-service comparison of the performance of the
commercially available sealant and newly developed foam sealant. This will
determine if the foam sealant can be considered as a suitable alternative for small
movement expansion joints.
Regular monitoring and observation of the foam and solid sealant under in-service
conditions was performed after installation. Monitoring will include records of the
joint gap width due to thermal contraction and expansion, acquisition of joint
movement data as a function of vehicular traffic during on and off peak hours,
and regular record keeping environmental conditions.
1.2 Project Objectives
The main objective of this project is to further examine the adhesive properties of the
foam sealant in comparison to the currently used solid sealant, develop an application
procedure for in-service structures, install the foam sealant onto several small-movement

5
bridges throughout Connecticut, and evaluate its performance under real life conditions.
In particular, the research involved the following steps:
Pre-Field Laboratory Testing: Conduct laboratory tests with the new sealant to
understand the sealant bonding behavior to various substrates treated with primers
and larger joint gap.
Field Installation Methods and Application: Develop a simplified procedure and
method for mixing, field installation, and monitoring of sealant performance,
apply the test sealants to two to three bridges in Connecticut, including heavily
travelled and with larger (thermal) movement in the small joint category.
Post-Installation Monitoring: Monitor the performance of the sealants installed
under the actual field service and environmental factors, including traffic,
moisture/rain, temperature, salt use, and joint movement/displacement of the
bridges over the project period. Correlate the performance of the sealant with
some of these more prominent factors.
Report Preparation: Prepare quarterly, interim, and final technical reports with the
results from the research. Present to the sponsor and the engineering community
the results in written and oral form.
1.3 Literature Review
This section provides a literature review of the various types of bridge expansion
joints used in modern construction and the advantages and disadvantages they deliver
while accommodating for inherent deck movements.
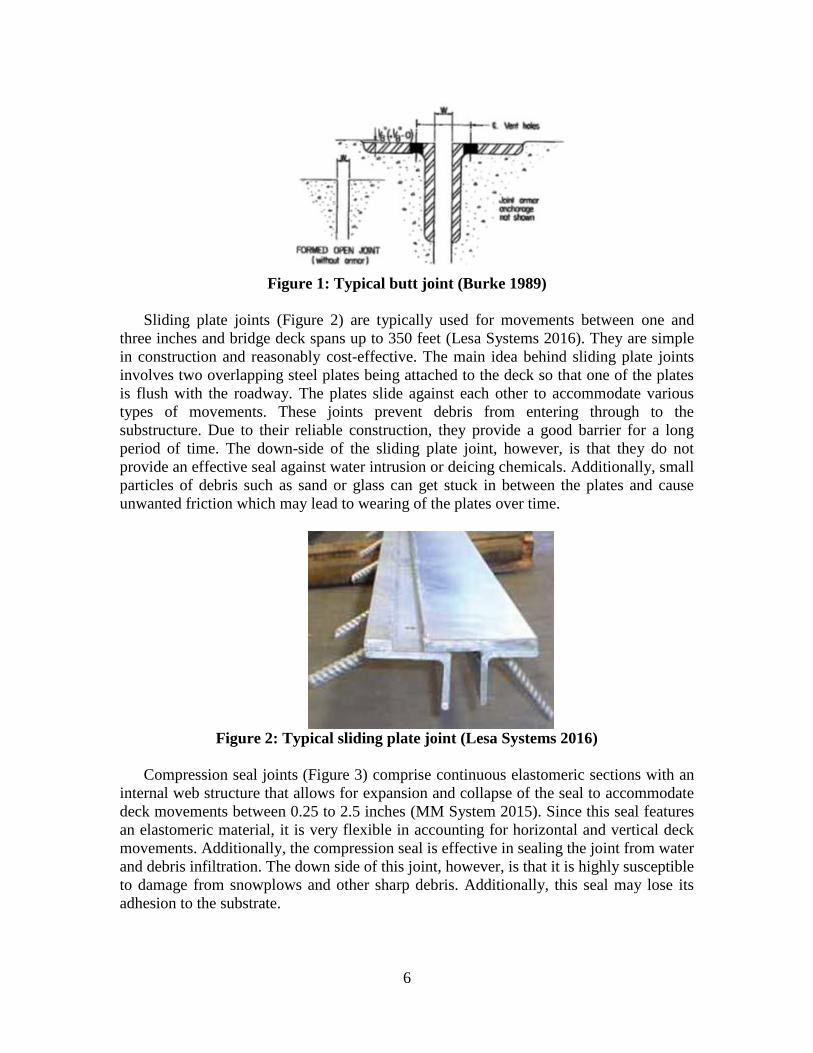
The most basic type of joint, the butt joint (Figure 1), is typically used for movements
less than 1 inch (Burke 1989). The opening is provided between two rigid deck slabs,
which does not allow a smooth transition for traffic. Typical construction includes using a
metal armoring (such as a steel angle embedded into the deck) which acts as the header.
This protects the top edge of the deck from vehicle or plow impacts which may cause
spalling or cracking. Advantages of the butt joint include simple and cost-effective
construction. However, the obvious downside is that it easily allows penetration of water
and deicing salts and chemicals, which can promote corrosion of the substructure. This
joint is often found in areas of the country that do not see snow (and, therefore, ice). It is
also preferred that these joints be installed on bridges with very small joint movement
(i.e., less than 0.5 inches).
6
Figure 1: Typical butt joint (Burke 1989)
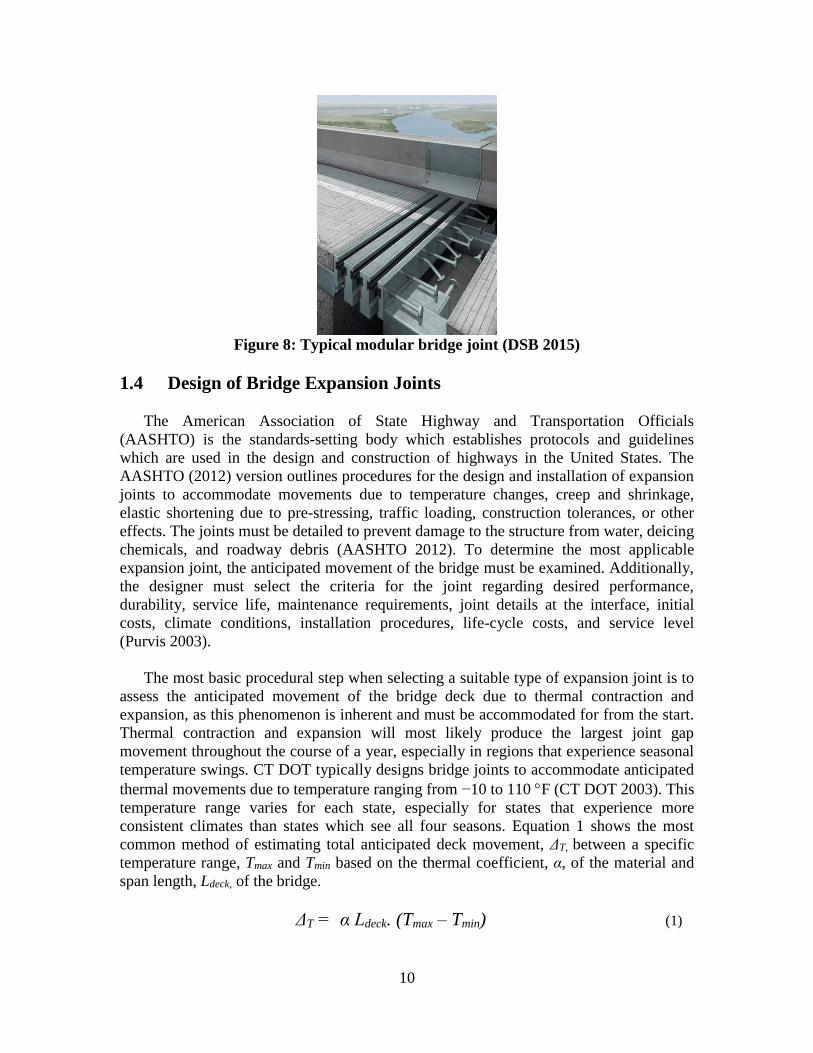
Sliding plate joints (Figure 2) are typically used for movements between one and
three inches and bridge deck spans up to 350 feet (Lesa Systems 2016). They are simple
in construction and reasonably cost-effective. The main idea behind sliding plate joints
involves two overlapping steel plates being attached to the deck so that one of the plates
is flush with the roadway. The plates slide against each other to accommodate various
types of movements. These joints prevent debris from entering through to the
substructure. Due to their reliable construction, they provide a good barrier for a long
period of time. The down-side of the sliding plate joint, however, is that they do not
provide an effective seal against water intrusion or deicing chemicals. Additionally, small
particles of debris such as sand or glass can get stuck in between the plates and cause
unwanted friction which may lead to wearing of the plates over time.
Figure 2: Typical sliding plate joint (Lesa Systems 2016)
Compression seal joints (Figure 3) comprise continuous elastomeric sections with an
internal web structure that allows for expansion and collapse of the seal to accommodate
deck movements between 0.25 to 2.5 inches (MM System 2015). Since this seal features
an elastomeric material, it is very flexible in accounting for horizontal and vertical deck
movements. Additionally, the compression seal is effective in sealing the joint from water
and debris infiltration. The down side of this joint, however, is that it is highly susceptible
to damage from snowplows and other sharp debris. Additionally, this seal may lose its
adhesion to the substrate.

7
Figure 3: Typical compression seal joint (MM Systems 2015)
Perhaps the most popular joint in New England (especially in Connecticut), the
asphaltic plug joint (APJ), provides a watertight seal with essentially no long term traffic
disruption during installation. These joints can accommodate movement of up to 1.5
inches. As shown in Figure 4, polymer-modified asphalt (PMA), is poured in a carved
channel between two bridge decks sealed by a backer rod and a bridging plate (USC
2015). Prior to pouring of the asphalt, the channel is prepared with waterproofing and a
wearing surface to ensure proper adhesion to the concrete deck. A drainage tube, which
deviates water away from the joint, is also installed in the event that water penetrates
through the seal. Once the modified asphalt is sufficiently cured, it will accommodate
traffic, thermal and impact loadings, as it has excellent contraction and expansion
properties. The main downside of APJs is the softening and creeping of the material
under high temperatures. This often leads to rutting and detachment of the asphalt from
the substrate, resulting in an expensive cleaning and replacement process. Additionally,
the polymer modified concrete can crack in cold temperatures, allowing water and
chemical penetration. The relaxation of the asphaltic plug joint should be sufficient to
relieve the stress due to applied thermal displacement (Bramel et al. 2000). Asphaltic
plug joints are not typically installed for vertical or skewed joints.
Figure 4: Typical asphaltic plug joint (USC 2015)

8
A typical poured silicone joint (Figure 5), which can accommodate bridge movements
between 0.25 and 1.5 inches, is usually installed on shorter span bridges where the
movement is minimal (BASF/WBA 2015). Such joints consist of a backer rod inserted
between two bridge decks onto which the silicone sealant is poured (Dow Corning
2004a). The backer rod is typically made of compressible, temperature resistant, UV-
resistant foam to accommodate various movements but still keep the silicone in place
throughout the lifespan of the joint. Poured silicone sealant joints exhibit several
advantages, including good durability, self-leveling action, strong elastic performance for
a wide range of temperatures and UV exposures, and rapid curing, allowing for minimum
traffic disruptions during installation (Fincher 1983). The most common problems with
poured silicone joints include detachment of the silicone from the substrate and
mechanical damage to the silicone material due to accumulation of debris and salt.
Figure 5: Typical poured silicone sealant joint (BASF/WBA 2015)
A strip seal (Figure 6) typically consists of a “V”-shape neoprene gland which is
mechanically locked into a metal facing located on the header of the joint (DSB 2015).
Movement is accommodated by unfolding of the elastomeric gland. This gland provides a
waterproof seal which protects the substructure of the bridge from water and road salts.
However, if debris gets caught inside the gland, the joint becomes vulnerable to puncture
once the gland closes during the summer season when the bridge joint is narrowest.
Additionally, faulty installation or dirty locking devices can cause pulling out of the
gland from the metal rail edges.
Figure 6: Typical strip seal joint (DSB 2015)

9
Finger joints (Figure 7), which are applicable for bridge movements of 3 inches or
greater, are one of the most dependable expansion joints for larger movement bridges
(Tensa 2015). They allow debris and water to enter, but a diaphragm that hangs between
the two bridge decks catches any unwanted material and allows it to flow out to the sides
of the bridge deck. Finger joints can accommodate for rotational and vertical movement,
which can be crucial for medium movement bridges (especially in seismic regions).
Some problems of the finger joint, however, include damage to the “fingers,” which may
lead to them bending upwards. This can result in a rough bump for vehicles or puncturing
of the tires. Additionally, the diaphragm that hangs below the roadway must be
constantly cleaned to prevent buildup of debris. This operation may prove to be costly
and time consuming.
Figure 7: Typical finger joint (Tensa 2015)
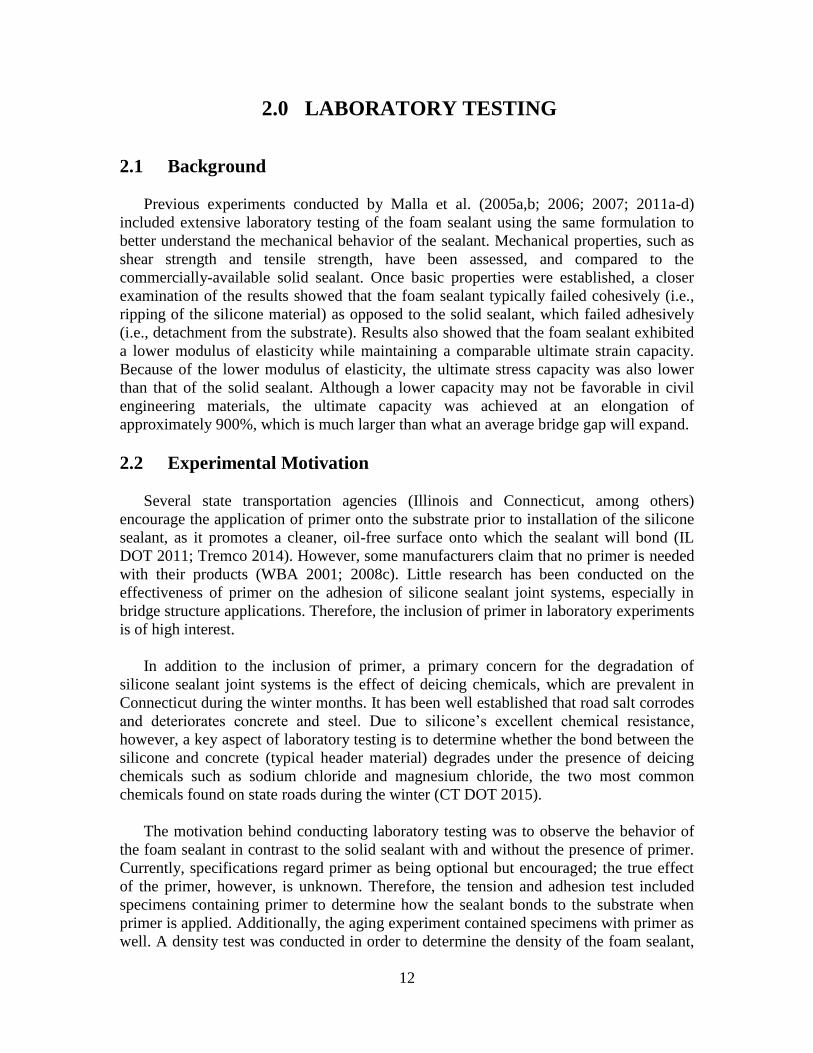
Modular bridge joints (Figure 8), designed to accommodate bridge deck movements
as large as 24 inches, are the most complex and expensive expansion joints (DSB 2015).
They are designed to provide a watertight seal while maintaining smooth wheel load
transfer between decks. Since they can accommodate movement up to 24 inches, the
joints themselves can be rather large, sometimes spanning over five feet. The system
comprises a series of center beams supported atop support bars. The center beams are
oriented parallel to the joint axis, while the support bars are placed parallel to the
movement direction and are usually embedded into the concrete deck as a monolithic
connection. Although these joints are capable of handling large thermal movements,
making them great candidates for long-span bridges, concerns raised with this type of
joint include fatigue cracking of welds, damage to the neoprene sealer material, damage
from snowplows, and debris getting caught in between the modules. In addition, many
state transportation agencies are reluctant to use modular joints because of their high
initial costs and expensive and tedious maintenance patterns.
10
Figure 8: Typical modular bridge joint (DSB 2015)
1.4 Design of Bridge Expansion Joints
The American Association of State Highway and Transportation Officials
(AASHTO) is the standards-setting body which establishes protocols and guidelines
which are used in the design and construction of highways in the United States. The
AASHTO (2012) version outlines procedures for the design and installation of expansion
joints to accommodate movements due to temperature changes, creep and shrinkage,
elastic shortening due to pre-stressing, traffic loading, construction tolerances, or other
effects. The joints must be detailed to prevent damage to the structure from water, deicing
chemicals, and roadway debris (AASHTO 2012). To determine the most applicable
expansion joint, the anticipated movement of the bridge must be examined. Additionally,
the designer must select the criteria for the joint regarding desired performance,
durability, service life, maintenance requirements, joint details at the interface, initial
costs, climate conditions, installation procedures, life-cycle costs, and service level
(Purvis 2003).
The most basic procedural step when selecting a suitable type of expansion joint is to
assess the anticipated movement of the bridge deck due to thermal contraction and
expansion, as this phenomenon is inherent and must be accommodated for from the start.
Thermal contraction and expansion will most likely produce the largest joint gap
movement throughout the course of a year, especially in regions that experience seasonal
temperature swings. CT DOT typically designs bridge joints to accommodate anticipated
thermal movements due to temperature ranging from −10 to 110 F (CT DOT 2003). This
temperature range varies for each state, especially for states that experience more
consistent climates than states which see all four seasons. Equation 1 shows the most
common method of estimating total anticipated deck movement, ΔT, between a specific
temperature range, Tmax and Tmin based on the thermal coefficient, α, of the material and
span length, Ldeck, of the bridge.
ΔT = α Ldeck. (Tmax – Tmin) (1)

11
Table 1: Coefficient of thermal expansion for various materials
Material
Coefficient of Thermal
Expansion, α (m/m/K)
Aluminum 22.2
Concrete 12
Iron 10.4
Rubber 77
Silicone 3
Steel 11
Table 1 shows that the coefficients of thermal expansions for steel and concrete are
11 and 12 K−1, respectively. These materials, the primary ones used in bridge
construction throughout Connecticut (CT DOT 2001), have a similar coefficient of
thermal expansion, which results in a uniform movement of the composite section.
1.5 Structure of Report
Section 1 introduces the importance of expansion joints and bridges and outlines the
various types of joints that can accommodate for a range of movements. This section also
outlines the motivation behind the research and the project objectives. Section 2 presents
the laboratory tests that were conducted to gain a better understanding of the silicone
sealants’ properties under tensile loadings. The tests were designed in such a way to
evaluate the performance of both sealants, with and without the presence of primer and
road salt under controlled curing and accelerated aging. Several experiments are also
outlined in this chapter; these experiments provided scientific information about the foam
sealant. Section 3 describes the field installation phase of the project, where both sealants
(foam and solid) were installed on three in-service bridges throughout the state of
Connecticut. The installation procedure was designed to allow for comparison of the
performance of both sealants in a real-life scenario. Consequently, Section 4 shows the
field-monitoring phase of the project which sheds light on the demands on the sealing
system. A traffic counter was installed on one bridge to determine the vehicular demand
on the joint, and displacement measuring devices were installed on two of the bridges to
assess the movement of the structure itself. Section 5 presents summary, conclusions and
recommendations for future work. Finally, Section 6 presents a list of publications cited
in this document.
12
2.0 LABORATORY TESTING
2.1 Background
Previous experiments conducted by Malla et al. (2005a,b; 2006; 2007; 2011a-d)
included extensive laboratory testing of the foam sealant using the same formulation to
better understand the mechanical behavior of the sealant. Mechanical properties, such as
shear strength and tensile strength, have been assessed, and compared to the
commercially-available solid sealant. Once basic properties were established, a closer
examination of the results showed that the foam sealant typically failed cohesively (i.e.,
ripping of the silicone material) as opposed to the solid sealant, which failed adhesively
(i.e., detachment from the substrate). Results also showed that the foam sealant exhibited
a lower modulus of elasticity while maintaining a comparable ultimate strain capacity.
Because of the lower modulus of elasticity, the ultimate stress capacity was also lower
than that of the solid sealant. Although a lower capacity may not be favorable in civil
engineering materials, the ultimate capacity was achieved at an elongation of
approximately 900%, which is much larger than what an average bridge gap will expand.
2.2 Experimental Motivation
Several state transportation agencies (Illinois and Connecticut, among others)
encourage the application of primer onto the substrate prior to installation of the silicone
sealant, as it promotes a cleaner, oil-free surface onto which the sealant will bond (IL
DOT 2011; Tremco 2014). However, some manufacturers claim that no primer is needed
with their products (WBA 2001; 2008c). Little research has been conducted on the
effectiveness of primer on the adhesion of silicone sealant joint systems, especially in
bridge structure applications. Therefore, the inclusion of primer in laboratory experiments
is of high interest.
In addition to the inclusion of primer, a primary concern for the degradation of
silicone sealant joint systems is the effect of deicing chemicals, which are prevalent in
Connecticut during the winter months. It has been well established that road salt corrodes
and deteriorates concrete and steel. Due to silicone’s excellent chemical resistance,
however, a key aspect of laboratory testing is to determine whether the bond between the
silicone and concrete (typical header material) degrades under the presence of deicing
chemicals such as sodium chloride and magnesium chloride, the two most common
chemicals found on state roads during the winter (CT DOT 2015).
The motivation behind conducting laboratory testing was to observe the behavior of
the foam sealant in contrast to the solid sealant with and without the presence of primer.
Currently, specifications regard primer as being optional but encouraged; the true effect
of the primer, however, is unknown. Therefore, the tension and adhesion test included
specimens containing primer to determine how the sealant bonds to the substrate when
primer is applied. Additionally, the aging experiment contained specimens with primer as
well. A density test was conducted in order to determine the density of the foam sealant,

13
as it is suspected that the foam sealant exhibits a lower density compared to the solid
sealant because of the expansion effect. An expansion test was also conducted in order to
quantify how much the foam sealant expands as a function of initial volume. Finally, a
prototype joint was fabricated to test larger scale mixing and application to prepare for
field installation. The results of all experiments are presented in the following section.
2.3 Overview of Foam Sealant Formulation
A poured silicone sealant expansion joint system previously developed by Malla, et
al., (2005a,b; 2006; 2007; 2011a-d) is considered as a suitable, cost-effective joint sealing
system that allows for a long term sealing solution for smaller movement bridges. The
sealant, termed “foam sealant” herein, comprises of Wabo SiliconeSeal (WBA 2008a), (a
commercial brand commonly used by CT DOT), water, crosslinker (Momentive
Materials) and a platinum catalyst (Gelest 2003).
Without any additives, Wabo SiliconeSeal (termed “solid sealant” herein) produces a
solid, rubber-like material; with the addition of the remaining ingredients, foaming of the
silicone occurs due to the reaction of water with the added hydrosilane, producing silanol
groups and hydrogen gas. As the foam sealant cures over time, the hydrogen gas
produces bubbles within the silicone, while the silanol groups condense and expedite the
polymerization (and, thus, curing) of the material. A schematic of the chemical reaction is
shown in Figure 9.
Figure 9: Schematic of foam sealant reaction (Malla et al. 2007)
The modified formulation produces a foam-like silicone sealant, which has been
observed to expand approximately 70% of its initial volume (Malla et al. 2005, 2006;
2007; Swanson et al. 2013). Previous studies have shown that the foam sealant exhibits a
significantly lower modulus when compared to the commercial (solid) product. This
characteristic is especially important, as it decreases the stresses at the interaction surface
between the bridge header and the sealant, itself, and, thus, reduces the likelihood of
premature adhesive failure.

14
2.4 Mixing Protocol for Experiments
A consistent mixing process was established in order to maintain consistency for all
experiments (ASTM 2009). As with many materials that require mixing, such as
concrete, the quality of the sealant often depends on the skill and experience of the user.
Therefore, several trial mixes were conducted prior to the actual experiments to establish
a feel for the material and produce the same consistency of material for each subsequent
mix. Before beginning the mixing process, all components listed in Table 2 were weighed
out by mass and placed aside to minimize wasted time between adding ingredients
(Figure 10). A mixing paddle was used to stir all ingredients together as outlined by the
Watson Bowman specifications for mixing their commercial sealant. First, Wabo White
(part A) and Wabo Grey (part B) were combined and mixed until a thorough consistency
was achieved. Next, platinum catalyst was slowly added, followed by water. These
components were added while continuously stirring the sealant. Once the added
components were mixed in with the sealant, the crosslinker was added to initiate the
chemical reaction. Mixing continued until the entire mixture exhibited a uniform texture.
Table 2: Mix proportions for foam sealant
Component Density (g/cm3) Percent Volume (%)
Wabo White (A) 1.08 54.43
Wabo Grey (B) 1.45 40.54
Crosslinker 0.98 2.77
Water 1 1.8
Platinum Catalyst 0.98 0.46
Figure 10: (Left to right) Wabo, crosslinker, water, platinum
A consistent mixing procedure is important, especially because a small deviation in
quantities added or mixing technique can alter the properties of the foam sealant. Care
was also taken to mix enough material to ensure the same batch of material was used for
15
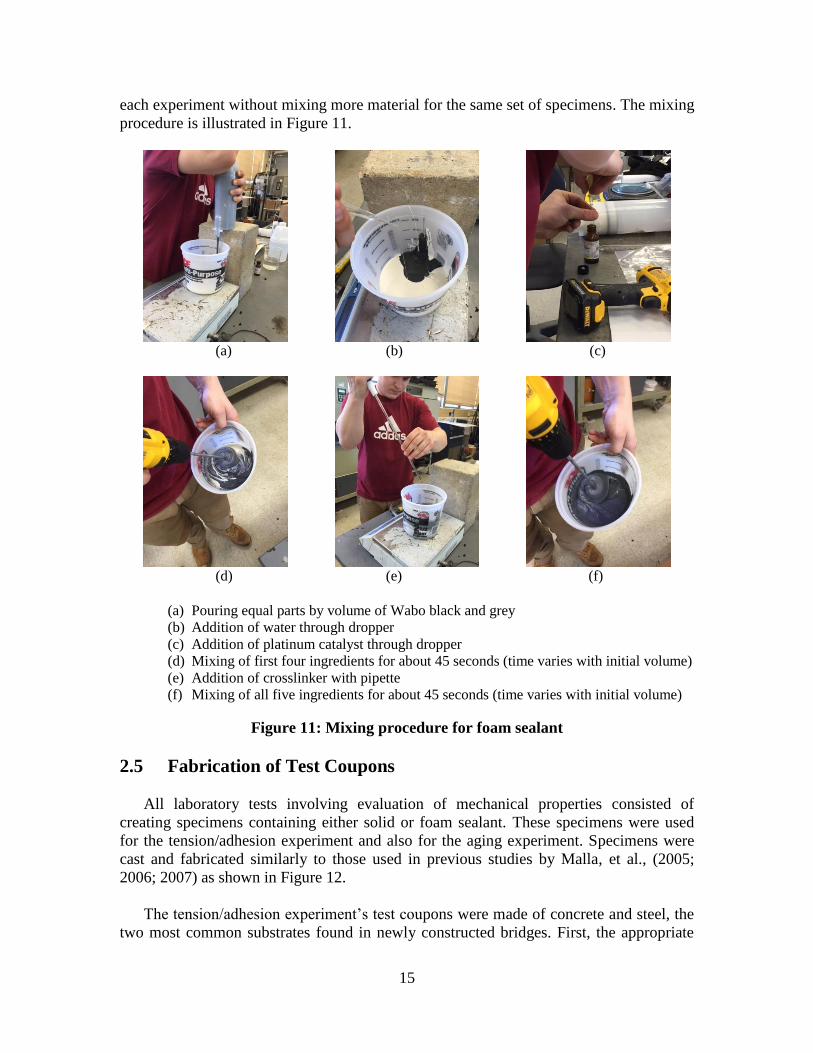
each experiment without mixing more material for the same set of specimens. The mixing
procedure is illustrated in Figure 11.
(a) (b) (c)
(d) (e) (f)
(a) Pouring equal parts by volume of Wabo black and grey
(b) Addition of water through dropper
(c) Addition of platinum catalyst through dropper
(d) Mixing of first four ingredients for about 45 seconds (time varies with initial volume)
(e) Addition of crosslinker with pipette
(f) Mixing of all five ingredients for about 45 seconds (time varies with initial volume)
Figure 11: Mixing procedure for foam sealant
2.5 Fabrication of Test Coupons
All laboratory tests involving evaluation of mechanical properties consisted of
creating specimens containing either solid or foam sealant. These specimens were used
for the tension/adhesion experiment and also for the aging experiment. Specimens were
cast and fabricated similarly to those used in previous studies by Malla, et al., (2005;
2006; 2007) as shown in Figure 12.
The tension/adhesion experiment’s test coupons were made of concrete and steel, the
two most common substrates found in newly constructed bridges. First, the appropriate

16
materials were obtained to adequately replicate those present in the field. With the
assistance of CT DOT, a large piece of concrete was salvaged from a local bridge
undergoing replacement. This was done to reflect the type of concrete in joint headers,
typically found throughout the state. Steel was also obtained with the assistance from
UConn’s Civil Engineering machine shop. Blocks were fabricated using typical A36
steel, the material commonly found at the joints of bridge decks with angle headers. Each
specimen contained a 12.7 x 50.8 x 12.7 mm (0.5 x 2 x 0.5 in.) volume of sealant applied
in between two substrate blocks measuring 76 x 50.8 x 12.7 mm (3 x 2 x 0.5 in.)
(LxWxH).
Figure 12: Fabrication of coupons for experimental testing
The substrate chosen for specimens in the aging experiment was a polymer modified
concrete (WaboCrete II), selected specifically because of its common use in bridge
header repair throughout the state of Connecticut. This concrete mix, manufactured by
Watson Bowman Acme Corporation (WBA 2008b), is composed of three components:
the activator (part A), the resin (part B), and the aggregate. The aggregate contains a
particle size distribution between 0.08 and 15 mm, having 30-65% passing through a 2-
mm screen, 12-15% passing through a 0.08-mm screen, and 100% passing through a 15-
mm screen. Per manufacturer specifications, the resin was premixed separately for about
20 seconds before being mixed with the activator in a 5-gallon bucket for approximately
30 seconds. The aggregate was then added until every particle was coated in the mixture.
Once all specimens were cast, they were left to cure at room temperature (23 ± 2⁰C) for
14 days as shown in Figure 13. Upon full curing, the blocks were cut into coupons to
create test specimens, as shown in Figure 14.
17
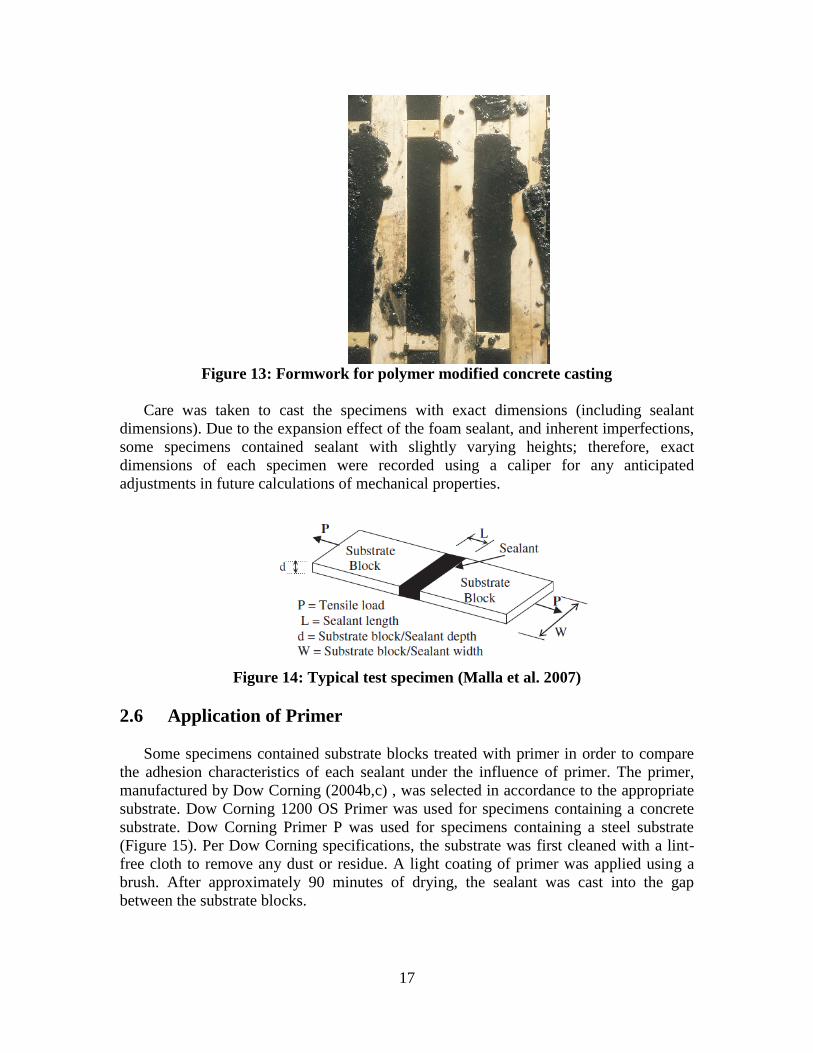
Figure 13: Formwork for polymer modified concrete casting
Care was taken to cast the specimens with exact dimensions (including sealant
dimensions). Due to the expansion effect of the foam sealant, and inherent imperfections,
some specimens contained sealant with slightly varying heights; therefore, exact
dimensions of each specimen were recorded using a caliper for any anticipated
adjustments in future calculations of mechanical properties.
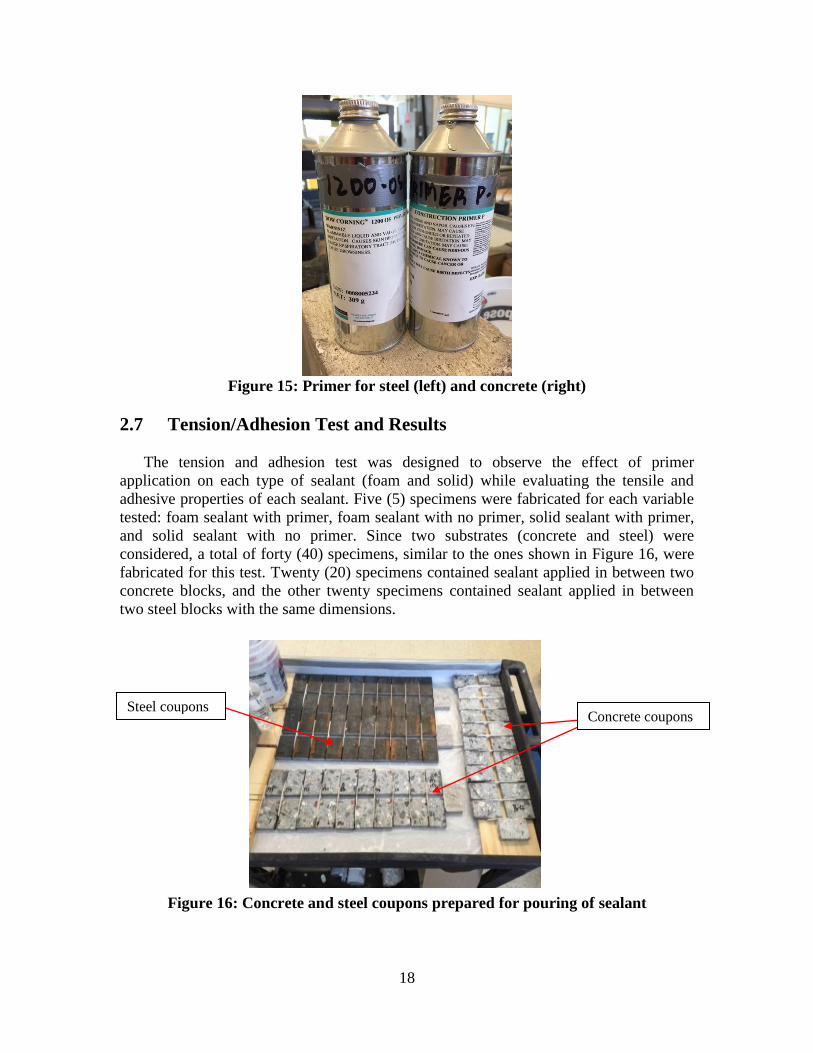
Figure 14: Typical test specimen (Malla et al. 2007)
2.6 Application of Primer
Some specimens contained substrate blocks treated with primer in order to compare
the adhesion characteristics of each sealant under the influence of primer. The primer,
manufactured by Dow Corning (2004b,c) , was selected in accordance to the appropriate
substrate. Dow Corning 1200 OS Primer was used for specimens containing a concrete
substrate. Dow Corning Primer P was used for specimens containing a steel substrate
(Figure 15). Per Dow Corning specifications, the substrate was first cleaned with a lint-
free cloth to remove any dust or residue. A light coating of primer was applied using a
brush. After approximately 90 minutes of drying, the sealant was cast into the gap
between the substrate blocks.
18
Figure 15: Primer for steel (left) and concrete (right)
2.7 Tension/Adhesion Test and Results
The tension and adhesion test was designed to observe the effect of primer
application on each type of sealant (foam and solid) while evaluating the tensile and
adhesive properties of each sealant. Five (5) specimens were fabricated for each variable
tested: foam sealant with primer, foam sealant with no primer, solid sealant with primer,
and solid sealant with no primer. Since two substrates (concrete and steel) were
considered, a total of forty (40) specimens, similar to the ones shown in Figure 16, were
fabricated for this test. Twenty (20) specimens contained sealant applied in between two
concrete blocks, and the other twenty specimens contained sealant applied in between
two steel blocks with the same dimensions.
Figure 16: Concrete and steel coupons prepared for pouring of sealant
Concrete coupons Steel coupons

19
Upon casting, all forty specimens cured at room temperature (23 ± 2⁰C) for 14 days.
Upon completion of curing, each specimen was labeled and installed at random onto an
Intron Model 1011 tensile tester and pulled until failure. Loads were measured using a
500-N (100-lb.) load cell. The testing procedure was modeled on specifications outlined
by ASTM C1135-00, Standard Test Method for Determining Tensile Adhesion Properties
of Structural Sealants (ASTM 2000). As shown in Figure 17, both substrate blocks were
gripped using the mechanical clamps attached to the machine. The lower end of the
specimen’s concrete block was fixed while the other concrete block was extended at a
rate of 10 mm/min. Using displacement control, the machine recorded the tensile force
required to extend the specimen over a specific displacement. From this data, stress and
strain information was extracted and computed.
Figure 17: Tensile testing using Instron machine
After testing five specimens per variable for each substrate (concrete and steel), both
results revealed the foam sealant has a lower tensile modulus (compare Figures 18 and
19). In addition, Figures 18 and 19 show that ultimate stresses and strains for specimens
containing foam sealant were lower than those containing solid sealant. Specifically,
specimens containing foam sealant exhibited an average ultimate stress of 155 kPa while
maintaining an average ultimate strain of 922.5%. Meanwhile, the solid sealant exhibited
an average ultimate stress of 312 kPa with a corresponding average ultimate strain of
1027%. While the foam sealant showed a smaller average strain, the corresponding
ultimate stress is about 49% of the solid sealant’s ultimate stress capacity. Although
typical civil engineering materials are characterized by their ultimate capacity, this
reduction in ultimate stress is actually favorable for reducing the stresses at the interface
of the silicone sealant and the bridge header. There was no significant difference
observed in maximum stress or strain properties of the specimens between steel and
concrete substrates.
Fixed
end
Extended end
Stretched sealant

20
Figure 18: Results for specimens containing foam sealant, steel substrate (top) and
foam sealant, concrete substrate (bottom)
The key characteristic that can be taken from this experiment is the failure mode of
each specimen. Figures 18 and 19 show the stress vs. strain curves of each specimen;
although the strain ranges are comparable, and an obvious reduction in modulus is
observed in the specimens containing foam sealant, all solid sealant specimens exhibited
an adhesive failure, while the foam sealant specimens failed via cohesive failure.
Adhesive failure is characterized by detachment of the sealant from the substrate prior to
material failure. Cohesive failure, on the other hand, pertains to ripping or shearing of the
silicone material itself while maintaining its attachment to the substrate. Both failure
modes can be observed in Figures 18 and 19, as a cohesive failure is characterized by a
smooth, rolling peak as the stress approaches its ultimate limit state. Adhesive
detachment, however, can be seen when the stress peak sharply drops, indicating a
sudden failure under tension. Cohesive failure was observed in 100% of the specimens
containing foam sealant for both substrates (concrete and steel). For specimens
containing solid sealant, however, 90% of the specimens failed via adhesive failure.
Figures 20-23 show the specimens post failure.
21
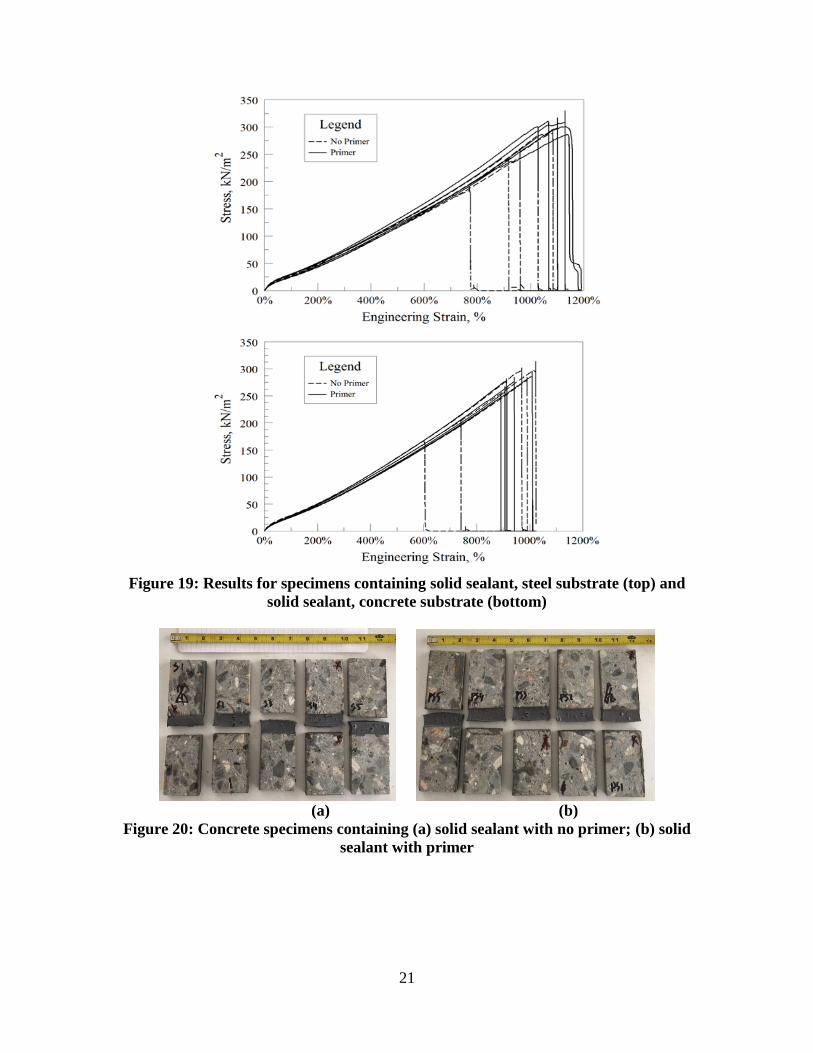
Figure 19: Results for specimens containing solid sealant, steel substrate (top) and
solid sealant, concrete substrate (bottom)
(a) (b)
Figure 20: Concrete specimens containing (a) solid sealant with no primer; (b) solid
sealant with primer

22
(a) (b)
Figure 21: Steel specimens containing (a) solid sealant with no primer; (b) solid
sealant with primer
(a) (b)
Figure 22: Concrete specimens containing (a) foam sealant with no primer; (b) foam
sealant with primer
(a) (b)
Figure 23: Steel specimens containing (a) foam sealant with no primer; (b) foam
sealant with primer
The failure modes for specimens treated with primer were very similar for those that
were not treated. When primer was applied to solid specimens, 20% of them failed via
cohesive failure, while 80% still failed by means of detachment from the substrate.
Although primer was applied, the conclusion that primer improves bonding of the sealant
to the substrate cannot be made from these results. Specimens containing foam sealant

23
and primer still exhibited excellent bond as all specimens failed cohesively, as expected.
The breakdown of average ultimate stress, average ultimate strain, average modulus at
100% strain, and failure mode fraction is shown in Table 3. Figures 24-25 show a
graphical comparison of average ultimate stress for each substrate.
Table 3: Results for tension/adhesion test
Substrate Sealant
Type
Primer
Presence
Average
Ultimate
Stress (kPa)
Average
Ultimate
Strain (%)
Average
Modulus at
100%
Strain (kPa)
Failure Mode
Cohesive Adhesive
Concrete Foam Yes 161 906 16.06 5 0
Foam No 158 952 19.62 5 0
Solid Yes 318 933 24.1 0 5
Solid No 246 866 26.6 0 5
Steel Foam Yes 149 939 16.81 2 3
Foam No 164 998 17.01 0 5
Solid Yes 306 1121 28.38 5 0
Solid No 265 953 28.03 5 0
Figure 24: Average ultimate stress for specimens with a concrete substrate
24
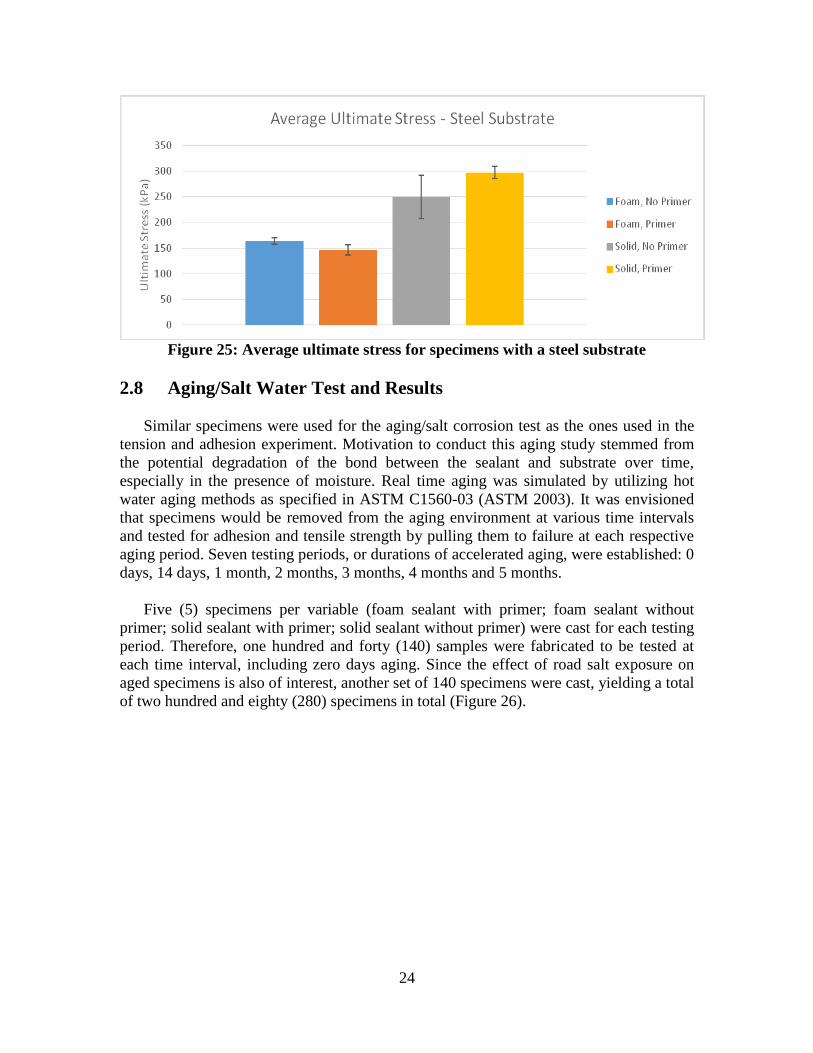
Figure 25: Average ultimate stress for specimens with a steel substrate
2.8 Aging/Salt Water Test and Results
Similar specimens were used for the aging/salt corrosion test as the ones used in the
tension and adhesion experiment. Motivation to conduct this aging study stemmed from
the potential degradation of the bond between the sealant and substrate over time,
especially in the presence of moisture. Real time aging was simulated by utilizing hot
water aging methods as specified in ASTM C1560-03 (ASTM 2003). It was envisioned
that specimens would be removed from the aging environment at various time intervals
and tested for adhesion and tensile strength by pulling them to failure at each respective
aging period. Seven testing periods, or durations of accelerated aging, were established: 0
days, 14 days, 1 month, 2 months, 3 months, 4 months and 5 months.
Five (5) specimens per variable (foam sealant with primer; foam sealant without
primer; solid sealant with primer; solid sealant without primer) were cast for each testing
period. Therefore, one hundred and forty (140) samples were fabricated to be tested at
each time interval, including zero days aging. Since the effect of road salt exposure on
aged specimens is also of interest, another set of 140 specimens were cast, yielding a total
of two hundred and eighty (280) specimens in total (Figure 26).

25
Figure 26: Curing of sealant specimens with concrete substrate for aging
experiment
Each tank was heated to 95 F (35 C) using a 400-W submersible water heater with a
sensor and activator. The temperature for both tanks was kept to a strict deviation
tolerance of ± 1 F(± 0.55 C). Temperature profiles of each tank were recorded regularly
(Figure 27). The low temperature in each tank observed on day 10 was due to a power
outage of the building in which the tanks were located; however, power was restored
within 6 hours and the target temperature was regained shortly afterwards.
Figure 27: Temperature profile of water tanks
One tank contained water with no additives and the other tank contained a saturated
solution of water mixed with sodium chloride and magnesium chloride. This
experimental design enabled for observation of the effects of aging and also the effects of
26
aging with the influence of road salt. Concentrations of sodium chloride and magnesium
chloride per total solution volume were 38.72% and 2.03%, respectively. These
proportions are specified by CT DOT as mandatory minimum dispensing ratios for
chemical treatment of state roads (CT DOT 2015). After thorough mixing, the pH of the
solution was measured to be 8.52.
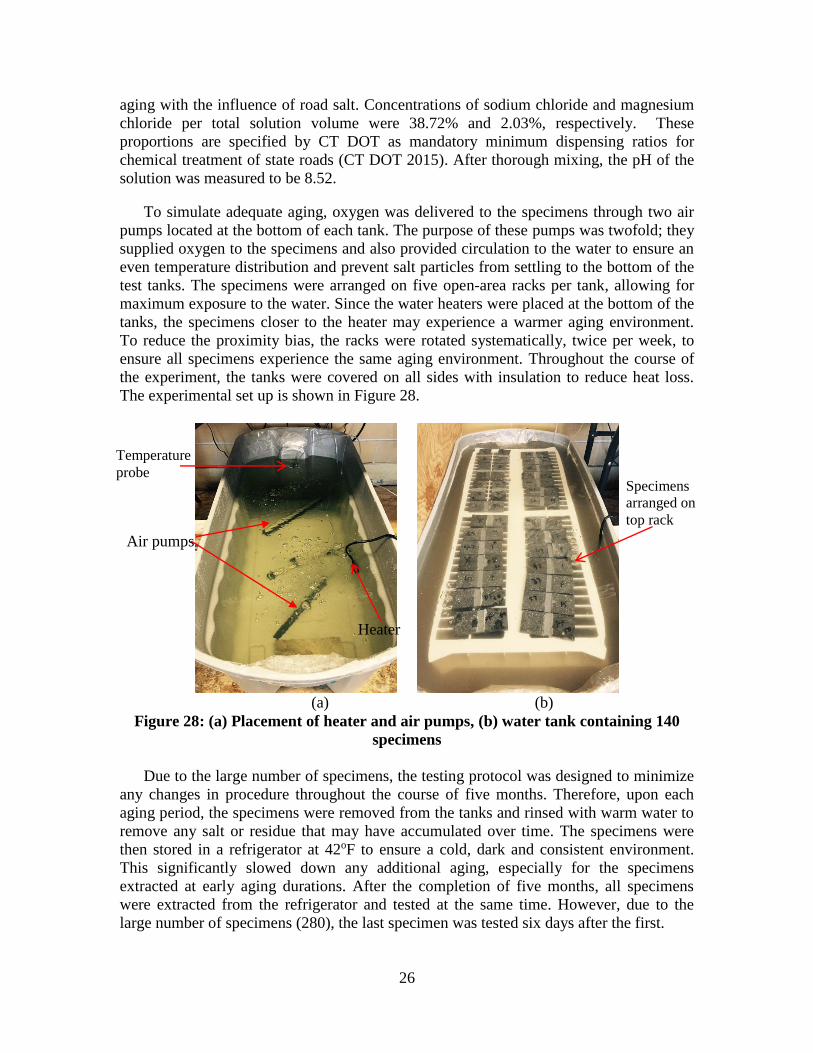
To simulate adequate aging, oxygen was delivered to the specimens through two air
pumps located at the bottom of each tank. The purpose of these pumps was twofold; they
supplied oxygen to the specimens and also provided circulation to the water to ensure an
even temperature distribution and prevent salt particles from settling to the bottom of the
test tanks. The specimens were arranged on five open-area racks per tank, allowing for
maximum exposure to the water. Since the water heaters were placed at the bottom of the
tanks, the specimens closer to the heater may experience a warmer aging environment.
To reduce the proximity bias, the racks were rotated systematically, twice per week, to
ensure all specimens experience the same aging environment. Throughout the course of
the experiment, the tanks were covered on all sides with insulation to reduce heat loss.
The experimental set up is shown in Figure 28.
(a) (b)
Figure 28: (a) Placement of heater and air pumps, (b) water tank containing 140
specimens
Due to the large number of specimens, the testing protocol was designed to minimize
any changes in procedure throughout the course of five months. Therefore, upon each
aging period, the specimens were removed from the tanks and rinsed with warm water to
remove any salt or residue that may have accumulated over time. The specimens were
then stored in a refrigerator at 42oF to ensure a cold, dark and consistent environment.
This significantly slowed down any additional aging, especially for the specimens
extracted at early aging durations. After the completion of five months, all specimens
were extracted from the refrigerator and tested at the same time. However, due to the
large number of specimens (280), the last specimen was tested six days after the first.
Heater
Specimens
arranged on
top rack
Temperature
probe
Air pumps

27
Upon extraction from the refrigerator, the specimens were labeled according to a
random number generator. These numbers represented the order in which they would be
tested (this minimized the bias in testing certain types of specimens before others). Since
there were a large number of specimens, this also ensured that the testing procedure was
not different for a specific bundle of specimens than for others.
The testing procedure was based on ASTM C1135 Standard Test Method for
Determining Tensile Adhesion Properties of Structural Sealants (ASTM 2000). However,
the procedure deviated slightly from the specified standard because a lower rate of
extension was implemented (10 mm/min instead of 50 mm/min). Similar to the
tension/adhesion test, the specimens were installed onto the Instron model 1011 (Instron
2010) and, using a 1000-pound load cell, pulled to failure. Because of the shape and
dimensions of the substrate blocks (the dimensions of the substrate blocks exactly
matched the dimensions of the grips of the Instron machine), the specimens were
mounted in the same way for each test. This was important, as a slight angle in mounting
would have an important effect on the measured values.
Inherent imperfections existed within each specimen due to slightly varying
thicknesses of sealant. This was also because of the expansion of the sealant, which
varies depending on the thickness of the initial layer. To account for this in future
calculations, the thickness of each specimen was measured using a digital caliper and
recorded for future adjustments. Per ASTM standards for tensile testing of structural
sealants (ASTM 2000), the mode of failure, ultimate extension, and ultimate force were
recorded upon failure. From these results, stress and strain properties were calculated and
tabulated (Kruszewski 2016). The test setup is shown in Figure 29.
Figure 29: Experimental setup containing Instron machine and data acquisition
system
Instron machine
used for tension
testing
Computer used for
data acquisition

28
(a) (b)
Figure 30: Condition of extended specimens containing (a) foam sealant and (b)
solid sealant
Figure 30 shows the extent of the air pockets formed for specimens containing foam
(compared to the containing solid sealant). A common observation among foam
specimens was that the cohesive mode of failure initiated at regions where large air
pockets were stretched. Upon further stretching, these air pockets began to tear
longitudinally, creating weak points in the structure of the sealant. Upon even further
extension, the sealant grew thin and eventually yielded, creating a hole in the sealant.
Once this hole developed, the remaining sections of the sealant were forced to resist
further stretching with a smaller area of sealant. Additionally, stress concentrations were
created around the hole where the sealant initially ripped. These regions also began to
slowly tear longitudinally, eventually ripping the entire cross sectional area (resulting in a
cohesive failure).
The most common failure mode of the solid sealant involved a sudden adhesive
failure, characterized by a detachment of the sealant from the substrate. Typically, the
sealant detached at one edge of the substrate block and followed through the entire
surface area. This indicated that upon an initial detachment, the remaining area of sealant
in contact with the substrate block could not handle the added stress and released from
the block. Figures 31-34 show the ultimate stress (stress at failure) for all specimens.
One of the most important factors included in this study was the effect of accelerated
aging on the modulus of each sealant. Figures 35-38 show the modulus, stress at 100%
strain (which is a common property when assessing the strength of the sealant, since a
100% extension of a joint gap can occur on a bridge).
Figure 31 shows the ultimate stress values for specimens exposed to salt and primer
treatment. It can be observed that, over the span of 150 days, the stress at failure for both
the foam and solid sealants reduced, indicating a possible reduction in modulus. This may
be attributed to the salt deteriorating the bond between the sealant and the substrate
blocks. Overall, the foam sealant’s ultimate stress values were more consistent, whereas
Foam
Sealant
Solid
Sealant
29
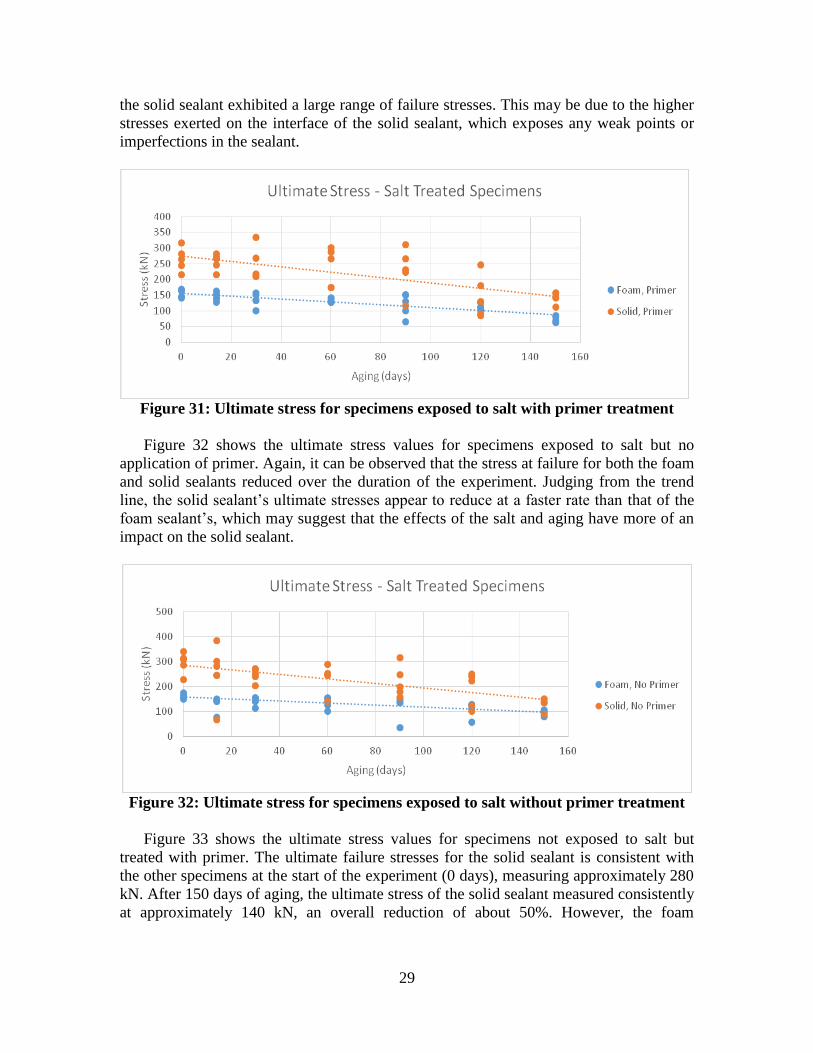
the solid sealant exhibited a large range of failure stresses. This may be due to the higher
stresses exerted on the interface of the solid sealant, which exposes any weak points or
imperfections in the sealant.
Figure 31: Ultimate stress for specimens exposed to salt with primer treatment
Figure 32 shows the ultimate stress values for specimens exposed to salt but no
application of primer. Again, it can be observed that the stress at failure for both the foam
and solid sealants reduced over the duration of the experiment. Judging from the trend
line, the solid sealant’s ultimate stresses appear to reduce at a faster rate than that of the
foam sealant’s, which may suggest that the effects of the salt and aging have more of an
impact on the solid sealant.
Figure 32: Ultimate stress for specimens exposed to salt without primer treatment
Figure 33 shows the ultimate stress values for specimens not exposed to salt but
treated with primer. The ultimate failure stresses for the solid sealant is consistent with
the other specimens at the start of the experiment (0 days), measuring approximately 280
kN. After 150 days of aging, the ultimate stress of the solid sealant measured consistently
at approximately 140 kN, an overall reduction of about 50%. However, the foam

30
sealant’s stress at failure dropped approximately 33% over the same time period and
aging conditions.
Figure 33: Ultimate stress for specimens not exposed to salt with primer treatment
Figure 34 shows the ultimate stress values for specimens not exposed to salt and also
not treated with primer. The ultimate failure stresses are consistent with the previous
results. Again, the solid sealant exhibits a sharper decline in tensile capacity, indicating
its vulnerability to aging itself. At 0 days, the solid sealant’s failure stress was (on
average) approximately 290 kN, dropping to about 140 kN after 150 days of aging with
no salt or primer. The foam sealant’s capacity dropped from about 160 kN at 0 days to
just below 100 kN after 150 days of aging.
Figure 34: Ultimate stress for specimens not exposed to salt and with no primer
treatment
From Figure 35, it can be observed that the modulus of the solid sealant decreases at a
higher rate when exposed to salt water aging. The stress at 100% strain of specimens
containing primer at 0 days (no aging) was measured to be approximately 39 kN. Over an
aging period of 5 months, however, the stress dropped to about 21.5 kN, a reduction of
44.9%. The foam sealant, however, exhibited a more consistent modulus throughout the
course of aging. The initial stress at 100% strain was observed to be about 26.9 kN,
31
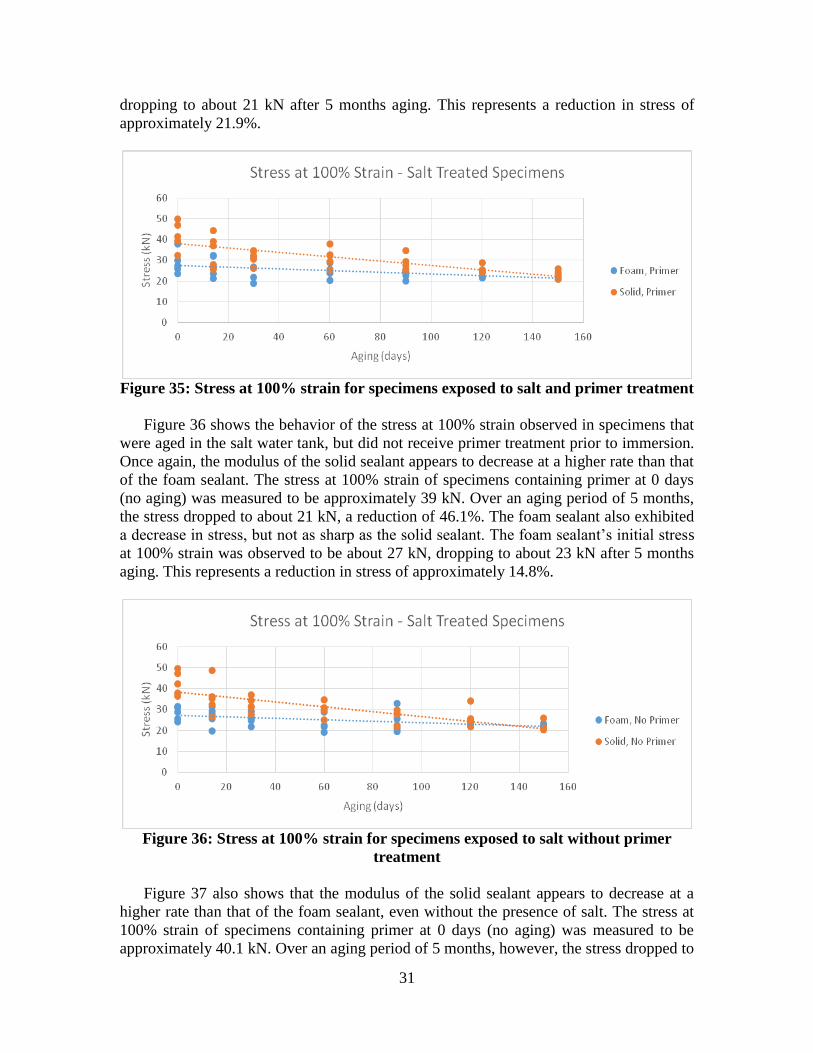
dropping to about 21 kN after 5 months aging. This represents a reduction in stress of
approximately 21.9%.
Figure 35: Stress at 100% strain for specimens exposed to salt and primer treatment
Figure 36 shows the behavior of the stress at 100% strain observed in specimens that
were aged in the salt water tank, but did not receive primer treatment prior to immersion.
Once again, the modulus of the solid sealant appears to decrease at a higher rate than that
of the foam sealant. The stress at 100% strain of specimens containing primer at 0 days
(no aging) was measured to be approximately 39 kN. Over an aging period of 5 months,
the stress dropped to about 21 kN, a reduction of 46.1%. The foam sealant also exhibited
a decrease in stress, but not as sharp as the solid sealant. The foam sealant’s initial stress
at 100% strain was observed to be about 27 kN, dropping to about 23 kN after 5 months
aging. This represents a reduction in stress of approximately 14.8%.
Figure 36: Stress at 100% strain for specimens exposed to salt without primer
treatment
Figure 37 also shows that the modulus of the solid sealant appears to decrease at a
higher rate than that of the foam sealant, even without the presence of salt. The stress at
100% strain of specimens containing primer at 0 days (no aging) was measured to be
approximately 40.1 kN. Over an aging period of 5 months, however, the stress dropped to

32
about 23.5 kN, a reduction of 41.4%. The foam sealant, however, exhibited a more
consistent modulus throughout the course of aging. The initial stress at 100% strain was
observed to be about 26.9 kN, dropping to about 21 kN after 5 months aging. This
represents a reduction in stress of approximately 21.9%.
Figure 37: Stress at 100% strain for specimens not exposed to salt and with primer
treatment
Figure 38 shows the stress at 100% strain for specimens not exposed to salt or treated
with primer. Again, it can be observed that the stress at 100% strain drastically reduces
after 150 days of aging, even to the point where the foam and solid stresses at 100%
strain are almost equal at 150 days. Although the foam sealant also exhibits a reduction in
stress at 100% strain as a function of aging, the drop is not as significant.
Figure 38: Stress at 100% Strain for specimens not exposed to salt and with no
primer treatment
Figure 39 shows the ultimate elongation of the specimens treated with salt, but not
with primer. It can be observed that the average elongation for the solid sealant appears to
be almost the same over time, judging by the trendline. However, the foam sealant’s
elongation tends to increase over time, possibly suggesting a reduction in stiffness (and
therefore an increase in ductility).
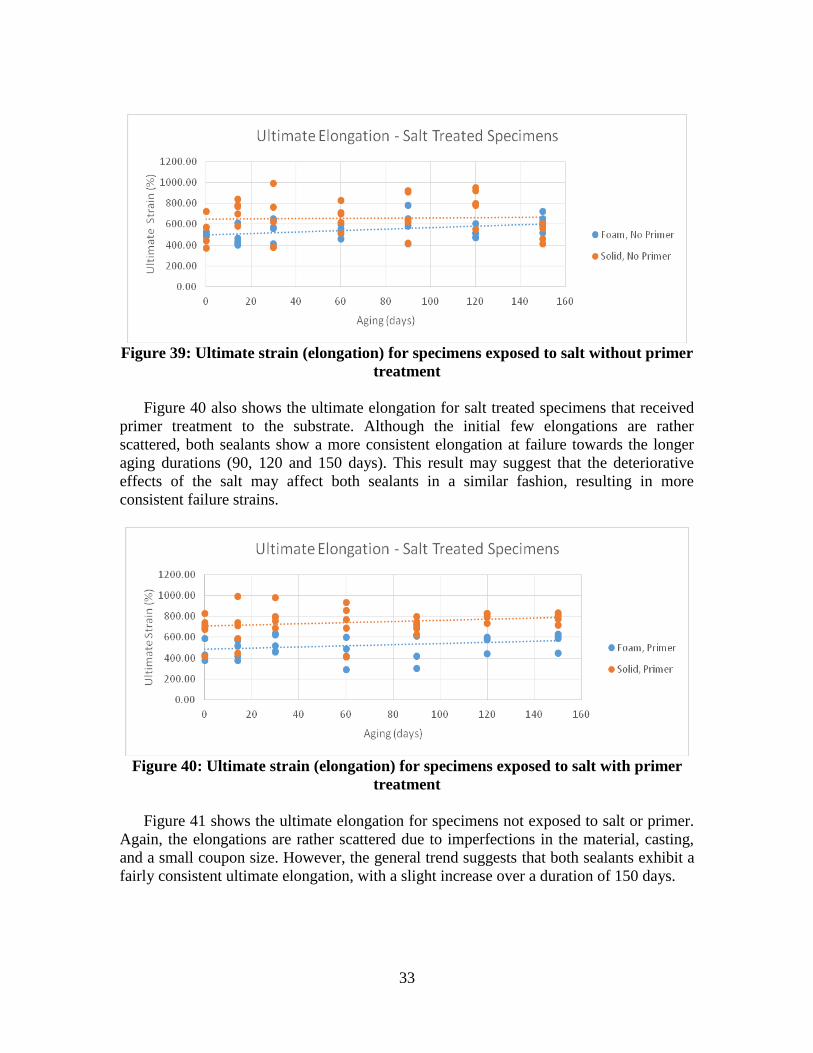
33
Figure 39: Ultimate strain (elongation) for specimens exposed to salt without primer
treatment
Figure 40 also shows the ultimate elongation for salt treated specimens that received
primer treatment to the substrate. Although the initial few elongations are rather
scattered, both sealants show a more consistent elongation at failure towards the longer
aging durations (90, 120 and 150 days). This result may suggest that the deteriorative
effects of the salt may affect both sealants in a similar fashion, resulting in more
consistent failure strains.
Figure 40: Ultimate strain (elongation) for specimens exposed to salt with primer
treatment
Figure 41 shows the ultimate elongation for specimens not exposed to salt or primer.
Again, the elongations are rather scattered due to imperfections in the material, casting,
and a small coupon size. However, the general trend suggests that both sealants exhibit a
fairly consistent ultimate elongation, with a slight increase over a duration of 150 days.
34
Figure 41: Ultimate strain (elongation) for specimens not exposed to salt and with
no primer treatment
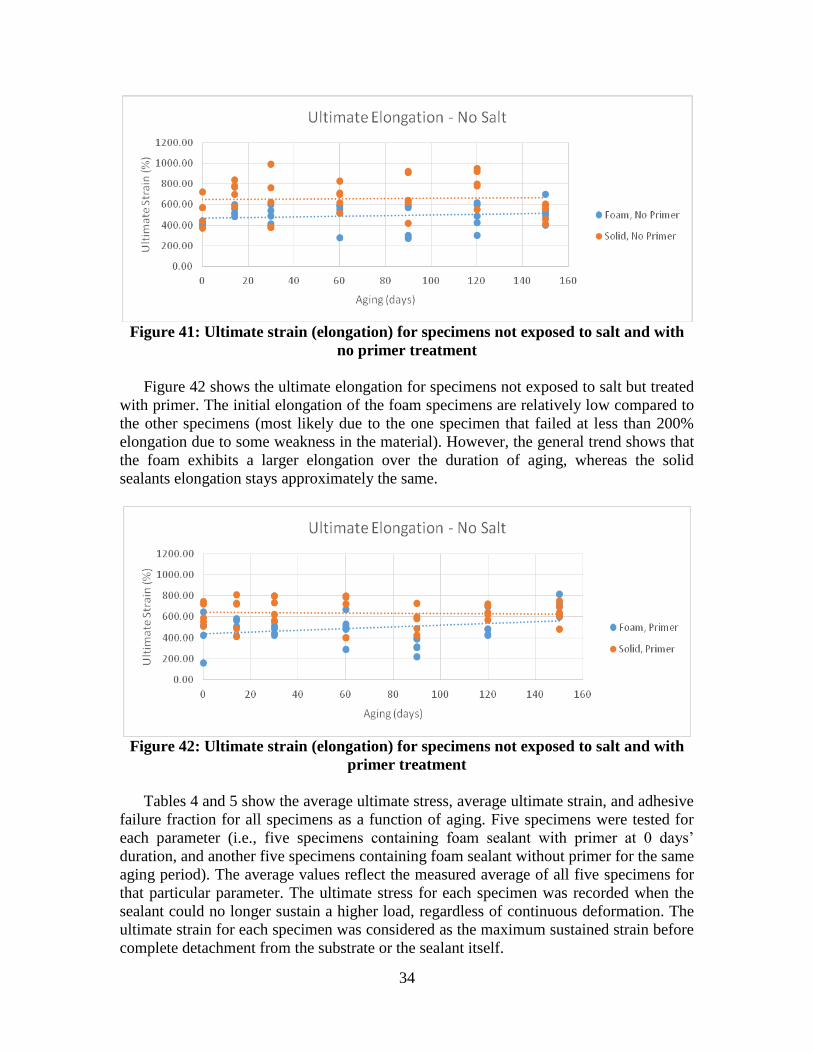
Figure 42 shows the ultimate elongation for specimens not exposed to salt but treated
with primer. The initial elongation of the foam specimens are relatively low compared to
the other specimens (most likely due to the one specimen that failed at less than 200%
elongation due to some weakness in the material). However, the general trend shows that
the foam exhibits a larger elongation over the duration of aging, whereas the solid
sealants elongation stays approximately the same.
Figure 42: Ultimate strain (elongation) for specimens not exposed to salt and with
primer treatment
Tables 4 and 5 show the average ultimate stress, average ultimate strain, and adhesive
failure fraction for all specimens as a function of aging. Five specimens were tested for
each parameter (i.e., five specimens containing foam sealant with primer at 0 days’
duration, and another five specimens containing foam sealant without primer for the same
aging period). The average values reflect the measured average of all five specimens for
that particular parameter. The ultimate stress for each specimen was recorded when the
sealant could no longer sustain a higher load, regardless of continuous deformation. The
ultimate strain for each specimen was considered as the maximum sustained strain before
complete detachment from the substrate or the sealant itself.

35
Table 4: Saltwater aging test – average ultimate stresses and strains (salt treated
specimens)
Salt Treated Specimens
Age
(days) Sealant
Type Surface Prep
Average Ultimate
Stress (kPa) Average Ultimate
Strain (%)
Adhesive
Failure Mode
(%)
0
Foam Primer 157a ± 9.6b 501 ± 130.7 20
No Primer 159 ± 8.2 504 ± 20.74 20
Solid Primer 264 ± 30.6 676 ± 154 100
No Primer 295 ± 33.4 679 ± 90.58 100
14
Foam Primer 144 ± 11 493 ± 91.9 20
No Primer 152 ± 48 464 ± 85.4 0
Solid Primer 256 ± 21.2 695 ± 200.9 100
No Primer 255 ± 94 522 ± 159.2 100
30
Foam Primer 135 ± 17.8 539 ± 83.6 20
No Primer 141 ± 13.2 565 ± 95.1 0
Solid Primer 248 ± 43.2 803 ± 108.7 100
No Primer 247 ± 21.6 380 ± 117.2 100
60
Foam Primer 134 ± 5 443 ± 113.5 0
No Primer 134 ± 17.6 528 ± 51.6 0
Solid Primer 240 ± 49.4 730 ± 200.8 100
No Primer 234 ± 44.8 731 ± 200.7 80
90
Foam Primer 119 ± 29.8 534 ± 169.9 0
No Primer 120 ± 38.4 614 ± 132.8 0
Solid Primer 229 ± 58 709 ± 67.8 80
No Primer 219 ± 50.2 485 ± 67.6 80
120
Foam Primer 115 ± 8.8 558 ± 66.5 0
No Primer 109 ± 24.2 516 ± 54.2 0
Solid Primer 146 ± 54.4 800 ± 39.5 60
No Primer 187 ± 55.8 527 ± 193.9 80
150
Foam Primer 72 ± 7.8 579 ± 74.0 0
No Primer 95 ± 9 621 ± 73.8 0
Solid Primer 142 ± 14 790 ± 47.4 80
No Primer 131 ± 19.4 751 ± 95.8 80 aAverage of five samples tested (complete specimen information found in Appendix A) b 95% confidence interval for the average

36
Table 5: Saltwater aging test – average ultimate stresses and strains (non-salt
treated specimens)
Non-Salt Treated Specimens
Age
(days) Sealant
Type Surface Prep
Average Ultimate
Stress (kPa)
Average
Ultimate Strain
(%)
Adhesive
Failure Mode
(%)
0
Foam Primer 158a ±7.6b 451 ± 180.6 0
No Primer 170 ±4 407 ± 22.2 20
Solid Primer 282 ±33.2 623 ± 105 100
No Primer 297 ±27 534 ± 135.1 100
14
Foam Primer 154 ±9 512 ± 66.9 0
No Primer 143 ±30.8 534 ± 46.6 20
Solid Primer 248 ±58.4 634 ± 168.9 100
No Primer 249 ±19 734 ± 99.4 100
30
Foam Primer 138 ±13 483 ± 51.1 0
No Primer 136 ±21.2 486 ± 87.9 0
Solid Primer 247 ±12 702 ± 105.2 100
No Primer 241 ±23.8 629 ± 259.9 100
60
Foam Primer 133 ±12.4 496 ± 136.3 0
No Primer 127 ±6.2 505 ± 128.9 0
Solid Primer 235 ±47.2 621 ± 203.8 100
No Primer 241 ±29.6 674 ± 117.3 100
90
Foam Primer 116±8 325 ± 73.31 0
No Primer 123 ±21.8 463 ± 163.0 0
Solid Primer 222 ±75.8 565 ± 116.0 100
No Primer 199 ±21.2 702 ± 213.0 100
120
Foam Primer 105 ±2 504 ± 112.9 0
No Primer 107 ±6.4 485 ± 130.8 0
Solid Primer 168 ±43.6 653 ± 62.4 80
No Primer 194 ±40.2 800 ± 157.9 100
150
Foam Primer 95 ±1.8 691 ± 83.9 0
No Primer 90 ±23.2 530 ± 109.1 0
Solid Primer 128 ±7.6 636 ± 102.6 80
No Primer 106 ±30.2 525 ± 85.6 80 aAverage of five samples tested b 95% confidence interval for the average
In order to investigate the effect of each individual parameter (salt, primer
application, foam, and age) on the ultimate stress, ultimate strain, stress at 100% strain
and adhesive failure fraction, a multi-parameter linear model was applied to the entire

37
data set using PSI-Plot (PSI-Plot 2015). In spite of being linear, a non-linear fitting
method, the Levenberg-Maquardt LSQ method (Lourakis 2005), was used as the software
was more convenient. Each parameter that influenced the specimens was assigned a
variable, which was multiplied by a “parameter term” which defines how significant that
parameter is. Variables such as x1, x2, x3, and x4 were used for salt, primer, foam, and
age, respectively. All results were tabulated according to age and each specimen was
coded using a binary system. For example, a specimen containing foam exposed to salt,
aging, and primer application would be identified as x1 = 1, x2 = 1, x3 = 1, and x4 ranging
from -3 to 3 to define all seven aging periods. The aging parameter was set from -3 to 3,
so that the model would intercept 0 at 2 months aging. When solid sealant was used, x3
was set to 0. This terminology allowed for including the global effect of all parameters
when using the fitting model, shown below.
(2)
The model also included terms for interaction between two or more parameters, since
specimens exposed to salt and age may have performed differently than specimens
exposed to just aging. These parameters, for example, are defined by x12, which would
represent the interaction between salt and primer application. The parameter values,
labeled as a0, a1, etc., were generated once the model was run. All parameter and
interaction terms are defined in Table 6.
Table 6: Parameter and interaction terms for LSQ model
Variable Parameter Interaction
x1 Salt --
x2 Primer --
x3 Sealant --
x4 Age --
a12 -- Salt and Primer
a13 -- Salt and Sealant
a14 -- Salt and Age
a23 -- Primer and Sealant
a24 -- Primer and Age
a34 -- Sealant and Age
The model provided parameters values and invariant 95% confidence intervals, which
were used to generate p-values. These p-values indicate the probability of error in
rejecting the null hypothesis, i.e., the factor (aging time, salt concentration, etc.) is not
significant. P-values less than 0.05 were considered to be an acceptable threshold of
reliability for this study.

38
As expected, the specimens with foam sealant instead of solid sealant had a
significant influence on the reduction of ultimate stress, yielding a p-value of less than
0.001 (t = 16.20). Likewise, the model showed that age also had a statistically significant
influence on the reduction of the ultimate stress, yielding a p-value less than 0.001
(t = 14.09). The interaction between these two parameters (foam and age) confirmed these
conclusions, as the yielded p-value was also less than 0.001 (t = 6.23). Interestingly, the
interaction between salt and primer yielded a p-value of 0.008 (t = 2.73), which may
suggest a deteriorative property of these two parameters on the ultimate stress.
Due to large variations in the ultimate strains, the statistical analysis for ultimate
strain only yielded a significance when foam specimens were tested, which is expected
(p-value generated was less than 0.001 and the t-value was 4.74). When considering the
adhesive failure fraction, which is the fraction of adhesive failures (clean detachment
from the substrate), out of five specimens tested for a particular parameter, several
parameters generated a statistically meaningful effect. The inclusion of salt generated a p-
value of 0.0013 (t = 3.41), indicating that the effect of salt may have an effect on the bond
between the sealant and the substrate. However, when examining the effect of primer on
the failure fraction, the yielded p-value was 0.79 (t = 0.25), suggesting that the effect of
primer on the bond is likely to be small. Interestingly, the interaction between salt and
primer generated a p-value of 0.054 (t = 1.97), which is slightly higher than the acceptable
threshold to draw a reasonable conclusion. However, this result suggests a possible
deteriorative effect due to a combination of salt and primer application. Additionally, the
model results suggest that the effect of aging time has a statistically significant effect on
the adhesive failure fraction, generating a p-value of 0.003 (t = 3.88).
2.9 Volume Expansion Test and Results
Previous studies conducted by Malla, et al., (2007) have indicated that the foam
sealant exhibits significant expansion after casting, often between 50% and 70%. To
understand better the characteristics of expansion and determine the cause for such
variations, the expansion experiment was established to examine the influence of initial
volume of sealant on the total expansion. This concept was formulated from observations
in the laboratory when certain specimens with varying amounts of sealant exhibited
different expansion characteristics. Motivation to understand the behavior of expansion in
this foam sealant stemmed from specifications for poured silicone sealant joints by
Watson Bowman Acme, which suggest a 12.7 mm (0.5 in.) layer of silicone to be applied
above the backer rod. The top surface of the silicone seal should also be recessed at 12.7
mm (0.5 in.) from the roadway. This is primarily to prevent damage to the joint itself due
to repeated vehicular loading and reduce the likelihood of snow plows tearing the sealant.
Since the foam sealant exhibits significant expansion upon initial set, understanding the
behavior of the expansion would provide insight to the quantities needed to prevent
expanding over the roadway and, instead, expand to the appropriate height above the
backer rod.
In order to study the expansion as a function of initial volume, the foam sealant was
cast into forms resembling a small section of a typical small movement bridge joint. The

39
dimensions of each form were L = 152.4 mm (6 in.), W = 25.4 mm (1 in.) in, and D =
38.1 mm (1.5 in.) (Figure 43). As shown in Table 7, the initial thickness of sealant
applied in each form ranged from ¼″ to 1″, representing typical minimum and maximum
thickness of sealant that would be applied into an in-service bridge joint.
Table 7: Initial thicknesses of specimens for expansion test
Specimen No. 1 2 3 4 5 6 7 8 9 10
Specimen
Thickness (mm) 3.18 3.97 7.94 7.94 7.14 7.94 9.53 11.91 12.70 13.49
The thickness of each joint was measured every minute for the first 20 minutes after
initial casting, and then, every 5 minutes until the sealant exhibited no further expansion
for three consecutive measurements. A laser-based distance measurement device was
used to measure the thickness of the sealant at each time interval. The device was placed
two inches above each set of blocks in order to ensure a consistent reference point for
each specimen. A schematic of the experimental set up is shown in Figure 43.
Figure 43: Expansion test assembly
As shown in Figure 44, the initial volume of sealant applied directly correlates to the
final thickness of the sealant. For example, an initial thickness of 0.25″ produced a final
thickness of 0.375″, while an initial thickness of 1″ produced a final thickness of almost
1.75″. The total exact expansions for these particular trials were 50% and 74%,
respectively. The difference in expansion from one specimen to another may stem from
greater amounts of hydrogen gas being lost from the specimen containing less sealant.
Additionally, it can be observed that specimens containing a smaller initial amount of
sealant experienced slower expansion in a step-like manner. The specimens containing a
thicker amount of sealant expanded more rapidly over time with larger and more frequent
steps.
These results indicate that applying the appropriate initial thickness of sealant into an
expansion joint is crucial to ensure no sealant expands over the top edge of the substrate.
Moreover, care must be taken to avoid applying conservative amounts of sealant as this

40
may results in too thin of a layer of sealant. If the joint is too thin, it may puncture or
allow water/debris to penetrate through to the substructure.
Figure 44: Expansion vs. time for foam sealant
1”
¼”

41
3.0 FIELD INSTALLATION
Through the coordination of CT DOT, experimental expansion joints were installed
on three bridges throughout the state of Connecticut. Each bridge was chosen
appropriately so that the foam sealant could accommodate the induced movements.
Traffic volume was an important factor in the choices.
3.1 Route 6 Bridge
The Route 6 bridge is located in Windham, CT. It features two 170-ft. spans over the
Route 6 expressway. Although the bridge spans over Route 6, vehicles travel under the
bridge as part of Route 6 and circle around to travel on the bridge itself, still as part of
Route 6 (Figure 45). This 8-girder composite bridge contains a steel girder superstructure
and a 7.75-inch concrete road deck with concrete joint headers (Figure 46). A 2.5-inch
bituminous concrete wearing surface and waterproofing membrane rest on top of the
concrete deck. According to the 2013 Bridge Safety Inspection report, the average daily
traffic (ADT) for this bridge is 15,700 vehicles. The bearings are fixed at the pier, so each
abutment joint accommodates movement over a temperature range of −10 °F to 110 °F,
resulting in a theoretical movement of each joint of approximately 1.53 inches as per
AASHTO specifications (AASHTO 2012). The speed limit on the bridge is 45 miles per
hour. The state of Connecticut previously installed a silicone sealant which failed after an
unknown period of time. Typically, they would install an asphaltic plug joint (APJ) to
repair joints of this nature; however, the total movement of this bridge exceeds the
capabilities of the asphaltic plug joint. Therefore, the silicone foam sealant joint was a
good candidate for this bridge.
Figure 45: Map location of the Route 6 Bridge in Windham, CT

42
(a) (b)
Figure 46: Route 6 Bridge (a) Span and center pier, (b) support at abutment
The full width of the bridge deck joint was sealed, amounting to a total of 106 feet
(53 feet per joint). At the time of installation, the west joint had an average gap opening
of 1.75 inches and the east joint had an average gap opening of 1.5 inches. However, due
to imperfections of the concrete header, the gap width varied along the length of the joint
by ± 0.25 inches.
The installation of the sealant into the expansion joints of the Route 6 bridge was a
two-day operation, conducted on Monday and Tuesday, September 14-15, 2015. The
sealants for lane 1 and the south shoulder (shown in Figure 47) were installed on
Monday, September 14. Weather conditions for Monday were mostly sunny with some
scattered clouds with a high temperature of 76 °F. Roadway temperatures and air
humidity for this day ranged between 83-97 °F and 18-26%, respectively. The sealants
for lanes 2, 3 and the north shoulder were installed on Tuesday, September 15, 2015.
Weather conditions for Tuesday were mostly sunny with some scattered clouds with a
high temperature of 80 °F. Roadway temperatures and air humidity for this day ranged
between 92-105 °F and 16-22%, respectively.
Figure 47: Plan schematic of Route 6 Bridge
The preparation of the joint (Figure 48) prior to actual installation of the sealant
involved removing the existing joint and sand blasting the header to ensure any remnants
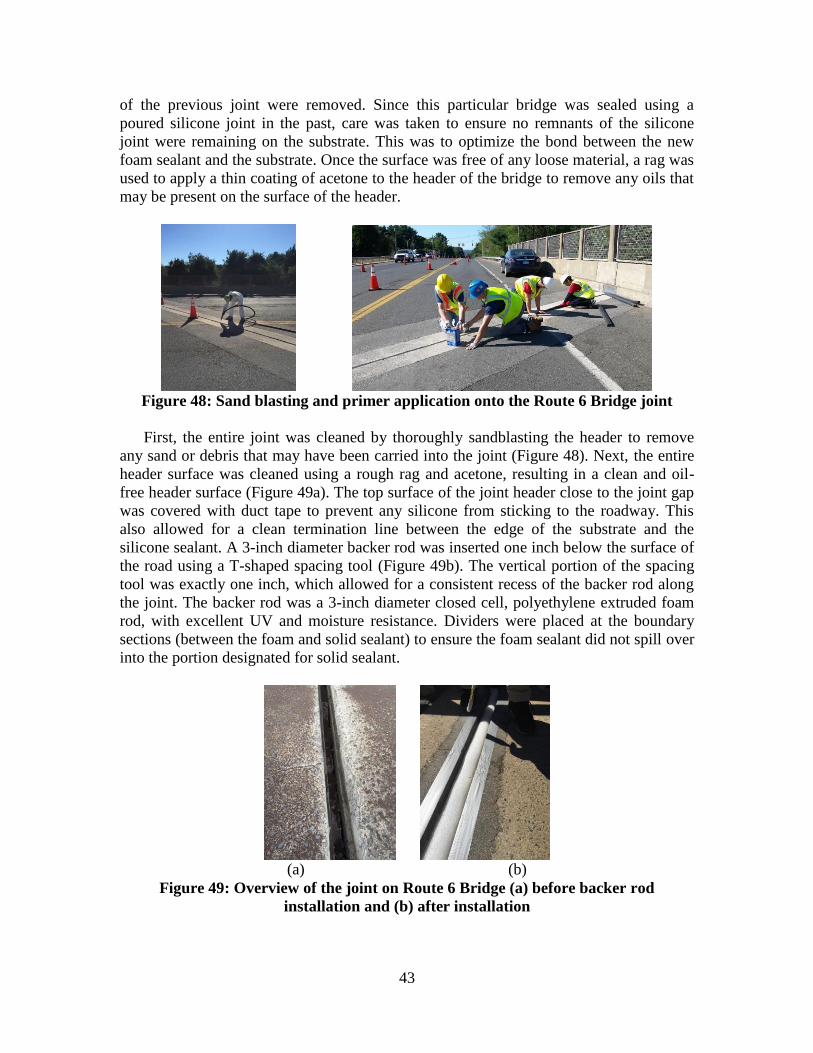
43
of the previous joint were removed. Since this particular bridge was sealed using a
poured silicone joint in the past, care was taken to ensure no remnants of the silicone
joint were remaining on the substrate. This was to optimize the bond between the new
foam sealant and the substrate. Once the surface was free of any loose material, a rag was
used to apply a thin coating of acetone to the header of the bridge to remove any oils that
may be present on the surface of the header.
Figure 48: Sand blasting and primer application onto the Route 6 Bridge joint
First, the entire joint was cleaned by thoroughly sandblasting the header to remove
any sand or debris that may have been carried into the joint (Figure 48). Next, the entire
header surface was cleaned using a rough rag and acetone, resulting in a clean and oil-
free header surface (Figure 49a). The top surface of the joint header close to the joint gap
was covered with duct tape to prevent any silicone from sticking to the roadway. This
also allowed for a clean termination line between the edge of the substrate and the
silicone sealant. A 3-inch diameter backer rod was inserted one inch below the surface of
the road using a T-shaped spacing tool (Figure 49b). The vertical portion of the spacing
tool was exactly one inch, which allowed for a consistent recess of the backer rod along
the joint. The backer rod was a 3-inch diameter closed cell, polyethylene extruded foam
rod, with excellent UV and moisture resistance. Dividers were placed at the boundary
sections (between the foam and solid sealant) to ensure the foam sealant did not spill over
into the portion designated for solid sealant.
(a) (b)
Figure 49: Overview of the joint on Route 6 Bridge (a) before backer rod
installation and (b) after installation

44
The placement of the sealants and the application of primer were chosen by following
the Latin square method of systematically assigning variables to a field (Figure 50). This
pattern was applied to one lane and, then, rotated clockwise for each adjacent lane to
minimize bias of placement. It was assumed that any vehicle driving over the bridge stays
in the same lane when it encounters both joints. This would allow for a straight forward
comparison of the in-service behavior for the joint containing foam sealant with primer,
foam sealant without primer, solid sealant with primer, and solid sealant without primer.
Each lane was split into two sections per joint; therefore, all four variables were included
in each joint. It was assumed that the effect of the left tire onto the joint was the same as
the effect of the right tire. Therefore, the effectiveness of the primer and the foam sealant
could be easily observed when assessing each section of the lane.
Figure 50: Sealant and primer placement plan, Route 6 Bridge
Once the entire joint was prepared for pouring, appropriate amounts of each
component were mixed to create the foam sealant formulation. Knowing the joint gap and
sections of sealant needed, as indicated in the placement plan, the components were pre
weighed for lengths equivalent to half of a lane. Each component was sealed and stored
in labeled syringes to facilitate the mixing process in the field without having to weigh
out each component on site. Since the foam sealant is known to have a longer curing
time, the foam sealant was placed first. The components were mixed on site in a bucket
using a hand drill with an appropriate mixing attachment. Equal parts by volume of the
Wabo white and Wabo (WBA 2008a) black were combined and mixed in a bucket using
the hand drill. Once a uniform color was established, the platinum was slowly added
while continuously stirring the sealant. The addition of water followed. Once these four
components were thoroughly mixed, the crosslinker was also added while continuously
stirring the sealant. After a uniform texture was obtained, the sealant was carefully

45
poured into the joint manually, from the bucket where the sealant components were
mixed together (Figure 51). The sealants were installed section-by-section, as outlined in
the plan shown in Figure 50. A leveling tool, also T-shaped, was used to establish the
appropriate recess from the roadway. The vertical portion of the T was exactly 0.5 inches
in height, so the sealant was poured and shaped with a recess of 0.5 inches from the
surface of the road.
Figure 51: Installation of the sealant, Route 6 Bridge
The details of the sealant installation were meticulously recorded, as the curing of the
sealant was time-dependent. Tack free time for the foam sealant is approximately 1.5
hours, while tack free time for the solid sealant is about 1 hour. However, these times are
highly dependent on the outside temperature and humidity. Silicone tends to cure quicker
with higher temperatures. This difference in curing time motivated the group to install the
foam sealant prior to installing the solid sealant at each lane. The average time for
mixing, pouring and leveling one lane was approximately 35 minutes (both joints).
3.2 Route 291 Bridge
The Route 291 Bridge is located in Windsor, CT, as part of Route 291, spanning
Deerfield Road (Figure 52). The structure is a four-span continuous, curved, multi-girder
steel bridge carrying four lanes of traffic (two in each direction). This 9-girder composite
bridge contains a steel-girder superstructure, an 8.25-inch concrete road deck, and a 2.5-
inch wearing surface with a waterproof membrane. The joint headers are concrete.
According to the 2014 Bridge Safety Inspection report by CT DOT, the anticipated daily
traffic (ADT) for this bridge is about 52,600. The structure is supported at each abutment,
and at three intermediate piers spaced at 132, 124, 124, and 124 feet, from west to east.
The middle pier (pier 2) is fixed, while the exterior piers and abutments contain rollers to
accommodate expansion. Figure 53 shows the schematic of the bridge. Each abutment
joint accommodates movement over a temperature range of −10 °F to 110 °F, resulting in
a theoretical movement of each joint of approximately 2.44 inches, as per AASHTO
specifications. The speed limit on this bridge is 65 miles per hour. The state of
Connecticut previously installed a poured silicone sealant joint which failed after two full
years. This bridge was a good candidate to directly compare the longevity of the foam
sealant in comparison to the previously-installed, commercially-available product.
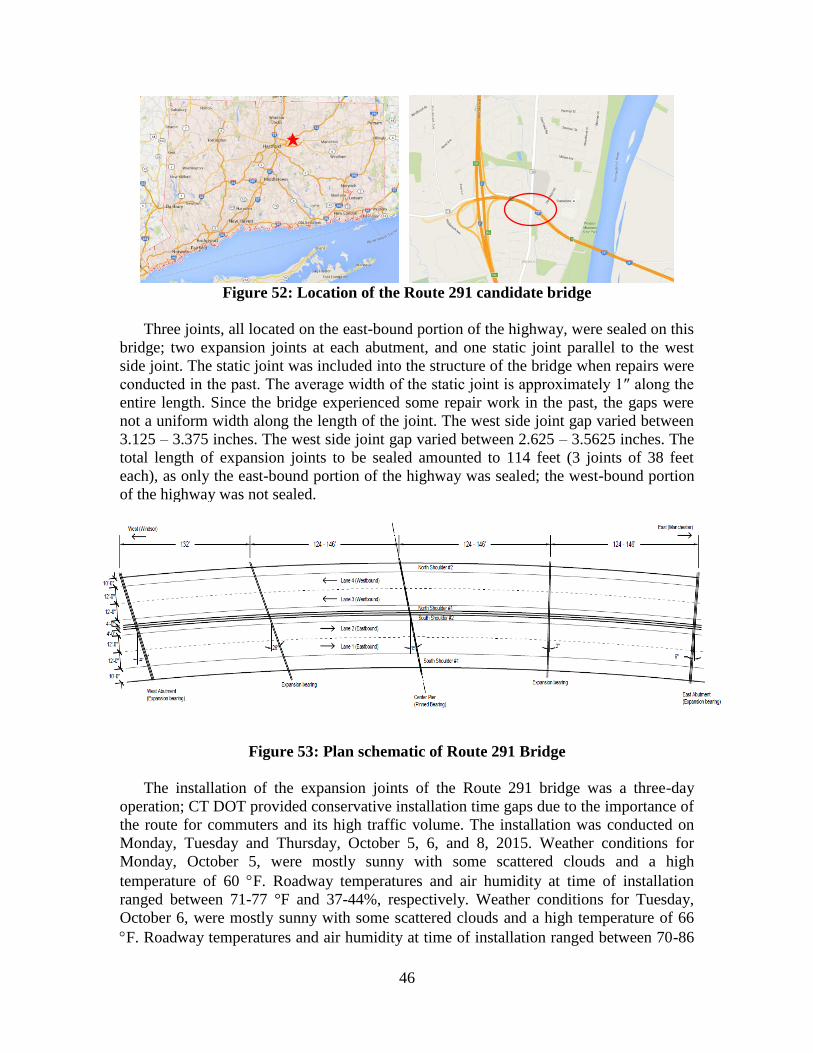
46
Figure 52: Location of the Route 291 candidate bridge
Three joints, all located on the east-bound portion of the highway, were sealed on this
bridge; two expansion joints at each abutment, and one static joint parallel to the west
side joint. The static joint was included into the structure of the bridge when repairs were
conducted in the past. The average width of the static joint is approximately 1″ along the
entire length. Since the bridge experienced some repair work in the past, the gaps were
not a uniform width along the length of the joint. The west side joint gap varied between
3.125 – 3.375 inches. The west side joint gap varied between 2.625 – 3.5625 inches. The
total length of expansion joints to be sealed amounted to 114 feet (3 joints of 38 feet
each), as only the east-bound portion of the highway was sealed; the west-bound portion
of the highway was not sealed.
Figure 53: Plan schematic of Route 291 Bridge
The installation of the expansion joints of the Route 291 bridge was a three-day
operation; CT DOT provided conservative installation time gaps due to the importance of
the route for commuters and its high traffic volume. The installation was conducted on
Monday, Tuesday and Thursday, October 5, 6, and 8, 2015. Weather conditions for
Monday, October 5, were mostly sunny with some scattered clouds and a high
temperature of 60 F. Roadway temperatures and air humidity at time of installation
ranged between 71-77 °F and 37-44%, respectively. Weather conditions for Tuesday,
October 6, were mostly sunny with some scattered clouds and a high temperature of 66
F. Roadway temperatures and air humidity at time of installation ranged between 70-86

47
°F and 29-41%, respectively. Weather conditions for Thursday, October 8, were mostly
sunny with some clouds and a high temperature of 72 °F. Roadway temperatures and air
humidity at time of installation ranged between 64-70 °F and 51-63%, respectively.
The preparation of the joint, prior to installation of the sealant, involved removing the
existing joint, which was coordinated by CT DOT as a night job conducted prior to
installing the new expansion joint. This was done to save time and avoid disrupting
traffic on the day of installation. The header was thoroughly sand-blasted to remove any
loose material and remnants of the old joint. Additionally, a large blade saw was applied
to the header to cut into the concrete and expose a fresh surface for optimal bond (Figure
54). Dividers were placed at the boundary sections (between the foam and solid sealant)
to ensure the foam sealant did not spill over into the portion designated for solid sealant.
Finally, an acetone-soaked rag was used to remove any oils that may have potentially
been left on the surface.
Figure 54: Joint preparation on Route 291 Bridge
Next, the top surface of the joint header was lined with duct tape to prevent any
silicone from sticking to the roadway. A 5-inch backer rod was inserted one inch below
the surface of the road using a T-shaped spacing tool (Figure 55). The vertical portion of
the spacing tool was exactly one inch, which allowed for a consistent recess of the backer
rod along the joint. The backer rod was a 5-inch diameter closed cell, polyethylene
extruded foam rod with excellent UV and moisture resistance. The joint was air blown
after installation of the backer rod to remove any sand or debris that may have been
carried into the joint after initial cleaning.
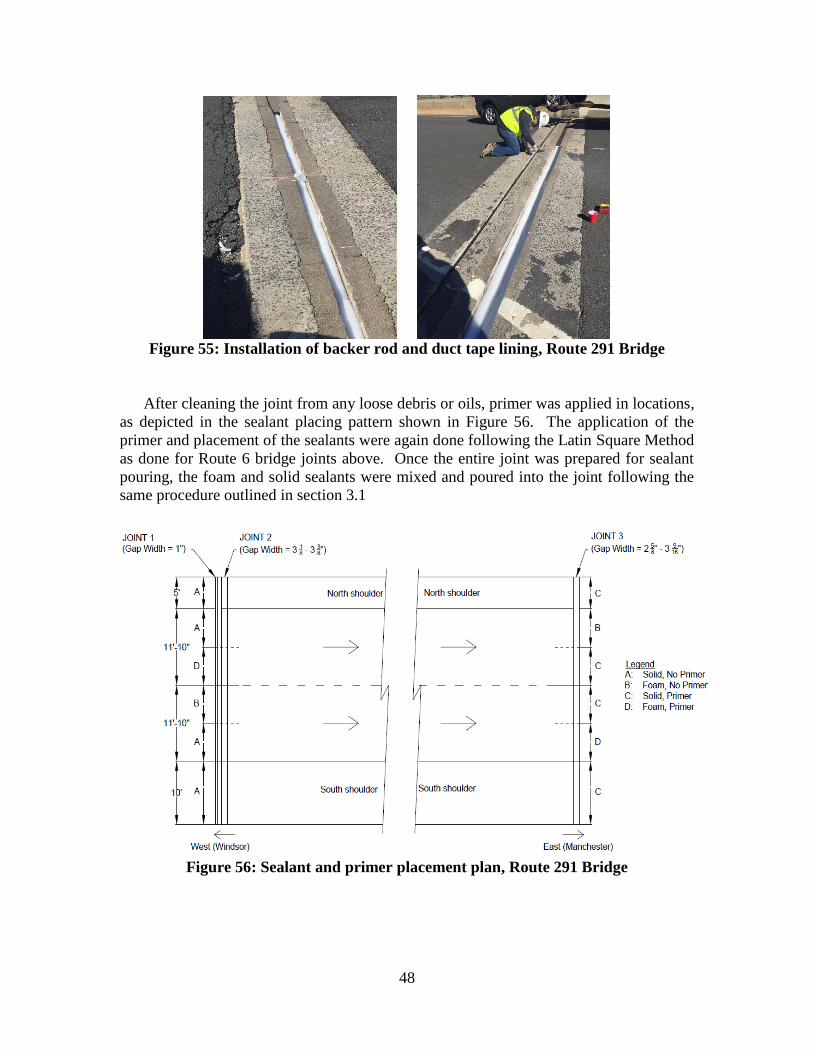
48
Figure 55: Installation of backer rod and duct tape lining, Route 291 Bridge
After cleaning the joint from any loose debris or oils, primer was applied in locations,
as depicted in the sealant placing pattern shown in Figure 56. The application of the
primer and placement of the sealants were again done following the Latin Square Method
as done for Route 6 bridge joints above. Once the entire joint was prepared for sealant
pouring, the foam and solid sealants were mixed and poured into the joint following the
same procedure outlined in section 3.1
Figure 56: Sealant and primer placement plan, Route 291 Bridge

49
3.3 Route 22 Bridge
The Route 22 Bridge selected for field implementation in this project is located in
North Haven, CT. It features two 141-ft. spans over Route 40 (Figure 57). This 5-girder
composite bridge contains a steel girder superstructure and an 8-inch reinforced concrete
deck (with concrete joint headers). A 2.5-inch bituminous concrete wearing surface and
waterproofing membrane rest on top of the concrete deck. According to the 2013 Bridge
Safety Inspection report, the anticipated daily traffic (ADT) for this bridge is 6,100
vehicles. The bearings are fixed at the center pier, so each abutment joint accommodates
movement over a temperature range of −10 °F to 110 °F, resulting in a theoretical
movement of each joint of approximately 1.3 inches as per AASHTO (2012)
specifications. The speed limit on the bridge is 25 miles per hour. The previous joint on
this bridge consisted of a poured silicone seal which showed signs of failure, as there was
noticeable leaking of water onto the abutment and several rips and punctures throughout
the length of the joint. The maintenance crew reported that the seal was installed
approximately four years prior to the installation of the foam sealant. Therefore, this
bridge allowed for a straight forward comparison of the in-service lifespan of the solid
and foam sealant.
Figure 57: Map location of Route 22 Bridge in North Haven, CT
For this bridge, both joints were sealed for the full width of the bridge deck. This
amounted to a total of 80 feet (approximately 40 feet per joint). At the time of
installation, the west joint had an average gap opening of 1.00 inches, and the east joint
had an average gap opening of 2.00 inches. The east joint had significant imperfections
along the length of the joint which varied the gap width by ± 0.50 inches. The installation
of the expansion joints of the Route 22 bridge was a one-day operation, conducted on
Tuesday, October 20, 2015. Weather conditions for that day were mostly sunny with an
average temperature of 58 °F. Roadway temperatures and humidity ranged from 57.2-84
°F and 28-42%, respectively. The entire bridge was sealed in approximately 4.5 hours
with minimal traffic disruption.
Similar to the installation procedure of the previous two bridges, the existing
expansion joint (also a poured silicone seal) was removed first, and the header of the deck
was cleaned using a blade saw to remove any remnants of the old joint and expose a fresh
surface of concrete. After this, the entire joint was blown with compressed air to remove

50
any dust or loose particles from the header. This procedure ensured the best quality
header since the blade saw exposed a brand new surface of concrete. The preparation of
the joint is shown in Figure 58.
(a) (b)
Figure 58: Joint on Route 22 Bridge: (a) air blasting the joint and (b) cutting of the
header surface
Upon cleaning of the joint, a three-inch backer rod was inserted into the west joint
along the length of the entire south shoulder and lane 1. The backer rod was inserted
approximately one inch below the surface of the roadway. A recess tool was used to push
the backer rod to the desired depth to ensure even placement along the entire joint. Once
the backer rod was in place, primer was applied at the appropriate locations, as shown in
Figure 59. Stoppers were inserted in between areas where the solid sealant was
terminated and the foam sealant was poured. Each sealant was poured so that, when a
vehicle drove over the joint, one tire hit the solid sealant and the other tire hit the foam
sealant. However, this was not always the case due to the Latin square rotation, since the
foam sealant could have been located on the west joint and the solid sealant on the east
joint.

51
Figure 59: Sealant and primer placement plan, Route 22 Bridge

52
4.0 FIELD MONITORING
This section outlines the measures taken to monitor the conditions of each bridge onto
which the expansion joints were installed. Due to limitations such as seasonal weather,
availability of crews, access to substructure, time window for work, and traffic
conditions, each bridge was monitored using varying techniques.
4.1 Route 6 Bridge
The Route 6 bridge in Windham, CT, was monitored with the most intensity due to its
proximity to UConn, easy access to the substructure, and good relationship with the local
maintenance crews. After installation of the sealant, several joint gap readings were
recorded on a monthly basis. Additionally, CT DOT generously provided maintenance
crews and equipment to assist with the installation of displacement measuring devices
onto the east abutment. Through the efforts of the Connecticut Transportation Institute
(CTI) and UConn, a traffic counter was installed to conduct continuous monitoring of the
vehicles passing over the bridge. Finally, weather data (temperatures, humidity and
precipitation) were recorded to examine the nature’s effect on the joint gap.
4.1.1 Joint Gap History
Upon installation, the joint gap was measured at several locations along the joint.
Since portions of the road were closed during the installation process, a detailed record of
the joint gap widths was recorded. However, after installation of the joint, the gaps were
measured at limited locations as moving traffic prevented measuring the joint gap due to
safety precautions. During installation on Friday, August 14, 2015, the average joint gap
for the west joint was 1.625 inches for the west joint and 2.00 inches for the east joint,
with an average temperature of 82 F. On Monday, September 14, 2015, the average joint
gap for the west joint increased to approximately 1.685 inches. The east gap that day
measured 2.0625 inches. These measurements were recorded at a temperature of 76 F.
On Tuesday, January 12, 2016, the west joint gap measured about 2.0625 inches while
the east joint gap measured 2.25 inches at a corresponding temperature of 29 F. This
large shift in joint gap corresponds to a 52 F drop in temperature since the day of
installation. According to Equation 1, the theoretical change in the joint gap is 0.37
inches, assuming the linear thermal coefficient of expansion (α) is 0.000008 R−1. Field
measurements indicate that the joint gap increased by about 0.25 inches, somewhat less
than the movement calculated theoretically. This may be due to the condition of the
bridge bearings, as significant rust and debris has accumulated near the supports over
time. The time history of the joint gap is shown in Figures 60 and 61.

53
Figure 60: Joint gap history for Route 6 Bridge
Figure 61: Joint gap as a function of temperature change for Route 6 Bridge
4.1.2 Traffic Counter
Through the assistance of CTI, a traffic counter was installed approximately 100 feet
away from the east expansion joint on Route 6 Bridge. The traffic counter could not be
installed on the bridge itself because there were no fixtures to secure the computer that
recorded and stored the data. However, there are no turns or alternate routes between the
bridge and the traffic counter, so the vehicle data was as accurate as possible. The traffic
counter consisted of two portable, automatic, pneumatic- tube counters spread across the
entire width of the roadway. Tube counters have proven over the years to be inexpensive
devices that are fairly easy to install and remove, and that provide adequate accuracy for
most applications (Kraft 2008).
The tubes were installed by nailing metal clamps to the asphalt at the outer edges of
the roadway. These clamps secured the tubes at each end, while a wire loop held the tube
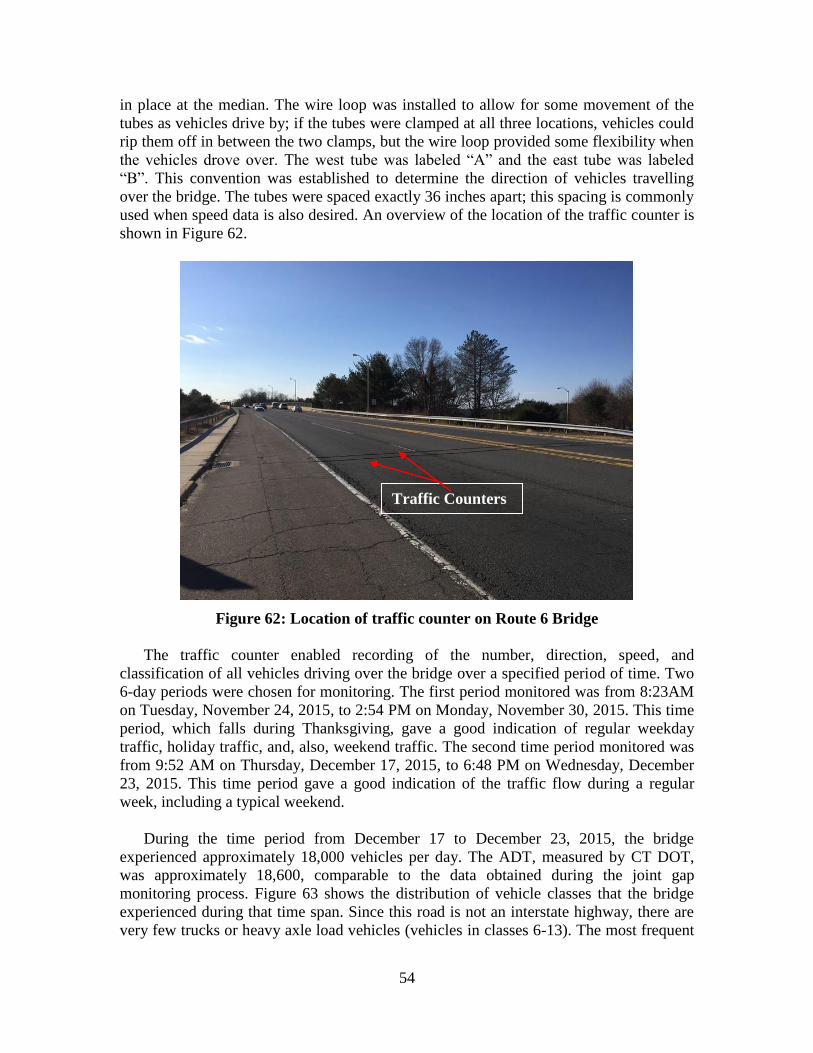
54
in place at the median. The wire loop was installed to allow for some movement of the
tubes as vehicles drive by; if the tubes were clamped at all three locations, vehicles could
rip them off in between the two clamps, but the wire loop provided some flexibility when
the vehicles drove over. The west tube was labeled “A” and the east tube was labeled
“B”. This convention was established to determine the direction of vehicles travelling
over the bridge. The tubes were spaced exactly 36 inches apart; this spacing is commonly
used when speed data is also desired. An overview of the location of the traffic counter is
shown in Figure 62.
Figure 62: Location of traffic counter on Route 6 Bridge
The traffic counter enabled recording of the number, direction, speed, and
classification of all vehicles driving over the bridge over a specified period of time. Two
6-day periods were chosen for monitoring. The first period monitored was from 8:23AM
on Tuesday, November 24, 2015, to 2:54 PM on Monday, November 30, 2015. This time
period, which falls during Thanksgiving, gave a good indication of regular weekday
traffic, holiday traffic, and, also, weekend traffic. The second time period monitored was
from 9:52 AM on Thursday, December 17, 2015, to 6:48 PM on Wednesday, December
23, 2015. This time period gave a good indication of the traffic flow during a regular
week, including a typical weekend.
During the time period from December 17 to December 23, 2015, the bridge
experienced approximately 18,000 vehicles per day. The ADT, measured by CT DOT,
was approximately 18,600, comparable to the data obtained during the joint gap
monitoring process. Figure 63 shows the distribution of vehicle classes that the bridge
experienced during that time span. Since this road is not an interstate highway, there are
very few trucks or heavy axle load vehicles (vehicles in classes 6-13). The most frequent
Traffic Counters
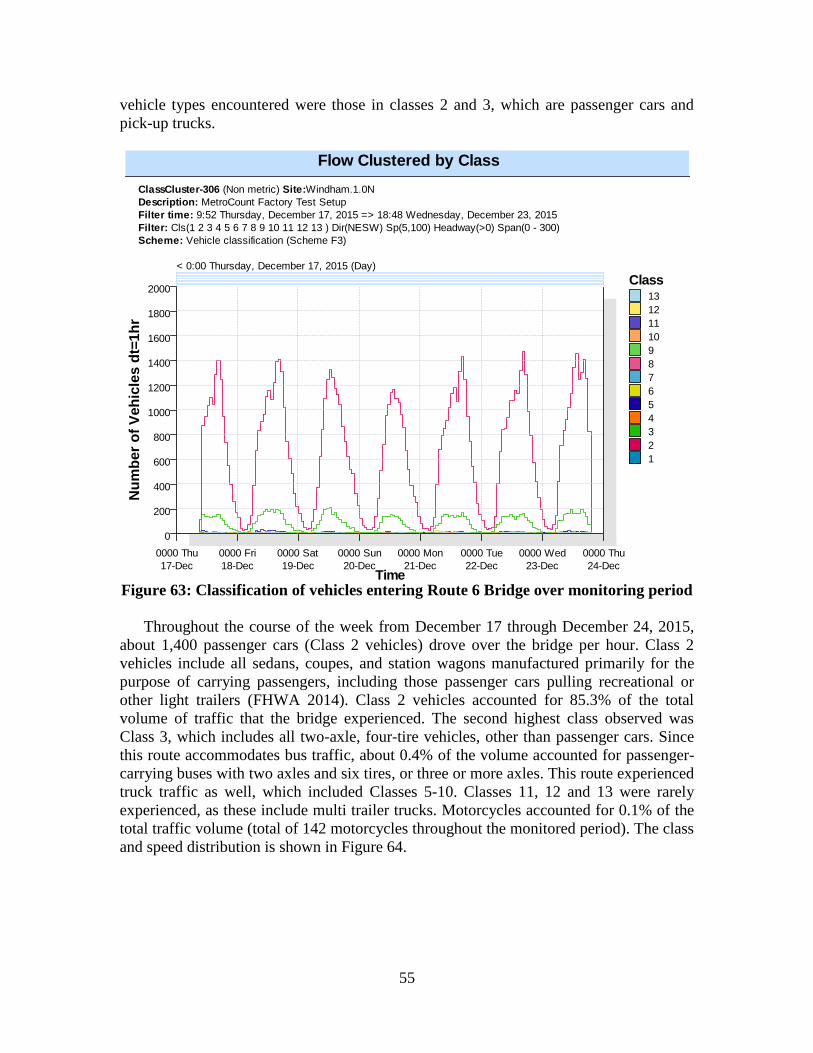
55
vehicle types encountered were those in classes 2 and 3, which are passenger cars and
pick-up trucks.
Flow Clustered by Class
ClassCluster-306 (Non metric) Site:Windham.1.0N
Description: MetroCount Factory Test Setup
Filter time: 9:52 Thursday, December 17, 2015 => 18:48 Wednesday, December 23, 2015
Filter: Cls(1 2 3 4 5 6 7 8 9 10 11 12 13 ) Dir(NESW) Sp(5,100) Headway(>0) Span(0 - 300)
Scheme: Vehicle classification (Scheme F3)
< 0:00 Thursday, December 17, 2015 (Day)
Class13
12
11
10
9
8
7
6
5
4
3
2
1
Time17-Dec
0000 Thu
18-Dec
0000 Fri
19-Dec
0000 Sat
20-Dec
0000 Sun
21-Dec
0000 Mon
22-Dec
0000 Tue
23-Dec
0000 Wed
24-Dec
0000 Thu
0
200
400
600
800
1000
1200
1400
1600
1800
2000
Nu
mb
er
of
Veh
icle
s d
t=1h
r
Figure 63: Classification of vehicles entering Route 6 Bridge over monitoring period
Throughout the course of the week from December 17 through December 24, 2015,
about 1,400 passenger cars (Class 2 vehicles) drove over the bridge per hour. Class 2
vehicles include all sedans, coupes, and station wagons manufactured primarily for the
purpose of carrying passengers, including those passenger cars pulling recreational or
other light trailers (FHWA 2014). Class 2 vehicles accounted for 85.3% of the total
volume of traffic that the bridge experienced. The second highest class observed was
Class 3, which includes all two-axle, four-tire vehicles, other than passenger cars. Since
this route accommodates bus traffic, about 0.4% of the volume accounted for passenger-
carrying buses with two axles and six tires, or three or more axles. This route experienced
truck traffic as well, which included Classes 5-10. Classes 11, 12 and 13 were rarely
experienced, as these include multi trailer trucks. Motorcycles accounted for 0.1% of the
total traffic volume (total of 142 motorcycles throughout the monitored period). The class
and speed distribution is shown in Figure 64.

56
Class Bin Chart
ClassBin-307 (Non metric) Site:Windham.1.0N
Description: MetroCount Factory Test Setup
Filter time: 9:52 Thursday, December 17, 2015 => 18:48 Wednesday, December 23, 2015
Filter: Cls(1 2 3 4 5 6 7 8 9 10 11 12 13 ) Dir(NESW) Sp(5,100) Headway(>0) Span(0 - 300)
Scheme: Vehicle classification (Scheme F3)
Total=118336
Class = 1
0.1% (142.0)
Class = 12
0.0% (2.0)
Class = 11
0.0% (4.0)
Class = 10
0.1% (90.0)
Class = 5
0.9% (1066.0)
Class = 6
0.7% (854.0)
Class = 7
0.6% (711.0)
Class = 8
0.2% (253.0)
Class = 9
0.4% (487.0)
Class = 13
0.1% (125.0)Class = 4
0.4% (516.0)
Class = 3
11.1% (13123.0)Class = 2
85.3% (100963.0)
Speed Histogram
SpeedHist-295 (Non metric) Site:Windham.1.0N
Description: MetroCount Factory Test Setup
Filter time: 9:52 Thursday, December 17, 2015 => 18:48 Wednesday, December 23, 2015
Filter: Cls(1 2 3 4 5 6 7 8 9 10 11 12 13 ) Dir(NESW) Sp(5,100) Headway(>0) Span(0 - 300)
Scheme: Vehicle classification (Scheme F3)
Speed (mph)
0 14 28 42 56 70 84 98 112 126 140
Fix Y
0
1000
2000
3000
4000
5000
6000
7000
8000
9000
10000
Nu
mb
er
of
Veh
icle
s(1
mp
h)
Figure 64: Average speed record for Route 6 Bridge: class bin chart (top) and speed
histogram (bottom)
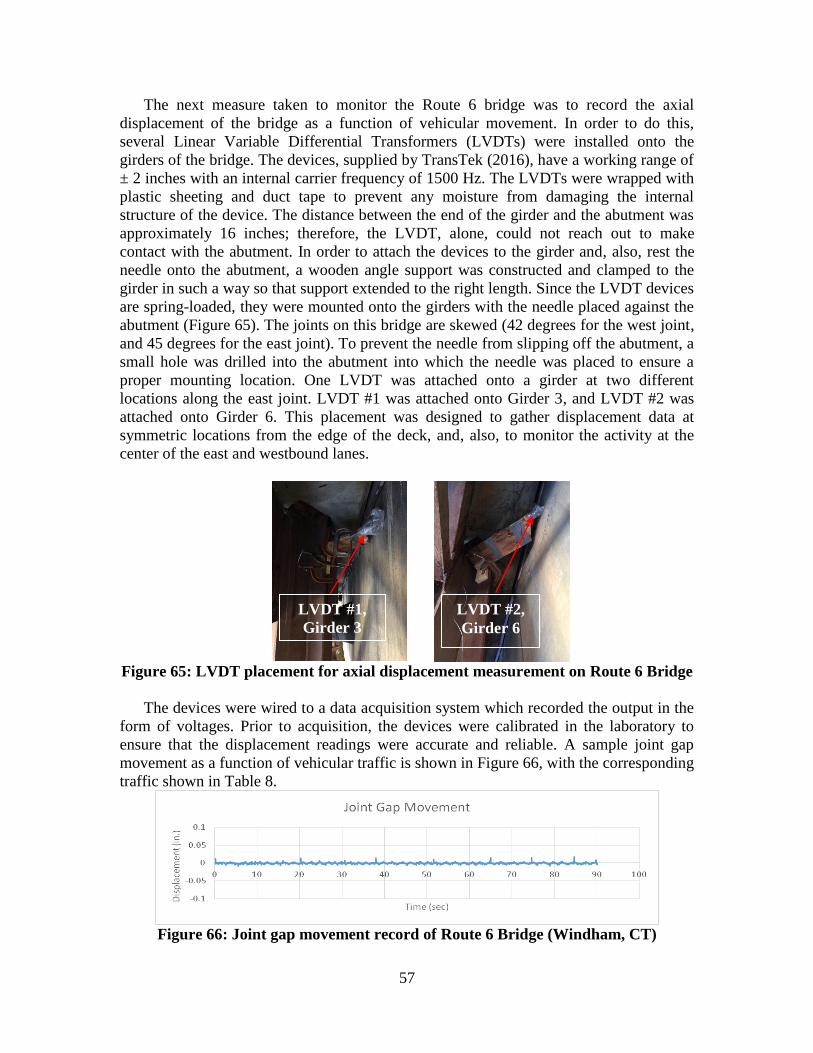
57
The next measure taken to monitor the Route 6 bridge was to record the axial
displacement of the bridge as a function of vehicular movement. In order to do this,
several Linear Variable Differential Transformers (LVDTs) were installed onto the
girders of the bridge. The devices, supplied by TransTek (2016), have a working range of
± 2 inches with an internal carrier frequency of 1500 Hz. The LVDTs were wrapped with
plastic sheeting and duct tape to prevent any moisture from damaging the internal
structure of the device. The distance between the end of the girder and the abutment was
approximately 16 inches; therefore, the LVDT, alone, could not reach out to make
contact with the abutment. In order to attach the devices to the girder and, also, rest the
needle onto the abutment, a wooden angle support was constructed and clamped to the
girder in such a way so that support extended to the right length. Since the LVDT devices
are spring-loaded, they were mounted onto the girders with the needle placed against the
abutment (Figure 65). The joints on this bridge are skewed (42 degrees for the west joint,
and 45 degrees for the east joint). To prevent the needle from slipping off the abutment, a
small hole was drilled into the abutment into which the needle was placed to ensure a
proper mounting location. One LVDT was attached onto a girder at two different
locations along the east joint. LVDT #1 was attached onto Girder 3, and LVDT #2 was
attached onto Girder 6. This placement was designed to gather displacement data at
symmetric locations from the edge of the deck, and, also, to monitor the activity at the
center of the east and westbound lanes.
Figure 65: LVDT placement for axial displacement measurement on Route 6 Bridge
The devices were wired to a data acquisition system which recorded the output in the
form of voltages. Prior to acquisition, the devices were calibrated in the laboratory to
ensure that the displacement readings were accurate and reliable. A sample joint gap
movement as a function of vehicular traffic is shown in Figure 66, with the corresponding
traffic shown in Table 8.
Figure 66: Joint gap movement record of Route 6 Bridge (Windham, CT)
LVDT #1,
Girder 3
LVDT #2,
Girder 6

58
Table 8. Sample vehicle count output on Route 6 Bridge
Count ID Date Time Direction
Speed,
mph
Headway,
s
FHWA
Class
00012bde 12/18/15 9:52:22 N1 42.98 1.7 2
00012be2 12/18/15 9:52:30 N1 38.95 7.6 2
00012be6 12/18/15 9:52:31 N1 38.14 1.3 2
00012bea 12/18/15 9:52:34 N1 36.1 2.7 2
00012bee 12/18/15 9:52:38 S0 44.44 26.3 2
00012bee 12/18/15 9:52:38 S0 44.44 0 2
00012bf5 12/18/15 9:52:40 S0 45.39 1.6 2
00012bf9 12/18/15 9:52:41 N1 39.23 6.9 2
00012bfd 12/18/15 9:52:41 N1 32.27 0.4 2
00012c01 12/18/15 9:52:42 S0 41.1 2.4 3
00012c05 12/18/15 9:52:43 N1 31.2 1.4 2
00012c09 12/18/15 9:52:44 N1 31.71 1.2 2
00012c0d 12/18/15 9:52:52 N1 54.15 7.8 2
00012c11 12/18/15 9:52:52 N1 50.41 0.7 2
00012c15 12/18/15 9:52:55 S0 47.98 13.1 2
00012c19 12/18/15 9:52:56 N1 49.32 3.3 3
00012c1d 12/18/15 9:52:56 N1 46.05 0.4 3
00012c21 12/18/15 9:52:59 N1 44.96 2.9 2
00012c25 12/18/15 9:53:00 N1 43.77 1.4 2
00012c29 12/18/15 9:53:02 N1 37.66 1.6 2
00012c2d 12/18/15 9:53:02 N1 50.73 0.4 2
00012c31 12/18/15 9:53:04 N1 42.13 1.2 2
00012c35 12/18/15 9:53:04 S0 41.13 8.5 2
00012c39 12/18/15 9:53:05 N1 48.45 0.9 2
00012c3d 12/18/15 9:53:08 S0 39.92 3.6 2
00012c41 12/18/15 9:53:12 N1 39.02 7.1 2
00012c45 12/18/15 9:53:15 N1 41.33 3.1 2
00012c49 12/18/15 9:53:16 S0 46.79 8.1 2
00012c4d 12/18/15 9:53:29 N1 44.23 14.6 2
00012c51 12/18/15 9:53:31 N1 39.24 1.9 7
4.2 Route 291 Bridge
The Route 291 bridge was monitored routinely for its joint gap opening as a function
of thermal contraction and expansion, and, also, as a function of vehicular movement.
Weather conditions such as temperature, precipitation, and humidity were also recorded.
However, due to the speed limit and high-priority route, CT DOT did not support
installing a traffic counter on the roadway. Therefore, exact traffic data regarding
classifications and daily vehicle totals were not obtained.
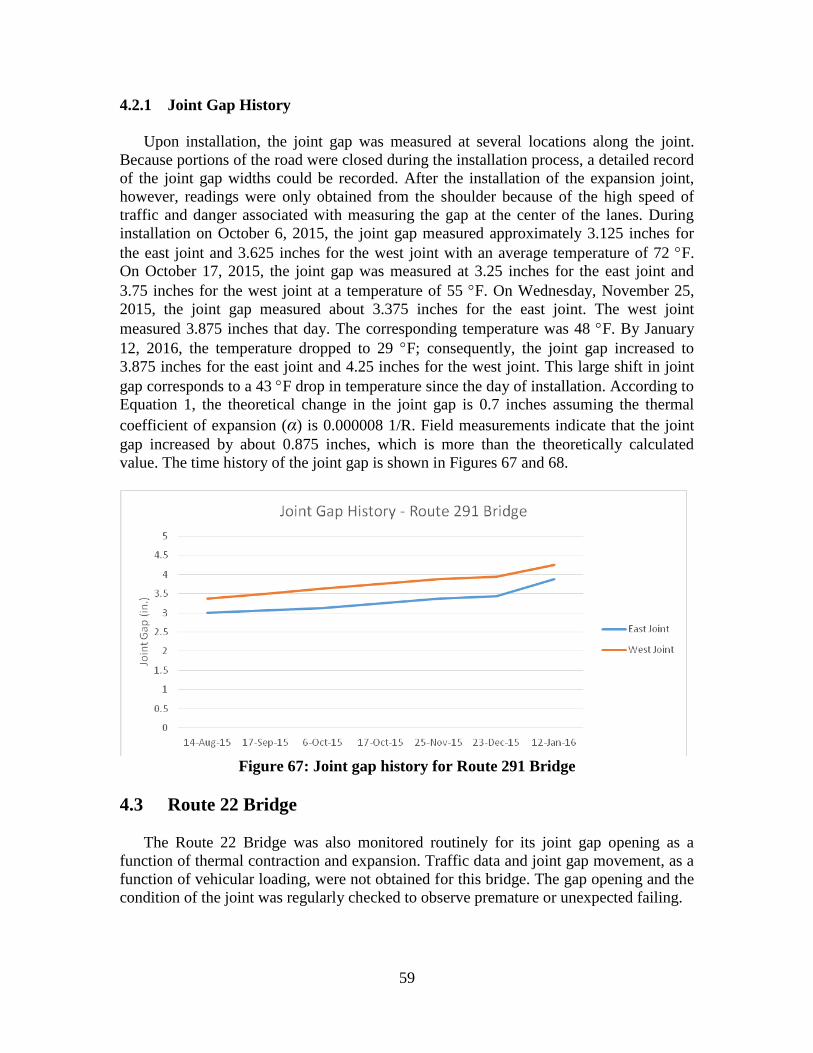
59
4.2.1 Joint Gap History
Upon installation, the joint gap was measured at several locations along the joint.
Because portions of the road were closed during the installation process, a detailed record
of the joint gap widths could be recorded. After the installation of the expansion joint,
however, readings were only obtained from the shoulder because of the high speed of
traffic and danger associated with measuring the gap at the center of the lanes. During
installation on October 6, 2015, the joint gap measured approximately 3.125 inches for
the east joint and 3.625 inches for the west joint with an average temperature of 72 F.
On October 17, 2015, the joint gap was measured at 3.25 inches for the east joint and
3.75 inches for the west joint at a temperature of 55 F. On Wednesday, November 25,
2015, the joint gap measured about 3.375 inches for the east joint. The west joint
measured 3.875 inches that day. The corresponding temperature was 48 F. By January
12, 2016, the temperature dropped to 29 F; consequently, the joint gap increased to
3.875 inches for the east joint and 4.25 inches for the west joint. This large shift in joint
gap corresponds to a 43 F drop in temperature since the day of installation. According to
Equation 1, the theoretical change in the joint gap is 0.7 inches assuming the thermal
coefficient of expansion (α) is 0.000008 1/R. Field measurements indicate that the joint
gap increased by about 0.875 inches, which is more than the theoretically calculated
value. The time history of the joint gap is shown in Figures 67 and 68.
Figure 67: Joint gap history for Route 291 Bridge
4.3 Route 22 Bridge
The Route 22 Bridge was also monitored routinely for its joint gap opening as a
function of thermal contraction and expansion. Traffic data and joint gap movement, as a
function of vehicular loading, were not obtained for this bridge. The gap opening and the
condition of the joint was regularly checked to observe premature or unexpected failing.
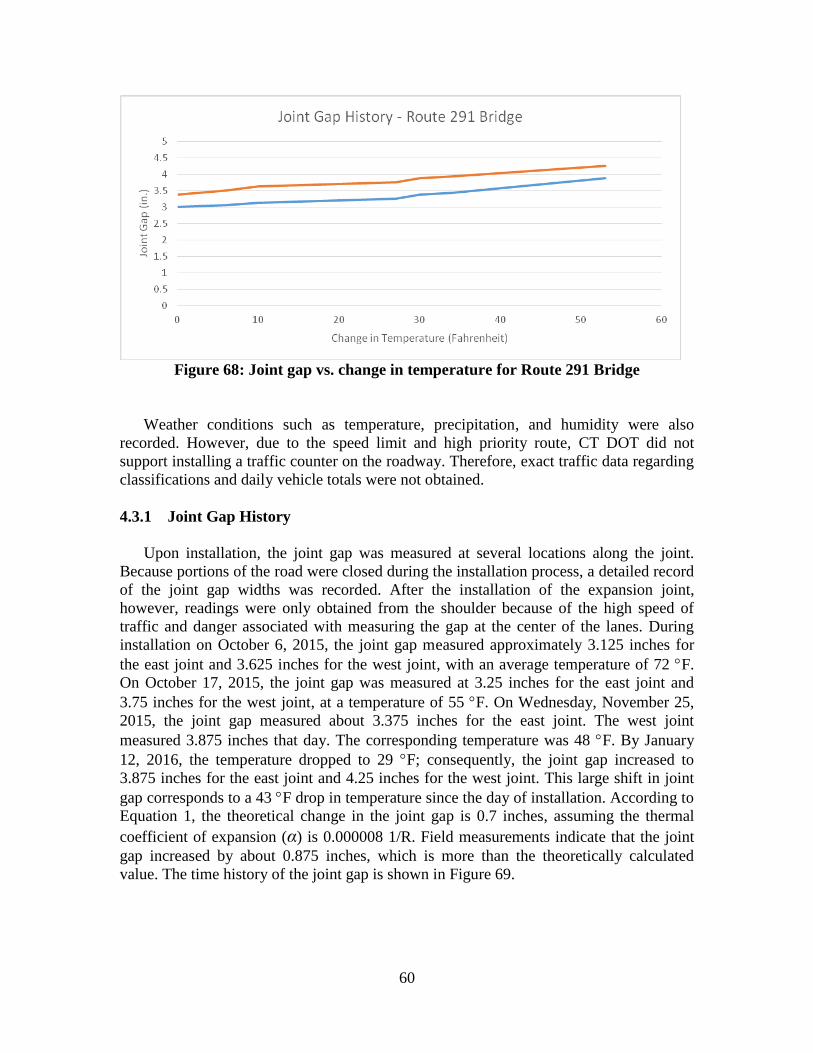
60
Figure 68: Joint gap vs. change in temperature for Route 291 Bridge
Weather conditions such as temperature, precipitation, and humidity were also
recorded. However, due to the speed limit and high priority route, CT DOT did not
support installing a traffic counter on the roadway. Therefore, exact traffic data regarding
classifications and daily vehicle totals were not obtained.
4.3.1 Joint Gap History
Upon installation, the joint gap was measured at several locations along the joint.
Because portions of the road were closed during the installation process, a detailed record
of the joint gap widths was recorded. After the installation of the expansion joint,
however, readings were only obtained from the shoulder because of the high speed of
traffic and danger associated with measuring the gap at the center of the lanes. During
installation on October 6, 2015, the joint gap measured approximately 3.125 inches for
the east joint and 3.625 inches for the west joint, with an average temperature of 72 F.
On October 17, 2015, the joint gap was measured at 3.25 inches for the east joint and
3.75 inches for the west joint, at a temperature of 55 F. On Wednesday, November 25,
2015, the joint gap measured about 3.375 inches for the east joint. The west joint
measured 3.875 inches that day. The corresponding temperature was 48 F. By January
12, 2016, the temperature dropped to 29 F; consequently, the joint gap increased to
3.875 inches for the east joint and 4.25 inches for the west joint. This large shift in joint
gap corresponds to a 43 F drop in temperature since the day of installation. According to
Equation 1, the theoretical change in the joint gap is 0.7 inches, assuming the thermal
coefficient of expansion (α) is 0.000008 1/R. Field measurements indicate that the joint
gap increased by about 0.875 inches, which is more than the theoretically calculated
value. The time history of the joint gap is shown in Figure 69.
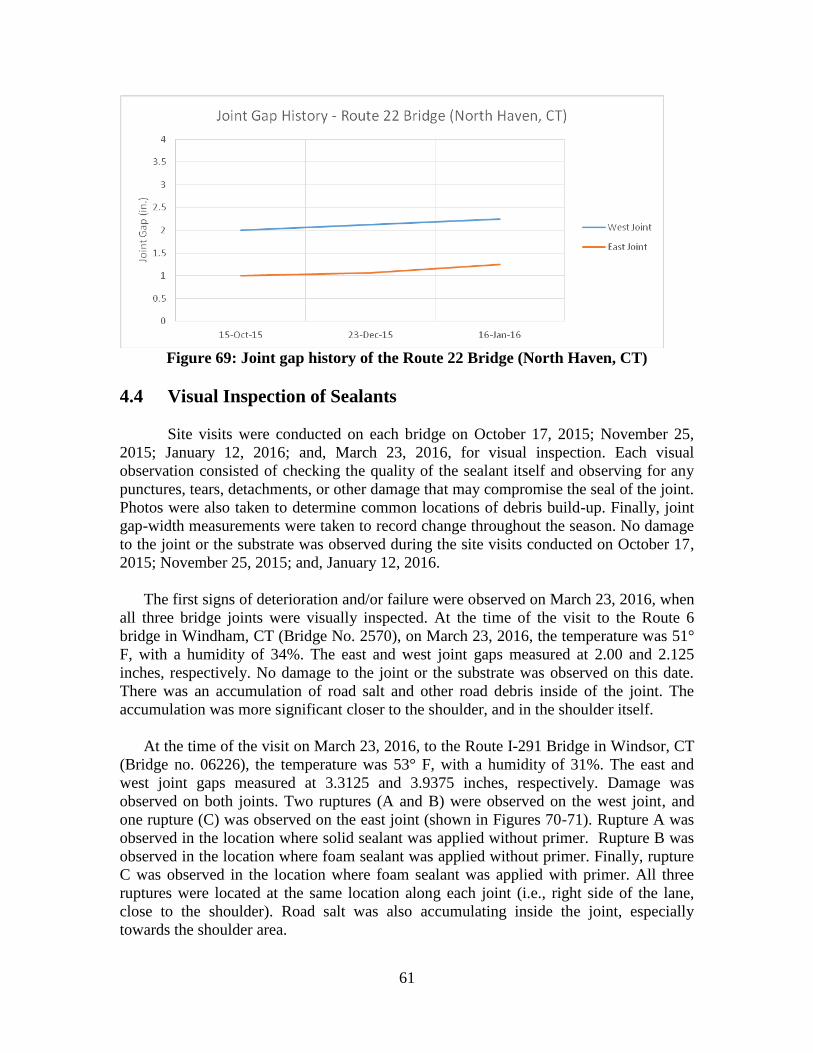
61
Figure 69: Joint gap history of the Route 22 Bridge (North Haven, CT)
4.4 Visual Inspection of Sealants
Site visits were conducted on each bridge on October 17, 2015; November 25,
2015; January 12, 2016; and, March 23, 2016, for visual inspection. Each visual
observation consisted of checking the quality of the sealant itself and observing for any
punctures, tears, detachments, or other damage that may compromise the seal of the joint.
Photos were also taken to determine common locations of debris build-up. Finally, joint
gap-width measurements were taken to record change throughout the season. No damage
to the joint or the substrate was observed during the site visits conducted on October 17,
2015; November 25, 2015; and, January 12, 2016.
The first signs of deterioration and/or failure were observed on March 23, 2016, when
all three bridge joints were visually inspected. At the time of the visit to the Route 6
bridge in Windham, CT (Bridge No. 2570), on March 23, 2016, the temperature was 51°
F, with a humidity of 34%. The east and west joint gaps measured at 2.00 and 2.125
inches, respectively. No damage to the joint or the substrate was observed on this date.
There was an accumulation of road salt and other road debris inside of the joint. The
accumulation was more significant closer to the shoulder, and in the shoulder itself.
At the time of the visit on March 23, 2016, to the Route I-291 Bridge in Windsor, CT
(Bridge no. 06226), the temperature was 53° F, with a humidity of 31%. The east and
west joint gaps measured at 3.3125 and 3.9375 inches, respectively. Damage was
observed on both joints. Two ruptures (A and B) were observed on the west joint, and
one rupture (C) was observed on the east joint (shown in Figures 70-71). Rupture A was
observed in the location where solid sealant was applied without primer. Rupture B was
observed in the location where foam sealant was applied without primer. Finally, rupture
C was observed in the location where foam sealant was applied with primer. All three
ruptures were located at the same location along each joint (i.e., right side of the lane,
close to the shoulder). Road salt was also accumulating inside the joint, especially
towards the shoulder area.
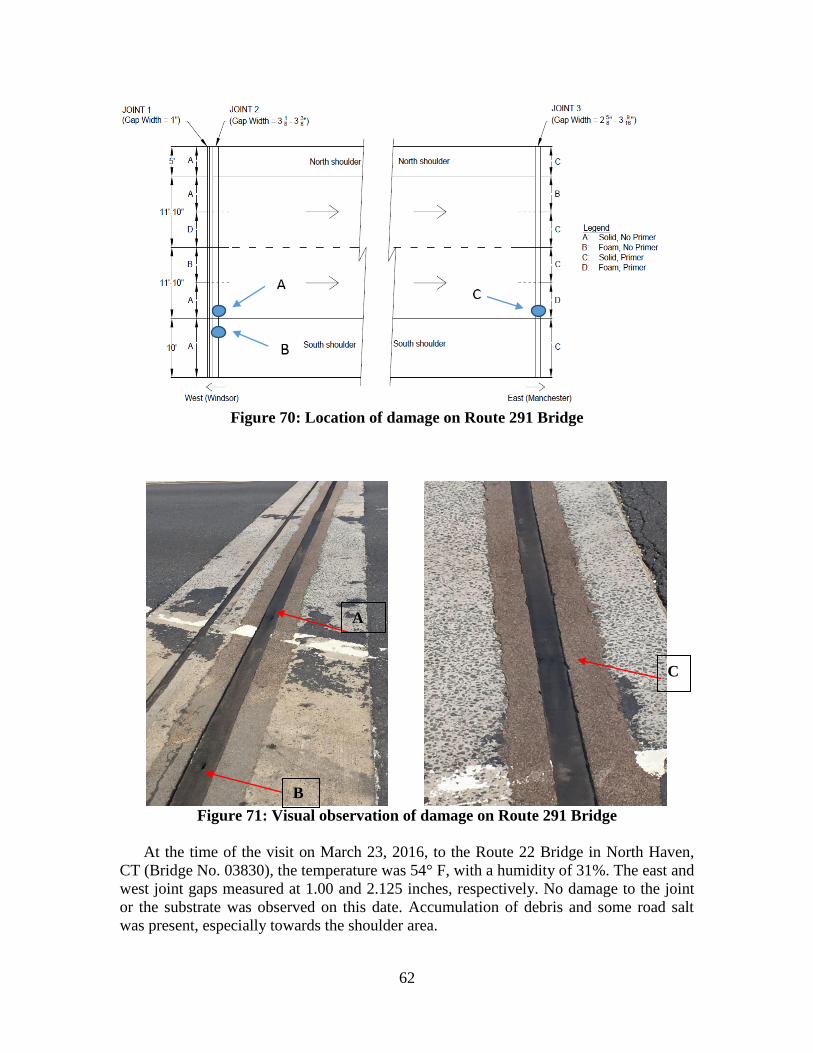
62
Figure 70: Location of damage on Route 291 Bridge
Figure 71: Visual observation of damage on Route 291 Bridge
At the time of the visit on March 23, 2016, to the Route 22 Bridge in North Haven,
CT (Bridge No. 03830), the temperature was 54° F, with a humidity of 31%. The east and
west joint gaps measured at 1.00 and 2.125 inches, respectively. No damage to the joint
or the substrate was observed on this date. Accumulation of debris and some road salt
was present, especially towards the shoulder area.
A
B
C
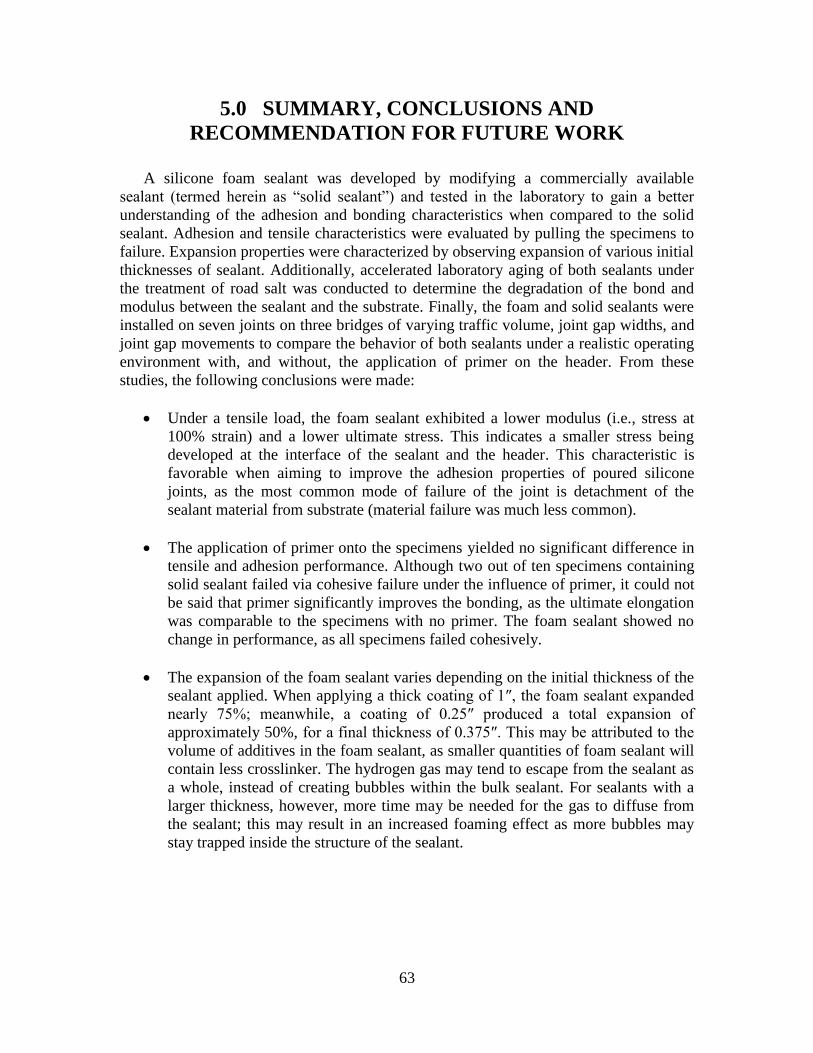
63
5.0 SUMMARY, CONCLUSIONS AND
RECOMMENDATION FOR FUTURE WORK
A silicone foam sealant was developed by modifying a commercially available
sealant (termed herein as “solid sealant”) and tested in the laboratory to gain a better
understanding of the adhesion and bonding characteristics when compared to the solid
sealant. Adhesion and tensile characteristics were evaluated by pulling the specimens to
failure. Expansion properties were characterized by observing expansion of various initial
thicknesses of sealant. Additionally, accelerated laboratory aging of both sealants under
the treatment of road salt was conducted to determine the degradation of the bond and
modulus between the sealant and the substrate. Finally, the foam and solid sealants were
installed on seven joints on three bridges of varying traffic volume, joint gap widths, and
joint gap movements to compare the behavior of both sealants under a realistic operating
environment with, and without, the application of primer on the header. From these
studies, the following conclusions were made:
Under a tensile load, the foam sealant exhibited a lower modulus (i.e., stress at
100% strain) and a lower ultimate stress. This indicates a smaller stress being
developed at the interface of the sealant and the header. This characteristic is
favorable when aiming to improve the adhesion properties of poured silicone
joints, as the most common mode of failure of the joint is detachment of the
sealant material from substrate (material failure was much less common).
The application of primer onto the specimens yielded no significant difference in
tensile and adhesion performance. Although two out of ten specimens containing
solid sealant failed via cohesive failure under the influence of primer, it could not
be said that primer significantly improves the bonding, as the ultimate elongation
was comparable to the specimens with no primer. The foam sealant showed no
change in performance, as all specimens failed cohesively.
The expansion of the foam sealant varies depending on the initial thickness of the
sealant applied. When applying a thick coating of 1″, the foam sealant expanded
nearly 75%; meanwhile, a coating of 0.25″ produced a total expansion of
approximately 50%, for a final thickness of 0.375″. This may be attributed to the
volume of additives in the foam sealant, as smaller quantities of foam sealant will
contain less crosslinker. The hydrogen gas may tend to escape from the sealant as
a whole, instead of creating bubbles within the bulk sealant. For sealants with a
larger thickness, however, more time may be needed for the gas to diffuse from
the sealant; this may result in an increased foaming effect as more bubbles may
stay trapped inside the structure of the sealant.
64
The stress at 100% strain (modulus) was observed to drop significantly for the
solid sealant over an aging period of six months. The rate of deterioration of the
solid sealant was more significant than that of the foam sealant. The specimens
treated with primer did not show any noticeable change in modulus as a function
of aging. Soaking in road-salt solution did not have a significant effect in the
reduction of the modulus of either sealants
The sealants were installed onto three bridges, at three different locations in the
state of Connecticut, to monitor their in-service performance under realistic
environmental and vehicular demands. After several site visits, no damage was
observed on the Route 6 and Route 22 bridges. However, some punctures and
tears were observed on the Route 291 (a bridge that experiences higher traffic
volumes and joint gap movements) during the most recent site visit on March 23,
2016.
Based on the research study performed in this project, the following directions can be
considered for future work:
Further development of an applicator that will make field installation easier and
more efficient, as combining five ingredients (especially the small amounts of
chemical additives) can be difficult. In this regard, it is imperative to develop a
two-component formulation, including variations for cold and hot temperature.
A fatigue test may be beneficial to understanding the behavior of each type of
sealant, when repeated impacts cause the material to slightly expand and contract
due to the movement of the bridge deck.
A larger sample size of bridges for field installation may be helpful to determine
whether the sealant can adhere to bridges with different geometries, substrate
headers, movement behavior, traffic patterns, and environmental conditions.
Quantitative, or at least ordinal, scoring of sealant field performance is needed.
This might be done by observing the leakage at the abutment during a rain event to
determine the condition of the seal.

65
6.0 REFERENCES
AASHTO (2012). Maintenance manual for roadways and bridges, American Assoc. of
State Highway and Transportation Officials (AASHTO), Washington, D.C.
ASCE (2013). “Report card for America’s infrastructure.” Infrastructure Advisory
Council, American Society of Civil Engineers (ASCE), Reston, VA.
ASTM (2003). “Standard test method for hot water accelerated aging of glass-fiber
reinforced cement-based composites.” ASTM Standard C1560, ASTM International,
West Conshohocken, PA. www.astm.org (Aug. 1, 2015).
ASTM (2000). “Standard method for determining tensile adhesion properties of structural
sealants.” ASTM Standard C1135. ASTM International, West Conshohocken, PA.
www.astm.org (Aug. 1, 2015).
ASTM (2009). “Standard guide for use of joint sealants.” ASTM Standard C1193, ASTM
International, West Conshohocken, PA. www.astm.org (Aug. 1, 2015).
BASF/WBA (2015). “Bridge and highway maintenance – expansion joint systems.”
BASF/Watson Bowman Acme (WBA) Corp., Amherst, NY.
Bramel, B.K., Dolan, C.W., Puckett, J.A., and Ksaibati, K. (2000). “Asphalt plug joints:
refined material tests and design guidelines.” Transportation Research Record, No.
1740, 126-134.
Burke, M.P. (1989). “Bridge deck joints.” NCHRP Synthesis 141, Transportation
Research Board, Washington, D. C.
CT DOT (2001). Bridge inspection manual version 2.1, Connecticut Department of
Transportation (CT DOT), Newington, CT.
CT DOT (2003). Bridge design manual - 2003 edition, Connecticut Department of
Transportation (CT DOT), Newington, CT.
CT DOT (2015). “Winter highway maintenance operations: Connecticut.” Connecticut
Department of Transportation (CT DOT), Newington, CT/ Connecticut Academy of
Science and Engineering, Rocky Hill, CT.
Dow Corning (2004a). “Dow Corning 902 RCS joint sealant.” Form No. 62-181F-01,
Dow Corning Corporation, Midland, MI. www.dowcorning.com (Nov. 1, 2014).
Dow Corning (2004b). “Dow Corning 1200 OS primer clear.” Dow Corning Corporation,
Midland, MI.
http://www.dowcorning.com/applications/search/default.aspx?R=939EN(Nov.1, 2014).

66
Dow Corning (2004c). “Dow Corning Construction – Primer P.” Dow Corning
Corporation, Midland, MI.
http://www.bondedmaterials.net/assets/data/dow_corning_primer_p.pdf (Nov. 1, 2014).
Dornsife, R.J. (2000). “Chapter 25: Expansion joints.” Bridge engineering handbook (W.
F. Chen and L. Duan, eds.), CRC, Boca Raton, FL.
DSB (2015). “Expansion joint systems.” D.S. Brown (DSB), North Baltimore, OH.
http://www.dsbrown.com/Resources/Bridges/Expansion-Joint-Systems-Brochure.pdf
(Nov. 1, 2015).
FHWA (1980). “Expansion devices for bridges.” Technical Advisory T5140.15, U.S.
Dept. of Transportation, Washington, D.C.
FHWA (2014). Traffic monitoring guide, Federal Highway Administration (FHWA),
U.S. Dept. of Transportation, Washington, D.C.
Fincher, H.E. (1983). “Evaluation of rubber expansion joints for bridges.” Rep. No.
FHWA/IN/RTC-83/1, FHWA, U.S. Dept. of Transportation, Washington, D.C., 15–16.
Gelest (2003). “Adhesives and sealants.” Gelest Inc., Morrisville, PA.
http://www.gelest.com (Nov. 1, 2014).
Hamilton, C. D. (1985). “Bridge deck expansion joints final report.” Rep. No. FHWA-
ME-TP-84-04, Maine Department of Transportation, Augusta, ME.
IL DOT (2011). “Silicone bridge joint sealer.” Manuals, Guides and Handbooks, Illinois
Department of Transportation, IL.
Instron 1011 (2010). “Instru-Met remanufactured Instron model 1000 series test frames.”
Instru-Met Corporation, Union, NJ, USA. (Nov. 1, 2014).
Kraft, W.H., Ed. (2008). “Traffic engineering handbook.” Publication No. TB-010B.
Institute of Transportation Engineers, Washington, D.C.
Kruszewski (2016). “Salt-water aging, bonding, and in-Service performance of a novel
poured silicone expansion joint sealant for small movement bridges.” M. S. Thesis
(Faculty Advisor: R. Malla), Univ. of Conn., Storrs, CT.
Lee, D.J. (1994). Bridge bearings and expansion joint, Alden Press, Oxford, UK.
Lesa Systems (2016). “Lesa G joint system.” Lesa Systems Ltd., Auckland, New
Zealand.
Lourakis, M.I.A. (2005). “A brief description of the Levenberg-Marquardt algorithm
implemented by Levmar.” Institute of Computer Science, Crete, Greece.

67
http://users.ics.forth.gr/~lourakis/levmar/levmar.pdf (Dec. 15, 2015).
Malla, R., Shrestha, M., Shaw, M., and Boob, S. (2005a). “Silicone foam sealant for
bridge expansion joints,” Proc., 2005 Joint ASCE/ASME/SES Conference on
Mechanics and Materials - McMat 2005; Baton Rouge, LA, June, 6 pages.
Malla, R., Shrestha, M., Shaw, M., and Boob, S. (2005b). “Experimental evaluation of
silicone foam sealant for bridge expansion joints.” Paper #416, Proc., 2005 SEM
Annual Conf. and Expo., Soc. for Experimental Mech. (SEM), Bethel, CT, 8 pages.
Malla, R., Shaw, M., Shrestha, M., and Boob, S. (2006). “Sealing small movement bridge
expansion joints.” NETCR-58, Final NETC 02-6 Project Rep., New England
Transportation Consortium, Fall River, MA, June, 112 pages.
http://www.uvm.edu/~transctr/pdf/netc/netcr58_02-6.pdf.
Malla, R.B., Shaw, M.T., Shrestha, M.R., and Brijmohan, S.B. (2007). “Development
and laboratory analysis of silicone foam sealant for bridge expansion joints.” J. Bridge
Eng., 12(4), 438–448.
Malla, R.B., Swanson, B., and Shaw, M.T. (2011a), “Laboratory evaluation of a silicone
foam sealant for field application on bridge expansion joints.” Experimental and
Applied Mechanics, Proc. of the 2010 Conference Society for Experimental Mechanics
Series, Vol. 6, Springer Publishing , New York, May, 805-816.
Malla, R.B., Shrestha, M. R., Shaw, M.T., and Brijmohan, S.B. (2011b). “Temperature
aging, compression recovery, creep, and weathering of a foam silicone sealant for
bridge expansion joints.” J. Mater. Civ. Eng., 23(3), 287–298.
Malla, R.B., Shaw, M.T., Swanson, B., and Gionet, T. (2011c). “NETC 02-6: Sealing
small movement bridge expansion joints (Phase 2) – Field demonstration and
monitoring.” Final Project Report, Project NETC 02-6, New England Transportation
Consortium, Fall River, MA, July 31, 2011, 128 pages.
http://www.uvm.edu/~transctr/pdf/netc/netcr86_02-6_phase2.pdf (Sept. 15, 2015).
Malla, R.B., Swanson, B., and Shaw, M.T. (2011d). “Laboratory evaluation of a silicone
foam sealant bonded to various expansion joint header materials.” Constr. Building
Mat., 25(11), 4132–4143.
Milner, M.H. and Shenton III, H. W. (2014). “Survey of past experience and state-of-the-
practice in the design and maintenance of small movement expansion joints in the
Northeast.” Report 242, Transportation System Preservation Technical Services
Program (TSP2), Univ. of Delaware, Newark, DE.
http://sites.udel.edu/dct/files/2013/10/Report-242-TSP2-Small-Movement-Expansion-
Joints-2dzoc1e.pdf (Sept. 01, 2015)

68
MM Systems (2015). “Waterproof expansion joints.” MM Systems Corp., Pendergrass,
GA, USA.
PSI (2015). PSI-Plot, Poly Software International (PSI), Pearl River, NY, USA.
Purvis, R. (2003). “Bridge deck joint performance.” NCHRP Synthesis 319,
Transportation Research Board, Washington, D.C.
Shrestha, M.R., Malla, R.B., Boob, S. and Shaw, M.T., (2006). “Laboratory evaluation of
weathering and freeze-thaw effects on silicone foam bridge joint sealant.” Paper #369,
Proc., 2006 SEM Annual Conference and Exposition, SEM, Bethel, CT, 8 pages.
Swanson, B.J., Malla, R.B., and Shaw, M.T. (2013). “Laboratory testing, field
installation, and monitoring of a silicone foam sealant for bridge expansion joints.” J.
Bridge Engineering, 18(8), Aug., 758-767.
Tensa (2015). “Cantilever finger joints – TENSA-FINGER RSFD.” Mageba Ltd, Eastern
Creek, Australia. http://www.mageba.com.au.
TransTek (2016). “TransTek series 240 general purpose DC LVDTs.” TRANS-TEK,
Inc., Ellington, CT. http://transtekinc.com/products/series-350/ (Jan. 2015, 2016).
Tremco (2014). “Sealant restoration guide.” Guide to Commercial Sealants and
Waterproofing, Tremco Waterproofing. Beachwood, OH.
http://www.thorosystem.com/Documents/SEALANT_RESTORATION_GUIDE_10-6-
08.pdf (Feb. 5, 2016).
USC (2015). “Febajoint highways agency type 2 asphaltic plug joint.” Universal Sealants
Company, England, U.K.
WBA (2001). “WABO_SiliconeSeal installation procedure.” Watson Bowman Acme
Corp., Amherst, NY.
http://www.wbacorp.com/Products/ProductInstallationProcedures.aspx?ProductlineID=
48 (Nov. 1, 2014).
WBA (2008a). “WABO_SiliconeSeal.” Watson Bowman Acme Corp., Amherst, NY.
https://wbacorp.com/products/bridge-highway/joint-seals/wabo-siliconeseal-bridge/
(Nov. 1, 2014).
WBA (2008b). “Wabocrete II.” Watson Bowman Acme Corp., Amherst, NY.
https://wbacorp.com/products/parking-sturctures-and-stadiums/accessories-parking-
stadiums/wabo-crete-ii/.
WBA (2008c). “WABO_SiliconeSeal installation procedure.” Watson Bowman Acme
Corp., Amherst, NY.
https://wbacorp.com/public/userfiles/WaboSiliconeSeal_Install.pdf (Nov. 1, 2014).