effective rates of corporation tax in ireland: technical paper, april
TRANSCRIPT

Effective Rates of Corporation Tax in Ireland: Technical Paper, April 2014

Department of Finance | Technical Paper on Effective Rates of Corporation Tax in Ireland Page | i
Contents EXECUTIVE SUMMARY............................................................................................................. iii SECTION 1: INTRODUCTION ..................................................................................................... 1
1.1 BACKGROUND ............................................................................................................... 1 1.2 DIFFERENT METHODOLOGIES ......................................................................................... 4
SECTION 2: THE MODEL COMPANY APPROACH ........................................................................ 8
2.1 EUROPEAN COMMISSION/ZEW: THE GRIFFITH/DEVEREUX METHODOLOGY ...................... 8 2.2 WORLD BANK/PWC: PAYING TAXES ............................................................................ 10
SECTION 3: THE NATIONAL AGGREGATES APPROACH ............................................................ 13
3.1 CENTRAL STATISTICS OFFICE: NATIONAL INCOME ACCOUNTS ....................................... 13 3.2 REVENUE COMMISSIONERS: CORPORATION TAX DISTRIBUTION STATISTICS ................... 21 3.3 RECONCILING THE NATIONAL AGGREGATES MEASURES ............................................... 29
SECTION 4: COMBINED COMPANY APPROACH........................................................................ 36
4.1 THE IRISH TIMES: TOP 1000 IRISH COMPANIES ............................................................. 36 4.2 US BUREAU OF ECONOMIC ANALYSIS: DIRECT INVESTMENT ABROAD DATA .................. 36
SECTION 5: CONCLUSION ...................................................................................................... 40
Department of Finance | Technical Paper on Effective Rates of Corporation Tax in Ireland Page | ii
List of Tables
Page
Table 1: Selected Effective Corporate Tax Rates Attributed to Ireland iii
Table 2.1.1: Simplified Example of Impact of Tax Credits on Effective Rates of Tax 3
Table 2.1.1: AETR by Type of Asset 8
Table 2.1.2: AETR by Source of Finance 8
Table 2.1.3: Average Effective Tax Rates by Type of Asset and Source of Finance, 2012 9
Table 2.2.1: The Total Tax Rate calculation for Ireland in 2012 in Paying Taxes 11
Table 3.1.1: Determination of Net Operating Surplus of the Corporate Sector in 2012 13
Table 3.1.2: Effective Tax Rate on Net Operating Surplus in 2012 14
Table 3.1.3: Calculation of Eurostat’s Implicit Tax Rate on Corporate Income in 2012 15 Table 3.1.4: Effective Tax Rates on Net Operating Surplus and Eurostat’s Measure of
Corporate Income 2003-2012 18 Table 3.1.5: Composition in the National Accounts of interest paid by non-financial
corporations 19
Table 3.2.1: Calculation of Taxable Income from Total Income, 2011 22
Table 3.2.2: Calculation of Tax Payable from Taxable Income, 2011 24
Table 3.2.3: Tax Due as a Proportion of Taxable Income in 2011 25
Table 3.2.4: Tax Burden as a Proportion of Taxable Income in 2011 26 Table 3.2.5: Main Income & Tax Measures from Revenue Commissioners’ Corporation
Tax Distribution Statistics 27
Table 3.2.6: Deductions from Total Income to Determine Taxable Income 28
Table 3.3.1: Corporation Tax Measures 30
Table 3.3.2: Corporate Income Measures 31
Table 3.3.3: Capital Gains taxed under and Losses Available for Corporation Tax 32 Table 4.2.1: Income Statement for US-owned, Irish-Incorporated Companies in BEA
USDIA data 37
Department of Finance | Technical Paper on Effective Rates of Corporation Tax in Ireland Page | iii
EXECUTIVE SUMMARY
This Technical Paper considers calculations for an effective tax rate on corporate profits in
Ireland. This is done under three broad headings: using model companies; using official
national statistics; and using company financial reports. Between these, eight approaches
for calculating the effective tax rate on company profits are identified.
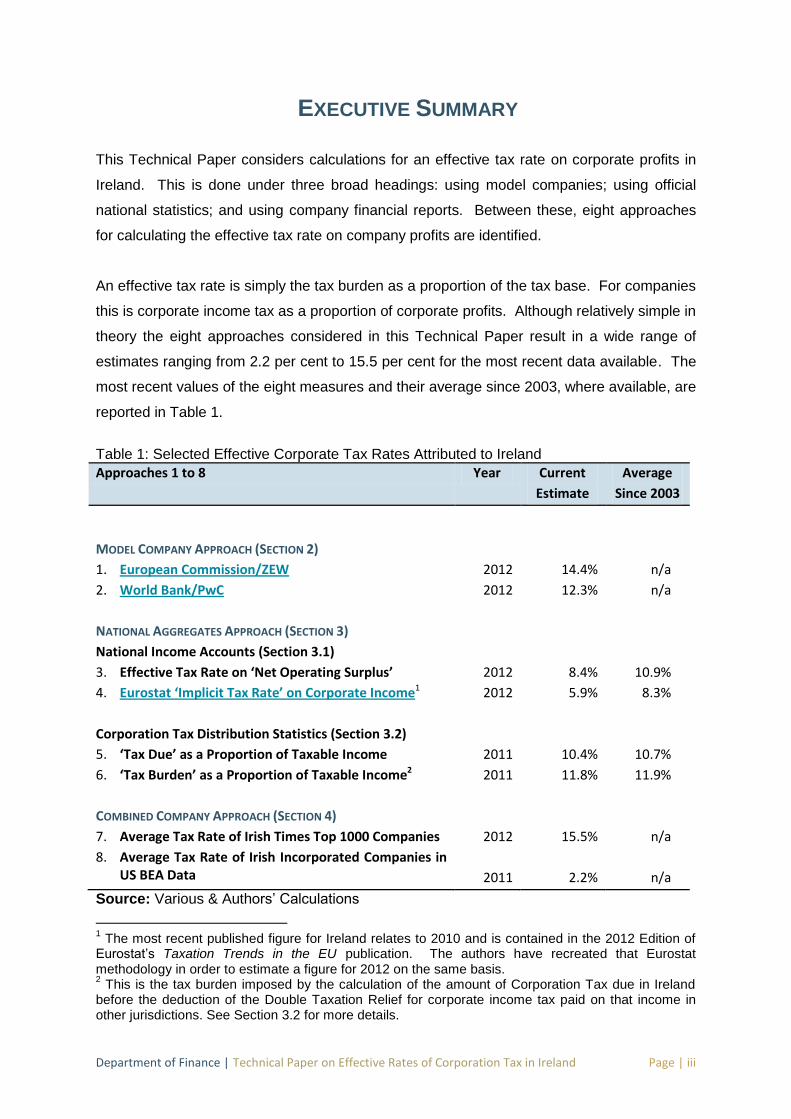
An effective tax rate is simply the tax burden as a proportion of the tax base. For companies
this is corporate income tax as a proportion of corporate profits. Although relatively simple in
theory the eight approaches considered in this Technical Paper result in a wide range of
estimates ranging from 2.2 per cent to 15.5 per cent for the most recent data available. The
most recent values of the eight measures and their average since 2003, where available, are
reported in Table 1.
Table 1: Selected Effective Corporate Tax Rates Attributed to Ireland
Approaches 1 to 8 Year Current
Estimate
Average
Since 2003
MODEL COMPANY APPROACH (SECTION 2)
1. European Commission/ZEW 2012 14.4% n/a
2. World Bank/PwC 2012 12.3% n/a
NATIONAL AGGREGATES APPROACH (SECTION 3)
National Income Accounts (Section 3.1)
3. Effective Tax Rate on ‘Net Operating Surplus’ 2012 8.4% 10.9%
4. Eurostat ‘Implicit Tax Rate’ on Corporate Income1 2012 5.9% 8.3%
Corporation Tax Distribution Statistics (Section 3.2)
5. ‘Tax Due’ as a Proportion of Taxable Income 2011 10.4% 10.7%
6. ‘Tax Burden’ as a Proportion of Taxable Income2 2011 11.8% 11.9%
COMBINED COMPANY APPROACH (SECTION 4)
7. Average Tax Rate of Irish Times Top 1000 Companies 2012 15.5% n/a
8. Average Tax Rate of Irish Incorporated Companies in US BEA Data
2011
2.2%
n/a
Source: Various & Authors’ Calculations
1 The most recent published figure for Ireland relates to 2010 and is contained in the 2012 Edition of
Eurostat’s Taxation Trends in the EU publication. The authors have recreated that Eurostat methodology in order to estimate a figure for 2012 on the same basis. 2 This is the tax burden imposed by the calculation of the amount of Corporation Tax due in Ireland
before the deduction of the Double Taxation Relief for corporate income tax paid on that income in other jurisdictions. See Section 3.2 for more details.
Department of Finance | Technical Paper on Effective Rates of Corporation Tax in Ireland Page | iv
This Technical Paper explains the methodology behind these approaches and attempts to
assess their suitability as measures of the effective corporate tax rate in Ireland. At the
outset it should be noted that there is no single best measure that summarises the effective
corporate tax rate. Different approaches are relevant depending on the task in hand. For
some measures, looking at the result for a single year can be misleading due to the impact
of the business cycle on; income and capital gains/losses, the use of ‘trading losses carried
forward’ and the timing of tax payments. The purpose of this Paper is to provide detail on
the effective corporate tax rate that is applied to the aggregate total of corporate profits in
Ireland.
1. The Model Company Approach
The first method is a comparison of the estimated tax liability in different jurisdictions for a
model or benchmark company. It is based on the creation of model companies which are
endowed with certain characteristics. The analysis then examines how the profits of such
model companies would be taxed across a range of jurisdictions. While this is a strength in
terms of comparability across jurisdictions, it does mean that the model cannot represent the
composition of all companies that operate in each country. This methodology does calculate
the appropriate effective rate for the model company, providing a good comparison of
effective tax rates across countries in a standard setting. It can also give an insight into the
breadth of the taxable base by comparing the calculated effective rate to the headline or
statutory rate. It cannot, however, calculate an effective tax rate for a company that
operates across multiple jurisdictions and it offers limited insight in respect of companies that
operate across borders as international trading is usually excluded as a feature of the model
company.
Two reports using the model company approach are assessed in this Technical Paper, one
undertaken for the European Commission by ZEW Centre for European Economic Research
(Approach No.1 – 14.4 per cent in 2012) and a second for the World Bank by PwC
(Approach No. 2 – 12.3 per cent in 2012). However, the conclusion is that neither is suitable
for providing an estimate of the effective rate of Corporation Tax on the aggregate total of
corporate profits earned in Ireland.
2. The National Aggregates Approach
The second approach to determining effective corporate tax rates is to look at the average
corporate tax burden of the entire corporate sector in a country using statistics commonly
Department of Finance | Technical Paper on Effective Rates of Corporation Tax in Ireland Page | v
available from the relevant tax authority or statistical agency in each country. The idea here
is to look at a measure of the total amount of corporation tax in a given year and to divide it
by the total amount of profit earned by companies operating in the country. Within this
approach, a number of measures of taxation (tax paid or tax due) and income (taxable
income or operating surplus) can be used. Using data from the Central Statistics Office and
the Revenue Commissioners, four estimates of the effective tax rate on profits earned in
Ireland are analysed.
This Technical Paper shows that the most appropriate measures of the effective corporate
income tax rate applying to the total of corporate profits in Ireland are the tax rate as
calculated based on ‘Net Operating Surplus’3 from the National Income Accounts which are
produced by the Central Statistics Office (Approach No. 3) , and the tax due as a proportion
of Taxable Income from the Corporation Tax Distribution Statistics produced by the Revenue
Commissioners (Approach No. 5). The most recent figures are 8.4 per cent for the former
and 10.4 per cent for the latter, and their averages since 2003 are 10.9 per cent and 10.7
per cent, respectively as shown in Table 1 above. The two measures are similar in concept
but there are notable differences between them.
The primary reason the effective rate on Net Operating Surplus (Approach No. 3) is, on
average, below the headline 12.5 per cent rate is because a portion of the interest
expenditure incurred by non-financial corporations is not deducted when determining Net
Operating Surplus in the national accounts. This interest is attributed to the financing rather
the operating of non-financial corporations in the national accounts. In 2011, non-financial
corporations incurred €7.5 billion of interest expenditure of which €5.2 billion was excluded
from the determination of Net Operating Surplus as it was attributed to the financing rather
than the operating of the companies. This lowers the effective tax rate on Net Operating
Surplus as it increases the measure of profit on which the effective rate is based.
The average of tax due as a proportion of Taxable Income (Approach No. 5) is lower than
the 12.5 per cent rate because Taxable Income includes the foreign-source profits of Irish-
resident companies, all of which are granted relief for any corporate income tax paid in other
countries on these foreign-source profits so as to avoid double taxation. In 2011, this relief
was €567 million and once account is taken of that the Revenue Commissioners’ data
indicates a corporate tax burden in Ireland of 11.8 per cent of Taxable Income (Approach
No. 6).
3 From National Accounts the measure of Net Operating Surplus can be used to represent the
aggregate of corporate profits in the economy.

Department of Finance | Technical Paper on Effective Rates of Corporation Tax in Ireland Page | vi
Eurostat publish an annual set of implicit tax rates (ITRs) for a range of tax bases including
corporate income. Using Eurostat’s methodology the 2012 figure for this implicit tax rate on
corporate income in Ireland is estimated in this Technical Paper to be 5.9 per cent
(Approach No. 4). The rate has averaged 8.3 per cent since 2003. There are a number of
issues that mean this is not an appropriate measure of the tax burden imposed by the Irish
system of Corporation Tax on company profits subject to tax in Ireland. Foremost amongst
these is the inclusion of interest and dividend income received by investment funds which
are valued at around €1 trillion based in Ireland, which have a disproportionate impact on the
Irish measures relative to most other EU countries. These receipts are counted as part of
the income of the corporate sector in Eurostat’s measure but are an artificial inflating of the
measure of corporate profitability in Ireland. The income of such collective investment funds
is taxed at the level of the investor rather than the fund, as is standard international practice.
In recent years the measures of effective corporate income tax rates based on the data from
the CSO’s National Accounts have been falling. The primary reason for this is the treatment
of capital gains and trading losses carried forward under Corporation Tax which caused the
effective rate in the National Accounts to be higher in the years up to 2007 (because of
Corporation Tax due on the capital gains of companies) and lower in the years since then
(because of use of trading losses carried forward to reduce tax due). Net Operating Surplus
is not affected by capital gains or losses carried forward but corporate tax can be higher or
lower depending on these gains and losses. The recent trend in Ireland has been for those
factors to result in a decreasing effective rate on Net Operating Surplus.
3. The Combined Company Approach
A final methodology is to aggregate firm-level data according to some fixed criteria. The
National Aggregates Approach described in the previous section is based on aggregating
firms by country, either for national accounts or taxation purposes. The Combined Company
Approach equally aggregates firm-level data but the criteria for inclusion do not necessarily
match jurisdictional boundaries. The approach uses published or reported company
accounts and determines an aggregate or average measure of tax paid on company income
using the data collected. The approach may not be informative in determining the effective
tax rate on profits by country as the company data is usually not disaggregated by each
country of operation, as would be required under a system of country-by-country reporting.
The approach is appropriate for determining the effective tax rate of the companies included.
However, if the companies included operate across multiple jurisdictions the approach can
Department of Finance | Technical Paper on Effective Rates of Corporation Tax in Ireland Page | vii
give an accurate estimate of the global effective tax rate for those companies but will not
necessarily be reflective of the corporate income tax imposed by any particular country.
The Irish Times aggregate the tax paid for their set of ‘The Top 1000 Irish Companies’ but
the extent to which the aggregated data reflect profits earned in Ireland and tax paid only in
Ireland is not clear (Approach No. 7). The federal economics statistics agency in the United
States, the Bureau of Economic Analysis (BEA), aggregates the data of all foreign-owned
subsidiaries of US companies (Approach No. 8). The BEA provides a by-country breakdown
of the figures but the country allocation is done on the basis of place of incorporation rather
than location of operations. For all countries in the BEA data the figures are the profits
earned and tax paid of companies incorporated in those countries, which may represent the
profit and tax outcomes for those companies in many other countries. The BEA figures
attributed to Ireland relate to the Irish-incorporated subsidiaries of US companies. There is
no restriction on these companies to limit their operations to Ireland. The figures in BEA data
represent their operations everywhere, not just in Ireland (to the extent they have any in
Ireland at all). The profits reported by these Irish-incorporated subsidiaries of US companies
are far in excess of the totals that appear in either the CSO’s or Revenue Commissioners’
data. The BEA data does highlight the ability of certain US companies to achieve very low
effective rates for the foreign tax paid on their non-US sourced profits arising from their
operations across multiple jurisdictions (including Ireland) but cannot give an appropriate
measure of the effective corporate tax rate applying to their Irish profits.
The conclusion of this Technical Paper is that the data from the CSO and Revenue
Commissioners provide the best estimate of the effective rate of Corporation Tax on the total
profits that are subject to Irish tax (Approaches No.3 and No. 5). The figures in this
Technical Paper show that, since 2003, these have averaged 10.9 per cent and 10.7 per
cent respectively.
Department of Finance | Technical Paper on Effective Rates of Corporation Tax in Ireland Page | 1
SECTION 1: INTRODUCTION
1.1 BACKGROUND
The effective rate of corporation tax paid by companies has been the subject of much debate
in Ireland and internationally. It is part of the broader debate on international tax issues
which has a particular focus on the taxation of multinational companies – some of whom
appear to be able to structure their global affairs in such a way as to pay very low effective
rates of tax.
The question of what is the effective rate of corporation tax in Ireland has been asked
repeatedly but, in the absence of a single, internationally agreed, methodology, there have
been a variety of conflicting answers from a variety of different sources. During the course
of debate at Committee Stage of Finance (No.2) Act 2013 on November 27th 2013, it was
agreed that the Department of Finance would provide the Oireachtas Committee on Finance,
Public Expenditure and Reform with a Technical Paper on the matter by the end of the first
quarter of 2014.
The Department of Finance commissioned Seamus Coffey, Lecturer in Economics in
University College Cork, to conduct the work jointly with Kate Levey, a tax-qualified Assistant
Principal in the Fiscal Policy Division of the Department of Finance.
The contribution of staff in the Central Statistics Office, the Office of the Revenue
Commissioners and PwC Ireland in supplying and explaining the data referred to in this
Technical Paper is gratefully acknowledged. Of course, all errors and omissions remain the
responsibility of the authors.
This Technical Paper looks at three different methodologies used in the calculation of
‘effective rates’ of corporation tax generally. The main figures being quoted in respect of
Ireland are examined in further detail in sections two to four. In the case of the measures
reported for the National Aggregates Approach some differences between the reported
figures are also explained. The work is important provide clarity about the seemingly
conflicting figures that are frequently quoted. This paper should serve as a resource to
those seeking to understand the issues.
Corporation Tax
Companies operating in Ireland are chargeable to corporation tax at the 12.5 per cent rate
on the profits that are generated from their trading activities. The 10 per cent corporation tax
rate for profits from manufacturing expired at the end of 2010 and the 12.5 per cent rate now
Department of Finance | Technical Paper on Effective Rates of Corporation Tax in Ireland Page | 2
applies to such profits. A higher 25 per cent rate applies in respect of investment, rental and
other non-trading profits, as well as certain petroleum, mining and land-dealing activities,
while chargeable capital gains are taxable at the capital gains tax rate of 33 per cent.
A company resident in Ireland is liable to Corporation Tax on its worldwide profits. Whether
or not these profits are brought into Ireland is irrelevant for this purpose. For Irish resident
companies with foreign-source profits, double taxation relief is available for corporate income
tax paid in other jurisdictions. A company which is not resident in Ireland for tax purposes
but which has a taxable presence in Ireland will only be liable for Corporation Tax on its
profits sourced in Ireland.
What is meant by the ‘effective’ rate of corporate tax?
The statutory or headline rate of tax is the rate that is applied to the ‘taxable income’ of
companies in order to calculate their tax liability before any tax credits are applied in order to
reduce the tax liability.
Generally speaking, corporation tax is understood to apply to the profits made by
companies. The ‘effective’ rate of tax is generally understood to mean the tax paid as a
percentage of the profits of companies. Profit is generally understood to be its turnover /
income less current expenses (labour, raw materials and depreciation of fixed assets).
When comparing corporate tax rates across countries, (and when comparing the tax rates
applied to different sectors of the economy or factors of production), the ‘effective’ tax rate
should be a better measure of the actual level of tax burden than the statutory or headline
rate because it takes account of the existence of tax reliefs/credits and differences in the
taxable base.
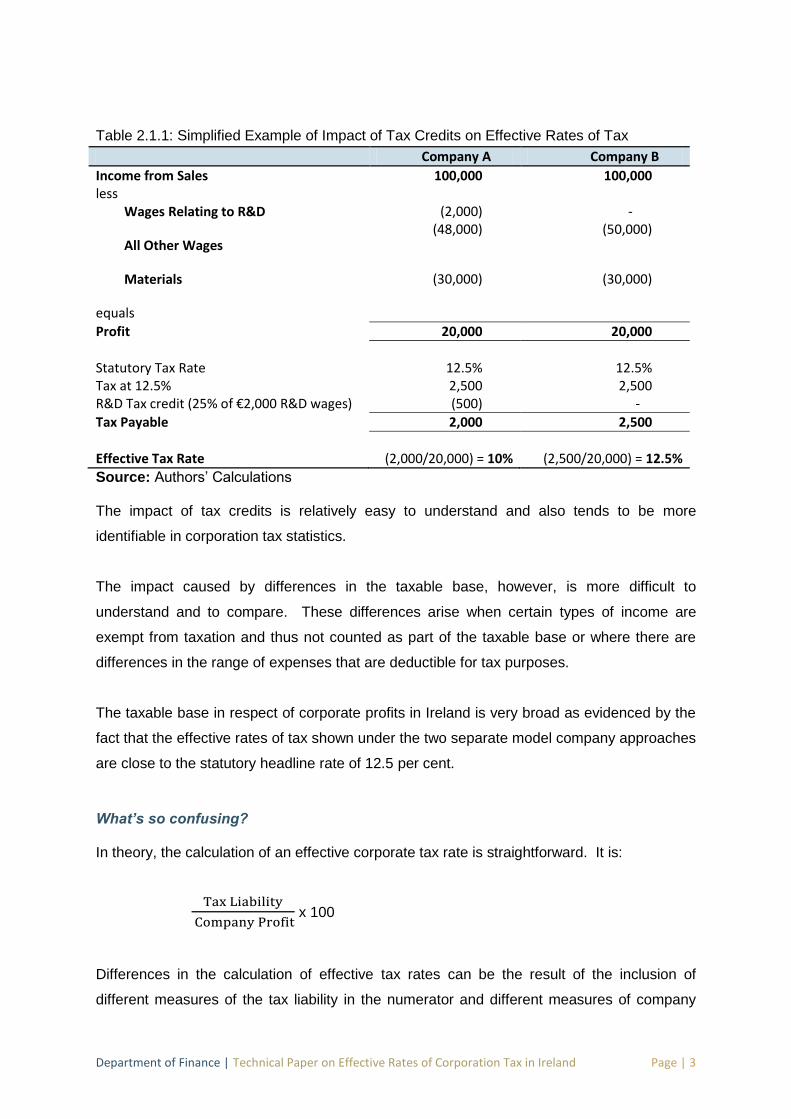
Table 2.1.1 sets out a simplified example of the difference in effective rate arising for two
companies, with identical total amounts of income and expenses, due to the fact that some
of the expenses incurred by Company A qualify for the Research and Development (R&D)
Tax Credit. In general terms, and subject to certain limits, 25 per cent of eligible R&D
expenditure can be used as a credit against corporation tax due.
Department of Finance | Technical Paper on Effective Rates of Corporation Tax in Ireland Page | 3
Table 2.1.1: Simplified Example of Impact of Tax Credits on Effective Rates of Tax
Company A Company B
Income from Sales 100,000 100,000 less
Wages Relating to R&D
All Other Wages
(2,000) (48,000)
- (50,000)
Materials (30,000) (30,000)
equals
Profit 20,000 20,000
Statutory Tax Rate 12.5% 12.5% Tax at 12.5% 2,500 2,500 R&D Tax credit (25% of €2,000 R&D wages) (500) -
Tax Payable 2,000 2,500
Effective Tax Rate (2,000/20,000) = 10% (2,500/20,000) = 12.5%
Source: Authors’ Calculations The impact of tax credits is relatively easy to understand and also tends to be more
identifiable in corporation tax statistics.
The impact caused by differences in the taxable base, however, is more difficult to
understand and to compare. These differences arise when certain types of income are
exempt from taxation and thus not counted as part of the taxable base or where there are
differences in the range of expenses that are deductible for tax purposes.
The taxable base in respect of corporate profits in Ireland is very broad as evidenced by the
fact that the effective rates of tax shown under the two separate model company approaches
are close to the statutory headline rate of 12.5 per cent.
What’s so confusing? In theory, the calculation of an effective corporate tax rate is straightforward. It is:
x 100
Differences in the calculation of effective tax rates can be the result of the inclusion of
different measures of the tax liability in the numerator and different measures of company
Department of Finance | Technical Paper on Effective Rates of Corporation Tax in Ireland Page | 4
profit in the denominator.
There are a variety of measures of corporate profit including: trading income and taxable
income based on accounting and taxation principles, and operating surplus and net
entrepreneurial income based on the economic principles of national income accounting. It
is also the case that measures of corporate income can be limited to that earned within a
region (i.e. territorial) or the income earned by a company which can operate across borders
(i.e. worldwide). This variety of options for the denominator is one reason for the different
effective corporation tax rates that may be attributed to the one country.
The choice of options for the tax measure in the numerator is more limited but can also lead
to some variation in the calculation of effective tax rates. The tax liability arising in respect of
the profits earned in a given year is the most appropriate numerator. However, tax paid to
the relevant tax authority in a given period is also sometimes used and there can be timing
differences between the two measures.
1.2 DIFFERENT METHODOLOGIES
This Technical Paper assesses three broad methodologies applied in analysis that attempts
to estimate effective corporate tax rates for Ireland. Throughout this section, the figures
arising from the different approaches are numbered consistent with Table 1 of the Executive
Summary.
Two of the figures that are frequently quoted when referring to effective corporate tax rates
are based on model company analyses. These are from a report produced for the European
Commission in 2012 by the Zentrum für Europäische Wirtschaftsforschung (ZEW or the
Centre for European Economic Research) and the Paying Taxes 2014 - The Global Picture
report produced for the World Bank by PricewaterhouseCoopers, PwC. The most recent
rates for Ireland from these are:
Current Estimate
1. European Commission/ZEW: 14.4 per cent in 2012
2. World Bank/PwC: 12.3 per cent in 2012
The effective tax rates provided by these reports are based on the creation of model
companies which are endowed with certain characteristics. The reports then examine how
the profits of such model companies would be taxed across a range of jurisdictions.
Department of Finance | Technical Paper on Effective Rates of Corporation Tax in Ireland Page | 5
The model company approach is designed to analyse the experience of a ‘typical’ company.
This analysis is very useful for comparing the taxable base across different jurisdictions.
However, all such comparisons are limited to the extent that the company’s structure and
characteristics may not be representative of the norm in different countries. In such a study
it would not be appropriate to use a different model company for each country as then it
would be impossible to determine if differences in the effective corporate tax rate were due
to differences in the corporate tax regime across countries or differences in the
characteristics of the model company used in each country. The application of the tax
regime of each country to a standard model company means that differences are solely a
result of the differing tax treatment of the company’s profits in each country.
Both of these studies show an effective rate of tax for Ireland close to the headline rate of
12.5 per cent which reflects the broad taxable base in Ireland. Neither takes account of tax
incentives. However, in the context of Ireland, there are only a very small number of
targeted incentives in any event, with the largest, in terms of cost, being the R&D tax credit
(€261m in 2010). The two studies are examined in further detail in section two.
The second approach is to look at the average corporate tax burden of the entire corporate
sector in a country. The idea here is to look at the total amount of corporation tax paid in a
given year and to divide it by the total amount of profit earned by companies operating in the
country. This is a relatively straightforward concept and is probably the most relevant to the
question of what is the average rate of tax that companies are paying on the profits they
make in Ireland.
Unfortunately, the simplicity is confined to the concept. In reality, there are significant
differences in the answers produced using this approach depending on the measure of tax
that is used as the numerator and the measure of profit that is used as the denominator
which is where the main issues arise.
There are two commonly-used measures of total corporate profit in the economy and using
them produces the following four effective rates:
Current Estimate Average
Using a National Accounts measure of ‘economic profit’
3. Effective Tax Rate on Net Operating Surplus: 8.4 per cent 10.9 per cent
4. Eurostat Implicit Tax Rate on Corporate Income: 5.9 per cent 8.3 per cent
Department of Finance | Technical Paper on Effective Rates of Corporation Tax in Ireland Page | 6
Using the Revenue Commissioners’ measure of ‘taxable profit’
5. Tax Due as a Proportion of Taxable Income: 10.4 per cent 10.7 per cent
6. Tax Burden as a Proportion of Taxable Income 11.8 per cent 11.9 per cent
Understanding the most appropriate figures to use from the National Accounts tables as well
as the differences between these figures and those from the Revenue Commissioners’
statistics is an important element of understanding the determination of effective Corporation
Tax rates in Ireland. The Taxation Trends in the European Union Report contains a
measure of the ‘implicit tax rate on corporate income’ in respect of each EU Member State.
The 2012 edition refers to a rate of 6.8 per cent for Ireland in 2010. This Technical Paper
applies the same methodology to 2012 data and shows in an estimated implicit tax rate for
corporate income of 5.9 per cent. The rate is based on data compiled by the Central
Statistics Office, collated by Eurostat and is essentially a National Accounts measure. There
are some notable features of the Irish economy, mainly the impact of the International
Financial Services Sector, that explain the difference between both these measures derived
from National Accounts data and highlight the inappropriateness of this implicit tax rate as a
measure of the effective tax rate on corporate income in Ireland. These and other issues
relating to the national aggregates approach are examined in section three.
The final method involves aggregating the data available from company financial statements.
The numerator can either be the tax charge made in the company’s accounts for a particular
accounting period or the cash tax payment made during a particular accounting period,
usually a year in both cases. The denominator is generally pre-tax accounting profits.
Two instances of the application of this approach are considered in this report and, in
respect of 2012 and 2011, are:
Current Estimate
7. The Irish Times Top 1000 Irish Companies Average Tax Rate: 15.5 per cent
8. Irish-Incorporated Companies in US BEA data Average Tax Rate: 2.2 per cent
This method is useful for getting the effective tax rate of companies as it calculates an
effective tax rate in terms of accounting profit, which best reflects their bottom line.
However, the approach presents a number of significant difficulties in determining the
effective corporate tax rate that applies in a particular country. One reason for this is that
companies can operate in multiple countries and the tax charge in their financial accounts
can reflect the tax due across a number of jurisdictions. There can also be issues for the
Department of Finance | Technical Paper on Effective Rates of Corporation Tax in Ireland Page | 7
assigning of companies to countries due to differences in the corporate tax residency rules
used in different jurisdictions. While the measures are useful in considering the effective tax
rates of companies, they are not as relevant to establishing the most appropriate measure of
the effective rate of corporation tax in Ireland.
The purpose of this Technical Paper is to present an analysis of the main methodologies
used to determine effective rates of corporation tax imposed on corporate profits in Ireland.
In doing so the Note assesses their appropriateness and limitations as a potential measure
of the effective corporation tax rate in Ireland. The purpose is not to find a definitive effective
corporate tax rate for Ireland as no single measure is best. The broad conclusion is that the
measures set out in section three using national aggregate data provide the best estimates
of the effective corporate tax rate that company profits in Ireland are subject to. Since 2003
these indicate a tax rate in the region of 11 per cent.
Department of Finance | Technical Paper on Effective Rates of Corporation Tax in Ireland Page | 8
SECTION 2: THE MODEL COMPANY APPROACH
2.1 EUROPEAN COMMISSION/ZEW: THE GRIFFITH/DEVEREUX METHODOLOGY
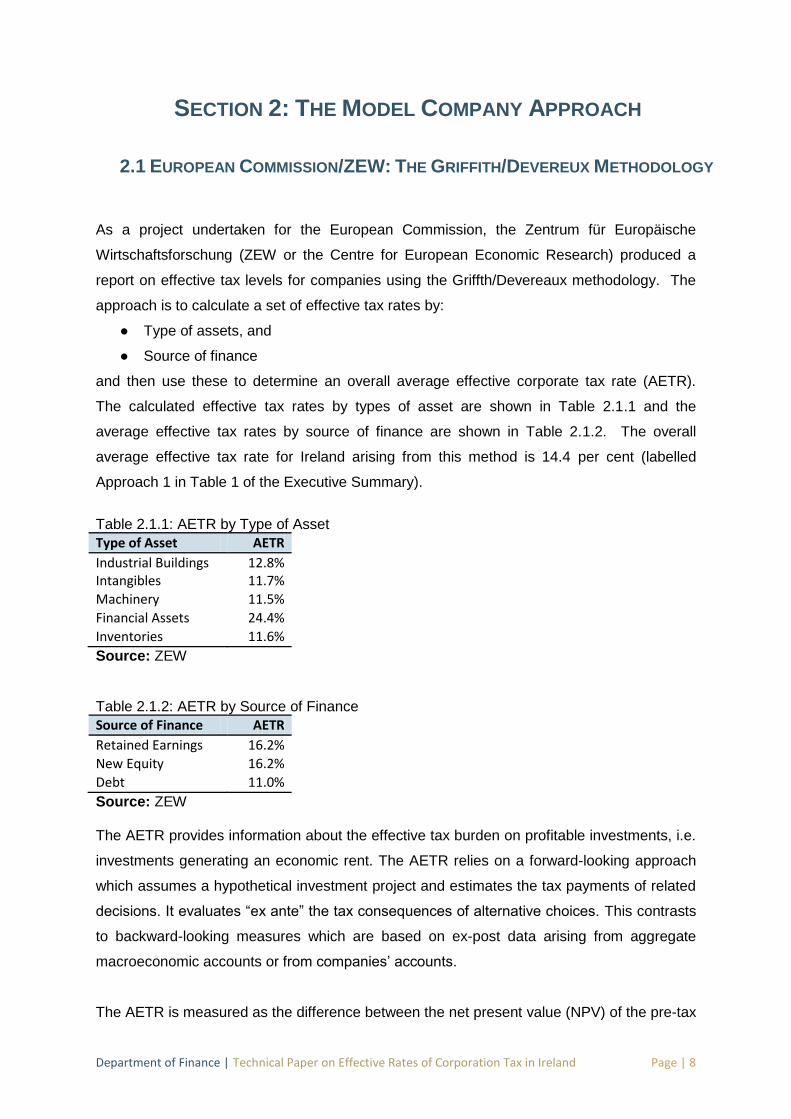
As a project undertaken for the European Commission, the Zentrum für Europäische
Wirtschaftsforschung (ZEW or the Centre for European Economic Research) produced a
report on effective tax levels for companies using the Griffth/Devereaux methodology. The
approach is to calculate a set of effective tax rates by:
● Type of assets, and
● Source of finance
and then use these to determine an overall average effective corporate tax rate (AETR).
The calculated effective tax rates by types of asset are shown in Table 2.1.1 and the
average effective tax rates by source of finance are shown in Table 2.1.2. The overall
average effective tax rate for Ireland arising from this method is 14.4 per cent (labelled
Approach 1 in Table 1 of the Executive Summary).
Table 2.1.1: AETR by Type of Asset
Type of Asset AETR
Industrial Buildings 12.8%
Intangibles 11.7%
Machinery 11.5%
Financial Assets 24.4%
Inventories 11.6%
Source: ZEW Table 2.1.2: AETR by Source of Finance
Source of Finance AETR
Retained Earnings 16.2%
New Equity 16.2%
Debt 11.0%
Source: ZEW The AETR provides information about the effective tax burden on profitable investments, i.e.
investments generating an economic rent. The AETR relies on a forward-looking approach
which assumes a hypothetical investment project and estimates the tax payments of related
decisions. It evaluates “ex ante” the tax consequences of alternative choices. This contrasts
to backward-looking measures which are based on ex-post data arising from aggregate
macroeconomic accounts or from companies’ accounts.
The AETR is measured as the difference between the net present value (NPV) of the pre-tax
Department of Finance | Technical Paper on Effective Rates of Corporation Tax in Ireland Page | 9
income and post-tax income of a new investment project relative to the NPV of the pre-tax
income stream derived from the real pre-tax rate of return. The approach essentially
determines the reduction in the value of the profit stream as a result of the application of
corporate income tax.
With increasing profitability the AETR will come closer to the statutory corporate income tax
rate. The underlying economic reason is the easing relative influence of depreciation,
interest deductibility and other tax accounting rules on the effective tax burden with rising
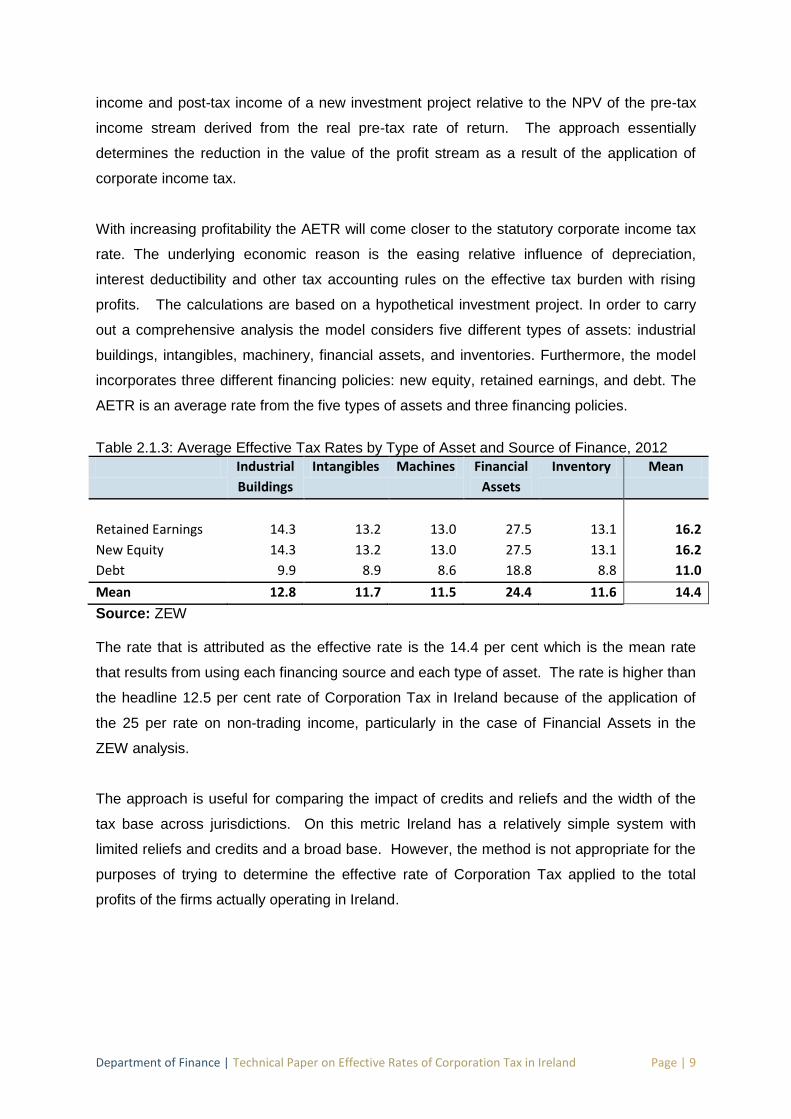
profits. The calculations are based on a hypothetical investment project. In order to carry
out a comprehensive analysis the model considers five different types of assets: industrial
buildings, intangibles, machinery, financial assets, and inventories. Furthermore, the model
incorporates three different financing policies: new equity, retained earnings, and debt. The
AETR is an average rate from the five types of assets and three financing policies.
Table 2.1.3: Average Effective Tax Rates by Type of Asset and Source of Finance, 2012
Industrial
Buildings
Intangibles Machines Financial
Assets
Inventory Mean
Retained Earnings 14.3 13.2 13.0 27.5 13.1 16.2
New Equity 14.3 13.2 13.0 27.5 13.1 16.2
Debt 9.9 8.9 8.6 18.8 8.8 11.0
Mean 12.8 11.7 11.5 24.4 11.6 14.4
Source: ZEW The rate that is attributed as the effective rate is the 14.4 per cent which is the mean rate
that results from using each financing source and each type of asset. The rate is higher than
the headline 12.5 per cent rate of Corporation Tax in Ireland because of the application of
the 25 per rate on non-trading income, particularly in the case of Financial Assets in the
ZEW analysis.
The approach is useful for comparing the impact of credits and reliefs and the width of the
tax base across jurisdictions. On this metric Ireland has a relatively simple system with
limited reliefs and credits and a broad base. However, the method is not appropriate for the
purposes of trying to determine the effective rate of Corporation Tax applied to the total
profits of the firms actually operating in Ireland.
Department of Finance | Technical Paper on Effective Rates of Corporation Tax in Ireland Page | 10
2.2 WORLD BANK/PWC: PAYING TAXES
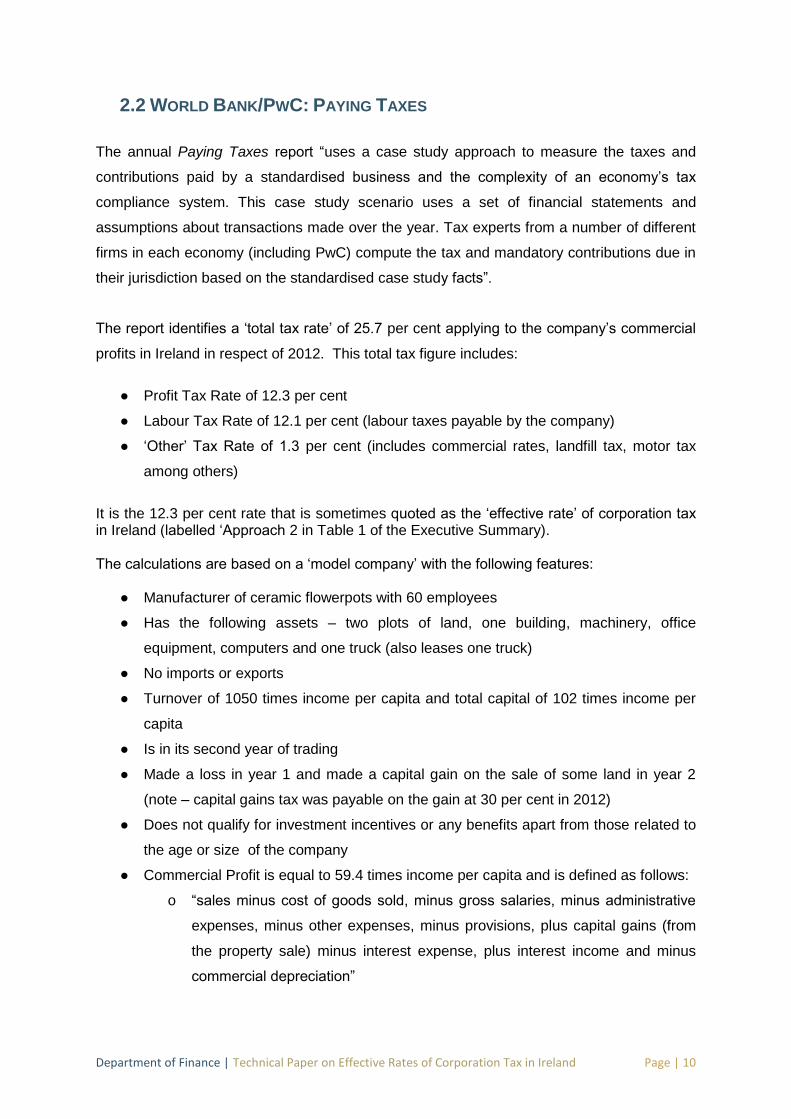
The annual Paying Taxes report “uses a case study approach to measure the taxes and
contributions paid by a standardised business and the complexity of an economy’s tax
compliance system. This case study scenario uses a set of financial statements and
assumptions about transactions made over the year. Tax experts from a number of different
firms in each economy (including PwC) compute the tax and mandatory contributions due in
their jurisdiction based on the standardised case study facts”.
The report identifies a ‘total tax rate’ of 25.7 per cent applying to the company’s commercial
profits in Ireland in respect of 2012. This total tax figure includes:
● Profit Tax Rate of 12.3 per cent
● Labour Tax Rate of 12.1 per cent (labour taxes payable by the company)
● ‘Other’ Tax Rate of 1.3 per cent (includes commercial rates, landfill tax, motor tax
among others)
It is the 12.3 per cent rate that is sometimes quoted as the ‘effective rate’ of corporation tax in Ireland (labelled ‘Approach 2 in Table 1 of the Executive Summary). The calculations are based on a ‘model company’ with the following features:
● Manufacturer of ceramic flowerpots with 60 employees
● Has the following assets – two plots of land, one building, machinery, office
equipment, computers and one truck (also leases one truck)
● No imports or exports
● Turnover of 1050 times income per capita and total capital of 102 times income per
capita
● Is in its second year of trading
● Made a loss in year 1 and made a capital gain on the sale of some land in year 2
(note – capital gains tax was payable on the gain at 30 per cent in 2012)
● Does not qualify for investment incentives or any benefits apart from those related to
the age or size of the company
● Commercial Profit is equal to 59.4 times income per capita and is defined as follows:
o “sales minus cost of goods sold, minus gross salaries, minus administrative
expenses, minus other expenses, minus provisions, plus capital gains (from
the property sale) minus interest expense, plus interest income and minus
commercial depreciation”
Department of Finance | Technical Paper on Effective Rates of Corporation Tax in Ireland Page | 11
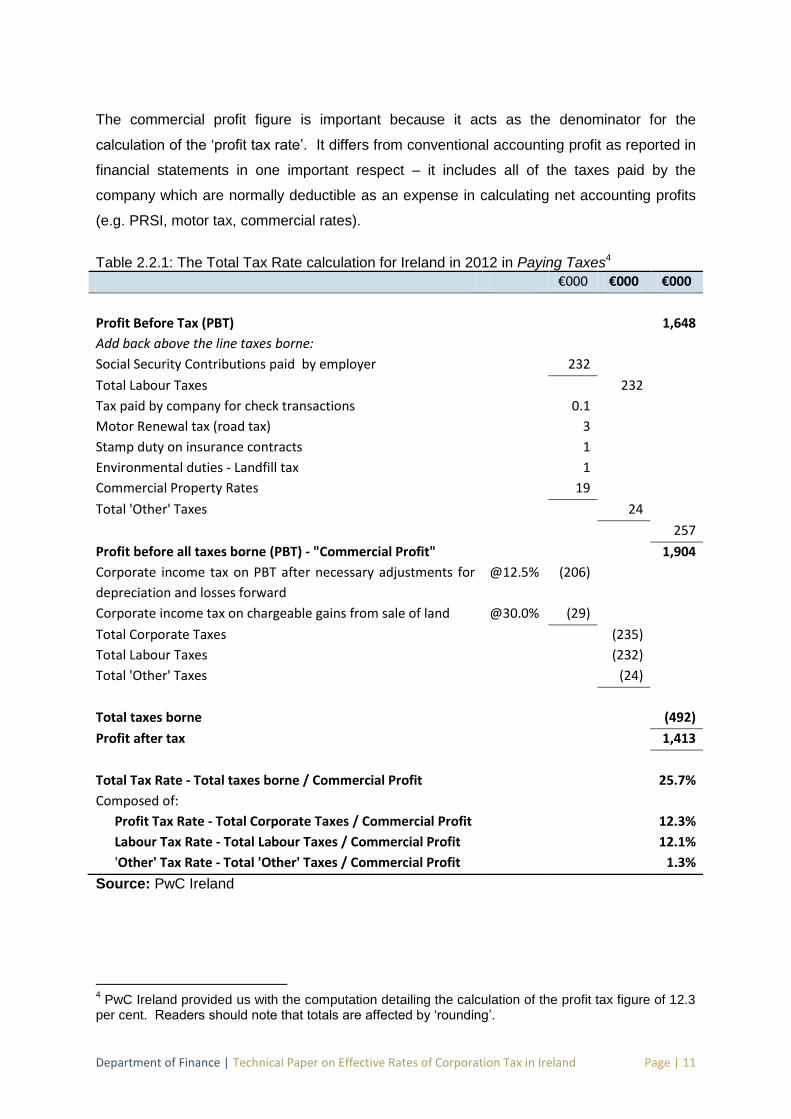
The commercial profit figure is important because it acts as the denominator for the
calculation of the ‘profit tax rate’. It differs from conventional accounting profit as reported in
financial statements in one important respect – it includes all of the taxes paid by the
company which are normally deductible as an expense in calculating net accounting profits
(e.g. PRSI, motor tax, commercial rates).
Table 2.2.1: The Total Tax Rate calculation for Ireland in 2012 in Paying Taxes4
€000 €000 €000
Profit Before Tax (PBT) 1,648
Add back above the line taxes borne:
Social Security Contributions paid by employer 232
Total Labour Taxes 232
Tax paid by company for check transactions 0.1
Motor Renewal tax (road tax) 3
Stamp duty on insurance contracts 1
Environmental duties - Landfill tax 1
Commercial Property Rates 19
Total 'Other' Taxes 24
257
Profit before all taxes borne (PBT) - "Commercial Profit" 1,904
Corporate income tax on PBT after necessary adjustments for
depreciation and losses forward
@12.5% (206)
Corporate income tax on chargeable gains from sale of land @30.0% (29)
Total Corporate Taxes (235)
Total Labour Taxes (232)
Total 'Other' Taxes (24)
Total taxes borne (492)
Profit after tax 1,413
Total Tax Rate - Total taxes borne / Commercial Profit 25.7%
Composed of:
Profit Tax Rate - Total Corporate Taxes / Commercial Profit 12.3%
Labour Tax Rate - Total Labour Taxes / Commercial Profit 12.1%
'Other' Tax Rate - Total 'Other' Taxes / Commercial Profit 1.3%
Source: PwC Ireland
4 PwC Ireland provided us with the computation detailing the calculation of the profit tax figure of 12.3
per cent. Readers should note that totals are affected by ‘rounding’.
Department of Finance | Technical Paper on Effective Rates of Corporation Tax in Ireland Page | 12
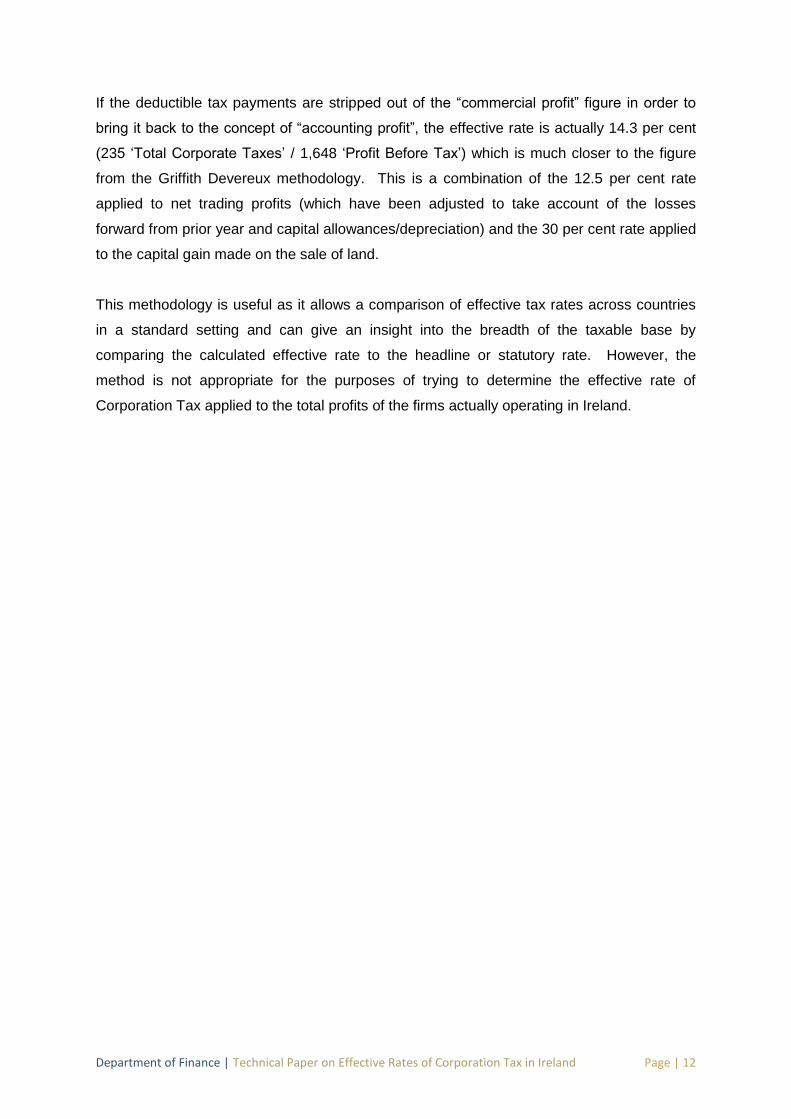
If the deductible tax payments are stripped out of the “commercial profit” figure in order to
bring it back to the concept of “accounting profit”, the effective rate is actually 14.3 per cent
(235 ‘Total Corporate Taxes’ / 1,648 ‘Profit Before Tax’) which is much closer to the figure
from the Griffith Devereux methodology. This is a combination of the 12.5 per cent rate
applied to net trading profits (which have been adjusted to take account of the losses
forward from prior year and capital allowances/depreciation) and the 30 per cent rate applied
to the capital gain made on the sale of land.
This methodology is useful as it allows a comparison of effective tax rates across countries
in a standard setting and can give an insight into the breadth of the taxable base by
comparing the calculated effective rate to the headline or statutory rate. However, the
method is not appropriate for the purposes of trying to determine the effective rate of
Corporation Tax applied to the total profits of the firms actually operating in Ireland.
Department of Finance | Technical Paper on Effective Rates of Corporation Tax in Ireland Page | 13
SECTION 3: THE NATIONAL AGGREGATES APPROACH
3.1 CENTRAL STATISTICS OFFICE: NATIONAL INCOME ACCOUNTS
A number of measures of the effective tax burden on corporations can be estimated from
National Accounts tables published by the Central Statistics Office. This section
summarises the two measures labelled as ‘Approaches 3 and 4’ in Table 1 of the Executive
Summary, explains the methods behind them and assesses their appropriateness for
Ireland. These measures, and their rates for 2012, are:
3. Effective Tax Rate on Net Operating Surplus: 8.4 per cent 4. Eurostat’s Implicit Tax Rate on Corporate Income: 5.9 per cent
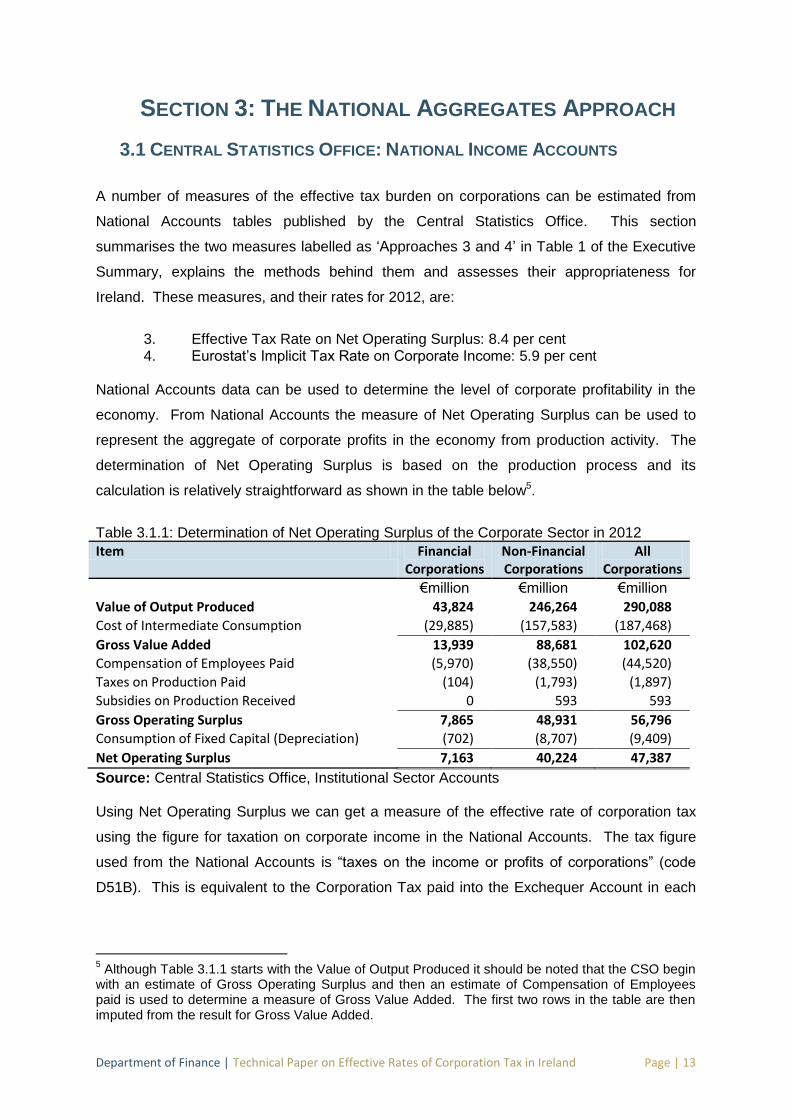
National Accounts data can be used to determine the level of corporate profitability in the
economy. From National Accounts the measure of Net Operating Surplus can be used to
represent the aggregate of corporate profits in the economy from production activity. The
determination of Net Operating Surplus is based on the production process and its
calculation is relatively straightforward as shown in the table below5.
Table 3.1.1: Determination of Net Operating Surplus of the Corporate Sector in 2012
Item Financial Corporations
Non-Financial Corporations
All Corporations
€million €million €million
Value of Output Produced 43,824 246,264 290,088
Cost of Intermediate Consumption (29,885) (157,583) (187,468)
Gross Value Added 13,939 88,681 102,620
Compensation of Employees Paid (5,970) (38,550) (44,520)
Taxes on Production Paid (104) (1,793) (1,897)
Subsidies on Production Received 0 593 593
Gross Operating Surplus 7,865 48,931 56,796
Consumption of Fixed Capital (Depreciation) (702) (8,707) (9,409)
Net Operating Surplus 7,163 40,224 47,387
Source: Central Statistics Office, Institutional Sector Accounts Using Net Operating Surplus we can get a measure of the effective rate of corporation tax
using the figure for taxation on corporate income in the National Accounts. The tax figure
used from the National Accounts is “taxes on the income or profits of corporations” (code
D51B). This is equivalent to the Corporation Tax paid into the Exchequer Account in each
5 Although Table 3.1.1 starts with the Value of Output Produced it should be noted that the CSO begin
with an estimate of Gross Operating Surplus and then an estimate of Compensation of Employees paid is used to determine a measure of Gross Value Added. The first two rows in the table are then imputed from the result for Gross Value Added.
Department of Finance | Technical Paper on Effective Rates of Corporation Tax in Ireland Page | 14
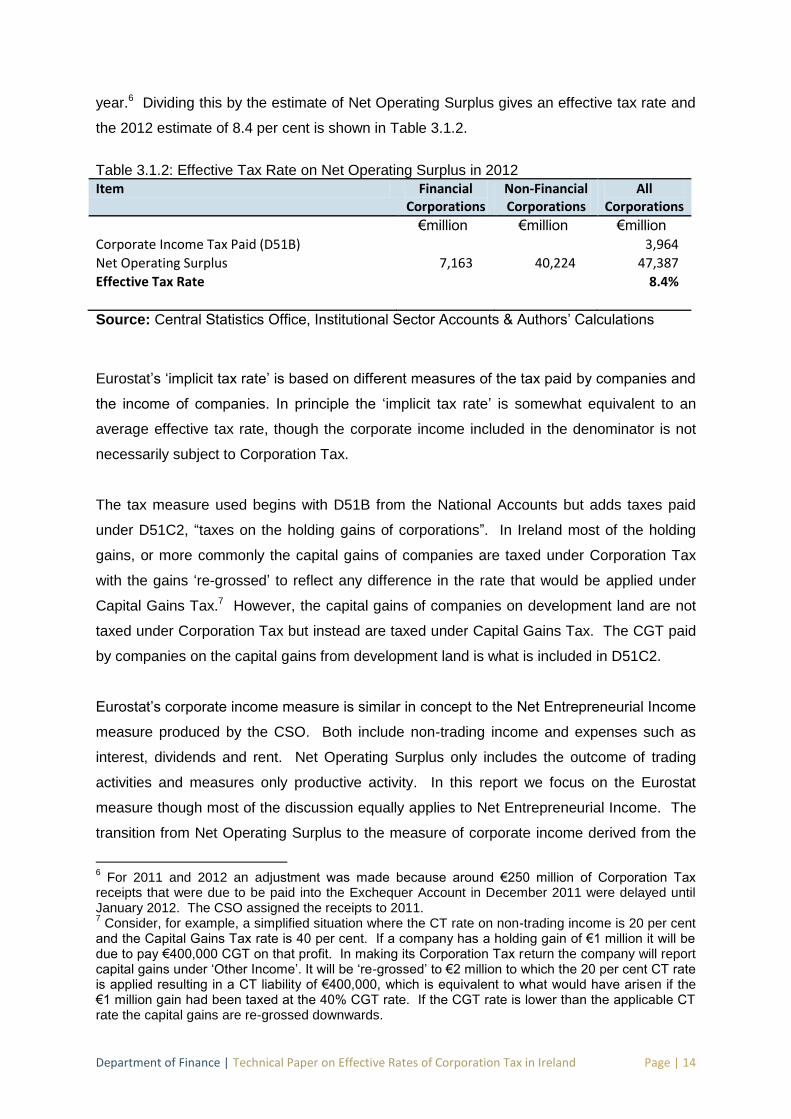
year.6 Dividing this by the estimate of Net Operating Surplus gives an effective tax rate and
the 2012 estimate of 8.4 per cent is shown in Table 3.1.2.
Table 3.1.2: Effective Tax Rate on Net Operating Surplus in 2012
Item Financial Corporations
Non-Financial Corporations
All Corporations
€million €million €million
Corporate Income Tax Paid (D51B) 3,964
Net Operating Surplus 7,163 40,224 47,387
Effective Tax Rate 8.4%
Source: Central Statistics Office, Institutional Sector Accounts & Authors’ Calculations
Eurostat’s ‘implicit tax rate’ is based on different measures of the tax paid by companies and
the income of companies. In principle the ‘implicit tax rate’ is somewhat equivalent to an
average effective tax rate, though the corporate income included in the denominator is not
necessarily subject to Corporation Tax.
The tax measure used begins with D51B from the National Accounts but adds taxes paid
under D51C2, “taxes on the holding gains of corporations”. In Ireland most of the holding
gains, or more commonly the capital gains of companies are taxed under Corporation Tax
with the gains ‘re-grossed’ to reflect any difference in the rate that would be applied under
Capital Gains Tax.7 However, the capital gains of companies on development land are not
taxed under Corporation Tax but instead are taxed under Capital Gains Tax. The CGT paid
by companies on the capital gains from development land is what is included in D51C2.
Eurostat’s corporate income measure is similar in concept to the Net Entrepreneurial Income
measure produced by the CSO. Both include non-trading income and expenses such as
interest, dividends and rent. Net Operating Surplus only includes the outcome of trading
activities and measures only productive activity. In this report we focus on the Eurostat
measure though most of the discussion equally applies to Net Entrepreneurial Income. The
transition from Net Operating Surplus to the measure of corporate income derived from the
6 For 2011 and 2012 an adjustment was made because around €250 million of Corporation Tax
receipts that were due to be paid into the Exchequer Account in December 2011 were delayed until January 2012. The CSO assigned the receipts to 2011. 7 Consider, for example, a simplified situation where the CT rate on non-trading income is 20 per cent
and the Capital Gains Tax rate is 40 per cent. If a company has a holding gain of €1 million it will be due to pay €400,000 CGT on that profit. In making its Corporation Tax return the company will report capital gains under ‘Other Income’. It will be ‘re-grossed’ to €2 million to which the 20 per cent CT rate is applied resulting in a CT liability of €400,000, which is equivalent to what would have arisen if the €1 million gain had been taxed at the 40% CGT rate. If the CGT rate is lower than the applicable CT rate the capital gains are re-grossed downwards.
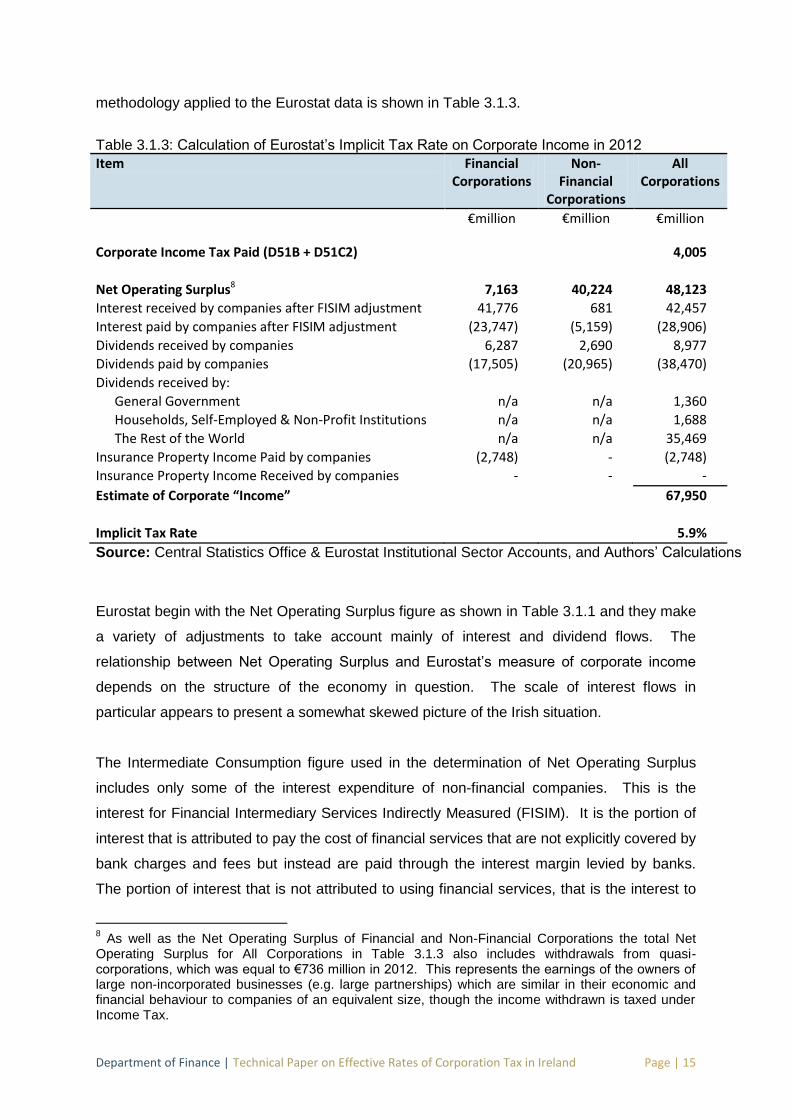
Department of Finance | Technical Paper on Effective Rates of Corporation Tax in Ireland Page | 15
methodology applied to the Eurostat data is shown in Table 3.1.3.
Table 3.1.3: Calculation of Eurostat’s Implicit Tax Rate on Corporate Income in 2012
Item Financial Corporations
Non-Financial
Corporations
All Corporations
€million €million €million
Corporate Income Tax Paid (D51B + D51C2) 4,005
Net Operating Surplus8 7,163 40,224 48,123
Interest received by companies after FISIM adjustment 41,776 681 42,457
Interest paid by companies after FISIM adjustment (23,747) (5,159) (28,906)
Dividends received by companies 6,287 2,690 8,977
Dividends paid by companies (17,505) (20,965) (38,470)
Dividends received by:
General Government n/a n/a 1,360
Households, Self-Employed & Non-Profit Institutions n/a n/a 1,688
The Rest of the World n/a n/a 35,469
Insurance Property Income Paid by companies (2,748) - (2,748)
Insurance Property Income Received by companies - - -
Estimate of Corporate “Income” 67,950
Implicit Tax Rate 5.9%
Source: Central Statistics Office & Eurostat Institutional Sector Accounts, and Authors’ Calculations
Eurostat begin with the Net Operating Surplus figure as shown in Table 3.1.1 and they make
a variety of adjustments to take account mainly of interest and dividend flows. The
relationship between Net Operating Surplus and Eurostat’s measure of corporate income
depends on the structure of the economy in question. The scale of interest flows in
particular appears to present a somewhat skewed picture of the Irish situation.
The Intermediate Consumption figure used in the determination of Net Operating Surplus
includes only some of the interest expenditure of non-financial companies. This is the
interest for Financial Intermediary Services Indirectly Measured (FISIM). It is the portion of
interest that is attributed to pay the cost of financial services that are not explicitly covered by
bank charges and fees but instead are paid through the interest margin levied by banks.
The portion of interest that is not attributed to using financial services, that is the interest to
8 As well as the Net Operating Surplus of Financial and Non-Financial Corporations the total Net
Operating Surplus for All Corporations in Table 3.1.3 also includes withdrawals from quasi-corporations, which was equal to €736 million in 2012. This represents the earnings of the owners of large non-incorporated businesses (e.g. large partnerships) which are similar in their economic and financial behaviour to companies of an equivalent size, though the income withdrawn is taxed under Income Tax.
Department of Finance | Technical Paper on Effective Rates of Corporation Tax in Ireland Page | 16
cover the cost of financing, is not used in the determination of Net Operating Surplus as this
relates to the financing rather than the productive activities and operating of the companies.
The interest expenditure of non-financial companies in excess of the FISIM adjustment is
deducted in the Eurostat measure of corporate income for non-financial corporations. In
Table 3.1.3 this can be seen to be €5.2 billion. To the extent that this interest is paid to
resident financial corporations it will be included as interest income for them. For Ireland,
however, the income receipts of financial corporations are significantly in excess of the
interest payments of the other domestic sectors of the economy (households, non-financial
corporations and general government). This means that Eurostat’s corporate income
measure has always exceeded Net Operating Surplus. It can be seen in the Table 3.1.3 that
the interest income received by financial corporations in Ireland was close to €42 billion in
2012.9 One key reason for large interest income for financial firms in Ireland is because it
includes income accruing to international collective investment funds that are domiciled in
Ireland.
Implicit tax rates attempt to calculate tax paid as a proportion of a potential taxable base of
income. In calculating the potential taxable base of the corporate sector, interest income
received by collective investment funds is included even though such income is generally
exempt from taxation in most EU countries (taxation occurs at the level of the individual
investor rather than at the level of the fund). The impact of this on the calculation of implicit
rates differs according to the relative size of the funds industry as compared to the overall
economy in each EU country. Ireland has a large international investment funds industry
and, as a result, the inclusion of this tax-exempt income has a disproportionate impact on
the calculation of implicit rates of corporate income for Ireland, as compared to other
countries, with the resulting estimates being significantly reduced.
The broad rationale for exempting such funds from direct taxation is to facilitate individuals in
collectively investing without suffering double taxation. “Most countries now have a tax
system that provides for neutrality between direct investments and investments through a
Collective Investment Vehicle (CIV)…”10
9 At an average interest rate of 4 per cent it would require a principal amount of over €1 trillion to
generate this amount of interest income. 10
“Report Of The Informal Consultative Group On The Taxation Of Collective Investment Vehicles
And Procedures For Tax Relief For Cross-Border Investors On The Granting Of Treaty Benefits With Respect To The Income Of Collective Investment Vehicles 12 January 2009”, Centre for Tax Policy and Administration, OECD.
Department of Finance | Technical Paper on Effective Rates of Corporation Tax in Ireland Page | 17
Ireland is one of the largest fund domiciles in the European Union with over €1 trillion in
assets under management11. As a result, this issue has a disproportionate impact on the
calculation of implicit rates on corporate income for Ireland as the interest and dividend
income earned by these funds are counted as income for the financial sector in Ireland. The
Balance of Payments will include a contemporaneous outflow of income to reflect the fact
that this is the income of non-resident investors in these funds. The income on these funds
does not form part of GDP as it is not related to production in Ireland and, although resident
in Ireland, the income is not counted in GNP as the investors in the funds are mainly non-
residents.
In one sense, it is arguable that the income of tax exempt investment funds should not be
included in the denominator at all as it is intended to represent the closest possible
approximation to the taxable base of corporate income.
The Eurostat measure also adds dividends received by the other sectors of the economy
(the rest of the world, the general government sector, and the sector comprising households,
the self-employed and non-profit institutions) to Net Operating Surplus to get the
denominator used. The final adjustment made is for income earned by the invested income
of insurance funds (pensions and life assurance funds). These are included in the interest
and dividend receipts of financial corporations but are subsequently imputed as a flow to the
household sector which owns the funds. In Table 3.1.3, the impact of these dividend and
insurance property income flows between the sectors largely offset each other. This is not
the case for Ireland with interest flows.
As can be seen in Table 3.1.3, in 2012 there was a €20 billion difference between Net
Operating Surplus and Eurostat’s measure of corporate income. The main driver of this is
the net interest income of the financial and non-financial sectors. Non-financial corporations
had an additional interest expense of €5.2 billion on top of the €2.4 billion of interest counted
as FISIM (which is included in intermediate consumption when determining Net Operating
Surplus). On the other hand it can be seen that there is a net interest gain of €18 billion
received by financial corporations. Some of this represents the interest income of banks and
financial institutions which are subject to Irish corporation tax but in the main it includes the
interest income of untaxed investment funds. There will also be some dividends received by
these funds in the income measure.
11
Central Bank Data on Investment Funds in Q3 2013 - Information Release 20 December 2013.
Department of Finance | Technical Paper on Effective Rates of Corporation Tax in Ireland Page | 18
In approximate terms, the dividends paid by corporations in Ireland matches the dividends
received by the other sectors with the majority of the dividends paid going to the rest of the
world. For financial corporations this reflects the presence and ownership of very large
investment funds in Ireland while for non-financial corporations it reflects the large impact of
foreign direct investment in Ireland. The income of investment funds is not included in Net
Operating Surplus and they are not subject to Irish Corporation Tax. And although the
dividends owing by MNCs operating in Ireland are deducted they are added back in as
dividends received by the Rest of the World. The profits earned by these FDI companies in
Ireland are included in the starting measure of Net Operating Surplus and are subject to Irish
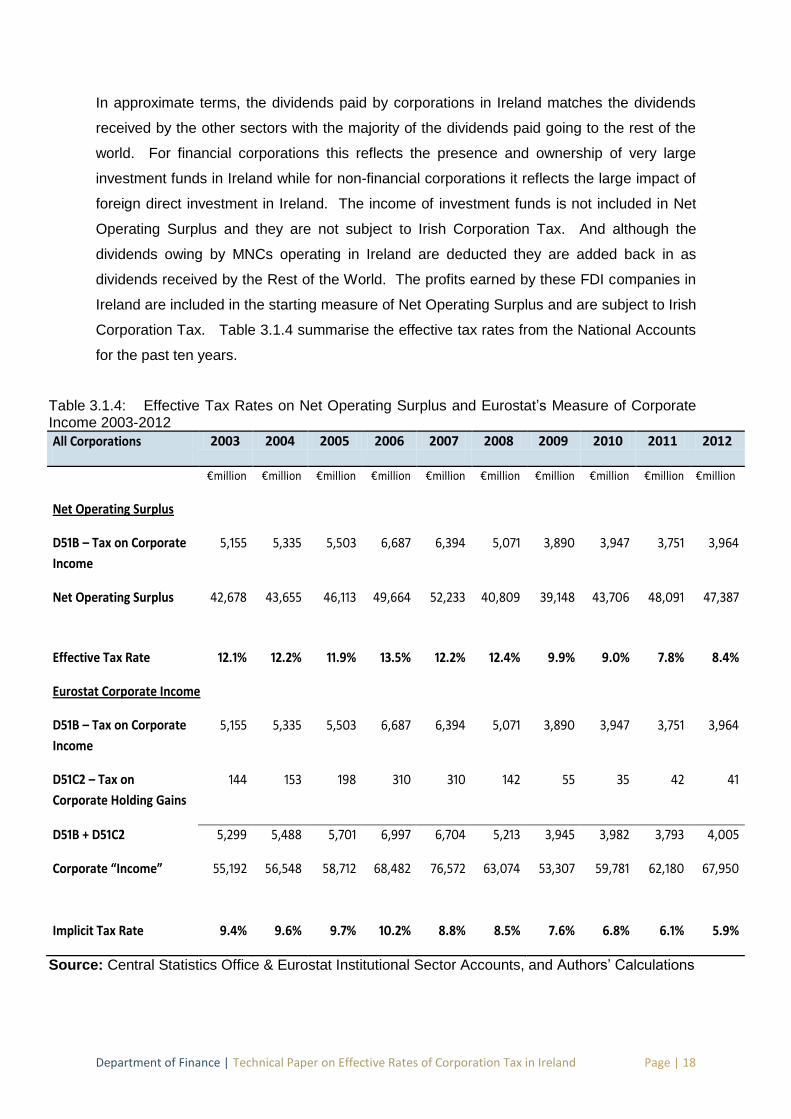
Corporation Tax. Table 3.1.4 summarise the effective tax rates from the National Accounts
for the past ten years.
Table 3.1.4: Effective Tax Rates on Net Operating Surplus and Eurostat’s Measure of Corporate Income 2003-2012
All Corporations 2003 2004 2005 2006 2007 2008 2009 2010 2011 2012
€million €million €million €million €million €million €million €million €million €million
Net Operating Surplus
D51B – Tax on Corporate
Income
5,155 5,335 5,503 6,687 6,394 5,071 3,890 3,947 3,751 3,964
Net Operating Surplus 42,678 43,655 46,113 49,664 52,233 40,809 39,148 43,706 48,091 47,387
Effective Tax Rate 12.1% 12.2% 11.9% 13.5% 12.2% 12.4% 9.9% 9.0% 7.8% 8.4%
Eurostat Corporate Income
D51B – Tax on Corporate
Income
5,155 5,335 5,503 6,687 6,394 5,071 3,890 3,947 3,751 3,964
D51C2 – Tax on
Corporate Holding Gains
144 153 198 310 310 142 55 35 42 41
D51B + D51C2 5,299 5,488 5,701 6,997 6,704 5,213 3,945 3,982 3,793 4,005
Corporate “Income” 55,192 56,548 58,712 68,482 76,572 63,074 53,307 59,781 62,180 67,950
Implicit Tax Rate 9.4% 9.6% 9.7% 10.2% 8.8% 8.5% 7.6% 6.8% 6.1% 5.9%
Source: Central Statistics Office & Eurostat Institutional Sector Accounts, and Authors’ Calculations
Department of Finance | Technical Paper on Effective Rates of Corporation Tax in Ireland Page | 19
Over the ten-year period the average for the effective rate on Net Operating Surplus has
been 10.9 per cent and the implicit tax rate from the methodology applied to the Eurostat has
averaged 8.3 per cent, with the difference between them due largely to the interest income
of collective investment funds.
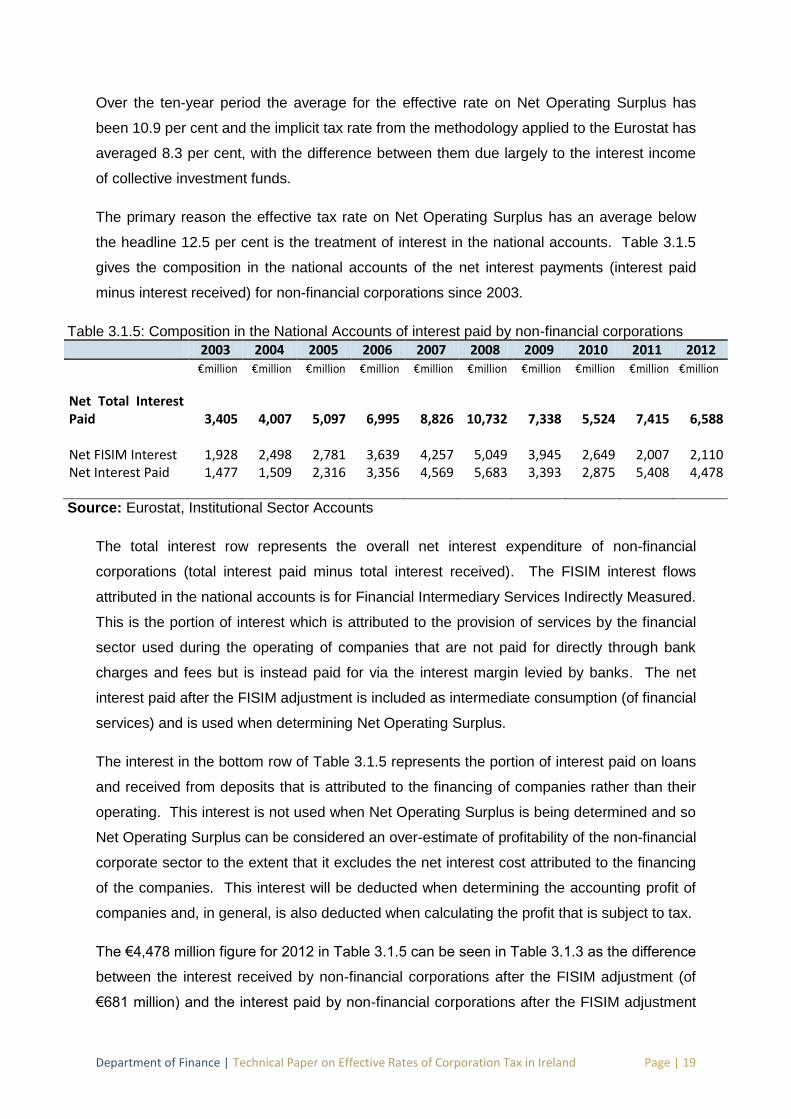
The primary reason the effective tax rate on Net Operating Surplus has an average below
the headline 12.5 per cent is the treatment of interest in the national accounts. Table 3.1.5
gives the composition in the national accounts of the net interest payments (interest paid
minus interest received) for non-financial corporations since 2003.
Table 3.1.5: Composition in the National Accounts of interest paid by non-financial corporations
2003 2004 2005 2006 2007 2008 2009 2010 2011 2012
€million €million €million €million €million €million €million €million €million €million
Net Total Interest Paid 3,405 4,007 5,097 6,995 8,826 10,732 7,338 5,524 7,415 6,588 Net FISIM Interest 1,928 2,498 2,781 3,639 4,257 5,049 3,945 2,649 2,007 2,110 Net Interest Paid 1,477 1,509 2,316 3,356 4,569 5,683 3,393 2,875 5,408 4,478
Source: Eurostat, Institutional Sector Accounts
The total interest row represents the overall net interest expenditure of non-financial
corporations (total interest paid minus total interest received). The FISIM interest flows
attributed in the national accounts is for Financial Intermediary Services Indirectly Measured.
This is the portion of interest which is attributed to the provision of services by the financial
sector used during the operating of companies that are not paid for directly through bank
charges and fees but is instead paid for via the interest margin levied by banks. The net
interest paid after the FISIM adjustment is included as intermediate consumption (of financial
services) and is used when determining Net Operating Surplus.
The interest in the bottom row of Table 3.1.5 represents the portion of interest paid on loans
and received from deposits that is attributed to the financing of companies rather than their
operating. This interest is not used when Net Operating Surplus is being determined and so
Net Operating Surplus can be considered an over-estimate of profitability of the non-financial
corporate sector to the extent that it excludes the net interest cost attributed to the financing
of the companies. This interest will be deducted when determining the accounting profit of
companies and, in general, is also deducted when calculating the profit that is subject to tax.
The €4,478 million figure for 2012 in Table 3.1.5 can be seen in Table 3.1.3 as the difference
between the interest received by non-financial corporations after the FISIM adjustment (of
€681 million) and the interest paid by non-financial corporations after the FISIM adjustment
Department of Finance | Technical Paper on Effective Rates of Corporation Tax in Ireland Page | 20
(of €5,159 million).
Over the ten years to 2012, non-financial corporations had net interest expenditure of €35
billion that was not used in the determination of Net Operating Surplus. This interest is
received by financial corporations but they pay much of it on to the household and rest of the
world sectors as well as other to financial corporations. If we take the Net Operating Surplus
measure of corporate profitability and take account of the additional €35 billion of net interest
expenditure of non-financial corporations after the FISIM adjustment then the ten-year
average for the effective tax rate on this rough measure of overall corporate profitability is
equal to 11.9 per cent.
Table 3.1.4 shows that the national accounting measures of the effective tax rate on
corporate profits have been falling for the past number of years. This is not the result of
changes in Ireland’s Corporation Tax regime, which has been largely unchanged over the
period, or a reduction in the tax burden on companies. Rather, it reflects the changes in the
economic environment and, in particular, one where we have moved from the generation of
taxable capital gains during the ‘boom’ period to the generation of significant trading losses
during the recent downturn, which can be carried forward to offset future tax liabilities.
These factors are explored in more detail in section 3.3 which tries to reconcile the
aggregate effective tax rates found using the data of the Central Statistics Office and the
statistics of the Revenue Commissioners.
Department of Finance | Technical Paper on Effective Rates of Corporation Tax in Ireland Page | 21
3.2 REVENUE COMMISSIONERS: CORPORATION TAX DISTRIBUTION STATISTICS
A second source of aggregate data at national level is the Corporation Tax Distribution
Statistics published annually by the Revenue Commissioners. The most recent published
data are for 2011 and the following measures of the corporate tax burden, which are labelled
approaches 5 and 6 in Table 1 of the Executive Summary, can be found using the figures
available:
5. Tax Due as a Proportion of Taxable Income: 10.4 per cent 6. Tax Burden as a Proportion of Taxable Income: 11.8 per cent
In 2011 companies subject to Irish Corporation Tax had gross trading profits of €72.7 billion.
Companies are chargeable to Corporation Tax on their profits after taking account of
allowable deductions and reliefs provided for in the Taxes Consolidation Act 1997. Expenses
that are incurred wholly and exclusively for the purposes of the trade are deductible in
computing trading profits, while allowances are available for capital expenditure on plant and
machinery, industrial buildings and certain intangible assets used in the trade, with such
allowances treated as a deductible trading expense. Companies are charged on their net
taxable profits after account is taken of any taxable losses they have incurred in previous
years.
The Taxes Consolidation Act 1997 contains certain tax reliefs for companies that are
standard features of a corporate tax system, including group relief - which allows for trading
losses of a group company to be offset against profits of another group company - and
double taxation relief which provides relief for foreign corporate income tax paid on profits
earned and taxed abroad. There are also specific tax reliefs for companies that are targeted
at promoting investment in key areas of economic importance, including a 25 per cent tax
credit for expenditure on research and development, and a relief for start-up companies
creating employment.
Using 2011 figures, Table 3.2.1 shows how the Taxable Income is arrived at via the various
additions and deductions from the starting point of Gross Trading Profits. The impact of the
different expenses, allowances and reliefs can be seen in the calculation.

Department of Finance | Technical Paper on Effective Rates of Corporation Tax in Ireland Page | 22
Table 3.2.1: Calculation of Taxable Income from Total Income in 2011
Item €million €million
Manufacturing Trading Profits 18,511.2
Other Trading Profits 54,225.6
Gross Trading Profits 72,736.8
plus Balancing Charges 1,080.5
less Allowances
Capital Allowances Used 8,452.9
Trading Losses Carried Forward Used 9,518.3
(17,971.2)
Net Trading Income 55,846.1
plus Other Income
Net Rental Income 520.4
Other Income 4,413.4
Capital Gains 736.5
5,670.3
Total Income 61,516.4
less Deductions and Expenses
Trade Charges 14,876.4
Group Relief 2,742.5
Current Year Trading Losses 156.0
Other Expenses 3,678.3
(21,453.2)
Taxable Income 40,062.9
Source: Revenue Commissioners, Corporation Tax Distribution Statistics
Box 3.1: Main Differences between ‘Gross Trading Profits’ and ‘Taxable Income’ in the Revenue Corporation Tax Distribution Statistics The main differences between the ‘Gross Trading Profits’ and ‘Taxable Income’ in the Revenue Corporation Tax Distribution Statistics are explained in detail below. The large difference in the aggregate statistics arises because the ‘Gross Trading Profit’ figure contains the total amount of all of the ‘addback’ adjustments that companies are required to make to ‘accounting profit’ before deducting the tax-equivalent amount in the case of depreciation and royalties. The remainder of the difference is accounted for by loss relief. Adjustments to ‘accounting profit’ in the computation of corporation tax liability Although the Revenue Corporation Tax Distribution Statistics are not presented in the same format in which a company’s tax computation is normally undertaken, the primary differences between the ‘Gross Trading Profits’ figure and the ‘Taxable Income’ figure in Table 3.2.1 can be understood by reference to the adjustments that are made to a company’s ‘accounting profit’ figure in computing its tax liability. At individual company level, ‘accounting profit’ is the starting point for the computation of a company’s tax liability. Accounting profit is what is recorded in a company’s financial statements and is derived using accounting standards. Most financial statements are audited with respect to these standards. Tax rules require that a number of adjustments are made to

Department of Finance | Technical Paper on Effective Rates of Corporation Tax in Ireland Page | 23
the ‘accounting profit’ figure in order to generate a ‘taxable profit’ figure to which the rate of tax is then applied. The main adjustments are set out below in detail. Depreciation and Capital Allowances The most common of these adjustments relates to depreciation of assets. Under international accounting standards, depreciation recognises that buildings, machinery and other assets eventually wear out in the course of earning business income and so companies are allowed an expense deduction for depreciation that represents the loss in value of assets during the course of the accounting year (not to recognise that fact would result in an overstatement of the business's profits). The tax rules do not allow a deduction for capital costs so depreciation must be added back to accounting profit. While the tax code does not recognise depreciation, it instead provides for capital allowances for certain fixed assets in place of the disallowed depreciation. These capital allowances are calculated on a standardised basis that differs from accounting depreciation (in Ireland, for example, capital allowances are normally written off on a straight-line basis over 8 years). The ‘Gross Trading Profits’ figure in Table 3.2.1 contains all of the depreciation that has been added back to accounting profits before capital allowances are given and, as a result, is a significant overstatement of companies’ accounting profits. Capital allowances accounted for €8.5bn of the difference between ‘Gross Trading Profits’ and ‘Taxable Income’ in 2011. Royalties and Trade Charges In today’s economy, much of the value of products can be attributed to intellectual property used in producing the good or service. ‘Royalties’ are typically payments for the right to use such intellectual property. Under international accounting standards, royalties are deductible as an expense in the same way that the purchase of any raw material is deductible as a cost of sales. However, Irish tax legislation requires that certain types of royalties be added back to accounting profits before a tax deduction is then specifically given in the form of ‘trade charges’ on income. Unlike the difference between depreciation and capital allowances above, there is no difference in how royalties and ‘trade charges’ are calculated. So, for tax purposes, the taxpayer will add back certain royalty expenses to their ‘accounting profit’ and then deduct the amount again as a ‘trade charge’. The ‘Gross Trading Profits’ figure in Table 3.2.1 contains all of the royalty expenses that have been added back to accounting profits before trade charges are deducted and, without the subsequent deduction of trade charges for tax purposes, would be a significant overstatement of companies’ profits. Trade charges accounted for €14.9bn of the difference between ‘Gross Trade Profits’ and ‘Taxable Income’ in 2011. Loss Relief and Group Relief Losses will be identifiable for accounting purposes in the year in which they arise. For tax purposes, relief from taxation is given in respect of losses incurred in different periods. Loss relief and group relief account for the vast bulk of the remainder of the difference between ‘Gross Trade Profits’ and ‘Taxable Income’ (after capital allowances and trade charges). The availability of relief for losses incurred in a business is a well-established feature of
Department of Finance | Technical Paper on Effective Rates of Corporation Tax in Ireland Page | 24
corporation tax, which is in recognition of the fact that a business cycle runs over several years and that it would be unbalanced to tax profits in one year and not allow relief for losses in another. Ireland follows the international norm in that losses incurred in the course of a business are taken into account in arriving at a company’s liability to tax. Under Irish tax legislation a company incurring a trading loss in an accounting year can carry that loss back for offset against profits in the immediately preceding year and companies are entitled to carry forward unrelieved trading losses for offset against trading profits of the same trade in future accounting periods until the losses are fully relieved or the trade is discontinued. Group relief for companies is also a basic feature of a modern tax system. It recognises the fact that groups of companies generally comprise a single economic entity and provides a system of relief for trading losses and related matters within the group. The relief may be surrendered to another company of the group subject to strict criteria being met. Trading Losses Forward and Group Relief together accounted for €12.3bn (€9.5bn + €2.7bn +€.16bn) of the difference between ‘Gross Trade Profits’ and ‘Taxable Income’ in 2011.
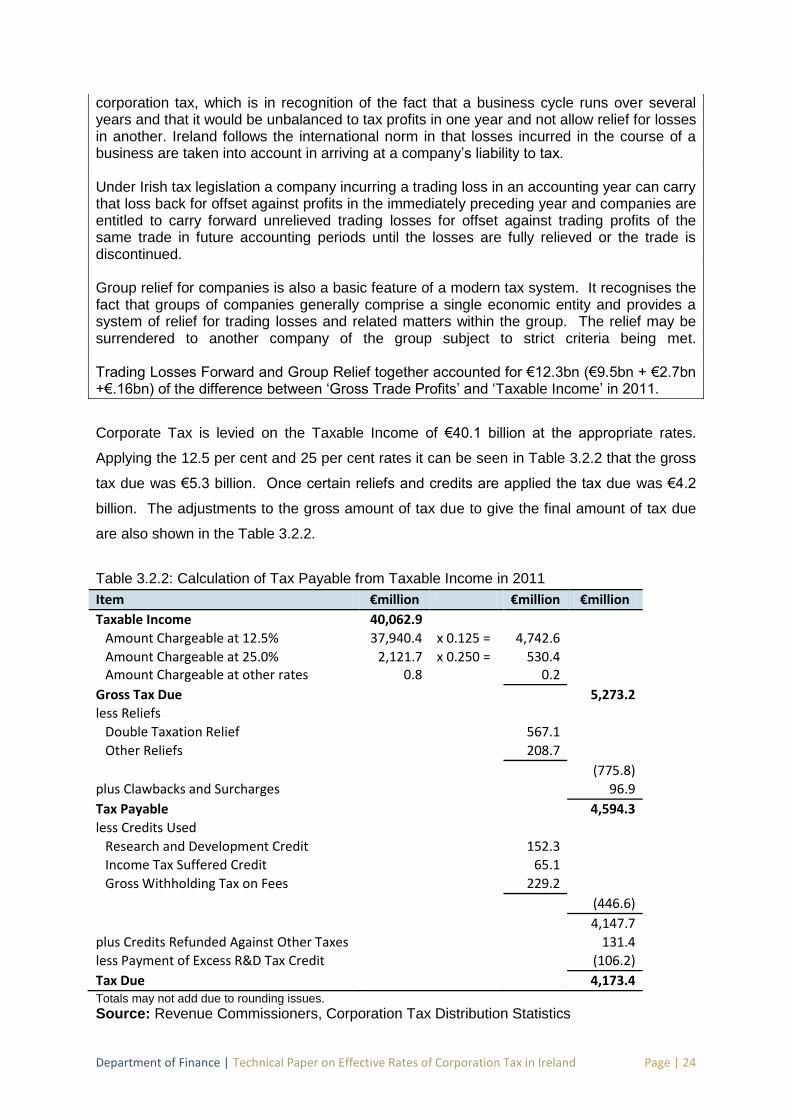
Corporate Tax is levied on the Taxable Income of €40.1 billion at the appropriate rates.
Applying the 12.5 per cent and 25 per cent rates it can be seen in Table 3.2.2 that the gross
tax due was €5.3 billion. Once certain reliefs and credits are applied the tax due was €4.2
billion. The adjustments to the gross amount of tax due to give the final amount of tax due
are also shown in the Table 3.2.2.
Table 3.2.2: Calculation of Tax Payable from Taxable Income in 2011
Item €million €million €million
Taxable Income 40,062.9
Amount Chargeable at 12.5% 37,940.4 x 0.125 = 4,742.6
Amount Chargeable at 25.0% 2,121.7 x 0.250 = 530.4
Amount Chargeable at other rates 0.8 0.2
Gross Tax Due 5,273.2
less Reliefs
Double Taxation Relief 567.1
Other Reliefs 208.7
(775.8)
plus Clawbacks and Surcharges 96.9
Tax Payable 4,594.3
less Credits Used
Research and Development Credit 152.3
Income Tax Suffered Credit 65.1
Gross Withholding Tax on Fees 229.2
(446.6)
4,147.7
plus Credits Refunded Against Other Taxes 131.4
less Payment of Excess R&D Tax Credit (106.2)
Tax Due 4,173.4
Totals may not add due to rounding issues.
Source: Revenue Commissioners, Corporation Tax Distribution Statistics

Department of Finance | Technical Paper on Effective Rates of Corporation Tax in Ireland Page | 25
A number of measures of the tax rate on corporate income can be determined from the
above tables but the most appropriate is tax due as a proportion of Taxable Income.
Calculations based on gross trading profits, net trading income or total income can be made
but these measures fail to account for allowances, deductions and expenses which are
standard worldwide in the calculation of corporate income tax. Thus, tax due as a proportion
of Taxable Income is the appropriate measure of the tax burden on corporate income from
these statistics and is shown in Table 3.2.3. The outcome for 2011 was 10.4 per cent.
Table 3.2.3: Tax Due as a Proportion of Taxable Income in 2011
Tax Amount
Taxable Income
Tax Rate
€million €million
Tax Due as a Proportion of Taxable Income 4,173.4 40,062.8 10.4%
Source: Revenue Commissioners, Corporation Tax Distribution Statistics & Authors’ Calculations
Double Taxation Relief
In the above calculations for 2011, Double-Taxation Relief of €567.1 million is subtracted as
part of the transition from gross tax due to tax due. In essence, this does not reduce a
company’s tax liability but gives credit for tax already paid, albeit in another jurisdiction.
Thus, included in the various measures of income shown above is the foreign-source income
of Irish-resident companies on which foreign tax has already been paid. The subtraction of
Double Taxation Relief understates the amount of tax due by a company and paid on the
income declared. If tax had not been paid elsewhere on this income it would have been due
in Ireland. The overall amount of tax due and paid would be the same for the company but
more of it would have been due in Ireland.
A second measure of the tax burden on the corporate income in the Revenue
Commissioners’ statistics is Tax Due plus Double Taxation Relief granted for corporate
income tax paid elsewhere and gives rise to the following tax measure:
Tax Due in Ireland + Double Taxation Relief for tax paid elsewhere = Tax burden on companies
imposed in Ireland:
€4,173.4 million + €567.1 million = €4,739.1 million.
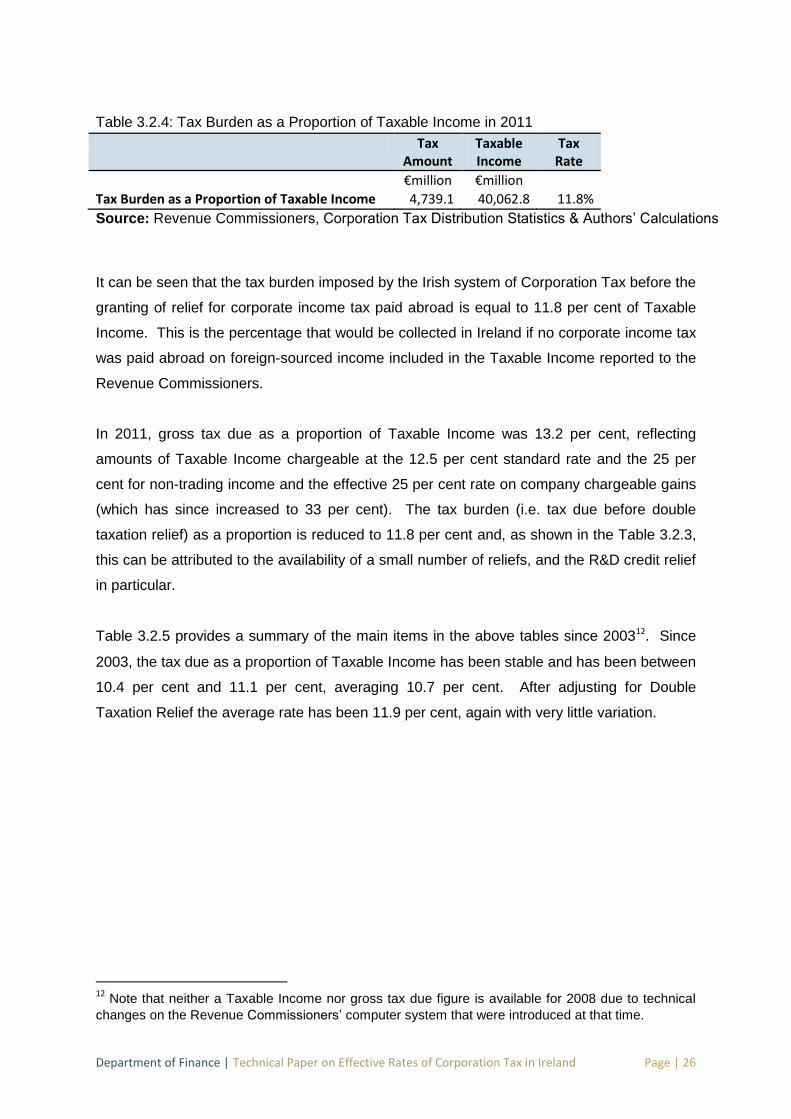
Department of Finance | Technical Paper on Effective Rates of Corporation Tax in Ireland Page | 26
Table 3.2.4: Tax Burden as a Proportion of Taxable Income in 2011
Tax Amount
Taxable Income
Tax Rate
€million €million
Tax Burden as a Proportion of Taxable Income 4,739.1 40,062.8 11.8%
Source: Revenue Commissioners, Corporation Tax Distribution Statistics & Authors’ Calculations
It can be seen that the tax burden imposed by the Irish system of Corporation Tax before the
granting of relief for corporate income tax paid abroad is equal to 11.8 per cent of Taxable
Income. This is the percentage that would be collected in Ireland if no corporate income tax
was paid abroad on foreign-sourced income included in the Taxable Income reported to the
Revenue Commissioners.
In 2011, gross tax due as a proportion of Taxable Income was 13.2 per cent, reflecting
amounts of Taxable Income chargeable at the 12.5 per cent standard rate and the 25 per
cent for non-trading income and the effective 25 per cent rate on company chargeable gains
(which has since increased to 33 per cent). The tax burden (i.e. tax due before double
taxation relief) as a proportion is reduced to 11.8 per cent and, as shown in the Table 3.2.3,
this can be attributed to the availability of a small number of reliefs, and the R&D credit relief
in particular.
Table 3.2.5 provides a summary of the main items in the above tables since 200312. Since
2003, the tax due as a proportion of Taxable Income has been stable and has been between
10.4 per cent and 11.1 per cent, averaging 10.7 per cent. After adjusting for Double
Taxation Relief the average rate has been 11.9 per cent, again with very little variation.
12 Note that neither a Taxable Income nor gross tax due figure is available for 2008 due to technical
changes on the Revenue Commissioners’ computer system that were introduced at that time.

Department of Finance | Technical Paper on Effective Rates of Corporation Tax in Ireland Page | 27
Table 3.2.5: Main Income & Tax Measures from Revenue Commissioners’ Corporation Tax Distribution Statistics
2003 2004 2005 2006 2007 2008 2009 2010 2011
€million €million €million €million €million €million €million €million €million
Gross Trading Profits* 54,701 58,186 65,735 72,447 76,457 75,014 66,187 70,805 73,817
less Allowances (17,328) (19,103) (22,320) (20,873) (22,126) (32,073) (15,327) (16,167) (17,971)
Net Trading Income 37,373 39,083 43,415 51,574 54,332 42,941 50,860 54,638 55,846
plus Other Income 5,118 5,043 6,545 8,390 8,828 8,213 6,350 6,396 5,670
Total Income 42,491 44,126 49,960 59,964 63,160 51,154 57,210 61,034 61,516
less Deductions (1,527) (1,863) (2,103) (5,070) (6,354) (19,454) (19,818) (21,454)
Taxable Income 40,964 42,263 47,857 54,894 56,806 37,757 41,216 40,063
Gross Tax Due 5,825 5,683 6,485 7,443 7,717 5,076 5,422 5,273
less Reliefs & Credits^ (1,493) (1,263 (1,317) (1,323) (1,411) (1,072) (1,177) (1,010)
Tax Due 4,332 4,420 5,167 6,1110 6,305 5,122 4,004 4,246 4,173
% Taxable Income 10.6% 10.5% 10.8% 11.1% 11.1% 10.6% 10.3% 10.4%
Double Taxation Relief 486 405 408 551 569 555 547 619 567
Tax Burden 4,818 4,826 5,576 6,670 6,874 5,677 4,550 4,864 4,739
% Taxable Income 11.8% 11.4% 11.7% 12.2% 12.1% 12.1% 11.8% 11.8%
* includes Balancing Charges
^ includes the addition of Surcharges and Clawbacks
Source: Revenue Commissioners, Corporation Tax Distribution Statistics & Authors’ Calculations
Although the tax burden on Taxable Income has been steady there have been changes in
some of the components used in the calculation of Taxable Income. Most notable of these is
the increase in the deductions from Total Income to get Taxable Income. As shown in Table
3.2.6 these deductions mainly comprise trade charges, group relief and other expenses.
The total of these deductions used was €5.1 billion in 2006 but had increased to €21.5 billion
by 2011.
It should be noted that the amounts given are the total amount of deductions available under

Department of Finance | Technical Paper on Effective Rates of Corporation Tax in Ireland Page | 28
each item.13 These can differ from the actual amounts used if, at the level of the firm, the
deduction available exceeds the amount of total income, but in the last three years in the
table there has not been a significant difference between the total amount of these
deductions available and the amount actually used.
Table 3.2.6: Deductions from Total Income to Determine Taxable Income
2006 2007 2008 2009 2010 2011
€million €million €million €million €million €million
Trade Charges
Manufacturing 4,532.4 5,518.2 7,336.5 9,014.1 9,274.8 7,666.4
Non-Manufacturing 925.2 1,297.0 2,759.8 2,654.8 3,118.0 7,939.2
Total Trade Charges 5,457.6 6,815.2 10,096.3 11,668.9 12,392.8 15,605.6
Group Relief 2,145.0 2,063.4 3,664.4 3,144.2 3,281.9 2,979.8
Other Expenses 5,302.0 6,335.7 6,714.0 5,241.6 5,246.0 3,678.3
Total Available 12,904.6 15,214.3 20,474.7 20,054.7 20,920.7 22,263.7
Total Used 5,069.7 6,354.3 n/a 19,453.5 19,818.3 21,453.5
Source: Revenue Commissioners, Corporation Tax Distribution Statistics
The increase in these deductions can be seen to be the result of an increase in trade
charges used against total income particularly for non-manufacturing firms. Trade charges
have increased by €10 billion over the years shown. An examination by the Revenue
Commissioners indicates that in recent years certain royalty payments form the vast bulk of
trade charges used.
This trend is reflective of the fact that services exports from Ireland, in particular IT, are
royalty-intensive and services exports have grown, in recent years, to over 57 per cent of
GDP. As described in Box 3.1, royalties in this context are payments for the use of
intellectual property (IP). While a high volume of IP-intensive goods and services are sold
from Ireland, generally the underlying intellectual property is not typically owned here.
13
The Revenue Commissioners are unable to provide figures for the amounts used by each deduction for years prior to 2009 and only a figure for the overall amount used for the group of deductions is available.
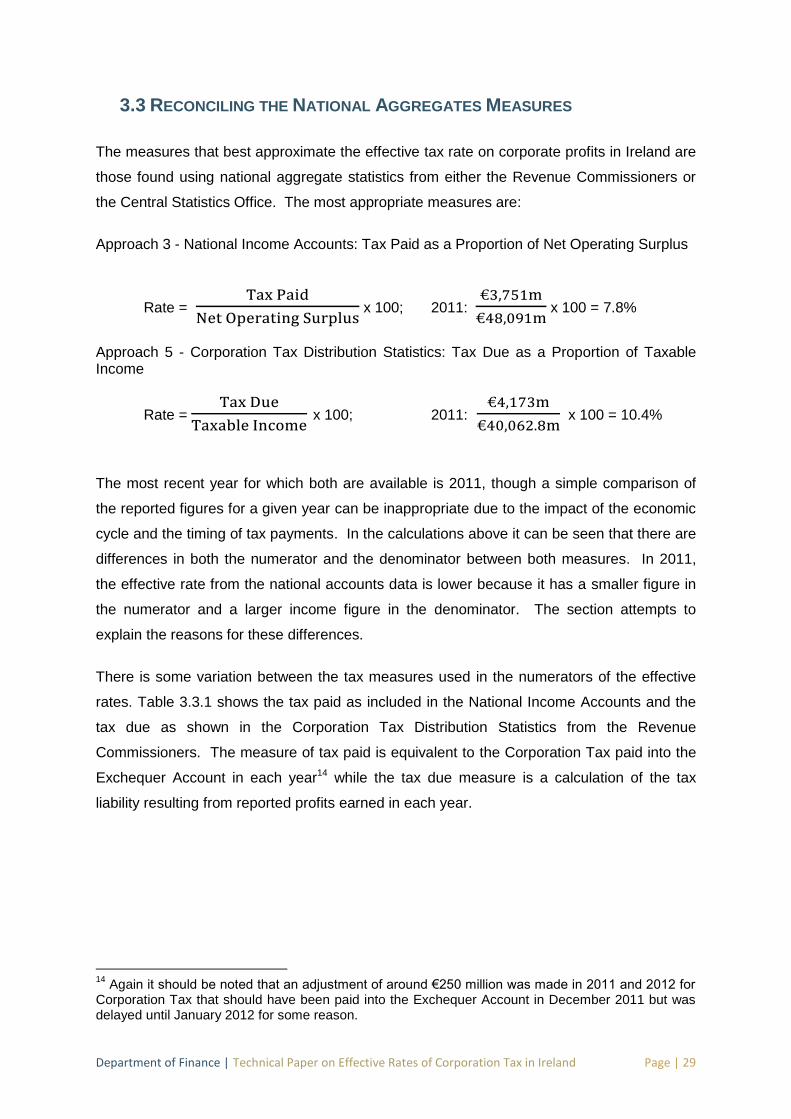
Department of Finance | Technical Paper on Effective Rates of Corporation Tax in Ireland Page | 29
3.3 RECONCILING THE NATIONAL AGGREGATES MEASURES
The measures that best approximate the effective tax rate on corporate profits in Ireland are
those found using national aggregate statistics from either the Revenue Commissioners or
the Central Statistics Office. The most appropriate measures are:
Approach 3 - National Income Accounts: Tax Paid as a Proportion of Net Operating Surplus
Rate =
x 100; 2011:
x 100 = 7.8%
Approach 5 - Corporation Tax Distribution Statistics: Tax Due as a Proportion of Taxable Income
Rate =
x 100; 2011:
x 100 = 10.4%
The most recent year for which both are available is 2011, though a simple comparison of
the reported figures for a given year can be inappropriate due to the impact of the economic
cycle and the timing of tax payments. In the calculations above it can be seen that there are
differences in both the numerator and the denominator between both measures. In 2011,
the effective rate from the national accounts data is lower because it has a smaller figure in
the numerator and a larger income figure in the denominator. The section attempts to
explain the reasons for these differences.
There is some variation between the tax measures used in the numerators of the effective
rates. Table 3.3.1 shows the tax paid as included in the National Income Accounts and the
tax due as shown in the Corporation Tax Distribution Statistics from the Revenue
Commissioners. The measure of tax paid is equivalent to the Corporation Tax paid into the
Exchequer Account in each year14 while the tax due measure is a calculation of the tax
liability resulting from reported profits earned in each year.
14
Again it should be noted that an adjustment of around €250 million was made in 2011 and 2012 for Corporation Tax that should have been paid into the Exchequer Account in December 2011 but was delayed until January 2012 for some reason.
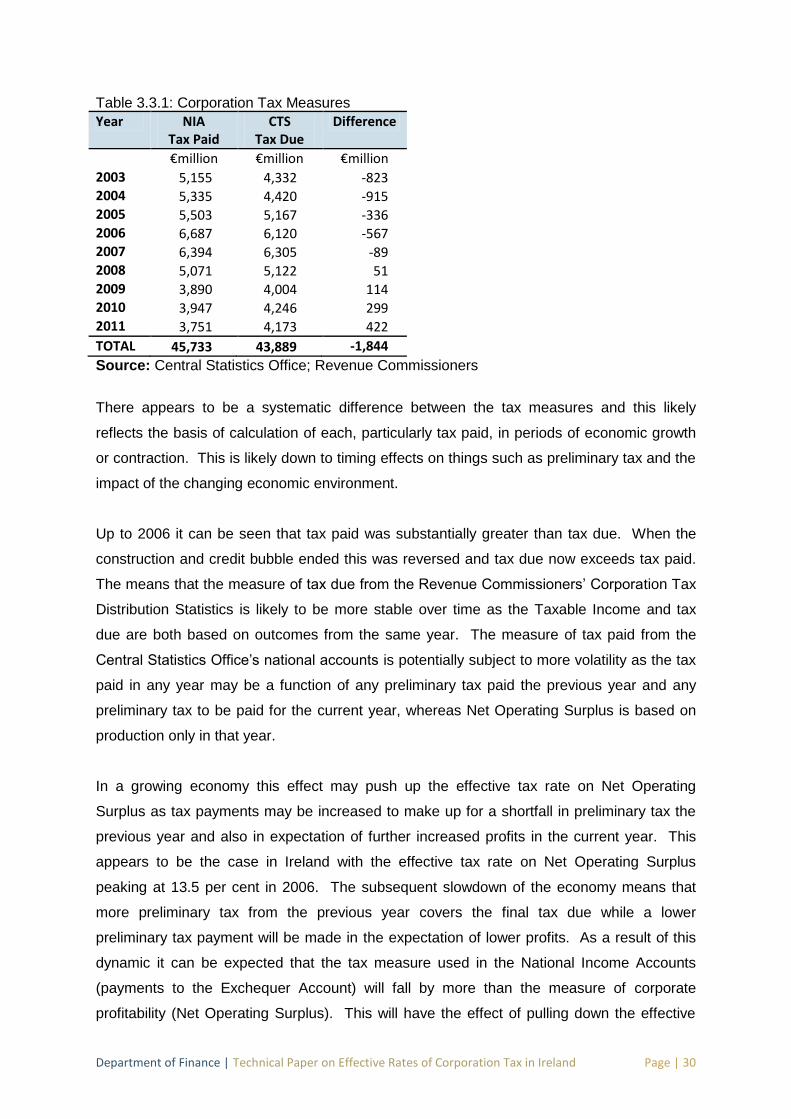
Department of Finance | Technical Paper on Effective Rates of Corporation Tax in Ireland Page | 30
Table 3.3.1: Corporation Tax Measures
Year NIA Tax Paid
CTS
Tax Due
Difference
€million €million €million
2003 5,155 4,332 -823 2004 5,335 4,420 -915 2005 5,503 5,167 -336 2006 6,687 6,120 -567 2007 6,394 6,305 -89 2008 5,071 5,122 51 2009 3,890 4,004 114 2010 3,947 4,246 299 2011 3,751 4,173 422
TOTAL 45,733 43,889 -1,844
Source: Central Statistics Office; Revenue Commissioners
There appears to be a systematic difference between the tax measures and this likely
reflects the basis of calculation of each, particularly tax paid, in periods of economic growth
or contraction. This is likely down to timing effects on things such as preliminary tax and the
impact of the changing economic environment.
Up to 2006 it can be seen that tax paid was substantially greater than tax due. When the
construction and credit bubble ended this was reversed and tax due now exceeds tax paid.
The means that the measure of tax due from the Revenue Commissioners’ Corporation Tax
Distribution Statistics is likely to be more stable over time as the Taxable Income and tax
due are both based on outcomes from the same year. The measure of tax paid from the
Central Statistics Office’s national accounts is potentially subject to more volatility as the tax
paid in any year may be a function of any preliminary tax paid the previous year and any
preliminary tax to be paid for the current year, whereas Net Operating Surplus is based on
production only in that year.
In a growing economy this effect may push up the effective tax rate on Net Operating
Surplus as tax payments may be increased to make up for a shortfall in preliminary tax the
previous year and also in expectation of further increased profits in the current year. This
appears to be the case in Ireland with the effective tax rate on Net Operating Surplus
peaking at 13.5 per cent in 2006. The subsequent slowdown of the economy means that
more preliminary tax from the previous year covers the final tax due while a lower
preliminary tax payment will be made in the expectation of lower profits. As a result of this
dynamic it can be expected that the tax measure used in the National Income Accounts
(payments to the Exchequer Account) will fall by more than the measure of corporate
profitability (Net Operating Surplus). This will have the effect of pulling down the effective
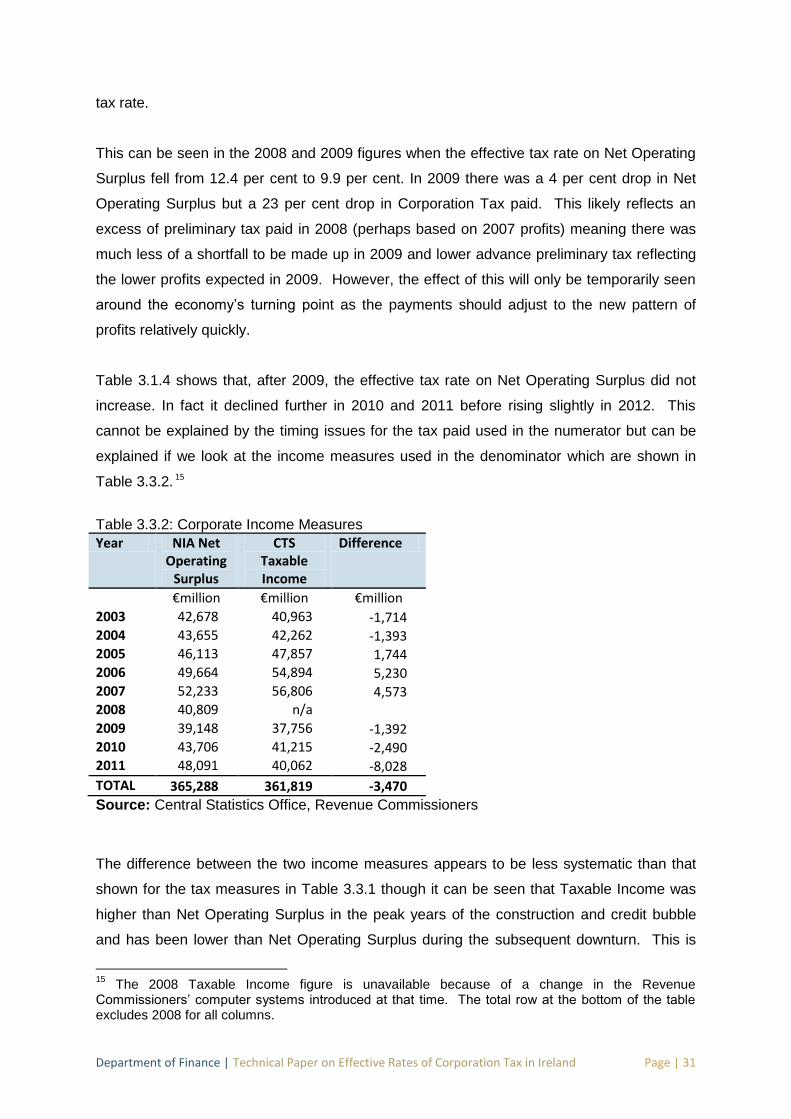
Department of Finance | Technical Paper on Effective Rates of Corporation Tax in Ireland Page | 31
tax rate.
This can be seen in the 2008 and 2009 figures when the effective tax rate on Net Operating
Surplus fell from 12.4 per cent to 9.9 per cent. In 2009 there was a 4 per cent drop in Net
Operating Surplus but a 23 per cent drop in Corporation Tax paid. This likely reflects an
excess of preliminary tax paid in 2008 (perhaps based on 2007 profits) meaning there was
much less of a shortfall to be made up in 2009 and lower advance preliminary tax reflecting
the lower profits expected in 2009. However, the effect of this will only be temporarily seen
around the economy’s turning point as the payments should adjust to the new pattern of
profits relatively quickly.
Table 3.1.4 shows that, after 2009, the effective tax rate on Net Operating Surplus did not
increase. In fact it declined further in 2010 and 2011 before rising slightly in 2012. This
cannot be explained by the timing issues for the tax paid used in the numerator but can be
explained if we look at the income measures used in the denominator which are shown in
Table 3.3.2. 15
Table 3.3.2: Corporate Income Measures
Year NIA Net Operating
Surplus
CTS
Taxable Income
Difference
€million €million €million
2003 42,678 40,963 -1,714 2004 43,655 42,262 -1,393 2005 46,113 47,857 1,744 2006 49,664 54,894 5,230 2007 52,233 56,806 4,573 2008 40,809 n/a 2009 39,148 37,756 -1,392 2010 43,706 41,215 -2,490 2011 48,091 40,062 -8,028
TOTAL 365,288 361,819 -3,470
Source: Central Statistics Office, Revenue Commissioners
The difference between the two income measures appears to be less systematic than that
shown for the tax measures in Table 3.3.1 though it can be seen that Taxable Income was
higher than Net Operating Surplus in the peak years of the construction and credit bubble
and has been lower than Net Operating Surplus during the subsequent downturn. This is
15
The 2008 Taxable Income figure is unavailable because of a change in the Revenue Commissioners’ computer systems introduced at that time. The total row at the bottom of the table excludes 2008 for all columns.
Department of Finance | Technical Paper on Effective Rates of Corporation Tax in Ireland Page | 32
likely the result of the capital gains of companies (excluding those on development land) and
the trading losses carried forward, both of which are used when calculating Taxable Income
but are not used in the determination of Net Operating Surplus.
The capital gains of companies arising from the disposal of assets (excluding development
land) are included in the Taxable Income base for Corporation Tax but are ‘re-grossed’ to
reflect the rate that applies under Capital Gains Tax (CGT) at the time the gain is made.16
Even though the gains are taxed under Corporation Tax it is the CGT rate that applies. Net
Operating Surplus only covers productive activity so such capital or holding gains are
excluded. The capital gains by companies that were taxed under Corporation Tax are
shown in Table 3.3.3 and the role of these can be seen in their inclusion as Other Income in
the 2011 calculation for Taxable Income in Table 3.2.1. These gains peaked at almost €3
billion in 2006 and 2007 (in re-grossed terms) and have declined significantly since then.
This will have had the effect of pulling up the effective tax rate on Net Operating Surplus
during the peak years as the tax paid under Corporation Tax will include tax on these capital
gains of companies which are not recorded in Net Operating Surplus.
Table 3.3.3: Capital Gains taxed under Corporation Tax and Losses Available for Corporation Tax
2003 2004 2005 2006 2007 2008 2009 2010 2011
€million €million €million €million €million €million €million €million €million
Capital Gains (regrossed) 1,096 1,332 2,050 2,994 2,858 1,912 799 645 737
Losses Available
Manufacturing 2,168 1,432 2,037 897 627 1,412 1,796 3,285 834
Non-Manufacturing 6,144 6,722 7,832 7,922 19,230 28,556 51,913 118,042 180,634
Total 8,312 8,154 9,869 8,819 19,858 29,968 53,709 121,327 181,468
Source: Revenue Commissioners, Corporation Tax Distribution Statistics
For the three years from 2009 to 2011, Table 3.3.2 shows that Net Operating Surplus of
companies in Ireland increased while in each of those years the amount of Taxable Income
subject to Corporation Tax decreased. Although there are some conceptual differences
16
See Footnote 6.
Department of Finance | Technical Paper on Effective Rates of Corporation Tax in Ireland Page | 33
between Taxable Income and Net Operating Surplus such as capital allowances versus
depreciation, the treatment of interest expenditure and the inclusion of foreign-source profits,
the effect of these will be generally stable over time and cannot explain relative changes in
the income measures.
The difference that can have a varying effect is the treatment of losses carried forward and
whether these were considered holding or trading losses in the national accounts at the time
they were incurred. As described above the capital gains during the boom caused Taxable
Income to be consistently above Net Operating Surplus. In the downturn, the application of
losses carried forward to Taxable Income will keep it below Net Operating Surplus.
During the recession many firms have made trading losses, in particular financial
corporations who have incurred massive losses from writing down the value of customer
loans they held.17 Unlike capital gains which are counted in Taxable Income when they are
crystallised, eligible trading losses are only applied to Taxable Income when the company
has a positive profit to tax, thus they can be carried forward. If a firm has an eligible trading
loss it can continue to carry it forward until the full offset against Taxable Income has been
claimed. Figures on the amount of losses actually used against current company profits
back to 2003 are not produced. We can, however, see the total amount of losses carried
forward available. These are shown in Table 3.3.3.18
In general trading losses are included when determining Net Operating Surplus so the effect
can largely be one of timing rather than level. However many of the losses generated in
recent years which are treated as eligible trading losses from a tax perspective are
categorised as holding losses from a national accounts perspective. In the main this applies
to the losses that financial corporations have incurred on their customer loans. In the
national accounts these are treated as holding losses and this means that, each year during
the recession, financial corporations can have generated a positive Net Operating Surplus
from a national accounts perspective but from an accounting and tax perspective have
generated substantial, and sustained, losses. These losses do not form part of the
production measures taken from the national accounts produced by the CSO and examined
in section 3.1, but do reduce the tax liability of companies as measured in the Revenue
Commissioners’ statistics examined in section 3.2. These trading losses carried forward will
17
For example, the five banks that transferred loans to the National Asset Management Agency (NAMA) incurred losses of around €42 billion on the transfer. 18
Additional details on the distribution by sector and use of these losses is available from Chapter 26 of the 2012 Annual Report of the Comptroller and Auditor General. See http://www.audgen.gov.ie/documents/annualreports/2012/report/en/Chapter26.pdf
Department of Finance | Technical Paper on Effective Rates of Corporation Tax in Ireland Page | 34
continue to reduce Taxable Income for a considerable period as the accumulated losses are
offset against future profits until they have been fully exhausted.
Figures on the amount of losses carried forward actually used against profits are available
from the Revenue Commissioners since 2009 and these show that in 2009 and 2010 €4.9
billion and €3.9 billion of losses carried forward were offset against profits in those years
while in 2011 the amount of trading losses carried forward used was €9.5 billion.
Between 2009 and 2011 the Net Operating Surplus reported by the CSO for all companies in
Ireland increased by €9 billion. Over the same period the amount of Taxable Income
reported by the Revenue Commissioners increased by just €2 billion. Although their
treatment of depreciation, interest and foreign-source income differs, by far the biggest
reason for the recent difference between them is the deduction of trading losses carried
forward from current profits in the determination of Taxable Income, which were around €5
billion higher over the period.
As long as such losses remain available to firms this has the effect of bringing down the
effective tax rate on Net Operating Surplus as the amount of Corporation Tax paid into the
Exchequer Account includes relief granted for previous losses (through a deduction from
current profits) whereas they are not used in the determination of Net Operating Surplus by
the CSO in the national accounts framework if they are treated as holding losses. The use
of these losses in offsetting the amount of tax paid on current profits pulls down the effective
tax rate on Net Operating Surplus. As the losses carried forward are used up it can be
expected that Taxable Income will converge on Net Operating Surplus and the effective tax
rate of Net Operating Surplus will automatically rise.
Over time it might be expected that these timing and treatment differences of gains and
losses between the National Income and Corporation Tax frameworks would “wash out”.
And this appears to be the case. The overall eight-year (2003 to 2011, excluding 2008)
average tax rate on Net Operating Surplus from the national accounts is 11.1 per cent. The
equivalent eight-year average rate for tax due as a proportion of Taxable Income from the
Revenue Commissioners’ CTS statistics is 10.7 per cent. The changing economic
environment causes fluctuations in the national accounts rate and we are currently at a
period where it is less than the rate from the Revenue Commissioners’ statistics but over the
eight-year period used in this Paper the rate from the national accounts has been slightly
higher.
Department of Finance | Technical Paper on Effective Rates of Corporation Tax in Ireland Page | 35
The reasons they both have average rate below the headline 12.5 per cent Corporation Tax
rate are relatively straightforward. The Taxable Income figure reported by the Revenue
Commissioners includes the foreign-source income of Irish-resident companies. These
companies are taxed on their worldwide income but are given relief for corporate income tax
paid abroad to avoid double taxation. These already-taxed, foreign-source profits of Irish-
resident companies are included in Taxable Income but relief is given so that they are not
taxed twice.
Net Operating Surplus is derived only from production activity in Ireland and is not affected
by foreign-source income. However, as outlined previously, a large part of the interest
expense of non-financial companies is not deducted from Net Operating Surplus. For non-
financial corporations, only interest that deals with the operating and not the financing of the
companies is deducted. All of the interest paid by companies is generally allowable as a
deduction for tax purposes so this has an overstating effect on the profitability of companies
as measured by Net Operating Surplus.
Although the reasons are different the effect appears to be roughly the same. Both rates
have averaged around 11 per cent since 2003. Tax due as a proportion of Taxable Income
is below the 12.5 per cent rate because of the inclusion of foreign source profits on which
double taxation relief is granted. Tax paid as a proportion of Net Operating Surplus is below
12.5 per cent because of the exclusion of much of the interest paid by non-financial
corporations which overstates corporate profitability. Once account is taken of these factors
the effective tax rate for both is around 12 per cent.
Department of Finance | Technical Paper on Effective Rates of Corporation Tax in Ireland Page | 36
SECTION 4: COMBINED COMPANY APPROACH The final approach involves the use of company data to calculate an effective corporate tax
rate. It should be clear that the use of company data means that the estimated effective tax
rates are for companies rather than countries. Even though this is the case some effective
tax rates calculated using this method are attributed to Ireland, even though they should be
correctly attributed to the group of companies that make up the sample. In that sense this
note will explore the following two measures of the effective corporate tax that have been
produced using this method, labelled Approaches 7 and 8 in Table 1 of the Executive
Summary:
7. Average Tax Rate of Irish Times Top 1000 Irish Companies: 15.5 per cent (2012) 8. Average Tax Rate of Irish-Incorporated Companies in US BEA data: 2.2 per cent (2011)
4.1 THE IRISH TIMES: TOP 1000 IRISH COMPANIES
The Irish Times maintain a database of what they term The Irish Times Top 1000
companies. The data is collected from company reports filed with the Company Registration
Office in Ireland but the database generated is not publicly available. For 2012 it was
reported that the effective tax rate of the companies in the sample was 15.5 per cent.19
It is not clear if this is a simple or weighted average of the effective tax rates of the
companies in the sample. It is also the case that profits earned and taxes paid outside of
Ireland are included. While the measure may give a useful insight into the effective tax rates
of the companies included the sample, it cannot be concluded that the rate arises solely from
the interaction of the companies’ profits with the Irish Corporation Tax regime.
4.2 US BUREAU OF ECONOMIC ANALYSIS: DIRECT INVESTMENT ABROAD DATA
The federal economic statistics agency in the United States, the Bureau of Economic
Analysis, publishes statistics that can be used to produce effective tax rates. As part of their
International Economic Accounts they publish data on “Direct Investment and Multinational
Companies”. The US Direct Investment Abroad (USDIA) data give details on the non-US
activities of subsidiary companies which are owned by US parent companies. Table 4.2.1 is
19 See http://www.irishtimes.com/business/ireland-s-top-companies-paying-effective-tax-rate-of-15-5-on-profits-1.1541494
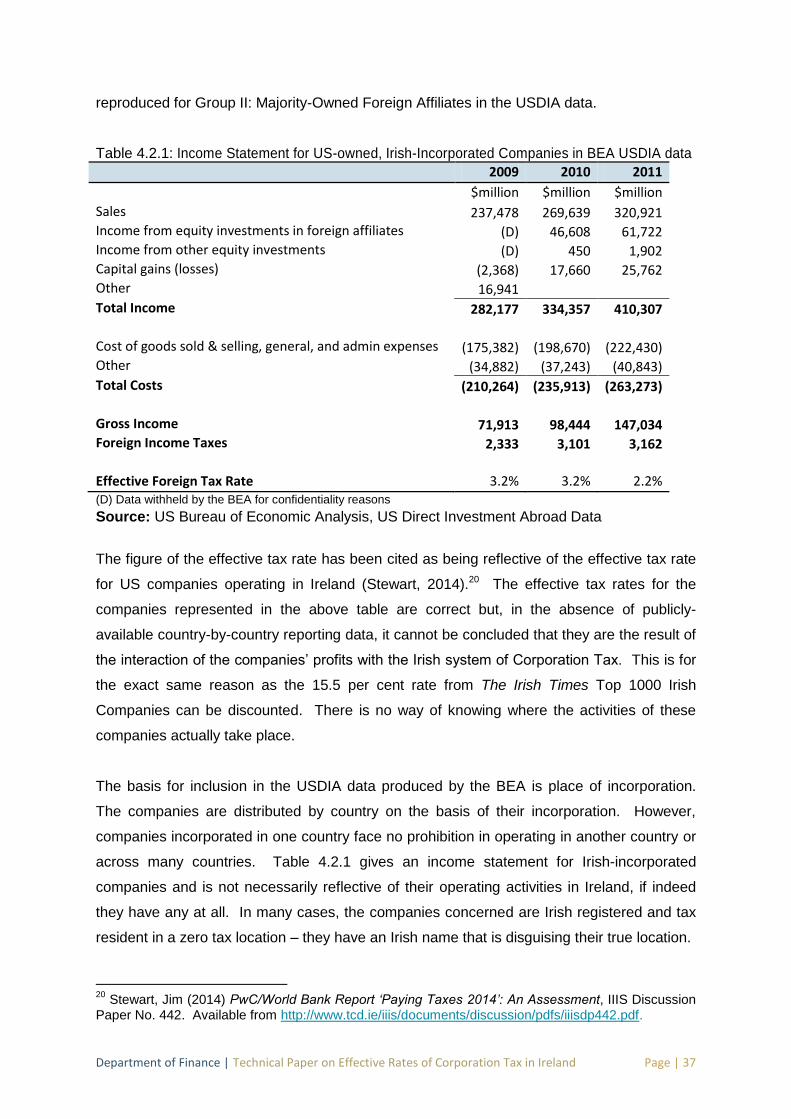
Department of Finance | Technical Paper on Effective Rates of Corporation Tax in Ireland Page | 37
reproduced for Group II: Majority-Owned Foreign Affiliates in the USDIA data.
Table 4.2.1: Income Statement for US-owned, Irish-Incorporated Companies in BEA USDIA data
2009 2010 2011
$million $million $million
Sales 237,478 269,639 320,921 Income from equity investments in foreign affiliates (D) 46,608 61,722 Income from other equity investments (D) 450 1,902 Capital gains (losses) (2,368) 17,660 25,762 Other 16,941
Total Income 282,177 334,357 410,307
Cost of goods sold & selling, general, and admin expenses (175,382) (198,670) (222,430) Other (34,882) (37,243) (40,843)
Total Costs (210,264) (235,913) (263,273)
Gross Income 71,913 98,444 147,034 Foreign Income Taxes 2,333 3,101 3,162
Effective Foreign Tax Rate 3.2% 3.2% 2.2% (D) Data withheld by the BEA for confidentiality reasons
Source: US Bureau of Economic Analysis, US Direct Investment Abroad Data
The figure of the effective tax rate has been cited as being reflective of the effective tax rate
for US companies operating in Ireland (Stewart, 2014).20 The effective tax rates for the
companies represented in the above table are correct but, in the absence of publicly-
available country-by-country reporting data, it cannot be concluded that they are the result of
the interaction of the companies’ profits with the Irish system of Corporation Tax. This is for
the exact same reason as the 15.5 per cent rate from The Irish Times Top 1000 Irish
Companies can be discounted. There is no way of knowing where the activities of these
companies actually take place.
The basis for inclusion in the USDIA data produced by the BEA is place of incorporation.
The companies are distributed by country on the basis of their incorporation. However,
companies incorporated in one country face no prohibition in operating in another country or
across many countries. Table 4.2.1 gives an income statement for Irish-incorporated
companies and is not necessarily reflective of their operating activities in Ireland, if indeed
they have any at all. In many cases, the companies concerned are Irish registered and tax
resident in a zero tax location – they have an Irish name that is disguising their true location.
20
Stewart, Jim (2014) PwC/World Bank Report ‘Paying Taxes 2014’: An Assessment, IIIS Discussion Paper No. 442. Available from http://www.tcd.ie/iiis/documents/discussion/pdfs/iiisdp442.pdf.
Department of Finance | Technical Paper on Effective Rates of Corporation Tax in Ireland Page | 38
The scale of the figures in Table 4.2.1 shows that the figures are not limited to the Irish
operations, if any, of these companies. At $321 billion, or around €230 billion21, the sales
figure is greater than the total amount of exports recorded from Ireland in 2011 of €167
billion. This €167 billion reflects the exports of all firms operating in Ireland not just those of
the US-owned, Irish-incorporated companies which are included in the BEA data. It is
impossible to tell from the BEA data from where the sales of these companies were actually
made. Some of the sales are undoubtedly from Ireland but it is not possible for it to be $321
billion.
It is also impossible to tell where the $3.2 billion of non-US corporation tax paid by these
companies in 2011 was actually paid. Irish-incorporated companies are not limited to paying
tax in Ireland. Again, some of it will have been paid in Ireland but the full amount would
represent more than 60 per cent of all Corporation Tax paid in Ireland in 2011.
It is also the case that some of these companies are not resident in Ireland for tax purposes.
If these companies were tax resident in Ireland their pre-tax profits would be subject to
Ireland’s 12.5 per cent corporation tax on the amount of Taxable Income with little facility to
reduce their effective rate below the headline rate.
To use an analogy with a person it is likely that in many cases these are companies which
were born here through their incorporation but who “live” somewhere else. It is somewhat
similar to the Irish Income Tax system which does not levy income tax on Irish nationals who
live abroad. The Irish Corporation Tax system does not levy corporation tax on some Irish
incorporated companies whose activities are carried out abroad. If these companies have
their place of effective management and control in Ireland then they will be considered
resident in Ireland for tax purposes and subject to Irish Corporation Tax on their worldwide
income (albeit with relief given for corporate income tax paid in other countries).
The BEA data does highlight how some companies can use the interaction between different
tax regimes to achieve very low effective tax rates. It should be noted that the USDIA data
produced by the BEA only includes foreign tax paid, so it is an effective foreign tax rate.
There is no figure given for the domestic (that is US) corporate income tax paid on the profits
earned by these companies.
The US levies a 35 per cent federal corporate income tax on the worldwide profits of US
21
Based on an average annual exchange rate of US$1 = €0.72 during 2011.
Department of Finance | Technical Paper on Effective Rates of Corporation Tax in Ireland Page | 39
companies. The Irish-incorporated companies in Table 4.3.1 which had $147 billion of gross
income in 2011 will be liable to pay around $51.5 billion in US corporate income tax (with
credits given for the $3.2 billion of foreign corporate income tax paid). These Irish-
incorporated companies therefore face a US tax liability of $48.3 billion on the reported 2011
profits which cannot be avoided but which can be deferred, sometimes indefinitely.22 It
cannot be determined from the BEA data how much of this US tax liability was actually paid.
Thus the quoted effective rates are only for foreign corporate income tax paid and not
necessarily the total effective tax rate on these profits.
To the extent that the companies in Table 4.2.1 are availing of the deferral provisions in the
US tax code their overall effective tax rate could be close to the effective foreign tax rate
shown in the table. This would be achieved if the companies are tax resident in a low- or no-
tax jurisdiction and their profits are not repatriated to the US parent company. From an Irish
perspective it should be noted that the income statement refers to the worldwide operations
of these Irish-incorporated companies and, if not tax resident in Ireland, they will be taxed
under Irish Corporation Tax only on their profits actually sourced in Ireland. Table 4.2.1
cannot be used to determine anything useful about effective Corporation Tax rates in Ireland
but does show that Irish-incorporated companies used by US MNCs have very low effective
rates of foreign tax paid outside the US.
22
Although the US levies corporate income tax on the worldwide profits of US companies the actual tax payment on foreign, that is non-US, profits can deferred using a range of provisions. There is a general deferral principle in the US tax code for foreign-source active income and a general non-deferral regime, known as Subpart F, for foreign-source passive income. Subpart F was introduced in the 1960s but its effectiveness has been reduced with the introduction of exemptions that allow deferral of US corporate income tax due on passive income such as interest, dividends and patent royalties. In these instances the US corporate income tax does not have to be paid until the profits are actually repatriated to the US. In some instances the US companies can decide to keep these profits offshore indefinitely thereby permanently deferring the tax payment.

Department of Finance | Technical Paper on Effective Rates of Corporation Tax in Ireland Page | 40
SECTION 5: CONCLUSION
This Technical Paper considered the effective tax rate on corporate profits in Ireland. It will
be appreciated that this apparently straight-forward concept generates significant confusion.
There is no single best measure of the effective tax rate and this Paper presents and
examines eight different calculations for an effective tax rate on corporate profits in Ireland
under three broad headings:
using model companies;
using official national statistics; and
using company financial reports.
The spread of estimates ranges from 2.2 per cent to 15.5 per cent for the most recent data
available. Different approaches are relevant depending on the specific nature of the
question being addressed. Some approaches are better at measuring the complexity and
breadth of corporate tax. Other approaches are better at measuring the effective tax rate of
companies. In attempting to assess the effective corporate tax rate that is applied to the
aggregate total of corporate profits in Ireland, this Paper has concluded that the approach
based on national aggregate statistics is the most suitable.
The data from the Central Statistics Office and the Revenue Commissioners provide the best
estimates of the effective rate of Irish Corporation Tax on the total profits that are subject to
Irish tax but even within that there remains a choice of measures. This Paper has put
forward the thesis that the measures based on Net Operating Surplus and Taxable Income
best represent the effective Corporation Tax rate in Ireland.
Much lower effective tax rates can be identified, notably the effective foreign tax rate for US-
owned, Irish-incorporated companies, in the direct investment data produced by the Bureau
of Economic Analysis. These show how MNCs can structure their activities to generate very
low effective tax rates but it is not possible to achieve such low rates for profits earned in
Ireland.
The most appropriate effective tax rates identified in this Paper are below the headline 12.5
per cent rate and the reasons for this are the inclusion of foreign-source profits in the case of
Taxable Income, and the exclusion of the interest cost of financing in the case of Net
Operating Surplus. The impact of these factors is relatively small and the analysis presented
here has shown that, since 2003, the effective Corporation Tax rates on Net Operating
Surplus and Taxable Income have averaged 10.9 per cent and 10.7 per cent respectively.