effect of truck tire inflation pressure and axle load on...
TRANSCRIPT
14
s. M.J. Mack, Jr., D.E. Hill, and J.R. Baumgarten. Analytical and Experimental Study of a Standing Torus with Normal Loads. Tire Modeling, NASA Conference Publication 2264. National Aeronautics and Space Administration, Washington, D.C., 1982.
6. S.K. Clark. Mechanics of Pneumatic Tires. Report NBS-Mono-122. Michigan University, Ann Arbor, Nov. 1971,853 PP•
7. S.A. Lippmann and K.L. Oblizajek. The Distribution of Stress Between the Tread and Road for Freely Rolling Tires. Transaction 740072. Society of Automotive Engineers, Warrendale, Pa., 1974.
8. R.B. Connell. Experimental Determination of Truck Tire Contact Pressures and Their Effect on Flex-
Transportation Research Record 1070
ible and Rigid Pavement Performance. M.S. thesis. University of Texas at Austin, Austin, 1985.
The contents of this paper reflect the views of the authors, who are responsible for the facts and the accuracy of the data presented herein. The contents do not necessarily reflect the official views or policies of the FHWA. This paper does not constitute a standard, specification, or regulation .
Publication of this paper sponsored by Conunittee on Strength and Deformation Characteristics of Pavement Sections.
Effect of Truck Tire Inflation Pressure and Axle Load on Flexible and Rigid Pavement Performance
KURT M. MARSHEK, HSIEN H. CHEN, RICHARD B. CONNELL, and CHHOTE L. SARAF
ABSTRACT
Results are presented of an investigation into the effect of truck tire inflation pressure and axle load on flexible and rigid pavement performance as determined by using computer analysis programs. The flexible and rigid pavement analyses were conducted with both an experimental nonuniform contact pressure distribution and a uniform circular contact pressure distribution as input to the computer programs. The results indicated for the flexible pavement analysis that high inflation pressures and heavy axle loads cause higher tensile strains at the bottom of the surface course, but that only heavy axle loads and not increased inflation pressures are responsible for higher compressive strains at the top of the subgrade course. The rigid pavement analysis indicated an insignificant difference between results obtained by using an experimental and a uniform contact pressure distribution model.
A variety of factors are known to contribute to pavement damage, including climate, traffic density, and the loads from automobile and truck tires. Historically, the subject of the effect of truck tire inflation pressure has received little attention for several reasons, including the following: (a) simplifying assumptions made in past road design procedures have made knowledge of the actual pressure distribution unnecessary, and (b) it is difficult to make measurements of the contact pressure over the entire contact area. The influence of tire inflation pressure as well as the contact pressure distribution between the tire and the pavement will both undoubtedly play a larger role in highway design after
K.M. Marshek, H.H. Chen, and R.B. Connell, Mechanical Engineering Department, University of Texas at Austin, Austin, Tex. 78712. C.L. Saraf, Center for Transportation Research, University of Texas at Austin, Austin, Tex. 78712.
their role in causing pavement damage is better understood.
The contact pressure distributions for truck tires loaded at various axle loads and tire inflation pressures were obtained experimentally by using a pressure-sensitive film technique (1). These experimental data were used to determine the effects that the magnitude and shape of the truck tire contact pressure distribution have on the stresses, strains, and deformations developed in the pavement. Computer programs, typical of those used by highway engineers in pavement analysis and design work, are used to determine the strains and stresses of interest for both flexible and rigid pavements. The strains and stresses for an experimental contact pressure distribution will be compared with those obtained by using a uniform pressure model.
The objective of this paper was to determine the effect of tire inflation pressure, tire axle load, and tire pressure distribution model on the strains
Marshek et al.
and stresses in flexible and rigid pavements. A significant portion of this paper will concentrate on flexible pavements because of their anticipated sensitivity to the pressure distribution. Tensile stresses in rigid pavements will also be investigated. The pavement descriptions and computer models used in the analysis of pavement stress (strain) will be described.
FLEXIBLE PAVEMENT MODEL
Figure l shows the flexible pavement model with surface, base, and subgrade courses. The surface courses in this study had thicknesses (Hsl between 1 and 4 in. and a Young's modulus (E) of 400 ksi (note that the modulus would depend on the season of the year). The base and subgrade had thicknesses of 8 and 169 in., respectively, and Young's moduli of 20 and 6 ksi, respectively. The course thicknesses and Young's moduli chosen correspond for the most part with those of a road with low traffic volume.
Tire
E = 400 ksl H = 1-4 in
Pressure Distribution Model for BISAR
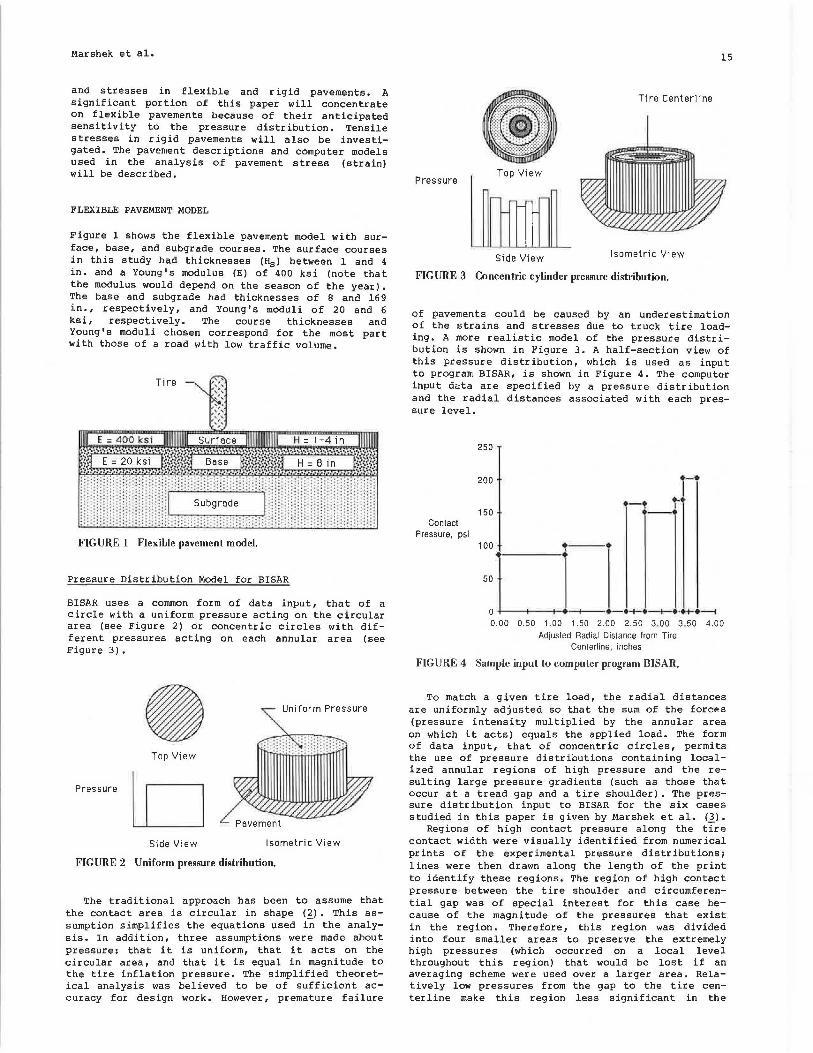
BISAR uses a common form of data input, that of a circle with a uniform pressure acting on the circular area (see Figure 2) or concentric circles with different pressures acting on each annular area (see Figure 3) •
• Uniform Pressure
Top View
Pressure lo Side View Isometric View
FIGURE 2 Uniform pressure distribution.
The traditional approach has been to assume that the contact area is circular in shape (~) • This assumption simplifies the equations used in the analysis. In addition, three assumptions were made about pressure: that it is uniform, that it acts on the circular area, and that it is equal in magnitude to the tire inflation pressure. The simplified theoretical analysis was believed to be of sufficient accuracy for design work. However, premature failure
15
Tire Centerline
Pressure Top View
Side View Isometric View
FIGURE 3 Concentric cylinder pressure distribution.
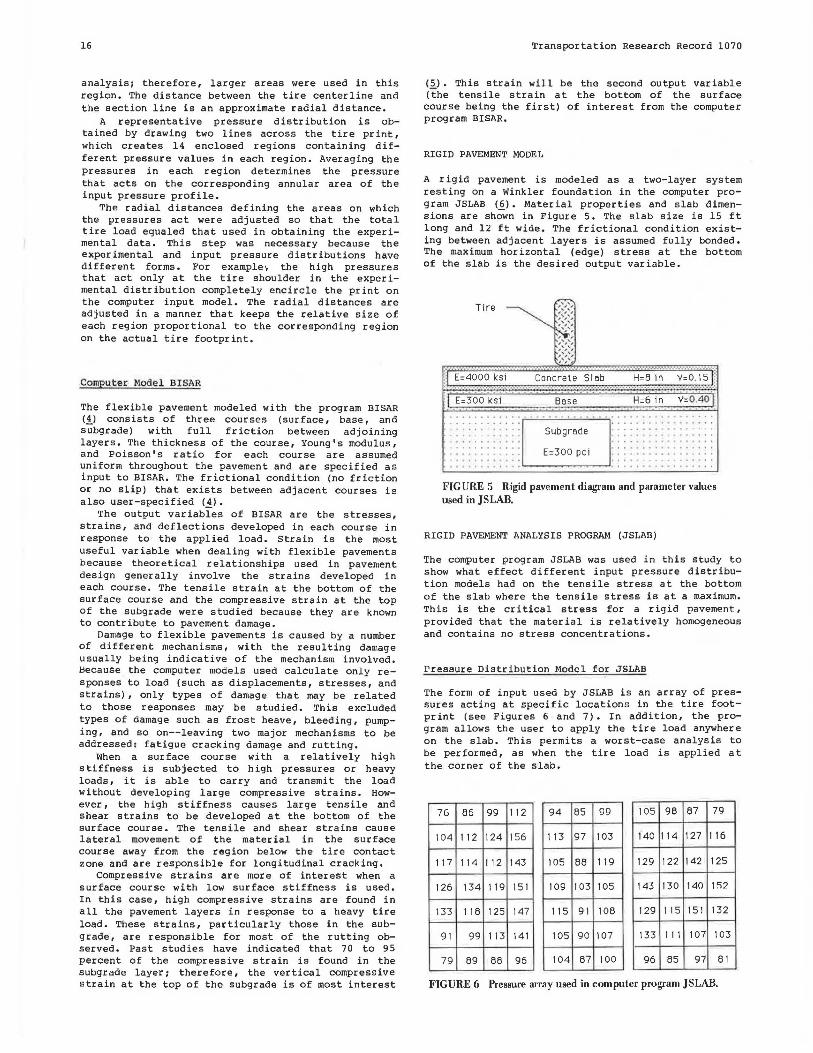
of pavements could be caused by an underestimation of the strains and stresses due to truck tire loading. A more realistic model of the pressure distribution is shown in Figure 3. A half-section view of this pressure distribution, which is used as input to program BISAR, is shown in Figure 4. The computer input deta are specified by a pressure distribution and the radial distances associated with each pressure level.
Contact Pressure, psi
250
200
150
_, ,.. ·--· ':: 1 ' ' ]~~-~ ~·-·~
0.00 0.50 1.00 1.50 2.00 2.50 3.00 3 .50 4.00 Adjusted Radial Distance from Tire
Centerline, inches
FIGURE 4 Sample input to computer program BISAR.
To match a given tire load, the radial distances are uniformly adjusted so that the sum of the forc@s (pressure intensity multiplied by the annular area on which it acts) equals the applied load. The form of data input, that of concentric circles, permits the use of pressure distributions containing localized annular regions of high pressure and the resulting large pressure gradients (such as those that occur at a tread gap and a tire shoulder). The pressure distribution input to BISAR for the six cases studied in this paper is given by Marshek et al. <l>·
Regions of high contact pressure along the tire contact width were visually identified from numerical pr in ts of the experimental pressure distributions; lines were then drawn along the length of the print to identify these regions. The region of high contact pressure between the tire shoulder and circumferential gap was of special interest for this case because of the magnitude of the pressures that exist in the region. Therefore, this region was divided into four smaller areas to preserve the extremely high pressures (which occurred on a local level throughout this region) that would be lost if an averaging scheme were used over a larger area. Relatively low pressures from the gap to the tire center line make this region less significant in the
16
analysis; therefore, larger areas were used in this region. The distance between the tire centerline and the section line is an approximate radial distance.
A representative pressure distribution is obtained by drawing two lines across the tire pr int, which creates 14 enclosed regions containing different pressure values in each region. Averaging the pressures in each region determines the pressure that acts on the corresponding annular area of the input pressure profile.
The radial distances defining the areas on which the pressures act were adjusted so that the total tire load equaled that used in obtaining the experimental data. This step was necessary because the experimental and input pressure distributions have different forms. For example•, the high pressures that act only at the tire shoulder in the experimental distribution completely encircle the print on the computer input model. The radial distances are adjusted in a manner that keeps the relative size of each region proportional to the corresponding region on the actual tire footprint.
Computer Model BISAR
The flexible pavement modeled with the program BISAR (_!) consists of three courses (surface, base, and subgrade) with full friction between adjoining layers. The thickness of the course, Young's modulus, and Poisson's ratio for each course are assumed uniform throughout the pavement and are specified as input to BISAR. The frictional condition (no friction or no slip) that exists between adjacent courses is also user-specified (4).
The output variables of BISAR are the stresses, strains, and deflections developed in each course in response to the applied load. Strain is the most useful variable when dealing with flexible pavements because theoretical relationships used in pavement design generally involve the strains developed in each course. The tensile strain at the bottom of the surface course and the compressive strain at the top of the subgrade were studied because they are known to contribute to pavement damage.
Damage to flexible pavements is caused by a number of different mechanisms, with the resulting damage usually being indicative of the mechanism involved. Hecause the computer models used calculate only responses to load (such as displacements, stresses, and strains), only types of damage that may be related to those responses may be studied. This excluded types of damage such as frost heave, bleeding, pumping, and so on--leaving two major mechanisms to be addressed: fatigue cracking damage and rutting.
When a surface course with a relatively high stiffness is subjected to high pressures or heavy loads, it is able to carry and transmit the load without developing large compressive strains. However, the high stiffness causes large tensile and shear strains to be developed at the bottom of the surface course. The tensile and shear strains cause lateral movement of the material in the surface course away from the region below the tire contact zone and are responsible for longitudinal cracking.
Compressive strains are more of interest when a surface course with low surface stiffness is used. In this case, high compressive strains are found in all the pavement layers in response to a heavy tire load. These strains, particularly those in the subgrade, are responsible for most of the rutting observed. Past studies have indicated that 70 to 95 percent of the compressive strain is found in the subgrade layer; therefore, the vertical compressive strain at the top of the subgrade is of most interest
Transportation Research Record 1070
<i >· This strain will be the second output variable (the tensile strain at the bottom of the surface course being the first) of interest from the computer program BISAR.
RIGID PAVEMENT MODEL
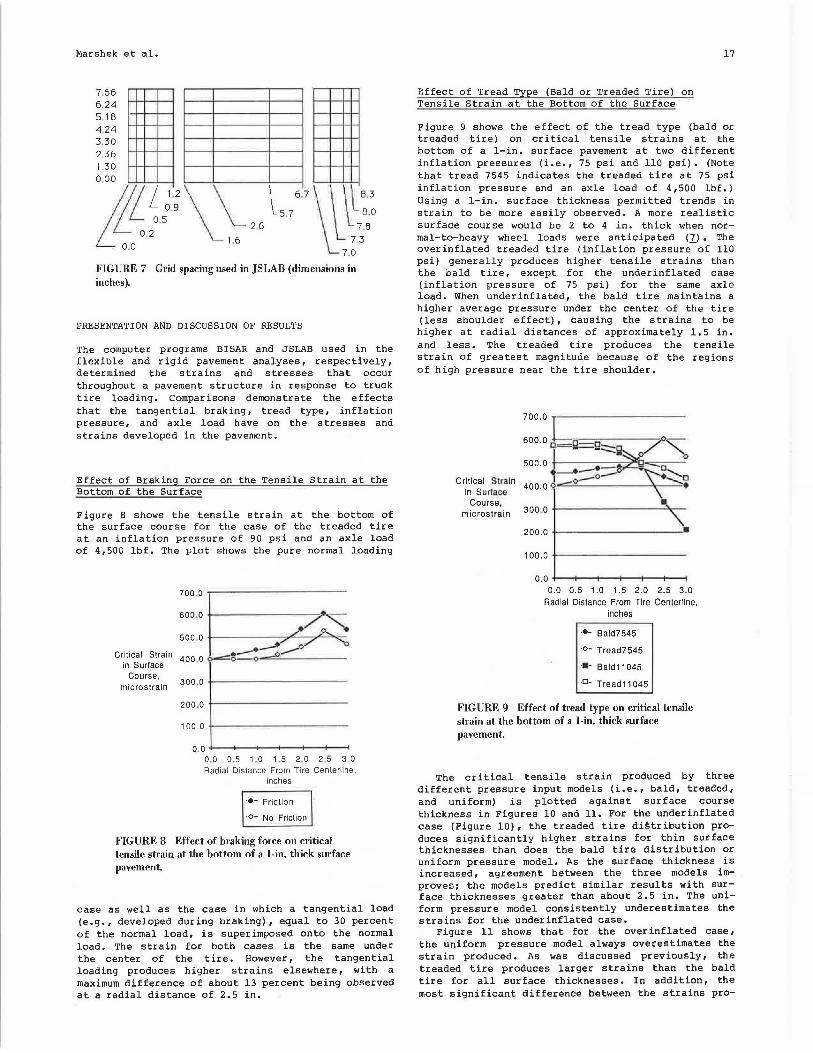
A rigid pavement is modeled as a two-layer system resting on a Winkler foundation in the computer program JSLAB (~). Material properties and slab dimensions are shown in Figure 5. The slab size is 15 ft long and 12 ft wide. The frictional condition existing between adjacent layers is assumed fully bonded. The maximum horizontal (edge) stress at the bottom of the slab is the desired output variable.
Tire
:\1 .. E.=40.00 k.si Concret~ · 5·l· ~·b ..... . H=8 .. in- ··~:,~:·;· 5 j;: ~ • • • -·.' ••••••• -~ -~'' ••••• ~ - - ·- . - - • - ....... .. .. .. ... .. ... . . .. ........... ••+< •• • • ' • • •• ::
. . . . . . . . . . . . . ...... .... . Subgrade
E=300 pci
H:6 in V:0.4o l
, . . . . . . . . . . . . ......... - ..... . . .. .. . . . . . '----~~---'· . . . . . . . . . .. ..
FIGURE 5 Rigid pavement diagram and parameter values used in JSLAB.
RIGID PAVEMENT ANALYSIS PROGRAM (JSLAB)
The computer program JSLAB was used in this study to show what effect different input pressure distribution models had on the tensile stress at the bottom of the slab where the tensile stress is at a maximum. This is the critical stress for a rigid pavement, provided that the material is relatively homogeneous and contains no stress concentrations.
rressure Distribution Model for JSLAB
The form of input used by JSLAB is an array of pressures acting at specific locations in the tire footprint (see Figures 6 and 7). In addition, the program allows the user to apply the tire load anywhere on the slab. This permits a worst-case analysis to be performed, as when the tire load is applied at the corner of the slab.
7G 66 99 112 94 85 99 105 96 87 79
104 112 124 156 113 97 103 140 114 127 116
117 114 112 143 105 88 119 129 122 142 125
126 134 119 151 109 103 105 143 130 140 1!'i2
133 116 125 147 115 91 108 129 115 151 132
91 99 113 14 1 105 90 107 133 111 107 103
79 69 68 96 104 87 100 96 85 97 61
FIGURE 6 Pressure array used in computer program JSLAB.
Marshek et al.
7.66 6.24 5. 1 B 4.24 3 .30 2 .36 1.30 o.oo
!f:,~J:\\,5 ls ,57
~~,;: 7.0
FIGURE 7 Grid spacing used in JS LAB (dimensions in inches).
PRESENTATION AND DISCUSSION OF RESULTS
The computer programs BISAR and JSLAB used in the flexible and rigid pavement analyses, respectively, determined the strains and stresses that occur throughout a pavement structure in response to truck tire loading. Comparisons demonstrate the effects that the tangential braking, tread type, inflation pressure, and axle load have on the stresses and strains developed in the pavement.
Effect of Braking Force on the Tensile Strain at the Bottom of the Surface
Figure 8 shows the tensile strain at the bottom of the surface course for the case of the treaded tire at an inflation pressure of 90 psi and an axle load of 4,500 lbf. The plot shows the pure normal loading
Critical Strain in Surface
Course. microstrain
700 .0 I 600 0 . •
L/,o..... • 500 .0 +-------,,,.----"--/~"'-'--"'""-""I)-·- ·_. --0 400 .0 o-==o-o·~.......P-="-------
300 .0 +------------
200 .0 +----- -------
100.0 +------------
0.0 +------<>----+---+----< 0.0 0.5 1.0 1.5 2.0 2.5 3.0 Radial Distance From Tire Centerline,
inches
·•- Friction
·O- No Friction
FIGURE 8 Effect of braking force on critical tensile strain at the bottom of a l ·in. thick surface pavement.
case as well as the case in which a tangential load (e.g., developed during braking), equal to 30 percent of the normal load, is superimposed onto the normal load. The strain for both cases is the same under the center of the tire. However, the tangential loading produces higher strains elsewhere, with a maximum difference of about 13 percent being observed at a radial distance of 2.5 in.
Effect of Tread Type (Bald or Treaded Tire) on Tensile Strain at the Bottom of the Surface
17
Figure 9 shows the effect of the tread type (bald or treaded tire) on critical tensile strains at the bottom of a 1-in. surface pavement at two different inflation pressures (i.e., 75 psi and 110 psi). (Note that tread 7545 indicates the treaded tire at 75 psi inflation pressure and an axle load of 4 ,500 lbf.) Using a 1-in. surface thickness permitted trends in strain to be more easily observed. A more realistic surface course would be 2 to 4 in. thick when normal-to-heavy wheel loads were anticipated (7). The overinflated treaded tire (inflation pressure-of 110 psi) generally produces higher tensile strains than the bald tire, except for the under inflated case (inflation pressure of 75 psi) for the same axle load. When underinflated, the bald tire maintains a higher average pressure under the center of the tire (less shoulder effect), causing the strains to be higher at radial distances of approximately 1.5 in. and less. The treaded tire produces the tensile strain of greatest magnitude because of the regions of high pressure near the tire shoulder.
Critical Strain in Surface
Course, microstrain
700.0 L 600.0 0_·~0-_-n----~ _ __ .,_ !ii / "'o
500.0 I ·-·==~~~ ~- _ o__.,., •'o 400.0 0 ° ...........
200.0 +------------"'
100.0 +-----------
0.0 +---i--t---+------< 0.0 0.5 1.0 1.5 2.0 2.5 3.0
Radial Distance From Tire Centerline, inches
·•- Bald7545
·O- Tread7545
·•· Bald11045
·0 • Tread11045
FIGURE 9 Effect of tread type on critical tensile strain at the bottom of a l·in. thick surface pavement.
The critical tensile strain produced by three different pressure input models (i.e., bald, treaded, and uniform) is plotted against surface course thickness in Figures 10 and 11. For the underinflated case (Figure 10), the treaded tire di~tribution produces significantly higher strains for thin surface thicknesses than does the bald tire distribution or uniform pressure model. As the surface thickness is increased, agreement between the three models improves; the models predict similar results with surface thicknesses greater than about 2.5 in. The uniform pressure model consistently underestimates the strains for the underinflated case.
Figure 11 shows that for the overinflated case, the uniform pressure model always overestimates the strain produced. As was discussed previously, the treaded tire produces larger strains than the bald tire for all surface thicknesses. In addition, the most significant difference between the strains pro-
18
Surface Course
Thickness, inches
4 .0
3. 5
3 .0
2.5
2 .0 r\\ ::: ./· L _.
250 300 350 400 450 500 550 600 Critical Strain in Surface Course,
microstrain
·•- Bald7545
·o- Tread7545
·• - Uniform Pressure Model
FIGURE 10 Effect of pressure distribution model (75 psi) on critical tensile strain at the bottom of the surface.
8urtace Course
Thickness, inches
4.0 49
3.5
3 .0
2.5
2.0
1.5
1.0 300 400 500 600 700
Critical Strain in Surface Course , microstra in
·•- Bald 11 045
·O- Tread 11045
·•- Uniform Pressure Model
FIGURE 11 Effect of pressure distribution model ( 110 psi) on critical tensile strain at the bottom of the surface.
duced for the three pressure distribution models occurs for thin surface layers.
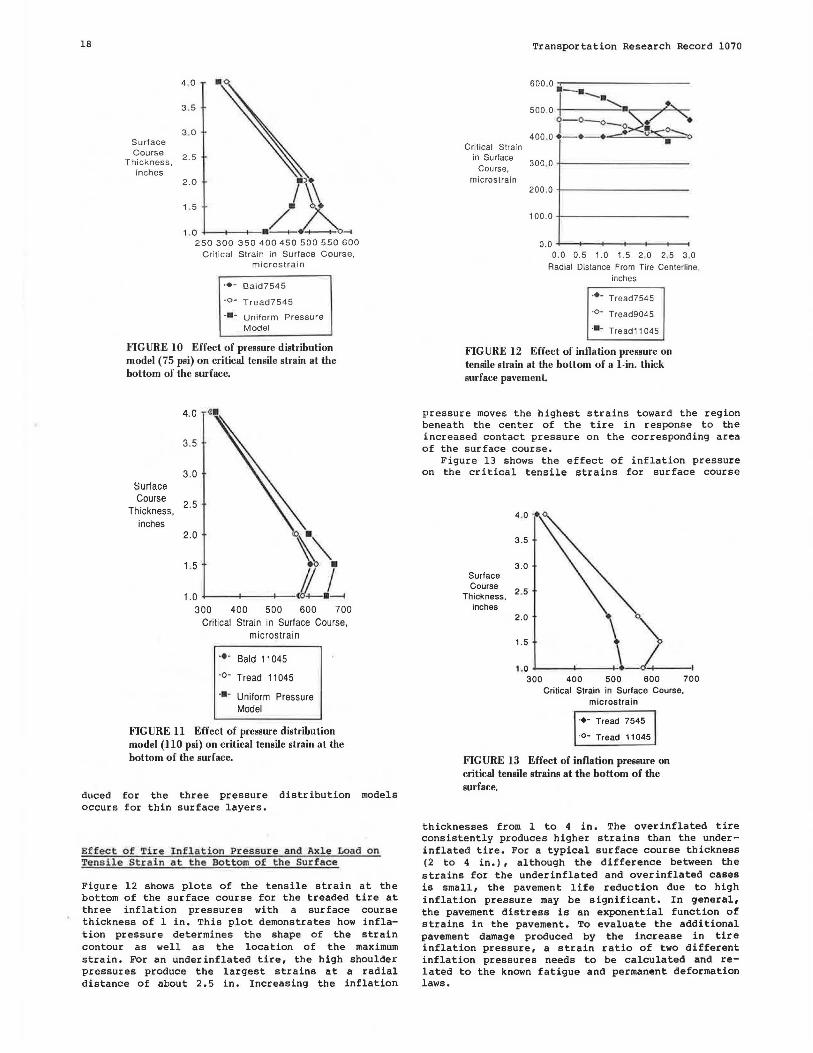
Ef f ec t o f Tire Inflation Pressure and Axle Load on Tens ile Strai n at the Bott om of the Sur f ace
Figure 12 shows plots of the tensile strain at the bottom of the surface course for the treaded tire at three inflation pressures with a surface course thickness of 1 in. This plot demonstrates how inflation pressure determines the shape of the strain contour as well as the location of the maximum strain. For an underinflated tire, the high shoulder pressures produce the largest strains at a radial distance of about 2.5 in. Increasing the inflation
Critical Strain in Surface
Course, micros train
Transportation Research Record 1070
600.0b,? •
500 .0 ~ 0 ~. I --o~~--o ...... ~
400 O - • - • --=• 0 :S::0
...._o . . 300 .0 -!-- ------- --
200 .0+-----------
100 .0+-----------
0.0 ....___,,__ ...... _ _,_ ___ _ _,
0.0 0.5 1.0 1.5 2.0 2.5 3.0 Radial Distance From Tire Centerline,
inches
·•- Tread7545
·0 - Tread9045
·•- Tread11 045
FIGURE 12 Effect of inflation pressure on tensile strain at the bottom of a I -in. thick surface pavement.
pressure moves the highest strains toward the region beneath the center of the tire in response to the increased contact pressure on the corresponding area of the surface course.
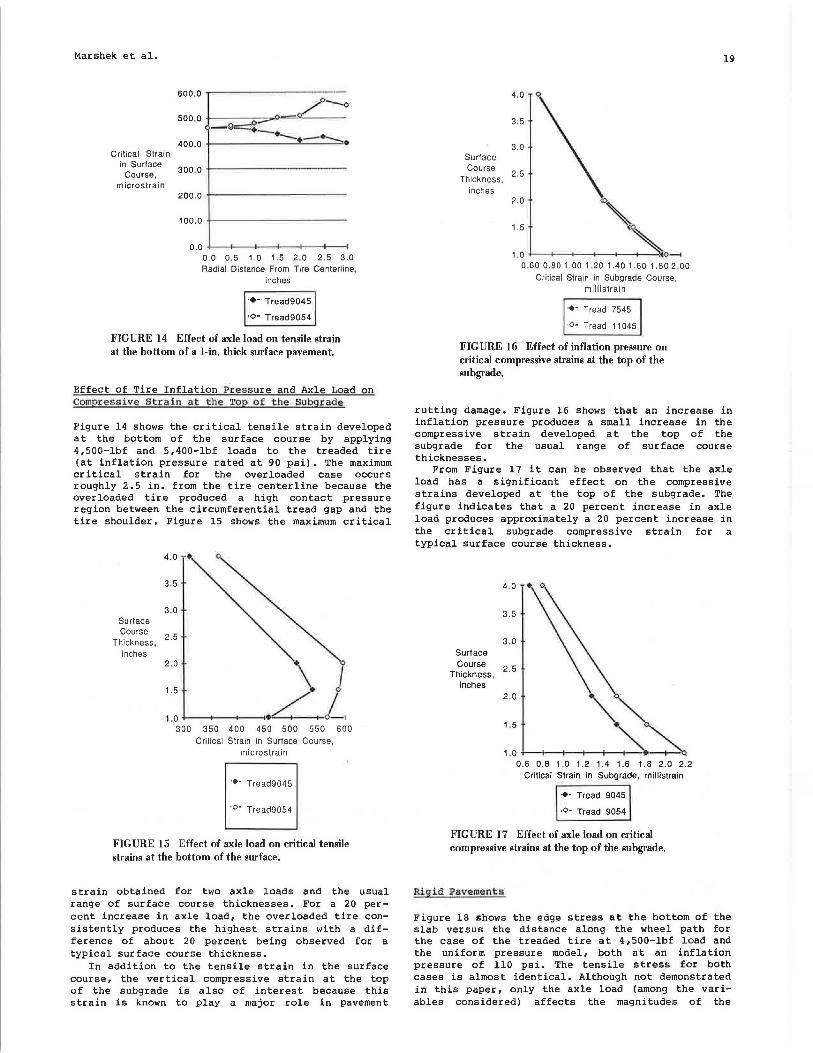
Figure 13 shows the effect of inflation pressure on the critical tensile strains for surface course
3 .5
3.0 Surface Course
2,5 Thickness ,
inches 2.0
1.5
1.0 I
300 400 500 600 700 Critical Strain in Surface Course.
microstrain
·•- Tread 7545
·O- Tread 11045
FIGURE 13 Effect of inflation pressure on critical tensile strains at the bottom of the surface.
thicknesses from 1 to 4 in. The overinflated tire consistently produces higher strains than the underinflated tire. For a typical surface course thickness (2 to 4 in.), although the difference between the strains for the underinflated and overinflated cases is small, the pavement life reduction due to high inflation pressure may be significant. In general, the pavement distress is an exponential function of strains in the pavement. To evaluate the additional pavement damage produced by the increase in tire inflation pressure, a strain ratio of two different inflation pressures needs to be calculated and related to the known fatigue and permanent deformation laws .
Marshek et al.
600.0 ..------------
Critical Strain in Surface Course.
micros train
/-o 500.0 _o- --='------- -<-9-·-· 400.0 .j.----------'·~---·----=""•
300.0 +------------
200.0 .j.------------
100.0 +------------
0.0 +--1---.j.--.j.--1---+----I 0.0 0.5 1.0 1.5 2.0 2.5 3.0 Radial Distance From Tire Centerline,
inches
·•- Tread9045
·O- Tread9054
FIGURE 14 Effect of axle load on tensile strain at the bottom of a 1-in. thick surface pavement.
Effect of Tire Inflation Pressure and Axle Load on Compressive Strain at t .he Top of the Subgrade
Figure 14 shows the critical tensile strain developed at the bottom of the surface course by applying 4 ,500-lbf and 5 ,400-lbf loads to the treaded tire (at inflation pressure rated at 90 psi). The maximum critical strain for the overloaded case occurs roughly 2.5 in. from the tire centerline because the overloaded tire produced a high contact pressure region between the circumferential tread gap and the tire shoulder. Figure 15 shows the maximum critical
3.5
3.0 Surface Course 2.5 Thickness, inches
2.0 ~\ Q
1.5 j /. L. 1.0 •
300 350 400 450 500 550 600 Critical Strain in Surface Course,
micro strain
·•- Tread9045
·O- Tread9054
FIGURE 15 Effect of axle load on critical tensile strains at the bottom of the surface.
strain obtained for two axle loads and the usual range of surface course thicknesses. For a 20 percent increase in axle load, the overloaded tire consistently produces the highest strains with a difference of about 20 percent being observed for a typical surface course thickness.
In addition to the tensile strain in the surface course, the vertical compressive strain at the top of the subgrade is also of interest because this strain is known to play a major role in pavement
Surface Course
Thickness, inches
4.0
3.5
3.0
2.5
2.0
1.5 (0, 1.0 (0~
0_60 0.80 1.00 1.20 1.40 1.60 1.80 2.00 Critical Strain in Subgrade Course,
millistrain
·•- Tread 7545
·O- Tread 11 045
FIGURE 16 Effect of inflation pressure on critical compressive strains at the top of the subgrade.
19
rutting damage. Figure 16 shows that an increase in inflation pressure produces a small increase in the compressive strain developed at the top of the subgrade for the usual range of surface course thicknesses.
From Figure 17 it can be observed that the axle load has a significant effect on the compressive strains developed at the top of the subgrade. The figure indicates that a 20 percent increase in axle load produces approximately a 20 percent increase in the critical subgrade compressive strain for a typical surface course thickness.
3.5
3.0 Surface Course
Thickness, 2·5
inches 2.0
~ : :: ....______, _ _,__~-~-·""'~-'-~
0.6 0.8 1.0 1.2 1.4 1.6 1.8 2.0 2.2 Critical Strain in Subgrade, millistrain
·•- Tread 9045
-O- Tread 9054
FIGURE 17 Effect of axle load on critical compressive strains at the top of the subgrade.
Rigid Pavements
Figure 18 shows the edge stress at the bottom of the slab versus the distance along the wheel path for the case of the treaded tire at 4,500-lbf load and the uniform pressure model, both at an inflation pressure of 110 psi. The tensile stress for both cases is almost identical. Although not demonstrated in this paper, only the axle load (among the variables considered) affects the magnitudes of the
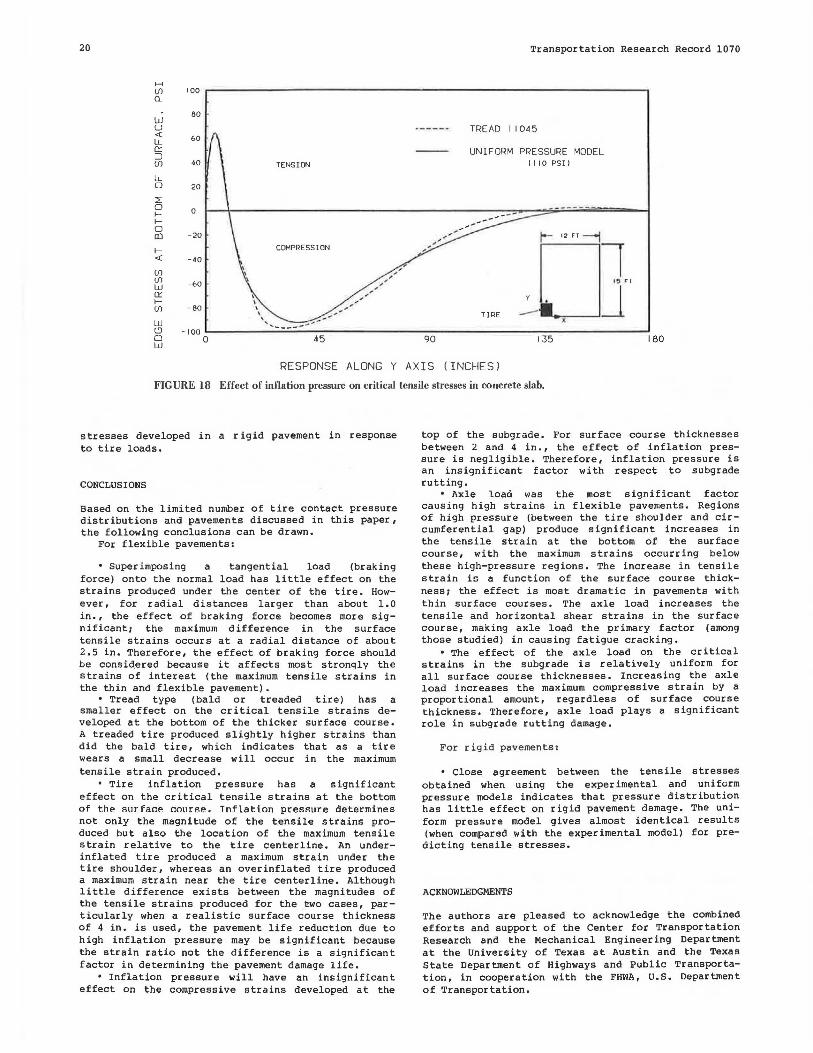
20
H (fJ 100 Q_
80 w u <( 60 LL 0:: ::J (fJ 40
LL 0 20
::;:: 0 0 I-I-0 (I) -20
I-<( -40
(fJ (fJ -60 w 0:: I-(fJ -80
w l.'.) -100 0 0 w
TENSION
COMPRESSION
45 90
Transportation Research Record 1070
TREAD I I 0~5
UNIFORM PRESSURE MODEL 1110 PSI l
12 rr --41
l '' Fl
TIRE -~J 135 180
RESPONSE ALONG Y AXIS (INCHES)
FIG URE 18 Effect of inflation pressure on critical tensile stresses in concrete slab.
stresses developed in a rigid pavement in response to tire loads.
CONCLUSIONS
Based on the limited number of tire contact pressure distributions and pavements discussed in this paper, the following conclusions can be drawn.
For flexible pavements:
• Superimposing a tangential load (braking force) onto the normal load has little effect on the strains produced under the center of the tire. However, for radial distances larger than about 1.0 in., the effect of braking force becomes more significant; the maximum difference in the surface tensile strains occurs at a radial distance of about 2.5 in. Therefore, the effect of braking force should be consid.ered because it affects most stronqly the strains of interest (the maximum tensile strains in the thin and flexible pavement) .
• Tread type (bald or treaded tire) has a smaller effect on the critical tensile strains developed at the bottom of the thicker surface course. A treaded tire produced slightly higher strains than did the bald tire, which indicates that as a tire wears a small decrease will occur in the maximum tensile strain produced.
• Tire inflation pressure has a significant effect on the critical tensile strains at the bottom of the surface course. Tnflatton pressure determines not only the magnitude of the tensile strains produced but also the location of the maximum tensile strain relative to the tire centerline. An underinflated tire produced a maximum strain under the tire shoulde~, whereas an overinflated tire produced a maximum strain near the tire centerline. Although little difference exists between the magnitudes of the tensile strains produced for the two cases, particularly when a realistic surface course thickness of 4 in. is used, the pavement life reduction due to high inflation pressure may be significant because the strain ratio not the difference is a significant factor in determining the pavement damage life.
• Inflation pressure will have an insignificant effect on the compressive strains developed at the
top of the subgrade. For surface course thicknesses between 2 and 4 in., the effect of inflation pressure is negligible. Therefore, inflation pressure is an insignificant factor with respect to subgrade rutting.
• Axle load was the most significant factor causing high strains in flexible pavements. Regions of high pressure (between the tire shoulder and circumferential gap) produce significant increases in the tensile strain at the bottom of the surface course, with the maximum strains occurring below these high-pressure regions. The increase in tensile strain is a function of the surface course thickness; the effect is most dramatic in pavements with thin surface courses. The axle load increases the tensile and her izontal shear strains in the surface course, making axle load the primary factor (among those studied) in causing fatigue cracking.
• The effect of the axle load on the critical strains in the subgrade is relatively uniform for all surface course thicknesses. Increasing the axle load increases the maximum compressive strain by a proportional amount, regardless of surface course thickness. Therefore, axle load plays a significant role in subgrade rutting damage.
For rigid pavements:
• Close agreement between the tensile stresses obtained when using the experimental and uniform pressure models indicates that pressure distribution has little effect on rigid pavement damage. The uniform pressure model gives almost identical results (when compared with the experimental model) for predicting tensile stresses.
ACKNOWLEDGMENTS
The authors are pleased to acknowledge the combined efforts and support of the Center for Transportation Research and the Mechanical Engineering Department at the University of Texas at Austin and the Texas State Department of Highways and Public Transportation, in cooperation with the FHWA, U.S. Department of Transportation.
Transportation Research Record 1070
REFERENCES
1. K.M. Marshek, W.R. Hudson, R.B. Connell, H.H. Chen, and C.L. Saraf. Experimental Investigation of Truck Tire Inflation Pressure on Pavement-Tire Contact Area and Pressure Distribution. Report 386-1. Center for Transportation Research, University of Texas at Austin, Austin, 1985.
2 . s.K. Clark. Mechanics of Pneumatic Tires. Report NBS-Mono-122. Michigan University, Ann Arbor, Nov. 1971, 853 pp.
J . K.M. Marshek, W.R. Hudson, H.H. Chen, C.L. Saraf, and R.B. Connell. Effect of Truck Tire Inflation Pressure and Axle Load on Pavement Performance. Report 386-2F. Center for Transportation Research, University of Texas at Austin, Austin, 1985.
4. BISAR, Computer Program User's Manual. Koninklij ke/Shell-Laboratorium, Amsterdam, The Netherlands, 1972.
5 . E.J. Yoder and M.W. Witczak. Principles of Pave-
21
ment Design. John Wiley and Sons, Inc., New York, 1975.
6. S . D. Tayabji and B.E. Colley. Analysis of Jointed Concrete Pavements. Portland Cement Association, Skokie, Ill., 1981.
7. K. B. Woods (ed . ). Highway Engineering Handbook. McGraw-Hill, New York, 1960.
The contents of this paper reflect the views of the authors, who are responsible for the facts and the accuracy of the data presented herein. The contents do not necessarily reflect the official views or policies of the FHWA. This paper does not constitute a standard, specification, or regulation.
Publication of this paper sponsored by Committee on Strength and Deformation Characteristics of Pavement Sections.
Rigid Bottom Considerations for Nondestructive Evaluation of Pavements
WAHEED UDDIN, A. H. MEYER, and W. RONALD HUDSON
ABSTRACT
Mechanistic analysis of dynamic deflection basins for evaluating in situ moduli of pavement-subgrade systems has become an important part of nondestructive pavement evaluation techniques. Discussed is the influence of a rock layer on the evaluation of in situ moduli by using the multilayered linear elas tic theory. The value of Young's modulus of elasticity of the subgrade overlying a rock layer can be significantly overestimated if a semi-infinite subgrade is assumed in applying the linear elastic layer theory to analyze deflection basins. An algorithm has been developed to correct this type of error for two cases: (a) when the subgrade thickness is known and (b) when depth to the rock layer is unknown. For the Dynaflect and falling weight deflectometer systems, a rigid bottom can be considered for the second case by assigning a subgrade thickness as a function of the wave length of compression wave in the subgrade. The computer programs FPEDDl (for flexible pavements) and RPEDDl (for rigid pavements) incorporate procedures for evaluating in situ moduli with regard to rigid bottom considerations in pavement-subgrade systems.
Nondestructive testing (NDT) is an indispensable part of pavement condition monitoring procedures. Recent surveys (!_,~) indicate that dynamic deflection measuring devices are used by a majority of agencies for nondestructive pavement evaluation.
w. Uddin, Austin Research Engineers, Inc., 2600 Dellana Lane, Austin, Tex. 78746. A.H. Meyer and W.R. Hudson, University of Texas at Austin, Austin, Tex. 78712.
Among these, the Dynaflect is the single most popular and widely accepted NDT device, followed by the Road Rater and falling weight deflectometer (FWD). Several agencies are currently evaluating FWDs because of improvements in their operating character is tics and their ability to apply variable and heavy dynamic loads . These devices use seismic sensors to measure surface deflections when the pavement surface is excited by dynamic loads.
The deflection basins formed by the dynamic deflection measurements from an array of seismic sen-