effect of the bat star asterina miniata (brandt) on recruitment of the giant kelp macrocystis...
TRANSCRIPT
JOURNAL OF EXPERIMENTAL MARINE BIOLOQY AND ECOLOGY
J. Exp. Mar. Biol. Ecol. 179 (1994) 81-98
Effect of the bat star Asterina miniata (Brandt) on recruitment of the giant kelp Macrocystis pyrifera C. Agardh
George H. Leonard*
Moss Landing Marine Laboratories, P.O. Box 450, Moss Landing, CA 95039, USA
(Received 25 May 1993; revision received 22 December 1993; accepted 25 January 1994)
Abstract
The effect of the common bat star, Asterina miniatu (Brandt), on recruitment of the giant kelp, Macrocystis pyriferu C. Agardh, was addressed through laboratory grazing experiments, a field experiment, and modeling of feeding behavior. In the laboratory, Asterina miniutu significantly decreased the density of sporophytes that developed from 1-wk-old gametophytes as well as the percent cover of 2-, 6-, and 7-wk-old sporophytes. All grazed blades remaining at the end of these experiments subsequently died. Small scale variability in spore settlement and sporophyte de- velopment were also evident in the laboratory. Bat star density significantly affected short-term kelp recruitment during a large-scale field experiment. Small scale variability in kelp recruitment and bat star density was also evident during this experiment. Simple modeling suggested that high densities of Asterina miniata could graze nearly 100% of the bottom over the 90-day experiment, However, visible recruitment was seen in less than 30 days, and over this time, 36% of the substratum was predicted to have remained ungrazed. Macrocystis pyrifru of 1 to 3 cm in length may thus obtain a refuge in size from bat star grazing through rapid growth. These results in- dicate this generalist grazer can affect giant kelp recruitment but that even under high grazing pressure numerous plants survive. Bat star grazing probably does not contribute to large-scale differences in adult plant density but may contribute to small-scale patterns of dispersion.
Key words: Giant kelp; Herbivory; Kelp forest; Plant-animal interaction; Sea star; Size refuge
* Current address: Graduate Program in Ecology and Evolutionary Biology, Brown University, Providence, RI 02912, USA
0022-0981/94/$7.00 0 1994 Elsevier Science B.V. All rights reserved
SSDI 0022-0981(94)00021-5
82 G.H. Leonard / J. Exp. Mar. Biol. Ecol. 179 (1994) 81-98
1. Introduction
Kelp forests are extremely productive marine habitats (Chapman, 1974) and support numerous species of fishes, invertebrates and algae. The giant kelp, Macrocystispyrifera (henceforth Macrocystis) is one of the most important algae in kelp forests since it provides nearly all the three dimensional structure of these habitats. As a consequence, the factors that control the recruitment, growth and survival of this seaweed have been
of interest to ecologists for many years. Light (Deysher & Dean, 1984; Reed & Fos- ter, 1984), temperature (Van den Hoek, 1982), nutrients (North & Zimmerman, 1984; Zimmerman & Kremer, 1984) and water motion (Ebeling et al., 1985; Dayton et al., 1992) can affect Macrocystis populations over large temporal and spatial scales (Day- ton, 1985; Schiel & Foster, 1986). On a local scale, variability in hard substrata (Gerard, 1976; Foster, 1982), sedimentation rates (Devinny & Volse, 1978) and wave
exposure (Ebeling et al., 1985; Tegner & Dayton, 1987; Seymour et al., 1989; Dayton et al., 1992) can also affect the distribution of kelp.
Biological factors such as interspecific competition, self thinning and grazing are
thought to affect small scale variability in kelp distribution and abundance while physi- cal factors are believed to be important on larger scales (Dayton et al. 1984). However, with the notable exception of sea urchins (reviews in Leighton, 197 1; Harrold & Pearse,
1987), the effect of grazers on kelp distribution has received less attention than that of physical factors (e.g. Hsiao & Druehl, 1973). Sea urchins can shift from feeding on drift algae to attached plants and this often results in massive decreases in kelp abundance
(Dean et al., 1984). Storms may decrease the abundance of drift algae, inducing this change in sea urchin behavior, and indirectly transforming areas from kelp dominated regions to “barren zones” (Harrold & Reed, 1985).
With the exception of sea urchins, only a few other subtidal kelp grazers have been
examined. Gastropods (Schiel, 1981; Watanabe, 1983), isopods (North, 1964; Barrales & Lobban, 1975), and some fishes (North, 1976) can all have varying effects on kelp abundance. Herbivorous fishes in southern California (Harris et al., 1984) greatly af- fect Macrocystis abundance but are rare in central California kelp forests (Schiel & Foster, 1986; pers. obs.).
However, in central California, the common bat star, Asterina miniata (Brandt) (henceforth Asterina), may be an important agent of juvenile kelp mortality. It can be
both abundant and pachily distributed (Araki, 1964; Gerard, 1976; Schiel & Foster, 1986) and exhibits a unique feeding behavior. Asterina is an omnivore and feeds on carrion and drift algae (Gerard, 1976) by everting its cardiac stomach over its food. Digestion therefore occurs externally. Bat stars often evert their stomachs on bare rock or encrusting coralline algae where no visible food is present. Araki (1964) hypothesized that in these cases Asterina may obtain nutrition from bacteria, detritus, algal spores and dissolved organic carbon. Asterina’s digestive enzymes break down cellulose, the
main constituent of plant cell walls (Araki, 1964). Feeding bat stars often produce bleached spots on encrusting coralline and drift algae indicating that degradation of photosynthetic pigments and damage to plant cell walls has occurred.
Several authors have proposed that bat stars may have community-wide effects because of these characteristics (Schiel & Foster, 1986; Harrold & Pearse, 1987). Past
G.H. Leonard / .I. Exp. Mar. Biol. Ecol. 179 (1994) 81-98 83
studies have shown that bat star grazing may kill gametophytes or young sporophytes
of some plants (Dayton et al., 1984; Breitburg 1985) and reproductive propagules of
some benthic invertebrates (Foster 1975; Day & Osman 1981). Grazing on microscopic stages of algae by invertebrates is probably common in intertidal and subtidal habitats (Jones, 1946; Breen & Mann, 1976; Chapman, 1981, 1984; Bertness et al., 1983) but this idea has rarely been tested.
The purpose of this study was to determine if Asterina miniata contributes to small scale variability in giant kelp recruitment and whether this effect potentially affects kelp population dynamics. Laboratory experiments were used to determine if grazing killed
kelp gametophytes and young sporophytes. A large-scale bat star removal and addi- tion study determined if Asterina grazing affected giant kelp recruitment success in the field. Modeling of movement and feeding behavior was used to calculate the potential
affect of Asterina grazing on Mucrocystis populations and compare this potential with results from the field study. These three approaches provided a detailed examination of Asterina’s potential to affect kelp recruitment.
2. Methods and materials
2.1. Laboratory grazing experiments
Grazing experiments were done at the Monterey Bay Aquarium from July 1991 through January 1992. Mucrocystis spores were allowed to settle onto glass microscope slides or roughened plastic plates (5 x 9 cm) using the techniques of Reed et al. (1991).
To encourage spore release, sporophylls were subjected to a 30-s salinity shock in distilled water followed by 2 h in the dark at 5 “C. This treatment had no effect on the viability of spores. The resultant spore solution was diluted to 5 x lo3 cells. ml-’ with 0.45~pm sterile filtered seawater. Substrata were covered to a depth of z 2 cm with this solution and spores allowed to settle in the dark at 15 “C for 24 h. This resulted in ~40
to 50 spores. mm -2. After 24 h, cultures were transferred to sterile seawater enriched
with PES growth medium (Provosoli, 1968) and were grown in the incubator at 15 “C under 20 to 25 PE. rne2. s-l light on a cycle of 12 h light and 12 h dark. Aeration from a small aquarium pump provided water circulation. Growth media were changed bi- weekly. Germanium dioxide, to retard diatom growth (2 ml *l-t medium of 250 mg . 1-l stock), and antibiotics, to retard bacterial growth (1 ml. 1-t medium of 100 g. 1-l penicillin and 50 g * 1-l streptomycin stock), were used sparingly and only as necessary.
Four experiments were done to test the susceptibility of gametophytes and sporo- phytes to Asterina grazing. Gametophytes were subjected to grazing after 1 wk of growth and sporophytes after 2, 6 and 7 wk of growth. One-wk-old gametophytes and 2-wk-old sporophytes were grown on slides and 6- and 7-wk-old sporophytes were
grown on roughened plastic plates. Two experimental tanks (with bat stars) and two control tanks (without bat stars)
were used. They measured 55 x 85 cm and were filled to a depth of 15 cm. This shal- low depth minimized the bat stars’ tendency to climb up the tank walls. Tanks were lit from above with “cool white” fluorescent fixtures on a cycle of 12 h light and 12 h
84 G.H. Leonard 1 J. hp. Mar. Biol. Ecof. I79 (1994) 81-98
dark. Light levels averaged 25 PE * rn-*. SC’. This supported the growth of Macrocystis but retarded growth of benthic diatoms. Sand-filtered seawater entered tanks at ~4 I.min-‘, resulting in a theoretical residence time of less than 20 min. Twenty Asterina were starved for I wk to standardize hunger levels and then 10 were added to each of the experimental tanks. An average of 4 to 5 bat stars remained on the bottom of each tank. These densities approximated those found in the field. Experimental substrata were added to the tanks ~2 h later.
Four slides were used in each tank for experiments on I-wk-old gametophytes and 2-wk-old sporophytes, and three plates were used in each tank for experiments on 6- and 7-wk-old sporophytes. Allocation of treatments, replicates and slides was random in all experiments. This resulted in a fully nested design with two levels of a single factor ( + grazing), two replicates of each treatment and three or four replicate substrata nested within each tank.
Grazing experiments were run for 1 wk. Because Asterina often ignored the slides under these laboratory conditions, this mount of time ensured they grazed the sub- strata. In the laboratory, gametophytes become reproductive at 1 wk and fertilization and initial sporophyte development occur during the next week. Therefore, after the 1-wk experiment, the density of sporophytes that had developed from the 1-wk-old gametophytes was determined under 200 x ma~i~cation. For the 2-wk-old sporo- phytes, the density of blades was determined under 100 x magnification. Percent cover on the 6- and 7-wk-old sporophyte plates was measured using a 100 point grid under 20 x magnification because blade density was too high to count. Nested analysis of variance was used to examine the effect of treatment, tanks and slides after the as- sumption of homogeneity of variances was tested. Data usually had to be transformed using Taylor’s power law (Elliot, 1971) or the t/(.x + 0.5) transformation to meet this assumption.
After preliminary counts, experimental substrata were returned to the incubator for growth under ideal light and nutrient conditions. This allowed estimation of plant re- covery and survival after Asterina grazing. After 1 additional wk, haphazardly chosen substrata were examined under a microscope for signs of healthy sporophytes. Because no blades survived (see Results), percent survival was estimated without using a quan- titative technique.
After all grazing experiments were concluded, it was thought that bat star exudate might have contributed to Macrocyst~s mortality even without direct grazing on the substrata. This was tested in a final experiment on 2-wk-old sporophytes. The four tanks were divided with plastic mesh (mesh size = 2 x 2 cm) and four slides were placed on each side of the partition. This allowed free exchange of seawater but denied bat stars access to half the slides.
2.2. Field experiment
The field study was done from March 12 to June 12, 1992 in Stillwater Cove, Car- me1 Bay, California [35”, 34’N, 121’, 56’W; see Reed & Foster (1984) for detailed site description]. Three separate reefs, between 10 and 17 m depth, were chosen that supported growth of Macrocystis and Pterygophora caljbmica (Ruprecht). Each reef was
G.H. Leonard/J. Exp. Mar. Biol. Ecol. 179 (1994) 81-98 85
cleared of these algae to encourage kelp recruitment. Macrocystis was also cleared along a 4-m band outside the reefs to prevent shading by plants at the edges. A healthy
population of Macrocystis surrounded all three reefs throughout the experiment. One replicate of each of three treatments (control, bat star removal, and bat star addition) was established on each of the three reefs. The order of these contiguous treatments along each reef was intentionally different to reduce any potential influence of one treatment on another. The sizes of experimental plots ranged from 45 to 104 m2 [mean = 71 + 6 (SE) m2, n = 91.
Asterina were removed from three plots and added to three plots biweekly. The number of bat stars that re-entered removal plots was recorded. At each manipulation, several hundred bat stars were added to addition sites such that densities were in- creased from l-3 individuals . m -’ above initial densities. Bat stars were evenly spread to minimize agonism (Wobber, 1975) due to crowding. Throughout the experiment, a total of 35 bat stars. mm2 were added to each of the addition plots.
After 90 days, the number of juvenile Mucrocystis plants, small brown blades (ex- cluding identifiable juvenile Pterygophora californica) and Asterina were counted in each plot using 21, 1-m’ quadrats. Approximately 30% of a plot was sampled with this
number of quadrats. Recruitment of Pterygophora californica was much lower than Mucrocystis and therefore it was not evaluated. Depth was also recorded for each quadrat. Quadrats were located using random compass bearings and distances, avoid- ing the edges of the plots.
Data were analyzed using a single factor, nested analysis of variance. Plot was nested within treatment effects. The assumption of homogeneity of variances for algal recruits, bat star density and depth was tested using Cochran’s test (Winer, 1971) and data were
retested after transformations were performed. Power analysis was used to determine the likelihood of correctly rejecting a false null hypothesis when the analysis of vari- ance was non-significant (Cohen, 1988).
2.3. Movement and feeding behavior
Movement and feeding behavior of Asterina were examined to determine the num- ber of locations on which a bat star feeds in a 24-h period. This information was used in the grazing probability model (see below). A technique similar to that of Scheibling
(1980, 1981) was employed. At the end of the field experiment, all macroalgae were cleared from an addition and control plot on the same reef. Bat star densities were again manipulated biweekly. These conditions presumably simulated those that existed dur- ing the first month of the previous experiment. Bat stars were monitored at both a control and addition plot to determine if manipulation of bat stars decreased feeding rates or increased their movement rates.
Asterina behavior was monitored on 3 days and 2 nights from July 30 to Septem-
ber 13, 1992. On each date, seven bat stars in each plot were gently labeled with a grease pencil and their locations (to the nearest cm) were determined using an x,y coordinate system. Sea star positions were determined every 2 h beginning at 0800 (day) and 1800 (night). Day sampling ended at 1800. Night sampling ended at 0600. Bat stars were never monitored from 0600 to 0800.
86 G.H. Leonard 1 J. Exp. Mar. Biol. Ecol. 179 (1994) 81-98
Feeding status (eversion of the cardiac stomach) was determined at each observa-
tion by gently tugging on each bat star. Stomach eversion is associated with strong
attachment to the bottom and this can be easily sensed. The average number of dif- ferent “feeding spots” (locations at which a bat star fed) was determined for each replicate day and night period by averaging those of the seven bat stars within each plot at each period. The mean number during the day and night was the average across the 3-day and 2-night periods, respectively. The number of different feeding spots during
a 24 hr period was simply the sum of those averages during each period. Distance traveled during the 2-h time periods was determined using the x,y coordi-
nates from the control and addition plots. Distance was calculated, assuming travel in a straight line, by using the equation D = (Ax2 + Ay2)‘j2 where Ax = xt - xtm , and Ay = y, - y, _ i. Average distance moved was calculated using the same method used for the number of feeding spots. Bat stars that did not move during a period (distance = 0.0 cm) were not included in this calculation. The percentage of individuals that moved
between periods and the average time spent on a feeding spot were also determined from these data. Number of feeding spots, time on a spot, and distance moved all suffer from lack of independence (replicate measurements on the same individual). Therefore, no inferential statistics were applied to these data.
It was unlikely that the marking technique or method of determining feeding status greatly altered bat star behavior. If it did, distance moved would be expected to decrease throughout the day and night sampling periods. Although it did decrease during the day (see Results) distance moved during the night remained constant throughout.
The ability of the handling technique to correctly determine bat star feeding status was tested on a group of randomly chosen animals (n = 175, 70.3% feeding). For each organism, its feeding status was estimated by the tugging method and then confirmed by turning the organism over and viewing its oral surface. Feeding status was correctly determined on 91.4% of the bat stars.
2.4. Grazing probability model
A simple, theoretical model of Asterina grazing, similar to that of Scheibling (1980) was used to interpret results of the field experiment. The model calculated the prob- ability that an area the size of a feeding spot would not be grazed in 1 day and then the geometric probability distribution was used to determine the probability that that area would remain ungrazed over an additional number of days. This model assumed that movement and feeding behavior occurred randomly (as plots of the bat star po- sitions indicated; data not shown). The equation used was P(ungrazed) = [ 1 - (p . A/
B)]’ where p = the density of bat stars (# . mm2), A = the number of different feeding spots. bat star-’ * day-‘, B = the number of feeding spots in a l-m2 quadrat, and t = time (days).
The densities of bat stars used in this model were those maintained during the field experiment (range = 0.3 - 5.7 . m -2) as well as two greater, hypothetical densities (9 and 18 . mm2). The number of different feeding spots * bat star -’ . day-’ was that calculated in the movement and feeding behavior study. Total number of feeding spots was the area of a l-m2 quadrat (in mm2) divided by the area of a feeding spot (in mm2). The
G.H. Leonard 1 J. Exp. Mar. Biol. Ecol. 179 (1994) 81-98 81
area of a feeding spot was assumed to be the area of a circle (n?), with “9’ the radius
of the everted stomach. The sizes of everted stomachs of all feeding Asterina were
measured in 27, 6-m2 quadrats, located throughout Stillwater Cove. The size at which Macrocystis was no longer susceptible to bat star grazing was examined by varying time in the model and comparing this with the size of plants seen in the field over the same time period. The time spent on a feeding spot was not directly incorporated in this model but it did correspond to that over which mortality occurred in the laboratory (see Results).
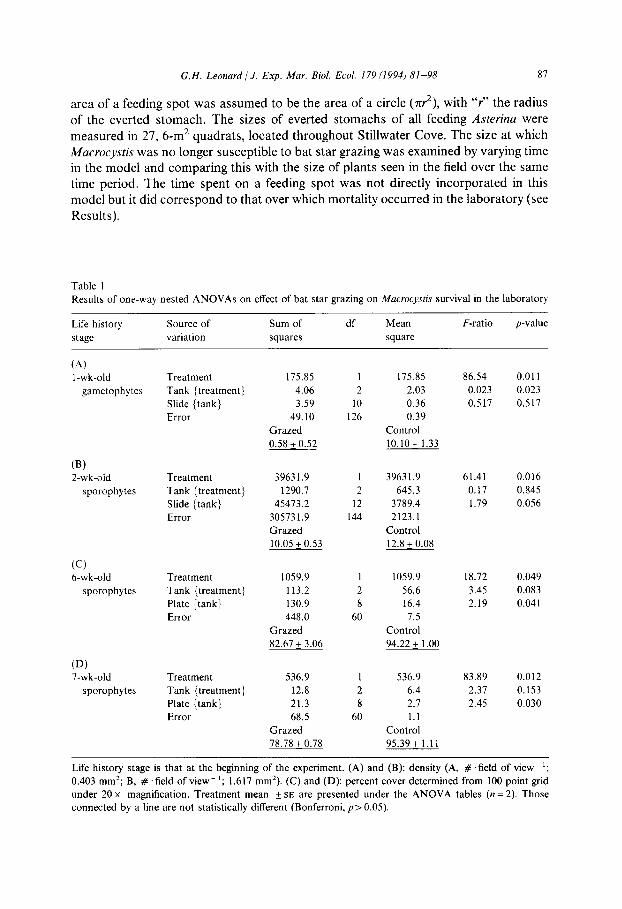
Table 1
Results of one-way nested ANOVAs on effect of bat star grazing on Macrocysh survival in the laboratory
Life history Source of Sum of
stage variation squares
(A) 1-wk-old
gametophytes
(B) 2-wk-old
sporophytes
(Cl 6-wk-old
sporophytes
CD) 7-wk-old
sporophytes
-
Treatment
Tank {treatment}
Slide {tank}
Error
Treatment
Tank {treatment}
Slide {tank}
Error
Treatment
Tank {treatment}
Plate {tank}
Error
Treatment
Tank {treatment}
Plate {tank}
Error
df Mean
square
F-ratio p-value
175.85
4.06
3.59
49.10
Grazed
0.58 + 0.52
39631.9
1290.7
45413.2
305731.9
Grazed
10.05 + 0.53
1059.9
113.2
130.9
448.0
Grazed
82.67 + 3.06
536.9
12.8
21.3
68.5
Grazed
78.78 + 0.78
1
2
10
126
I
2
I2
144
1
2
8
60
I
2
8
60
175.85
2.03
0.36
0.39
Control
10.10 + 1.33
3963 I .9
645.3
3789.4
2123.1
Control
12.8 + 0.08
1059.9
56.6
16.4
7.5
Control
94.22 f 1.00
536.9
6.4
2.7
1.1
Control
95.39+ 1.11
86.54 0.011
0.023 0.023
0.517 0.517
61.41 0.016
0.17 0.845
1.79 0.056
18.72
3.45
2.19
83.89
2.31
2.45
0.049
0.083
0.041
0.012
0.153
0.030
Life history stage is that at the beginning of the experiment. (A) and (B): density (A, # . field of view ‘;
0.403 mm*; B, # ‘field of view- t; 1.617 mm’). (C) and (D): percent cover determined from 100 point grid under 20 x magnification. Treatment mean f SE are presented under the ANOVA tables (n = 2). Those
connected by a line are not statistically different (Bonferroni, p> 0.05).
88
3. Results
G.H. Leonard j J. Exp. Mar. Biol. Ecol. I79 (1994) 81-98
3. I. Laboratory grazing experiments
The density and percent cover of Macrocystis gametophytes and sporophytes de- creased significantly when subjected to Asterina grazing in the laboratory (Table 1). Bat star grazing si~ifi~antly decreased the number of sporophytes that developed from 1-wk-old gametophytes (Table la). Presence of gametophytes on the experimental slides at the end of the experiment suggested Aster&a grazing inhibited fertilization or development of the female gametophytes. Grazing also significantly decreased the density of 2-wk-old sporophytes (Table lb) mainly by removal of plants during feed- ing. Similarly, percent cover of 6- and 7-wk-old sporophytes was significantly decreased by grazing (Table lc,d). Decreases in percent cover of these older sporophytes, although significant, were not large. Changes appeared to be due to shrinkage and damage to the thallus.
In these experiments, there were always significant nested factors. In three of the four experiments, slide{tank} was significant while tank {treatment} was not (Table 1 b-d). Unlike the other experiments, those on 1-wk-old gametophytes showed significant tank (treatment} but insignificant slide (tank) effects.
Grazed sporophytes were visibly different from the control blades. Two-, 6- and 7-wk-old sporophytes were highly bleached (yellowish-green) and had lost much of the characteristic light brown of laminarian sporophytes. Cytoplasm and photosynthetic pigments had coalesced as dark clumps in the center of the cells. These grazing effects, however, were localized. In a rare instance when only part of a slide was grazed, the grazed/ungrazed border was very abrupt. The distal ends of blades at this border ap- peared normal while the basal portions were heavily bleached.
There was no post-grazing recovery of any ~acrocystis blades when returned to the incubator. In all cases, percent mortality on control substrata was x07;, while on grazed substrata it was x 100% (few blades were ever seen). Although algal tissue was still present at the end of the experiments, it was clearly dead.
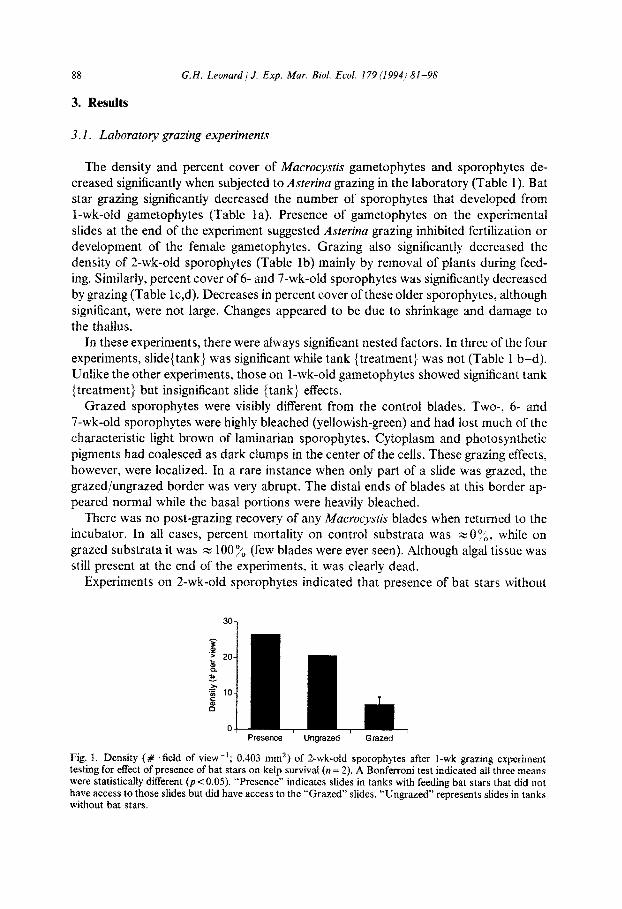
Experiments on 2-wk-old sporophytes indicated that presence of bat stars without
Presence Ungrazed Grazed
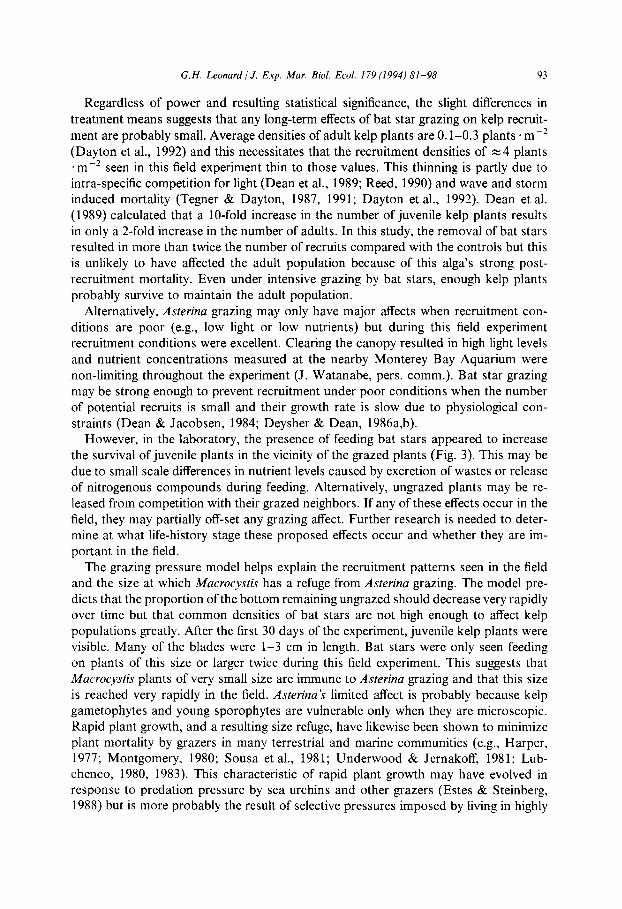
Fig. 1. Density (# .field of view-‘; 0.403 mm’) of Z-wk-old sporophytes after I-wk grazing experiment testing for effect of presence of bat stars on kelp survival (n = 2). A Bonferroni test indicated all three means were statistically different (pi: 0.05). “Presence” indicates slides in tanks with feeding bat stars that did not have access to those slides but did have access to the “Grazed” slides. “Ungrazed” represents slides in tanks without bat stars.
G.H. Leonard/J. Exp. Mar. Biol. Ecot. 119 (1994) 81-98 89
grazing did not negatively affect algal density but, surprisingly, increased the density of sporophytes (F2,3 = 63.2, p = 0.004; Fig. 1). As with the other laboratory experiments, there was a significant slide (tank} (F12,162 = 5.52, p< 0.001) and insignificant tank (treatment) effect (Fs,t2 = 0.52, p = 0.679).
3.2. Field experiment
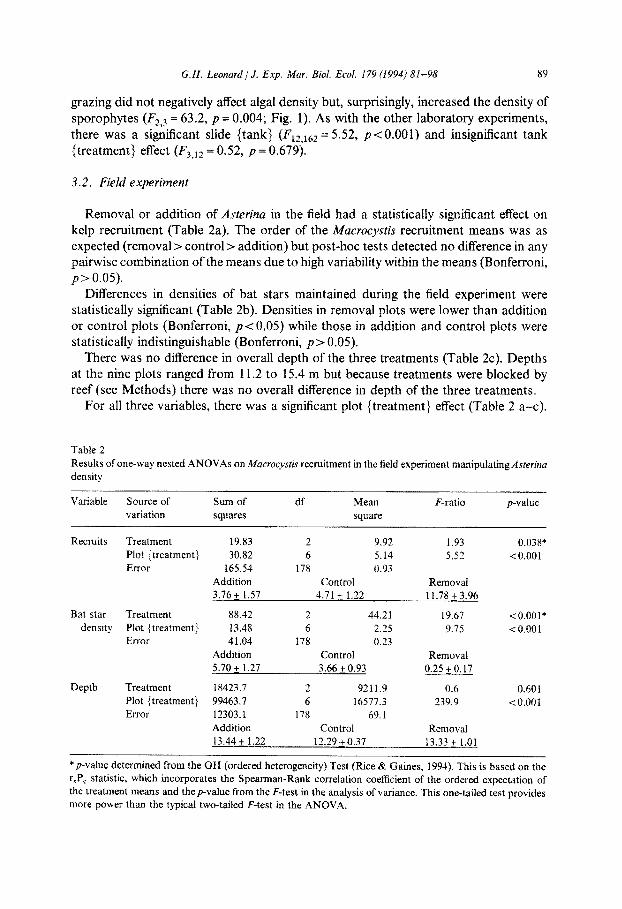
Removal or addition of Aster-ha in the field had a statistically significant effect on kelp recruitment (Table 2a). The order of the Macrocystis recruitment means was as expected (removal > control > addition) but post-hoc tests detected no difference in any pairwise combination of the means due to high v~iability within the means (Bonferroni, p > 0.05).
Differences in densities of bat stars maintained during the field experiment were statistically significant (Table 2b). Densities in removal plots were lower than addition or control plots ~Bonferroni, p-~O,05) whiie those in addition and control plots were statistically indistinguishable (Bonferroni, p> 0.05).
There was no difference in overall depth of the three treatments (Table 2~). Depths at the nine plots ranged from 11.2 to 15.4 m but because treatments were blocked by reef (see methods) there was no overall difference in depth of the three treatments.
For all three variables, there was a significant plot {treatment} effect (Table 2 a-c).
Table 2
Results of one-way nested ANOVAs on iwacrocysris recruitment in the field experiment manipuiating Asrerinu density
Variable Source of
variation
Sum of
squares
df Mean
square
F-ratio pvalue
Recruits Treatment 19.83 2 9.92 1.93 0.038*
Plot {treatment} 30.82 6 5.14 5.52 <O.OOl
Error 165.54 178 0.93
Addition Control Removal
3.76 + 1.57 4.71+ 1.22 11.78 + 3.96
Bat star Treatment 88.42 2 44.21 19.67 < 0.001*
density Plot {treatments 13.48 6 2.25 9.75 <O.OOl
Error 41.04 178 0.23
Addition Control Removal
5.70 + 1.27 3.66 + 0.93 0.25 + 0.17
Depth Treatment 18423.7 2 9211.9 0.6 0.601
Plot (treatment] 99463.7 6 16577.3 239.9 io.001
Error 12303.1 178 69.1
Addition Control Removal
13.44 + 1.22 12.29 + 0.37 13.33 + 1.01
*p-value determined from the OH (ordered heterogeneity) Test (Rice & Gaines, 1994). This is based on the
rrPc statistic, which incorporates the Spearman-Rank correlation coefficient of the ordered expectation of
the treatment means and the F-value from the F-test in the analysis of variance. This one-tailed test provides
more power than the typical two-tailed F-test in the ANOVA.
90 G.H. Leonard 1 J. Exp. Mar. Biol. Ecol. 179 (1994) 81-98
Variability in kelp recruitment, bat star density and depth could be detected on a small
scale that was not related to overall treatment effects. Much of this variability was
attributable to Reef 3. The removal and addition plots on this reef were at the great-
est depths of the nine plots, while the control plot was at intermediate depth. The re- moval and addition plots on Reef 3 also had the lowest initial density of Ascerina. Bat stars added to the addition plot also rapidly fled. There was a linear relationship be- tween the number added to the addition plot and the number found entering the ad- jacent removal plot at the time of the next manipulation (2 = 0.499, p = 0.001; n = 19).
No such relationship occurred for the other two reefs. Consequently, the number of recruits at the removal plot and density of bat stars at the addition plot were low on Reef 3.
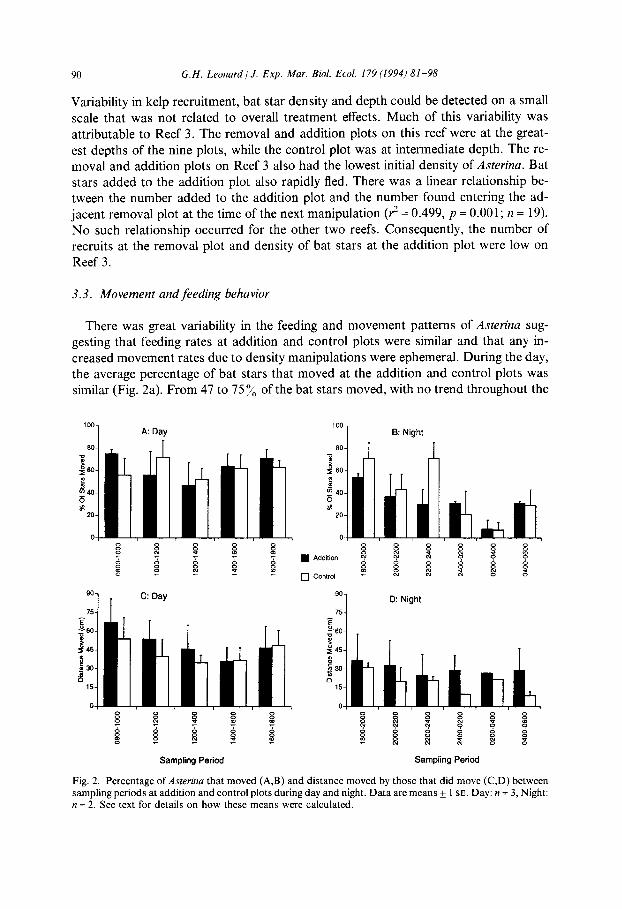
3.3. Movement and feeding behavior
There was great variability in the feeding and movement patterns of Asterina sug- gesting that feeding rates at addition and control plots were similar and that any in-
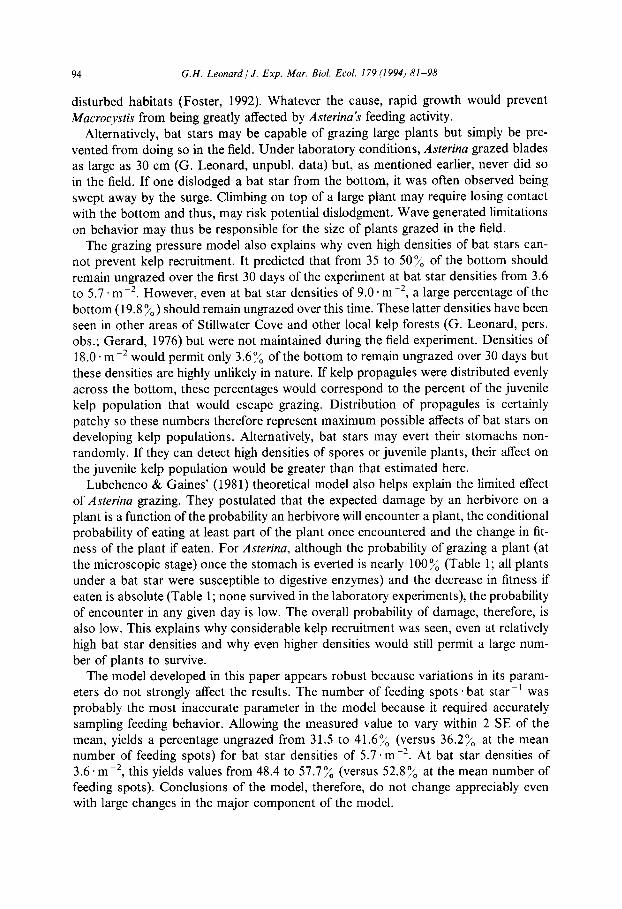
creased movement rates due to density manipulations were ephemeral. During the day, the average percentage of bat stars that moved at the addition and control plots was similar (Fig. 2a). From 47 to 75 y0 of the bat stars moved, with no trend throughout the
A: Day 100 1 B: Night
Fig. 2. Percentage of Asterina that moved (A,B) and distance moved by those that did move (C,D) between sampling periods at addition and control plots during day and night. Data are means k 1 SE. Day: n = 3, Night: n = 2. See text for details on how these means were calculated.
G.H. Leonard/J. Exp. Mar. Biol. Ecol. 179 (1994) 81-98 91
Table 3
Measured and calculated parameters used in the grazing probability model as detailed in the text
Parameter Mean + 1 SE n
Density of Asterina ( # m- *)
(1) Addition
(2) Control
(3) Removal
(4) Hypothetical 1
(5) Hypothetical 2
Stomach radius (mm)
Effective area (mm’)
Feeding spots during day (#)
Feeding spots during night (#)
Feeding spots during 24 h (#)
Time (days)
5.7 f 1.3
3.7* 1.0
0.3 + 0.2 9.0
18.0
18.2 f 0.9
1235.5 k 105.7
2.28 f 0.12
2.45 f 0.20
4.73 f 0.32
Range: l-90
3
3
3
27
27
3
2
2
II = sample size.
day. This indicated marking and handling did not significantly alter the behavior of bat stars during the movement study. Variability in the average percentage of bat stars that
moved was greater during the night than the day (7-7 1 %), but there was no clear trend between addition and control plots. In general, it appeared that the percentage that moved was less during the night than the day and that this percentage decreased
throughout the night until the early morning hours (Fig. 2b). Asterina moved an average of 9 to 67 cm * 2 h-’ period (Fig. 2c,d). In general, this
distance was less at night. The distance moved was usually (9 of 11 periods) less in the control than in the addition plots. The distance moved during the night remained low and relatively constant throughout.
There was little variability in average number of feeding spots . bat star-’ during the day or night in control or addition plots (mean k 1 SE, Day: Addition = 2.33 k 0.15, Control = 2.20 + 0.23; Night: Addition = 2.30 + 0.10, Control = 2.60 k 0.5). Across both treatments, bat stars were found on an average 2.3 spots during the day and 2.5 spots during the night (Table 3). The overall average was 4.73 feeding spots. day-’ (Table 3). Time spent on a feeding spot in the field was 4.12 k 0.9 h (mean k 1 SE;
n = 5). Lack of video equipment prevented determination of time spent feeding on a slide in the laboratory. However, intermittent observations made during the experiments suggested that mortality in the laboratory occurred over a 4-6-h period as well.
3.4. Grazing probability model
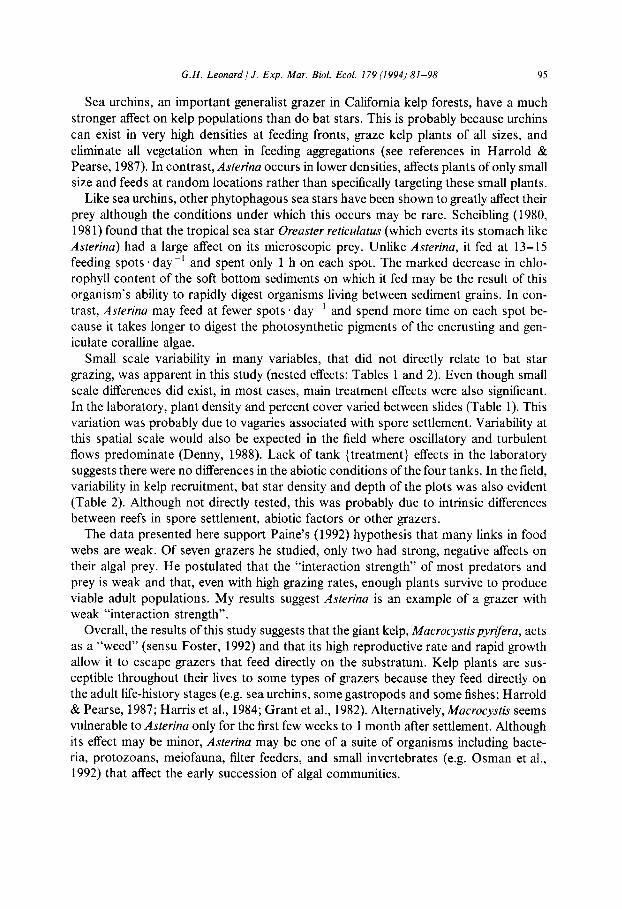
The model indicated that the probability a feeding spot would remain ungrazed in 1 day ranged from 99.8 to 99.5% for bat star densities from 0.3 to 18.0 .rn-* (Fig. 3). Similarly, this corresponds to 99.8 to 99.5% of the bottom remaining ungrazed over the same time period. This value decreased exponentially with time, most rapidly during the first 30 days. The model also predicted that during the 90-day experiment,
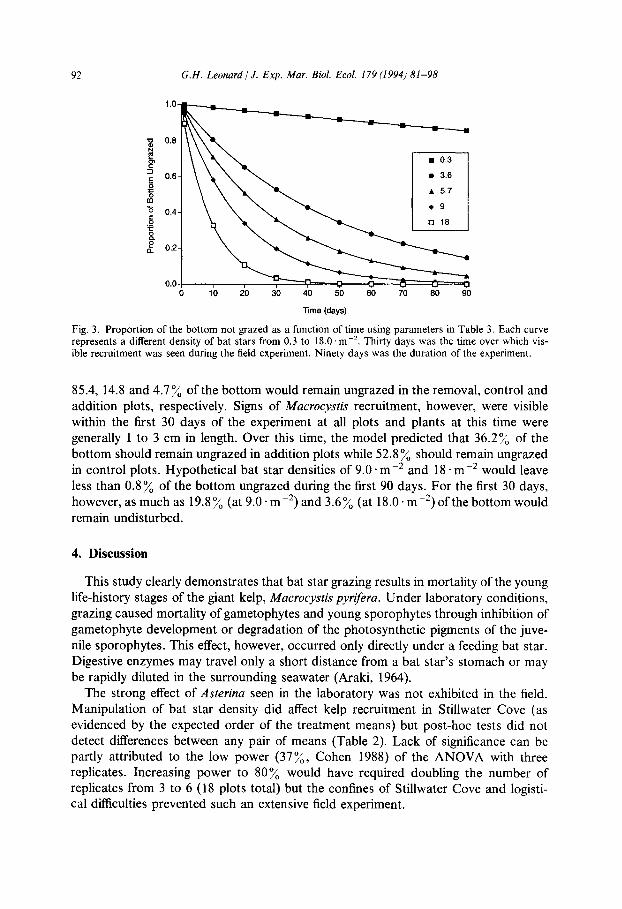
92 G.H. Leonard / J. Exp. Mar. Biol. Ecol. I79 (1994) 81-98
0.0
0 10 20 30 40 50 60 70 60 90
Time (days)
Fig. 3. Proportion of the bottom not grazed as a function of time using parameters in Table 3. Each curve represents a different density of bat stars from 0.3 to 18.0. m -‘. Thirty days was the time over which vis- ible recruitment was seen during the field experiment. Ninety days was the duration of the experiment.
85.4, 14.8 and 4.7% of the bottom would remain ungrazed in the removal, control and addition plots, respectively. Signs of Mucroc,v~tis recruitment, however, were visible within the first 30 days of the experiment at all plots and plants at this time were generally 1 to 3 cm in length. Over this time, the model predicted that 36.2% of the bottom should remain ungrazed in addition plots while 52.8% should remain ungrazed in control plots. Hypothetical bat star densities of 9.0 * me2 and 18 em-* would leave less than 0.8% of the bottom ungrazed during the first 90 days. For the first 30 days, however, as much as 19.8% (at 9.0 * mm2) and 3.6% (at 18.0. mm2) of the bottom would remain undisturbed.
4. Discussion
This study clearly demonstrates that bat star grazing results in mortality of the young life-history stages of the giant kelp, Mucrocystis pyriferu. Under laboratory conditions, grazing caused mortality of gametophytes and young sporophytes through inhibition of gametophyte development or degradation of the photosynthetic pigments of the juve- nile sporophytes. This effect, however, occurred only directly under a feeding bat star. Digestive enzymes may travel only a short distance from a bat star’s stomach or may be rapidly diluted in the surrounding seawater (Araki, 1964).
The strong effect of Asterina seen in the laboratory was not exhibited in the field. Manipulation of bat star density did affect kelp recruitment in Stillwater Cove (as evidenced by the expected order of the treatment means) but post-hoc tests did not detect differences between any pair of means (Table 2). Lack of significance can be partly attributed to the low power (37%, Cohen 1988) of the ANOVA with three replicates. Increasing power to 80% would have required doubling the number of replicates from 3 to 6 (18 plots total) but the confines of Stillwater Cove and logisti- cal difficulties prevented such an extensive field experiment.
G.H. Leonard/J. Exp. Mar. Biol. Ecol. 179 (1994) 81-98 93
Regardless of power and resulting statistical significance, the slight differences in
treatment means suggests that any long-term effects of bat star grazing on kelp recruit-
ment are probably small. Average densities of adult kelp plants are 0.1-0.3 plants. mm2
(Dayton et al., 1992) and this necessitates that the recruitment densities of ~4 plants .m-2 seen in this field experiment thin to those values. This thinning is partly due to intra-specific competition for light (Dean et al., 1989; Reed, 1990) and wave and storm induced mortality (Tegner & Dayton, 1987, 1991; Dayton et al., 1992). Dean et al. (1989) calculated that a lo-fold increase in the number of juvenile kelp plants results in only a 2-fold increase in the number of adults. In this study, the removal of bat stars resulted in more than twice the number of recruits compared with the controls but this
is unlikely to have affected the adult population because of this alga’s strong post- recruitment mortality. Even under intensive grazing by bat stars, enough kelp plants probably survive to maintain the adult population.
Alternatively, Aster-ha grazing may only have major affects when recruitment con-
ditions are poor (e.g., low light or low nutrients) but during this field experiment recruitment conditions were excellent. Clearing the canopy resulted in high light levels and nutrient concentrations measured at the nearby Monterey Bay Aquarium were non-limiting throughout the experiment (J. Watanabe, pers. comm.). Bat star grazing may be strong enough to prevent recruitment under poor conditions when the number of potential recruits is small and their growth rate is slow due to physiological con-
straints (Dean & Jacobsen, 1984; Deysher & Dean, 1986a,b). However, in the laboratory, the presence of feeding bat stars appeared to increase
the survival of juvenile plants in the vicinity of the grazed plants (Fig. 3). This may be
due to small scale differences in nutrient levels caused by excretion of wastes or release of nitrogenous compounds during feeding. Alternatively, ungrazed plants may be re- leased from competition with their grazed neighbors. If any of these effects occur in the field, they may partially off-set any grazing affect. Further research is needed to deter- mine at what life-history stage these proposed effects occur and whether they are im- portant in the field.
The grazing pressure model helps explain the recruitment patterns seen in the field and the size at which Macrocystis has a refuge from Asterina grazing. The model pre- dicts that the proportion of the bottom remaining ungrazed should decrease very rapidly over time but that common densities of bat stars are not high enough to affect kelp populations greatly. After the first 30 days of the experiment, juvenile kelp plants were visible. Many of the blades were l-3 cm in length. Bat stars were only seen feeding on plants of this size or larger twice during this field experiment. This suggests that Macrocystis plants of very small size are immune to Aster-ha grazing and that this size is reached very rapidly in the field. Aster-ha’s limited affect is probably because kelp gametophytes and young sporophytes are vulnerable only when they are microscopic. Rapid plant growth, and a resulting size refuge, have likewise been shown to minimize plant mortality by grazers in many terrestrial and marine communities (e.g., Harper, 1977; Montgomery, 1980; Sousa et al., 1981; Underwood & Jernakoff, 1981; Lub- chenco, 1980, 1983). This characteristic of rapid plant growth may have evolved in response to predation pressure by sea urchins and other grazers (Estes & Steinberg, 1988) but is more probably the result of selective pressures imposed by living in highly
94 G.H. Leonard 1 J. Exp. Mar. Biol. Ecol. 179(1994) 81-98
disturbed habitats (Foster, 1992). Whatever the cause, rapid growth would prevent
Macrocystis from being greatly affected by Asterina’s feeding activity.
Alternatively, bat stars may be capable of grazing large plants but simply be pre- vented from doing so in the field. Under laboratory conditions, Asterina grazed blades as large as 30 cm (G. Leonard, unpubl. data) but, as mentioned earlier, never did so in the field. If one dislodged a bat star from the bottom, it was often observed being swept away by the surge. Climbing on top of a large plant may require losing contact with the bottom and thus, may risk potential dislodgment. Wave generated limitations on behavior may thus be responsible for the size of plants grazed in the field.
The grazing pressure model also explains why even high densities of bat stars can- not prevent kelp recruitment. It predicted that from 35 to 50% of the bottom should remain ungrazed over the first 30 days of the experiment at bat star densities from 3.6 to 5.7. rne2. However, even at bat star densities of 9.0. me2, a large percentage of the bottom (19.8 %) should remain ungrazed over this time. These latter densities have been seen in other areas of Stillwater Cove and other local kelp forests (G. Leonard, pers. obs.; Gerard, 1976) but were not maintained during the field experiment. Densities of 18.0. m-’ would permit only 3.6% of the bottom to remain ungrazed over 30 days but these densities are highly unlikely in nature. If kelp propagules were distributed evenly
across the bottom, these percentages would correspond to the percent of the juvenile kelp population that would escape grazing. Distribution of propagules is certainly patchy so these numbers therefore represent maximum possible affects of bat stars on developing kelp populations. Alternatively, bat stars may evert their stomachs non- randomly. If they can detect high densities of spores or juvenile plants, their affect on the juvenile kelp population would be greater than that estimated here.
Lubchenco & Gaines’ (198 1) theoretical model also helps explain the limited effect of Asterina grazing. They postulated that the expected damage by an herbivore on a plant is a function of the probability an herbivore will encounter a plant, the conditional probability of eating at least part of the plant once encountered and the change in fit- ness of the plant if eaten. For Asterina, although the probability of grazing a plant (at the microscopic stage) once the stomach is everted is nearly 100% (Table 1; all plants under a bat star were susceptible to digestive enzymes) and the decrease in fitness if
eaten is absolute (Table 1; none survived in the laboratory experiments), the probability of encounter in any given day is low. The overall probability of damage, therefore, is also low. This explains why considerable kelp recruitment was seen, even at relatively high bat star densities and why even higher densities would still permit a large num- ber of plants to survive.
The model developed in this paper appears robust because variations in its param- eters do not strongly affect the results. The number of feeding spots. bat star -’ was probably the most inaccurate parameter in the model because it required accurately sampling feeding behavior. Allowing the measured value to vary within 2 SE of the mean, yields a percentage ungrazed from 31.5 to 41.6% (versus 36.2% at the mean number of feeding spots) for bat star densities of 5.7. mm2. At bat star densities of 3.6. m m2, this yields values from 48.4 to 57.7% (versus 52.8% at the mean number of feeding spots). Conclusions of the model, therefore, do not change appreciably even with large changes in the major component of the model.
G.H. Leonard/J. Exp. Mar. Biol. Ecol. I79 (1994) 81-98 95
Sea urchins, an important generalist grazer in California kelp forests, have a much stronger affect on kelp populations than do bat stars. This is probably because urchins
can exist in very high densities at feeding fronts, graze kelp plants of all sizes, and
eliminate all vegetation when in feeding aggregations (see references in Harrold & Pearse, 1987). In contrast,Asterina occurs in lower densities, affects plants of only small size and feeds at random locations rather than specifically targeting these small plants.
Like sea urchins, other phytophagous sea stars have been shown to greatly affect their prey although the conditions under which this occurs may be rare. Scheibling (1980,
198 1) found that the tropical sea star Oreaster reticuhtus (which everts its stomach like Asterina) had a large affect on its microscopic prey. Unlike Asterina, it fed at 13-15 feeding spots . day-r and spent only 1 h on each spot. The marked decrease in chlo- rophyll content of the soft bottom sediments on which it fed may be the result of this
organism’s ability to rapidly digest organisms living between sediment grains. In con- trast, Asterina may feed at fewer spots * day-’ and spend more time on each spot be- cause it takes longer to digest the photosynthetic pigments of the encrusting and gen-
iculate coralline algae. Small scale variability in many variables, that did not directly relate to bat star
grazing, was apparent in this study (nested effects: Tables 1 and 2). Even though small scale differences did exist, in most cases, main treatment effects were also significant. In the laboratory, plant density and percent cover varied between slides (Table 1). This variation was probably due to vagaries associated with spore settlement. Variability at this spatial scale would also be expected in the field where oscillatory and turbulent flows predominate (Denny, 1988). Lack of tank {treatment} effects in the laboratory suggests there were no differences in the abiotic conditions of the four tanks. In the field, variability in kelp recruitment, bat star density and depth of the plots was also evident (Table 2). Although not directly tested, this was probably due to intrinsic differences between reefs in spore settlement, abiotic factors or other grazers.
The data presented here support Paine’s (1992) hypothesis that many links in food webs are weak. Of seven grazers he studied, only two had strong, negative affects on their algal prey. He postulated that the “interaction strength” of most predators and
prey is weak and that, even with high grazing rates, enough plants survive to produce viable adult populations. My results suggest Asterina is an example of a grazer with weak “interaction strength”.
Overall, the results of this study suggests that the giant kelp, kfacrocystispyrifera, acts as a “weed” (sensu Foster, 1992) and that its high reproductive rate and rapid growth allow it to escape grazers that feed directly on the substratum. Kelp plants are sus- ceptible throughout their lives to some types of grazers because they feed directly on the adult life-history stages (e.g. sea urchins, some gastropods and some fishes; Harrold & Pearse, 1987; Harris et al., 1984; Grant et al., 1982). Alternatively, Macrocystis seems vulnerable to Asterina only for the first few weeks to 1 month after settlement. Although
its effect may be minor, Asterina may be one of a suite of organisms including bacte- ria, protozoans, meiofauna, filter feeders, and small invertebrates (e.g. Osman et al., 1992) that affect the early succession of algal communities.
96 G.H. Leonard / J. Exp. Mar. Biol. Ecol. 179 (1994) 81-98
Acknowledgements
C. Harrold kindly provided use of the seawater facilities at the Monterey Bay Aquarium. Access to the field site was made possible by the Pebble Beach Corpora- tion and Moss Landing Marine Laboratories. C. Roberts, J. Downing, L. Honma and especially R. Clark were instrumental in conducting the field work. I thank M. Fos- ter for his encouragement and advice throughout this project and M. Denny for his suggestions on the probability model. J. Harvey, C. Harrold, M. Foster, T. Leonard, S. Hacker and two reviewers provided constructive criticism on earlier drafts of the manuscript. This work was funded, in part, by a grant from the Dr. Earl H. Myers and Ethel M. Myers Oceanographic and Marine Biology Trust.
References
Araki, G.S., 1964. On the physiology of feeding and digestion of the sea star Patiria miniatcr. Ph.D. Disser-
tation, Standford University, Stanford, CA, 182 pp.
Barrales, H.L. & C.S. Lobban, 1975. The comparative ecology of Macrocystispyrifera with emphasis on the
forests of Chubut, Argentina. J. Ecol., Vol. 63, pp. 657-677.
Bertness, M.D., P.O. Yund & A.F. Brown, 1983. Snail grazing and the abundance of algal crusts on a
sheltered New England rocky beach. J. Exp. Mar. Biol. Ecol, Vol. 71, pp. 147-164.
Breen, P.A. & K.H. Mann, 1976. Changing lobster abundance and the destruction of kelp beds by sea ur-
chins. Mar. Biol., Vol. 34, pp. 137-142.
Breitburg, D.L., 1985. Development of a subtidal epibenthic community: factors affecting species compo-
sition and the mechanisms of succession. Oecologia, Vol. 65, pp. 173-184.
Chapman. A.R.O., 1974. The ecology of macroscopic marine algae. Anna Rev. Ecol. Cyst., Vol. 5, pp. 65-
80.
Chapman, A.R.O., 1981. Stability of sea urchin dominated barren grounds following destructive grazing of
kelp in St. Margaret’s Bay, Eastern Canada. Mar. Biol., Vol. 62, pp. 307-3 11.
Chapman, A.R.O., 1984. Reproduction, recruitment and mortality in two species of Laminaria in Southwest
Nova Scotia. J. Exp. Mar. Biol. Ecol., Vol. 78, pp. 99-109.
Cohen, J., 1988. Statisticalpower analyyis,for the behavioral sciences. Lawrence Erlbaum Associates, Hillsdale,
New Jersey, 567 pp.
Day, R.W. & R.W. Osman, 1981. Predation by Patiria miniata (Asteroidea) on bryozoans: prey diversity may
depend on the mechanism of succession. Oecologia, Vol. 51, pp. 300-309.
Dayton, P.K., 1985. Ecology of kelp communities. Anna Rev. Ecol. Cyst., Vol. 16, pp. 215-245.
Dayton, P.K., V. Currie, T. Gerrodette, B.D. Keller, R. Rosenthal & D. Van Tresca, 1984. Patch dynam-
ics and stability of some California kelp communities. Ecol. Monogr., Vol. 54, pp. 253-289.
Dayton, P.K., M.J. Tegner, P.E. Pamell & P.B. Edwards, 1992. Temporal and spatial patterns of disturb-
ance and recovery in a kelp forest community. Ecol. Monogr., Vol. 62, pp. 421-445.
Dean, T.A. & F.R. Jacobsen, 1984. Growth of juvenile Mucrocysris pyrijzru (Laminariales) in relation to
environmental factors. Mar. Biol., Vol. 83, pp. 301-3 11.
Dean, T.A., S.C. Schroeter & J.D. Dixon, 1984. Effects of grazing by two species of sea urchins (Strongy- locenrrorus ,fianciscanus and Lytechinus anamesus) on recruitment and survival of two species of kelp
(Macrocystis pyrifera and Pterygophora calijomica). Mar. Biol., Vol. 78, pp. 301-3 13.
Dean, T.A., K. Thies & S.L. Lagos, 1989. Survival of juvenile giant kelp: the effects of demographic fac- tors, competitors, and grazers. Ecoloa, Vol. 70, pp. 483-495.
Denny, M.W., 1988. Biology and the mechanics of lhe wave-swept environment. Princeton University Press, Princeton, NJ, 329 pp.
Devinny, J.S. & L.A. Volse, 1978. Effects of sediments on the development of Macrocystis pyrifkra game-
tophytes. Mar. Biol., Vol. 48, pp. 343-348.
G.H. Leonard 1 J. Exp. Mar. Biol. Ecol. 179 (1994) 81-98 91
Deysher, L.E. & T.A. Dean, 1984. Critical irradiance levels and the interactive effects of quantum irradi-
ante and dose on gametogenesis in the giant kelp, Macrocystis pyrifera. J. Phycol., Vol. 20, pp. 520-524.
Deysher, L.E. & T.A. Dean, 1986a. Interactive effects of light and temperature on sporophyte production
in the giant kelp Macrocystis pynfira. Mar. Biol., Vol. 93, pp. 17-20.
Deysher, L.E. & T.A. Dean, 1986b. In situ recruitment of sporophytes of the giant kelp, Macrocystis pynifera
(L.) CA. Agardh: effects of physical factors. J. Exp. Mar. Biol. Ecol., Vol. 103, pp. 41-63.
Ebeling, A.W., D.R. Laur & R.J. Rowley, 1985. Severe storm disturbances and reversal of community
structure in a southern California kelp forest. Mar. Biol., Vol. 84, pp. 287-294.
Elliot, J.M.. 197 1. Some methods for the statistical analysis of samples of benthic invertebrates. Titua Wilson
and Son, Ltd., Kendall, New York, 144 pp.
Estes, J.A. & P.D. Steinberg, 1988. Predation, herbivory, and kelp evolution. Paleobiology, Vol. 14, pp. 19-
36.
Foster, M.S., 1975. Regulation of algal community development in a Macrocystis pyrifera forest. Mar. Biol.,
Vol. 32, pp. 331-342.
Foster, M.S., 1982. The regulation of macroalgal associations in kelp forests. In, Synthetic and degradative
processes in marine macrophytes, edited by L. Srivastava, Walter de Gruyter and Co., Berlin, pp. l85-
205.
Foster, M.S., 1992. How important is grazing to seaweed evolution and assemblage structure in the northeast
Pacific? In, Plant-animal interactions in the marine benthos, edited by D.M. John, S.J. Hawkins & J.H. Price,
Clarendon Press, Oxford, pp. 61-85.
Gerard, V.A., 1976. Some aspects of material dynamics and energy flow in a kelp forest in Monterey Bay,
California. Ph. D. Dissertation, University of California, Santa Cruz, California, 173 pp.
Grant, J.J., K.C. Wilson, A. Grover & H. Togstad, 1982. Early development of Pendleton artificial reef. Mar.
Fish. Rev., Vol. 44, pp. 53-60.
Harper, J.L., 1977. Population biology of plants. Academic Press, London, 892 pp.
Harris, L.C., A.W. Ebeling, D.R. Laur & R.J. Rowley, 1984. Community recovery after storm damage: a
case of facilitation in primary succession. Science, Vol. 224, pp. 1336-1338.
Harrold, C. & D.C. Reed, 1985. Food availability, sea urchin grazing, and kelp forest community structure.
Ecology, Vol. 66, pp. 1160-l 169.
Harrold, C. & J.S. Pearse, 1987. The ecological role of echinoderms in kelp forests. In, Echinoderm stud-
ies, edited by Michel Jangoux & John M. Lawrence, A.A. Balkema, Rotterdam, The Netherlands, pp. l37-
233.
Hsiao, S.I.C. & L.D. Druehl, 1973. Environmental control of gametogenesis in Laminaria saccharina iv. In
situ development of gametophytes and young sporophytes. J. Phycol., Vol. 9, pp. 160-164.
Jones, N.S., 1946. Browsing of Patella. Nature, Vol. 158, pp. 557-558.
Leighton, D.L., 1971. Grazing activities of benthic invertebrates in southern California kelp beds. In, The
biology of giant kelp beds (Macrocystis) in California, edited by Wheeler J. North, Nova Hedwegia, Beihefte
zur Nova Hedwegia Heft 32, Verlag von J. Cramer, 32, pp. 421-453.
Lubchenco. J., 1980. Algal zonation in the New England rocky intertidal community: an experimental
analysis. Ecology, Vol. 61, pp. 333-344.
Lubchenco, J., 1983. Littorina and Fucus: effects of herbivores, substratum heterogeneity, and plant escapes
during succession. Ecology, Vol. 64, pp. 1116-l 123.
Lubchenco, J. & S.D. Gaines, 1981. A unified approach to marine plant-herbivore interactions. I. Popula-
tions and communities. Anna. Rev. Ecol. Syst, Vol. 12, pp. 405-437.
Montgomery, W.L., 1980. The impact of non-selective grazing by the giant blue damselfish, Microspathodon
dor.yalis, on algal communities in the Gulf of California, Mexico. Bull. Mar. Sci., Vol. 30, pp. 290-303.
North, W.J., 1964. An investigation of the effpcts of discharged wastes on kelp. Calf. State Water Qual. Con-
trol Bd., Pub. No. 26, 124 pp.
North, W.J., 1976. Aquacultural techniques for creating and restoring beds of giant kelp, Macrocystb spp. J. Fish. Res. Board Can., Vol. 33, pp. 1015-1023.
North, W.J. & R.C. Zimmerman, 1984. Influences of macronutrients and water temperatures on summer-
time survival of Macrocystis canopies. Hydrobiologia, Vol. 116/l 17, pp. 419-424.
Osman, R.W., R.B. Whitlatch & R.J. Malatesta, 1992. Potential role of micro-predators in determining recruitment into a marine community. Mar. Ecol. Prog. Ser., Vol. 83, pp. 35-43.
98 G.H. Leonard/J. Exp. Mar. Biol. Ecol. 179 (1994) 81-98
Paine, R.T., 1992. Food-web analysis through field measurements of per capita interaction strength. Nature,
Vol. 355, pp. 73-15. Provosoli, L., 1968. Media and prospects for the cultivation of marine algae. In, Culrures and collecfions of
algae, edited by A. Watanabe & A. Hatori, Proceedings of the United States-Japan Conference, Hakone,
Japanese Society of Plant Physiologists, Kyoto, Japan, pp. 63-75. Reed, D.C., 1990. The effects of variable settlement and early competition on patterns of kelp recruitment.
Ecology, Vol. 71, pp. 716-787.
Reed, D.C. & M.S. Foster, 1984. The effects of canopy shading on algal recruitment and growth in a giant
kelp forest. Ecology, Vol. 65, pp. 937-948.
Reed, D.C., M. Neushul & A.W. Ebeling, 1991. Role of settlement density on gametophyte growth and
reproduction in the kelps Pterygophora californica and Macrocystispyrifera (Phaeophyceae). J. Phycol., Vol.
27, pp. 361-366.
Rice, W.R. & S.D. Gaines, 1994. The Ordered-Heterogeneity family of tests. Biometrika (in press).
Scheibling, R.E., 1980. Dynamics and feeding activity of high-density aggregations of Oreaster reticula&s (Echinodermata: Asteriodea) in a sand patch habitat. Mar. Ecol. Prog. Ser., Vol. 2, pp. 321-327.
Scheibling, R.E., 1981. Optimal foraging movements of Oreaster reticulatus (L.) (Echinodermata: Asteroidea).
J. Exp. Mar. Biol. Ecol, Vol. 51, pp. 173-185.
Schiel, D.R., 1981. A demographic and experimental evaluation of plant and herbivore interaction in subtidal
algal stands. Ph.D. Dissertation, University of Aukland, New Zealand, 166 pp.
Schiel, D.R. & M.S. Foster, 1986. The structure of subtidal algal stands in temperate waters. Oceanogr. Mar. Biol. Annu. Rev., Vol. 24, pp. 265-307.
Seymour, R.J., M.J. Tegner, P.K. Dayton & P.E. Parnell, 1989. Storm wave induced mortality of giant kelp,
Macrocystis pyrifra, in Southern California. Estuarine Coastal Shelf. Sci., Vol. 28, pp. 277-292.
Sousa, W.P., S.C. Schroeter & S.D. Gaines, 1981. Latitudinal variation in intertidal algal community
structure: the influence of grazing and vegetative propagation. Oecologia, Vol. 48, pp. 297-307.
Tegner, M.J. & P.K. Dayton, 1987. El Nino effects on southern California kelp forest communities. Adv. Ecol. Res., Vol. 17, pp. 243-219.
Tegner, M.J. & P.K. Dayton, 1991. Sea urchins, El Ninos, and the long term stability of Southern California
kelp forest communities. Mar. Ecol. Prog. Ser., Vol. 77, pp. 49-63.
Underwood, A.J. & P. Jernakoff, 1981. Effects of interactions between algae and grazing gastropods on the
structure of a low-shore intertidal algal community. Oecologia, Vol. 48, pp. 221-233.
Van den Hoek, C., 1982. The distribution of benthic marine algae in relation to the temperature regulation
of their life histories. Bull. J. Lint Sot., Vol. 18, pp. 81-144.
Watanabe, J.M., 1983. Anti-predator defenses of three kelp forest gastropods: contrasting adaptations of
closely related prey species. J. Exp. Mar. Biol. Ecol., Vol. 71, pp. 257-270.
Winer, B.J., 1971. Statisticalprinciples in experimenfal design. McGraw-Hill Book Co., New York, 907 pp.
Wobber, D.R., 1975. Agonism in asteroids. Biol. Bull., Vol. 148, pp. 483-496.
Zimmerman, R.C. Kc J.N. Kremer, 1984. Episodic nutrient supply to a kelp forest ecosystem in Southern
California. J. Mar. Res., Vol. 42, pp. 591-604.