effect of land cover change on runoff curve number ... · effect of land cover change on runoff...
TRANSCRIPT
ECOHYDROLOGYEcohydrol. 4, 315–321 (2011)Published online 24 August 2010 in Wiley Online Library(wileyonlinelibrary.com) DOI: 10.1002/eco.162
Effect of land cover change on runoff curve numberestimation in Iowa, 1832–2001
Loren L. Wehmeyer,1* Frank H. Weirich2 and Thomas F. Cuffney1
1 US Geological Survey, 3916 Sunset Ridge Road, Raleigh, NC 27607-6416, USA2 IIHR-Hydroscience and Engineering and the Department of Geosience, The University of Iowa, 121 Trowbridge Hall, Iowa City, IA 52242, USA
ABSTRACT
Within the first few decades of European-descended settlers arriving in Iowa, much of the land cover across the state wastransformed from prairie and forest to farmland, patches of forest, and urbanized areas. Land cover change over the subsequent126 years was minor in comparison. Between 1832 and 1859, the General Land Office conducted a survey of the State ofIowa to aid in the disbursement of land. In 1875, an illustrated atlas of the State of Iowa was published, and in 2001, the USGeological Survey National Land Cover Dataset was compiled. Using these three data resources for classifying land cover,the hydrologic impact of the land cover change at three points in time over a period of 132C years is presented in terms of theeffect on the area-weighted average curve number, a term commonly used to predict peak runoff from rainstorms. In the fourwatersheds studied, the area-weighted average curve number associated with the first 30 years of settlement increased from61Ð4 to 77Ð8. State-wide mapped forest area over this same period decreased 19%. Over the next 126 years, the area-weightedaverage curve number decreased to 76Ð7, despite an additional forest area reduction of 60%. This suggests that degradationof aquatic resources (plants, fish, invertebrates, and habitat) arising from hydrologic alteration was likely to have been muchhigher during the 30 years of initial settlement than in the subsequent period of 126 years in which land cover changes resultedprimarily from deforestation and urbanization. Published 2010. This article is a US Government work and is in the publicdomain in the USA.
KEY WORDS land usage; surface drainage; land surveys; history
Received 13 November 2009; Accepted 7 July 2010
INTRODUCTION
Conversion of tall grass prairie and forested landscapesto agricultural land in Iowa has driven aquatic habitatdegradation and reduced biodiversity (Poole and Down-ing, 2004). These changes in land cover have alteredstreamflow and sediment supply (Randhir and Hawes,2009). Altering the natural flow regimes is known to leadto deleterious effects on wetland and riparian vegetation,fish, benthic invertebrates, and aquatic habitats (Bunnand Arthington, 2002; Poff and Zimmerman, 2010).Changes in extreme sedimentation that occur during largestorm events, but infrequently, allow aquatic organisms torebound. However, chronic deposition of large volumesof sediment from smaller flow events can reduce aquaticbiodiversity (Richter et al., 1997), thereby limiting a sys-tem’s ability to rebound after an extreme storm and sed-imentation event (Farnsworth and Milliman, 2003). Thisinvestigation estimated differences in the runoff curvenumber, which provides an insight into changes in largestreamflow events in Iowa under three historical landcover regimes to gain a better understanding of the eco-hydrological implications of land cover change.
Land cover change in the first few decades ofEuropean-descended settlement in Iowa occurred at an
* Correspondence to: Loren L. Wehmeyer, US Geological Survey, 3916Sunset Ridge Road, Raleigh, NC 27607-6416, USA.E-mail: [email protected]
astonishing rate. Between 1832 and 1859, prior to mostsettlement in Iowa, the General Land Office (GLO)conducted the first public land survey of the state. Sur-veyors traversed the state in a one-mile-by-one-mile griddescribing identifiable markers, topography, soil type,water bodies and boundaries of land cover. In 1996, theland cover information from the GLO surveys for theState of Iowa was digitized (paper maps converted todigital maps) into a geographic information system formapping analysis (Anderson, 1996).
Approximately three decades after settlement,entrepreneur A. T. Andreas began producing maps ofcounties in the Midwest. With success in Illinois andMinnesota, Andreas used the services of over 300 ofhis own employees over the course of approximately15 months to ‘compile the history, execute portraits, drawpictures of homes, farms, buildings and cities, and recordfaithfully the maps (including land cover) and plats ofcounties and towns (in Iowa)’ (Andreas, 1875). Andreas’Illustrated Historical Atlas of the State of Iowa (IASI)was published in 1875 with nearly 23 000 subscribers.Prairie was the predominant land cover class in the GLOsurvey, however, in the IASI, prairie was not includedas a land cover class, indicating that it was not foundor that it was classified differently. The 2001 NationalLand Cover Dataset (NLCD 2001) (USGS, 2001) wasdeveloped to provide a consistently derived (from 30 mresolution multitemporal Landsat 5 and 7 imagery),
Published in 2010 by John Wiley and Sons, Ltd.
316 L. L. WEHMEYER, F. H. WEIRICH AND T. F. CUFFNEY
public-domain land use product for the Nation (Homeret al., 2007) with land cover classification descriptionsand methodology of the minimum 1-acre mapping unitdescribed by Homer et al. (2004).
The Natural Resource Conservation Service (NRCS)runoff curve number (CN) method has been the foun-dation of the hydrology algorithms in many simulationmodels for hydrology, soil erosion, and nonpoint sourcewater quality for over five decades. However, the methodwas originally developed only as an event-based model topredict peak streamflow, and the scientific basis of otheruses has been questioned (Garen and Moore, 2005). TheCN method converts mass rainfall into mass runoff usingthe empirically derived CN, which is a function of soiltype, land cover, interception, and surface storage param-eters (SCS, 1986). The generation of land cover and soiltype maps, coupled with assumptions about interceptionand surface storage, make it possible to create maps ofcurve numbers for each land cover dataset.
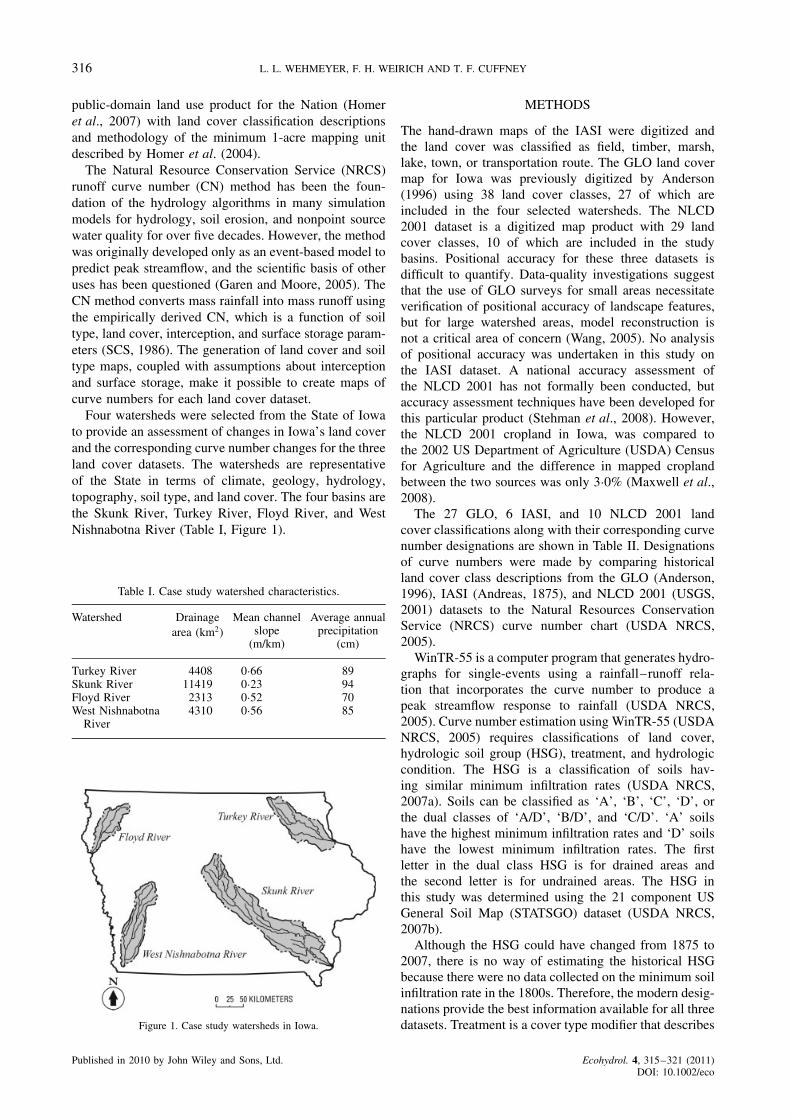
Four watersheds were selected from the State of Iowato provide an assessment of changes in Iowa’s land coverand the corresponding curve number changes for the threeland cover datasets. The watersheds are representativeof the State in terms of climate, geology, hydrology,topography, soil type, and land cover. The four basins arethe Skunk River, Turkey River, Floyd River, and WestNishnabotna River (Table I, Figure 1).
Table I. Case study watershed characteristics.
Watershed Drainagearea (km2)
Mean channelslope
(m/km)
Average annualprecipitation
(cm)
Turkey River 4408 0Ð66 89Skunk River 11419 0Ð23 94Floyd River 2313 0Ð52 70West Nishnabotna
River4310 0Ð56 85
Figure 1. Case study watersheds in Iowa.
METHODS
The hand-drawn maps of the IASI were digitized andthe land cover was classified as field, timber, marsh,lake, town, or transportation route. The GLO land covermap for Iowa was previously digitized by Anderson(1996) using 38 land cover classes, 27 of which areincluded in the four selected watersheds. The NLCD2001 dataset is a digitized map product with 29 landcover classes, 10 of which are included in the studybasins. Positional accuracy for these three datasets isdifficult to quantify. Data-quality investigations suggestthat the use of GLO surveys for small areas necessitateverification of positional accuracy of landscape features,but for large watershed areas, model reconstruction isnot a critical area of concern (Wang, 2005). No analysisof positional accuracy was undertaken in this study onthe IASI dataset. A national accuracy assessment ofthe NLCD 2001 has not formally been conducted, butaccuracy assessment techniques have been developed forthis particular product (Stehman et al., 2008). However,the NLCD 2001 cropland in Iowa, was compared tothe 2002 US Department of Agriculture (USDA) Censusfor Agriculture and the difference in mapped croplandbetween the two sources was only 3Ð0% (Maxwell et al.,2008).
The 27 GLO, 6 IASI, and 10 NLCD 2001 landcover classifications along with their corresponding curvenumber designations are shown in Table II. Designationsof curve numbers were made by comparing historicalland cover class descriptions from the GLO (Anderson,1996), IASI (Andreas, 1875), and NLCD 2001 (USGS,2001) datasets to the Natural Resources ConservationService (NRCS) curve number chart (USDA NRCS,2005).
WinTR-55 is a computer program that generates hydro-graphs for single-events using a rainfall–runoff rela-tion that incorporates the curve number to produce apeak streamflow response to rainfall (USDA NRCS,2005). Curve number estimation using WinTR-55 (USDANRCS, 2005) requires classifications of land cover,hydrologic soil group (HSG), treatment, and hydrologiccondition. The HSG is a classification of soils hav-ing similar minimum infiltration rates (USDA NRCS,2007a). Soils can be classified as ‘A’, ‘B’, ‘C’, ‘D’, orthe dual classes of ‘A/D’, ‘B/D’, and ‘C/D’. ‘A’ soilshave the highest minimum infiltration rates and ‘D’ soilshave the lowest minimum infiltration rates. The firstletter in the dual class HSG is for drained areas andthe second letter is for undrained areas. The HSG inthis study was determined using the 21 component USGeneral Soil Map (STATSGO) dataset (USDA NRCS,2007b).
Although the HSG could have changed from 1875 to2007, there is no way of estimating the historical HSGbecause there were no data collected on the minimum soilinfiltration rate in the 1800s. Therefore, the modern desig-nations provide the best information available for all threedatasets. Treatment is a cover type modifier that describes
Published in 2010 by John Wiley and Sons, Ltd. Ecohydrol. 4, 315–321 (2011)DOI: 10.1002/eco

EFFECT OF LAND COVER CHANGE ON RUNOFF CURVE NUMBER ESTIMATION 317
Table II. GLO, IASI and NLCD of 2001 land cover types and corresponding Natural Resources Conservation Service curve numbersby hydrologic soil group.
GLO IASI NLCD 2001 NRCS coverdescription
HSGA
HSGB
HSGC
HSGD
Barrens — Barren land Woods–grass combo 32 58 72 79Bayou — — — 100 100 100 100Brush — Shrub/scrub Brush 30 48 65 73City — — Residential 1/8 acre 77 85 90 92Drain — — — 100 100 100 100Field Field Cultivated crops Straight row crops 67 78 85 89Grovea — — Woods 30 55 70 77Lake Lake — — 100 100 100 100Marsh Marsh — — 100 100 100 100Meadow — Pasture Meadow 30 58 71 78Openings — — Meadow 30 58 71 78Pond — Open water — 100 100 100 100Prairie — — Meadow 30 58 71 78Prairie/timber — — Woods–grass combo 32 58 72 79Ravine — — — 100 100 100 100River (border) — — — 100 100 100 100Rough — — Brush 30 48 65 73Scattered treesa — — Woods–grass combo 32 58 72 79Slough — — — 100 100 100 100Spring — — — 100 100 100 100Swamp — — — 100 100 100 100Thicketa — — Woods 30 55 70 77Timbera Timbera Forest: deciduous,
evergreen or mixedaWoods 30 55 70 77
Timber/barrensa — — Woods–grass combo 32 58 72 79Timber/openingsa — — Woods–grass combo 32 58 72 79Village Town Developed: low, medium
or high intensityResidential 1/2 acre 54 70 80 85
Wetland — Wetland: emergent,herbaceous, or woody
— 100 100 100 100
— Transportationroute
— Dirt streets 72 82 87 89
— — Developed open space Open space 39 61 74 80— — Pasture/hay Pasture/grassland 39 61 74 80
GLO, General Land Office survey; IASI, Andreas’ Illustrated Historical Atlas of the State of Iowa; NLCD, National Land Cover Dataset.—denotes no equivalent classification.
a A forest classification for this study.
the management of cultivated land. Treatment includesboth mechanical and management practices of the soil,and was considered ‘straight row’ for all agriculturalland cover classifications. Hydrologic condition indicatesthe effects of cover type and treatment on runoff andwas considered ‘good’ for all land cover classifications.Curve number values of 100 indicate there is no infiltra-tion (i.e. impervious land or standing water). Interceptionand surface storage terms in the CN method are lumpedtogether as part of an initial abstraction term that variesby CN and has been studied extensively (Jiang, 2001),yet the original equation developed in the 1950s relatingthe initial abstraction and the curve number remains theonly widely accepted approach. The area-weighted aver-age curve number approach used in this analysis takesthe CN computed for each combination of parametersand multiplies this CN value by its proportional water-shed area, producing an area-weighted average CN forthe watershed.
Because forested land was more difficult to convertinto agricultural land than prairie, this study looked at the
forest fraction within each watershed to see if a relationexisted between forest fraction or forest fraction changeand the area-weighted average curve number. To evalu-ate this relation, land cover for each dataset was dividedinto forested or non-forested categories. For the IASIand NLCD 2001, this designation was simple. In theIASI, one land cover class was forest and in the NLCD2001, the evergreen, deciduous and mixed forest classeswere defined as forest. The GLO dataset presented chal-lenges because the delineation of some transitional landcover classes was not clearly defined. Anderson (1996)included descriptions and noted the ambiguity of sometransitional land cover classes in the GLO survey. If tran-sition forest land cover classes were unclear from thesedescriptions, the determination was made based on theclass name. If a forest-related term was the first landcover word in the description, the land cover was clas-sified as forest, but if it was the second word in thedescription then the land cover was not described asforest. This evaluation resulted in forest classificationsof scattered trees, timber/barrens, and timber/openings,
Published in 2010 by John Wiley and Sons, Ltd. Ecohydrol. 4, 315–321 (2011)DOI: 10.1002/eco

318 L. L. WEHMEYER, F. H. WEIRICH AND T. F. CUFFNEY
and a non-forest classification of prairie/timber. Tim-ber, thicket, and grove were not transitional classesand were classified as forest land cover in the GLOsurvey.
RESULTS AND DISCUSSION
The GLO, IASI, and NLCD 2001 curve number mapsfor the four Iowa study watersheds are shown inFigures 2–4, respectively. Figure 5 shows the magnitudeof change of the curve number between the GLO andIASI datasets for each watershed. Figure 6 shows themagnitude of change of the curve number between theIASI and NLCD 2001 datasets for each watershed. Neg-ative values of change indicate that the land provides lessdirect runoff. The curve numbers are mapped such thathigh curve number values, representing a large propor-tion of direct runoff, are displayed in light colours, andlow curve number values, representing a small proportionof direct runoff, are displayed in dark colours.
The area-weighted average curve numbers for eachwatershed, show a sharp increase between the GLO andIASI datasets, and a slight decrease between the IASI
Figure 2. General Land Office survey (GLO) land cover based curvenumbers for selected basins in Iowa.
Figure 3. Andreas’ Illustrated Historical Atlas of the State of Iowa (IASI)land cover-based curve numbers for selected basins in Iowa.
Figure 4. National Land Cover Dataset of 2001 (NLCD 2001) landcover-based curve numbers for selected basins on Iowa.
Figure 5. General Land Office survey-Andreas’ Illustrated HistoricalAtlas of the State of Iowa (GLO-IASI) curve number change for selected
basins on Iowa.
Figure 6. Andreas’ Illustrated Historical Atlas of the State of Iowa-National Land Cover Dataset of 2001 (IASI-NLCD 2001) curve number
change for selected basins on Iowa.
and NLCD 2001 datasets (Table III). The Floyd Riverand West Nishnabotna River have larger CN increasesbetween the GLO and IASI datasets than the Skunk Riverand Turkey River. The forest fraction is greater in theTurkey River and Skunk River watersheds, resulting insmaller changes in the curve number between the GLO
Published in 2010 by John Wiley and Sons, Ltd. Ecohydrol. 4, 315–321 (2011)DOI: 10.1002/eco

EFFECT OF LAND COVER CHANGE ON RUNOFF CURVE NUMBER ESTIMATION 319
Table III. Computed area-weighted average curve numbers andchange between land cover classifications.
Watershed GLOCN
CN
IASICN
CN
NLCD2001 CN
Turkey River 59Ð3 15Ð7 75Ð0 �1Ð1 73Ð9Skunk River 63Ð5 15Ð2 78Ð7 �1Ð1 77Ð6Floyd River 60Ð4 18Ð6 79Ð0 �1Ð2 77Ð8West Nishnabotna
River58Ð2 19Ð4 77Ð6 �1Ð1 76Ð5
All four combined 61Ð4 16Ð4 77Ð8 �1Ð1 76Ð7
GLO, General Land Office survey; , change; CN, Natural ResourcesConservation Service curve number; IASI, Andreas’ Illustrated HistoricalAtlas of the State of Iowa; NLCD 2001, National Land Cover Dataset of2001.
Table IV. Percentage of watershed with a forested land cover andchange between land cover classifications.
Watershed GLO IASI NLCD 2001
Turkey River 43 �16 27 �13 14Skunk River 22 �2 20 �13 7Floyd River 0 0 0 1 1West Nishnabotna River 2 2 4 �2 2All four combined 20 �4 16 �9 7
GLO, General Land Office survey; , change; CN, Natural ResourcesConservation Service curve number; IASI, Andreas’ Illustrated HistoricalAtlas of the State of Iowa; NLCD 2001, National Land Cover Dataset of2001.
Table V. Computed forested areas, in hectares, and percentchange between land cover classifications.
Watershed GLO (%)
IASI (%)
NLCD2001
Turkey River 191 160 �38 119 327 �50 60 149Skunk River 251 058 �8 230 227 �64 83 067Floyd River 311 100 0 N/A 1757West Nishnabotna
River8858 83 16 168 �75 4005
All four combined 451 386 �19 365 721 �59 148 977
GLO, General Land Office survey; , change; CN, Natural ResourcesConservation Service curve number; IASI, Andreas’ Illustrated HistoricalAtlas of the State of Iowa; NLCD 2001, National Land Cover Dataset of2001.
and IASI datasets because forest was more difficult toconvert to arable land than prairie (Table IV).
The GLO Turkey River watershed forest fraction wastwice as large as the GLO Skunk River watershed forestfraction, and between the GLO and IASI datasets weredeforested at a much higher rate. During this period, theforested area in the Skunk River watershed decreased 8%,whereas the forested area in the Turkey River decreased38% (Table V), yet the curve number change between thetwo is similar. One might expect that a larger percentageof change in forested land cover would result in agreater increase in the curve number, but this is notobserved between the Skunk River and Turkey Riverwatersheds. Another observation is the 83% increaseof the forest fraction in the West Nishnabotna River
watershed between the GLO and IASI datasets; however,only 2% of watershed was classified as forested in theGLO. This increase in the forest fraction between theGLO and IASI datasets in the West Nishnabotna Riveris likely a function of different classification schemesbetween the two datasets.
The changes in the area-weighted average curvenumbers for forested areas were relatively consistentacross the four watersheds (Table VI). The area-weightedaverage CN in forested areas increased by an average of6Ð1 between the GLO and IASI datasets, and the area-weighted average CN in forested areas decreased by anaverage of 0Ð9 between the IASI and NLCD 2001. Thesechanges could indicate that during the time between theGLO and IASI datasets either (1) forest types with lowercurve numbers were preferentially removed (possiblyforests on land with higher minimum infiltration rates),(2) the classification scheme tends to underestimate thecurve number in the GLO dataset, or (3) it is coincidentalthat the curve number change is around six for all fourwatersheds. The curve number change in forested areasbetween the IASI and NLCD 2001 is also consistent. Thischange could be a function of land use change across theState of Iowa combining deforestation in locations withsoils with high minimum infiltration rates, and reforesta-tion in locations with soils with low minimum infiltrationrates (such as stream buffers in floodplains with high claycontent).
The greatest area-weighted average curve numberchanges between the GLO and IASI datasets were inthe West Nishnabotna River and Floyd River watersheds,both of which had larger fractions of prairie and smallerfractions of forest than the Turkey River and Skunk Riverwatersheds of eastern Iowa. The area-weighted averagecurve number between the GLO and IASI datasets for thefour study basins showed a combined increase of 16Ð4from 61Ð4 to 77Ð8. The CN change between the IASI andNLCD 2001 datasets for all four watersheds showed aconsistent decrease of about �1Ð1 to an area-weightedaverage of 76Ð7 despite the variability in the change offorested land cover between the watersheds.
To put the changes in the area-weighted average curvenumber in context of how the changes relate to peakstreamflow response to rainfall is useful. Assuming ahypothetical basin with a 52 km2 drainage area withthe standard 24-h rainfall distribution of Des MoinesCounty, Iowa, a 2% slope, and a hydraulic watershedlength of 442 m yields a time of concentration (theamount of time it takes runoff generated from the mostdistant point in a watershed to reach the watershed outlet)of about 51 min using the Soil Conservation Servicelag equation (USDA SCS, 1986). Table VII shows theflood frequency computation output from WinTR-55(USDA NRCS, 2005) using the computed area-weightedaverage CNs of 61 (GLO), 77 (IASI), and 76 (NLCD2001). In this example, the streamflow magnitude of theestimated 2-year return interval (50% change exceedanceflood) increased 306% and the estimated 100-year returninterval (1% change exceedance flood) increased 74%
Published in 2010 by John Wiley and Sons, Ltd. Ecohydrol. 4, 315–321 (2011)DOI: 10.1002/eco
320 L. L. WEHMEYER, F. H. WEIRICH AND T. F. CUFFNEY
Table VI. Computed area-weighted average curve numbers and curve number changes between land cover classifications in only theforested areas of each watershed.
Watershed GLO CN CN IASI CN CN NLCD 2001 CN
Turkey River 60Ð0 6Ð0 66Ð0 �0Ð1 65Ð9Skunk River 67Ð3 5Ð4 72Ð7 �0Ð7 72Ð0Floyd River 72Ð8 N/A N/AŁ N/A 67Ð0West Nishnabotna River 60Ð3 5Ð7 66Ð0 0Ð0 66Ð0All four combined 64Ð1 6Ð1 70Ð2 �0Ð9 69Ð3
GLO, General Land Office survey; , change; CN, Natural Resources Conservation Service curve number; IASI, Andreas’ Illustrated HistoricalAtlas of the State of Iowa; NLCD 2001, National Land Cover Dataset of 2001; N/A, not applicable;Ł , no land classified as forest.
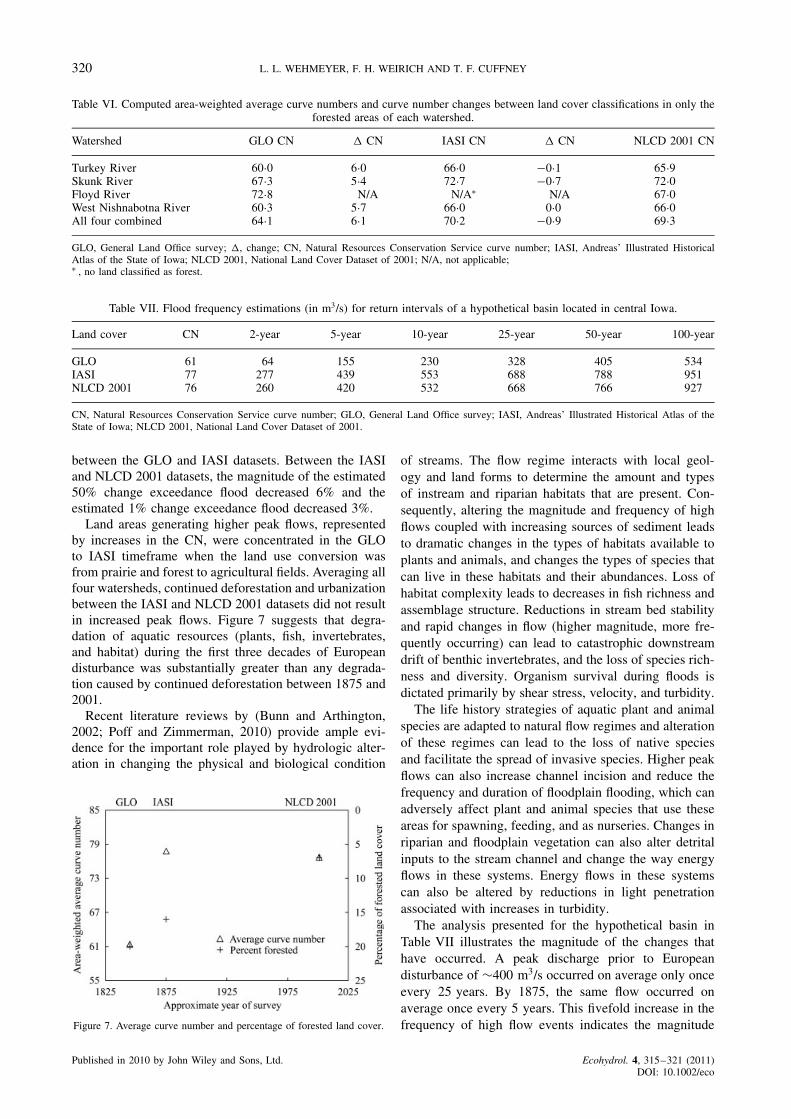
Table VII. Flood frequency estimations (in m3/s) for return intervals of a hypothetical basin located in central Iowa.
Land cover CN 2-year 5-year 10-year 25-year 50-year 100-year
GLO 61 64 155 230 328 405 534IASI 77 277 439 553 688 788 951NLCD 2001 76 260 420 532 668 766 927
CN, Natural Resources Conservation Service curve number; GLO, General Land Office survey; IASI, Andreas’ Illustrated Historical Atlas of theState of Iowa; NLCD 2001, National Land Cover Dataset of 2001.
between the GLO and IASI datasets. Between the IASIand NLCD 2001 datasets, the magnitude of the estimated50% change exceedance flood decreased 6% and theestimated 1% change exceedance flood decreased 3%.
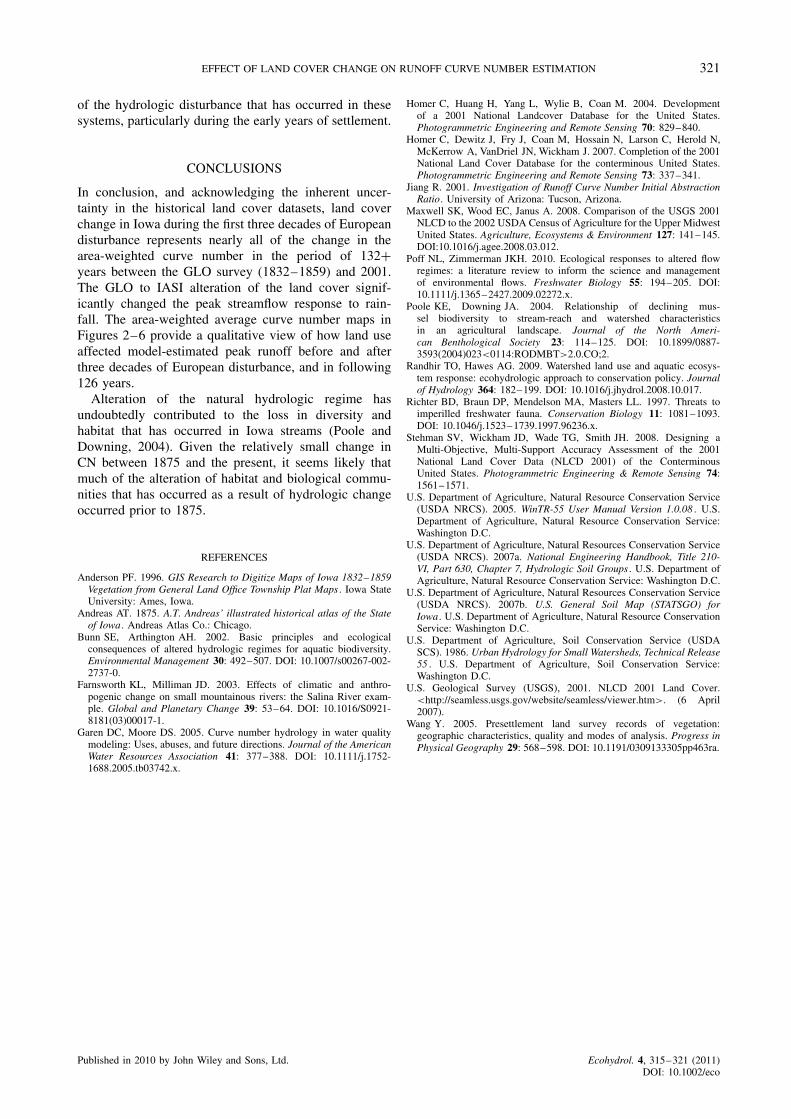
Land areas generating higher peak flows, representedby increases in the CN, were concentrated in the GLOto IASI timeframe when the land use conversion wasfrom prairie and forest to agricultural fields. Averaging allfour watersheds, continued deforestation and urbanizationbetween the IASI and NLCD 2001 datasets did not resultin increased peak flows. Figure 7 suggests that degra-dation of aquatic resources (plants, fish, invertebrates,and habitat) during the first three decades of Europeandisturbance was substantially greater than any degrada-tion caused by continued deforestation between 1875 and2001.
Recent literature reviews by (Bunn and Arthington,2002; Poff and Zimmerman, 2010) provide ample evi-dence for the important role played by hydrologic alter-ation in changing the physical and biological condition
Figure 7. Average curve number and percentage of forested land cover.
of streams. The flow regime interacts with local geol-ogy and land forms to determine the amount and typesof instream and riparian habitats that are present. Con-sequently, altering the magnitude and frequency of highflows coupled with increasing sources of sediment leadsto dramatic changes in the types of habitats available toplants and animals, and changes the types of species thatcan live in these habitats and their abundances. Loss ofhabitat complexity leads to decreases in fish richness andassemblage structure. Reductions in stream bed stabilityand rapid changes in flow (higher magnitude, more fre-quently occurring) can lead to catastrophic downstreamdrift of benthic invertebrates, and the loss of species rich-ness and diversity. Organism survival during floods isdictated primarily by shear stress, velocity, and turbidity.
The life history strategies of aquatic plant and animalspecies are adapted to natural flow regimes and alterationof these regimes can lead to the loss of native speciesand facilitate the spread of invasive species. Higher peakflows can also increase channel incision and reduce thefrequency and duration of floodplain flooding, which canadversely affect plant and animal species that use theseareas for spawning, feeding, and as nurseries. Changes inriparian and floodplain vegetation can also alter detritalinputs to the stream channel and change the way energyflows in these systems. Energy flows in these systemscan also be altered by reductions in light penetrationassociated with increases in turbidity.
The analysis presented for the hypothetical basin inTable VII illustrates the magnitude of the changes thathave occurred. A peak discharge prior to Europeandisturbance of ¾400 m3/s occurred on average only onceevery 25 years. By 1875, the same flow occurred onaverage once every 5 years. This fivefold increase in thefrequency of high flow events indicates the magnitude
Published in 2010 by John Wiley and Sons, Ltd. Ecohydrol. 4, 315–321 (2011)DOI: 10.1002/eco
EFFECT OF LAND COVER CHANGE ON RUNOFF CURVE NUMBER ESTIMATION 321
of the hydrologic disturbance that has occurred in thesesystems, particularly during the early years of settlement.
CONCLUSIONS
In conclusion, and acknowledging the inherent uncer-tainty in the historical land cover datasets, land coverchange in Iowa during the first three decades of Europeandisturbance represents nearly all of the change in thearea-weighted curve number in the period of 132Cyears between the GLO survey (1832–1859) and 2001.The GLO to IASI alteration of the land cover signif-icantly changed the peak streamflow response to rain-fall. The area-weighted average curve number maps inFigures 2–6 provide a qualitative view of how land useaffected model-estimated peak runoff before and afterthree decades of European disturbance, and in following126 years.
Alteration of the natural hydrologic regime hasundoubtedly contributed to the loss in diversity andhabitat that has occurred in Iowa streams (Poole andDowning, 2004). Given the relatively small change inCN between 1875 and the present, it seems likely thatmuch of the alteration of habitat and biological commu-nities that has occurred as a result of hydrologic changeoccurred prior to 1875.
REFERENCES
Anderson PF. 1996. GIS Research to Digitize Maps of Iowa 1832–1859Vegetation from General Land Office Township Plat Maps . Iowa StateUniversity: Ames, Iowa.
Andreas AT. 1875. A.T. Andreas’ illustrated historical atlas of the Stateof Iowa. Andreas Atlas Co.: Chicago.
Bunn SE, Arthington AH. 2002. Basic principles and ecologicalconsequences of altered hydrologic regimes for aquatic biodiversity.Environmental Management 30: 492–507. DOI: 10.1007/s00267-002-2737-0.
Farnsworth KL, Milliman JD. 2003. Effects of climatic and anthro-pogenic change on small mountainous rivers: the Salina River exam-ple. Global and Planetary Change 39: 53–64. DOI: 10.1016/S0921-8181(03)00017-1.
Garen DC, Moore DS. 2005. Curve number hydrology in water qualitymodeling: Uses, abuses, and future directions. Journal of the AmericanWater Resources Association 41: 377–388. DOI: 10.1111/j.1752-1688.2005.tb03742.x.
Homer C, Huang H, Yang L, Wylie B, Coan M. 2004. Developmentof a 2001 National Landcover Database for the United States.Photogrammetric Engineering and Remote Sensing 70: 829–840.
Homer C, Dewitz J, Fry J, Coan M, Hossain N, Larson C, Herold N,McKerrow A, VanDriel JN, Wickham J. 2007. Completion of the 2001National Land Cover Database for the conterminous United States.Photogrammetric Engineering and Remote Sensing 73: 337–341.
Jiang R. 2001. Investigation of Runoff Curve Number Initial AbstractionRatio. University of Arizona: Tucson, Arizona.
Maxwell SK, Wood EC, Janus A. 2008. Comparison of the USGS 2001NLCD to the 2002 USDA Census of Agriculture for the Upper MidwestUnited States. Agriculture, Ecosystems & Environment 127: 141–145.DOI:10.1016/j.agee.2008.03.012.
Poff NL, Zimmerman JKH. 2010. Ecological responses to altered flowregimes: a literature review to inform the science and managementof environmental flows. Freshwater Biology 55: 194–205. DOI:10.1111/j.1365–2427.2009.02272.x.
Poole KE, Downing JA. 2004. Relationship of declining mus-sel biodiversity to stream-reach and watershed characteristicsin an agricultural landscape. Journal of the North Ameri-can Benthological Society 23: 114–125. DOI: 10.1899/0887-3593(2004)023<0114:RODMBT>2.0.CO;2.
Randhir TO, Hawes AG. 2009. Watershed land use and aquatic ecosys-tem response: ecohydrologic approach to conservation policy. Journalof Hydrology 364: 182–199. DOI: 10.1016/j.jhydrol.2008.10.017.
Richter BD, Braun DP, Mendelson MA, Masters LL. 1997. Threats toimperilled freshwater fauna. Conservation Biology 11: 1081–1093.DOI: 10.1046/j.1523–1739.1997.96236.x.
Stehman SV, Wickham JD, Wade TG, Smith JH. 2008. Designing aMulti-Objective, Multi-Support Accuracy Assessment of the 2001National Land Cover Data (NLCD 2001) of the ConterminousUnited States. Photogrammetric Engineering & Remote Sensing 74:1561–1571.
U.S. Department of Agriculture, Natural Resource Conservation Service(USDA NRCS). 2005. WinTR-55 User Manual Version 1.0.08 . U.S.Department of Agriculture, Natural Resource Conservation Service:Washington D.C.
U.S. Department of Agriculture, Natural Resources Conservation Service(USDA NRCS). 2007a. National Engineering Handbook, Title 210-VI, Part 630, Chapter 7, Hydrologic Soil Groups . U.S. Department ofAgriculture, Natural Resource Conservation Service: Washington D.C.
U.S. Department of Agriculture, Natural Resources Conservation Service(USDA NRCS). 2007b. U.S. General Soil Map (STATSGO) forIowa. U.S. Department of Agriculture, Natural Resource ConservationService: Washington D.C.
U.S. Department of Agriculture, Soil Conservation Service (USDASCS). 1986. Urban Hydrology for Small Watersheds, Technical Release55 . U.S. Department of Agriculture, Soil Conservation Service:Washington D.C.
U.S. Geological Survey (USGS), 2001. NLCD 2001 Land Cover.<http://seamless.usgs.gov/website/seamless/viewer.htm>. (6 April2007).
Wang Y. 2005. Presettlement land survey records of vegetation:geographic characteristics, quality and modes of analysis. Progress inPhysical Geography 29: 568–598. DOI: 10.1191/0309133305pp463ra.
Published in 2010 by John Wiley and Sons, Ltd. Ecohydrol. 4, 315–321 (2011)DOI: 10.1002/eco