effect of internal shading devices towards building … of internal... · penyejukan oleh sistem...
TRANSCRIPT
EFFECT OF INTERNAL SHADING DEVICES TOWARDS BUILDING ENERGY EFFICIENCY IN HOT AND HUMID CLIMATE
Nurafina Binti Safri
Master of Engineering 2010

Pusat Khidmat MlkJumat Abdftn'" ; -• .. . • T <::rrr UT . ~v<:' S~R U '
P-KHIDMAT MAKLUMAT AKADEMIK
'11'"III 1111111000246290
EFFECTS OF INTERNAL SHADING DEVICES TOWARDS BUIDING ENERGY EFFICIENCY IN HOT AND HUMID CLIMATES
NURAFINA BINTI SAFRI
This project is submitted in fulfillment of the requirements for Master of Engineering (Energy and Building)
Faculty of Engineering UNIVERSITI MALAYSIA SARA W AK
2010

To my belovedfamily andfiance
ii
------------------ - --:
ACKNOWLEDGEMENT
Fullest gratitude to Allah, the most Gracious and Merciful for giving me a chance , and strength to complete this project on time.
I wish to express my greatest appreciation to my supervisor, Dr Azhaili Baharun
and my co-supervisor, Dr Siti Halipah Ibrahim for their guidance, advices,
comments and suggestions throughout this whole process.
lowe a big thanks to the staff of Building Services Laboratory of Civil
Engineering, Mr. Mohd Rozaini for his dedication and kindness for helping me
setting up field measurement's apparatus.
I would also like to acknowledge with gratitude to my family especially my
beloved mother and father for their endless love, invaluable moral and financial
support throughout my entire life.
Finally, for the loved one, thank you for your patience and love.
Thank you so much.
iii

,... ~ ,....
ABSTRACT
( Energy Efficiency is important to ensure our country's natural resources are adequate
for future generation. Data in annual statistic from Malaysia Energy Commission
shows that commercial buildings, such as an office building, are the second largest
consumers of the electricity in this country. Transparent envelope of the building is
determined to be the largest factors on cooling load placed on building's air
conditioning system. The glazing area allows the admission of solar heat gain through
radiation and conduction which causing the excessive usage of electricity by a chiller
to keep to the set temperature in bUilding. Tabuan Height Commercial Centre was
modeled in the simulation software and it was validated against the field
measurement) rhe validated model was used to simulate various options of internal
shading devices and their effect on building energy consumption. Results of this
study show that internal shading devices do contribute as much as 31.3 percent of
energy saving annually by controlling solar admission into the building.
iv

ABSTRAK
Penggunaan tenaga elektrik secara effisien adalah penting bagi menjamin bekalan
sumber asli negara mencukupi untuk generasi yang akan datang. Menurut statistik
tahunan oleh Suruhanjaya Tenaga Malaysia, bangunan komersial seperti bangunan
pejabat adalah pengguna kedua terbesar tenaga elektrik di negara ini. Penggunaan
tingkap kaca yang besar telah dikenal pasti sebagai penyumbang utama beban
penyejukan oleh sistem penghawa dingin. Tingkap kaca ini membenarkan haba dari
sinaran matahari secara radiasi and konduksi ke dalam sesebuah bangunan. Ini
menyebabkan sistem penghawa dingin di dalam bangunan tersebut meggunakan
lebih tenaga elektrik bagi memastikan suhu di cialam bangunan mencapai paras yang
telah ditetapkan. Pusat Komersial Tabuan Height telah dijadikan model kajian
simulasi perisian dan datanya disahkan berciasarkan bacaan data lapangan. Model
kajian simulasi yang diakui sahih kemudiannya digunakan untuk menjalankan
pelbagai simulasi alat pelindung dalaman dan kesannya ke atas penggunaan tenaga
bangunan. Hasil ujikaji kajian menciapati alat pelindung cialaman menyumbang
sebanyak 31.3 peratus penjimatan tenaga tahunan melalui mengawal pancaran
cahaya matahari ke atas bangunan.
v

,..
PUjat KWdmat M umat Akademih VNlVERSm MALAYSIA SARAWAJ(
TABLE OF CONTENT
Content
APPROV AL LETTER
APPROVAL SHEET
TITLE PAGE
DEDICATION SHEET
ACKNOWLEGDEMENT
ABSTRACT
TABLE OF CONTENT
LIST OF TABLE
LIST OF FIGURE
CHAPTER 1. INTRODUCTION
1.1 Introduction
1.2 Energy Consumption
1.3 Energy Production
1.4 Environmental Issues
1.5 Aim and Objectives of Study
1.6 Structure of the Thesis
CHAPTER 2. LITERATURE REVIEW
2.1 Introduction
2.2 Energy Efficiency Policy and Building Codes
2.3 Factors Affecting Energy Consumption of Building.
2.4 Energy Efficiency and Human Comfort
2.5 Shading Devices and Their Impact on Thermal Condition
vi
Page
ii
iii
iv
vi
ix
x
1
3
5
7
8
9
II
12
15
27
29
2.5 Building Simulation Programme 31
2.6 Validation of Simulation Model 34
2.7 Summary 36
CHAPTER 3. METHODOLOGY
3.1 Introduction 38
3.2 Building Energy Simulation Software Selection 39
3.3 Methodology 41
3.4 Summary 50
CHAPTER 4. RESULTS AND DISCUSSION
PROGRAMME, ENERGYPLUS
4.1 Introduction 51
4.2 Description and Justification ofthe Selected Building 52
4.3 Building Simulation Model ofTabuan Height Commercial 56
Center
4.4 Field Measurements 58
4.5 Simulation of the Building Model 62
4.6 Validation of Building Simulation against Field 63
Measurements
4.7 Energy Conservation Opportunity 82
4.8 Summary 84
VB
CHAPTER 5. STUDY ON THE EFFECT OF INTERNAL
SHADING DEVICES ON BUILDING ENERGY
CONSUMPTION USING COMPUTER SIMULATION
5.1 Introduction 85
5.2 Input Data for Simulation 86
5.3 Effectiveness of Window Shading Devices on Building Cooling 88
Load
5.4 Integration of Window Blind and Daylighting Provision 98
5.5 Conclusion 110
CHAPTER 6 CONCLUSIONS AND RECCOMENDA nONS
6.1 Introduction 111
6.2 Optimum Distance from Glazing Area for Effective Energy 112
Consumption
6.3 Optimum Slat Angle for the Integration of Daylighting 114
6.4 Energy Conservation by Internal Shading Devices 115
6.5 Building Simulation Programme: EnergyPlus version 2.1 117
6.6 Factor Affecting Energy Consumption of the Office Building 118
6.7 Recommendation For Future Work 120
REFFERENCES 122
APPENDICES
Appendix I : Actual Weather Data 135
Appendix II : Glass Performance Data 137
Appendix III : Input Data for Chiller 139
viii

Appendix IV : Statistical Analysis 140
Appendix V : Internal Shading Devices Properties 143
Appendix VI : EnergyPlus Output Example 144
IX
....
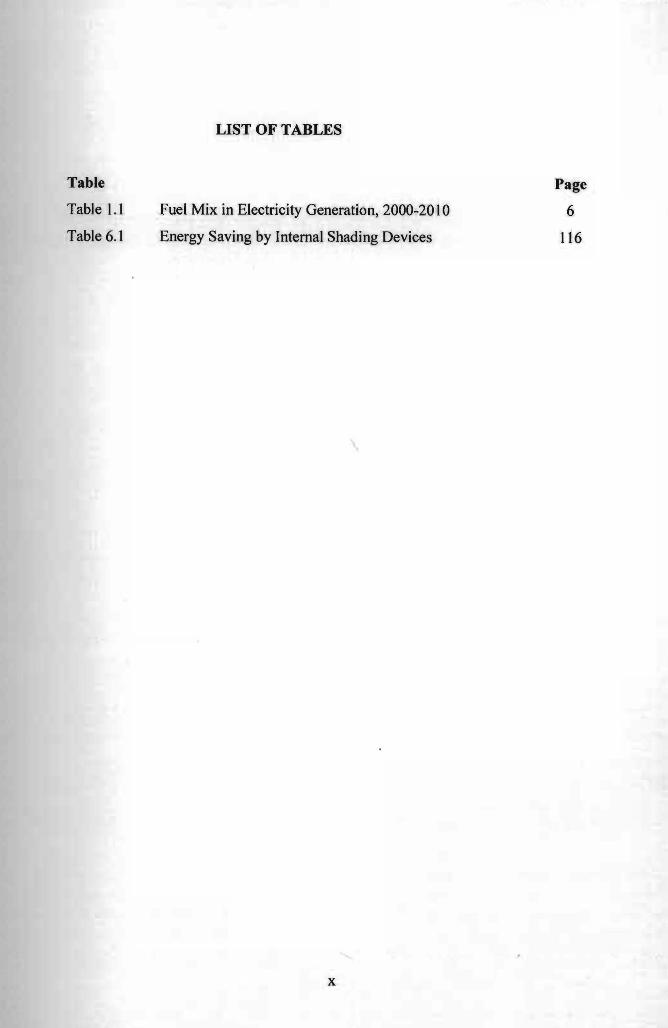
LIST OF TABLES
Table Page
Table 1.1 Fuel Mix in Electricity Generation, 2000-2010 6
Table 6.1 Energy Saving by Internal Shading Devices 116
:
x
-

,....
LIST OF FIGURES
Figure Page
Figure 1.1 Primary Energy Consumed in Office Building 4
Office Building
and Conduction
heat absorption.
building envelope
Indoor Temperature in Office Room A.
Indoor Temperature in Office Room B
on a Typical Day
Figure 2.1 Cooling Load Components for a Typical 930 m2 16
Figure 2.2 Solar Heat Gain through Glazing Area by Radiation 19
Figure 2.3 Whitewashing a dark wall reduces 60 percent of the 23
Figure 3.1 Flow Chart of Methodology 44
Figure 3.2 Data logger recorded thermal response of the 47
Figure 3.3 Thermocouples locations 47
Figure 3.4 Wattmeter Connected to the Chiller 48
Figure 4.1 View of the building from the East Fa~ade 55
Figure 4.2 The Experimental Room's Floor Plan 58
Figure 4.3 Office Room A 59
Figure 4.4 Office Room B 60
Figure 4.5 Thermocouple's Location 61
Figure 4.6 Comparisons between Measured and Simulated 64
Figure 4.7 Comparisons between Measured and Simulated 65
Figure 4.8 Indoor Temperature Performance of Office Room B 66
Figure 4.9 External Wall Surface Temperature of Office Room 68
B
xi
1II_..r---------~----------

Figure 4.10 External Wall Surface Temperature Performances of 70
Office Room B on a Typical Day
Figure 4.11 Thermal Response of Roof Component in Office 72
RoomB
Figure 4.12 Surface Roof Temperature Performances on a 73
Typical Day
Figure 4.13 Comparisons between Measured and
Indoor Temperature in Office Room A
Figure 4.14 Comparisons between Measured and
Indoor Temperature in Office Room B.
Figure 4.15 Comparisons between Measured and
Simulated 75
Simulated 76
Simulated 77
Energy Consumption of the Chiller in Office Room
B.
Figure 4.16 Energy Consumption of the Chiller in Office Room 78
B on a Typical Day
Figure 4.17 Comparisons between Indoor Measured 80
Temperature in Office Room A and Office Room B
when Internal Blind Applied on the Window
Figure 4.l8 Comparison oflndoor Temperature Performances of 81
Office Room A and Office Room B on a Typical
Day with Internal Blind Applied on Office Room
B's Glazing Area
Figure 5.1 Total Energy Consumption for the Tested Draperies 89
Figure 5.2 Total Energy Consumption for the Tested Various 91
Types of Window Shade
Figure 5.3 Total Energy Consumption for the Tested Various 92
Types of Window Blind
Figure 5.4 The Effect of STG distance on Energy Saving 94
Figure 5.5 The Effect of BTG distance on Energy Saving 96
xii

Figure 5.6 Locations of the Reference Points for Oaylighting 99
Illumination
Figure 5.7 The Integration of Slat Angle with Oaylighting 91
Illuminance Level at Reference Point 1
Figure 5.8 The Integration of Slat Angle with Oaylighting 102
Illuminance Level at Reference Point 2
Figure 5.9 The Integration of Slat Angle with Daylighting 102
Illuminance Level at Reference Point 3
Figure 5.10 Locations of the Installed Lighting Points and 105
Reference Points for Day Lighting
Figure 5.11 Total Energy Consumption's Breakdown for the 106
Tested Five Cases
Figure 5.12 Annual Energy Consumption and Total Building 108
Load for the Tested Five Cases
Figure 5.13 Annual Energy Saving for the Tested Five Cases 109
I
xiii
CHAPTER ONE
INTRODUCTION
1.1 Introduction
Commercial and residential buildings are estimated to consume approximately 36
percent of the world's primary energy (World Energy Outlook, 2008). Energy
consumption in buildings is generally high in industrialized countries, but comparatively
low in developing countries of Asia. However, over the past two decades, energy
consumption in commercia} and institutional buildings in Asia has grown rapidly,
particularly in the urban metropolitan centres of these developing countries (APEC
Outlook, 2006).
As Malaysia moves towards a developed country in 2020, energy requirements
will remain very severe as more buildings to be constructed while the supply source
(fossil fuel) for energy is expected to decline every y~ar (Lin el ai, 2006). At present,
almost half the energy consumption in the nation is consumed by the industrial,
residential and commercial sectors. Commercial buildings alone, accounts for about 13
percent of total energy consumption and 48 percent of electricity consumption (Abdul
Rahman, 2005). Malaysia current policy in developing knowledge-based economy to
reduce it dependency on the industrial sector, will result in increasing number of research
1
and learning institutions as well as office buildings. This means Malaysia has a strong
need and great potential to apply energy efficient strategies in lowering energy
consumption in buildings.
Saving energy usage in building requires cooperation. All parties induding
architects, engineers, interior designers and researchers play important roles to mold
ideas into the creation of energy efficient building. Often, aesthetical value and cost
barrier are the main reasons it is not being implemented in Malaysia. Modem architecture
favours buildings with large ratios of glazing to floor area allow uncontrollable solar
radiation that lead to inefficient energy consumption in a building (Tinker, 2002) and
(Ismail, 2004).
As transparent building becoming a popular trend in Malaysia, the large glazed
surface become the weak spot of the building as it was found to be the main elements that
contributes to high cooling load in office building (Ossama et ai, 1997). The answer often
is the installation of costly and energy consuming air conditioning units to provide
comfortable ambient working place in an office building. However, due to hot and humid
climate of Malaysia, the installation of air conditioning units in office building is
undeniable. Therefore, efficient gains by allowing certain amount of dayJighting but
reducing solar radiation emission in building are likely to provide the greatest energy
reduction and in many cases will be the most economical answer.
2 ·
_.18-------------~-

,.
Shading the glazing area is the most effective way to achieve good indoor climate
condition with minimal energy consumption. The significant of glazing area toward
energy consumption would be discussed in detailed in literature review. Two types of
solar shading devices are external and internal shading devices. Studies on the
effectiveness of external solar shading devices in Malaysia are widely reported (Ku
Hassan, 1996; Kamal, 1997 and Ossen et ai, 2005). In contrast, inadequate information
on the role of internal shading devices toward energy efficiency was found. Hence, this
study assesses the effectiveness of internal shading devices on energy saving in an office
building.
1.2 Energy Consumption
Depending on climatic condition, heating, cooling, lighting and office equipments
are essential purposes of which energy is required in office building. Air conditioning
systems are discovered to be the main consumer of energy in Malaysia's office building
(Bateni, 2004 and, Yusof and Mustapa, 2005). Studies on energy efficiency in office
buildings found that 61 percent of the building in this country is inefficient (Wee, 2003
and Malaysia Energy Centre, 2004). Efficiency in building is determined by the pattern
of energy use. The typical energy usage breakdown in office building of Malaysia is as
presented in Figure 1.1.
3

Primary Energy Consumed in Office Building
• Air Conditioning
16%
• Lighting
52% Office Equipmmts and others
Figure 1.1: Primary Energy Consumed in Office Building
(Source: Wee, 2003; Bateni, 2004; Malaysia Energy Centre, 2004; Yusofand Mustapa,
2005)
As shown in Figure 1.1, air conditioning system accounts for 52 percent of energy
consumed in office building. Advance researches have been conducted to increase the
efficiency of the air conditioning system. However, the efforts are not sufficient if the
source for high energy usage of the air conditioning system is not treated, which in this
case is uncontrollable heat gain from glazing area . . Therefore an energy conservation
strategy by addressing the stated problem is discussed in this study.
In Malaysia, the necessity of implementing an energy conservation programme
had been recognized from earlier five year period. In the Ninth Malaysia Plan, the
4
PII~at Khidmat MakJumal Akademik UNlVERSITI MALAY IA SARAWAK
government encourages the efficient usage of energy as it moderates the impact of
escalating fossil fuel on the economy and the environment.
1.3 Energy Production
The electricity supply industry in Malaysia was privati sed in 1990. There are
three main utilities in the country namely Tenaga Nasional Berhad (TNB), Sarawak
Electricity Supply Corporation (SESCo) and Sabah Electricity Sdn. Bhd. (SESB). The
power demand in 2006 was 14,557 MW, met by total generation capacity of 19,998 MW
(Malaysia Energy Commission, 2006)
Power producers in Malaysia used as much as. 70.2 percent of natural gas, 21.8
percent of coal, 2.2 percent of crude oil, 5.5 percent of hydro and 0.3 percent of other mix
such as biomass to generate electricity in 2005. However, the dependency on natural gas
in the generation mix is promised to be reduced in Malaysia Ninth Plan when the source
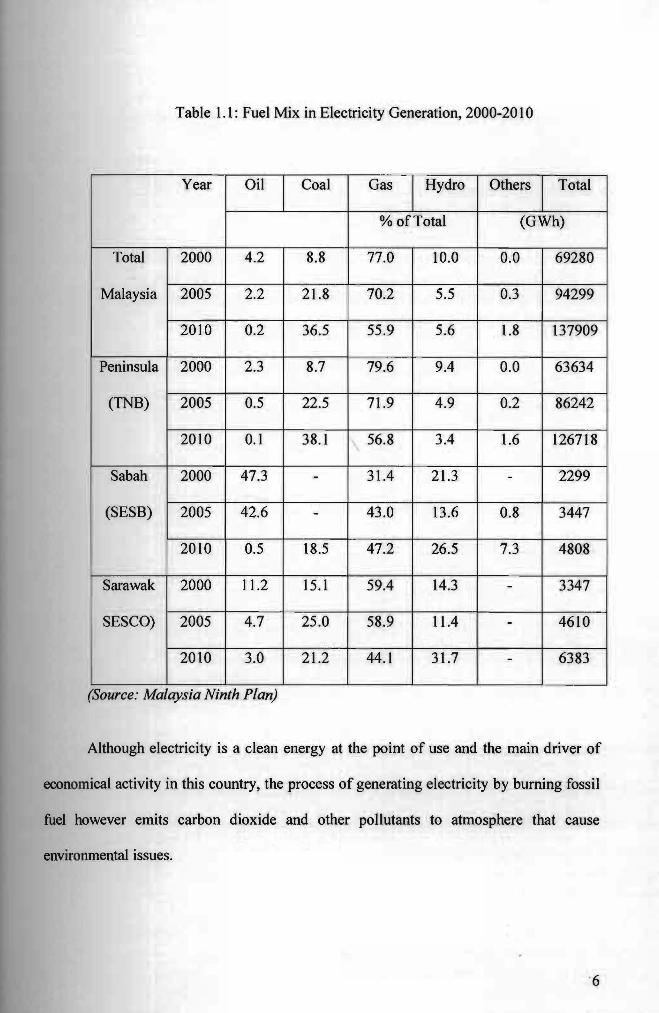
of fuel is further diversified with the increased used of coal. Table 1.1 presents the fuel
mix generation in Malaysia according to the ninth plan.
5
--------------------------------------- --
Table 1.1: Fuel Mix in Electricity Generation, 2000-20 I 0
Year Oil Coal Gas I
Hydro Others Total
% of Total (GWh)
Total
Malaysia
2000 4.2 8.8 77.0 10.0 0.0 69280
2005 2.2 21.8 70.2 5.5 0.3 94299
2010 0.2 36.5 55.9 5.6 1.8 137909 I
Peninsula
(TNB)
2000 2.3 8.7 79.6 9.4 0.0 63634
2005 0.5 22.5 71.9 4.9 0.2 86242
2010 0.1 38.1 56.8 3.4 1.6 1267 18
Sabah
(SESB)
2000 47.3 - 31.4 21.3 - 2299
2005 42.6 - 43.0 13.6 0.8 3447
2010 0.5 18.5 47.2 26.5 7.3 4808
Sarawak
SESCO)
2000 11.2 15.1 59.4 14.3 - 3347
2005 4.7 25.0 I 58.9 11.4 - 4610
2010 3.0 21.2 44.1 31.7 - 6383
(Source: Malaysia Ninth Plan)
Although electricity is a clean energy at the point of use and the main driver of
economical activity in this country, the process of generating electricity by burning fossil
fuel however emits carbon dioxide and other pollutants to atmosphere that cause
environmental issues.
6

1.4 Environmental Issues
Energy production and consumption places undeniable pressure on the
environment. Over the past 20 years, fossil fuel burning has produced approximately one
third of the increase in carbon dioxide from human activity (Pearson and Palmer, 2008).
Electricity sector in Malaysia is projected to produce 49 percent of carbon dioxide
emission for next 20 years followed by the transportation sector at 28 percent and
industry sector at 20 percent (APEC Outlook, 2006).
Damage to natural ecosystems and climatic changes are the current environmental
issues due high percentage of carbon dioxide in the atmosphere. Growing concern on the
rising amount of carbon dioxide in atmosphere has led to Kyoto Protocol in 1997 and has
entered into force in 2005. It ratifies by 178 countries and government entities including
Malaysia. Countries that ratify this protocol commit to reducing their emissions ofcarbon
dioxide and other greenhouse gases (GHG) such as methane, nitrous oxide,
hydrotlourocarbons and perfluorocarbons, or engaging in emissions trading if they
maintain or increase emissions of these green house gases.
Other environmental pressures from energy production and consumption include
wastes water contamination from mining, oil spills and discharges to marine waters, soil
damage from spills and leakages of liquid fuels, and impacts on ecosystems from the
construction and operation of large dams.
7

Thus, improving energy efficiency in a building will lead to double benefits to
reduce emissions of greenhouse gases (GHGs) and pollutants by reducing the
conswnption of fossil fuels and also the amount of energy consumed.
1.5 Aim and Objectives of Study
This research aims to evaluate the effectiveness of internal shading devices in the
reduction of energy consumption in an office building. Such an evaluation allows the
quantification of the energy saving that can be obtained by reducing the cooling load in
the building. To achieve the aims of the study, specific objectives are defined as listed
below:
a) To investigate the contribution of envelope thermal heat gain to energy
consumption of the office buildings.
b) To select and appropriately calibrate building simulation model in EnergyPlus
thus validate the EnergyPlus as reliable tool to predict the energy consumption
of buildings.
c) To determine the type of internal shading that provides the optimum energy
consumption in office building.
d) To investigate the distance of internal shading devices to window glass that
provides the optimum energy consumption.
8

I e) To investigate the impact of internal shading devices on day lighting as a
function to provide energy saving opportunities.
1.6 Structure of the Thesis
The thesis is presented in six chapters covering the background information,
literature review, field measurement, validation of the model based on actual office
building, simulation the proposed energy conservation strategies and finally, the
conclusions and recommendations.
Chapter 1 has presented the brief introduction to the problem under investigation
and stated the aim and objectives of the work.
Chapter 2 discusses the literature review of the factors affecting energy
consumption in a building and human comfort, and the related previous study on energy
simulation programme, Energy Plus.
Chapter 3 describes the methodology on co·nducting field measurement and
creating evaluation model to further investigate energy conservation strategies.
Chapter 4 presents the field measurement results for energy saving opportunities
and validating building energy programme, EnergyPlus.
9
------~
I
Chapter 5 evaluates the potential of internal shading devices for energy saving in
an office building. This chapter presents the simulation results and discusses energy
consumption of the office room when various parameters of internal shading devices
were tested.
Chapter 6 summarizes the research results and provides recommendations for
possible future work.
10