effect of internal branding strategiesijecm.co.uk/wp-content/uploads/2017/11/51131.pdf · internal...
TRANSCRIPT
International Journal of Economics, Commerce and Management United Kingdom Vol. V, Issue 11, November 2017
Licensed under Creative Common Page 521
http://ijecm.co.uk/ ISSN 2348 0386
EFFECT OF INTERNAL BRANDING STRATEGIES
ON POSTGRADUATE STUDENTS’ CHOICE OF
UNIVERSITIES IN NAKURU COUNTY, KENYA
Lydia Chepkoech Langat
School of Business and Economics, Kabarak University, Kenya
Robert Otuya
School of Business and Management Science, University of Eldoret, Kenya
Ronald Chepkilot
School of Business and Economics, Kabarak University, Kenya
Joel Koima
School of Computer Science and Bioinformatics, Kabarak University
Abstract
Internal Branding strategies can be used strategically by educational institutions. Universities’
are required to take aggressive stance in defining a unique position to attract students. This
study therefore examined the effect of Internal branding strategies and postgraduate students’
choice of Universities in Nakuru County, Kenya. The results indicate effective organization
culture is key in positioning the organization to prospective clients in this case prospective post
graduate students. Universities culture of ensuring that they hire professional employees who
are committed to universities, shared vision, have focus on institution set goals and values has
enhanced postgraduate students choice for universities through different internal branding
strategies in this case: Leadership styles, Organization culture and Employees. The study
© Langat, Otuya, Chepkilot & Koima
Licensed under Creative Common Page 522
adopted explanatory design in which opinions from post graduate students choices were
sought. The target population was 3,742 consisting of all postgraduate students in universities
in Nakuru county, Kenya. Proportionate stratified random sampling was used to allocate the
sample size 212 post graduate students in various universities. A structured questionnaire was
used to gather primary data from students. Descriptive statistics and inferential statistics
particularly chi2, correlation and regression were used to test the relationship between variables
under study whereas research hypotheses were tested at 0.05 significant levels. Internal
branding strategies employed by universities have a significant influence on postgraduate
students choice of universities, as evidenced by the statistically significant positive relationship
as shown in the overall regression model (β = 0.453, p<0.05).
Keywords: Internal Branding strategies, Post Graduate Students’ choice
INTRODUCTION
Internal Branding Strategies
Several studies have examined internal branding strategies as practiced by companies. For
example a Research study on internal branding with an online survey examined how
organizations view and implement internal branding practices. These Canadian marketers
presented it as „Internal Branding Best Practices Study. This was identified as one of the top
most issue. (Canadian Marketing Association, 2007).According to the research findings Internal
branding is a relatively new approach practiced by the companies of leading Canadian brands
thus giving that its application is relatively inconsistent across participating organizations. This
presents significant opportunity to the Canadian service industry with the ability to be more
attentive to branding and customer promise development which facilitates consistent delivery.
The study employed quantitative and qualitative research techniques. The qualitative research
consisted of eleven in-depth phone interviews with executives that are responsible for internal
branding within their organizations while quantitative research portion of this study was
managed through a CMA 2005 Internet survey of 475 respondents across industries. These
marketers described Internal branding within the survey as “promoting the company brand
values amongst employees. It is the set of strategic processes that align and empower
employees to deliver the appropriate customer experience in a consistent fashion. These
processes include, but are not limited to, internal communications, training support, leadership
practices, reward & recognition programs, recruitment practices and sustainability factors.

International Journal of Economics, Commerce and Management, United Kingdom
Licensed under Creative Common Page 523
Narissara (2010) in a study entitled “An investigation into the effects of internal branding on
employee brand support in Thai universities” states that in the context of higher education
institutions, employees play a crucial role in the internal branding process. Findings indicate
ambiguities surrounding internal branding in higher education. The study recommends a value
for higher education management and public policy makers in order to encourage academic
staff to support their university‟s brand. Tosti and Stotz, 2001; Mitchell, 2002; Vallaster and de
Chernatony, 2004; Hankinson, 2004; Aurand et al., 2005; Mosley, 2007 further asserts that
Internal branding is about aligning employee behaviour with brand values where employees
should have the same perceptions of the values embedded in the brand (de Chenatony,
2002)Internal branding strategies in this study focused on; leadership style, employees and
culture which were also reviewed.
Leadership Styles
Leadership practices and Employees in an organization is seen in a study conducted by
Jandaghi, Bahamin & Abaei, (2015) on the effects of brand leadership styles on employees -
based brand citizenship behavior Leadership Practices states that internal branding is a new
strategy to assure that employees act in accordance with brand commitment. He justifies this by
saying that in service organizations, employees are able to influence over customers‟ purchase
decisions and conceptions, they play a critical role in organizational success. Enhancing
employee – based brand citizenship behavior by managers can create a competitive advantage
for organization.
According to Ulrich and Smallwood (2007), stronger brand leaders will be shaped if the
behavior of organization‟s representatives is based on stakeholders‟ principles and demands.
Concerning organizational behavior, leadership is seen as an important behaviour affecting the
behavior of organizational members especially employees. Morhartet al (2009) suggested that
brand leadership style can be divided into two parts: Brand-specific Transactional Leadership
(BTSL): which is an approach of a leader to motivate its employees as the agents of company‟s
band and emphasizes on employees‟ mindset and brand-specific Transformational Leadership
(BTFL) where a leader to motivate its employees as the agents of company‟s band and
emphasizes on employees‟ personal values and beliefs. Similar to traditional leadership, both
brand leadership styles impact on organizational performance.
According to Morhart, Herzog, and Tomczak (2009), in their study on Brand-Specific
Leadership: Turning Employees into Brand Champions where they examined the mechanisms
by which brand-specific transactional and transformational leadership influence employees‟
brand-building behavior, the results show that brand-specific transactional leadership moderates
© Langat, Otuya, Chepkilot & Koima
Licensed under Creative Common Page 524
the influence of brand-specific transformational leadership in a nonlinear, inverse U-shaped
way, so that a medium level of transactional leadership maximizes the positive effects of
transformational leadership. In the other study the researcher addresses whether managers
can learn brand-specific transformational leadership. The research surveyed 269 customer-
contact employees show that brand-specific transactional leaders influence followers through a
process of compliance, leading to an increase in turnover intentions and a decrease in in-role
and extra-role brand-building behaviors. In contrast, brand-specific transformational leaders
influence followers through a process of internalization, leading to a decrease in turnover
intentions and an increase in in-role and extra-role brand-building behaviors. In turn, both
processes are mediated by employees‟ perceptions of autonomy, competence, and relatedness
with regard to their work roles as brand representatives. Moreover, in their field experiment
shows that brand-specific transformational leadership can indeed be learned through
management training. Management development programs; senior team personal site visits;
Employee rating of leaders through regular performance reviews (Canadian Marketing
Association, 2007).
According to Hackman and Wageman (2007) they suggested that different leaders can
behave in their own unique manner and still achieve effective leadership results. Mulford (2006)
research conducted between 1996 and 2005, Leithwood and Jantzi (2005) confirm three of their
four sets of transformational leadership practices of helping people, setting directions and
redesigning the organisation. In addition, they conclude that evidence about transformational
leadership effects on organizational effectiveness, student outcomes and student engagement
in school which are all positive (although with decreasing amounts of supporting evidence as
one moves through the three areas) creating the conditions, opportunities and experiences for
collaboration and mutual learning”.
Employees
Employer branding integrates the previously separate policies and procedures of marketing and
human resources to create a new unique blend within the organization. Within the context of
internal branding processes, employer branding regards current and potential employees as
branding targets (Edwards, 2009). Sartain and Schumann (2006) define a employer brand as
how a business builds and packages its identity, from its origins and values, what it promises to
deliver to emotionally connect employees so that they in turn deliver what the business
promises to customers. It has been shown that the advantages to a strong employer brand are
that it will not only attract new employees but also generate satisfaction, affinity, and loyalty for
current employees (Davies, 2008).
International Journal of Economics, Commerce and Management, United Kingdom
Licensed under Creative Common Page 525
A consistent voice must be established through internal communications that can help create
and maintain the employee commitment, shared vision, loyalty, and satisfaction (Punjaisri&
Wilson, 2007). This requires a unified effort within the organization. Literature suggests that an
important element of an employer brand is establishing employee commitment. In relation to the
discussion on developing employee emotional connections it is shown that the emotional capital
of an organization is increased by more committed employees (Thomson et al, 1999).Through
their study of the retail banking industry in UK, Pasolomou and Vrontis (2006) propose four
elements to enhance the effectiveness of internal branding. Recognizing the central role of
employees in building and differentiating their corporate brand, the first element is about viewing
employees as internal customers and hence reinforcing practices that enable internal customer
satisfaction, motivation and retention. In order to enable the internal customer element, the
authors propose training and development programmesas the second element to create
knowledge and understanding among staff of how their attitudes and behaviour towards
customers form an integral part of the overall service offering and hence shape employee
behaviors to develop a strong service mentality that will pervade the entire organization. The
third element internal standards urge organizations to set high standards of on-brand
performance and equip employees in order to enable them to meet and exceed these standards
of performance. The fourth and final element rewards emphasizes on the need to establish
rewards systems rewards system which instill confidence and elicits that extra energy that
individuals voluntarily invest towards the success of the organization‟s brand.
Employee behaviour has been identified as of paramount importance and strongly
influential in shaping consumer perceptions of their most and least preferred service brands.
Therefore it can be reasonably argued that the same attention to branding should be directed
internally to employees as is currently directed externally to potential customers since it is at the
intersection of service providers and customers that brand meaning is realized (De
Chernatony& Segal-Horn, 2003; Elliot & Percy, 2007; Judson, Aurand, Gorchels, & Gordon,
2009).
Organization Culture
Organizational culture should only relate to the "deeper" less visible level, although it does use
visible evidence to understand and describe different cultures. The visible aspects encompass
behaviour patterns, the physical and social environment and the written and spoken language
used by the group (Schein's 1990). Kotter&Heskett (1992) explained that culture evolves as a
result of the turnover of group members, changes in the company's market environment and
general changes in society. According to Low and Mohr (2000) organization culture is an
© Langat, Otuya, Chepkilot & Koima
Licensed under Creative Common Page 526
important combination of character, behavior and a self-identification of human being, these
characteristics help an individual to create his or her own buying behavior, and however,
isolating culture as a variable that can be studied and readily implanted is very difficult, taking
into consideration that the buying behaviors of human beings consist of three phases which are
the individual, societal and situational. Low and Mohr (2000) further state that culture affects all
these phases but the extent of the effect depends on the individual person and the
circumstance. Culture consists of beliefs, values and customs that serve to direct consumer
behavior differently amongst the members of a particular group or society Values and beliefs
are guides to behavior in such that they form and affect attitude on how to behave on certain
situations, on the other hand customs are modes of behavior that constitute an acceptable way
to behavior in a particular culture.
Wilkins and Ouchi (1983) quoted a number of examples of organizations claiming to
experience great distress because the culture could not be changed or because its members
would not change fast enough. Hatch and Schultz (2000) depend on a successful and balanced
interplay between corporate image, corporate culture and corporate vision. In brand related
narratives, the question of identity is reflected at different levels. Culture has recently been
conceptualized as a factor in shaping a company's image in the marketplace. Corporate image
is an overall perception of the company held by different segments of the public (Villanova,
Zinkhan& Hyman, 1990). Universities‟ represents the erosion of the traditional role that is based
on scholarship and education to a role many worry is based on the broad acceptance of
business ideologies and which reduces the role of higher education to not much more than an
economic function. Criticisms argued there are consequences to the broad adoption of
business ideologies and accountability measures as it unfairly leads to a devaluation and
erosion of liberal arts programming as these subjects rely more heavily on intangible skills which
are much more difficult to quantify(Anderson, 2008; Deem & Brehony, 2005; Dill, 2012).
In a study conducted by Watson (2001) he greatly stated that if the culture is not
hospitable to learning then student achievement can suffer. Lunenburg and Ornstein (2004)
described organizational climate as the total environ-mental quality within an organization and
believe that the recent attention to the effectiveness of public schools and their cultures has
shed more interest on the importance of climate. The relationship between culture and climate
was supported by Schein (1985, 1996) when he stated that norms, values, rituals and climate
are all manifestations of culture.
Mortimore (2001) further warns that firms should concentrate on establishing more
knowledge about the complex interactions between culture and schooling. In a study by
Lakomski (2001) he claims that it is necessary to change an organization‟s culture in order to
International Journal of Economics, Commerce and Management, United Kingdom
Licensed under Creative Common Page 527
bring about organizational change and concluded that there is a causal relationship between the
role of the leader and organizational learning. Pringle (2014) revealed how institutions and
faculty members within them respond to these forces is also directly influenced by contextual
factors like heritage and geographic location, and these contextual factors lead to specific
perceptions with respect to how they assess and choose to respond to branding practices at
universities and the authenticity of specific brand elements.
General Research Objective
To examine the effect of internal branding strategies on postgraduate students‟ choice of
Universities Nakuru County, Kenya.
Specific Research Objectives
In achieving the main objective, the study was guided by the following specific objectives:
i. To examine the effect of leadership styles on post graduate students‟ choice of
universities.
ii. To examine the effect of employees on post graduate students‟ choice of universities.
iii. To assess effect of organization culture on post graduate students‟ choice of
universities.
Research Hypotheses
HO1: There is no significant effect of leadership styles on post graduate students‟ choice of
universities.
HO2: There is no significant effect of employees on post graduate students‟ choice of universities
HO3: There is no significant effect of organization culture on post graduate students‟ choice of
universities
RESEARCH METHODOLOGY
The study employed explanatory research design. According to Easterby-Smith, Thorpe and
Jackson (2008), research design is the way the research is organized, how evidence will be
gathered, where the evidence will be found and how the evidence will be interpreted.
Study Area
Nakuru County is located in the former Rift Valley Province of Kenya, about 90km from Nairobi.
Nakuru is an agriculturally-rich county blessed with various tourist attractions such as craters
and lakes. It is made up of 11 constituencies. Nakuru borders seven counties; Laikipia to the
© Langat, Otuya, Chepkilot & Koima
Licensed under Creative Common Page 528
northeast, Kericho to the west, Narok to the south-west, Kajiado to the south, Baringo to the
north, Nyandarua to the east and Bomet to the west. It covers an area of 7496.5 square
kilometers. Nakuru County is home to 1, 603, 325 people (male – 50.2% and female – 49.8%),
according to the 2009 National Census. It is a cosmopolitan county, with its population
originating from all the major tribes of Kenya. Universities and other institutions of higher
learning in the county include Egerton University, Mt Kenya University Campus, Kabarak
University, Kenya Methodist, Kenyatta University, Jomo-Kenyatta University of Science and
Technology, University of Nairobi Extra Mural, St. Pauls University and Moi University. The
study will only concentrate on the universities in Nakuru County.
Target Population
This study focused on all post graduate students admitted in the university both in the public
and private sector in Nakuru County, Kenya. The target population of the study included all
students irrespective of the courses chosen. University‟s post graduate students are always
tasked with the responsibility of choosing courses offered by universities in relation to
marketability and career path progression and as such formed the best target population for this
study.
Sampling Design
Purposive sampling was used to select the universities in Nakuru County. The method was for
sampling the respondents (post graduate students) who were expected to provide information
on universities‟ choice. The purpose of sampling was to secure a representative group
(Mugenda, 2008). Burns & Grove (2003), refer to sampling as a process of selecting a group of
people, events or behavior with which to conduct a study. The sample for the study was
designed to produce a representation of the university post graduate students both in public
universities and private universities in Nakuru County, Kenya. To arrive at a sample size, the
study adopted a formula by Nassiuma (2000) for estimating a sample size, n, from a known
population size, N and a coefficient of variation (C.V) which range between 21%s and 30% (i.e.
21%<e<30%) and error between 5% and 1 % (1%<e<5%).
Where
n = optimum sample size;
N = population size;
C = coefficient of variation and e is error margin.
International Journal of Economics, Commerce and Management, United Kingdom
Licensed under Creative Common Page 529
Substituting these values in the equation, estimated sample size (n) was:
n=3,732*0.32 / {0.32 + (3,732-1)0.022}
n= 212
Research Instruments
The study used structured questionnaires that were distributed to all the continuing university
students randomly irrespective of the courses they are undertaking involved in the sample.
Primary data was collected through semi structured self-administered questionnaires.
Secondary data was gathered from existing credible and recognized source.
Data Analysis Approach
Hypothesis Independent
Variable
Dependent
Variable
Statistics
Internal Branding Strategies has
no significant effect on students
choice of post graduate programs
in Nakuru County.
Internal Branding
Strategies
Student choice of
post graduate
programmes
Percentage,
Frequencies, Chi-
Square, ANOVA,
Pearson‟s Correlations
ANALYSIS AND RESULTS
Cross tabulation results
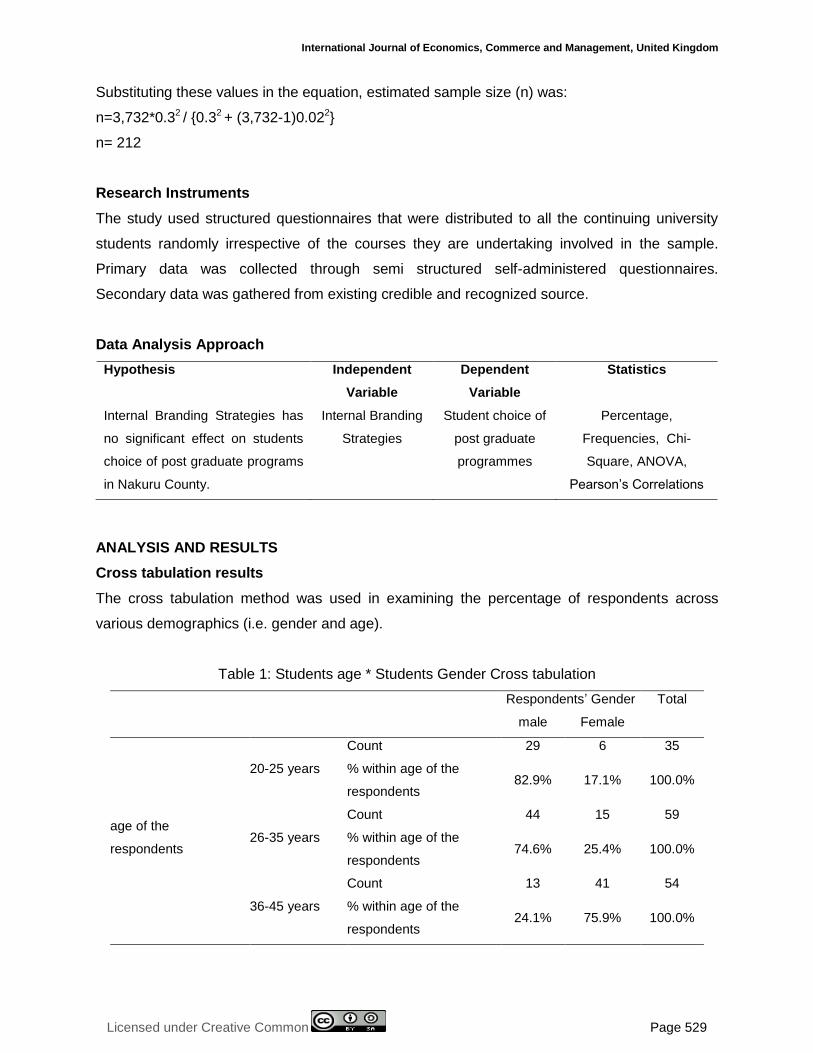
The cross tabulation method was used in examining the percentage of respondents across
various demographics (i.e. gender and age).
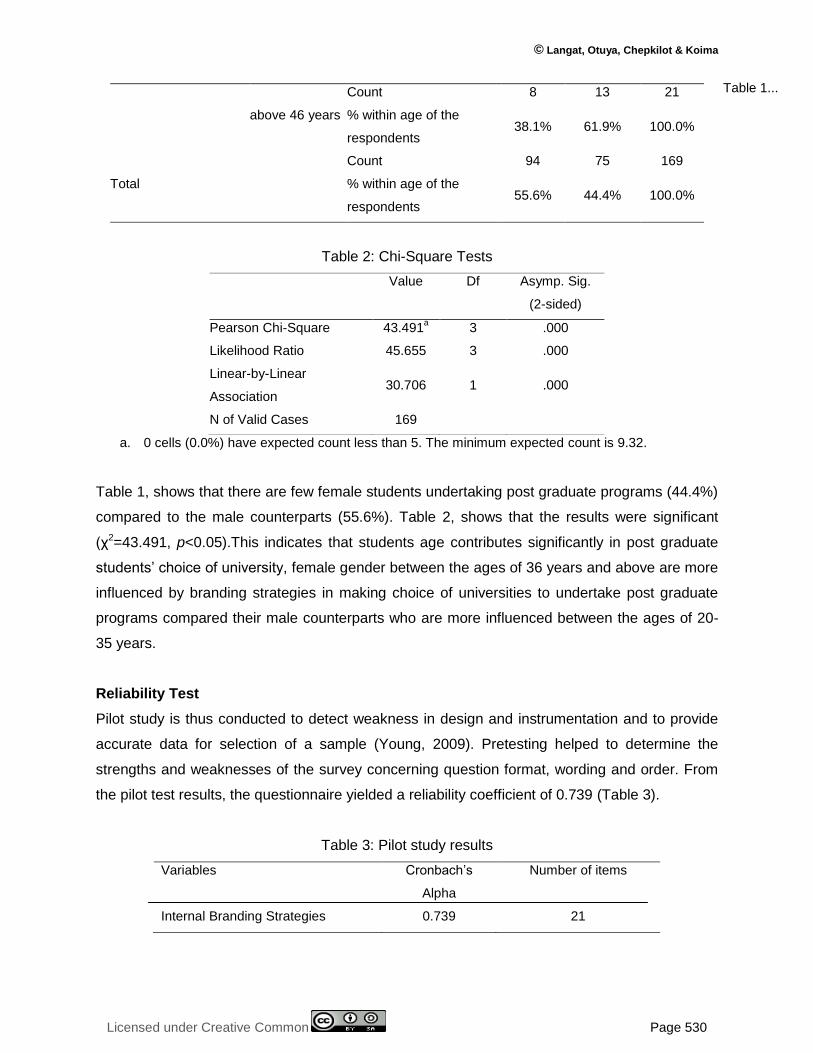
Table 1: Students age * Students Gender Cross tabulation
Respondents‟ Gender Total
male Female
age of the
respondents
20-25 years
Count 29 6 35
% within age of the
respondents 82.9% 17.1% 100.0%
26-35 years
Count 44 15 59
% within age of the
respondents 74.6% 25.4% 100.0%
36-45 years
Count 13 41 54
% within age of the
respondents 24.1% 75.9% 100.0%
© Langat, Otuya, Chepkilot & Koima
Licensed under Creative Common Page 530
above 46 years
Count 8 13 21
% within age of the
respondents 38.1% 61.9% 100.0%
Total
Count 94 75 169
% within age of the
respondents 55.6% 44.4% 100.0%
Table 2: Chi-Square Tests
Value Df Asymp. Sig.
(2-sided)
Pearson Chi-Square 43.491a 3 .000
Likelihood Ratio 45.655 3 .000
Linear-by-Linear
Association 30.706 1 .000
N of Valid Cases 169
a. 0 cells (0.0%) have expected count less than 5. The minimum expected count is 9.32.
Table 1, shows that there are few female students undertaking post graduate programs (44.4%)
compared to the male counterparts (55.6%). Table 2, shows that the results were significant
(χ2=43.491, p<0.05).This indicates that students age contributes significantly in post graduate
students‟ choice of university, female gender between the ages of 36 years and above are more
influenced by branding strategies in making choice of universities to undertake post graduate
programs compared their male counterparts who are more influenced between the ages of 20-
35 years.
Reliability Test
Pilot study is thus conducted to detect weakness in design and instrumentation and to provide
accurate data for selection of a sample (Young, 2009). Pretesting helped to determine the
strengths and weaknesses of the survey concerning question format, wording and order. From
the pilot test results, the questionnaire yielded a reliability coefficient of 0.739 (Table 3).
Table 3: Pilot study results
Variables Cronbach‟s
Alpha
Number of items
Internal Branding Strategies 0.739 21
Table 1...
International Journal of Economics, Commerce and Management, United Kingdom
Licensed under Creative Common Page 531
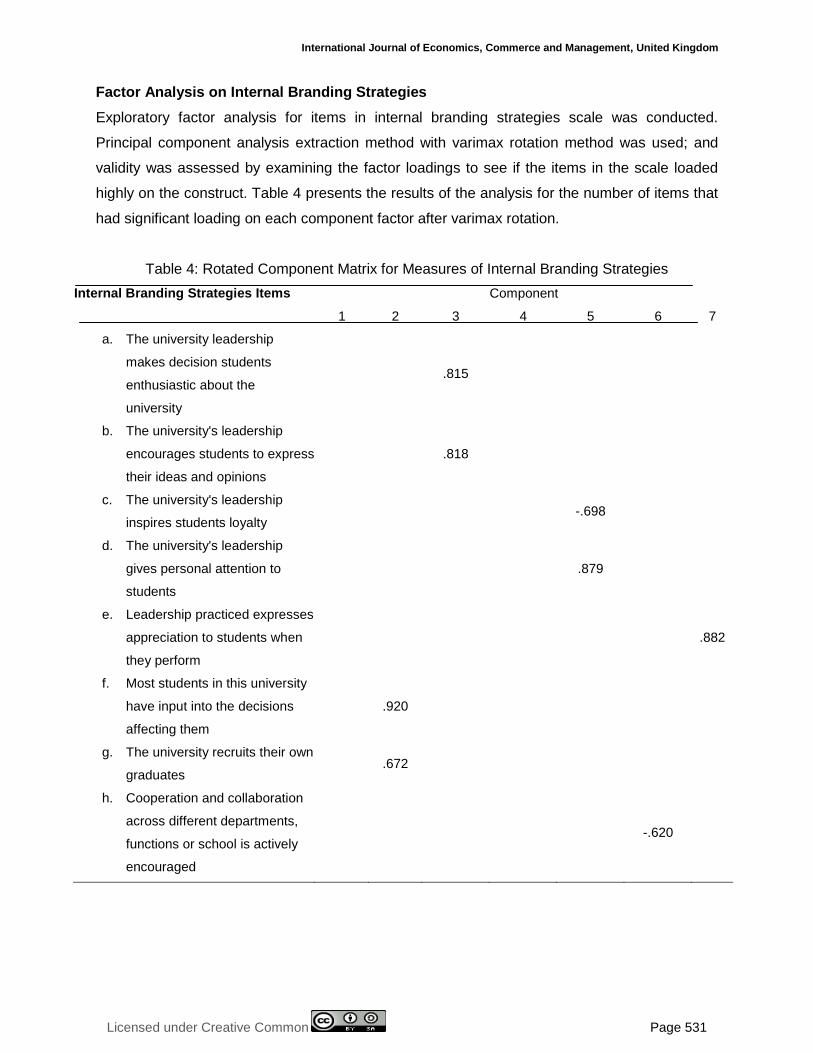
Factor Analysis on Internal Branding Strategies
Exploratory factor analysis for items in internal branding strategies scale was conducted.
Principal component analysis extraction method with varimax rotation method was used; and
validity was assessed by examining the factor loadings to see if the items in the scale loaded
highly on the construct. Table 4 presents the results of the analysis for the number of items that
had significant loading on each component factor after varimax rotation.
Table 4: Rotated Component Matrix for Measures of Internal Branding Strategies
Internal Branding Strategies Items Component
1 2 3 4 5 6 7
a. The university leadership
makes decision students
enthusiastic about the
university
.815
b. The university's leadership
encourages students to express
their ideas and opinions
.818
c. The university's leadership
inspires students loyalty -.698
d. The university's leadership
gives personal attention to
students
.879
e. Leadership practiced expresses
appreciation to students when
they perform
.882
f. Most students in this university
have input into the decisions
affecting them
.920
g. The university recruits their own
graduates .672
h. Cooperation and collaboration
across different departments,
functions or school is actively
encouraged
-.620
© Langat, Otuya, Chepkilot & Koima
Licensed under Creative Common Page 532
i. There is high level of
agreement about the way
students do things in this
university
.775
j. University is very responsive
and adapts to changes easily .892
k. University ensures Students are
well informed about policy
changes ( for example CUE
regulations)
.828
l. University has a long-term
purpose and direction .726
m. There is a shared vision of what
the university would be like in
the future
.866
n. Institution holistically nurtures
students .714
o. The university teaching staff
have the required qualifications .623
p. Employees have self initiation
activities that are beneficial to
students
.744
q. Employees provide feedback
on inquiries timely
r. Employees have collective
focus on institution set goals,
objectives and values
.646
s. Employees have enough
knowledge to deliver assigned
responsibilities
.732
t. Employees positively
communicate about the
university
.697
Extraction Method: Principal Component Analysis. Rotation Method: Varimax with Kaiser Normalization.
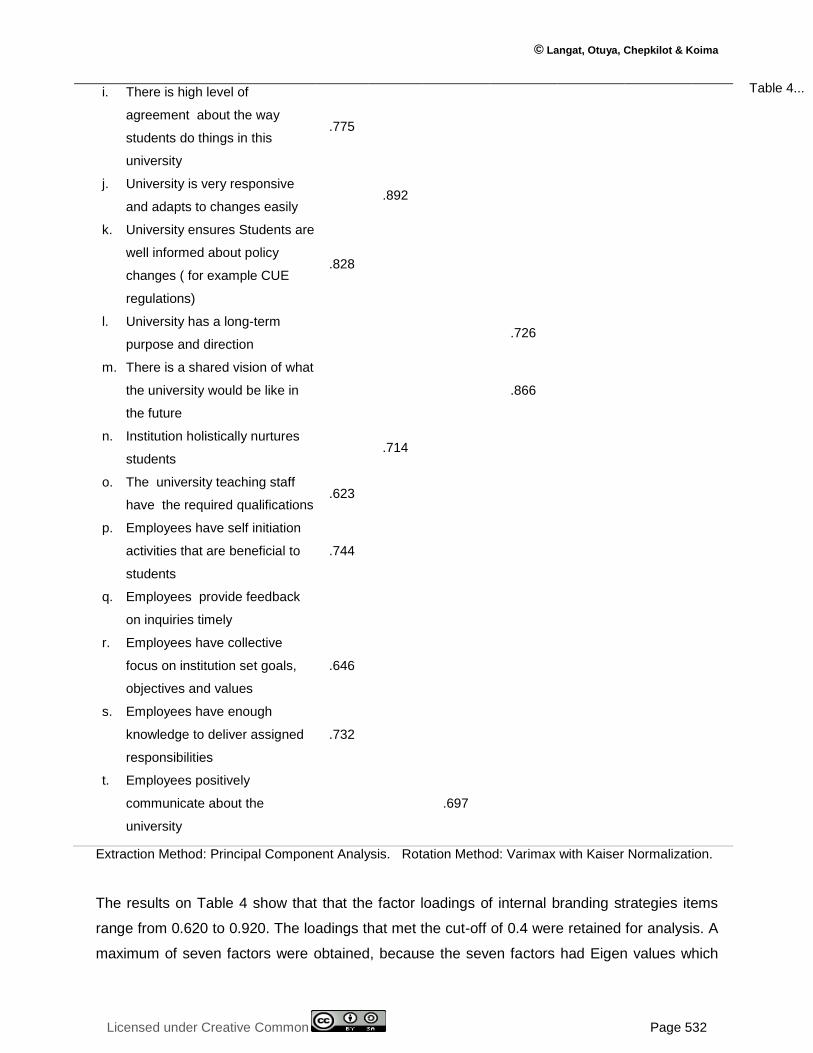
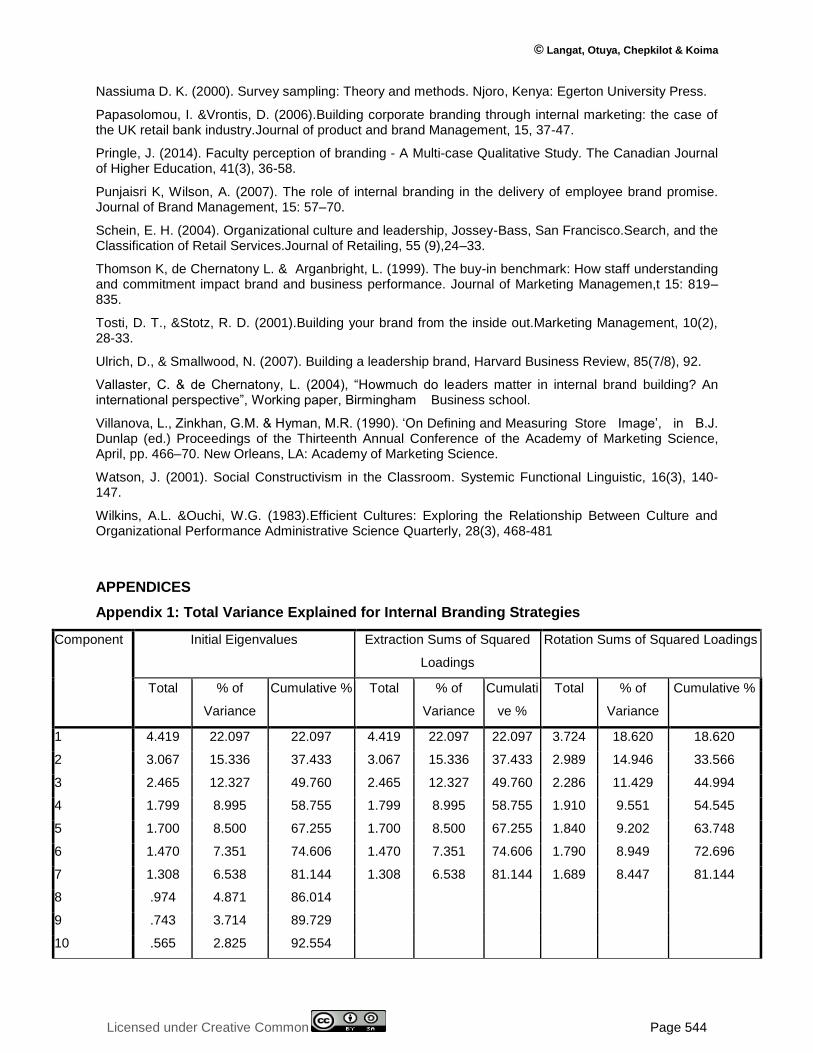
The results on Table 4 show that that the factor loadings of internal branding strategies items
range from 0.620 to 0.920. The loadings that met the cut-off of 0.4 were retained for analysis. A
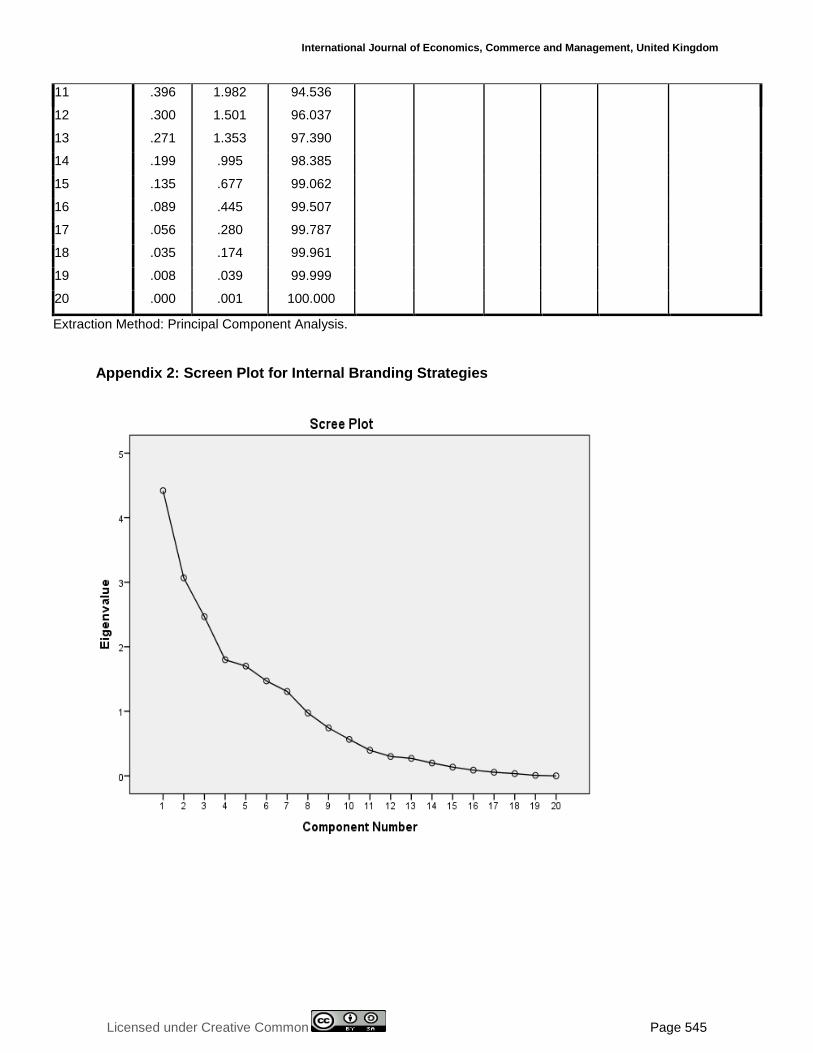
maximum of seven factors were obtained, because the seven factors had Eigen values which
Table 4...

International Journal of Economics, Commerce and Management, United Kingdom
Licensed under Creative Common Page 533
are greater than one and their extraction sums of squared loadings are greater than 1. Factor 1
had the highest extraction sums of squared loadings of 4.419, which represents 22.097 percent
of variation. Factor 7 had the lowest extraction sums of squared loadings of 1.308 representing
6.538 percent of variance. The extraction sums of squared loadings of other factors were
between the range of 4.419 and 0.000. The contributing power of these other factors to the
explanation of the variance in the variables was significantly considered. The factors account for
81.144 percent of the variance in the construct (Appendix 1).
Multicollinearity Test
Multicollinearity means that there is linear relationship between explanatory variables which may
cause the regression model biased (Gujarati, 2003). VIF is a statistic calculated for each
variable in the model to test Multicollinearity. Theoretically, a VIF greater than 5 may suggest
that the concerned variable is multi-collinear with others in the model and may need to be
excluded from the model (Gujarati, 2003). Hence, as presented on Table 5, the VIF results
indicate there was no collinearity in the explanatory variables. Moreover a tolerance of greater
than 0.2 indicates nonexistence of multicollinearity. Tolerance and VIF results indicate there
was no collinearity in the explanatory variables.
Table 5: Multicollinearity Test
Model Collinearity Statistics
Tolerance VIF
Internal branding strategy .501 1.997
a. Dependent Variable: students‟ choice of post graduate programs
Internal Branding Strategies
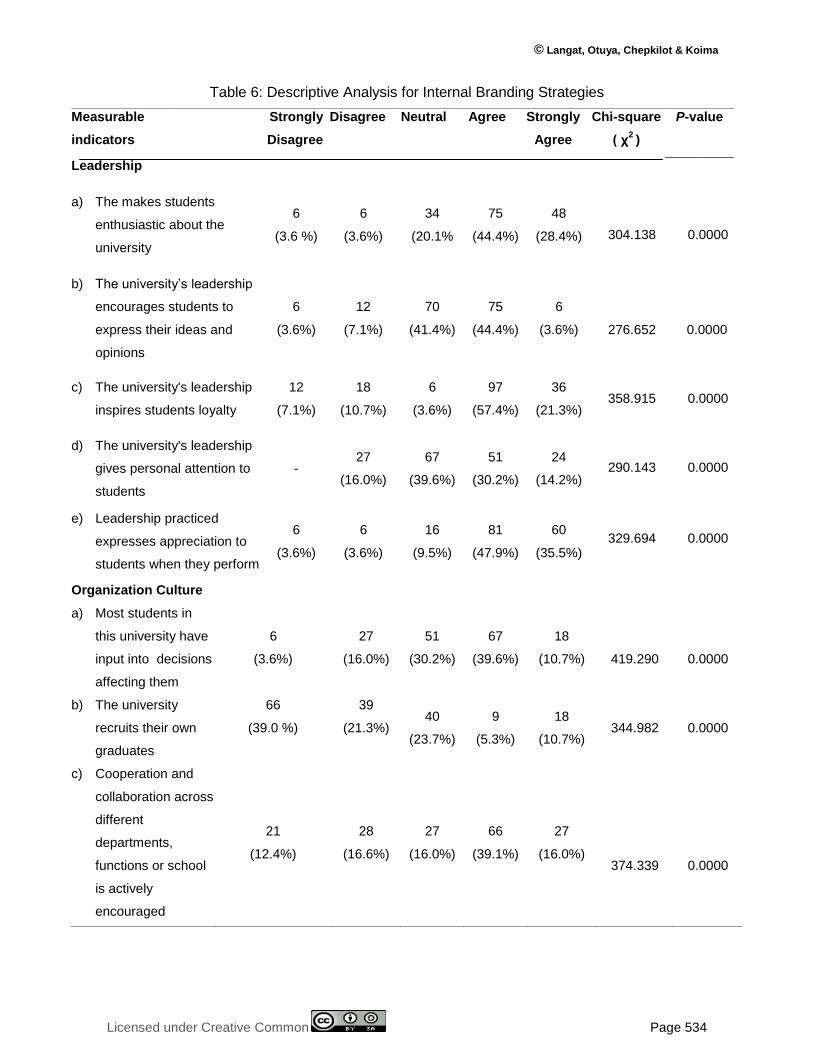
Respondents were asked to indicate the extent to which they agreed with internal branding
strategies statements in influencing choice of post graduate programs. The measurable
indicators were ranked on a 5-point Likert-type scale, ranging from „strongly disagree‟ (1) to
„strongly agree‟ (5).
The responses were analyzed using frequencies and percentages. Chi-square values for
measured indicators were also determined with respective probability values (p-value). Table 6
presents the results of the analysis.
© Langat, Otuya, Chepkilot & Koima
Licensed under Creative Common Page 534
Table 6: Descriptive Analysis for Internal Branding Strategies
Measurable
indicators
Strongly
Disagree
Disagree Neutral Agree Strongly
Agree
Chi-square
( χ2 )
P-value
Leadership
a) The makes students
enthusiastic about the
university
6
(3.6 %)
6
(3.6%)
34
(20.1%
75
(44.4%)
48
(28.4%)
304.138
0.0000
b) The university‟s leadership
encourages students to
express their ideas and
opinions
6
(3.6%)
12
(7.1%)
70
(41.4%)
75
(44.4%)
6
(3.6%)
276.652
0.0000
c) The university's leadership
inspires students loyalty
12
(7.1%)
18
(10.7%)
6
(3.6%)
97
(57.4%)
36
(21.3%)
358.915
0.0000
d) The university's leadership
gives personal attention to
students
- 27
(16.0%)
67
(39.6%)
51
(30.2%)
24
(14.2%)
290.143
0.0000
e) Leadership practiced
expresses appreciation to
students when they perform
6
(3.6%)
6
(3.6%)
16
(9.5%)
81
(47.9%)
60
(35.5%)
329.694
0.0000
Organization Culture
a) Most students in
this university have
input into decisions
affecting them
6
(3.6%)
27
(16.0%)
51
(30.2%)
67
(39.6%)
18
(10.7%)
419.290
0.0000
b) The university
recruits their own
graduates
66
(39.0 %)
39
(21.3%)
40
(23.7%)
9
(5.3%)
18
(10.7%)
344.982
0.0000
c) Cooperation and
collaboration across
different
departments,
functions or school
is actively
encouraged
21
(12.4%)
28
(16.6%)
27
(16.0%)
66
(39.1%)
27
(16.0%)
374.339
0.0000
International Journal of Economics, Commerce and Management, United Kingdom
Licensed under Creative Common Page 535
d) There is high level
of agreement about
the way students do
things in this
university
57
(33.7%)
52
(30.8%)
24
(14.2%)
18
(10.7%)
18
(10.7%)
276.578
0.0000
e) University is very
responsive and
adopts to changes
easily
6
(3.6%)
49
(29.0%)
81
(47.9%)
18
(10.7%)
15
(8.9%)
436.266
0.0000
f) University ensures
students are well
informed about
policy changes ( for
example CUE
regulations)
30
(17.8%)
27
(16.0%)
46
(27.2%)
54
(32.0%)
12
(7.1%)
251.080
0.0000
g) University has a
longterm purpose
and direction
12
(7.1%)
27
(16.0%)
82
(48.5%)
42
(24.9%)
6
(3.6%)
446.880
0.0000
h) There is a shared
vision of what the
university would be
like in the future
6
(3.6%) -
45
(26.6%)
61
(36.1%)
57
(33.7%)
215.362
0.0000
i) Institution
holistically nurtures
students
6
(3.6%)
12
(7.1%)
63
(47.3%)
52
(20.8%)
36
(21.3%)
355.050
0.0000
Employees
a) The university
teaching staff have
the required
qualifications
- 18
(10.7%)
42
(24.9%)
73
(43.2%)
36
(21.3%)
277.612
0.0000
b) Employees have
self-initiation
activities that are
beneficial to
students
6
(3.6%)
9
(5.3%)
43
(25.4%)
69
(40.8%)
42
(24.9%)
338.876
0.0000

© Langat, Otuya, Chepkilot & Koima
Licensed under Creative Common Page 536
c) Employees provide
feedback on
inquiries timely
6
(3.6%)
24
(14.2%)
66
(39.1%)
55
(32.5%)
18
(10.7%)
311.245
0.0000
d) Employees have
collective focus on
institution set goals,
objectives and
values
24
(14.2%)
12
(7.1%)
27
(16.0%)
64
(37.9%)
42
(24.9%)
358.955
0.0000
e) Employees have
enough knowledge
to deliver assigned
responsibilities
18
(10.7%)
22
(13.0%)
45
(26.6%)
54
(32.0%)
30
(17.8%)
369.817
0.0000
f) Employees
positively
communicate about
the university
6
(3.6%)
16
(9.5%)
78
(46.2%)
18
(10.7%)
51
(30.2%)
348.239
0.0000
Leadership as an internal branding strategy
Universities‟ leadership makes students enthusiastic about the university (χ2=304.138, p<0.05),
with the leadership encouraging students to express their ideas and opinions agreed by 44.4%
with a 41.4% of respondents holding a neutral opinion (χ2=276.652, p<0.05). The leadership
also inspires students loyalty (χ2=358.915, p<0.05), gives personal attention to students
(χ2=290.143, p<0.05). Leadership practiced in universities expresses appreciation to students
when they perform (χ2=329.694, p<0.05).
The study findings agree with those of Özer and Tnaztepe (2014) who in their article
“Effect of Strategic Leadership Styles on Firm Performance” in SMEs in Turkey noted that
transformational leadership style is relationship-oriented and are significantly related to firm
performance. The study further agree with those of Ulrich and Smallwood, (2007) who states
that stronger brand leaders will be shaped if the behavior of organization‟s representatives is
based on stakeholders‟ principles and demands. They further suggest that concerning
organizational behavior, leadership is seen as an important behaviour affecting the behavior of
organizational members especially employees.
The study findings also concur with those of Kim (2004) who in his article “Leadership
Style and National Culture on Restaurant Employees‟ Affective Commitment who noted that is
of the view that the kind of leadership style exhibited by managers to a large extent influences
International Journal of Economics, Commerce and Management, United Kingdom
Licensed under Creative Common Page 537
organizational valued outcomes such as low employee turnover, reduced absenteeism,
customer satisfaction, and organizational effectiveness. He further asserts that transformational
leadership style improves employee dedication, social behavior, role clarity, and satisfaction
(Gill &Mathur, 2007).
The study findings further concurs with those of Mulford (2006), Leithwood and Jantzi
(2005) who confirms that transformational leadership practices of helping people, setting
directions and redesigning the organization brings about organizational effectiveness, student
outcomes and student engagement in school.
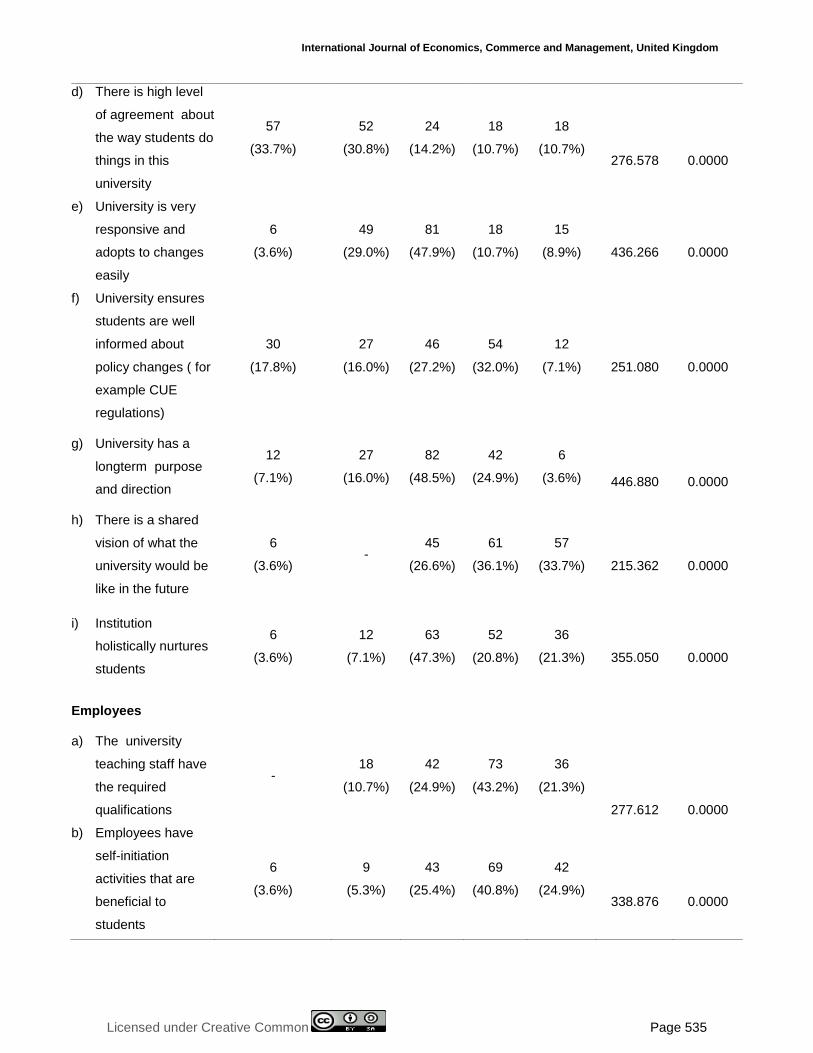
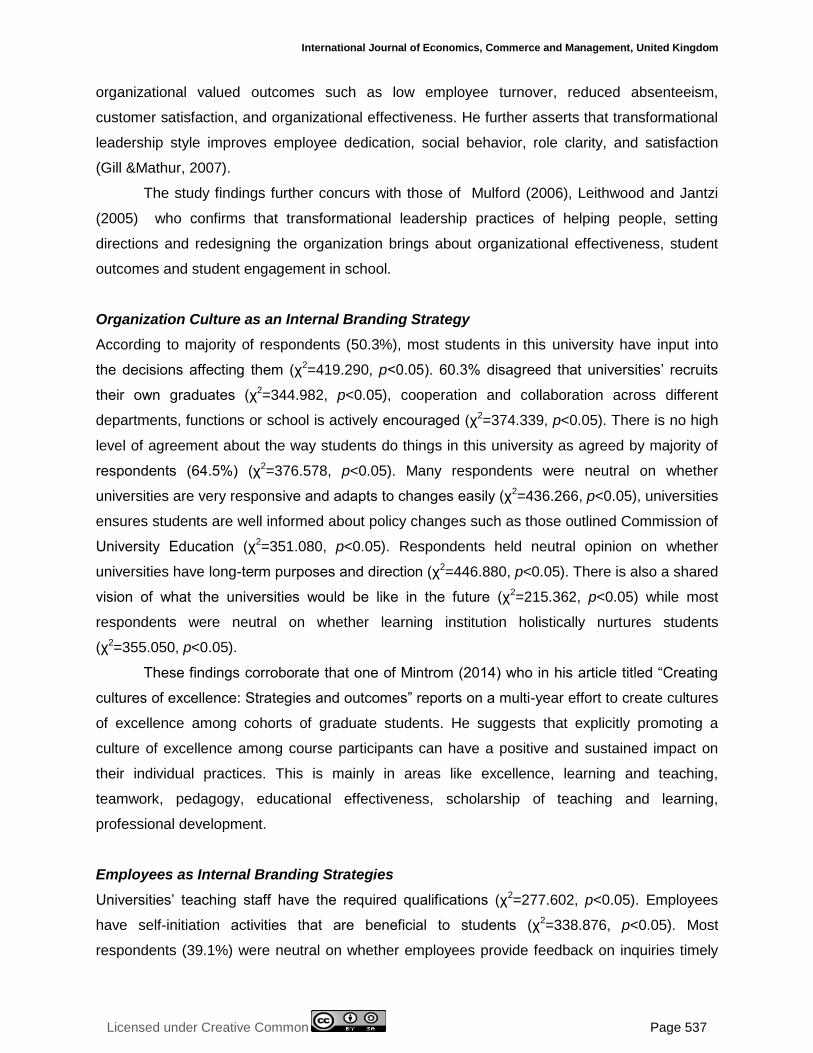
Organization Culture as an Internal Branding Strategy
According to majority of respondents (50.3%), most students in this university have input into
the decisions affecting them (χ2=419.290, p<0.05). 60.3% disagreed that universities‟ recruits
their own graduates (χ2=344.982, p<0.05), cooperation and collaboration across different
departments, functions or school is actively encouraged (χ2=374.339, p<0.05). There is no high
level of agreement about the way students do things in this university as agreed by majority of
respondents (64.5%) (χ2=376.578, p<0.05). Many respondents were neutral on whether
universities are very responsive and adapts to changes easily (χ2=436.266, p<0.05), universities
ensures students are well informed about policy changes such as those outlined Commission of
University Education (χ2=351.080, p<0.05). Respondents held neutral opinion on whether
universities have long-term purposes and direction (χ2=446.880, p<0.05). There is also a shared
vision of what the universities would be like in the future (χ2=215.362, p<0.05) while most
respondents were neutral on whether learning institution holistically nurtures students
(χ2=355.050, p<0.05).
These findings corroborate that one of Mintrom (2014) who in his article titled “Creating
cultures of excellence: Strategies and outcomes” reports on a multi-year effort to create cultures
of excellence among cohorts of graduate students. He suggests that explicitly promoting a
culture of excellence among course participants can have a positive and sustained impact on
their individual practices. This is mainly in areas like excellence, learning and teaching,
teamwork, pedagogy, educational effectiveness, scholarship of teaching and learning,
professional development.
Employees as Internal Branding Strategies
Universities‟ teaching staff have the required qualifications (χ2=277.602, p<0.05). Employees
have self-initiation activities that are beneficial to students (χ2=338.876, p<0.05). Most
respondents (39.1%) were neutral on whether employees provide feedback on inquiries timely
© Langat, Otuya, Chepkilot & Koima
Licensed under Creative Common Page 538
(χ2=311.245, p<0.05).Universities employees have collective focus on institution set goals,
objectives and values (χ2=358.955, p<0.05) with enough knowledge to deliver assigned
responsibilities (χ2=369.817, p<0.05). However, most respondents (46.2%) held neutral opinion
on whether the employees positively communicate about the university (χ2=348.239, p<0.05).
The study findings agree with those of Jandaghi, Bahamin, and Abaei, (2015) who in
their article titled “effects of brand leadership styles on employees - based brand citizenship
behavior Leadership Practices” states that in service organizations, employees are able to
influence over customers purchase decisions and conceptions. They further assert that
employees play a critical role in organizational success. Enhancing employee – based brand
citizenship behavior by managers can create a competitive advantage for organization.
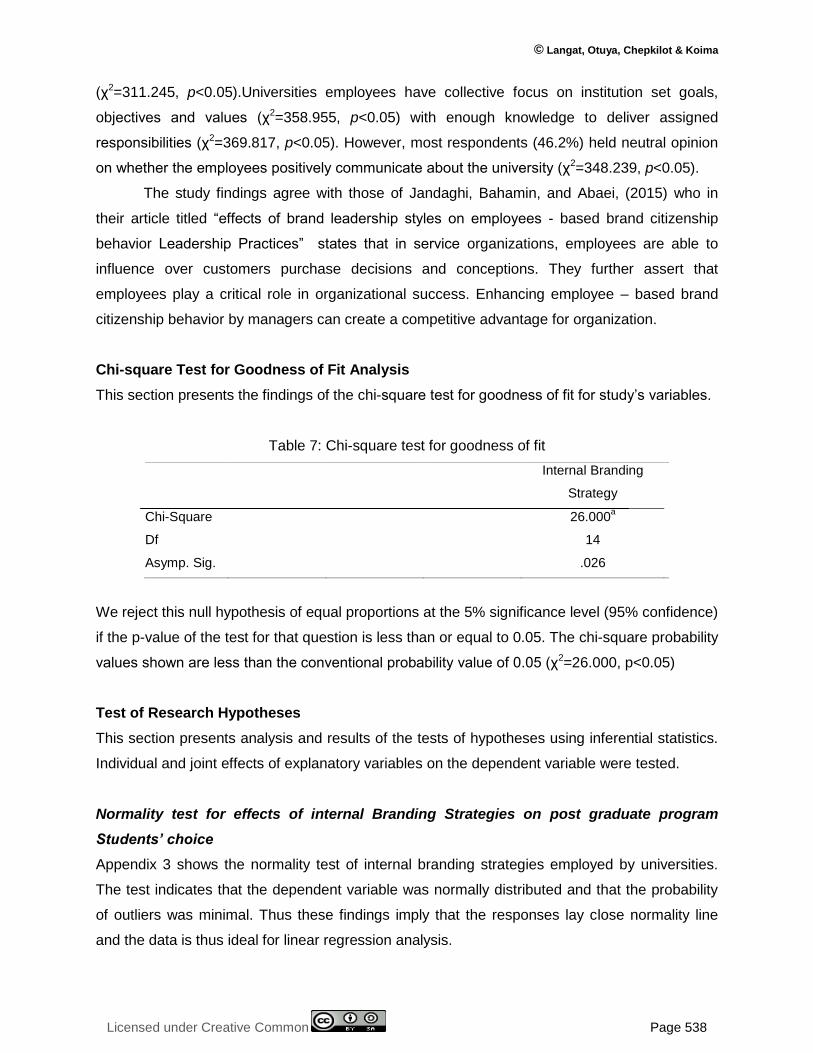
Chi-square Test for Goodness of Fit Analysis
This section presents the findings of the chi-square test for goodness of fit for study‟s variables.
Table 7: Chi-square test for goodness of fit
Internal Branding
Strategy
Chi-Square 26.000a
Df 14
Asymp. Sig. .026
We reject this null hypothesis of equal proportions at the 5% significance level (95% confidence)
if the p-value of the test for that question is less than or equal to 0.05. The chi-square probability
values shown are less than the conventional probability value of 0.05 (χ2=26.000, p<0.05)
Test of Research Hypotheses
This section presents analysis and results of the tests of hypotheses using inferential statistics.
Individual and joint effects of explanatory variables on the dependent variable were tested.
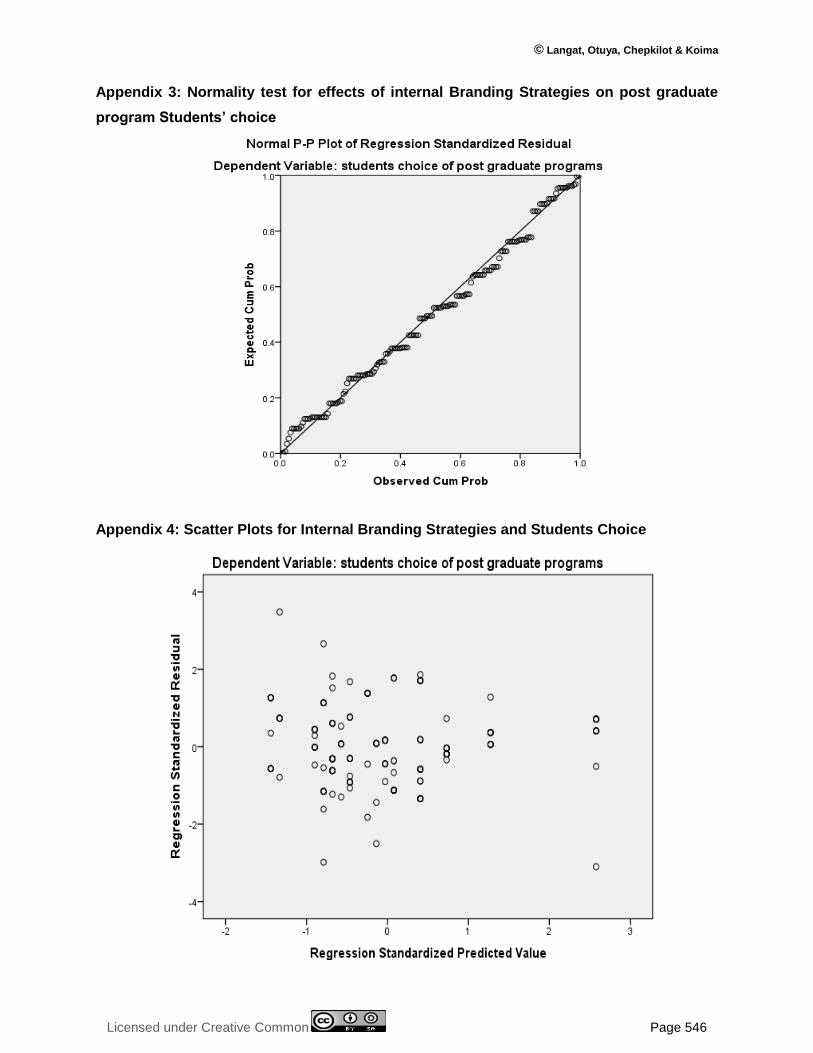
Normality test for effects of internal Branding Strategies on post graduate program
Students’ choice
Appendix 3 shows the normality test of internal branding strategies employed by universities.
The test indicates that the dependent variable was normally distributed and that the probability
of outliers was minimal. Thus these findings imply that the responses lay close normality line
and the data is thus ideal for linear regression analysis.
International Journal of Economics, Commerce and Management, United Kingdom
Licensed under Creative Common Page 539
Linear Regression between Internal Branding Strategies and Students Choice
Here, individual effect of internal branding strategies on students‟ choice of post graduate
program was tested and results presented. As shown Appendix 4 the scatter plots shows that
the variables assumed a linear relationship between internal branding strategies and students
choice. Looking at the scatter plot, there is a positive linear relationship between internal
branding strategies and students choice. The ordinary least square (OLS) method of estimation
was employed in establishing the nature of relationship between the predictor and the
dependent variable. Ordinary least square (OLS) permitted derivation of a regression line of
best fit while ensuring that errors are kept at minimum.
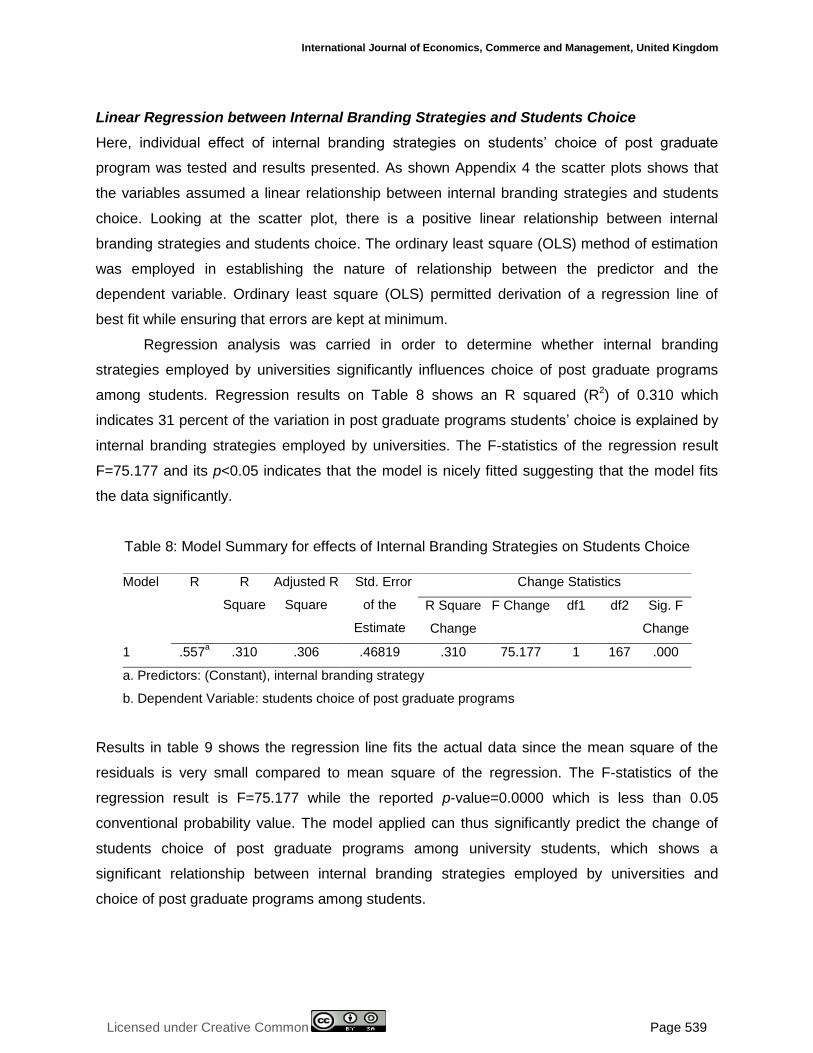
Regression analysis was carried in order to determine whether internal branding
strategies employed by universities significantly influences choice of post graduate programs
among students. Regression results on Table 8 shows an R squared (R2) of 0.310 which
indicates 31 percent of the variation in post graduate programs students‟ choice is explained by
internal branding strategies employed by universities. The F-statistics of the regression result
F=75.177 and its p<0.05 indicates that the model is nicely fitted suggesting that the model fits
the data significantly.
Table 8: Model Summary for effects of Internal Branding Strategies on Students Choice
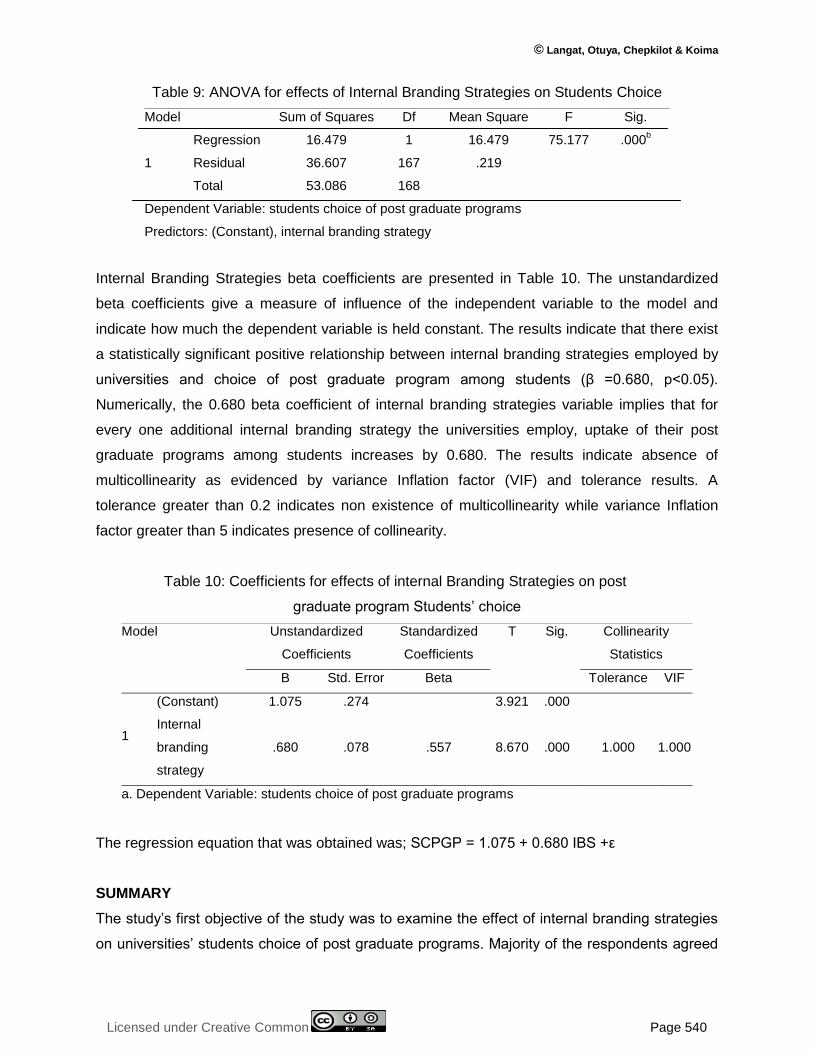
Results in table 9 shows the regression line fits the actual data since the mean square of the
residuals is very small compared to mean square of the regression. The F-statistics of the
regression result is F=75.177 while the reported p-value=0.0000 which is less than 0.05
conventional probability value. The model applied can thus significantly predict the change of
students choice of post graduate programs among university students, which shows a
significant relationship between internal branding strategies employed by universities and
choice of post graduate programs among students.
Model R R
Square
Adjusted R
Square
Std. Error
of the
Estimate
Change Statistics
R Square
Change
F Change df1 df2 Sig. F
Change
1 .557a .310 .306 .46819 .310 75.177 1 167 .000
a. Predictors: (Constant), internal branding strategy
b. Dependent Variable: students choice of post graduate programs
© Langat, Otuya, Chepkilot & Koima
Licensed under Creative Common Page 540
Table 9: ANOVA for effects of Internal Branding Strategies on Students Choice
Model Sum of Squares Df Mean Square F Sig.
1
Regression 16.479 1 16.479 75.177 .000b
Residual 36.607 167 .219
Total 53.086 168
Dependent Variable: students choice of post graduate programs
Predictors: (Constant), internal branding strategy
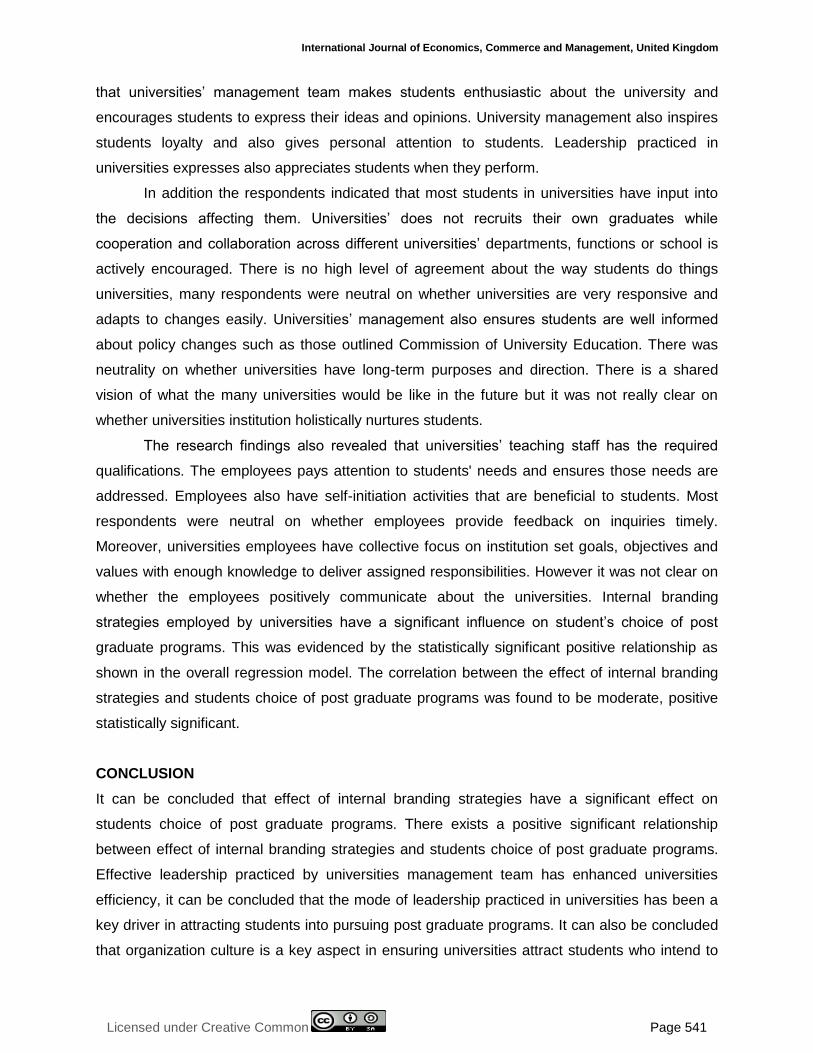
Internal Branding Strategies beta coefficients are presented in Table 10. The unstandardized
beta coefficients give a measure of influence of the independent variable to the model and
indicate how much the dependent variable is held constant. The results indicate that there exist
a statistically significant positive relationship between internal branding strategies employed by
universities and choice of post graduate program among students (β =0.680, p<0.05).
Numerically, the 0.680 beta coefficient of internal branding strategies variable implies that for
every one additional internal branding strategy the universities employ, uptake of their post
graduate programs among students increases by 0.680. The results indicate absence of
multicollinearity as evidenced by variance Inflation factor (VIF) and tolerance results. A
tolerance greater than 0.2 indicates non existence of multicollinearity while variance Inflation
factor greater than 5 indicates presence of collinearity.
Table 10: Coefficients for effects of internal Branding Strategies on post
graduate program Students‟ choice
Model Unstandardized
Coefficients
Standardized
Coefficients
T Sig. Collinearity
Statistics
B Std. Error Beta Tolerance VIF
1
(Constant) 1.075 .274 3.921 .000
Internal
branding
strategy
.680 .078 .557 8.670 .000 1.000 1.000
a. Dependent Variable: students choice of post graduate programs
The regression equation that was obtained was; SCPGP = 1.075 + 0.680 IBS +ε
SUMMARY
The study‟s first objective of the study was to examine the effect of internal branding strategies
on universities‟ students choice of post graduate programs. Majority of the respondents agreed
International Journal of Economics, Commerce and Management, United Kingdom
Licensed under Creative Common Page 541
that universities‟ management team makes students enthusiastic about the university and
encourages students to express their ideas and opinions. University management also inspires
students loyalty and also gives personal attention to students. Leadership practiced in
universities expresses also appreciates students when they perform.
In addition the respondents indicated that most students in universities have input into
the decisions affecting them. Universities‟ does not recruits their own graduates while
cooperation and collaboration across different universities‟ departments, functions or school is
actively encouraged. There is no high level of agreement about the way students do things
universities, many respondents were neutral on whether universities are very responsive and
adapts to changes easily. Universities‟ management also ensures students are well informed
about policy changes such as those outlined Commission of University Education. There was
neutrality on whether universities have long-term purposes and direction. There is a shared
vision of what the many universities would be like in the future but it was not really clear on
whether universities institution holistically nurtures students.
The research findings also revealed that universities‟ teaching staff has the required
qualifications. The employees pays attention to students' needs and ensures those needs are
addressed. Employees also have self-initiation activities that are beneficial to students. Most
respondents were neutral on whether employees provide feedback on inquiries timely.
Moreover, universities employees have collective focus on institution set goals, objectives and
values with enough knowledge to deliver assigned responsibilities. However it was not clear on
whether the employees positively communicate about the universities. Internal branding
strategies employed by universities have a significant influence on student‟s choice of post
graduate programs. This was evidenced by the statistically significant positive relationship as
shown in the overall regression model. The correlation between the effect of internal branding
strategies and students choice of post graduate programs was found to be moderate, positive
statistically significant.
CONCLUSION
It can be concluded that effect of internal branding strategies have a significant effect on
students choice of post graduate programs. There exists a positive significant relationship
between effect of internal branding strategies and students choice of post graduate programs.
Effective leadership practiced by universities management team has enhanced universities
efficiency, it can be concluded that the mode of leadership practiced in universities has been a
key driver in attracting students into pursuing post graduate programs. It can also be concluded
that organization culture is a key aspect in ensuring universities attract students who intend to
© Langat, Otuya, Chepkilot & Koima
Licensed under Creative Common Page 542
undertake post graduate programs. As the results indicate, effective organization culture is key
in positioning the organization to prospective clients in this case prospective post graduate
students. Thus is vital for universities to ensure that the existing organisation‟s culture is all
people inclusive culture that enhances various stakeholders‟ participation. However, it can also
be concluded that most universities does not have a culture where they recruit their own
students. It can be concluded that universities culture of ensuring that they hire professional
employees who are committed to universities, shared vision, have focus on institution set goals
and values has enhanced students choice for post graduate programs.
RECOMMENDATIONS
According to the results respondents it was not clear as to whether universities leadership team
encourage students to express their ideas and opinions. The universities policy board of
management should ensure that universities staff serving at different levels carry their duties
and responsibilities by ensuring students opinions, grievances are taken into account. This will
ensure that the relationship between students and the staff is cordial thus enhancing
universities‟ reputation among prospective and continuing post graduate students. Universities
ought to create an organization culture where top performing students in academic and extra
curriculum affairs are hired and retained by their own universities this will create a culture of
competition among students thus positioning and enhancing universities image. Universities
management team should also ensure that universities are responsive and adapts to changes
easily with long-term purposes and direction. There is also great need to ensure that post
graduate students are nurtured holistically in a bid to make students graduating from respective
universities more competitive and resilient and knowledgeable with holistic employability skills.
Most respondents were neutral on whether employees provide feedback on inquiries and
whether employees positively communicate about the university. Thus the university leadership
should ensure an organization culture is created where employees are obliged to provide
feedback on inquiries by students, employees motivation will also enhance employees positive
communication about the university.
SCOPE FOR FURTHER RESEARCH
The study employed a case study approach of Nakuru County; it is recommended that this
study be carried on a broader scale in Kenya. Yin (2003) asserts that a single case study is
weaker than a multiple case study as the research findings cannot be applied in any other
situations. In determining key measurable indicators under each study‟s variable qualitative
research was used.
International Journal of Economics, Commerce and Management, United Kingdom
Licensed under Creative Common Page 543
REFERENCE
Anderson, G. (2008). Mapping Academic Resistance in the Managerial University. Organization Articles. SAGE: Los Angeles, London, New Delhi and Singapore,15(2), 251-270.
Aurand, T.W., Gorchels, L. and Bishop, T.R. (2005), “Human resource management‟s role in Brand Management, 3(2), 84-93.
Burns, N & Grove, S.K. (2003). The practice of nursing research: Conduct, critique and utilization. Toronto: WB Saunders
Davies, G. (2008). "Employer branding and its influence on managers", European Journal of Marketing, 42(5/6), 667-681.
De Chernatony, L.S., Druty,S.& Segal-Horn. (2003). Building a Services Brand: Stages, People and Orientations. The Service Industries Journal, 23 (5), 1-21.
Deem, R., &Brehony, K. J. (2005). Management as ideology: the case of 'new managerialism' in higher education. Oxford Review of Education, 31(2), 217-235.
Dill, D. D. (1982).The Management of Academic Culture: Notes on the management of meaning and social integration. Higher Education, 11, 303–320.
Elliot, R., & Percy, L. (2007).Strategic Brand Management.Journal of Consumer Marketing, 12 (4), 11–9.
Hackman, J.R. & Wageman, R.(2007).Asking the right questions about leadership: Discussion and conclusions. American Psychologist 62(1): 43-47.
Hankinson, P. (2004), “The internal brand in leading UK charities”, Journal of Product and Internal branding: an opportunity for cross-functional brand message synergy”, Journal of brand management, 15(2), 123-134.
Hatch, M. J.,& Schultz, M. (1997).Relations between organizational culture, identity and image. European Journal of Marketing, 31(6), 35-60.
Jandaghi, G., Bahamin, F. &Abaei, M. (2015).The effects of brand leadership styles on employees-based brand citizenship behavior.World scientific news, 22, 25-39.
Judson, K., Aurand, T.,&Gorchels, L. (2006).Building a university brand from within: A comparison of Coaches‟ perspectives of internal branding.Journal of Marketing for Higher Education, 16(1), 97-114.
Kotter, J. P. &Heskett. J. L. (1992), Corporate Culture and Performance. New York: Free Press.
Lakomski, G. (2001). Organizational change, leadership and learning: culture as cognitive process. International Journal of Educational Management, 15(2), 68-77.
Leithwood, K. &Jantzi, D. (2005).Transformational leadership. The essentials of school leadership, 31-43.
Low, G.S, & Mohr, J. J. (2000).Advertising vs. sales promotion: a brand management perspective. Journal of product & brand management 9: 389-414.
Lunenburg, F. C., & Ornstein, A. O. (2012).Educational administration: Concepts and practices (6thed.). Belmont, CA: Wadsworth/Cengage Learning.
Mitchell, C. (2002), “Selling the Brand Inside: You tell customers what makes you great. Do your employees know?” Harvard Business Review, 80, 99-105.
Morhart, Felicitas, M., Walter, H., &Torsten, T. (2009).Brand-Specific Leadership: Turning Employees into Brand Champions.Journal of Marketing, 73(5), 122- 142.
Mosley, R W. (2007), “Customer experience, organizational culture and the employer brand”,
Mugenda M. O. and Mugenda A. (2008). Research Methods: Qualitative and Quantitative Approaches, African Centre for Technology Studies, Nairobi, Kenya.
Mulford, B. (2006). Leadership for school and student learning: What do we know?, keynote address, Australian Centre for Educational Leadership, Fifth International Conference, University of Wollongong.
© Langat, Otuya, Chepkilot & Koima
Licensed under Creative Common Page 544
Nassiuma D. K. (2000). Survey sampling: Theory and methods. Njoro, Kenya: Egerton University Press.
Papasolomou, I. &Vrontis, D. (2006).Building corporate branding through internal marketing: the case of the UK retail bank industry.Journal of product and brand Management, 15, 37-47.
Pringle, J. (2014). Faculty perception of branding - A Multi-case Qualitative Study. The Canadian Journal of Higher Education, 41(3), 36-58.
Punjaisri K, Wilson, A. (2007). The role of internal branding in the delivery of employee brand promise. Journal of Brand Management, 15: 57–70.
Schein, E. H. (2004). Organizational culture and leadership, Jossey-Bass, San Francisco.Search, and the Classification of Retail Services.Journal of Retailing, 55 (9),24–33.
Thomson K, de Chernatony L. & Arganbright, L. (1999). The buy-in benchmark: How staff understanding and commitment impact brand and business performance. Journal of Marketing Managemen,t 15: 819–835.
Tosti, D. T., &Stotz, R. D. (2001).Building your brand from the inside out.Marketing Management, 10(2), 28-33.
Ulrich, D., & Smallwood, N. (2007). Building a leadership brand, Harvard Business Review, 85(7/8), 92.
Vallaster, C. & de Chernatony, L. (2004), “Howmuch do leaders matter in internal brand building? An international perspective”, Working paper, Birmingham Business school.
Villanova, L., Zinkhan, G.M. & Hyman, M.R. (1990). „On Defining and Measuring Store Image‟, in B.J. Dunlap (ed.) Proceedings of the Thirteenth Annual Conference of the Academy of Marketing Science, April, pp. 466–70. New Orleans, LA: Academy of Marketing Science.
Watson, J. (2001). Social Constructivism in the Classroom. Systemic Functional Linguistic, 16(3), 140-147.
Wilkins, A.L. &Ouchi, W.G. (1983).Efficient Cultures: Exploring the Relationship Between Culture and Organizational Performance Administrative Science Quarterly, 28(3), 468-481
APPENDICES
Appendix 1: Total Variance Explained for Internal Branding Strategies
Component Initial Eigenvalues Extraction Sums of Squared
Loadings
Rotation Sums of Squared Loadings
Total % of
Variance
Cumulative % Total % of
Variance
Cumulati
ve %
Total % of
Variance
Cumulative %
1 4.419 22.097 22.097 4.419 22.097 22.097 3.724 18.620 18.620
2 3.067 15.336 37.433 3.067 15.336 37.433 2.989 14.946 33.566
3 2.465 12.327 49.760 2.465 12.327 49.760 2.286 11.429 44.994
4 1.799 8.995 58.755 1.799 8.995 58.755 1.910 9.551 54.545
5 1.700 8.500 67.255 1.700 8.500 67.255 1.840 9.202 63.748
6 1.470 7.351 74.606 1.470 7.351 74.606 1.790 8.949 72.696
7 1.308 6.538 81.144 1.308 6.538 81.144 1.689 8.447 81.144
8 .974 4.871 86.014
9 .743 3.714 89.729
10 .565 2.825 92.554
International Journal of Economics, Commerce and Management, United Kingdom
Licensed under Creative Common Page 545
11 .396 1.982 94.536
12 .300 1.501 96.037
13 .271 1.353 97.390
14 .199 .995 98.385
15 .135 .677 99.062
16 .089 .445 99.507
17 .056 .280 99.787
18 .035 .174 99.961
19 .008 .039 99.999
20 .000 .001 100.000
Extraction Method: Principal Component Analysis.
Appendix 2: Screen Plot for Internal Branding Strategies
© Langat, Otuya, Chepkilot & Koima
Licensed under Creative Common Page 546
Appendix 3: Normality test for effects of internal Branding Strategies on post graduate
program Students’ choice
Appendix 4: Scatter Plots for Internal Branding Strategies and Students Choice