eerc disclaimer iii pipeline...eerc disclaimer legal notice this research report was prepared by the...
TRANSCRIPT
EERC DISCLAIMER LEGAL NOTICE This research report was prepared by the Energy & Environmental Research Center (EERC), an agency of the University of North Dakota, as an account of work sponsored by North Dakota Industrial Commission and the Energy Development and Transmission Committee. Because of the research nature of the work performed, neither the EERC nor any of its employees makes any warranty, express or implied, or assumes any legal liability or responsibility for the accuracy, completeness, or usefulness of any information, apparatus, product, or process disclosed or represents that its use would not infringe privately owned rights. Reference herein to any specific commercial product, process, or service by trade name, trademark, manufacturer, or otherwise does not necessarily constitute or imply its endorsement or recommendation by the EERC. NDIC DISCLAIMER This report was prepared by the EERC pursuant to an agreement partially funded by the Industrial Commission of North Dakota, and neither the EERC nor any of its subcontractors nor the North Dakota Industrial Commission nor any person acting on behalf of either:
(A) Makes any warranty or representation, express or implied, with respect to the accuracy, completeness, or usefulness of the information contained in this report or that the use of any information, apparatus, method, or process disclosed in this report may not infringe privately owned rights; or
(B) Assumes any liabilities with respect to the use of, or for damages resulting from the
use of, any information, apparatus, method, or process disclosed in this report. Reference herein to any specific commercial product, process, or service by trade name, trademark, manufacturer, or otherwise does not necessarily constitute or imply its endorsement, recommendation, or favoring by the North Dakota Industrial Commission. The views and opinions of authors expressed herein do not necessarily state or reflect those of the North Dakota Industrial Commission.

i
TABLE OF CONTENTS LIST OF FIGURES ....................................................................................................................... iii LIST OF TABLES ............................................................................................................................. v NOMENCLATURE ..................................................................................................................... vii EXECUTIVE SUMMARY ......................................................................................................... viii INTRODUCTION .......................................................................................................................... 1
Background ........................................................................................................................... 1 Scope of Study ...................................................................................................................... 2
CHAPTER 1 – EMERGING TECHNOLOGY FOR LIQUIDS GATHERING PIPELINES
I. STATE OF TECHNOLOGY APPLICABLE TO LIQUIDS GATHERING
PIPELINES ....................................................................................................................... 4 II. KEY TERMS USED IN THIS CHAPTER ...................................................................... 5 III. A SAMPLING OF EMERGING TECHNOLOGIES APPLICABLE TO LIQUIDS
GATHERING PIPELINE LEAK PREVENTION AND LEAK DETECTION .............. 6 A. Emergence of Artificial Intelligence ......................................................................... 6 B. Targeted, Drone-Based AI Pipeline Monitoring for Leak Detection ........................ 8 C. AI Utilizing Opportunistic Data Collection Applied to Pipeline Leak Detection ... 12 D. Distributed Measurements via Fiber Optic Cables ................................................. 13 E. Miniaturized In-Line Inspection to Avoid Leaks .................................................... 15 F. Dedicated Leak Detection for Challenging Situations and Remote Areas ............. 17
IV. PREREQUISITES FOR PROLIFERATION OF DRONE EMPLOYMENT IN
PIPELINE MONITORING ............................................................................................ 18 A. Science-Based Payloads .......................................................................................... 19 B. Automated Collection and Processing of Data ....................................................... 21 C. Beyond Visual Line-of-Sight (BVLOS) Operation ................................................ 21 D. Automated Flight Operations .................................................................................. 21
V. CONCLUSIONS ............................................................................................................ 22
Continued . . .

ii
TABLE OF CONTENTS (continued)
CHAPTER 2 – RISK ASSESSMENT FOR LIQUIDS GATHERING PIPELINES I. RISK ASSESSMENT INTRODUCTION ..................................................................... 23 II. KEY TERMS AND ACRONYMS USED IN THIS CHAPTER .................................. 25 III. BACKGROUND ............................................................................................................ 28 IV. DEFINITION AND PURPOSE OF RISK ASSESSMENT .......................................... 30
A. Purpose of Risk Assessment ................................................................................... 30 B. Commonly Employed Definitions in Risk Assessment .......................................... 33 C. Risk Assessment Inputs ........................................................................................... 37 D. Risk Assessment Outputs ........................................................................................ 37
V. SURVEY OF AVAILABLE RISK ASSESSMENT APPROACHES FOR
LIQUIDS GATHERING PIPELINES ........................................................................... 39 A. Recognized Approaches to Risk Assessment .......................................................... 39 B. Factors Influencing Risk Assessment ..................................................................... 45 C. Desirable Pipeline Risk Assessment Characteristics .............................................. 48 D. Approaches Adopted for Purpose of Illustrating Examples .................................... 51
VI. APPLICATION OF RISK ASSESSMENT ................................................................... 51
A. Example Scenario Created for Basis of Fictional Risk Assessment ....................... 52 B. Demonstration of Multiple Risk Assessment Methods ........................................... 54
1. Index Method ................................................................................................... 55 2. Matrix Method ................................................................................................. 57 3. Quantitative Method ........................................................................................ 61
C. Comparison of Risk Assessment Model Results ..................................................... 65 D. Key Lessons from Examples ................................................................................... 66
VII. EMERGING TOPICS RELATED TO RISK ASSESSMENT ...................................... 68
A. PHMSA Risk Modeling Work Group ..................................................................... 69 B. Feedback and Continuous Improvement ................................................................. 74 C. Defense in Depth ..................................................................................................... 76
VIII. CONCLUSIONS ............................................................................................................ 78 REFERENCES ............................................................................................................................. 79

iii
LIST OF FIGURES 1 Defining AI ........................................................................................................................... 7 2 Thundercloud mobile operations center ................................................................................ 9 3 Multilayered automated data analysis ................................................................................... 9 4 INEXATM solutions suite .................................................................................................... 10 5 INEXA platform architecture .............................................................................................. 11 6 SwRI’s SLED hydrocarbon identification .......................................................................... 12 7 Identification of pipeline hydrocarbon spill by Satelytics .................................................. 13 8 Examples of application of distributed fiber optics sensing for pipelines .......................... 14 9 Pipers sensor ........................................................................................................................ 15 10 SmartBall in pipeline ........................................................................................................... 16 11 Technicians extracting data from SmartBall ....................................................................... 16 12 Pipeline Guardian sensor installation .................................................................................. 17 13 Pipeline Guardian components ............................................................................................ 18 14 Hyperspectral image ............................................................................................................ 19 15 Multispectral image ............................................................................................................. 20 16 Lidar image ......................................................................................................................... 20 17 Infrared image ..................................................................................................................... 20 18 Overview of a pipeline assessment process ........................................................................ 25 19 Pipeline risk assessment context ......................................................................................... 31 20 Examples of hazards leading to threats ............................................................................... 35 21 Risk chain ............................................................................................................................ 36
Continued . . .

iv
LIST OF FIGURES (continued)
22 Simplified risk chain ........................................................................................................... 36 23 Graphical representation of index method .......................................................................... 43 24 Example event tree with likelihoods of events and estimated consequence values ............ 44 25 Example event tree with expected consequence values of events based on Figure 24 ....... 44 26 Simple risk chain diagrams of different fundamental approaches to aggregating risk ....... 45 27 Simple risk chain diagram of a more advanced concept of pipeline failure ....................... 46 28 Simplified Figure 27 ............................................................................................................ 46 29 Fictitious produced water gathering pipeline system for use in example scenario ............. 53 30 Trend of serious pipeline incidents within PHMSA jurisdiction ........................................ 69 31 3-year average onshore pipe incidents 1999–2009 ............................................................. 71 32 Liquids pipeline industry 3-year average onshore pipe spills ............................................. 71 33 Gas pipeline risk management plan process flow diagram ................................................. 75 34 Hazardous liquids pipeline risk management program process flow diagram .................... 75
v
LIST OF TABLES 1 Threats from ASME B31.8S and API RP-1160 .................................................................. 34 2 Potential Consequences to Consider in Risk Assessment ................................................... 36 3 Risk Assessment Approaches Specifically Outlined for Pipeline Applications ................. 40 4 Characteristics of Pipeline Risk Modeling Approaches ...................................................... 40 5 Notional Examples of Units for Matrix Models of Likelihood, Consequence, and Risk
Values .................................................................................................................................. 42 6 Characteristic Elements of Risk Assessments ..................................................................... 49 7 Desirable Pipeline Risk Assessment Characteristics .......................................................... 50 8 Fictitious Produced Water Gathering Pipeline Characteristics ........................................... 54 9 Equipment Listing for Fictitious Pipeline System .............................................................. 54 10 Line Size Safety Risk Indicator Values ............................................................................... 55 11 Scoring Example Results .................................................................................................... 56 12 Conceptual Qualitative Risk Matrix .................................................................................... 57 13 5 × 5 Matrix Structure Utilized in This Example Application ............................................ 58 14 Risk Estimates by Segment ................................................................................................. 58 15 Results of Semiquantitative Scoring of Risks Estimated in Table 16 ................................. 59 16 Consequence and Frequency Values Used in the Example Application ............................ 59 17 Summary of Results of Example Risk Matrix Method of Risk Assessment ...................... 60 18 Example Risk Matrix for Each Threat Category and Color Definitions ............................. 60 19 Threats and Threat Categories Adopted for Quantitative Risk Model Example ................ 62 20 Factors Affecting Risk ........................................................................................................ 63
Continued . . .

vi
LIST OF TABLES (continued) 21 Adjustments to Baseline Values .......................................................................................... 64 22 Example Quantitative Model Results .................................................................................. 65 23 Comparison of Example Index and Matrix Model Results ................................................. 66

NOMENCLATURE September 2018
vii
NOMENCLATURE AI artificial intelligence ANSI American National Standards Institute AOPL Association of Oil Pipe Lines API American Petroleum Institute ASME American Society of Mechanical Engineers BVLOS beyond visual line of sight EERC Energy & Environmental Research Center EO electro-optical EPA U.S. Environmental Protection Agency ESD emergency shutdown FAA Federal Aviation Administration FOSA Fiber Optic Sensing Association HB House Bill HAZOP hazardous operations lidar light detection and ranging LOPA layer(s) of protection analysis MIR medium-range infrared NASA National Aeronautics and Space Administration NDIC North Dakota Industrial Commission NRC National Research Council OSHA Occupational Safety and Health Administration P&M preventive and mitigative PCIF pressure cycle induced fatigue PE polyethylene PHMSA Pipeline and Hazardous Materials Safety Administration PRCI Pipeline Research Council International PSM Process Safety Management QGC Queensland Gas Company R&D Research & Development RMWG Risk Modeling Work Group ROW right of way SCADA supervisory control and data acquisition SCC stress corrosion cracking SIS safety instrumented systems SLED smart leak detection SME subject matter experts SSC selective seam corrosion SwRI Southwest Research Institute UAS unmanned aerial systems WAS water allocation skid

EXECUTIVE SUMMARY September 2018
viii
LIQUIDS GATHERING PIPELINES: SURVEY OF EMERGING TECHNOLOGIES AND APPLICATIONS OF RISK ASSESSMENT TO INCREASE PIPELINE INTEGRITY
EXECUTIVE SUMMARY The Energy & Environmental Research Center (EERC) has concluded a three-phase study of liquids gathering pipelines. Phases I and II of this study served to inform the state on the status of the liquids gathering pipelines industry in North Dakota and to demonstrate different approaches to leak detection, respectively. Phase III of this study (the focus of this report) is focused on emerging technologies to prevent and detect leaks from these pipelines and risk assessment methods that can be applied to prioritize these pipelines for additional preventative actions. The ultimate goal of the three-phase pipeline study is to reduce the frequency and total volume of leaks and spills from liquids gathering pipeline systems in the state of North Dakota. The results of this study phase serve to inform stakeholders on possible approaches to risk assessment, which may facilitate appropriate layering of risk abatement approaches, including employment of technology. Chapter 1 – Emerging Technology for Liquids Gathering Pipelines A significant quantity of new pipeline leak detection and leak prevention technology has emerged since the first phase of this pipeline study was completed in 2015. The EERC suggests that four factors contribute to this rapidly changing landscape of available or developing technology:
1) A rapidly expanding new market for technology solutions suited to small-diameter liquids gathering pipelines.
2) New regulation on liquids gathering pipelines caused by rapidly expanding
infrastructure.
3) Increased public attention on pipelines in recent years due to a variety of factors, not all of which are directly related to otherwise safe operations of pipelines.
4) Pipeline operator’s desire for increased efficiency in operations.
This report summarizes a partial sampling of emerging technologies that may have applicability to liquids gathering pipelines in the near future. This summary of new and emerging technologies is not a comprehensive overview of all new technology applicable to leak prevention and leak detection for liquids gathering pipelines, but it does provide insight into emerging options such as:
1. Artificial intelligence (AI) employed in leak detection a. Drone-based AI applications b. Platform-independent AI applications
2. Distributed measurements via fiber optic cable

EXECUTIVE SUMMARY September 2018
ix
3. Miniaturized in-line inspection tools 4. Dedicated leak detection for challenging situations and remote areas
Artificial Intelligence AI is a field of new technology that is rapidly maturing to serve a significant role across a broad range of industries. AI is now viewed as a potential solution to the challenge of leak prevention and leak detection in pipelines. Several companies are exploring the application of an AI subtopic termed “machine learning” to large data sets including remote imagery (including satellite, drone, commercial aircraft, and fixed sensors), supervisory control and data acquisition (SCADA) data, and field inputs from technicians with smart phones. These companies are looking at streams of data from multiple sensors at multiple time intervals, then applying machine learning algorithms to look for hidden differences that would not be recognized if a specific, prescribed analytical technique were used on only one or two sets of data. Fiber Optic Cable In distributed fiber optic measurements, as laser light travels through a transparent media, a small fraction of that light is backscattered through interaction with the transparent media. Vibration, temperature, or strain in the fiber optic cable can be measured by analyzing the backscatter signals returned to an optical sensor connected to the fiber optic cable. Fiber optic technology is now being applied to pipeline leak detection. Noise from a leak in the pipe can be detected, as can a negative pressure pulse propagating in the pipe. Ground heave and soil slumping can also be detected. Finally, certain cable materials swell in the presence of either salt water or hydrocarbons and can thus, potentially, detect leaks directly. Miniaturized In-Line Inspection In-line inspection is a category of leak prevention technologies that are regularly employed in large transmission pipelines to ascertain the physical condition of the pipeline. In-line inspection employs inspection tools that travel within the pipeline to measure various features of the pipe wall. Until recently, in-line inspection tools have been available only for larger-diameter transmission pipelines. The shale revolution is now creating an opportunity for new technologies that can achieve in-line inspection on smaller-diameter, highly networked gathering pipeline systems. As such, traditional notions of in-line inspection tools may change significantly in the near future. Dedicated Leak Detection for Challenging Situations and Remote Areas New software-based leak detection products have recently been released to address challenging situations such as river crossings, high-density population areas, or environmentally sensitive areas. Some of these products offer features to overcome communication and power infrastructure shortcomings found in remote areas of western North Dakota. Conclusions A variety of new technologies is emerging to address the needs of liquids gathering pipelines. These emerging technologies are at various stages of development and all will require additional testing and demonstration to provide the proven performance expected by stakeholders. It is anticipated that with willing pipeline operators as demonstration partners, some of these technologies can be matured to directly contribute to the safe operation of liquids gathering

EXECUTIVE SUMMARY September 2018
x
pipelines. The development status of these technologies will likely change rapidly in the near term. Therefore, pipeline operators and state authorities should monitor their progress to determine appropriate timing for possible implementation. Chapter 2 – Risk Assessment and Continuous Improvement Defining Risk Assessment Risk assessment is an exercise in either quantifying risk or sorting multiple risks in order of importance or hazard level. Risk assessment is broadly applied across industries and government organizations seeking to improve safety, environmental, and financial performance by reducing losses. Unfortunately, little information focusing specifically on risk assessment’s application to liquids gathering pipelines exists in available literature. The current study intends to bridge that gap. Risk management might be defined as actions taken by a company to mitigate risks following any type of risk assessment activity. The ultimate goal of risk management is to identify additional actions to ensure safety. Pipeline literature describes risk assessment as a component of risk management. Therefore, risk assessment is conducted as part of a decision-making process directed at improving pipeline integrity. Available standards recommend that operators be provided great latitude performing risk assessment to ensure that the purpose and approach match the needs and resources of the situation. Key Characteristics of an Effective Risk Assessment Pipeline risk assessment literature presents perspectives regarding the nature of appropriate guidelines for risk assessment. These systems and guidelines possess the following common characteristics:
• They promote prioritization of pipeline segments and employment of resources. • They permit flexibility to enable operators to customize their systems to meet their unique
situations. • They avoid onerous requirements and seek to maintain a favorable cost–benefit ratio. • They promote discovery of new hazards and scenarios.
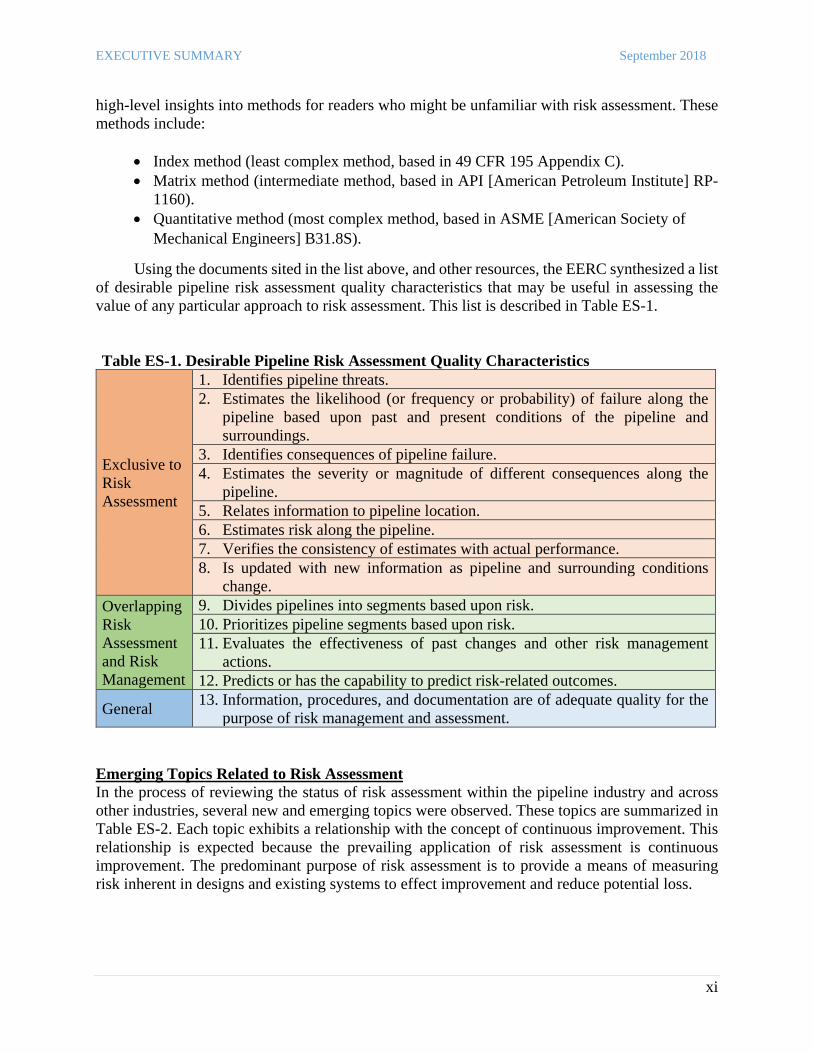
This study identifies the most fundamental, commonly accepted risk assessment quality characteristics, summarized in Table ES-1. The EERC suggests that this table may form a foundation upon which stakeholders may assess the adequacy of any particular approach to risk assessment. Demonstration of Risk Assessment Approaches The current study illustrates, at a high level, three risk assessment methods applied to a fictional produced water gathering pipeline scenario. The examples are intended to provide a conceptual idea of the nature of a few risk assessment methods and some activities involved with risk assessment. A hypothetical example scenario was defined to provide the foundation to which these risk assessment methods could be applied. Three different risk assessment methods were then applied to the example scenario to demonstrate the potential range of complexity and to convey
EXECUTIVE SUMMARY September 2018
xi
high-level insights into methods for readers who might be unfamiliar with risk assessment. These methods include:
• Index method (least complex method, based in 49 CFR 195 Appendix C). • Matrix method (intermediate method, based in API [American Petroleum Institute] RP-
1160). • Quantitative method (most complex method, based in ASME [American Society of
Mechanical Engineers] B31.8S).
Using the documents sited in the list above, and other resources, the EERC synthesized a list of desirable pipeline risk assessment quality characteristics that may be useful in assessing the value of any particular approach to risk assessment. This list is described in Table ES-1. Table ES-1. Desirable Pipeline Risk Assessment Quality Characteristics
Exclusive to Risk Assessment
1. Identifies pipeline threats. 2. Estimates the likelihood (or frequency or probability) of failure along the
pipeline based upon past and present conditions of the pipeline and surroundings.
3. Identifies consequences of pipeline failure. 4. Estimates the severity or magnitude of different consequences along the
pipeline. 5. Relates information to pipeline location. 6. Estimates risk along the pipeline. 7. Verifies the consistency of estimates with actual performance. 8. Is updated with new information as pipeline and surrounding conditions
change. Overlapping Risk Assessment and Risk Management
9. Divides pipelines into segments based upon risk. 10. Prioritizes pipeline segments based upon risk. 11. Evaluates the effectiveness of past changes and other risk management
actions. 12. Predicts or has the capability to predict risk-related outcomes.
General 13. Information, procedures, and documentation are of adequate quality for the purpose of risk management and assessment.
Emerging Topics Related to Risk Assessment In the process of reviewing the status of risk assessment within the pipeline industry and across other industries, several new and emerging topics were observed. These topics are summarized in Table ES-2. Each topic exhibits a relationship with the concept of continuous improvement. This relationship is expected because the prevailing application of risk assessment is continuous improvement. The predominant purpose of risk assessment is to provide a means of measuring risk inherent in designs and existing systems to effect improvement and reduce potential loss.

EXECUTIVE SUMMARY September 2018
xii
ES-2. Summary of Emerging Topics Related to Risk Assessment Topic Summary of Discussion
PHMSA Risk Modeling Work Group
The U.S. Pipeline and Hazardous Materials Safety Administration (PHMSA) formed a Risk Modeling Work Group (RMWG) in late 2015 to aid in development of a technical guidance document on the topic of pipeline risk assessment that will address:
1. Regulatory requirements for risk analysis and assessment performance. 2. Risk modeling’s position in overall pipeline risk management. 3. Likelihood modeling to guide preventative measures. 4. Consequence approach selection to guide mitigative measures. 5. Facility risk approach selection to guide preventive\mitigative measures. 6. Risk modeling data needs.
A draft of this document is expected during the summer of 2018. It may be beneficial to consider the RMWG study in concert with the current EERC study. The RMWG study focuses on PHMSA-regulated pipelines rather than on the type of liquid gathering pipelines common in North Dakota. Despite that, the EERC believes that some of the study outcome may be applicable to liquids gathering pipeline risk assessment in North Dakota.
Feedback and Continuous Improvement
Feedback, validation, and continuous improvement are quality concepts that are woven into the existing standards for pipeline operations. Relevant pipeline operations standards define risk management processes. Embedded in these processes are feedback loops (“continuous improvement”) that strive to constantly improve the integrity of pipelines.
Defense in Depth
“Defense in depth” refers to multiple, independent levels of protection designed to compensate for the failure of one or more levels to ensure risk is held at an acceptable level. Defense-in-depth concepts may be considered for higher-risk pipeline segments, where additional layers of safety would provide benefit to the pipeline operator, landowners, the general public, or critical habitats.
Conclusions The ultimate goal of risk assessment and risk management is to identify and prioritize actions to ensure pipeline safety and integrity. Available standards recommend that operators be provided great latitude performing risk assessment to ensure that the purpose and approach match the needs and resources of the situation. Principles of continuous improvement are woven into every approach to risk assessment. The reliability, usefulness, and resources demanded for each approach to risk assessment approach vary greatly. Naturally, more complex quantitative methods provide greater potential for insight but also require significant additional resources to complete and, therefore, are not globally applicable. The EERC suggests three overarching lessons were derived from application of various risk assessment approaches to an uncomplicated, hypothetical scenario:
• Risk Assessment Is Not Easy – No approach was “easy.” Each pipeline operator must determine what level of accuracy and uncertainty is both practical and sufficient for each specific application of a particular risk assessment approach.

EXECUTIVE SUMMARY September 2018
xiii
• Any Systematic and Thoughtful Method Can Be Useful – All methods provided some insight into the relative risk of different segments. Each model results in a list of considerations that facilitate the desired prioritization for subsequent actions.
• Models Exhibited Surprising Consistency – Models exhibited significant consistency in
many respects, especially in final ranking of segments by risk.

INTRODUCTION September 2018
1
LIQUIDS GATHERING PIPELINES: SURVEY OF EMERGING TECHNOLOGIES AND APPLICATIONS OF RISK ASSESSMENT TO INCREASE PIPELINE INTEGRITY
INTRODUCTION Background In August 2017, the Energy & Environmental Research Center (EERC) was awarded funding by the North Dakota Industrial Commission (NDIC) for a project to continue the EERC’s 2015/2016 study of liquids gathering pipelines. Phases I and II of this study were mandated by Section 8 of the North Dakota Legislature’s House Bill 1358 in 2015. The first two phases of the study served to inform the state on the status of the liquids gathering pipelines industry in North Dakota and to demonstrate different approaches to leak detection, respectively. Phase III of this study directly addresses the intent of Section 3 of North Dakota’s 65th Legislative Assembly House Bill 1347, which states that a study must be completed to “include an analysis of leak detection and monitoring technology and risk assessment of new and existing pipeline systems.” The EERC accomplished this work by:
• Assembling and engaging a stakeholder group comprising pipeline operators. • Evaluating options for risk assessment protocols. • Exploring a wide suite of specific risk factors. • Investigating strategies for continuous improvement. • Exploring emerging technologies developed since the release of the December 2015
report from Phase I of this pipeline study. The ultimate goal of Phase III of the pipeline study, as with previous phases, is to reduce the frequency and total volume of leaks and spills from liquids gathering pipeline systems in the state of North Dakota. This goal is supported by the following specific objectives:
• Improve policymaker and pipeline operator knowledge of the factors influencing leaks and spills.
• Outline risk assessment processes that enable pipeline operators to evaluate and prioritize risk factors for pipeline systems.
• Identify continuous improvement strategies suitable for employment in the liquids
gathering pipeline sector and suggest mechanisms for measuring success in continuous improvement protocols.
• Provide a summary of emerging leak prevention and leak detection technologies now
available or soon to be available for application to liquids gathering pipelines.
INTRODUCTION September 2018
2
The results of this study serve to inform stakeholders on possible approaches to risk assessment, which may facilitate appropriate layering of risk abatement approaches, including employment of technology. Scope of Study The scope of Phase III of the pipeline study is guided by the language of House Bill (HB)1347 (2017), as summarized below.
The industrial commission shall … contract with the energy and environmental research center to continue a study regarding pipeline leak detection technology, for the biennium beginning July 1, 2017, and ending June 30, 2019. The study must include an analysis of leak detection and monitoring technology and a risk assessment of new and existing pipeline systems. … The energy and environmental research center shall provide a report to the industrial commission and the legislative management by September 30, 2018, regarding the results and recommendations of the study.
To address the Legislature’s intent, the EERC developed a scope of work with four primary tasks.
1. Identification of Emerging Technologies to Enhance Pipeline Safety and Reliability
The EERC completed a survey of emerging technologies applicable to liquids gathering pipelines to diminish the risk of pipeline leaks. This task was intended only to provide an overview of a sampling of newly available technologies, not a thorough evaluation of said technologies, and not an exhaustive survey of all newly available technologies.
2. Pipeline Stakeholder Group The EERC reassembled the pipeline stakeholder group that played such a vital role during Phase I of the pipeline study. This stakeholder group provided “ground truthing” to the EERC team, educating the team on what aspects of risk assessment are effective in practice. Stakeholders also provided insights on new technologies being investigated by industry for use in the field. Stakeholders were defined as companies operating liquids gathering pipelines in North Dakota. Working with the Governor’s Office and North Dakota Department of Mineral Resources to develop a comprehensive list of potential participants, and drawing from the EERC’s list of stakeholders from Phase I of the pipeline study, the EERC invited nearly 40 companies to participate. The EERC hosted three meetings with stakeholders to encourage their input into the study. The first meeting framed the scope and intent of the study, thus setting expectations for both the EERC and industry stakeholders. A second meeting was hosted after the EERC’s initial discovery period and after the EERC had a body of knowledge to discuss with the group. The third meeting

INTRODUCTION September 2018
3
was hosted to review the findings of the study and elicit comments from the stakeholders before the report draft was finalized. Each stakeholder meeting was made up of 30 to 50 individuals representing 25 to 30 companies participating in the discussion and ensuring the practicality of the study findings. Another benefit of assembling the stakeholder group was that the EERC was able to create an industry forum that facilitated discussion of issues faced by all pipeline operators and potential solutions to those issues. The forum facilitated industry self-education that raised the awareness and performance of all members. Some in the stakeholder group shared successful experiences in risk assessment and exploration of new technologies, while others benefitted from learning of those successful experiences.
3. Review of Risk Assessment Methodologies The EERC developed an overview of possible risk assessment methodologies applicable to liquids gathering pipeline systems. Included in this overview is an evaluation of the challenges and opportunities in application of risk assessment to liquids gathering pipelines. Specifically, the state wishes to understand whether risk assessment can be employed as a tool to prioritize attention and risk reduction activities on higher-risk segments or subsystems. It is hoped that risk assessment will provide benefit to industry seeking to prioritize risk mitigation efforts and to state regulators seeking to prioritize pipeline oversight activities and that it will contribute to improved product delivery and waste disposal.
4. Strategies for Continuous Improvement
Closely tied to the task described above, the EERC addressed the role of continuous improvement principles in liquids gathering pipeline operations. Specifically, the state desires guidance on how the impact of continuous improvement strategies might be measured. Employment of continuous improvement principles may form a basis for evaluating success and may provide data from which to make decisions to perform better in the future, on a pathway to zero pipeline leaks.


CHAPTER 1 – EMERGING TECHNOLOGY FOR LIQUIDS GATHERING PIPELINES September 2018
4
I. STATE OF TECHNOLOGY APPLICABLE TO LIQUIDS GATHERING PIPELINES
Phase I of this pipeline study produced a report in December 2015 that discussed various leak detection technologies available at that time. New technology has since become available, much of it very recently during later months of 2017. These new technologies will be briefly highlighted in this report. Additionally, this report will feature brief descriptions of emerging leak prevention technologies. Technologies such as in-line inspection and advanced machine learning technologies (a subset of the field of artificial intelligence [AI]) to predict problems before they happen using existing data sets are included in this discussion. Industry, via the stakeholder group described earlier, has expressed its preference for leak prevention technologies over leak detection technologies. As discussed in the Phase I report, applying leak prevention and leak detection technologies to liquids gathering pipelines is, in many ways, more complicated than applying these tools to straight-line transmission pipelines:
• Unlike transmission pipelines, gathering pipeline systems are constantly transitioning in flow, pressure, line-packing, and pump status.
• Unlike transmission pipelines, gathering pipeline systems have tens to hundreds of
pipeline connections. • Economic justification for expensive leak detection or leak prevention technologies on
small-diameter gathering pipelines is more difficult, compared to large-diameter, high-throughput, high-product-value transmission pipelines.
Many of the technologies examined by the EERC for applicability to liquids gathering pipelines are developing right now. The technologies summarized within this report were not available at the time of the December 2015 report, or even until sometime in 2017. The EERC suggests that four factors contribute to this rapidly changing landscape of available or developing technology:
1) A rapidly expanding new market for technology solutions suited to small-diameter liquids gathering pipelines.
2) New regulation on liquids gathering pipelines caused by rapidly expanding infrastructure.
KEY TAKEAWAYS:
• New technology to prevent and detect pipeline leaks is being developed right now.
• We discussed in the December 2015 report that application of leak prevention and leak detection technologies to liquids gathering pipelines is more complex than application to transmission pipelines.

CHAPTER 1 – EMERGING TECHNOLOGY FOR LIQUIDS GATHERING PIPELINES September 2018
5
3) Increased public attention on pipelines in recent years due to a variety of factors, not all of which are directly related to otherwise safe operations of pipelines.
4) Pipeline operator’s desire for increased efficiency in operations.
The result is an incomplete awareness of constantly and rapidly emerging technology options among pipeline operators who focus on safe and profitable delivery of petroleum to market. II. KEY TERMS USED IN THIS CHAPTER
Artificial Intelligence (AI)
No commonly accepted definitions of AI exist, but the term has informally been accepted to label those technologies that permit data gathering and data analysis without the direction of the human mind. There are many branches of AI, as identified in Figure 1. In this report, AI combines the ability to recognize patterns in text or data with the very different ability to weigh the evidence that matching those patterns provides (Hammond, 2015).
BVLOS Beyond visual line of sight (BVLOS) is an important concept in the emerging drone industry. At the time of this report, Federal Aviation Administration (FAA) rules preclude BVLOS flight with drones. This is, perhaps, the chief limiting factor in the broadscale emergence of drones as a mainstream tool for industry.
Drone/UAS/UAV “Drones” has become a common label for what was formerly called “unmanned aerial systems” or “unmanned aerial vehicles.” These are small, light aircraft (either rotorcraft or fixed-wing aircraft) that can be deployed to monitor areas of concern without humans in the aircraft.
Inline Inspection (ILI)
In-line inspection is a category of leak prevention technologies that are employed to ascertain the physical condition of the pipeline. In-line inspection employs inspection tools that travel within the pipeline to measure various features of that pipeline.
Leak Detection In this report, leak detection refers to the act of identifying an unintentional release of fluids from a pipeline. The ideal identification occurs immediately upon release, and instantly notifies the pipeline operator of location and size of the release. Leak detection technology is any tool that accomplishes identification of an unintentional release.
Leak Prevention In this report, leak prevention refers to methods employed to preclude unintentional releases of fluids from pipelines before they happen. Every pipeline operator prefers leak prevention to leak detection because unintentional releases from pipelines damage the environment, result in additional cleanup costs to the operator, and result in lost revenue from sale of commodity products. Leak prevention technology is any tool that monitors the “health” of the pipeline (e.g., joint integrity, wall corrosion/erosion, material flaws) to identify risks that may LEAD to an unintentional release of fluid from the pipeline.
Machine Learning Algorithms
In this report, machine learning algorithms refers to computer code that is focused on productive self-modification as more and more data are consumed. Rather than being focused on prescribed, fixed coding to deliver an answer using a predetermined set of equations, machine learning algorithms are capable of looking for differences in that data, then redefining the logic of the code to pursue investigation of those differences.
CHAPTER 1 – EMERGING TECHNOLOGY FOR LIQUIDS GATHERING PIPELINES September 2018
6
III. A SAMPLING OF EMERGING TECHNOLOGIES APPLICABLE TO LIQUIDS GATHERING PIPELINE LEAK PREVENTION AND LEAK DETECTION
The EERC has explored a number of new and developing technologies for purposes of this study. By no means is it suggested that the following sampling of new and emerging technologies is a comprehensive overview of all new technology applicable to leak prevention and leak detection for liquids gathering pipelines. Instead, the reader should consider this summary as a partial sampling of emerging technologies that may have applicability to liquids gathering pipelines in the near future. A. Emergence of Artificial Intelligence
AI is a field of technology that is rapidly, and only recently, maturing to serve a significant role across a broad range of industries. Seen as science fiction just a few years ago, AI is now being adopted as mainstream because of a convergence of many factors—greatly improved machine learning algorithms, availability of extensive processing and data storage made possible by the emergence of cloud computing, and continuously decreasing costs of processors and data storage. Defining AI is difficult. A concept known as the “AI effect” suggests that AI is whatever has not yet been accomplished by computational machines. Optical character recognition is now routine in many software packages but was once considered an application of AI. Similarly, many smartphones now employ face and voice recognition algorithms that were formerly considered the domain of AI. Many academic definitions of AI quickly become esoteric and philosophic. For purposes of this report, the EERC will employ the definition of AI employed by IBM’s Watson technology.
KEY TAKEAWAYS:
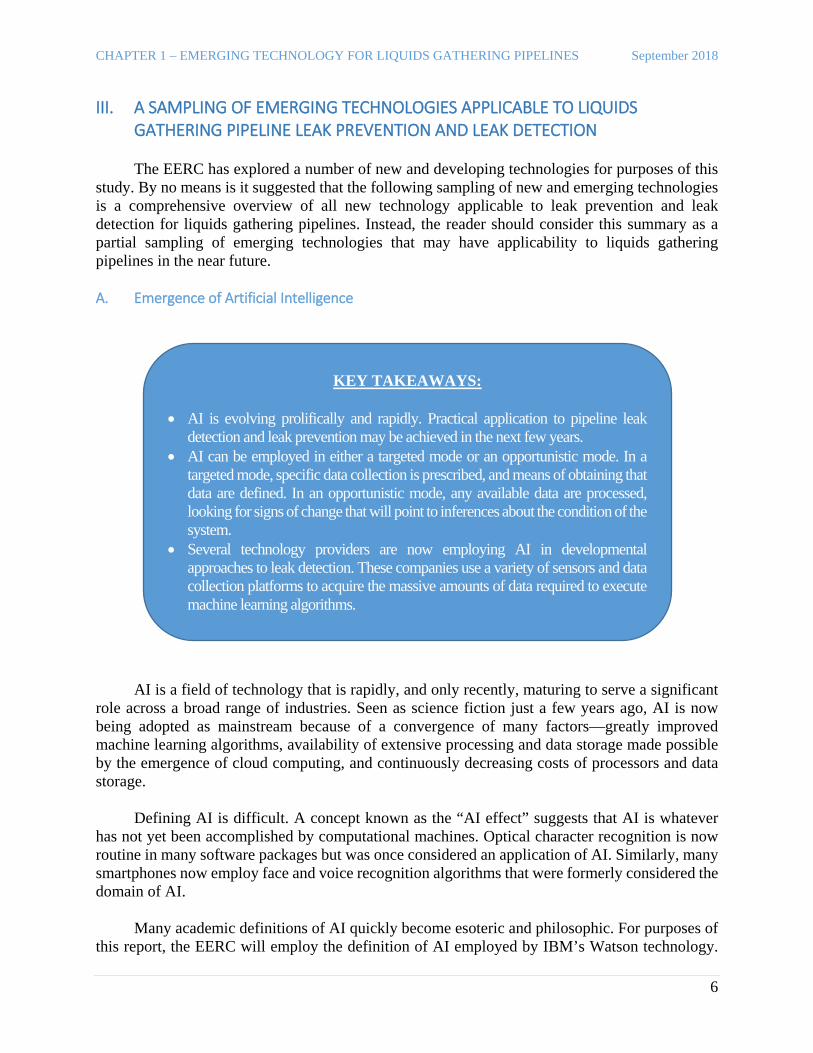
• AI is evolving prolifically and rapidly. Practical application to pipeline leak detection and leak prevention may be achieved in the next few years.
• AI can be employed in either a targeted mode or an opportunistic mode. In a targeted mode, specific data collection is prescribed, and means of obtaining that data are defined. In an opportunistic mode, any available data are processed, looking for signs of change that will point to inferences about the condition of the system.
• Several technology providers are now employing AI in developmental approaches to leak detection. These companies use a variety of sensors and data collection platforms to acquire the massive amounts of data required to execute machine learning algorithms.

CHAPTER 1 – EMERGING TECHNOLOGY FOR LIQUIDS GATHERING PIPELINES September 2018
7
Watson combines the ability to recognize patterns in text or data with the very different ability to weigh the evidence that matching those patterns provides (Hammond, 2015). AI is capable of synthesizing analytical deductions from multiple, seemingly disparate, data sets, shining a light on conclusions previously missed. AI is, at its core, an intensive, adaptive difference engine. AI is looking for differences in multiple, integrated streams of data, and its machine learning algorithms “teach” it to refine its search for differences constantly. An attempt to describe the various branches of AI is presented in Figure 1.
Figure 1. Defining AI. AI technologies are evolving prolifically and rapidly and may hold promise to reduce pipeline leaks. In 2016, AI, machine learning, and deep learning were terms known within Silicon Valley circles but were not commonplace in public media missives. In 2017, acknowledged technological innovators such as Elon Musk of SpaceX and Tesla Motors (Finlay, 2017), Bill Gates of Microsoft (Shermer, 2017), Mark Zuckerberg of Facebook (Bogost, 2017), Andrew Ng of Stanford University and Google (Nakashima, 2017), Tim Cook of Apple (Knight, 2017), and Stephen Hawking (Osborne, 2017) were quoted frequently on the topic of the in-progress revolution spurred by AI. In 2015, AI was a dream, and in 2017, it became reality with companies such as Microsoft, NEC, Boeing, Apple, Google, and others developing commercial offerings. AI is now viewed as a potential solution to the challenge of leak prevention and leak detection in pipelines. Companies are exploring application of machine learning to large data sets including remote imagery (including satellite, drone, commercial aircraft, and fixed sensors), supervisory control and data acquisition (SCADA) data, and field inputs from technicians with smart phones to analyze for minute changes that were not possible before the advent of machine learning algorithms because humans were required to not only process the data but also to develop the analytical techniques required to observe these indistinct changes.

CHAPTER 1 – EMERGING TECHNOLOGY FOR LIQUIDS GATHERING PIPELINES September 2018
8
Several technology providers are currently proposing demonstration projects that employ AI for pipeline leak detection. These technology providers are looking at streams of data from multiple sensors at multiple time intervals, then applying machine learning algorithms to look for hidden differences that would not be recognized if a specific, prescribed analytical technique were used on only one or two sets of data. B. Targeted, Drone-Based AI Pipeline Monitoring for Leak Detection A number of emerging, potential solutions employ AI technology (including machine-learning algorithms) to automatically process and analyze data collected from a variety of drone-based sensors. The use of drones makes this approach a targeted approach, actively collecting and analyzing data for a specific area with a planned flight path. This approach can be performed for a specific company, but it can also be performed for a number of companies operating in the same vicinity. Many who offer this approach have developed possible business plans to accommodate singular or multiple, banded clients. These companies typically offer this approach as a service, rather than selling a package for a pipeline operator to purchase and use within the company. These approaches are just beginning to be demonstrated around the world. As such, limited publicly available information on results exists. With each of these offerings, cybersecurity will be paramount. Connected Drone and Thundercloud by eSmart Systems www.esmartsystems.com A team led by eSmart Systems, a Norwegian company with demonstrated expertise in application of AI to energy systems, has created a drone/AI offering ready for application to the task of pipeline monitoring and leak detection. The team relies upon integrated participation of Microsoft (providing cyber security expertise and a data storage and processing platform called Azure), Kongsberg Digital (providing expertise in oilfield operations simulation), and SkySkopes (providing drone operations services). The eSmart approach utilizes advanced machine learning to decipher nonobvious differences across spatial and temporal data sets derived from a multisensor package. The sensors employed include a sodium-iodide-based gamma spectroscope, a medium-range infrared (MIR) sensor, a hyperspectral sensor, and a lidar (light detection and ranging) sensor. The sensor package will be configured from these options and customized for specific terrains and pipeline fluids.
Any one of these sensors’ data streams would not provide enough information at sufficient
resolution to result in an indication of pipeline leak at more than 6 feet below the surface, but the application of machine learning to combine and assimilate these data streams and determine nonobvious differences will result in indication of leak. eSmart’s confidence in this prediction rests in prior experience in development of AI for use in inspecting high-voltage power lines. (eSmart Systems, 2017).

CHAPTER 1 – EMERGING TECHNOLOGY FOR LIQUIDS GATHERING PIPELINES September 2018
9
Processing and analysis of collected data is accomplished with machine learning algorithms that will detect small differences in soil composition, foliage health, snow depth, and thermal signatures to provide indication of pipeline leakage. Data will be processed in a combination of layers that eSmart terms “edge computing” (onboard the sensor platform), fog computing (in a mobile operations center), and “cloud computing” (in virtual space) to deliver actionable condition information with location to the pipeline operator, as shown in Figures 2 and 3.
Before this system can be offered commercially, the team must prove that AI is capable of detecting pipeline leaks before a surface expression of the leak is evident, or at least before a worker could observe the signs of a leak during a regular inspection on foot. INEXA by Insitu (a Boeing company) https://insitu.com/ Insitu began business operations in 1994 and was acquired by aerospace giant Boeing Company in 2008. Now over 1000 employees strong, and more than 1,000,000 flight hours accumulated, Insitu focuses on remote sensing via unmanned aerial systems (UAS) for the following sectors: oil and gas, railroad, utilities, precision agriculture, border patrol, drug enforcement, military reconnaissance, wildfire management, and natural disaster recovery. It does so with three primary airframe platforms: the ScanEagle, the Integrator, and the RQ-21A Blackjack. Most recently, Insitu contracted with Shell Oil’s Queensland Gas Company (QGC) to provide routine infrastructure inspection and management services. Insitu claims this as a global first in beyond visual line of sight (BVLOS) drone operations. Insitu will routinely inspect QGC facilities spread over more than 2700 square miles of remote Australian outback. The service provides actionable indications to QGC via automated processing and analysis of data collected
Figure 2. Thundercloud mobile operations center (courtesy of eSmart Systems).
Figure 3. Multilayered automated data analysis (adapted from eSmart Systems).

CHAPTER 1 – EMERGING TECHNOLOGY FOR LIQUIDS GATHERING PIPELINES September 2018
10
from regular overflights of the QGC facilities. Thus, little additional analysis is required of QGC staff. This is an automated system providing near-real-time indication of system status for a very large system of equipment. Insitu has branded its suite of remote sensing products and services as INEXA Solutions (outlined in Figures 4 and 5). INEXA Solutions automates data collection, data analysis, and delivery of actionable feedback via advanced analytics and secure information delivery. A goal of INEXA is to deliver only the data required by the customer to trigger action on the part of the customer, thus avoiding need for the customer to analyze the data itself. A strength of Insitu is that it is a vertically integrated solution provider. With Boeing backing, Insitu claims it is able to draw from internal sensor experts, internal payload integration experts, internal flight operations experts, and internal analytics experts to provide a tailored solution for companies.
Figure 4. INEXATM solutions suite (courtesy of Insitu).
CHAPTER 1 – EMERGING TECHNOLOGY FOR LIQUIDS GATHERING PIPELINES September 2018
11
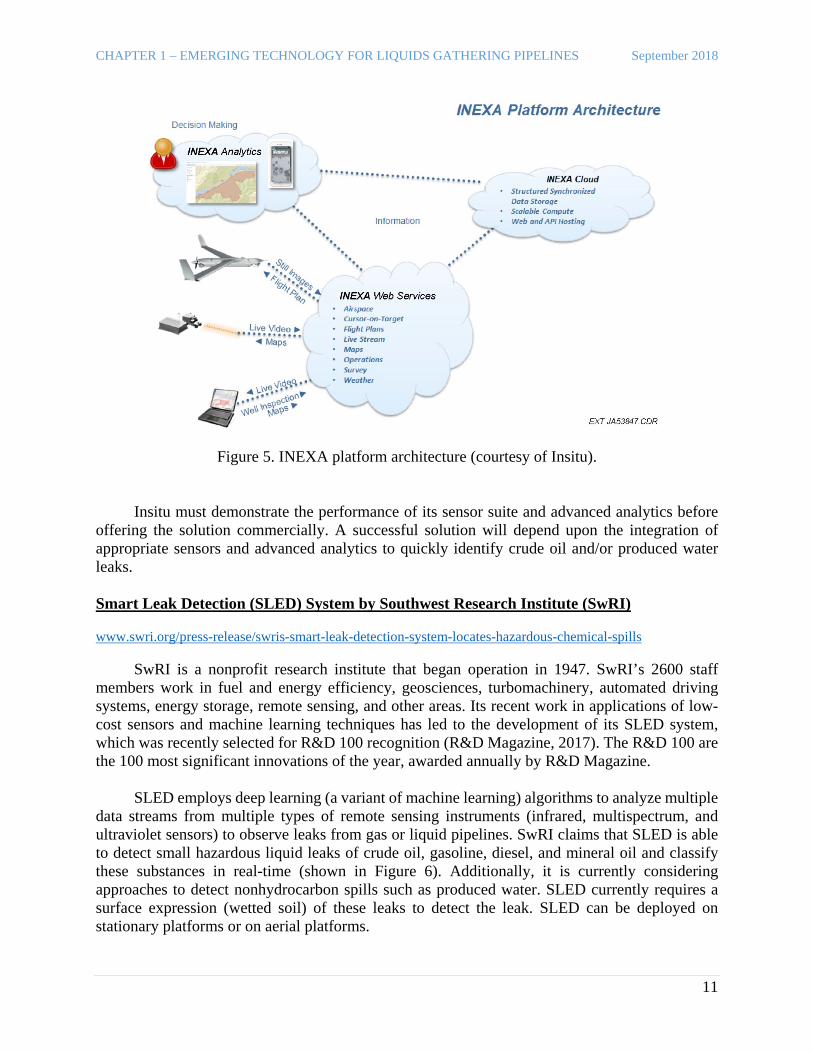
Figure 5. INEXA platform architecture (courtesy of Insitu). Insitu must demonstrate the performance of its sensor suite and advanced analytics before offering the solution commercially. A successful solution will depend upon the integration of appropriate sensors and advanced analytics to quickly identify crude oil and/or produced water leaks. Smart Leak Detection (SLED) System by Southwest Research Institute (SwRI) www.swri.org/press-release/swris-smart-leak-detection-system-locates-hazardous-chemical-spills SwRI is a nonprofit research institute that began operation in 1947. SwRI’s 2600 staff members work in fuel and energy efficiency, geosciences, turbomachinery, automated driving systems, energy storage, remote sensing, and other areas. Its recent work in applications of low-cost sensors and machine learning techniques has led to the development of its SLED system, which was recently selected for R&D 100 recognition (R&D Magazine, 2017). The R&D 100 are the 100 most significant innovations of the year, awarded annually by R&D Magazine. SLED employs deep learning (a variant of machine learning) algorithms to analyze multiple data streams from multiple types of remote sensing instruments (infrared, multispectrum, and ultraviolet sensors) to observe leaks from gas or liquid pipelines. SwRI claims that SLED is able to detect small hazardous liquid leaks of crude oil, gasoline, diesel, and mineral oil and classify these substances in real-time (shown in Figure 6). Additionally, it is currently considering approaches to detect nonhydrocarbon spills such as produced water. SLED currently requires a surface expression (wetted soil) of these leaks to detect the leak. SLED can be deployed on stationary platforms or on aerial platforms.

CHAPTER 1 – EMERGING TECHNOLOGY FOR LIQUIDS GATHERING PIPELINES September 2018
12
Figure 6. SwRI’s SLED hydrocarbon identification (courtesy of Southwest Research Institute). SwRI’s SLED has been demonstrated at laboratory scale (Araujo, 2016). While SLED has been demonstrated effective in characterizing hydrocarbon spills with surface expressions, SwRI is just beginning to explore solutions for brine spills. C. AI Utilizing Opportunistic Data Collection Applied to Pipeline Leak Detection Another approach to employment of AI is to passively collect and analyze existing data from available sources, rather than to actively target collection of custom data using tasked aircraft. These data can come from commercial airliners, fixed-wing or rotary aircraft, drones, satellites, or stationary observation points. An advantage of this opportunistic, platform-agnostic approach is that the user pays only for the data and processing of the data, not for the sensors or operations of the platform itself. A disadvantage of this approach is that the timing of the data collection is outside the control of the end user. Data are available for windows of time during which the satellite or commercial aircraft is positioned above the area of interest. This is, in turn, driven by schedules optimized for other purposes. Remote Sensing Leak Detection by Satelytics www.satelytics.com/ Satelytics is a small Ohio company specializing in acquisition and processing of opportunistic data sets to accomplish Earth-monitoring tasks for industry. At this time, Satelytics is entirely focused on commercial/industrial applications and does not contract with government entities. Satelytics acquires multi- and hyperspectral data from a variety of third-party sources including enterprise satellite data providers, airplane or drone aerial imagery, and fixed or

CHAPTER 1 – EMERGING TECHNOLOGY FOR LIQUIDS GATHERING PIPELINES September 2018
13
persistent camera platforms. These data, from across the entire electromagnetic spectrum, are collated into bands and processed by Satelytics advanced analytical algorithms. Satelytics applies complex machine learning algorithms to isolate the spectral signatures of objects and phenomena contained in the data (or the pixels of an image). Using scalable cloud computing resources, Satelytics then processes petabytes of data comprising thousands of individual aerial or satellite images and builds a repository of spectral signatures, then uses these algorithms to create alerts and visualizations on a Web-accessible platform customized to meet the customer’s needs. Satelytics has demonstrated this approach during calendar years 2016 and 2017 with oil and gas companies such as BP, Marathon Oil, Phillips 66, EQT Midstream, and Georgia Power. Satelytics states that it is ready to tune algorithms to meet the needs of customers across a wide variety of oilfield applications. An example of its pipeline leak detection output is shown in Figure 7.
Figure 7. Identification of pipeline hydrocarbon spill by Satelytics (courtesy of Satelytics). D. Distributed Measurements via Fiber Optic Cables Fiber optic cables have been employed in a variety of ways for decades. They are generally considered to be high-speed digital data transmission tools, but they also possess properties that lend themselves to distributed sensor applications. In distributed fiber optic measurements, as laser light travels through a transparent media, a small fraction of that light is backscattered through

CHAPTER 1 – EMERGING TECHNOLOGY FOR LIQUIDS GATHERING PIPELINES September 2018
14
interaction with the transparent media. This backscatter is different at every point along the cable and varies with the local environment. Vibration, temperature, or strain in the fiber optic cable can be measured by analyzing the backscatter signals returned to an optical sensor connected to the fiber optic cable. The resulting data provide information on the environment at every point along the cable.
In the past decade, fiber optics have been applied to pipeline leak detection. Orifice noise from a leak in the pipe can be detected, as can a negative pressure pulse propagating in the pipe. Both of these examples rely upon the fiber optics to detect minute vibrations, which in turn are rooted in strain measurements. Ground heave and soil slumping can also be detected with similar strain measurements within the cable. Finally, cable materials can be selected to swell in the presence of either salt water or hydrocarbons and can thus potentially detect leaks directly. These examples are illustrated graphically in Figure 8. The Fiber Optic Sensing Association (FOSA) began an intensive education campaign in 2017 to promote the utilization of fiber optic distributed measurements for pipeline applications. Only recently have electronics and algorithms to analyze the complicated backscatter signals advanced to the point where they are now commercially available for use in the pipeline sector. The U.S. Department of Defense has been utilizing this technology for facility intrusion detection for a number of years.
FOSA claims that costs associated with fiber optics are coming down with increased market penetration. However, FOSA admits that retrofitting existing pipelines is currently difficult, and is promoting fiber optics primarily for new installations. It may be especially applicable to challenging situations and remote areas.
Figure 8. Examples of application of distributed fiber optics sensing for pipelines.

CHAPTER 1 – EMERGING TECHNOLOGY FOR LIQUIDS GATHERING PIPELINES September 2018
15
E. Miniaturized In-Line Inspection to Avoid Leaks
In-line inspection is a category of leak prevention technologies that are regularly employed in large transmission pipelines to ascertain the physical condition of the pipeline. In-line inspection employs inspection tools that travel within the pipeline to measure various features of that pipeline. Although there are several forms of in-line inspection, a prominent technology is known as smart pigging. A smart pig is an instrumented bolus pushed through a pipeline to measure changes in pipeline thickness, changes in pipeline geometry, spatial position of pipeline, or extent of corrosion in steel pipelines. Smart pigs can also be fitted with acoustic sensors to “listen” for leaks in the pipeline, if the fluid within the pipeline flows at a minimum pressure. Smart pigs have not been widely used in liquids gathering pipelines for a variety of reasons, including electronic payload size, system architecture, line size diversity, radius of bends in some systems, and a lack of need for in-line inspection on many gathering systems. Very recently, however, products have begun to appear that may prove to bridge this gap. Pipers™ Sensors by Ingu Solutions http://ingu.co/
Ingu Solutions is a small Alberta (Canada) company that has specialized in development of miniaturized, free-floating sensors (shown in Figure 9) used to detect leaks, geometric defects, and deposits within pipelines. Although the company’s stated goal is to offer in-line inspection for all pipelines without the need for heavy equipment or expensive consultants, the emergence of increased regulatory pressures on liquids gathering pipelines opens up a novel market for the company. The company’s “Pipers” product can float freely with liquids inside pipelines with diameters greater than 2 inches. Because these sensors are neutrally buoyant, and float with the transported fluid, they are not technically “smart pigs.” They are not pushed by fluid pressure as a bolus down the length of the pipeline. They do, however, claim to capture the same type of data obtained by traditional smart pigs: pressure, temperature, position, magnetic fields (which measure corrosion, erosion, and deformity in steel pipelines), and acoustics (which indicate leaks through the pipeline wall).
KEY TAKEAWAY:
• In-line inspection has not been widely used in liquids gathering pipelines because, until recently, installed sensors and power packages could not be miniaturized enough to enable them to fit within smaller diameters. Very recently, however, products are being developed to bridge this gap.
Figure 9. Pipers sensor (courtesy of Ingu Solutions).

CHAPTER 1 – EMERGING TECHNOLOGY FOR LIQUIDS GATHERING PIPELINES September 2018
16
At the 15th Annual Energy & Clean Technology Venture Forum in Houston in 2017, the Rice Alliance for Technology and Entrepreneurship named Ingu Solutions one of the ten most promising energy & clean technology venture companies. Industry interests including Chevron, Shell, Aramco Energy Ventures, BP, GE, Total, ConocoPhillips, Lime Rock Partners, Statoil, and others supported the Forum. In 2017, Ingu Solutions completed 11 paid pilot projects with the Pipers™ sensors with, among others, Shell and Chevron. In February 2018, the first field project was successfully executed in a 10-km sour gas line in Alberta, Canada. Currently, field projects are prepared with major U.S. oil and gas operators. Ingu Solutions received CSA International certification (Class 2258-04 and -84, Process Control Equipment, Intrinsically Safe) for hazardous locations in November 2017. SmartBall® by Pure Technologies https://puretechltd.com/technology/smartball-leak-detection/
Pure Technologies is an Alberta (Canada) firm that offers a product called “SmartBall” (shown in Figures 10 and 11) that more closely resembles traditional smart pigs, but can be pushed through pipelines as small as 6 inches in diameter. Pure Technologies claims that its multisensor in-line inspection tool is capable of assessing pipelines lacking traditional pigging infrastructure and provides operators with pipeline data that traditional tools cannot provide. The tool can simultaneously collect acoustic data to confirm containment, temperature, pressure, and inertial mapping data.
According to Pure Technologies, the SmartBall tool’s acoustic sensor can detect product losses as small as 0.03 gallons per minute. They also claim that, since commercial introduction in 2007, SmartBall has been used to inspect more than 25,000 miles of oil and gas pipelines and has detected seven leaks. The tool has also been used to assess more than 4000 miles of freshwater pipelines and has detected more than 2000 leaks on these freshwater pipelines.
Figure 10. SmartBall in pipeline (courtesy of Pure Technologies).
Figure 11. Technicians extracting data from SmartBall (courtesy of Pure Technologies).

CHAPTER 1 – EMERGING TECHNOLOGY FOR LIQUIDS GATHERING PIPELINES September 2018
17
F. Dedicated Leak Detection for Challenging Situations and Remote Areas The EERC previously reported on available leak detection software for liquids gathering pipelines in the December 2015 report. Since that report was released, additional products have been released to address challenging situations such as river crossings, high-density population areas, or environmentally sensitive areas. Some of these products offer features to overcome communication and power infrastructure shortcomings found in remote areas of western North Dakota. Pipeline Guardian® by Atmos International https://atmosi.com/en-us/products-services/pipeline-guardian/ Atmos International’s Pipeline Guardian® product was released in 2016 as a turnkey leak detection system (shown in Figure 12) that can provide indication of very small leaks in challenging pipeline segments such as those in environmentally sensitive areas or remote locations where power and communications are a challenge. The system includes a master control panel with power and communications options that enable functionality in challenging locations, nonintrusive flow and pressure sensors, acoustic sensors, and a customized version of the Atmos Pipeline Guardian software described in the December 2015 report. Pipeline Guardian is intended to put intensive leak detection functionality on relatively small segments of pipeline in challenging or sensitive locations, as summarized in Figure 13. Atmos claims remote location functionality, fast detection time, high sensitivity, accurate leak location capability, and nonintrusive sensor installation. Atmos also claims that Guardian functions effectively with slack flow, a challenging condition discussed in the December 2015 report.
Figure 12. Pipeline Guardian sensor installation (adapted from Atmos International).

CHAPTER 1 – EMERGING TECHNOLOGY FOR LIQUIDS GATHERING PIPELINES September 2018
18
Figure 13. Pipeline Guardian components (courtesy of Atmos International).
IV. PREREQUISITES FOR PROLIFERATION OF DRONE EMPLOYMENT IN PIPELINE MONITORING
KEY TAKEAWAYS:
• Although drones are frequently discussed as a promising tool for pipelines, certain prerequisites must underlie their fruitful application:
- Drones are merely platforms for scientific sensors. Focus must be placed on
collection of insightful data via these sensors. - Huge amounts of data can be collected, but those data require appropriate
analysis. To make analysis of large quantities of data economic, automated data processing and analysis must be employed.
- Drones will only be economical for application to large-area gathering pipeline systems if rules for BVLOS flight operations are enacted.
- Automated flight operations (takeoff, flight path, data collection, landing, data uploading) will greatly enhance the economics of drone application.

CHAPTER 1 – EMERGING TECHNOLOGY FOR LIQUIDS GATHERING PIPELINES September 2018
19
Drones as tools for industry have received significant attention in very recent years. Drones promise new efficiencies for observation of oilfield activities with minimal operational costs. This report would be incomplete without a deeper look at the opportunities and challenges presented by this tool. Drones are platforms for scientific measurements of oilfield operations in remote areas. They may significantly decrease the labor hours required to observe thousands of well sites and thousands of miles of pipeline, and may make it possible to more frequently observe all oilfield facilities in a cost-effective manner. All of these promises rely upon the following unproven prerequisites: science-based payloads, automated collection and processing of data, BVLOS operations, and automated flight operations. A. Science-Based Payloads Many drone operators are currently offering their services to observe oilfield operations. Most of these operators are currently relying upon simple visual data collection from an electro-optical (EO) sensor – essentially a camera mounted on an elevated platform. While this may be useful in certain situations, the EERC suggests that marked advancement will depend upon integration of more scientific sensors into the payloads of these drones. Hyperspectral, multispectral, infrared, lidar, radiological, and other advanced sensors will greatly multiply the benefits offered by drones in acquiring insightful data on oilfield operations. • Hyperspectral instruments measure continuous
ranges of the electromagnetic spectrum and can be tuned to focus on desired ranges, as illustrated in Figure 14. Hyperspectral imaging has been used to monitor development and health of foliage and to determine composition of gaseous releases from equipment. An advantage of hyperspectral measurements is that the instrument user requires no prior knowledge of a sample. A broad spectrum is acquired for each sample zone, and the data are then postprocessed to mine information. Hyperspectral instruments, however, tend to cost more than comparable EO, infrared, and multispectral instruments. In addition, because they are collecting large amounts of data from across the spectrum, the data storage needs are larger, adding complexity to the payload.
Figure 14. Hyperspectral image.

CHAPTER 1 – EMERGING TECHNOLOGY FOR LIQUIDS GATHERING PIPELINES September 2018
20
• Multispectral instruments focus on multiple, separate bands of the electromagnetic spectrum, as illustrated in Figure 15. A single multispectral instrument, for example, may simultaneously measure a green band (approximately 520– 600-nm wavelengths), a near infrared band (approximately 750–900 nm), and a far infrared band (2000–2500 nm). Multispectral instruments have been used to identify large-scale environmental changes after fire damage or flooding.
• Lidar instruments use pulsed lasers to create highly
dimensionally accurate point clouds of complex surfaces such as the example shown in Figure 16. These point clouds can be used to monitor land elevations with a great degree of accuracy, used for site selection or site reclamation activities, or used to monitor subsidence. A lidar instrument typically consists of a laser, a high-speed rotating scanner, and a geolocation instrument. Laser light reflects off a scanned surface, a sensor measures the reflected light to determine range, and these data are combined with geolocation information to create the point cloud.
• Infrared instruments measure wavelengths of light
slightly longer than those found in the visible portion of the electromagnetic spectrum. Infrared can be used to observe thermal features not visible with EO instruments, and can be used to detect the presence of certain gases that may provide indication of a crude oil leak. Infrared instruments are currently in use in the oilfield to detect fugitive methane emissions. An example infrared image is shown in Figure 17.
• Radiological instruments measure radiation
emissions from not just surfaces, but masses. Advanced instrumentation can distinguish individual isotopes. These instruments have been used to provide an additional layer of information regarding produced water spills, although this is still developmental work.
Compared to simple EO instruments, the instruments listed above generally present greater payload weight and power challenges for drone applications. This, in turn, tends to demand larger, fixed-wing drone platforms and higher costs.
Figure 15. Multispectral image.
Figure 16. Lidar image.
Figure 17. Infrared image.

CHAPTER 1 – EMERGING TECHNOLOGY FOR LIQUIDS GATHERING PIPELINES September 2018
21
B. Automated Collection and Processing of Data All of the scientific instruments listed above generate copious amounts of data. Some drone operators tout that they can provide 4 terabytes of data to pipeline operators every day. Discussions the EERC has held with pipeline operators clearly indicate that this is not valuable to most pipeline operators. Receipt of mountains of raw data means that the pipeline operators must employ teams of analysts to process and interpret the data. What pipeline operators require is actionable intelligence from this data—a red flag to indicate a problem or a green flag to indicate situation normal. To make the collection and processing of data economic at large scale, it is anticipated that AI will be revolutionary. It is also anticipated that widespread, commercial application of AI is imminent, as evidenced by the quantity of proposed solutions presented herein that rely upon the application of AI. C. Beyond Visual Line-of-Sight (BVLOS) Operation The third pillar required to dramatically increase the utilization of drones in the oil field is BVLOS operations. Currently, the Federal Aviation Administration (FAA) prohibits BVLOS operations for drones. Drones must be operated within the visual range of the drone pilot, which limits the operational area to approximately 6–7 square miles around a stationary point. For liquids gathering pipeline systems that branch out over miles, it will generally be less economical to operate the drones in piecemeal fashion, setting up in one location, then moving multiple times to provide adequate coverage over a large area of operations. Changes in FAA regulations allowing BVLOS operations could lead to transformational changes in the use and advantage of drones for pipeline monitoring. D. Automated Flight Operations Finally, the most economical vision of future drone operations includes automated launch, flight, and recovery of the drone over a predetermined flight path. Removing the pilot and teams of data analysts from the loop will open the door for dramatic increases in effective employment of drones in the oil field. Drone solutions requiring a large team of mission facilitators to operate will likely always face economic challenges.

CHAPTER 1 – EMERGING TECHNOLOGY FOR LIQUIDS GATHERING PIPELINES September 2018
22
V. CONCLUSIONS A variety of new technologies is emerging to address the needs of liquids gathering pipelines. These technologies have emerged since the 2015 EERC report on liquids gathering pipelines as a response to the developing market and a heightened interest in improving the operations and safety of liquids gathering pipelines. Many of these emerging technologies are not yet ready for easy commercial application, but are close to maturing. It is anticipated that with willing pipeline operators as demonstration partners, some of these technologies can be matured to directly contribute positively to the safe operation of liquids gathering pipelines. The development status of these technologies will likely change rapidly in the near term. Therefore, pipeline operators and state authorities should monitor their progress to determine appropriate timing for possible implementation. New technology can be applied to improve performance, but new technology does not necessarily mean fewer pipeline leaks. Addition of technology often leads to more hardware and software. These additions can contribute to new failure pathways and increased risk, especially when technology lacks sufficient proof of performance in a representative environment. The EERC encourages the investigation and testing of new approaches to improve pipeline performance. Additionally, stakeholders should proceed deliberately to ensure adequate testing and demonstration is achieved before implementation is widely deployed.
KEY TAKEAWAYS:
• Application of a new technology will not automatically eliminate pipeline leaks. Technology also has potential to add failure pathways with little performance benefit, if the technology is not appropriately applied.
• Pipeline operators should seek to employ technology where gains can be realized. To do so often requires development work to specifically tune these technologies for liquids gathering pipelines.


CHAPTER 2 – RISK ASSESSMENT FOR LIQUIDS GATHERING PIPELINES September 2018
23
I. RISK ASSESSMENT INTRODUCTION Risk is a concept with which most people are intimately familiar. Each day we make decisions regarding risk:
“What is the risk I’ll get sick from eating week-old leftovers from the refrigerator?”
“My car hasn’t had an oil change in 18 months, but I don’t have time for one and have to be in Chicago tomorrow morning. What are the risks to my engine?”
In such situations, our decisions tend to be casual assessments of risk based only on personal experience and intuitive, “gut feelings.” As a result, these assessments tend to be haphazard and disorganized and lack the comprehensiveness and fundamental data required for reliable judgments. Even our imprecise use of language hampers our ability to think effectively. For example, the use of the term “risk” in the above statements appears to represent “likelihood” in the first instance and “consequence” in the second, or perhaps represents a combination of both in both statements—it is difficult to tell. Formal risk assessments appear to share several characteristics:
They develop and consistently apply precise terminology.
They are systematic in that they apply well-defined, objective methods, often following explicit procedures.
They are comprehensive in two ways:
– They dissect the process by which an event and its consequence unfold into a chain or sequence of events.
– They continually develop and refer to aids, such as comprehensive lists of tools or other items (e.g., threats), to guide their considerations.
They collect relevant and objective data as the basis of decisions.
In situations where objective methods and data are limited, they fall back on next-best
methods and data sources, which often are experts, knowledgeable in the matters of interest, i.e., “subject matter experts” (SMEs).
They continuously work to improve all aspects of risk assessment.
Superficially, informal and formal risk assessment appear to start at approximately the same point: identifying portions of pipelines that are “important” in some way with respect to safety. From there, they proceed to consider what needs to be done to portions to improve their safety. Less formal assessments might involve a couple of individuals discussing and suggesting locations of concern based upon what they feel is appropriate. Without a systematic methodology and aids to guide thought to consider a wide range of factors, such methods could easily fail to recognize

CHAPTER 2 – RISK ASSESSMENT FOR LIQUIDS GATHERING PIPELINES September 2018
24
and accurately assess important considerations. More formal methods, such as hazard and operability studies (HAZOP), often provide guidance as to what types of expertise should be involved to ensure a breadth of experience and perspective is represented and which factors should be considered. However, such teams typically focus on how an incident could occur, with less attention to its likelihood or consequences. Formally, American Society of Mechanical Engineers (ASME) B31.8S and American Petroleum Institute (API) RP-1160 consider risk assessment to be a component of risk management—which itself is a part of pipeline integrity management—with an objective of prioritizing pipeline segments for integrity assessments and additional actions, such as prevention and mitigation actions. In order to accomplish this, pipeline literature:
Carefully defines terms, such as risk, prevention, mitigation, and so on. For example, the ASME and API standards define risk as a measure of potential loss in terms of both incident likelihood or probability of occurrence and magnitude of the consequences.
Suggests methods that: – Analyze the likelihood/probability of occurrence of events on pipeline segments. – Analyze consequences of events on pipeline segments. – Relate the likelihood/probability and consequence to estimate risk on pipeline
segments. – Prioritize segments based upon estimated risk.
Presents a list of threats to be considered when analyzing likelihood/probability.
Promotes continually improving methods and the quality of data used by analyses in
terms of representativeness, objectivity, and in other ways.
As additional help to understanding and accomplishing this, the current study introduces two aids:
The concept of the “risk chain” (a chain of events that connect threats to consequences and contributors that influence the existence of threats and the progression along the chain).
By way of example, a list of a wide variety of specific contributors.
As depicted in Figure 18, risk estimates generated to prioritize pipeline segments rely on threat and consequence analyses that employ valid and comprehensive methods. These methods, in turn, consider intended acts and unintended hazards, which are supported by appropriate data. To aid analysts – as indicated by dashed-line boxes – ASME and API standards have defined the threats to be considered. This report includes an extensive list of situations, acts, and conditions (“contributors”) that could influence the impact of preventive and mitigative acts and hazards. These items are discussed more thoroughly in the remainder of this chapter.

CHAPTER 2 – RISK ASSESSMENT FOR LIQUIDS GATHERING PIPELINES September 2018
25
Figure 18. Overview of a pipeline risk assessment process. Organizations that oversee and perform hazardous operations, such as the U.S. Nuclear Regulatory Commission and the National Aeronautics and Space Administration, have developed extremely detailed, highly mathematical and very systematic methods to assess risk leading to decisions. Such methods are more expensive and labor-intensive than can be justified for use by many industries. However, merely because such advanced assessment methods might be too difficult, expensive or otherwise inappropriate does not imply that the casual approaches mentioned above are acceptable. Instead, companies benefit by seeking rational approaches that match the needs of the specific situation of interest. Any rational approach that promotes systematic and comprehensive assessment is likely superior to casual assessments or evaluations based upon limited personal experience and intuition. Formal risk assessment is very much a technical pursuit with language, concepts and methods that can be challenging for the uninitiated to master. Discussion in this chapter seeks to describe fundamental concepts and terminology in a manner consistent with the existing pipeline risk-assessment literature. It will discuss and provide examples of different risk assessment approaches and models. Additionally, it will present several commonly recognized quality characteristics of pipeline risk assessments and will highlight several nascent and evolving trends and topics related to risk assessment. II. KEY TERMS AND ACRONYMS USED IN THIS CHAPTER Absolute Risk Assessment
In this report, risk assessment methods that produce absolute risk estimates. Refer to absolute risk estimates.
Absolute Risk Estimates
Risk estimates produced by risk assessment methods that employ objective methods and data that can be understood and related to historical data or other absolute risk estimates from situations other than that being assessed. Absolute risk estimates are often expressed in units of events per year and dollars or injuries per year, which can be related to other pipelines or situations. This contrasts with

CHAPTER 2 – RISK ASSESSMENT FOR LIQUIDS GATHERING PIPELINES September 2018
26
relative risk estimates that lack universality and generalizability for comparisons outside of the method and/or pipeline being assessed.
Consequence Impact that a pipeline failure could have on the public, employees, property and the environment (ASME B81.8S, 37). Any unplanned effect on the environment, people or pipeline operation (Mora and others, 2016, 233). Is measured in a variety of ways: as fatalities or injuries if the consequences involve human health or safety or cost required to repair damage and restore the affected environment if the consequences involve environmental damage (PHMSA Risk Assessment Fact Sheet). Describes the result of an accidental event. The consequence is normally evaluated for human safety, environmental impact and economic loss (DNVGL-RP-F107).
Consequence Ranking
Used to describe the severity of a consequence. Consequences are ranked from 1 (minor, insignificant) to 5 (major, catastrophic) (DNVGL-RP-F107).
Consequence Analysis
Within this report, a consequence analysis is a component of risk assessment in which relevant situations, acts, or conditions that are associated with hazards and mitigative actions are identified and evaluated to produce an understanding of the nature of the consequences and estimate their severity. Consequence analyses often serve as a basis for determining appropriate mitigative measures. Historical and calculated data (such as physical models), statistical methods, as well as event trees, fault trees and other tools are often employed in consequence analysis.
Continuous Improvement
In this report, continuous improvement refers to actions taken to improve the quality of the systems, methods, and data in accomplishing risk management, risk assessment, and their subordinate activities. “Quality” here refers to objectiveness, representativeness, accuracy, and other desirable traits.
Direct Assessment
An integrity assessment method that utilizes a process to evaluate certain threats (e.g., external corrosion, internal corrosion and stress corrosion cracking) to a covered pipeline segment’s integrity. The process includes the gathering and integration of risk factor data, indirect examination to identify areas of suspected corrosion, direct examination of the pipeline in these areas, and post assessment evaluation (49 CFR 192.903).
Frequency Describes the likelihood per unit time of an event occurring (DNVGL-RP-F107). Frequency Ranking
Describes the frequency of an event. The frequency is ranked from 1 (low) to 5 (high) (DNVGL-RP-F107).
Hazard In this report, any operator-unintended or uncontrollable situation, act or condition that primarily affects threats, but could also affect events or consequences. (For example, flooding at a river crossing is a threat, but it also can increase consequences of a release by distributing pipeline contents over a larger area.) Other definitions: Any situation, event or condition able to initiate or grow an integrity threat (Mora,
Pipeline Integrity Management Systems). Used synonymously with danger, especially with respect to persons, property and
environment (49 CFR 190–199).
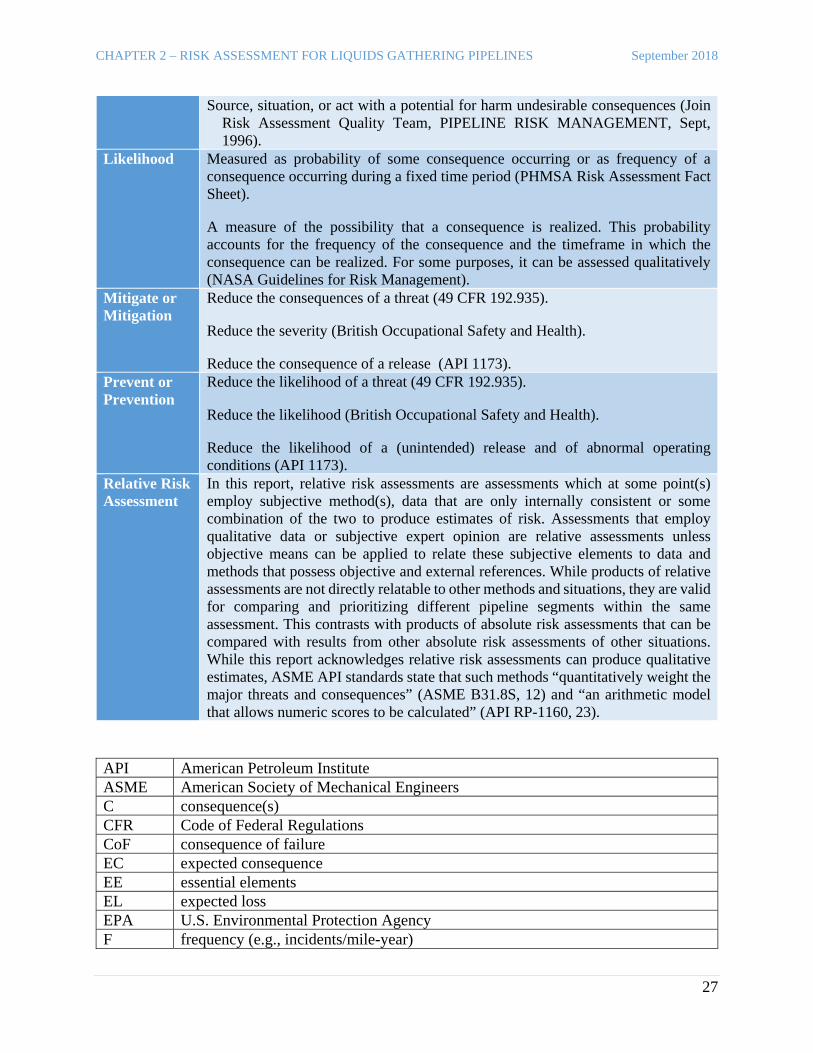
CHAPTER 2 – RISK ASSESSMENT FOR LIQUIDS GATHERING PIPELINES September 2018
27
Source, situation, or act with a potential for harm undesirable consequences (Join Risk Assessment Quality Team, PIPELINE RISK MANAGEMENT, Sept, 1996).
Likelihood Measured as probability of some consequence occurring or as frequency of a consequence occurring during a fixed time period (PHMSA Risk Assessment Fact Sheet).
A measure of the possibility that a consequence is realized. This probability accounts for the frequency of the consequence and the timeframe in which the consequence can be realized. For some purposes, it can be assessed qualitatively (NASA Guidelines for Risk Management).
Mitigate or Mitigation
Reduce the consequences of a threat (49 CFR 192.935). Reduce the severity (British Occupational Safety and Health). Reduce the consequence of a release (API 1173).
Prevent or Prevention
Reduce the likelihood of a threat (49 CFR 192.935). Reduce the likelihood (British Occupational Safety and Health). Reduce the likelihood of a (unintended) release and of abnormal operating conditions (API 1173).
Relative Risk Assessment
In this report, relative risk assessments are assessments which at some point(s) employ subjective method(s), data that are only internally consistent or some combination of the two to produce estimates of risk. Assessments that employ qualitative data or subjective expert opinion are relative assessments unless objective means can be applied to relate these subjective elements to data and methods that possess objective and external references. While products of relative assessments are not directly relatable to other methods and situations, they are valid for comparing and prioritizing different pipeline segments within the same assessment. This contrasts with products of absolute risk assessments that can be compared with results from other absolute risk assessments of other situations. While this report acknowledges relative risk assessments can produce qualitative estimates, ASME API standards state that such methods “quantitatively weight the major threats and consequences” (ASME B31.8S, 12) and “an arithmetic model that allows numeric scores to be calculated” (API RP-1160, 23).
API American Petroleum Institute ASME American Society of Mechanical Engineers C consequence(s) CFR Code of Federal Regulations CoF consequence of failure EC expected consequence EE essential elements EL expected loss EPA U.S. Environmental Protection Agency F frequency (e.g., incidents/mile-year)
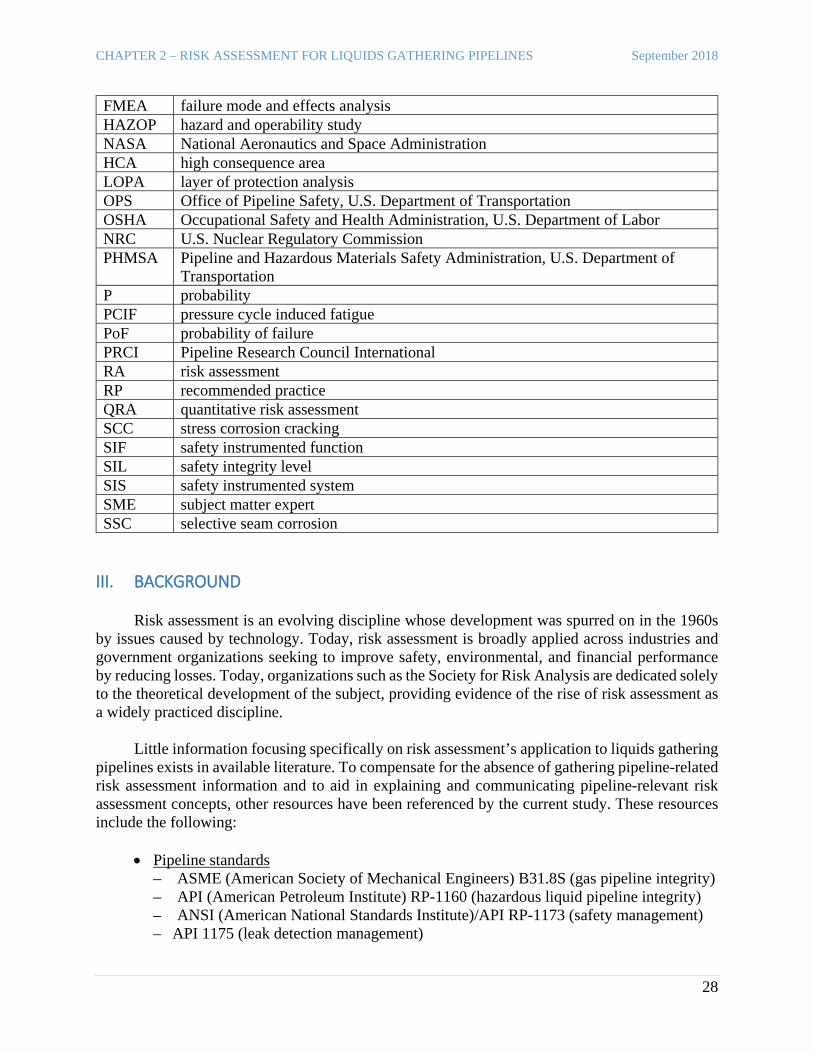
CHAPTER 2 – RISK ASSESSMENT FOR LIQUIDS GATHERING PIPELINES September 2018
28
FMEA failure mode and effects analysis HAZOP hazard and operability study NASA National Aeronautics and Space Administration HCA high consequence area LOPA layer of protection analysis OPS Office of Pipeline Safety, U.S. Department of Transportation OSHA Occupational Safety and Health Administration, U.S. Department of Labor NRC U.S. Nuclear Regulatory Commission PHMSA Pipeline and Hazardous Materials Safety Administration, U.S. Department of
Transportation P probability PCIF pressure cycle induced fatigue PoF probability of failure PRCI Pipeline Research Council International RA risk assessment RP recommended practice QRA quantitative risk assessment SCC stress corrosion cracking SIF safety instrumented function SIL safety integrity level SIS safety instrumented system SME subject matter expert SSC selective seam corrosion
III. BACKGROUND Risk assessment is an evolving discipline whose development was spurred on in the 1960s by issues caused by technology. Today, risk assessment is broadly applied across industries and government organizations seeking to improve safety, environmental, and financial performance by reducing losses. Today, organizations such as the Society for Risk Analysis are dedicated solely to the theoretical development of the subject, providing evidence of the rise of risk assessment as a widely practiced discipline. Little information focusing specifically on risk assessment’s application to liquids gathering pipelines exists in available literature. To compensate for the absence of gathering pipeline-related risk assessment information and to aid in explaining and communicating pipeline-relevant risk assessment concepts, other resources have been referenced by the current study. These resources include the following:
• Pipeline standards – ASME (American Society of Mechanical Engineers) B31.8S (gas pipeline integrity) – API (American Petroleum Institute) RP-1160 (hazardous liquid pipeline integrity) – ANSI (American National Standards Institute)/API RP-1173 (safety management) – API 1175 (leak detection management)

CHAPTER 2 – RISK ASSESSMENT FOR LIQUIDS GATHERING PIPELINES September 2018
29
• U.S. Pipeline and Hazardous Materials Safety Administration (PHMSA) resources: regulations (49 CFR 190-199), inspection materials, safety advisory bulletins, public workshops, Risk Modeling Work Group (RMWG)
• Pipeline literature by subject matter experts – Muhlbauer: “Pipeline Risk Management Manual” (2004), “Pipeline Risk
Assessment” (2015) – Mora and others: “Pipeline Integrity Management Systems” (2016) – Mohitpour and others: “Pipeline Integrity Assurance – A Practical Approach” (2010)
• Other pipeline literature
– Industry magazines such as “Pipeline & Gas Journal” and “Pipeline International” – Conference proceedings such as NACE International, American Society for Quality – Journals such as “Journal of Hazardous Materials,” “Reliability Engineering &
System Safety,” and “Advances in Decision Sciences”
• Other industries’ and government agencies’ information sources – Industries: chemical process (petroleum refining and chemicals), nuclear, other – Agencies: Occupational Safety and Health Administration (OSHA), National
Aeronautics and Space Administration (NASA), U.S. Environmental Protection Agency (EPA), National Research Council (NRC), National Academies
It is important to note that reference to any particular document within this report does not imply any recommendation regarding the applicability or appropriateness of the concepts, methods, or guidance contained in the document to any particular gathering pipeline application. The documents only provide generally recognized concepts, perspectives, examples, and terminology that aid discussion within this report. This chapter on the topic of risk assessment will:
• Define risk, risk management, and risk assessment.
• Describe risk assessment-related concepts with respect to pipeline applications.
• Discuss different risk assessment approaches and models.
• Describe several commonly recognized quality characteristics of pipeline risk assessments.
• Develop a gathering pipeline scenario and describe three methods to assess its risk.
• Discuss several nascent and evolving trends and topics related to pipeline risk assessment.

CHAPTER 2 – RISK ASSESSMENT FOR LIQUIDS GATHERING PIPELINES September 2018
30
IV. DEFINITION AND PURPOSE OF RISK ASSESSMENT
A. Purpose of Risk Assessment Pipeline literature describes risk assessment as a component of risk management. The ultimate goal of risk management is to identify additional actions to ensure safety. Figure 19 graphically depicts the context of pipeline risk assessment. Data and expert opinions provide the basis for threat and consequence analyses which, when associated with pipeline location, produce a risk profile along a pipeline. The current EERC study regards the risk profile as the ultimate output of risk assessment. Subsequently, pipelines are segmented to identify portions that could most benefit from preventive/mitigative actions. When risk assessment is considered, it is crucial to realize that the quality of each element—data and expert opinion, threat and consequence analyses, and risk assessment tools and methods—is important to arrive at representative estimates of risk and that no deficiency in one element can be compensated for by another element. While much of the following discussion relates to risk assessment approaches (that is, methods that combine data, opinion, analyses, and tools to produce risk estimates), representativeness of results from any approach will decline because of missing or inaccurate data and opinions, analyses that fail to consider or properly analyze all threats and consequences, and misapplication of risk assessment tools. Thus the confidence placed in any approach may be an illusion if data, opinions, analyses, and tools are not appropriate for the method or cannot justify the same degree of confidence.
KEY TAKEAWAYS:
• The ultimate goal of risk management is to identify and prioritize actions to ensure safety. Pipeline literature describes risk assessment as a component of risk management.
• Risk assessment is conducted as part of a decision-making process directed at improving pipeline integrity.
• Available standards recommend that operators be provided great latitude performing risk assessment to ensure that the purpose and approach match the needs and resources of the situation.

CHAPTER 2 – RISK ASSESSMENT FOR LIQUIDS GATHERING PIPELINES September 2018
31
Figure 19. Pipeline risk assessment context. The meaning and usefulness of the output of risk assessment depend upon the risk assessment’s purpose and approach. ASME B31.8S and API RP-1160 recommend that operators be provided great latitude performing risk assessment to ensure that the purpose and approach match the needs and resources of the situation. Guidance is provided in API RP-1160:
API RP-1160 Guidance on Risk Assessment Latitude
“An integrity management program should be flexible. An integrity management program should be customized to support the operator’s unique conditions … Risk assessments can have varying scopes, varying levels of detail, and use different methods. However, the ultimate goal of assessing risks is to identify and prioritize the most significant risks so that an operator can make informed decisions about these issues.”

CHAPTER 2 – RISK ASSESSMENT FOR LIQUIDS GATHERING PIPELINES September 2018
32
Similar guidance from ASME B31.8S states:
A common perception is that risk assessment will produce a quantitative estimate of potential loss that can be immediately judged as acceptable or unacceptable. This may be a laudable goal, but exceedingly difficult to achieve. The aerospace and nuclear industries have made substantial, decades-long investments in such endeavors to secure their expensive and dangerous operations. Their best risk assessment outputs include probability curves and expressions of associated uncertainty, not the clear and unambiguous number commonly desired (Stamatelatos and Dezfuli, 2011; Siu and others, 2016). Given that the ultimate goal of risk management is prioritization of pipeline segments for preventative/mitigative actions, risk assessment only needs to produce a relative rating scheme that helps to compare pipeline segments. The output of risk assessment is an estimate of risk along pipelines, not decisions resulting from those estimates. Risk assessment practiced by the aerospace and nuclear industries recognize that risk estimates or ratings benefit from an understanding of the confidence or uncertainty associated with those estimates. The usefulness of risk estimates decreases as the error related to those estimates increases. (Stamatelatos and Dezfuli, 2011; Siu and others, 2016) Risk estimates also continuously change, as actions resulting from those risk estimates are implemented. Throughout the current EERC study, this inherent process will be referred to as continuous improvement. Continuous improvement is, in essence, a feedback loop as shown in
ASME B31.8S Guidance on Risk Assessment Latitude
“An integrity management program is continuously evolving and must be flexible. An integrity management program should be customized to meet each operator’s unique conditions … The operator is in the best position to gather and analyze this information … Risk assessments, which are the very foundation of an integrity management program, can vary in scope or complexity and use different methods or techniques. The ultimate goal of assessing risks is to identify the most significant risks so that an operator can develop an effective and prioritized prevention/detection/mitigation plan to address the risks … In developing the integrity management program a pipeline operator shall consider his company’s specific integrity management goals and objectives and then apply the processes to ensure these goals are achieved … There is no single ‘best’ approach that is applicable to all pipeline systems for all situations. This Code recognizes the importance of flexibility in designing integrity management programs and providing alternatives commensurate with the need … Risk assessments are required in order to rank the segments for integrity assessments. The performance-based approach relies on detailed risk assessments. There are a variety of risk assessment methods that can be applied based on the available data and nature of the threats. The operator should tailor the method to meet the needs of the system … The results of this step enable the operator to prioritize pipeline segments for appropriate actions that will be defined in the integrity management plan.”

CHAPTER 2 – RISK ASSESSMENT FOR LIQUIDS GATHERING PIPELINES September 2018
33
Figure 19. The actions resulting from risk management ideally improve the overall risk of a studied pipeline segment, which then results in a new risk assessment and comparison against other segments. B. Commonly Employed Definitions in Risk Assessment Risk At its core, risk is a measure of potential loss. However, references generally expand upon that statement by enumerating the elements that comprise risk. For example, 49 CFR 192.452, ASME B31.8S, and API RP-1160 and other pipeline-related documents define risk in terms of likelihood or probability of an occurrence of an incident and the magnitude of its consequences. API RP-1160 describes risk as “the product of the likelihood of a release times the consequences of the release.” A second, more comprehensive description proposed by Kaplan and Garrick (1981) and adopted by the Nuclear Regulatory Commission and National Aeronautics and Space Administration (Stamatelatos and Dezfuli, 2011; Siu and others, 2016) is that risk is the aggregation of all scenarios each taken with their related likelihoods and consequences. Each scenario with its associated likelihood and consequence is termed a “risk triplet.” A risk triplet exists for every expected scenario and, when considered collectively, they comprise risk. The risk triplet reflects the three questions routinely associated with risk analysis in the literature: “What can go wrong?” “How likely is it?” and “What are the consequences?” Another description substitutes frequency in terms of incidents per distance-time for likelihood and expresses consequence in terms of fatalities, injuries, financial cost, and so on per incident. When frequency and consequence are multiplied, a risk measure designated “expected consequence” results. Risk descriptions are tightly aligned with risk assessment methods. Threats vs. Hazards U.S. pipeline standards employ standardized terminology related to risk assessment. Based on a study of gas pipeline incidents, the Pipeline Research Council International (PRCI) identified 22 types of incident root causes. These types have been named “threat categories” by API RP-1160 or just “threats” by ASME B31.8S. The two standards organize threats into groups as noted in Table 1.
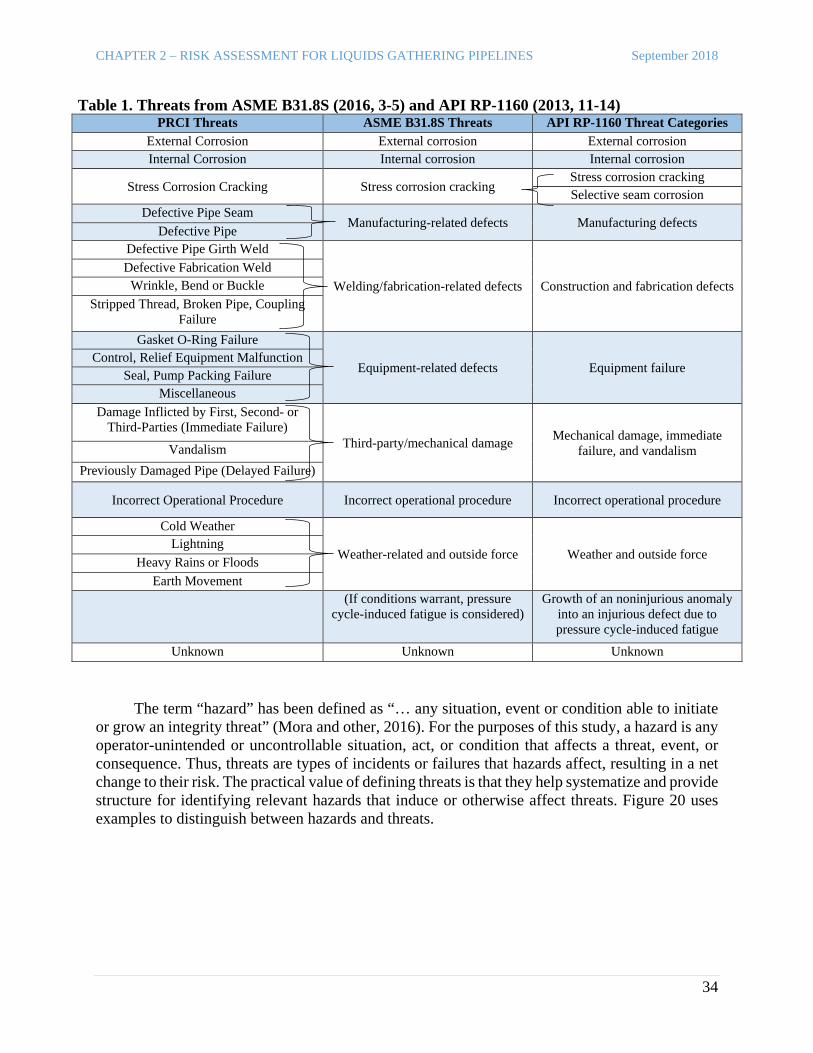
CHAPTER 2 – RISK ASSESSMENT FOR LIQUIDS GATHERING PIPELINES September 2018
34
Table 1. Threats from ASME B31.8S (2016, 3-5) and API RP-1160 (2013, 11-14) PRCI Threats ASME B31.8S Threats API RP-1160 Threat Categories
External Corrosion External corrosion External corrosion Internal Corrosion Internal corrosion Internal corrosion
Stress Corrosion Cracking Stress corrosion cracking Stress corrosion cracking Selective seam corrosion
Defective Pipe Seam Manufacturing-related defects Manufacturing defects Defective Pipe
Defective Pipe Girth Weld
Welding/fabrication-related defects Construction and fabrication defects Defective Fabrication Weld
Wrinkle, Bend or Buckle Stripped Thread, Broken Pipe, Coupling
Failure Gasket O-Ring Failure
Equipment-related defects Equipment failure Control, Relief Equipment Malfunction
Seal, Pump Packing Failure Miscellaneous
Damage Inflicted by First, Second- or Third-Parties (Immediate Failure)
Third-party/mechanical damage Mechanical damage, immediate failure, and vandalism Vandalism
Previously Damaged Pipe (Delayed Failure)
Incorrect Operational Procedure Incorrect operational procedure Incorrect operational procedure
Cold Weather
Weather-related and outside force Weather and outside force Lightning
Heavy Rains or Floods Earth Movement
(If conditions warrant, pressure cycle-induced fatigue is considered)
Growth of an noninjurious anomaly into an injurious defect due to pressure cycle-induced fatigue
Unknown Unknown Unknown The term “hazard” has been defined as “… any situation, event or condition able to initiate or grow an integrity threat” (Mora and other, 2016). For the purposes of this study, a hazard is any operator-unintended or uncontrollable situation, act, or condition that affects a threat, event, or consequence. Thus, threats are types of incidents or failures that hazards affect, resulting in a net change to their risk. The practical value of defining threats is that they help systematize and provide structure for identifying relevant hazards that induce or otherwise affect threats. Figure 20 uses examples to distinguish between hazards and threats.
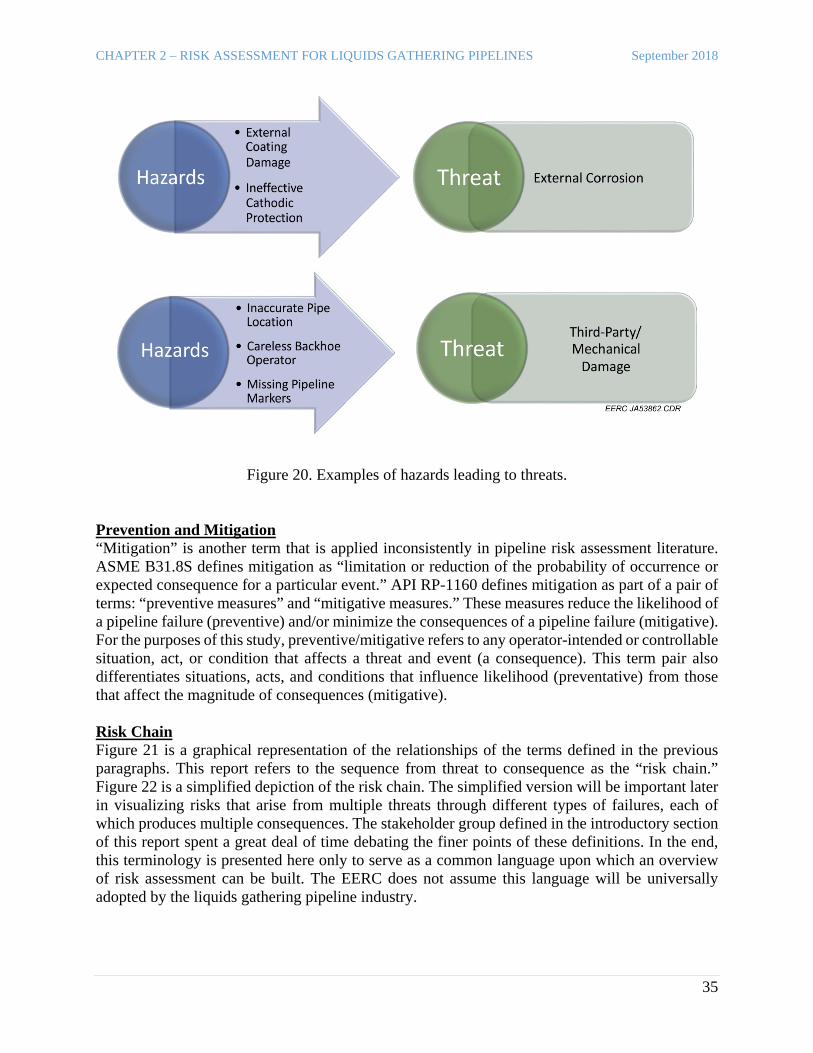
CHAPTER 2 – RISK ASSESSMENT FOR LIQUIDS GATHERING PIPELINES September 2018
35
Figure 20. Examples of hazards leading to threats.
Prevention and Mitigation “Mitigation” is another term that is applied inconsistently in pipeline risk assessment literature. ASME B31.8S defines mitigation as “limitation or reduction of the probability of occurrence or expected consequence for a particular event.” API RP-1160 defines mitigation as part of a pair of terms: “preventive measures” and “mitigative measures.” These measures reduce the likelihood of a pipeline failure (preventive) and/or minimize the consequences of a pipeline failure (mitigative). For the purposes of this study, preventive/mitigative refers to any operator-intended or controllable situation, act, or condition that affects a threat and event (a consequence). This term pair also differentiates situations, acts, and conditions that influence likelihood (preventative) from those that affect the magnitude of consequences (mitigative). Risk Chain Figure 21 is a graphical representation of the relationships of the terms defined in the previous paragraphs. This report refers to the sequence from threat to consequence as the “risk chain.” Figure 22 is a simplified depiction of the risk chain. The simplified version will be important later in visualizing risks that arise from multiple threats through different types of failures, each of which produces multiple consequences. The stakeholder group defined in the introductory section of this report spent a great deal of time debating the finer points of these definitions. In the end, this terminology is presented here only to serve as a common language upon which an overview of risk assessment can be built. The EERC does not assume this language will be universally adopted by the liquids gathering pipeline industry.

CHAPTER 2 – RISK ASSESSMENT FOR LIQUIDS GATHERING PIPELINES September 2018
36
Figure 21. Risk chain.
Figure 22. Simplified risk chain. Consequences Just as the list of threats in Table 1 could serve as a checklist to guide risk assessment in ensuring all potential threats are considered, other references provide lists of consequences to aid in ensuring all consequences are considered. Table 2 lists potential consequences, as defined by the references cited. Table 2. Potential Consequences to Consider in Risk Assessment
ASME B31.8S Muhlbauer (2004) Mora and others (2016)
Population Density Proximity of Population to Pipeline*
Proximity of Limited-Mobility Populations* Property Damage
Environmental Damage Effects of Unignited Gases and Vapors
Released Impacts of Loss of Pipeline Service Public Convenience and Necessity
Potential Secondary Failures
Direct consequences: Property damage
Human health damage Environmental damage
Loss of product Repair costs
Cleanup costs
Indirect consequences: Litigation
Contract violations Customer dissatisfaction
Political reactions Loss of market share
Government fines
Human safety and health Environmental
Community Regulatory Financial Business
Human talent Internal supply Technological
* Includes consideration of barriers or other objects that provide some level of protection.
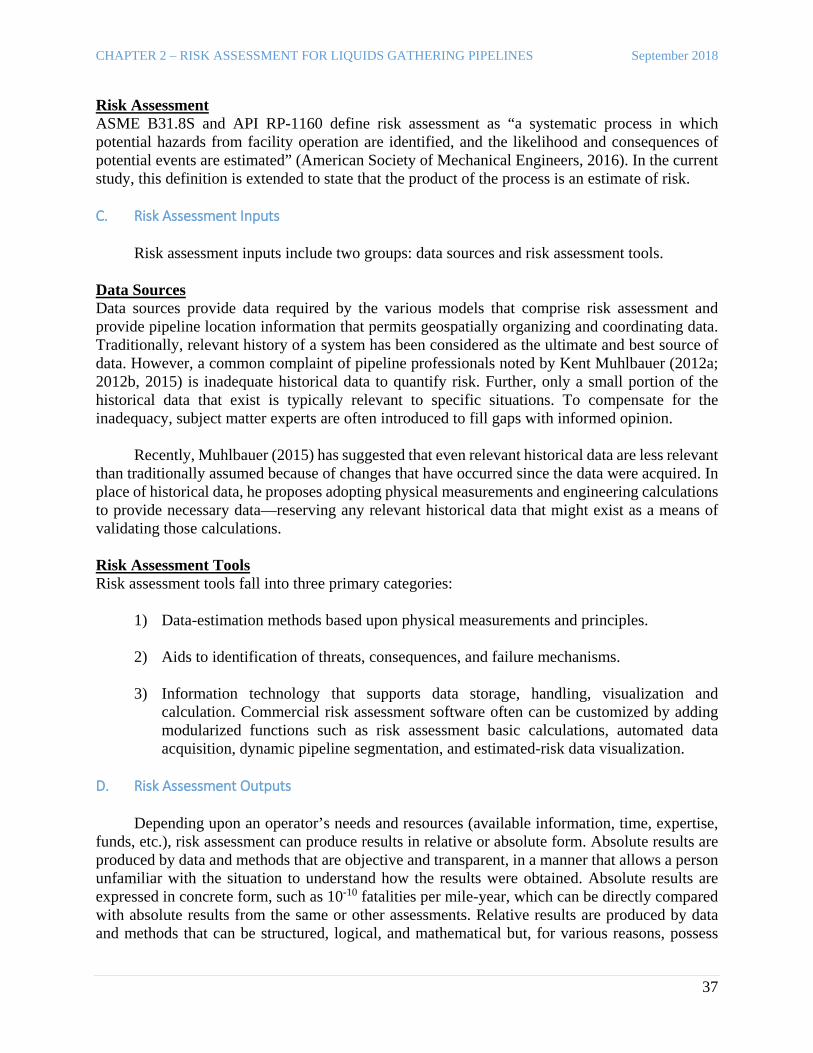
CHAPTER 2 – RISK ASSESSMENT FOR LIQUIDS GATHERING PIPELINES September 2018
37
Risk Assessment ASME B31.8S and API RP-1160 define risk assessment as “a systematic process in which potential hazards from facility operation are identified, and the likelihood and consequences of potential events are estimated” (American Society of Mechanical Engineers, 2016). In the current study, this definition is extended to state that the product of the process is an estimate of risk. C. Risk Assessment Inputs Risk assessment inputs include two groups: data sources and risk assessment tools. Data Sources Data sources provide data required by the various models that comprise risk assessment and provide pipeline location information that permits geospatially organizing and coordinating data. Traditionally, relevant history of a system has been considered as the ultimate and best source of data. However, a common complaint of pipeline professionals noted by Kent Muhlbauer (2012a; 2012b, 2015) is inadequate historical data to quantify risk. Further, only a small portion of the historical data that exist is typically relevant to specific situations. To compensate for the inadequacy, subject matter experts are often introduced to fill gaps with informed opinion. Recently, Muhlbauer (2015) has suggested that even relevant historical data are less relevant than traditionally assumed because of changes that have occurred since the data were acquired. In place of historical data, he proposes adopting physical measurements and engineering calculations to provide necessary data—reserving any relevant historical data that might exist as a means of validating those calculations. Risk Assessment Tools Risk assessment tools fall into three primary categories:
1) Data-estimation methods based upon physical measurements and principles. 2) Aids to identification of threats, consequences, and failure mechanisms. 3) Information technology that supports data storage, handling, visualization and
calculation. Commercial risk assessment software often can be customized by adding modularized functions such as risk assessment basic calculations, automated data acquisition, dynamic pipeline segmentation, and estimated-risk data visualization.
D. Risk Assessment Outputs Depending upon an operator’s needs and resources (available information, time, expertise, funds, etc.), risk assessment can produce results in relative or absolute form. Absolute results are produced by data and methods that are objective and transparent, in a manner that allows a person unfamiliar with the situation to understand how the results were obtained. Absolute results are expressed in concrete form, such as 10-10 fatalities per mile-year, which can be directly compared with absolute results from the same or other assessments. Relative results are produced by data and methods that can be structured, logical, and mathematical but, for various reasons, possess

CHAPTER 2 – RISK ASSESSMENT FOR LIQUIDS GATHERING PIPELINES September 2018
38
different characteristics than absolute results. Relative results often rely upon a subjective piece of data or judgment that might not be immediately understood by a third party. Relative results are expressed on a scale, such as a qualitative scale of negligible to severe risk, or a numerical scale of 1 to 10, generated internally by the particular method being applied. Relative results are specific to the assessment approach and/or pipeline(s) segments assessed. They cannot be directly compared to pipeline segments outside of the assessment. Both forms of results enable prioritization of pipeline segments. It should be noted that while absolute results are often products of objective and more mathematically rigorous methods, they are not necessarily without bias nor inherently more certain than relative results. Major advantages of methods that generate absolute results are objectivity and transparency. Major disadvantages of these methods include demand for more data and other resources. Assessments and results can also be performed and expressed in terms of qualitative, semiquantitative, and quantitative factors:
• Qualitative assessments employ words and phrases to express relationships. Terms such as “rare,” “unlikely,” and “possible” could describe likelihood. Words such as “negligible,” “marginal,” and “catastrophic” could represent magnitudes of consequences. Terms such as “low,” “medium,” and “high” could represent degrees of risk. Such assessments are relatively easy to perform, but are also highly subjective. They tend to provide less granularity, less accuracy, less consistency, and less reproducibility than quantitative assessments (Mora, 2016).
• Semiquantitative assessments can combine the best characteristics of qualitative and
quantitative assessments, such as adopting objective ranges of probability to represent discrete levels of likelihood (Mora, 2016).
• Quantitative risk assessment is generally associated with probabilistic risk assessment in
which objective pipeline statistics representing probability and consequence are combined mathematically to produce estimates of risk and related uncertainty. Results of quantitative assessments can be significantly more accurate and defensible than other assessment types but take substantially more resources and effort to implement. Although quantitative assessments should produce objective results, they are not necessarily free of bias. Only methods that apply concepts commonly exhibited by quantitative methods can provide absolute results (Muhlbauer, 2004; Mora, 2016).
CHAPTER 2 – RISK ASSESSMENT FOR LIQUIDS GATHERING PIPELINES September 2018
39
V. SURVEY OF AVAILABLE RISK ASSESSMENT APPROACHES FOR LIQUIDS GATHERING PIPELINES
Risk assessment is necessarily a highly flexible endeavor. Risk assessment can involve an enormous variety of inputs, numerous styles of analyses can be performed, and results can be expressed in myriad alternate forms. Figure 19 depicted the inputs to, components of, and outputs from risk assessment, and provided a basis for considering alternatives involved with risk assessment. A. Recognized Approaches to Risk Assessment Referring again to Figure 19, risk assessment can be decomposed into three elements: threat analysis, consequence analysis, and risk analysis. Risk analysis combines results from the other two analyses to produce risk estimates. Threat analysis involves identifying threats and estimating their likelihood. Complications arise in estimating likelihoods when interactions among threats can occur. Consequence analysis, likewise, involves identifying consequences and estimating their magnitude but also introduces a dependency on the nature of failure (consequences produced by pinhole-leak failures are much different from those resulting from ruptures) and can have multiple units of measurement. Consequences can be measured in terms of human fatalities and injuries, environmental damage, impact on company operations and reputation, impact on customers, and so on. Theoretically, all of these can be converted to a financial cost basis by estimating the cost to repair and return to original condition or to “make whole.” However, legal or ethical issues can intervene to discourage converting such things as human life and injuries into financial terms, requiring they remain in units of fatalities and injuries.
KEY TAKEAWAYS:
• Risk assessment must be flexible to accommodate the infinite variety of situations and conditions present.
• A number of recognized approaches to risk assessment exist: – Subject matter experts – Relative risk methods (e.g., matrix methods, indexing methods) – Scenario-based methods (e.g., event trees, fault trees) – Probabilistic methods
• From available literature, the EERC has composed a list of 13 key characteristics of an effective risk assessment. This list can serve as a tool to help stakeholders evaluate the appropriateness and quality of a particular risk assessment approach.

CHAPTER 2 – RISK ASSESSMENT FOR LIQUIDS GATHERING PIPELINES September 2018
40
Risk analysis ultimately must combine:
• Threats and consequences accounting for interactions among threats. • Variations in consequences due to the relevant ranges of pipeline failures. • Aggregation of risks arising from different threats to produce a representative description
of risk (and possibly associated uncertainty) for each pipe segment. Table 3 lists risk assessment approaches recognized by different sources. The perceived appropriateness of classifying all of these analyses as risk assessment approaches varies from reference to reference. Some references also include Monte Carlo simulation and defense-in-depth concepts, which were not included in the table because they are generally regarded as being analytical tools or guiding concepts in applying risk preventive and mitigative measures, not risk assessment approaches. Table 3. Risk Assessment Approaches Specifically Outlined for Pipeline Applications
ASME B31.8S API RP-1160 Muhlbauer (2004) Muhlbauer (2015) • SMEs1 • Relative risk • Scenario-based • Probabilistic
• Using SMEs • Relative risk • Scenario-based • Probabilistic
• Matrix • Indexing or
scoring • Probabilistic
• Indexing or scoring
• Probabilistic • Physics-based
1 Subject matter experts. As previously observed in this study, risk assessment approaches vary in appropriateness for specific pipeline situations. Approaches vary with respect to resource requirements, appropriate tools, and purpose of assessment. Some risk assessments are less detailed, initial attempts for risk screening, while others are more detailed risk ranking, and others are more comprehensive for active risk management. Table 4 depicts the view of one risk assessment software vendor regarding relevance and appropriateness of different approaches. Table 4. Characteristics of Pipeline Risk Modeling Approaches (New Century Software, 2017) Approach Examples Effort Description SMEs Qualitative,
semiquantitative $ Subjective risk estimates
Relative Risk Matrix, indexing (semiquantitative)
$$ Risk estimates that can be compared only with those from very similar methods and situations
Scenario-Based
Event tree, fault tree
$$ Depicts event sequences leading to end states and relates likelihood of events to end-state consequences
Probabilistic Quantitative $$$ Risk estimates that can be compared with risk estimates from other quantitative methods and situations

CHAPTER 2 – RISK ASSESSMENT FOR LIQUIDS GATHERING PIPELINES September 2018
41
A conflict appears to exist among risk assessment applications regarding which methods or “approaches” are truly risk assessment and which are only tools (Muhlbauer, 2016). Since pipeline applications typically have ranges of likelihood and consequences for threats, risk analysis must consider both. However, in assessing manned space mission risk, consequences such as loss of mission, loss of crew, loss of spacecraft are all unacceptable, which results in risk assessment being focused on likelihood. Conversely, in evaluating the environmental and health risks involved with chemical exposure, consequence is the primary focus; an incident has already occurred or the likelihood of the release of an agent is overshadowed by the expected effect on the environment or health. The result is that some methods, which are “approaches” to some applications, could appear as “tools” to other applications. Subject Matter Experts Subject matter experts participate in essentially all risk assessments. Subject matter experts are experts in different aspects of pipeline design, construction, operation, inspection, and maintenance. As a risk assessment approach, subject matter experts jointly estimate the likelihoods of different threats for each pipeline segment and combine those with associated consequences to produce a relative risk ranking for each segment (ASME B31.8S, 2016; API RP-1160, 2013). Subject matter experts’ risk assessments characteristically are simple to implement, requiring relatively few resources. However, while knowledgeable persons often exhibit surprising agreement, their estimates contain elevated amounts of uncertainty resulting from the subjectivity of their assessments. The approach also suffers from difficulty in estimating the degree of conservatism in the estimates and is difficult to validate (Koduru and others, 2016). Relative Risk Assessments Relative risk assessments include methods such as indexing/scoring and matrix models. Such assessments are generally either qualitative or semiquantitative. While scenarios exist, such as screening analyses, in which qualitative approaches are at least as acceptable as other approaches, qualitative assessments are considered to have more limited use and value, especially in instances in which the approach does not promote separate consideration of likelihood and consequence as being components of risk (Mora, 2016; Muhlbauer, 2004). As described in ASME B31.8S and API RP-1160, relative risk assessment approaches are typically equation-based, containing algorithms for generating probabilities and consequences for each threat and pipeline segment and in consideration of critical locations. Inherent in the calculations and algorithms are weighting factors acquired from sensitivity studies and historical data that adjust the relative influence of different threats and consequences. In addition to the goal of ranking and prioritizing pipeline segments based on relative risk, API RP-1160 states that relative risk approaches also “provide for calculating the effects of integrity assessment and mitigation (…) thus, the value of potential integrity assessment methods and mitigative actions appropriate for addressing a particular threat can be compared prior to their selection and use.” Inherent in applying relative approaches is the need for consistency across threats, consequences, and pipeline segments. Matrix models and indexing or scoring models are two major relative risk assessment techniques.
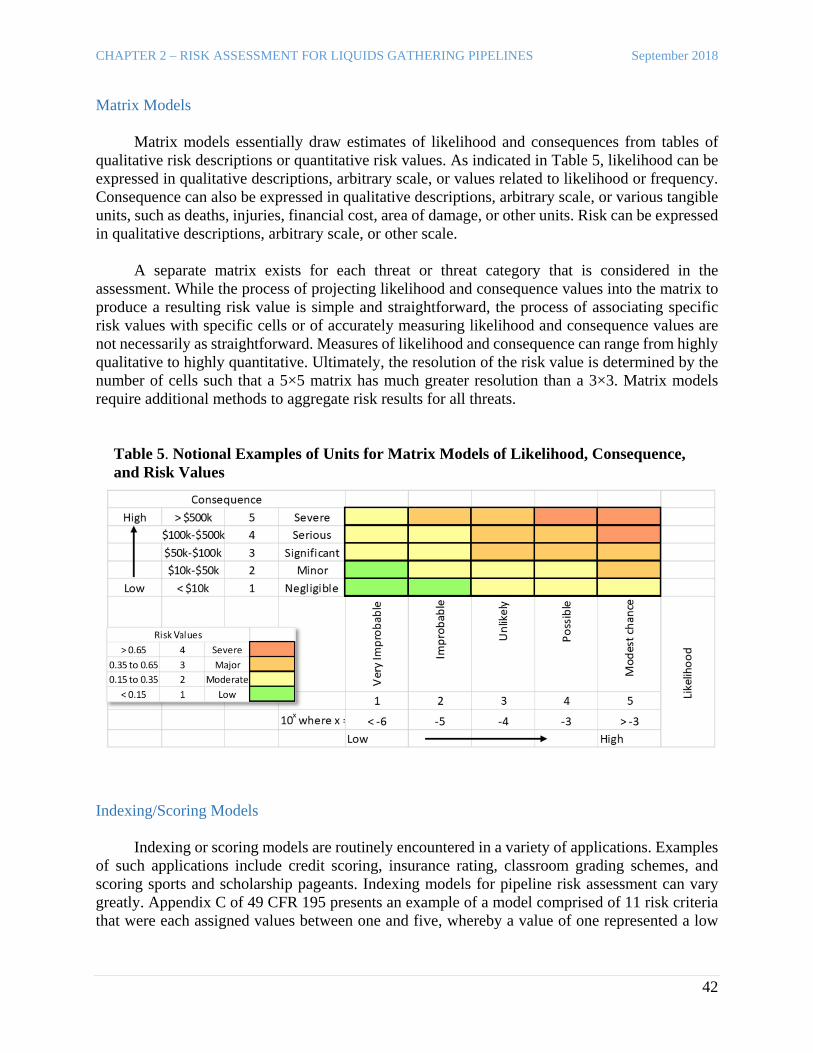
CHAPTER 2 – RISK ASSESSMENT FOR LIQUIDS GATHERING PIPELINES September 2018
42
Matrix Models
Matrix models essentially draw estimates of likelihood and consequences from tables of qualitative risk descriptions or quantitative risk values. As indicated in Table 5, likelihood can be expressed in qualitative descriptions, arbitrary scale, or values related to likelihood or frequency. Consequence can also be expressed in qualitative descriptions, arbitrary scale, or various tangible units, such as deaths, injuries, financial cost, area of damage, or other units. Risk can be expressed in qualitative descriptions, arbitrary scale, or other scale. A separate matrix exists for each threat or threat category that is considered in the assessment. While the process of projecting likelihood and consequence values into the matrix to produce a resulting risk value is simple and straightforward, the process of associating specific risk values with specific cells or of accurately measuring likelihood and consequence values are not necessarily as straightforward. Measures of likelihood and consequence can range from highly qualitative to highly quantitative. Ultimately, the resolution of the risk value is determined by the number of cells such that a 5×5 matrix has much greater resolution than a 3×3. Matrix models require additional methods to aggregate risk results for all threats.
Table 5. Notional Examples of Units for Matrix Models of Likelihood, Consequence, and Risk Values
Indexing/Scoring Models
Indexing or scoring models are routinely encountered in a variety of applications. Examples of such applications include credit scoring, insurance rating, classroom grading schemes, and scoring sports and scholarship pageants. Indexing models for pipeline risk assessment can vary greatly. Appendix C of 49 CFR 195 presents an example of a model comprised of 11 risk criteria that were each assigned values between one and five, whereby a value of one represented a low
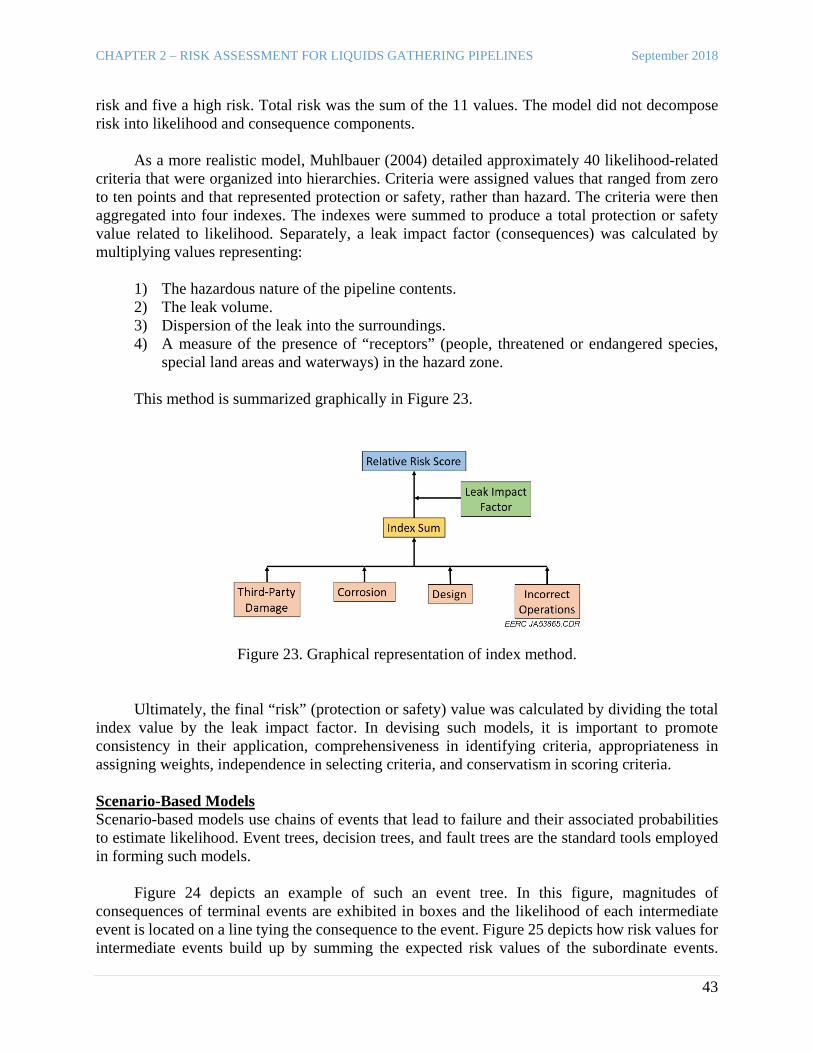
CHAPTER 2 – RISK ASSESSMENT FOR LIQUIDS GATHERING PIPELINES September 2018
43
risk and five a high risk. Total risk was the sum of the 11 values. The model did not decompose risk into likelihood and consequence components. As a more realistic model, Muhlbauer (2004) detailed approximately 40 likelihood-related criteria that were organized into hierarchies. Criteria were assigned values that ranged from zero to ten points and that represented protection or safety, rather than hazard. The criteria were then aggregated into four indexes. The indexes were summed to produce a total protection or safety value related to likelihood. Separately, a leak impact factor (consequences) was calculated by multiplying values representing:
1) The hazardous nature of the pipeline contents. 2) The leak volume. 3) Dispersion of the leak into the surroundings. 4) A measure of the presence of “receptors” (people, threatened or endangered species,
special land areas and waterways) in the hazard zone. This method is summarized graphically in Figure 23.
Figure 23. Graphical representation of index method. Ultimately, the final “risk” (protection or safety) value was calculated by dividing the total index value by the leak impact factor. In devising such models, it is important to promote consistency in their application, comprehensiveness in identifying criteria, appropriateness in assigning weights, independence in selecting criteria, and conservatism in scoring criteria. Scenario-Based Models Scenario-based models use chains of events that lead to failure and their associated probabilities to estimate likelihood. Event trees, decision trees, and fault trees are the standard tools employed in forming such models. Figure 24 depicts an example of such an event tree. In this figure, magnitudes of consequences of terminal events are exhibited in boxes and the likelihood of each intermediate event is located on a line tying the consequence to the event. Figure 25 depicts how risk values for intermediate events build up by summing the expected risk values of the subordinate events.

CHAPTER 2 – RISK ASSESSMENT FOR LIQUIDS GATHERING PIPELINES September 2018
44
Ultimately, the expected risk value of the initiating or top-most event represents the expected risk of the incident. Multiple trees can be constructed that represent different threats. Multiple trees can also be constructed based upon assumptions of certain characteristics of each failure. Probabilistic Risk Assessment Probabilistic risk assessment is a quantitative statistical method that represents the most complex, objective, and resource-intensive risk assessment approach. This approach is capable of providing absolute risk results, the accuracy of which depends upon the quality of model adopted and data incorporated. Probabilistic risk assessment is commonly applied to high-value or high-danger situations, such as manned spaceflight operations and nuclear reactor safety (Stamatelatos and Dezfuli, 2011; Siu and others, 2016). The approach conventionally begins with a scenario-based model to comprehensively identify events and pathways and then applies statistical methods to produce likelihood descriptions. The scenario model can involve multiple analyses such as an event tree followed by a fault tree. Likelihood descriptions could be single-valued quantities that best represent historic data, or they could be probability distributions that represent those data. The former case is sometimes termed “deterministic,” while the latter is termed “probabilistic” (Hetes and others, 2014). Data requirements are demanding in terms of amount and quality of data because rigorous methods cannot compensate for incomplete or inaccurate data. Often, assessments of uncertainty inherent in the risk estimate accompany assessments of risk.
Figure 24. Example event tree with likelihoods of events and estimated consequence values.
Figure 25. Example event tree with expected consequence values of events based on Figure 24.

CHAPTER 2 – RISK ASSESSMENT FOR LIQUIDS GATHERING PIPELINES September 2018
45
B. Factors Influencing Risk Assessment Three challenges that must be addressed in performing risk assessment include:
• Aggregating likelihood and risk values from multiple threats. • Pipeline segmentation. • Uncertainty.
Aggregating Likelihood and Risk Values from Multiple Threats Various approaches to aggregating risk have been suggested:
• Total the likelihoods of all threats and multiply the result by the total or average consequence of those threats.
• Average both the likelihoods of all threats and the associated consequences of those threats, then multiply the two averages together.
• Multiply the likelihood of each threat by the consequences of that threat, and then add the
resulting values together. The three models in Figure 26 depict these approaches to aggregating risk. Model 1 is flawed in that totalizing likelihoods (or probabilities, P) permits the possibility that the sum may exceed 1, which is statistically impossible. Model 3 corresponds to the definition of risk in ASME B31.8S (2016).
Figure 26. Simple risk chain diagrams of different fundamental approaches to aggregating risk.

CHAPTER 2 – RISK ASSESSMENT FOR LIQUIDS GATHERING PIPELINES September 2018
46
Figure 27 exhibits a refined view of pipeline failure. This figure recognizes that there is no single type of failure for any threat. Characteristic failures might exist, but no single, unique type of failure exists for a threat. Figure 27 also depicts the concept that consequences are linked to the type of failure. For example, consequences from pinhole leaks would be expected to be different from ruptures.
Figure 27. Simple risk chain diagram of a more advanced concept of pipeline failure. For simplicity, the multiple consequences emanating from failures in Figure 27 are not intended to represent different sets of consequences, but rather different types of consequences. That is, Consequence1 might be a characteristic number of fatalities for the related failure. Consequence2 represents a characteristic number of injuries for the related failure. Consequence3 represents characteristic property repair cost for the related failure. The k types of failures represent the range of expected failures, each of which is associated with its specific set of characteristic consequences. The simplification from Figure 27 to Figure 28 represents a statistical process in arriving at a representative (“average”) failure and representative (“average”) set of consequences.
Figure 28. Simplified Figure 27.
CHAPTER 2 – RISK ASSESSMENT FOR LIQUIDS GATHERING PIPELINES September 2018
47
Segmenting Pipelines for Risk Assessment Characteristics and conditions of a pipeline and its surroundings that affect risk vary along pipelines and within facilities. Therefore, it is prudent to section pipelines and facilities into segments and treat each segment relative to the particular risk it poses, rather than attempt to treat the entire length of a pipeline for all risks encountered along the pipeline. Various methods regarding how to divide pipelines into segments have been proposed (Muhlbauer, 2004). Three common groups of methods are the following:
1. Fixed length – Pipeline segment lengths are based on distance and/or pipeline equipment. 2. Variable length – Pipeline segment lengths are based on significant changes in pipeline
conditions or characteristics that affect risk. Segments terminate at points of significant changes in any datum representing such influences.
3. Manual – Pipeline segment lengths are determined by experts, using segmenting criteria
tied to pipeline condition or pipeline surroundings. Because the goal of risk assessment is to identify portions of pipelines that would most benefit from preventative/mitigative actions, establishing arbitrary lengths and equipment-related break points that are not directly tied to risk values could be misleading. Long lengths of pipe that adopt average metrics over the length of the pipe could mask higher-risk portions, as their characteristics are blended into lower-risk portions. Conversely, long lengths that conservatively adopt the worst values to represent the segment could downgrade lower-risk portions of pipe. Establishing and applying criteria that are related to risk, likelihood, and consequence (such as proximity of populated areas, pipe age, condition of coating or cathodic protection or soil) can serve as indicators of changes in risk that justify segmenting. Thus, manual application of risk-related criteria can be labor-intensive but more justifiable than fixed-length methods. The most justifiable and most efficient approaches for performing risk assessments are variable-length methods (also termed dynamic segmentation methods). These methods define segments as portions of pipelines exhibiting reasonably constant characteristics or conditions that affect risk. The boundaries of segments are defined as points where a risk characteristic changes significantly. Such methods introduce the possibility of creating very short segments. In 2012, Muhlbauer (Det Norske Veritas and Muhlbauer, 2012) claimed that most pipelines require a minimum of five to ten segments per mile to achieve proper analysis. In 2016, he stated that proper analysis requires ten to 100 segments and, in some situations, thousands of segments per mile (Muhlbauer, 2016). With computerization and a sufficiently detailed risk profile, Muhlbauer claims that such large numbers of segments per mile can be efficiently handled. Uncertainty in Pipeline Risk Assessment Default or worst-case data often substitute for missing data, which contributes to overall uncertainty. Natural statistical variation in data, inherent model error, and many other sources add to uncertainty. The most advanced probabilistic methods often attempt to estimate uncertainty inherent in risk estimates, but less quantitative methods have difficulty producing an objective and consistent basis by which to estimate the uncertainty of estimates. Relative methods rely on

CHAPTER 2 – RISK ASSESSMENT FOR LIQUIDS GATHERING PIPELINES September 2018
48
consistency in pursuit of achieving equitable levels of uncertainty across segments, which does not provide more confidence in the representativeness of the prioritization but should not unfairly disadvantage some segments. C. Desirable Pipeline Risk Assessment Characteristics Pipeline risk assessment literature presents perspectives regarding the nature of appropriate guidelines for risk assessment. These systems and guidelines possess the following common characteristics:
• They promote prioritization of pipeline segments and employment of resources.
• They permit flexibility to enable operators to customize their systems to meet their unique situations
• They avoid onerous requirements and seek to maintain a favorable cost–benefit ratio.
• They promote discovery of new hazards and scenarios.
The ultimate goal of these systems and guidelines is to prioritize pipeline segments and determine the most effective follow-on actions and resource allocations. Several references define elements that comprise a risk assessment. Table 6 summarizes these elements. It is apparent that many of the elements are directly related to the definition of risk adopted by the pipeline community, i.e., a measure of loss in terms of likelihood and magnitude of consequences.

CHAPTER 2 – RISK ASSESSMENT FOR LIQUIDS GATHERING PIPELINES September 2018
49
Table 6. Characteristic Elements of Risk Assessments
ASME B31.8S (2016, 13) 49 CFR 195 Muhlbauer (2016 )
Threat Identification 49 CFR 195’s list of risk factors that must be considered A*
Likelihood Evaluation Likelihood evaluation Proper probability of failure assessment B
Consequence Evaluation Consequence evaluation Characterization of potential consequences C
Information analysis including all available information
Full integration of pipeline knowledge D
Risk Ranking Establishment of risk and prioritization Profiles of risk E Measure integrity program effectiveness F Provide Structure and Continuous Updating Continual evaluation and assessment G
Sufficient granularity H Aid Identifying Integrity Assessment and Mitigation Options
Identify the need for additional actions
Provide Data Feedback Risk Driver Identification Consider Size of Leak, or Assume Worst-Case Leak
Anomalous conditions must be evaluated Two risk analysis methods described
Verifiable units of measurement
Proper aggregation Bias management
* The letters at the right side of the table will be used to relate this information from open literature to an important concept developed in Table 7.
The above elements from ASME B31.8S (2016) relate to components of risk assessment. They are therefore more recognizable than other characteristics that have been deemed desirable. For example, ASME B31.8S (2016) also recommends that risk assessments possess the following characteristics:
• A structure capable of providing a complete, accurate and objective analysis of risk
• Adequate resources available to implement the risk assessment
• Incorporation of relevant history data including operations and mitigative actions
• Ability to identify and estimate risk for previously unrecognized threats or future conditions
• Incorporation of validated data or, in cases of missing or questionable data, conservative
data

CHAPTER 2 – RISK ASSESSMENT FOR LIQUIDS GATHERING PIPELINES September 2018
50
• Effective feedback of updated or new data in order to validate and improve risk assessment method ability to perform “what-if” determinations
• Employ a structured set of weighting factors
• Appropriate segment resolution to identify local high-risk areas and ability to reprioritize
segments to account for mitigative actions Many of these characteristics tend to be subjective. Terms such as “adequate,” “thorough,” and “appropriate” are subject to interpretation, which reduces their effectiveness as guidelines to review risk assessment approaches. Twelve references1 were consulted in an effort to identify the most fundamental, commonly accepted risk assessment quality characteristics. From these documents, approximately 140 statements were extracted that related to risk assessment quality characteristics. These statements were subsequently distilled to a set of desirable characteristics for pipeline risk assessment, as summarized in Table 7. The EERC suggests that this table may form a foundation upon which stakeholders may assess the adequacy of any particular approach to risk assessment. The column at the right of Table 7 relates this EERC-synthesized list to characteristics listed in open literature references shown in Table 6. Table 7. Desirable Pipeline Risk Assessment Characteristics
Exclusive to Risk Assessment
1. Identifies pipeline threats. A* 2. Estimates the likelihood (or frequency or probability) of failure along
the pipeline based upon past and present conditions of the pipeline and surroundings.
B
3. Identifies consequences of pipeline failure. C 4. Estimates the severity or magnitude of different consequences along the
pipeline. C
5. Relates information to pipeline location. D 6. Estimates risk along the pipeline. E 7. Verifies the consistency of estimates with actual performance. F 8. Is updated with new information as pipeline and surrounding conditions
change. G
Overlapping Risk Assessment and Risk Management
9. Divides pipelines into segments based upon risk. H 10. Prioritizes pipeline segments based upon risk. E 11. Evaluates the effectiveness of past changes and other risk management
actions. –
12. Predicts or has the capability to predict risk-related outcomes –
General 13. Information, procedures and documentation are of adequate quality for the purpose of risk management and assessment
–
* The letters at the right side of the table are meant to help the reader map key quality characteristics to those found in the literature and summarized in Table 6.
1 ASME B31.8S (2016), API RP-1160 (2013), ANSI/API RP-1173 (2015), 49 CFR 190-199, Pipeline and Hazardous Materials Safety Administration “Fact Sheet: Risk Assessment” (2011), Mora and others (2016), Det Norske Veritas and Muhlbauer (2012), Mangold and Muhlbauer (2013), Muhlbauer (2012, 2013, 2016), Muhlbauer and others (2014).

CHAPTER 2 – RISK ASSESSMENT FOR LIQUIDS GATHERING PIPELINES September 2018
51
The characteristics identified in Table 7 have been extracted from standards and the open literature published, for the most part, over the past 6 years. Recently, PHMSA has sponsored a RMWG that has been examining the application of risk assessment in pipeline risk management programs (PHMSA, 2016). A summary of the RMWG’s activities is presented in the “Nascent and Evolving Trends and Topics” section of this report. Guidance provided by the RMWG should be evaluated for relevance to gathering pipelines when the product of that group’s work is released. D. Approaches Adopted for Purpose of Illustrating Examples For purpose of illustration, three traditional risk assessment methods were applied to a simple hypothetical gathering pipeline scenario. The methods include:
1. Indexing method (minimal complexity) 2. Matrix method (more complex) 3. Quantitative approach (moderately complex)
The intent is to convey to the reader the basic nature of, and data requirement for, a range of risk assessment methods as well as the steps involved in performing risk assessment. Despite the relative simplicity of the scenario and methods, it is expected that the reader will witness the effort and expertise required to perform each assessment, and more so, the effort and expertise that would be required to comprehensively assess an actual gathering pipeline or gathering pipeline system. It should be noted that the least complex method does not consider likelihood and consequence separately in assessing risk. VI. APPLICATION OF RISK ASSESSMENT
KEY TAKEAWAYS:
• In this section, for purposes of illustration, the EERC develops an example scenario, then applies three different risk assessment approaches to it to demonstrate a range of what is possible and appropriate.
• The reliability, usefulness, and resources demanded for each risk assessment approach vary. Naturally, more complex quantitative methods provide greater potential for insight, but they also require significant additional resources to complete and, therefore, are not globally applicable.
• The results of each approach yield similar results in ranking the risk of each pipeline segment. • The EERC suggests three key lessons from this exercise:
– Risk assessment is not easy, even when assessing an uncomplicated scenario. – Any systematic and thoughtful risk assessment method can be useful. – When applied to the hypothetical scenario, all approaches tended to yield similar results in
terms of ranking of risks.

CHAPTER 2 – RISK ASSESSMENT FOR LIQUIDS GATHERING PIPELINES September 2018
52
This following portion of the gathering pipeline risk assessment study provides, at a high level, three risk assessment methods applied to a fictional produced water gathering pipeline scenario. The example is intended to provide a conceptual idea of the nature of a few risk assessment methods and some activities involved with risk assessment. Frequencies, severities, costs, and other data are for illustration purposes only and not intended to accurately portray any existing gathering pipeline system.
A. Example Scenario Created for Basis of Fictional Risk Assessment While identifying and analyzing various existing methods of risk assessment, the need to apply several methods to an example scenario became apparent. The scenario needed to meet a number of conditions in order to demonstrate the necessary effort and inputs required of each method. A few of the most desired characteristics include incorporation of:
1. A variety of relevant threats.
2. Easily segmented pipelines.
3. A realistic, but generic, foundation not attributable to any existing liquids gathering system.
4. A size manageable enough to apply the chosen models and remain within the scope of this study.
To meet these conditions, a fictitious, simplified gathering system model was created and is depicted in Figure 29. Physical properties of the model were selected largely at random but such that, when observed as a whole, would represent realistic conditions of a small liquids gathering system. A location in western North Dakota with a clear concentration of threats and hazards was chosen to lend credibility to the scenario. The hypothetical system is a produced water gathering pipeline with input from two separate locations leading to a salt water disposal well. The pipeline itself consists of 4-in. polyethylene composite pipe and is approximately 2 miles long with a wye joining the two inputs. The only equipment along the line occurs at points of input and output and includes pumps, valves, and meters. The system operates at an average pressure of 140 psi and is designed to transport 6 Mbpd. Full detail of the system equipment and characteristics can be found in Tables 8 and 9.
DIS
CLA
IMER
R
The scenario and risk assessment methods that follow are presented for the purpose of illustration only. Although the scenario is intended to possess some characteristics of real-world situations, there is no intent to identify the scenario with any actual location or situation. Likewise, there is no intent to recommend or otherwise express a preference regarding the suitability or effectiveness of any method or procedure presented in the following discussion of the scenario or any actual situation.

CHAPTER 2 – RISK ASSESSMENT FOR LIQUIDS GATHERING PIPELINES September 2018
53
The pipeline is segmented to enable prioritization of segments by the risk assessment models. Three segments were chosen to reflect the concentrations of hazards in the scenario and remain within scope. The segments and some location-related hazards are highlighted in Figure 29. Segment 1 contains the two input locations as well as the wye connecting them. Hazards specific to this segment are two road crossings, a stream crossed several times, and a developing residential neighborhood. Segment 2 runs along the side of a private road and includes no unique location-specific hazards. Segment 3 completes the system with the output to the disposal site and includes significant location-specific hazards. These hazards include proximity to an area of historic subsidence according to the North Dakota Geological Survey, a small residential area, and a river crossing.
Figure 29. Fictitious produced water gathering pipeline system for use in example scenario.
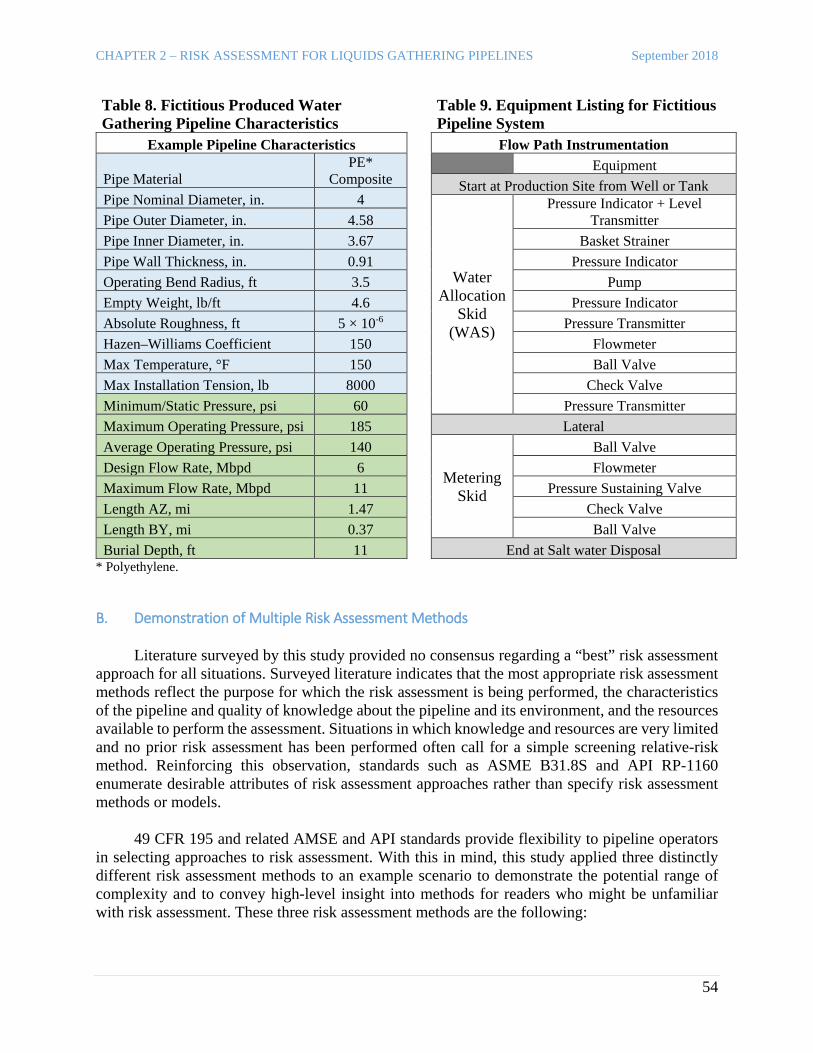
CHAPTER 2 – RISK ASSESSMENT FOR LIQUIDS GATHERING PIPELINES September 2018
54
Table 8. Fictitious Produced Water Gathering Pipeline Characteristics
Example Pipeline Characteristics
Pipe Material PE*
Composite Pipe Nominal Diameter, in. 4 Pipe Outer Diameter, in. 4.58 Pipe Inner Diameter, in. 3.67 Pipe Wall Thickness, in. 0.91 Operating Bend Radius, ft 3.5 Empty Weight, lb/ft 4.6 Absolute Roughness, ft 5 × 10⁻⁶ Hazen–Williams Coefficient 150 Max Temperature, °F 150 Max Installation Tension, lb 8000 Minimum/Static Pressure, psi 60 Maximum Operating Pressure, psi 185 Average Operating Pressure, psi 140 Design Flow Rate, Mbpd 6 Maximum Flow Rate, Mbpd 11 Length AZ, mi 1.47 Length BY, mi 0.37 Burial Depth, ft 11
* Polyethylene.
Table 9. Equipment Listing for Fictitious Pipeline System
Flow Path Instrumentation Equipment
Start at Production Site from Well or Tank
Water Allocation
Skid (WAS)
Pressure Indicator + Level Transmitter
Basket Strainer Pressure Indicator
Pump Pressure Indicator
Pressure Transmitter Flowmeter Ball Valve
Check Valve Pressure Transmitter Lateral
Metering Skid
Ball Valve Flowmeter
Pressure Sustaining Valve Check Valve Ball Valve
End at Salt water Disposal
B. Demonstration of Multiple Risk Assessment Methods Literature surveyed by this study provided no consensus regarding a “best” risk assessment approach for all situations. Surveyed literature indicates that the most appropriate risk assessment methods reflect the purpose for which the risk assessment is being performed, the characteristics of the pipeline and quality of knowledge about the pipeline and its environment, and the resources available to perform the assessment. Situations in which knowledge and resources are very limited and no prior risk assessment has been performed often call for a simple screening relative-risk method. Reinforcing this observation, standards such as ASME B31.8S and API RP-1160 enumerate desirable attributes of risk assessment approaches rather than specify risk assessment methods or models. 49 CFR 195 and related AMSE and API standards provide flexibility to pipeline operators in selecting approaches to risk assessment. With this in mind, this study applied three distinctly different risk assessment methods to an example scenario to demonstrate the potential range of complexity and to convey high-level insight into methods for readers who might be unfamiliar with risk assessment. These three risk assessment methods are the following:

CHAPTER 2 – RISK ASSESSMENT FOR LIQUIDS GATHERING PIPELINES September 2018
55
• Index method (based in 49 CFR 195 Appendix C) This method differs from other methods in that it does not decompose the analysis into likelihood and consequence elements, which form the definition of risk.
• Matrix method (based in API RP-1160)
The matrix method can vary in complexity, so it is commonly adopted and improved over time by entities with limited exposure to risk assessment.
• Quantitative method (based in ASME B31.8S)
This is a simplified version of a more complex quantitative risk assessment method. Quantitative methods typically refer to complex statistical methods of deriving expressions for likelihood and consequence. Such statistical approaches are termed “probabilistic risk assessment.” The method avoids statistical complexity by assuming that representative values of pipeline spill and other data are known (this is a very uncommon situation in reality but is a simplification used for the sake of example).
1. Index Method PHMSA regulations related to the transportation of hazardous liquids by pipeline contain an example that illustrates a hypothetical index model applied to a fictional pipeline (49 CFR 195.II.B). The example applies risk assessment to prioritize pipeline segments for risk management. Priority is based on the sum of the scores (or weights) of a dozen risk factors. 49 CFR 195 Appendix C lists 19 risk factors that are recommended for consideration and includes tables containing suggested scores for four of those risk factors, as shown in Table 10. The appendix recommends considering other risk factors when appropriate. Scores are integers ranging from one (representing low risk) to five (representing high risk) for all risk factors. This implies that all criteria are weighted the same and are therefore all considered to be of equal importance. The segment with the largest sum is given the highest priority. Table 10. Line Size Safety Risk Indicator Values
Safety Risk Indicator Line Size
(nominal diameter) Leak History (last 10 years)
Age of Pipeline
Product Transported
High Greater than 18 inch > 3 spills > 25 years Highly volatile/ flammable/toxic
Moderate 10–16 inch Flammable Low Less than 8 inch < 3 spills < 25 years Nonflammable
Two members of the EERC study team, serving as subject matter experts, independently assessed the segments and then reconciled their scores to produce final total scores for each segment. Their initial assessment scores appear in the first two rows of Table 11. During

CHAPTER 2 – RISK ASSESSMENT FOR LIQUIDS GATHERING PIPELINES September 2018
56
Table 11. Scoring Example Results Segment Raw Scores
Segment 1 Segment 2 Segment 3 Subject Matter Expert 1 33 27 39 Subject Matter Expert 2 38 32 41 Jointly Reconciled 49 39 54
reconciliation, scores were generated based upon an expanded set of additional factors that had previously been eliminated, including:
• Hydraulic gradient of the pipeline segment. • Results of visual inspection. • Issues related to potential ground movement: climate. • Crossing of streams that experience year-round flow or stream beds that experience
periodic flows. Despite the simplicity of the approach, the model exhibits surprising consistency in two ways:
1. Both subject matter experts produced the same order of risk. Segment 2 was considered the lowest risk segment, and Segment 3 was considered the highest risk in all instances.
2. Individual subject matter experts scores differed by less than 6% for Segment 1 and less than 12% for Segment 3.
A difficulty encountered in applying this method is in choosing risk factors that are independent of each other. Factors that are very similar tend to be double counted as threats. For example, the risk factor “Potential physical pathways between the pipeline and high-consequence area” was very similar to the risk factor, “Terrain surrounding pipeline could allow release to a high-consequence area.” The second factor was eliminated from the assessment to avoid entering a score twice for essentially the same threat related to terrain providing a physical pathway to an environmentally sensitive area. It is also difficult to achieve appropriate weighting of the various factors. Limiting each factor to a scale of 1 to 5 fails to consider the relative importance of different risk factors. For example, a factor related to pipe condition perhaps should receive a higher maximum risk score than operator drug testing because of its direct relationship to the likelihood of release. A third issue relates to segmenting pipelines. 49 CFR 195 Appendix C applies risk assessment to environmentally sensitive areas without guidance regarding whether or how pipelines in those areas should be segmented. The 49 CFR 195 Appendix C method was selected as an example because of its simplicity. However, it does not consider consequence and likelihood separately.

CHAPTER 2 – RISK ASSESSMENT FOR LIQUIDS GATHERING PIPELINES September 2018
57
2. Matrix Method The second example approach, a matrix method, is a slightly more methodical approach that fits the approach suggested by API RP-1160. The matrix approach to risk assessment decomposes risk into likelihood and consequence components. These components are then combined by means of projecting them into a matrix of risk values. Models can be simple, such as the qualitative 3 × 3 model depicted in Table 12, or can be much more detailed in terms of the number of levels of consequences and likelihoods and the number of dimensions or threat categories that are represented by independent matrices. Multiple matrices assessing multiple threats require a mean of aggregating individual risk values to produce an overall risk. Models can also be substantially more quantitative by means of replacing qualitative descriptions with quantitative ranges and assigning quantitative values to cells instead of qualitative descriptions. Applying Table 12 to a situation in which a failure is unlikely with many possible consequences, the estimated risk is represented in the top row and middle column by a red rectangle that denotes a high risk value.
Table 12. Conceptual Qualitative Risk Matrix
Con
sequ
ence
s Many
Ris
k V
alue
s High
Some Medium
Few
Low
Ver
y U
nlik
ely
Unl
ikel
y
Som
ewha
t Lik
ely
Likelihood The example matrix model developed for this study adopted the 5 × 5 matrix depicted in Table 13 for each of seven threat categories. Data used in this example came from three different tables that appear in Muhlbauer (2004). Data from the tables were reorganized to conform to API RP-1160’s threat category structure. The categories included the following:
1. Mechanical strike or damage (30%) 2. Pressure-cycle induced fatigue (5%) 3. Corrosion (25%) 4. Weather and natural or outside forces (5%) 5. Equipment failure (17%) 6. Manufacturing defects (8%) 7. Construction defects (10%)

CHAPTER 2 – RISK ASSESSMENT FOR LIQUIDS GATHERING PIPELINES September 2018
58
Table 13. 5 × 5 Matrix Structure Utilized in This Example Application
Con
sequ
ence
s Severe Serious Severe risk
Significant Major risk Minor Moderate risk
Negligible Low risk
Ver
y ra
rely
Rar
ely
Infr
eque
ntly
Occ
asio
nally
Som
ewha
t of
ten
Frequency Parenthetical numbers represent the relative occurrence of the categories. Note that frequency has been substituted for likelihood in Table 13. Frequency might be in terms of incidents, fatalities, and injuries on a mile-year basis, for example. After assessing frequency and consequences of each threat category for each segment, an aggregate risk was derived for each segment based on weightings (relative occurrences) of threat categories. Table 14 exhibits the results for each segment. Risk estimates for Segments 1, 2, and 3 are “low,” “low,” and “moderate,” respectively. Table 14. Risk Estimates by Segment
Segment 1 Severe
Serious Significant
Minor Negligible X
VR R I O SO
Segment 2 Severe
Serious Significant
Minor Negligible X
VR R I O SO
Segment 3 Severe
Serious Significant
Minor X Negligible
VR R I O SO
“VR” denotes very rarely, “R” denotes rarely, “I” denotes infrequently, “O” denotes occasionally, and “SO” denotes somewhat often.
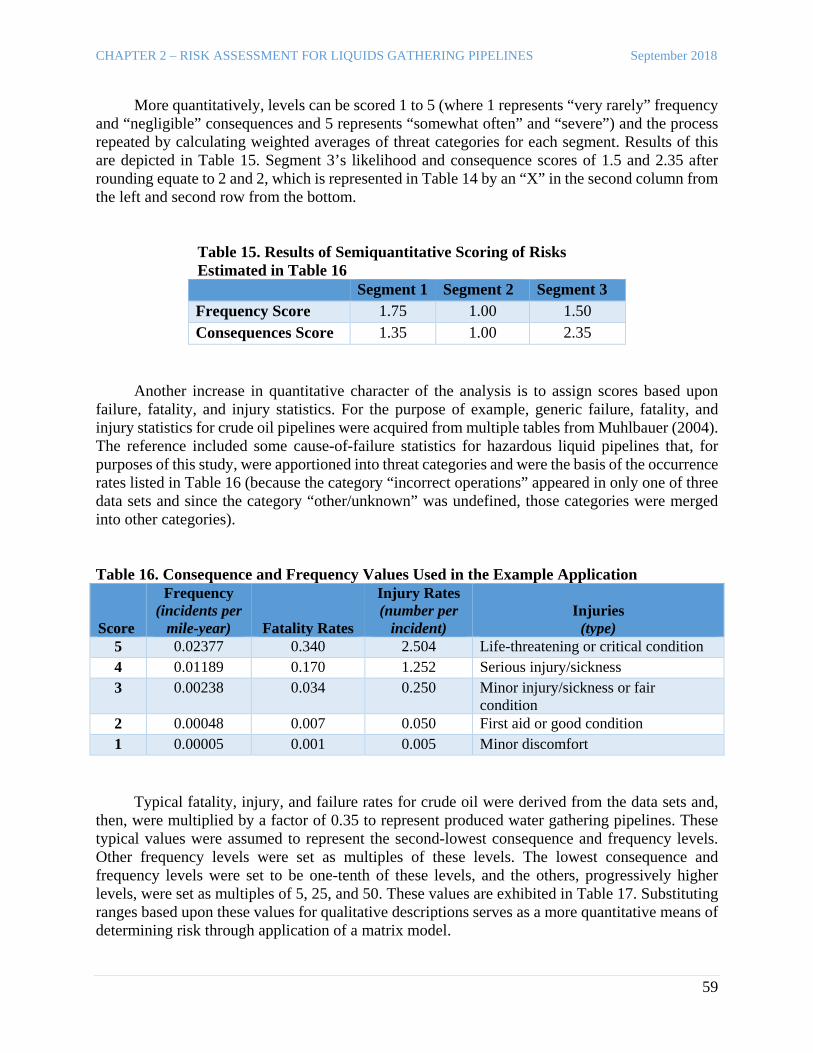
CHAPTER 2 – RISK ASSESSMENT FOR LIQUIDS GATHERING PIPELINES September 2018
59
More quantitatively, levels can be scored 1 to 5 (where 1 represents “very rarely” frequency and “negligible” consequences and 5 represents “somewhat often” and “severe”) and the process repeated by calculating weighted averages of threat categories for each segment. Results of this are depicted in Table 15. Segment 3’s likelihood and consequence scores of 1.5 and 2.35 after rounding equate to 2 and 2, which is represented in Table 14 by an “X” in the second column from the left and second row from the bottom.
Table 15. Results of Semiquantitative Scoring of Risks Estimated in Table 16 Segment 1 Segment 2 Segment 3 Frequency Score 1.75 1.00 1.50 Consequences Score 1.35 1.00 2.35
Another increase in quantitative character of the analysis is to assign scores based upon failure, fatality, and injury statistics. For the purpose of example, generic failure, fatality, and injury statistics for crude oil pipelines were acquired from multiple tables from Muhlbauer (2004). The reference included some cause-of-failure statistics for hazardous liquid pipelines that, for purposes of this study, were apportioned into threat categories and were the basis of the occurrence rates listed in Table 16 (because the category “incorrect operations” appeared in only one of three data sets and since the category “other/unknown” was undefined, those categories were merged into other categories). Table 16. Consequence and Frequency Values Used in the Example Application
Score
Frequency (incidents per
mile-year) Fatality Rates
Injury Rates (number per
incident) Injuries
(type) 5 0.02377 0.340 2.504 Life-threatening or critical condition 4 0.01189 0.170 1.252 Serious injury/sickness 3 0.00238 0.034 0.250 Minor injury/sickness or fair
condition 2 0.00048 0.007 0.050 First aid or good condition 1 0.00005 0.001 0.005 Minor discomfort
Typical fatality, injury, and failure rates for crude oil were derived from the data sets and, then, were multiplied by a factor of 0.35 to represent produced water gathering pipelines. These typical values were assumed to represent the second-lowest consequence and frequency levels. Other frequency levels were set as multiples of these levels. The lowest consequence and frequency levels were set to be one-tenth of these levels, and the others, progressively higher levels, were set as multiples of 5, 25, and 50. These values are exhibited in Table 17. Substituting ranges based upon these values for qualitative descriptions serves as a more quantitative means of determining risk through application of a matrix model.
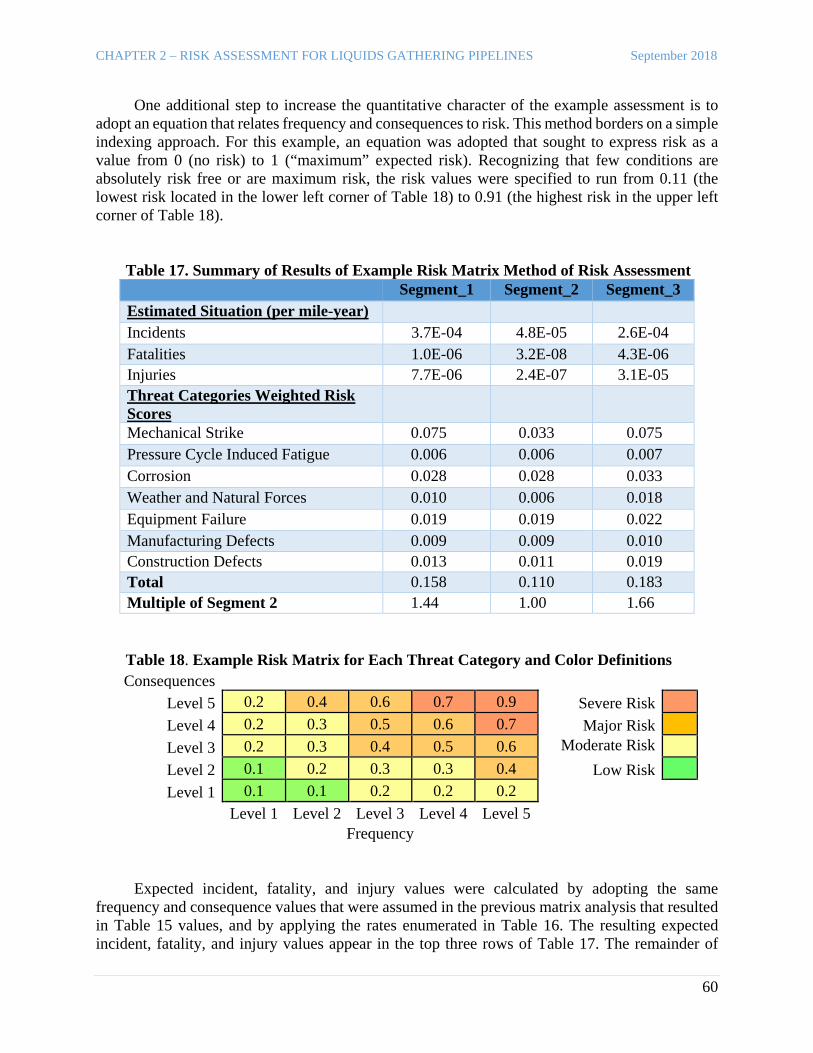
CHAPTER 2 – RISK ASSESSMENT FOR LIQUIDS GATHERING PIPELINES September 2018
60
One additional step to increase the quantitative character of the example assessment is to adopt an equation that relates frequency and consequences to risk. This method borders on a simple indexing approach. For this example, an equation was adopted that sought to express risk as a value from 0 (no risk) to 1 (“maximum” expected risk). Recognizing that few conditions are absolutely risk free or are maximum risk, the risk values were specified to run from 0.11 (the lowest risk located in the lower left corner of Table 18) to 0.91 (the highest risk in the upper left corner of Table 18).
Table 17. Summary of Results of Example Risk Matrix Method of Risk Assessment Segment_1 Segment_2 Segment_3 Estimated Situation (per mile-year)
Incidents 3.7E-04 4.8E-05 2.6E-04 Fatalities 1.0E-06 3.2E-08 4.3E-06 Injuries 7.7E-06 2.4E-07 3.1E-05 Threat Categories Weighted Risk Scores
Mechanical Strike 0.075 0.033 0.075 Pressure Cycle Induced Fatigue 0.006 0.006 0.007 Corrosion 0.028 0.028 0.033 Weather and Natural Forces 0.010 0.006 0.018 Equipment Failure 0.019 0.019 0.022 Manufacturing Defects 0.009 0.009 0.010 Construction Defects 0.013 0.011 0.019 Total 0.158 0.110 0.183 Multiple of Segment 2 1.44 1.00 1.66
Table 18. Example Risk Matrix for Each Threat Category and Color Definitions Consequences
Level 5 0.2 0.4 0.6 0.7 0.9 Severe Risk Level 4 0.2 0.3 0.5 0.6 0.7 Major Risk Level 3 0.2 0.3 0.4 0.5 0.6 Moderate Risk Level 2 0.1 0.2 0.3 0.3 0.4 Low Risk Level 1 0.1 0.1 0.2 0.2 0.2
Level 1 Level 2 Level 3 Level 4 Level 5 Frequency
Expected incident, fatality, and injury values were calculated by adopting the same frequency and consequence values that were assumed in the previous matrix analysis that resulted in Table 15 values, and by applying the rates enumerated in Table 16. The resulting expected incident, fatality, and injury values appear in the top three rows of Table 17. The remainder of
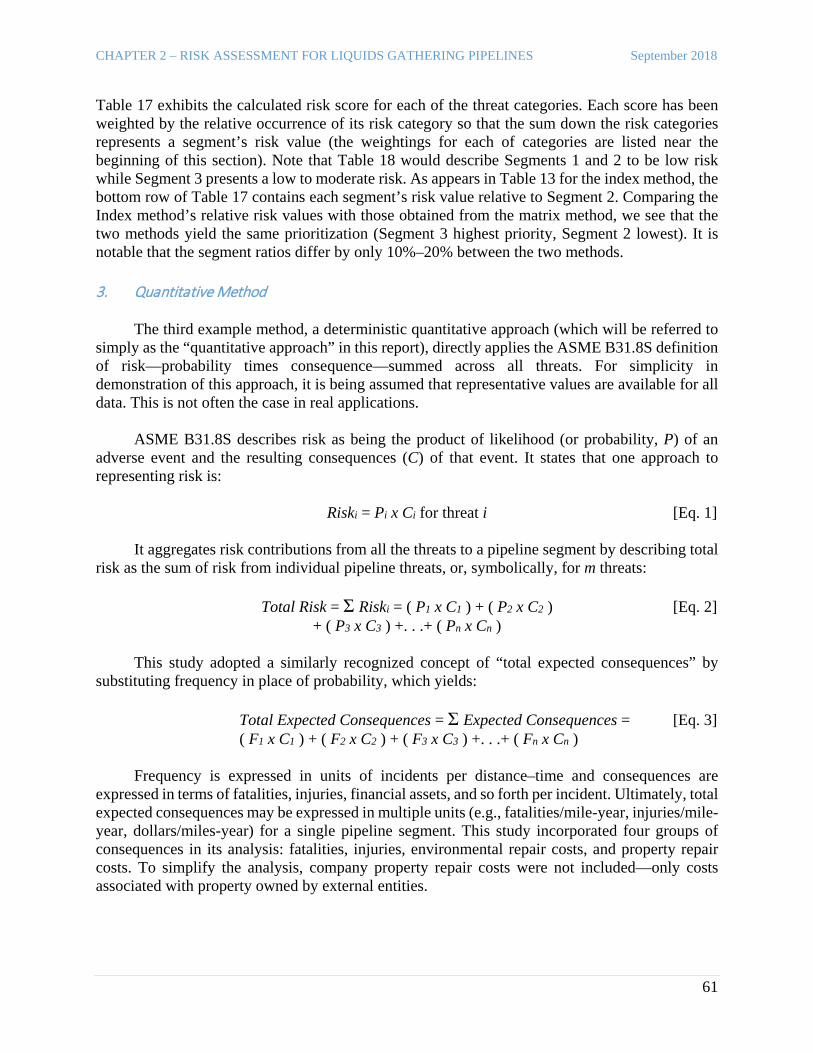
CHAPTER 2 – RISK ASSESSMENT FOR LIQUIDS GATHERING PIPELINES September 2018
61
Table 17 exhibits the calculated risk score for each of the threat categories. Each score has been weighted by the relative occurrence of its risk category so that the sum down the risk categories represents a segment’s risk value (the weightings for each of categories are listed near the beginning of this section). Note that Table 18 would describe Segments 1 and 2 to be low risk while Segment 3 presents a low to moderate risk. As appears in Table 13 for the index method, the bottom row of Table 17 contains each segment’s risk value relative to Segment 2. Comparing the Index method’s relative risk values with those obtained from the matrix method, we see that the two methods yield the same prioritization (Segment 3 highest priority, Segment 2 lowest). It is notable that the segment ratios differ by only 10%–20% between the two methods. 3. Quantitative Method The third example method, a deterministic quantitative approach (which will be referred to simply as the “quantitative approach” in this report), directly applies the ASME B31.8S definition of risk—probability times consequence—summed across all threats. For simplicity in demonstration of this approach, it is being assumed that representative values are available for all data. This is not often the case in real applications. ASME B31.8S describes risk as being the product of likelihood (or probability, P) of an adverse event and the resulting consequences (C) of that event. It states that one approach to representing risk is: Riski = Pi x Ci for threat i [Eq. 1] It aggregates risk contributions from all the threats to a pipeline segment by describing total risk as the sum of risk from individual pipeline threats, or, symbolically, for m threats: Total Risk = Σ Riski = ( P1 x C1 ) + ( P2 x C2 ) [Eq. 2] + ( P3 x C3 ) +. . .+ ( Pn x Cn ) This study adopted a similarly recognized concept of “total expected consequences” by substituting frequency in place of probability, which yields:
Total Expected Consequences = Σ Expected Consequences = [Eq. 3] ( F1 x C1 ) + ( F2 x C2 ) + ( F3 x C3 ) +. . .+ ( Fn x Cn )
Frequency is expressed in units of incidents per distance–time and consequences are expressed in terms of fatalities, injuries, financial assets, and so forth per incident. Ultimately, total expected consequences may be expressed in multiple units (e.g., fatalities/mile-year, injuries/mile-year, dollars/miles-year) for a single pipeline segment. This study incorporated four groups of consequences in its analysis: fatalities, injuries, environmental repair costs, and property repair costs. To simplify the analysis, company property repair costs were not included—only costs associated with property owned by external entities.

CHAPTER 2 – RISK ASSESSMENT FOR LIQUIDS GATHERING PIPELINES September 2018
62
In addition to incorporating four groups of consequences, 23 threats were also included in this example model. These threats were based upon 21 threats recognized in ASME B21.8S and two additional threats introduced in API RP-1160. Table 19 lists those threats and categorizes them.
Table 19. Threats and Threat Categories Adopted for Quantitative Risk Model Example 1. Unintended Human Strike “3rd-Party Strike”
3rd-party and mechanical damage 2. Intended Human Strike “Vandalism” 3. Previously Damaged Pipe 4. Pressure Cycle Induced Fatigue (PCIF) API RP-1160 addition 5. External Corrosion
Time-dependent threats 6. Internal Corrosion 7. Stress Corrosion Cracking (SCC) 8. Selective Seam Corrosion (SSC) API RP-1160 addition 9. Earth Movement
Weather-related and outside force 10. Cold Weather 11. Lightning 12. Flood/Water Event 13. Gasket/O-Ring Failure
Equipment threats 14. Pump Packing/Seal Failure 15. Control/Relief Equipment Failure 16. Miscellaneous (failure of valve or other)
17. Incorrect Operational Procedure Incorrect operation 18. Defective Pipe Seam Manufacturing-related defects 19. Defective Pipe 20. Defective Girth Weld
Welding- and fabrication-related threats
21. Defective Fabrication Weld 22. Stripped Thread, Coupling Failure, Broken Pipe 23. Wrinkle, Bend, or Buckle
The risk chain in Figure 21 depicted relationships of components (threats and consequences) of and contributors (preventive, mitigative and hazardous situations, acts and conditions) to risk. In addition to the 23 threats and four consequences already described as being adopted by the quantitative model example, 84 risk factors representing preventive, mitigative, and hazardous situations, acts, and conditions also were incorporated into the example model. These risk factors are listed in Table 20. It must be carefully noted, however, that this table represents only a sample of possible situations, acts, and conditions considered for use in the example scenario. It is not to be interpreted as a comprehensive checklist of all possible factors affecting risk.

CHAPTER 2 – RISK ASSESSMENT FOR LIQUIDS GATHERING PIPELINES September 2018
63
Table 20. Factors Affecting Risk W i d e A r r a y o f F a c t o r s A f f e c t i n g R i s k
Pipe Diameter Type of inspection Operator competency/training Wall Thickness Hydraulically pressure-tested Contractor competency/training Pipe Material Recency of hydraulic pressure test Reliability of meters
Manufacturing Process Internal coating type Reliability of communications Seam Weld Type Internal coating condition Reliability of control equipment
Age/System Design Age Internal coating age Media attention Relative Segment Elevation External coating type Cathodic protection type
Depth of Burial External coating condition Cathodic protection coverage Soil Type External coating age Cathodic protection age
Soil Grain Size In-line chemicals Outside electric current interference Land Use Value Hydrogen sulfide levels Type of casing Microbiology Coupons present Casing condition
Fluid Transported Corroded weak points Ground thrust from cyclic freezing Pressure Profile Mechanical weak points Thawing of supporting soil
System Pressure Cycling Range Human population density Frost heave susceptibility Line Fill Percentage Ecologically sensitive areas Local geology
Fluid Velocity Proximity to sensitive infrastructure Local hydrology Fluid Temperature Accessibility (distance) Intersection with flood plain
Temperature Cycling Range Accessibility (terrain) Flood frequency Phase of Flow ROW* maintenance Waterway velocity
Operating Tensile Stress Levels ROW patrol Waterway volume Flow Accounting Shared row/crossings Waterway sediment size range
Risk Management Program Electric transmission lines Waterway migration System Ownership Unstable slope Lines located
Maintenance History Slope shoring Compliance with 811 efforts Prevention History Proximity to high mobility spill vector Joining method
Inspectability Connectivity to water source Surface installations Inspection Frequency/History Proximity to sources of stray current Crossing farm tile
* Right of way. The volume of data and number of decisions and calculations required even for this simplified quantitative approach are substantial. The general approach considered 23 threats; four types of consequences; and 84 preventive, mitigative, and hazard factors applied to each pipeline segment. This created a potential of 115 baseline frequency and consequence values and 2268 preventive, mitigative, and hazard adjustment factors per segment. Characteristics of the example scenario, however, simplified application of the quantitative model by decreasing the number of relevant threats and preventive, mitigative, and hazard factors. For example, the effect of threats and factors related to corrosion were not considered relevant to plastic composite pipe. Consequently, threats such as external and internal corrosion,
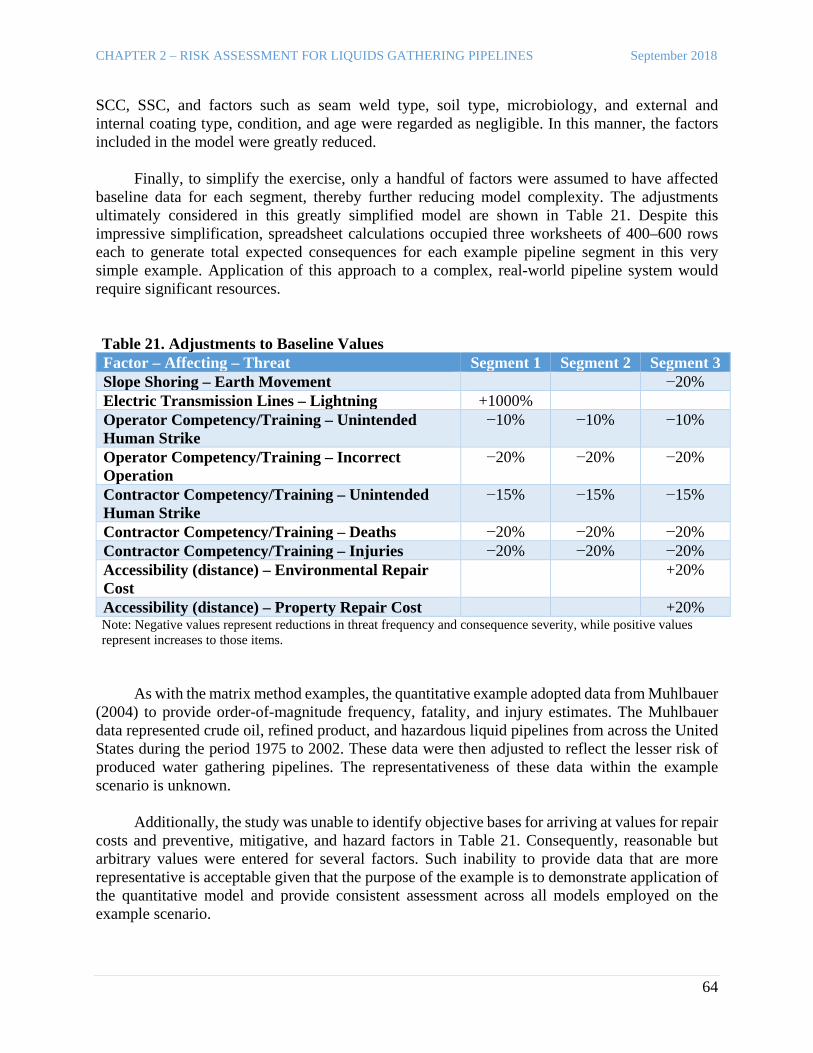
CHAPTER 2 – RISK ASSESSMENT FOR LIQUIDS GATHERING PIPELINES September 2018
64
SCC, SSC, and factors such as seam weld type, soil type, microbiology, and external and internal coating type, condition, and age were regarded as negligible. In this manner, the factors included in the model were greatly reduced. Finally, to simplify the exercise, only a handful of factors were assumed to have affected baseline data for each segment, thereby further reducing model complexity. The adjustments ultimately considered in this greatly simplified model are shown in Table 21. Despite this impressive simplification, spreadsheet calculations occupied three worksheets of 400–600 rows each to generate total expected consequences for each example pipeline segment in this very simple example. Application of this approach to a complex, real-world pipeline system would require significant resources. Table 21. Adjustments to Baseline Values Factor – Affecting – Threat Segment 1 Segment 2 Segment 3 Slope Shoring – Earth Movement −20% Electric Transmission Lines – Lightning +1000% Operator Competency/Training – Unintended Human Strike
−10% −10% −10%
Operator Competency/Training – Incorrect Operation
−20% −20% −20%
Contractor Competency/Training – Unintended Human Strike
−15% −15% −15%
Contractor Competency/Training – Deaths −20% −20% −20% Contractor Competency/Training – Injuries −20% −20% −20% Accessibility (distance) – Environmental Repair Cost
+20%
Accessibility (distance) – Property Repair Cost +20% Note: Negative values represent reductions in threat frequency and consequence severity, while positive values represent increases to those items.
As with the matrix method examples, the quantitative example adopted data from Muhlbauer (2004) to provide order-of-magnitude frequency, fatality, and injury estimates. The Muhlbauer data represented crude oil, refined product, and hazardous liquid pipelines from across the United States during the period 1975 to 2002. These data were then adjusted to reflect the lesser risk of produced water gathering pipelines. The representativeness of these data within the example scenario is unknown. Additionally, the study was unable to identify objective bases for arriving at values for repair costs and preventive, mitigative, and hazard factors in Table 21. Consequently, reasonable but arbitrary values were entered for several factors. Such inability to provide data that are more representative is acceptable given that the purpose of the example is to demonstrate application of the quantitative model and provide consistent assessment across all models employed on the example scenario.

CHAPTER 2 – RISK ASSESSMENT FOR LIQUIDS GATHERING PIPELINES September 2018
65
Table 22 exhibits results from the example quantitative model. The large difference in cost between Segment 2 and the other segments and the similarity in cost between the other segments was unexpected. Much of the cost magnitudes of Segments 1 and 3 are due to only one or two threats. Almost three-quarters of Segment 1’s expected total cost is attributable to unintended human strike that resulted from a relatively large value for frequency of incidents due to its location by a road and residential development and from potentially larger costs given its location. Almost two-thirds of Segment 3’s expected total cost is related to unintended human strike and earth movement. The crucial factors in estimating Segment 3’s values was an accentuated environmental repair cost due to the segment’s easier access to waterways. Table 22. Example Quantitative Model Results
Ave
rage
Fre
quen
cy o
f Fa
ilure
(inc
iden
ts/ m
i/yr
Fata
lity
Rat
e (f
atal
ities
/inci
dent
)
Inju
ry R
ate
(inju
ries
/inci
dent
)
Env
iron
men
tal C
ost
Rat
e ($
US/
inci
dent
)
Prop
erty
Cos
t Rat
e ($
US/
inci
dent
)
Exp
ecte
d Fa
talit
ies R
ate
(fat
aliti
es/m
i-yr)
Exp
ecte
d In
juri
es R
ate
(inju
ries
/mi-y
r)
Exp
ecte
d To
tal C
ost
Rat
e ($
US/
mi-y
r)
Exp
ecte
d Fa
talit
ies
Rat
io
Exp
ecte
d In
juri
es R
atio
Exp
ecte
d To
tal C
ost
Rat
io
Segment 1 6.5 × 10⁻⁵ 3.2 × 10⁻¹¹ 3.2 × 10⁻¹⁰ 1.00 0.70 9.3 × 10⁻⁹ 9.3 × 10⁻⁸ 86.2 20.3 20.3 34.3 Segment 2 1.8 × 10⁻⁵ 3.2 × 10⁻¹¹ 3.2 × 10⁻¹⁰ 0.10 0.10 4.6 × 10⁻¹⁰ 4.6 × 10⁻⁹ 2.5 1.0 1.0 1.0 Segment 3 3.6 × 10⁻⁵ 3.2 × 10⁻¹¹ 3.2 × 10⁻¹⁰ 1.20 0.84 2.0 × 10⁻⁹ 2.0 × 10⁻⁸ 88.4 4.3 4.3 35.1 C. Comparison of Risk Assessment Model Results A few salient comparisons among the various approaches can be drawn.
• The example matrix method provided consistently larger risk estimates than the example
jointly reconciled index model, summarized by the ratios shown in Table 23: – ≈14% larger value for the ratio of Segment 1:Segment 2 – ≈20% larger value for the ratio of Segment 3:Segment 2 – ≈5% larger value for the ratio of Segment 3:Segment 1
• The index models and matrix models both rank Segment 1 risk greater than Segment 2
but less than Segment 3.
• The index models and matrix models both indicate greater similarity in Segments 1 and 3 risk than between Segment 2 and either other segment.

CHAPTER 2 – RISK ASSESSMENT FOR LIQUIDS GATHERING PIPELINES September 2018
66
Table 23. Comparison of Example Index and Matrix Model Results Seg. 1:
Seg. 2 Seg. 2: Seg. 2
Seg. 3: Seg. 2
Seg. 3: Seg. 1
Index Model Individual 1 1.22 1.00 1.44 1.18 Index Model Individual 2 1.19 1.00 1.28 1.08 Index Model Reconciled 1.26 1.00 1.38 1.10 Matrix Model 1.44 1.00 1.66 1.15 Quantitative Model Fatalities and Injuries 20.3 1.0 4.3 0.2 Total Cost 34.3 1.0 35.1 1.0
• The rankings agree with the qualitative impression of both individuals. The consistency of the numerical values is likely coincidental because these rudimentary approaches lack the rigor and detail of risk assessment methods that would be considered more accurate.
• Some of the example quantitative model’s expected consequence estimates deviated
significantly from the two simpler models’ risk estimates. – Segment 1 is estimated to possess five times larger fatality and injury risk than
Segment 3. – Segment 3 is estimated to possess four times larger risk than Segment 2. – Even larger disparities are estimated between Segment 2 and the other segments in
terms of expected total cost. However, the expected total cost of the other segments are comparable to within 3%.
Ultimately, the quantitative model agreed with the less complex models regarding ranking in terms of expected total costs. However, it reverses the ranking of Segments 1 and 3 with respect to expected fatalities and injuries, and it estimates larger differences between Segment 2 and other segments. Since the magnitudes of Segments 1 and 3 estimates are dependent primarily on the frequencies and severities of only one or two threats and associated consequences, it is possible that the frequency and severity values are excessively large. The extent of the excess likely is not adequate to change rankings, but it could substantially reduce the size of the disparities. D. Key Lessons from Examples Although the simple example scenario was undetailed and the risk assessment methods applied to the scenario lacked the typical rigor indicated in the literature, developing a gathering pipeline scenario and applying multiple diverse risk assessment methods to the scenario was instructive and provided several key lessons. Risk Assessment Is Not Easy First, no approach was “easy,” even when assessing an uncomplicated scenario. A detailed and objective quantitative model requires substantially more effort than simpler models. • Depending upon operator needs and assessment approach, acquisition of relevant pipeline
historical data is challenging (Muhlbauer, 2012a, 2012b, 2015).

CHAPTER 2 – RISK ASSESSMENT FOR LIQUIDS GATHERING PIPELINES September 2018
67
• Acquisition or generation of objective values for the preventative, mitigative, and hazard risk factors for use in adjustment of historical data is challenging.
• Estimating fatalities, injuries, and property and environmental repair costs for each gathering pipeline segment is challenging.
Accomplishing these tasks for existing pipelines or pipeline designs requires orders of magnitude more effort than the fictional example. Each pipeline operator must determine what level of accuracy and uncertainty is both practical and sufficient for each specific application of a particular risk assessment approach. Substantial effort was also required to apply the two less complex models. The issue for these models was not the accuracy and uncertainty inherent in quantitative values. Rather, the issue was realism and consistency in working across segments, threats, and consequences. The greater subjectivity implicit in these nonquantitative methods provided an opportunity for inconsistency, bias, and reduced realism in the assessment. Consistency can be as difficult to enforce for qualitative and semiquantitative methods as objectivity is for quantitative methods. Any Method Can Be Useful All methods provided some insight into the relative risk of different segments. Each model points to a list of considerations to guide deliberation. The mere act of deliberation forces prioritization for subsequent action. It is reasonable to expect that more systematic and comprehensive assessment methods yield better results, but any systematic deliberation, no matter how simple or complex, is likely more beneficial than none. Models Exhibited Surprising Consistency When applied to the hypothetical scenario, models exhibited notable consistency in some respects and less consistency in other respects:
• All models ranked Segment 2 as the least risky segment.
• With the exception of the quantitative model’s expected fatalities and injuries, all models concluded that Segment 3 possessed greater risk than Segment 1.
• Independently, and after joint reconciliation, two subject matter experts applying the
index model to the example scenario produced relative risk estimates that differed by only 6% to 13% and jointly produced relative results for the index and matrix models that differed by only 5% to 20%.
• However, the quantitative model departed significantly from the other models in two
respects:
– The magnitude of the relative risk estimates for Segments 1 and 3, with respect to Segment 2, were much larger (160%–2600%) for the quantitative model than for the nonquantitative models.

CHAPTER 2 – RISK ASSESSMENT FOR LIQUIDS GATHERING PIPELINES September 2018
68
– The quantitative model’s fatality and injury risk priority was substantially higher for Segment 1 than for the other segments.
The reader should not attempt to read too much into these results. It is tempting to conclude that the consistency observed in prioritizing segments across the models means that no benefit was received from the greater effort invested in the more advanced models. The level of detail of the example scenario and model are insufficient to support such a conclusion. It should be noted, however, that the more rigorous method highlighted a potential difference between the magnitudes of human and financial risks. The differences in human-related risks were not as apparent in the simpler models. VII. EMERGING TOPICS RELATED TO RISK ASSESSMENT
KEY TAKEAWAYS:
Risk Modeling Work Group (RWMG) • PHMSA’s RMWG study should be reviewed in concert with the results
of the current EERC study after the RMWG study is released. The RMWG study focuses on PHMSA-regulated pipelines rather than on the type of liquids gathering pipelines common in North Dakota. Despite that, the EERC believes that some of the study outcome may be applicable to liquids gathering pipeline risk assessment in North Dakota.
Continuous Improvement • A risk management program is continually evolving and must be
flexible. • There is no single best approach that is applicable to all pipeline systems
for all situations. • New technology should be evaluated and implemented as appropriate. Defense in Depth • Multiple, independent levels of protection designed to compensate for
the failure of one or more levels to ensure risk is held at an acceptable level.
• Practiced by a variety of industries such as nuclear, chemical, transport, and information and communication technology to layer additional preventative/mitigative actions to areas of highest risk.
• This practice seems to have relevance to the liquids gathering pipeline sector.

CHAPTER 2 – RISK ASSESSMENT FOR LIQUIDS GATHERING PIPELINES September 2018
69
In the process of reviewing the status of risk assessment within the pipeline industry and across other industries, several new and emerging topics were observed. Each topic exhibits a relationship with the concept of continuous improvement. This relationship is expected because the prevailing application of risk assessment is continuous improvement. The predominant purpose of risk assessment is to provide a means of measuring risk inherent in designs and existing systems to effect improvement and reduce potential loss. Some of these topics are new, but some have been evolving for decades. Following are several of the topics and trends. A. PHMSA Risk Modeling Work Group A series of serious incidents related to PHMSA-regulated gas transmission and hazardous liquid pipelines prior to 2011 that resulted in fatalities and injuries (trend reflected in Figure 30) was recognized by PHMSA as troubling weakness in pipeline risk analysis (Mayberry, 2011). This prompted PHMSA to host a workshop on risk assessment and recordkeeping in July 2011. During the meeting, a PHMSA presenter expressed the view that effective risk analysis might have prevented or mitigated some incidents. The troubling trend was attributed to the following risk analysis inadequacies:
• Pipeline risk characteristics knowledge • Means to analyze interactive threats • Means to evaluate consequence mitigation approaches • Objective and systematic means to select preventive and mitigative (P&M) measures (Mayberry, 2011)
Figure 30. Trend of serious pipeline incidents within PHMSA jurisdiction (Mayberry, 2011).

CHAPTER 2 – RISK ASSESSMENT FOR LIQUIDS GATHERING PIPELINES September 2018
70
These inadequacies were linked to fundamental concerns regarding:
• Weaknesses of simple, relative models, such as indexing models, that limit their effectiveness in: – Addressing complex threats and hazards. – Identifying previously unrecognized threats. – Evaluating preventive and mitgative measures. – Considering uncertainty.
• Availability and quality of data in records that induce risk assessors to introduce less objective data. The introduced data are difficult to validate and introduce uncertainties that often are not adequately considered when evaluating preventive and mitigative measures.
• Data integration from disparate sources, including location referencing.
• The potential for multiple threats to exist simultaneously and interact.
• Risk analysis to connect and influence “real” decision-making.
• Uncertainties attributable to measurement accuracy and natural variation in measurements as well as model error resulting from the state of knowledge regarding model assumptions and the numerical values of model parameters (Mayberry, 2011).
During the PHMSA workshop, a representative of API and Association of Oil Pipe Lines (AOPL) gave a presentation highlighting the investment and progress that the pipeline industry has made in improving methods and decision making. Data demonstrating the liquid pipeline industry’s impressive reduction in incidents and spills (refer to Figures 31 and 32) of pipeline risk was presented and was attributed to an exponential increase in knowledge (Foley, 2011). Pipeline operators and representatives from the Interstate Natural Gas Association of America (Kirsch, 2011) and the American Gas Association (Marek, 2011) also spoke at the workshop on how they employ risk assessment and the similarly impressive results they have attained. The workshop finished with addresses on risk assessment issues such as dealing with recordkeeping gaps and interactive threats. In August 2014, as a part of its on-going research and development (R&D) effort, PHMSA convened a Government/Industry Pipeline R&D Forum that partitioned participants into five working groups. One of these working groups was entitled “Improving Risk Models.” PHMSA directed the 44-member working group to discuss:
1. How risk models could evolve from “index” type models used to prioritize pipeline
segments to “investigative-oriented approaches/models.” 2. How to more meaningfully evaluate risk from nonpipe equipment in pipeline systems. 3. How to facilitate the analytical use of risk approach/model results (PHMSA, 2014).
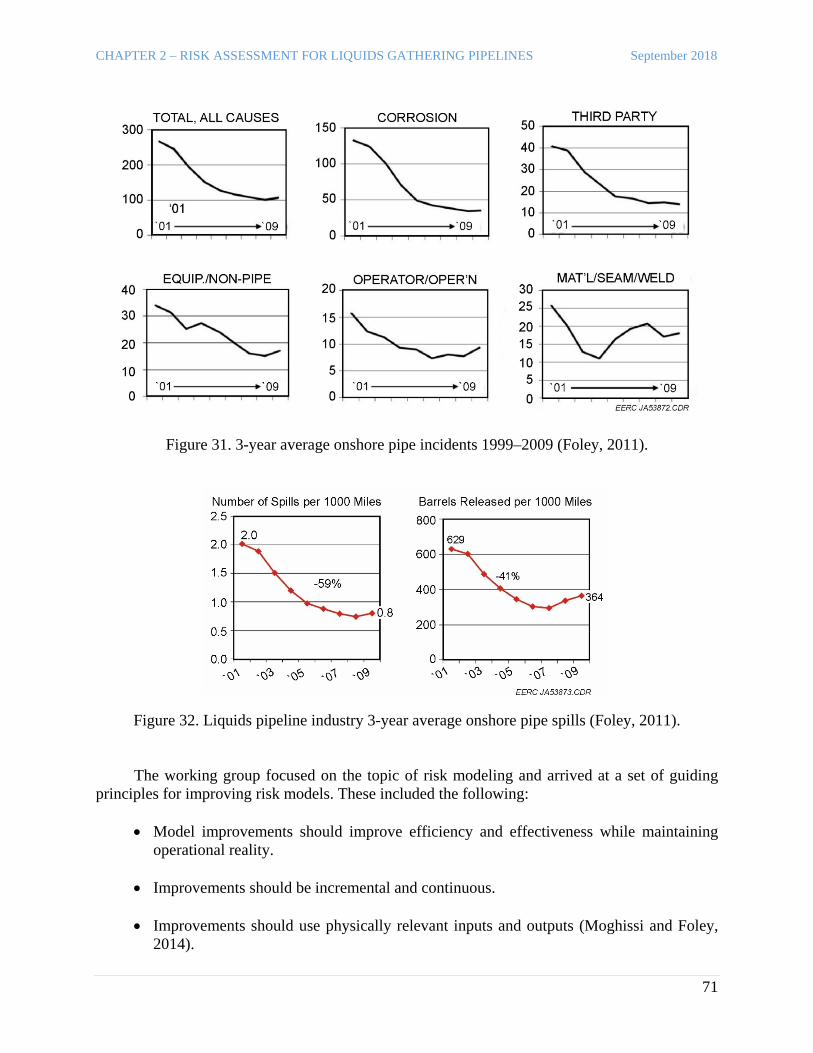
CHAPTER 2 – RISK ASSESSMENT FOR LIQUIDS GATHERING PIPELINES September 2018
71
Figure 31. 3-year average onshore pipe incidents 1999–2009 (Foley, 2011).
Figure 32. Liquids pipeline industry 3-year average onshore pipe spills (Foley, 2011). The working group focused on the topic of risk modeling and arrived at a set of guiding principles for improving risk models. These included the following:
• Model improvements should improve efficiency and effectiveness while maintaining operational reality.
• Improvements should be incremental and continuous.
• Improvements should use physically relevant inputs and outputs (Moghissi and Foley,
2014).

CHAPTER 2 – RISK ASSESSMENT FOR LIQUIDS GATHERING PIPELINES September 2018
72
The group then converged on several principal improvements:
• How to address low-likelihood catastrophic failures. • How to connect enterprise risk management systems, safety management systems, and
regulations.
• How to move to probabilistic risk models and, in so doing, address targets (Moghissi and Foley, 2014).
The working group also brought up several minor improvements:
• How to address unintended consequences, e.g., mitigation creating new risk. • How to expose hidden threats. • How to learn from near misses. • How to use models to identify R&D needs. • How to predict new threats emanating from operational changes, e.g., infrequent weather
and new production sources (Moghissi and Foley, 2014). Ultimately, four high-priority gaps were identified:
1. Acquiring perspective from pipeline industry and risk modeling stakeholders by means of workshop(s).
2. Acquiring knowledge from a study performing a critical review of candidate risk
assessment models – considering models from within and outside of the pipeline industry, their capacity to predict past incidents, and their suitability in light of business, regulatory, and operational realities.
3. Acquiring knowledge from studying other industries’ approaches to preventing
catastrophic events.
4. Acquiring knowledge from studying risk tolerance and considering the conflict between non-zero risk and the goal of zero failures (Moghissi and Foley, 2014).
PHMSA decided to formalize the work group, culminating in 2015 with the formation of the RMWG. In September 2015, a second risk assessment workshop was convened. PHMSA speakers early in the workshop established a set of risk modeling challenges:
• Acquiring validated data. • Constructing meaningful models that comprehensively identify threats and consequences
and reliably estimate their likelihoods and magnitudes.
• Constructing models that satisfy functional and performance requirements (Nanney and Lee, 2015).

CHAPTER 2 – RISK ASSESSMENT FOR LIQUIDS GATHERING PIPELINES September 2018
73
Three paper studies (whose topics were mentioned in association with the 2014 workshop) were completed:
• “Approaches for Preventing Catastrophic Events” (Lever and Ersoy, 2016) • “Paper Study on Risk Tolerance” (Flamberg and others, 2016) • “Critical Review of Candidate Pipeline Risk Models” (Koduru and others, 2016)
The effort described in the third document parallels the activities of current EERC study, such as literature reviews of risk assessment performed by the pipeline and other industries, including nuclear, offshore, aircraft and power transmission industries. The RMWG was formed as a follow-up to the September 2015 workshop. The purpose of the RMWG was to provide technical input to PHMSA to aid in development of a pipeline system risk modeling technical guidance document (PHMSA, 2016). The RMWG provides a forum to acquire perspective and a wide range of input from a variety of gas transmission and hazardous liquid pipeline stakeholders. The RMWG comprises approximately 30 members representing regulatory, operator, and related third-party communities. The RMWG is currently working on a guidance document that is anticipated to address:
• Regulatory requirements for risk analysis and assessment performance.
• Risk modeling’s position in overall pipeline risk management.
• Likelihood modeling, including pipeline threats, single approach or threat-specific approach, selection of approach, human performance modeling, critical likelihood parameters, interactive threat modeling, threshold or threat consideration, validation of results, and application to identification of preventative measures.
• Consequence approach selection, including identification of receptors, emergency
response, critical consequence parameters, validation of results, and application to identification of mitigative measures.
• Facility risk approach selection, including selection of approach (hazard identification,
bowtie analysis, scenarios, etc.) comparison with pipeline risk, and application to preventive and mitigative measures to reduce risk.
• Risk modeling data needs, including threat- and consequence-specific data, data
validation, available industry, government and international data, and related National Transportation Safety Board recommendations (PHMSA, 2016).
The document is expected to discuss six model types: relative assessment (index), scenario-based, semiquantitative, quantitative, probabilistic, and facility risk models (PHMSA, 2016). As of June 2018, a draft of this document was in its second round of reviews, with one more round anticipated. No formal release date has yet been disclosed (Nanney, 2018). It may be beneficial to consider the RMWG study in concert with the current EERC study. The RMWG study focuses on PHMSA-regulated pipelines rather than on the type of liquids gathering pipelines common in

CHAPTER 2 – RISK ASSESSMENT FOR LIQUIDS GATHERING PIPELINES September 2018
74
North Dakota. Despite that, the EERC believes that some of the study outcome may be applicable to liquids gathering pipeline risk assessment in North Dakota. B. Feedback and Continuous Improvement Feedback, validation, and continuous improvement are quality concepts that are woven into the existing ASME B31.8S and API RP-1160 pipeline standards and appear frequently in other pipeline risk assessment literature. For the purpose of this discussion, “feedback” refers to data generated in the later steps of a risk management program being returned to update preceding steps. “Continuous improvement” refers to the quality of risk assessment, its processes, and supporting systems in the broadest sense. Figures 33 and 34 depict risk management processes from ASME B31.8S and API RP-1160, respectively. Embedded in these processes are feedback loops (“continuous improvement”) that strive to constantly improve the integrity of pipelines. ASME B31.8S states:
“One of the most important steps in an effective risk analysis is feedback … Data collected during the inspection and mitigation activities shall be analyzed and integrated with previously collected data … The addition of this new data is a continuous process that, over time, will improve the accuracy of future risk assessments … Risk assessment should be performed periodically to include new information, consider changes made to the pipeline system or segment, incorporate external changes, and consider new scientific techniques that have been developed and commercialized since the last assessment.”
API RP-1160 states:
“Analyzing for risks in a pipeline system is an iterative process. The operator will periodically gather additional and refreshed information and system operating experience. This information should be factored into understanding of system risks … After an integrity assessment has been performed, the operator should add the information acquired through the assessment to the database of information used to assess risk. In addition, as the system continues to be operated, the accumulated operating, maintenance and surveillance data should be collected for input into the next scheduled reevaluation of risk … The experience that comes from carrying out integrity assessments and mitigative actions should be fed back into the risk assessment process in order for an operator’s risk assessment process to remain reliable.”
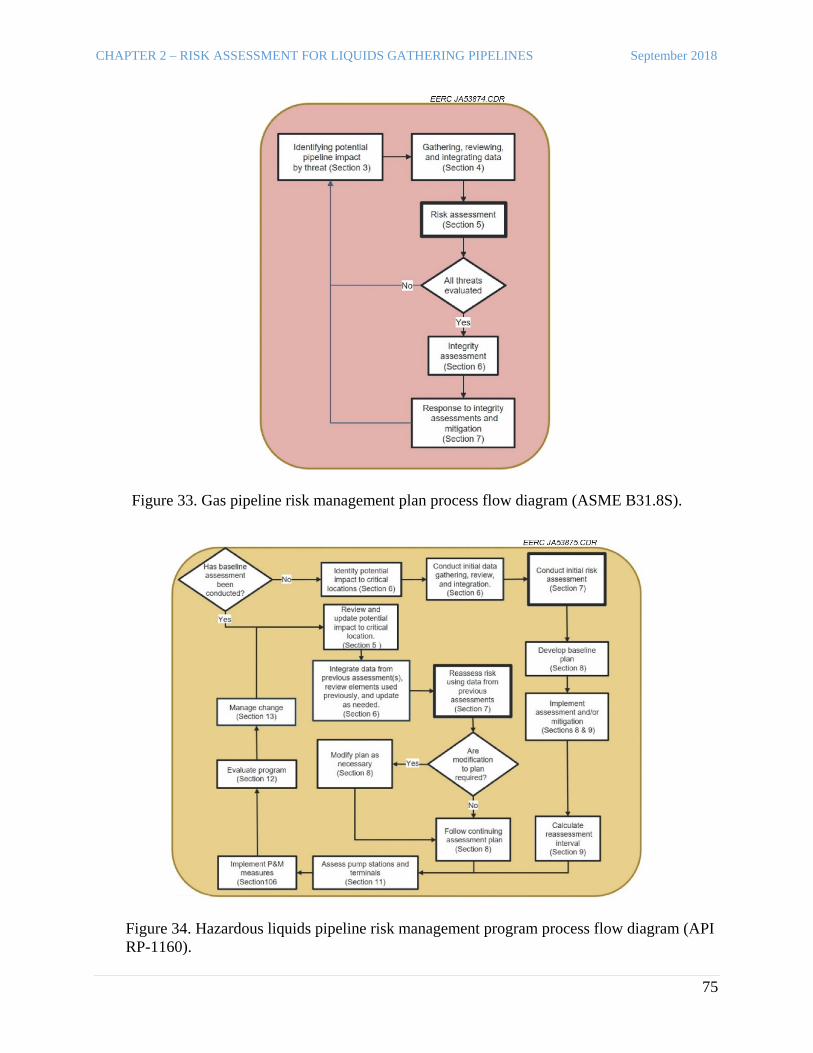
CHAPTER 2 – RISK ASSESSMENT FOR LIQUIDS GATHERING PIPELINES September 2018
75
Figure 33. Gas pipeline risk management plan process flow diagram (ASME B31.8S).
Figure 34. Hazardous liquids pipeline risk management program process flow diagram (API RP-1160).

CHAPTER 2 – RISK ASSESSMENT FOR LIQUIDS GATHERING PIPELINES September 2018
76
Muhlbauer includes acquiring complete data as one of his eight essential elements of risk assessment (2012c, 2016; Det Norske Veritas and Muhlbauer, 2012). He asserts that risk assessment must collect all that is known about any pipeline being assessed; that reliance of risk assessment on full and complete knowledge cannot be overemphasized; and that information degrades over time, especially for time-dependent processes such as corrosion. He also states that superior risk assessment processes possess abilities to rapidly integrate new information, quickly refresh risk estimates, and swiftly incorporate new information regarding emerging threats and P&M opportunities. Continuous improvement concepts appear numerous times in the ASME and API pipeline standards in reference to data quality, risk model, new technology, and other elements of risk management programs. Perhaps the documents’ greatest emphasis is related to review and overall management of risk management programs. According to ASME B31.8S, risk management programs are comprised of five subordinate plans, one of which is the performance plan. The purpose of the performance plan is to provide a continuing measure of program effectiveness over time, with the ultimate goal being use of the results of the performance measurements and audits to modify the risk management program as part of a continuous improvement process. A similar program evaluation is part of API RP-1160, which states that the results of the performance evaluation should be used to modify the risk management program as part of a continuous improvement process. Two topics often appear in conjunction with continuous improvement in the AMSE and API standards: these are flexibility and new technology. The linkages are easy to understand from the perspectives that constraints that prevent selecting the best option limit the ability of systems to improve and new technologies potentially offer improved performance. ASME B31.8S states:
• A risk management program is continually evolving and must be flexible. – A risk management program should be customized to meet each operator’s unique
conditions. – The program should be periodically evaluated and modified to accommodate changes. – Periodic evaluation is required to ensure the program takes appropriate advantage of
improved technologies and that the program utilizes the best set of prevention, detection, and mitigation activities that are available for the conditions at that time.
• There is no single best approach that is applicable to all pipeline systems for all situations. • New technology should be evaluated and implemented as appropriate. Pipeline system
operators should avail themselves of new technology as it becomes proven and practical. API RP-1160 echoes these principles. C. Defense in Depth “Defense in depth” is a concept practiced by a variety of technical disciplines and industries such as nuclear, chemical, transport, and information and communication technology (Chierici and

CHAPTER 2 – RISK ASSESSMENT FOR LIQUIDS GATHERING PIPELINES September 2018
77
others, 2016). The terminology stems from a military concept describing an army’s frontline composed of a deep system or interconnected trench lines and strong points. Today, it generally refers to multiple, independent levels of protection designed to compensate for the failure of one or more levels to ensure risk is held at an acceptable level (Drouin and others, 2016). The chemical process industry employs a similar concept, “layer(s) of protection analysis” (LOPA), in seeking to constrain risk to acceptable levels. The industry generally recognizes eight layers of protection (Center for Chemical Process Safety, 2001):
1. Process design
2. Basic controls, process alarms and operator supervision
3. Critical alarms, operator supervision and manual intervention
4. Automatic action: SIS (safety instrumented systems) or ESD (emergency shutdown) systems
5. Physical protection: relief devices
6. Physical protection: containment
7. Plant emergency response
8. Community emergency response
Each layer represents a device, system, or action that is independent of the initiating event or other layers of protection associated with the scenario and is able to prevent a scenario from progressing to its undesired consequence (Dowell and Hendershot, 2002). Independent protective layers possess characteristics similar to layers of defense. As a risk analysis method, LOPA is a simplified, semiquantitative approach that focuses on one cause (or initiating event)–one consequence scenarios and defines risk as a function of the frequency and consequence of individual scenarios. In practice by the chemical process industry, LOPA is performed by qualified, multidisciplinary teams subsequently to a qualitative hazard analysis, such as a HAZOP (hazardous operations) study, as part of a Process Hazard Analysis to comply with OSHA’s Process Safety Management (PSM) of Highly Hazardous Chemicals (29 CFR 1910.119) regulation. The hazard analysis identifies hazard scenarios and provides information to LOPA in order for LOPA to assess the adequacy of existing and need for additional preventative/mitigative measures. LOPA estimates the frequency of the specific consequence for the specific initiating event as being the product of the frequency of the initiating event times the product of the probabilities of failure on demand of each of the independent protective layers. Failure probabilities are expressed as order-of-magnitude or decimal math values (Willey, 2014). When the resulting
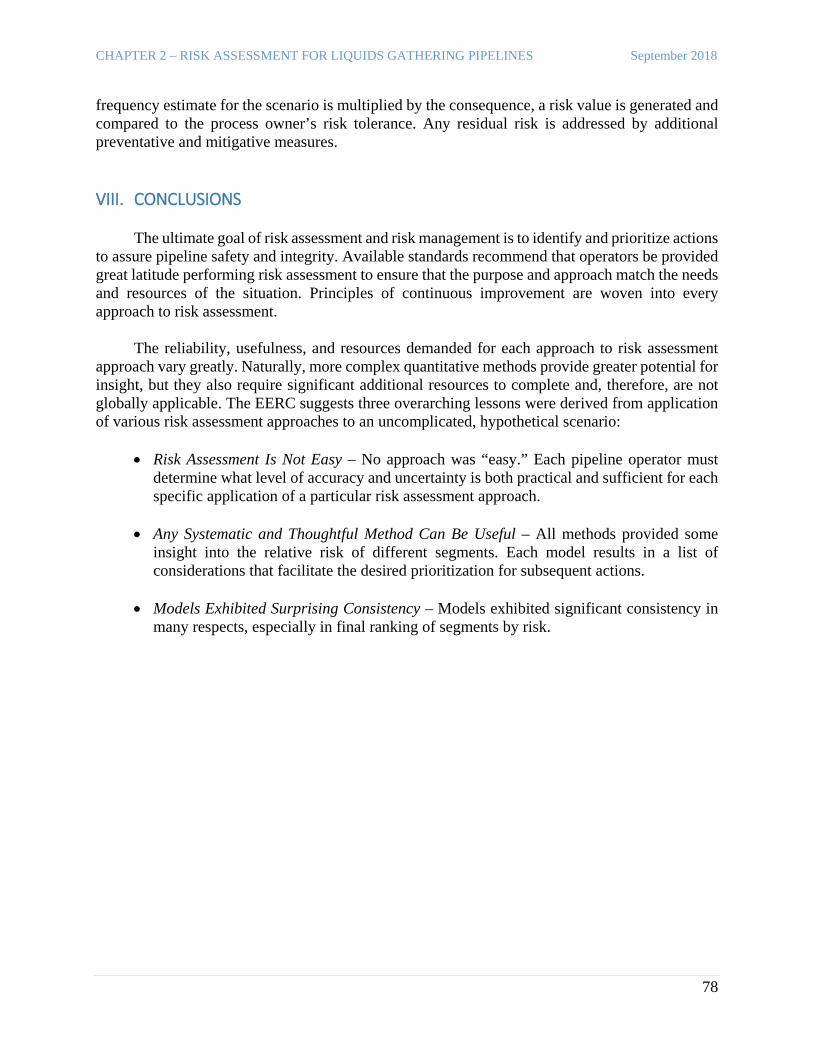
CHAPTER 2 – RISK ASSESSMENT FOR LIQUIDS GATHERING PIPELINES September 2018
78
frequency estimate for the scenario is multiplied by the consequence, a risk value is generated and compared to the process owner’s risk tolerance. Any residual risk is addressed by additional preventative and mitigative measures. VIII. CONCLUSIONS The ultimate goal of risk assessment and risk management is to identify and prioritize actions to assure pipeline safety and integrity. Available standards recommend that operators be provided great latitude performing risk assessment to ensure that the purpose and approach match the needs and resources of the situation. Principles of continuous improvement are woven into every approach to risk assessment. The reliability, usefulness, and resources demanded for each approach to risk assessment approach vary greatly. Naturally, more complex quantitative methods provide greater potential for insight, but they also require significant additional resources to complete and, therefore, are not globally applicable. The EERC suggests three overarching lessons were derived from application of various risk assessment approaches to an uncomplicated, hypothetical scenario:
• Risk Assessment Is Not Easy – No approach was “easy.” Each pipeline operator must determine what level of accuracy and uncertainty is both practical and sufficient for each specific application of a particular risk assessment approach.
• Any Systematic and Thoughtful Method Can Be Useful – All methods provided some
insight into the relative risk of different segments. Each model results in a list of considerations that facilitate the desired prioritization for subsequent actions.
• Models Exhibited Surprising Consistency – Models exhibited significant consistency in
many respects, especially in final ranking of segments by risk.

REFERENCES September 2018
79
REFERENCES American Petroleum Institute, 2013, API Recommended Practice 1160—managing system
integrity for hazardous liquid pipelines, 2d ed., Errata: American Petroleum Institute, September.
American Petroleum Institute, 2015, API Recommended Practice 1173—pipeline safety management systems, (1st ed.): American Petroleum Institute, July.
American Petroleum Institute, 2015, API Recommended Practice 1175—pipeline leak detection – program management (1st ed.), Errata: American Petroleum Institute, published March 2017.
American Society of Mechanical Engineers, 2016, ASME B31.8S-2016—managing system integrity of gas pipelines: New York, American Society of Mechanical Engineers, Supplement to ASME B31.8.
Araujo, M.E., 2016, Near real-time automated detection of small hazardous liquid pipeline leaks using remote optical sensing and machine learning, in Proceedings of the 2016 11th International Pipeline Conference: Calgary, Alberta, American Society of Mechanical Engineers, IPC2016-64218.
Bogost, I., 2017, Why Zuckerberg and Musk are fighting about the robot future: The Atlantic Magazine, July.
Center for Chemical Process Safety, 2001, Layer of protection analysis—simplified process risk assessment: American Institute of Chemical Engineers, John Wiley & Sons, Inc., New York.
Chierici, L., Fiorini, G.L., La Rovere, S., and Vestrucci, P., 2016, The evolution of defense in depth approach—a cross sectorial analysis: Open Journal of Safety Science and Technology, v. 6, p. 35–54.
Det Norske Veritas, and Muhlbauer, W.K., 2012, Pipeline risk assessment—the essential elements: Pipeline & Gas Journal, May, 7 p. www.pipelinerisk.net/articles/Pipeline-Risk-Assessment-Essential-Elements-Sample-Case_PGJ0113.pdf (accessed 2018).
Dowell III, A.M., and Hendershot, D.C., 2002, Simplified risk analysis—layer of protection analysis (LOPA): American Institute of Chemical Engineers 2002 National Meeting, Paper 281a, November 3–8, 2002, Indianapolis, Indiana.
Drouin, M., Wagner, B., Lehner, J., and Mubayi, V., 2016, Historical review and observations of defense-in-depth: U.S. Nuclear Regulatory Commission, Office of Nuclear Regulatory Research, NUREG/KM-0009, Upton, New York.
eSmart Systems, 2017, February 8, Norgesnett goes live with connected grid (press release): www.esmartsystems.com/newsroom/norgesnett-goes-live-with-connected-grid/ (accessed February 2018).
Finlay, S., 2017, We should be as scared of artificial intelligence as Elon Musk is: Fortune Magazine, August.
REFERENCES September 2018
80
Flamberg, S., Rose, S., Kurth, B., and Sallaberry, C., 2016, Paper study on risk tolerance: Final Report, Kiefner and Associates, Inc., Final Report Number 16–092, Columbus, Ohio.
Foley, C., 2011, Liquid pipeline industry perspective on risk assessment: PHMSA Risk Assessment Panel Presented at Improving Pipeline Risk Assessments and Recordkeeping, Arlington, Virginia, Pipeline & Hazardous Materials Safety Administration. https://primis.phmsa.dot.gov/meetings/FilGet.mtg?fil=261 (accessed February 2018).
Hammond, K., 2015, What is artificial intelligence? Computerworld, April.
Hetes, R., Gallagher, K., Olsen, M., Schoeny, R., and Stahl, C., 2014, Probabilistic risk assessment to inform decision making: frequently asked questions: U.S. Environmental Protection Agency, Office of the Science Advisor, Risk Assessment Forum, EPA/100/R-14/003.
Holley, P., 2015, Bill Gates on dangers of artificial intelligence: “I don’t understand why some people are not concerned”: Washington Post, January.
Kaplan, S., and Garrick, B.J., 1981, On the quantitative definition of risk: Risk Analysis, v. 1, no. 1, p. 11–27.
Kirsch, P., 2011, Risk assessment: Presented at Improving Pipeline Risk Assessments and Recordkeeping, Pipeline & Hazardous Materials Safety Administration, Arlington, Virginia, July 21. https://primis.phmsa.dot.gov/meetings/FilGet.mtg?fil=250 (accessed February 2018).
Knight, W., 2017, Apple isn’t as late to automatic driving as you might think: MIT Technology Review, June.
Koduru, S., Adianto, R., and Skow, J., 2016, Final report on critical review of candidate pipeline risk model: C-FER Technologies, M172, Edmonton, Alberta.
Lever, E., and Ersoy, D., 2016, Final report on approaches for preventing catastrophic events: Gas Technology Institute, GTI Project Number 21878, Des Plaines, Illinois.
Mangold, D., and Muhlbauer, K., 2013, Essential elements of risk assessment. Presented at 2DO Congreso y Exposición Internacional de Logística, Transporte y Distribución de Hidrocarburos 2013, León, Guanajuato, Mexico. www.slideshare.net/LTDH2013/mangold-essential-elements-of-risk-assessment (accessed February 2018).
Marek, M., 2011, PHMSA public workshop on pipeline risk assessments and recordkeeping: Presented at Improving Pipeline Risk Assessments and Recordkeeping, Pipeline & Hazardous Materials Safety Administration, Arlington, Virginia. https://primis.phmsa.dot.gov/ meetings/FilGet.mtg?fil=256 (accessed February 2018).
Mayberry, A., 2011, Pipeline risk assessments and recordkeeping. Presented at Improving Pipeline Risk Assessments and Recordkeeping, Pipeline & Hazardous Materials Safety Administration, Arlington, Virginia. https://primis.phmsa.dot.gov/meetings/FilGet.mtg?fil=264 (accessed February 2018).
Moghissi, O., and Foley, C., 2014, Working Group 4—improving risk models: Government/ Industry Pipeline R&D Forum, Pipeline & Hazardous Materials Safety Administration,

REFERENCES September 2018
81
Rosemont, Illinois, August 6–7, 2014. https://primis.phmsa.dot.gov/rd/mtgs/080614/ WG_4_ReportOut.pdf (accessed February 2018).
Mohitpour, M., Murray, A., McManus, M., and Colquhoun, I., 2010, Pipeline integrity assurance a practical approach: American Society of Mechanical Engineers, ASME Press, New York.
Mora, R.G., Hopkins, P., Cote, E.I., and Shie, T., 2016, Pipeline integrity management systems—a practical approach: American Society of Mechanical Engineers, ASME Press, New York.
Muhlbauer, W.K., 2004, Pipeline risk management manual—ideas: techniques and resources, 3rd ed: Burlington, Massachussetts, Elsevier, Inc., Gulf Professional Publishing.
Muhlbauer, W.K., 2012a, Myth busting—I don’t have enough data (Part 1): Pipelines International, no. 12, p. 50–51.
Muhlbauer, W.K., 2012b, Myth busting—I don’t have enough data (Part 2): Pipelines International, no. 13, p. 56–57.
Muhlbauer, W.K., 2012c, The essential elements of risk assessment: Pipelines International, no. 11, p. 35.
Muhlbauer, W.K., 2013, Measuring failure potential—exposure, mitigation and resistance: Pipelines International, v. 18, p. 54–55.
Muhlbauer, W.K., 2015, Pipeline risk assessment—the definitive approach and its role in risk management: Austin, Texas, Expert Publishing, LLC.
Muhlbauer, W.K., 2016, Pipeline risk assessment management: Presented at Risk Modeling Work Group Meeting, Houston, Texas, October 4–6, 2016. https://primis.phmsa.dot.gov/rmwg/ docs/Muhlbauer-PHMSA_committee_Oct_2016.pdf (accessed February 2018).
Muhlbauer, W.K., WKMC, and DNV GL, 2014, Developments toward unified pipeline risk assessment approach: Pipeline & Gas Journal, v. 241, no. 3.
Nakashima, R., 2017, Why AI visionary Andrew Ng teaches humans to teach computers: Associated Press, August.
Nanney, S., 2018, Personal communication, April 3, 2018.
Nanney, S., and Lee, K., 2015, Practical risk modeling challenges: PHMSA Pipeline Risk Modeling Methodologies Public Workshop, Pipeline & Hazardous Materials Safety Administration, Office of Pipeline Safety, Arlington, Virginia, September 10, 2015.
New Century Software, Inc., 2017, IntegrityPlusTM (computer software). www.ncintegrityplus.com/im/pdf/Pipeline_Risk_Modeling_and_Analysis.pdf.
Osborne, H., 2017, Stephen Hawking AI warning—artificial intelligence could destroy civilization: Newsweek, November.
REFERENCES September 2018
82
Pipelines & Hazardous Materials Administration, 2011, Fact sheet—risk assessment: December 1. https://primis.phmsa.dot.gov/comm/FactSheets/FSRiskAssessment.htm (accessed February 2018)
Pipelines & Hazardous Materials Administration, 2014, Working group subject backgrounds: Government/Industry Pipeline R&D Forum, Pipeline & Hazardous Materials Administration, Chicago, Illinois, August 6. https://primis.phmsa.dot.gov/meetings/filGet.mtg?fil=600 (accessed February 2018).
Pipelines & Hazardous Materials Administration, 2016, The “risk modeling work group” and the application of risk assessment in integrity management programs: rmwg template presentation, October 7. https://primis.phmsa.dot.gov/rmwg/docs/Risk%20Modeling%20Work%20Group %20Mission%20Statement020816.docx (accessed February 2018).
R&D Magazine, 2017, Smart leak detection (SLED) system: R&D 100 Conference, January 10, 2018. www.rd100conference.com/awards/winners-finalists/6840/smart-leak-detection-sled-system/ (accessed February 2018).
Shermer, M., 2017, Artificial intelligence is not a threat—yet: Scientific American, March 1.
Siu, N., Stutzke, M., Dennis, S., and Harrison, D., 2016, Probabilistic risk assessment and regulatory decisionmaking—some frequently asked questions: U.S. Nuclear Regulatory Commission, Office of Nuclear Regulatory Research.
Stamatelatos, M., and Dezfuli, H., 2011, Probabilistic risk assessment procedures guide for NASA managers and practitioners: National Aeronautics and Space Administration, NASA/SP-2011–3421.
U.S. National Archives and Records Administration. Code of Federal Regulations. Title 29, Subtitle B, Chapter XVII, Part 1910, Subpart H, Part 119, Occupational Safety and Health Standards, Hazardous Materials, Process Safety Management of Highly Hazardous Chemicals.
U.S. National Archives and Records Administration. Code of Federal Regulations. Title 49, Subtitle B, Chapter I, Subchapter D, Parts 190–199, Other Regulations Relating to Transportation, Pipeline and Hazardous Materials Administration, Pipeline Safety.
Willey, R.J., 2014, Layer of protection analysis: Procedia Engineering, v. 84, p. 12–22.