eel river watershed overview for nc steelhead · 2018-06-20 · eel river watershed overview for nc...
TRANSCRIPT
Eel River Watershed Overview for NC Steelhead
The following functionally independent and potentially independent populations of the Eel River
(Spence et al. 2012), selected to achieve a low extinction risk for recovery scenarios, were assessed
using the CAP protocols:
Essential Populations
● South Fork Eel River (Functionally Independent)
● Van Duzen River (Functionally Independent)
● Middle Fork Eel River (Functionally Independent)
● North Fork Eel River (Functionally Independent)
● Upper Mainstem Eel River (Functionally Independent)
● Tomki Creek (Functionally Independent)
● Larabee Creek (Potentially Independent)
● Chamise Creek (Potentially Independent)
● Woodman Creek (Potentially Independent)
● Outlet Creek (Functionally Independent)
In addition, a number of potentially independent populations of the Eel River were selected for
recovery scenarios to attain moderate extinction risk criteria and the dependent populations were
selected for recovery scenarios to meet redundancy and occupancy criteria; these populations
were assessed using the Rapid Assessment protocols:
Supporting Populations
● Lower Interior/North Mountain Interior Rapid Assessment
o Bell Springs Creek (Potentially Independent)
o Bucknell Creek (Potentially Independent)
o Dobbyn Creek (Potentially Independent)
o Garcia Creek (Dependent)
o Jewett Creek (Potentially Independent)
o Soda Creek (Dependent)
Coastal Multispecies Recovery Plan Vol. III, Northern California Steelhead
Eel River Overview
● North Coastal Diversity Stratum: Eel River Rapid Assessment
o Lower Mainstem Eel River Tributaries1 (Dependent)
o Howe Creek (Dependent)
The following sections provide a general overview of the abundance and distribution of NC
steelhead, history of land use, current resources and land management, and a brief summary of
the CAP viability, stresses, and threats results for the Eel River Watershed.
Abundance and Distribution
Information on the historic abundance and distribution of adult steelhead in the Eel River
watershed are limited and poorly understood. Historically, winter-run (winter) steelhead are
thought to have spawned and reared in the mainstem and tributary streams of all major subbasins
in the Eel River Watershed. The distribution of summer-run (summer) steelhead was less
extensive with populations primarily located in the Middle Fork, Van Duzen, and North Fork
subbasins (Moyle et al. 2008). Like other coastal populations throughout California, steelhead use
of the Eel River estuary was undoubtedly extensive with multiple life stages utilizing the estuary
throughout the year. The construction of Scott Dam (1922) eliminated significant portions of
historic spawning habitat for steelhead in the Upper Mainstem Eel River including “some of the
best spawning grounds in the entire watershed (Gravelly Valley) (Shapovalov 1939).” Aside from the
loss of habitat upstream of Scott Dam and within reaches flooded by both Van Arsdale Reservoir
and Lake Pillsbury, steelhead remain widely distributed throughout the Eel River Watershed.
Based on amount of historic habitat available in the watershed, Yoshiyama and Moyle (2010)
estimate the historic run size ranged between 100,000 and 150,000 adults per year for both the
winter and summer populations. There are two long-term data series of adult returns to the Eel
River Watershed—ladder counts at the Van Arsdale Fisheries Station (VAFS) located at Cape
1 The Lower Mainstem Eel River includes a set of small tributaries to the lower mainstem of the Eel River.
Coastal Multispecies Recovery Plan Vol. III, Northern California Steelhead
Eel River Overview
Horn Dam on the Upper Mainstem Eel River (Figure 1), and counts at Benbow Dam on the South
Fork Eel River (Figure 2). Based on these records, and assuming the historic run size estimates
above, steelhead runs in the Eel River watershed have declined substantially with a precipitous
decline since the 1950s. Annual counts at VAFS averaged 4,394 in the 1930’s, which declined to
731 during the 1970’s (Figure 1). Similarly, on the South Fork Eel River, adult returns at Benbow
Dam in the 1940s averaged 18,800 fish, which declined to an average of 3,400 fish during the 1970s
(Figure 2). For summer steelhead, the decline in abundance is equally as significant. CDFG (1997)
noted that recent counts were approximately 80 to 90 percent lower than counts made in the 1930s
and 1940s.
Recent data of steelhead adult returns to the Eel River Watershed are limited primarily to counts
at the VAFS on the Upper Mainstem and dive counts of summer steelhead adults in the Middle
Fork Eel River. Overall, the trend of adult returns at VAFS is negative with recent counts well
below the peak counts from the 1930s and 1940s. There is a strong hatchery influence as well.
Between 1997 and 2007, more than 90% of adult steelhead returns at VAFS were of hatchery
origin, although the trend in wild fish has been positive over the past 14 years (Williams et al.
2011). Nevertheless, the Upper Mainstem Eel River population remains highly impacted and the
overall population is at high risk of extinction (Williams et al. 2011). Based on recent counts of
summer adults in the Middle Fork Eel River, Williams et al. (2011) concluded this population
remains at moderate risk of extinction despite recent counts being slightly above low extinction
thresholds.
Coastal Multispecies Recovery Plan Vol. III, Northern California Steelhead
Eel River Overview
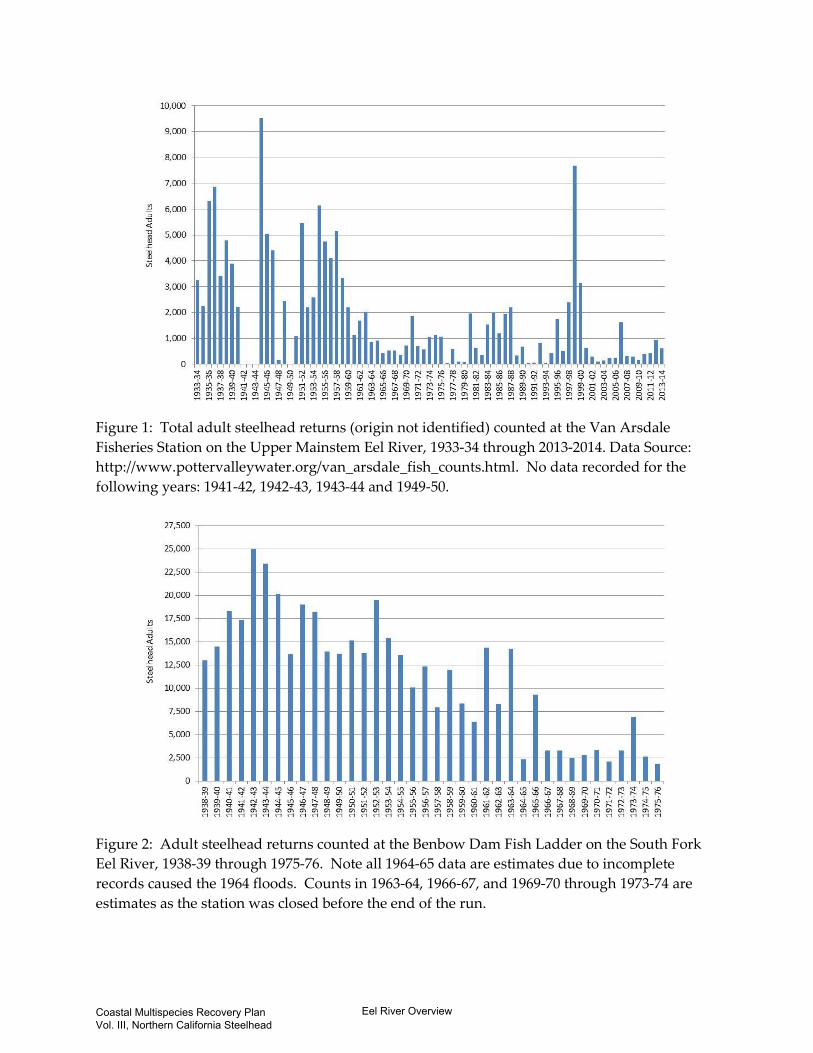
Figure 1: Total adult steelhead returns (origin not identified) counted at the Van Arsdale Fisheries Station on the Upper Mainstem Eel River, 1933-34 through 2013-2014. Data Source: http://www.pottervalleywater.org/van_arsdale_fish_counts.html. No data recorded for the following years: 1941-42, 1942-43, 1943-44 and 1949-50.
Figure 2: Adult steelhead returns counted at the Benbow Dam Fish Ladder on the South Fork Eel River, 1938-39 through 1975-76. Note all 1964-65 data are estimates due to incomplete records caused the 1964 floods. Counts in 1963-64, 1966-67, and 1969-70 through 1973-74 are estimates as the station was closed before the end of the run.
Coastal Multispecies Recovery Plan Vol. III, Northern California Steelhead
Eel River Overview
History of Land Use
The Eel River Watershed is the third largest watershed within California with a drainage area of
approximately 3,684 square miles covering four major subbasins (Van Duzen River, South Fork
Eel River, North Fork Eel River, and Middle Fork Eel River) and portions of five counties (Figure
3). Due to its size, the topography and climate within the watershed varies. Overall, the climate
follows a Mediterranean pattern with cool wet winters, followed by dry and relatively warm
summers. In summer, the coastal areas of the watershed typically experience fog while inland
areas are dry and much warmer. The watershed is located in a geologically active area and is
underlain by Franciscan Formation which is highly erodible, particularly in steep terrain
(Kubicek 1977; Yoshiyama and Moyle 2010).
Coastal Multispecies Recovery Plan Vol. III, Northern California Steelhead
Eel River Overview
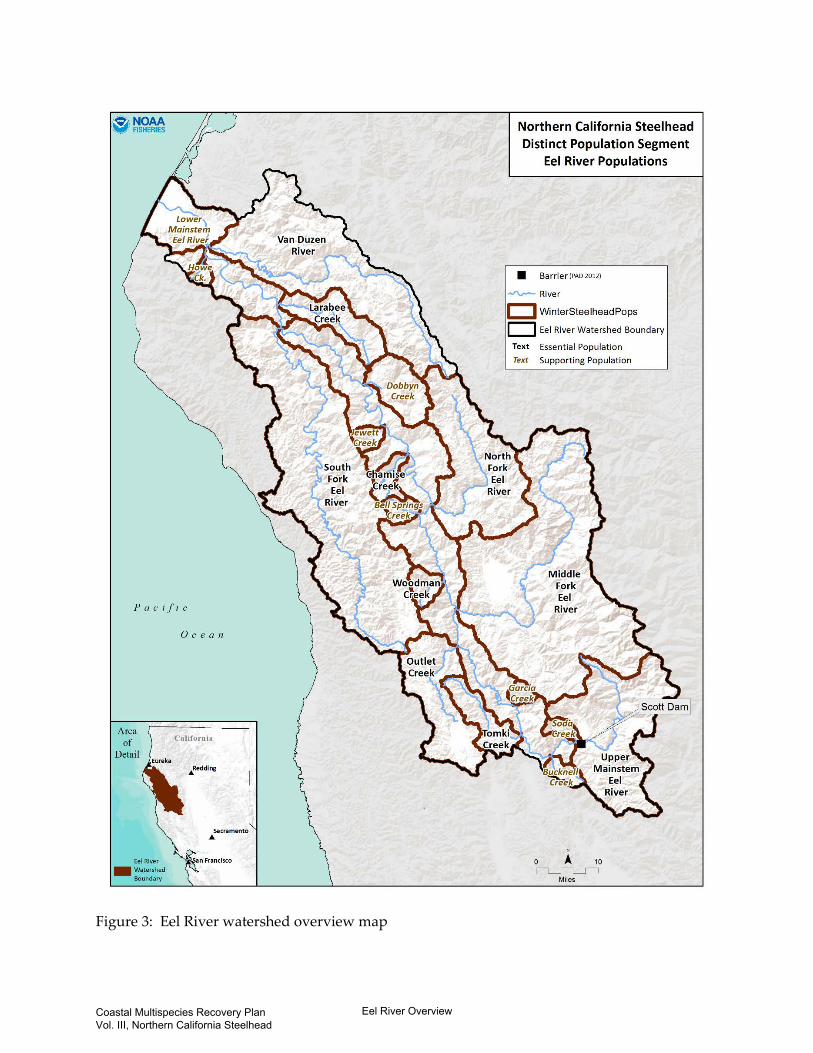
Figure 3: Eel River watershed overview map
Coastal Multispecies Recovery Plan Vol. III, Northern California Steelhead
Eel River Overview

Prior to Euro-American settlement, the Eel River Watershed was inhabited by several native
groups including the Wiyot, Sinkyone, Lassik, Nongatl, Yuki and Wailaki peoples. While these
groups utilized the natural resources of the Eel River Watershed, it is likely their collective impact
on the resources or landscape was relatively minor. Euro-American settlement and exploitation
of the watershed’s natural resources began in the second half of the 19th Century. During this
period, most of the low-elevation forested areas were logged and converted to other uses such as
dairies and agriculture. The abundant fish populations in the watershed (primarily Chinook
salmon), supported a commercial fishery including cannery operations. The canneries operated
until 1912 and the commercial fishery was closed by 1926 as salmon numbers declined despite
substantial artificial propagation (Yoshiyama and Moyle 2010).
Although logging and fishing continued through the early 20th Century, two of the more
significant anthropogenic changes to the watershed during this period were the construction of
Cape Horn (1908) and Scott (1922) dams on the Upper Mainstem Eel River (SEC 1998). Unlike
Cape Horn, Scott Dam (farther upstream) was constructed without fish passage facilities and
therefore blocks a significant amount of potential anadromous salmonid habitat. The dams and
impounded reservoirs were built to generate hydro-electric power and provide water south to
the Russian River Watershed (NMFS 2002).
Following World War II, much of the remaining virgin forest as well as substantial areas of
second-growth forest were logged at a rapid pace throughout the watershed. Logging spread to
steeper slopes and remote areas which required development of a vast network of mostly poorly
constructed roads. The removal of vegetation and road construction increased sediment erosion
on an unprecedented scale. The large floods in 1955 and 1964 exacerbated the erosion and caused
significant sedimentation within the Eel River, its tributaries, and the estuary. Deep pools that
were common in the river channels were mostly filled in and most of the riparian vegetation was
eliminated. While some areas have improved since the floods, legacy effects of the logging and
floods remains in many areas of the watershed, which contribute to the poor habitat quality
evident throughout much of the watershed today.
Coastal Multispecies Recovery Plan Vol. III, Northern California Steelhead
Eel River Overview
Throughout the 20th Century, both Chinook salmon and steelhead were propagated and released
into the Eel River. For Chinook salmon, most of the eggs and fry were harvested from out-of-
basin stocks (Sacramento and Trinity basins) (Yoshiyama and Moyle 2010). Prior to 1920, all
steelhead released in the Eel River were of native stock (SEC 1998). After 1981, all Chinook
salmon planted in the Eel River Watershed were of native origin. The impacts of the hatchery
practices on the genetic integrity and population status are unknown or poorly understood due
to insufficient information (SEC 1998; Yoshiyama and Moyle 2010).
In 1980, predatory Sacramento pikeminnow were introduced into Lake Pillsbury (CDFG 1997),
and are now found throughout the Eel River watershed. Based on recent surveys by the California
Department of Fish and Wildlife (CDFW), Sacramento pikeminnow are present in large numbers
in Lake Pillsbury, and many of the larger tributaries that drain into the lake such as the mainstem
Eel River, and much of the Rice Fork system (S. Harris, CDFW, personal communication, 2013).
Current Resources and Land Management
Approximately 67% of the Eel River Watershed is privately owned, 30% managed as federal
lands, and 3% managed as state lands. A majority of the federally managed lands are within the
Six Rivers National Forest and the Yolla Bolly-Middle Eel Wilderness Area. Approximately
60,000 acres of the watershed is managed under the State of California Department of Parks and
Recreation, much of which is within Humboldt Redwoods State Park. In 1981, portions of the
Eel River and its major tributaries (a total 398 miles) were designated under the National Wild
and Scenic River system.
Nearly 75% of the watershed is forested with Douglas fir (27%), montane hardwood (26%), and
Coast redwood (10%) being the most common forest communities. Urban areas represent less
than 1% of the watershed area with the largest developments located near the coast and extreme
headwaters. In addition to parks and other recreational areas, logging, grazing, and agriculture
are the primary land uses in the watershed.
Coastal Multispecies Recovery Plan Vol. III, Northern California Steelhead
Eel River Overview
The Eel River Estuary
The Eel River estuary was once a highly complex and extensive habitat area that played a vital
role in the health and productivity of all Eel River salmonid populations. Currently, the Eel River
estuary is severely impaired due to past diking and filling of tidal wetlands for agriculture and
flood protection. Approximately 60% of the estuary has been lost through the construction of
levees and dikes, and CDFG (2010) estimated only 10% of historic salt marsh habitat remains
today. The function of the estuary (e.g., rearing, refugia, ocean transition) for Eel River salmonids
is particularly important given the degraded habitat conditions and predation and competition
from non-native Sacramento pikeminnow in the mainstem Eel River. Juveniles and smolts suffer
from the lost opportunity for increased growth, which affects their survival at ocean entry. The
quantity and quality of estuary habitat available to salmonids in the Eel River is expected to
expand in the near future due to the Salt River Ecosystem Restoration Project and restoration
efforts on the The Wildland Conservancy’s Eel River Estuary Preserve and CDFW’s Ocean Ranch
Unit of the Eel River Wildlife Area.
Salmonid Viability and Habitat Conditions
A summary of attributes and indicator ratings for Eel River populations of NC steelhead are
presented in Table 1 and Table 2. Across the Eel River Watershed, attribute indicators frequently
rated Poor for multiple populations and life stages were:
● Estuary: Quality and Extent;
● Habitat Complexity: Large Wood and Shelter;
● Habitat Complexity: Percent Primary Pools and Pool/Riffle/Flatwater Ratios;
● Hydrology: Baseflow & Number, Condition and/or Magnitude of Diversions;
● Riparian Vegetation: Canopy Cover and Tree Diameter;
● Sediment: Gravel Quality and Distribution of Spawning Gravels;
● Sediment Transport: Road Density and Streamside Road Density;
● Viability: Density, Abundance and Spatial Structure; and
● Water Quality: Temperature and Turbidity
Coastal Multispecies Recovery Plan Vol. III, Northern California Steelhead
Eel River Overview

Across all populations in the Eel River Watershed, summer rearing juveniles are the most
impaired life stage with 85% of attribute indicators rated Poor or Fair and 45% rated as Poor alone
(Figure 3). Winter rearing juveniles are a close second with 82% of attribute indicators rated Poor
or Fair, of which 39% were rated Poor. Of the Watershed Processes, streamside road density was
identified as the most significant impact to instream and riparian habitat quality with all
populations rated Poor (Table 2). Timber harvest was also rated Poor for the Larabee Creek and
Van Duzen River populations. The extent and impact of impervious surfaces, urban
development, and agriculture are minimal as all populations were rated Fair or better with most
rated Very Good.
With the exception of the South Fork Eel River (North Coastal Diversity Stratum), all other
populations represent the entirety of the Lower Interior and North Mountain Interior Diversity
Strata, which includes the upper portions of the Mad River and Redwood Creek watersheds
(Bjorkstedt et al. 2005). The DPS and Diversity Strata results from the CAP viability analysis are
described in greater detail in the section above, NC steelhead CAP results. Population-specific
results are described below in the population profiles and rapid assessments.
Coastal Multispecies Recovery Plan Vol. III, Northern California Steelhead
Eel River Overview
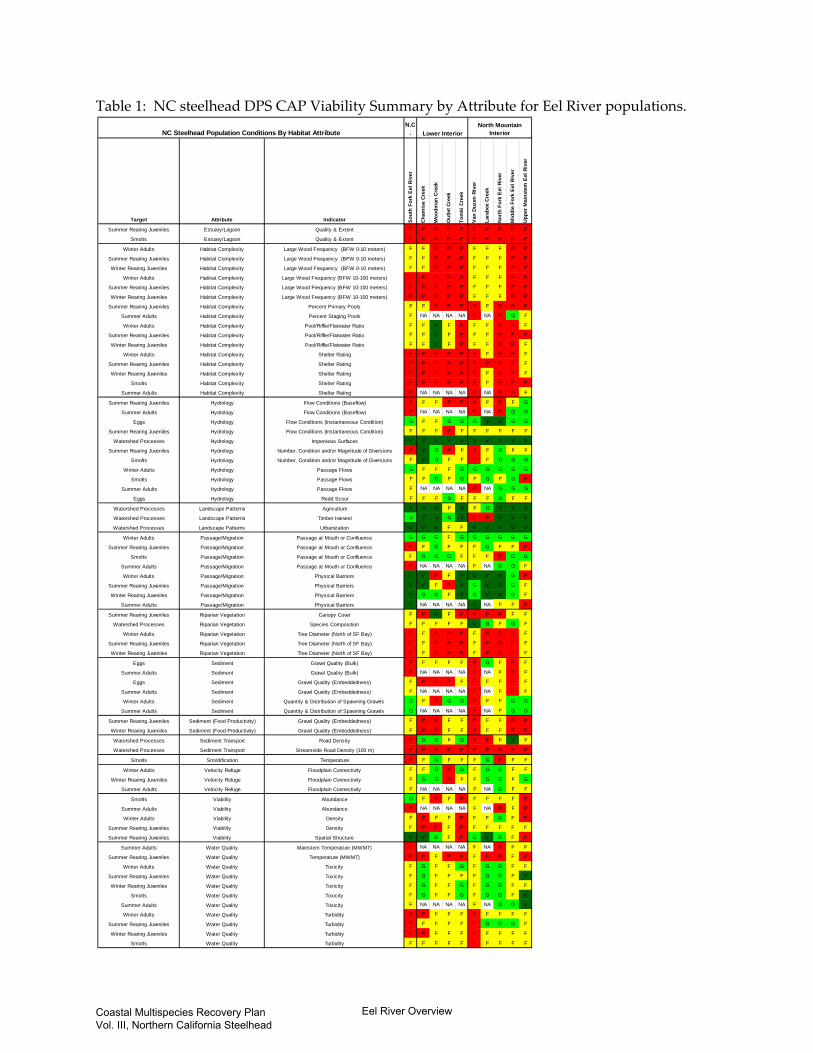
Table 1: NC steelhead DPS CAP Viability Summary by Attribute for Eel River populations.
N.C.
Target Attribute Indicator Sout
h Fo
rk E
el R
iver
Cham
ise
Cree
k
Woo
dman
Cre
ek
Out
let C
reek
Tom
ki C
reek
Van
Duze
n Ri
ver
Lara
bee
Cree
k
North
For
k Ee
l Riv
er
Mid
dle
Fork
Eel
Riv
er
Uppe
r Mai
nste
m E
el R
iver
Summer Rearing Juveniles Estuary/Lagoon Quality & Extent P P P P P P P P P P
Smolts Estuary/Lagoon Quality & Extent P P P P P P P P P P
Winter Adults Habitat Complexity Large Wood Frequency (BFW 0-10 meters) F F P P P F F F P P
Summer Rearing Juveniles Habitat Complexity Large Wood Frequency (BFW 0-10 meters) F F P P P F F F P P
Winter Rearing Juveniles Habitat Complexity Large Wood Frequency (BFW 0-10 meters) F F P P P F F F P P
Winter Adults Habitat Complexity Large Wood Frequency (BFW 10-100 meters) P P P P P F F F P P
Summer Rearing Juveniles Habitat Complexity Large Wood Frequency (BFW 10-100 meters) P P P P P F F F P P
Winter Rearing Juveniles Habitat Complexity Large Wood Frequency (BFW 10-100 meters) P P P P P F F F P P
Summer Rearing Juveniles Habitat Complexity Percent Primary Pools F F P P P P F P P P
Summer Adults Habitat Complexity Percent Staging Pools F NA NA NA NA P NA P G F
Winter Adults Habitat Complexity Pool/Riffle/Flatwater Ratio F F V F P F F P P F
Summer Rearing Juveniles Habitat Complexity Pool/Riffle/Flatwater Ratio F F V F P F F P P P
Winter Rearing Juveniles Habitat Complexity Pool/Riffle/Flatwater Ratio F F V F P F F P P F
Winter Adults Habitat Complexity Shelter Rating P P P P P P F P P F
Summer Rearing Juveniles Habitat Complexity Shelter Rating P P P P P P P P P F
Winter Rearing Juveniles Habitat Complexity Shelter Rating P P P P P P F P P F
Smolts Habitat Complexity Shelter Rating P P P P P P F P P P
Summer Adults Habitat Complexity Shelter Rating P NA NA NA NA P NA P P F
Summer Rearing Juveniles Hydrology Flow Conditions (Baseflow) P F F P P P F P F G
Summer Adults Hydrology Flow Conditions (Baseflow) P NA NA NA NA P NA P G G
Eggs Hydrology Flow Conditions (Instantaneous Condition) G F F G G G V V G G
Summer Rearing Juveniles Hydrology Flow Conditions (Instantaneous Condition) F F F P F F F F F F
Watershed Processes Hydrology Impervious Surfaces V V V V V V V V V V
Summer Rearing Juveniles Hydrology Number, Condition and/or Magnitude of Diversions P V G P F P F G F F
Smolts Hydrology Number, Condition and/or Magnitude of Diversions F V G F F P F G G G
Winter Adults Hydrology Passage Flows G F F F G G G G G G
Smolts Hydrology Passage Flows F F G F G F G F G P
Summer Adults Hydrology Passage Flows F NA NA NA NA P NA G G G
Eggs Hydrology Redd Scour F F F G F F F G F F
Watershed Processes Landscape Patterns Agriculture V V V F V F G V V V
Watershed Processes Landscape Patterns Timber Harvest G V V G V P P V V V
Watershed Processes Landscape Patterns Urbanization V V V F F V V V V V
Winter Adults Passage/Migration Passage at Mouth or Confluence G G G F G G G G G G
Summer Rearing Juveniles Passage/Migration Passage at Mouth or Confluence P F G F F F G F F P
Smolts Passage/Migration Passage at Mouth or Confluence F G G G F F F P G G
Summer Adults Passage/Migration Passage at Mouth or Confluence P NA NA NA NA F NA G G F
Winter Adults Passage/Migration Physical Barriers V V P F V V V V G P
Summer Rearing Juveniles Passage/Migration Physical Barriers V V F P V G V V G F
Winter Rearing Juveniles Passage/Migration Physical Barriers V G G F V G V V G F
Summer Adults Passage/Migration Physical Barriers V NA NA NA NA V NA F F P
Summer Rearing Juveniles Riparian Vegetation Canopy Cover F P V F P P P P F F
Watershed Processes Riparian Vegetation Species Composition F F F F F V G F G F
Winter Adults Riparian Vegetation Tree Diameter (North of SF Bay) P F P P P F P P P F
Summer Rearing Juveniles Riparian Vegetation Tree Diameter (North of SF Bay) P F P P P F P P P F
Winter Rearing Juveniles Riparian Vegetation Tree Diameter (North of SF Bay) P F P P P F P P P F
Eggs Sediment Gravel Quality (Bulk) P F F F F P G F P F
Summer Adults Sediment Gravel Quality (Bulk) P NA NA NA NA P NA F P F
Eggs Sediment Gravel Quality (Embeddedness) F P P P F P F F P F
Summer Adults Sediment Gravel Quality (Embeddedness) F NA NA NA NA P NA F P F
Winter Adults Sediment Quantity & Distribution of Spawning Gravels G F P G G P F F G G
Summer Adults Sediment Quantity & Distribution of Spawning Gravels G NA NA NA NA P NA F G G
Summer Rearing Juveniles Sediment (Food Productivity) Gravel Quality (Embeddedness) F P P F F P F F P P
Winter Rearing Juveniles Sediment (Food Productivity) Gravel Quality (Embeddedness) F P P F F P F F P P
Watershed Processes Sediment Transport Road Density P G G F G P P F V F
Watershed Processes Sediment Transport Streamside Road Density (100 m) P P P P P P P P P P
Smolts Smoltification Temperature P F G F F F G P F F
Winter Adults Velocity Refuge Floodplain Connectivity F F G P G F G G F F
Winter Rearing Juveniles Velocity Refuge Floodplain Connectivity F G G P F F G G F G
Summer Adults Velocity Refuge Floodplain Connectivity F NA NA NA NA F NA G F F
Smolts Viability Abundance G F P F P F F F F P
Summer Adults Viability Abundance P NA NA NA NA F NA P F P
Winter Adults Viability Density F P F F P F F G F P
Summer Rearing Juveniles Viability Density F P P F P F F F F F
Summer Rearing Juveniles Viability Spatial Structure V V G F P G V G F P
Summer Adults Water Quality Mainstem Temperature (MWMT) P NA NA NA NA F NA P F F
Summer Rearing Juveniles Water Quality Temperature (MWMT) P P F P P F P P F P
Winter Adults Water Quality Toxicity F G F F G F G G F F
Summer Rearing Juveniles Water Quality Toxicity F G F F F F G G F V
Winter Rearing Juveniles Water Quality Toxicity F G F F G F G G F F
Smolts Water Quality Toxicity F G F F G F G G F V
Summer Adults Water Quality Toxicity F NA NA NA NA F NA G G V
Winter Adults Water Quality Turbidity P P F F F P F F F F
Summer Rearing Juveniles Water Quality Turbidity P F F F F P G G G F
Winter Rearing Juveniles Water Quality Turbidity P P F F F P F F F F
Smolts Water Quality Turbidity F F F F F P F F F F
NC Steelhead Population Conditions By Habitat Attribute Lower InteriorNorth Mountain
Interior
Coastal Multispecies Recovery Plan Vol. III, Northern California Steelhead
Eel River Overview
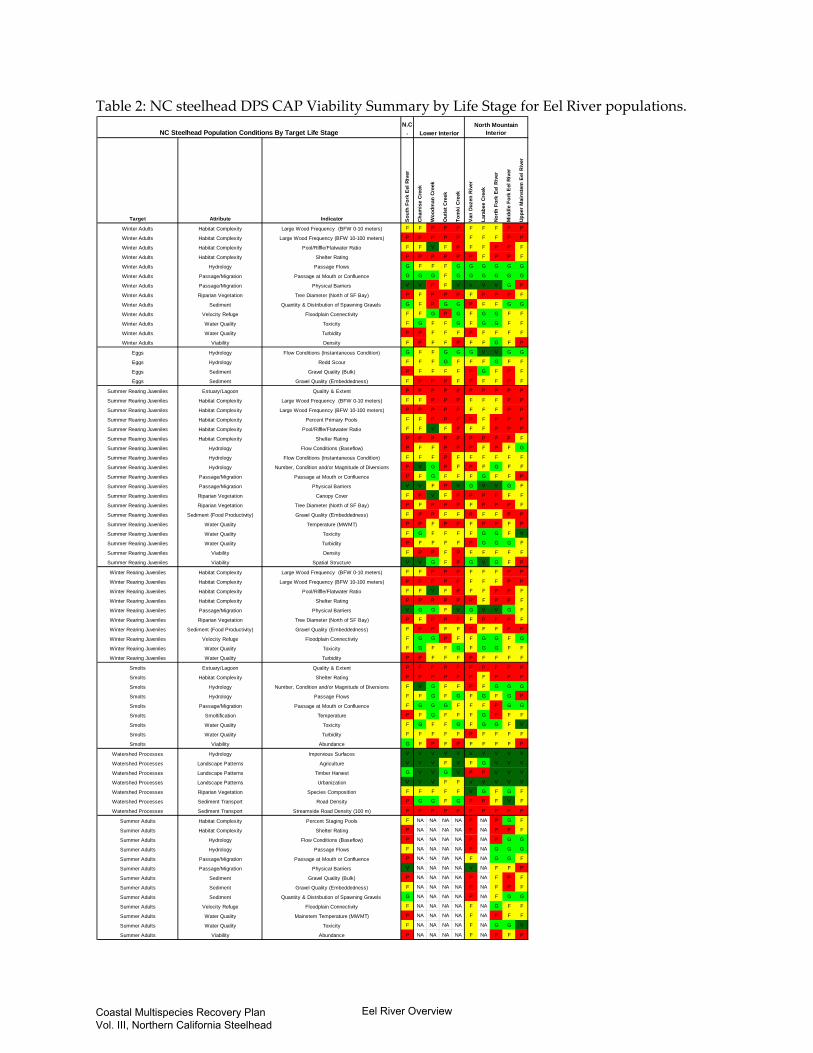
Table 2: NC steelhead DPS CAP Viability Summary by Life Stage for Eel River populations.
N.C.
Target Attribute Indicator Sout
h Fo
rk E
el R
iver
Cham
ise
Cree
k
Woo
dman
Cre
ek
Out
let C
reek
Tom
ki C
reek
Van
Duze
n Ri
ver
Lara
bee
Cree
k
North
For
k Ee
l Riv
er
Mid
dle
Fork
Eel
Riv
er
Uppe
r Mai
nste
m E
el R
iver
Winter Adults Habitat Complexity Large Wood Frequency (BFW 0-10 meters) F F P P P F F F P P
Winter Adults Habitat Complexity Large Wood Frequency (BFW 10-100 meters) P P P P P F F F P P
Winter Adults Habitat Complexity Pool/Riffle/Flatwater Ratio F F V F P F F P P F
Winter Adults Habitat Complexity Shelter Rating P P P P P P F P P F
Winter Adults Hydrology Passage Flows G F F F G G G G G G
Winter Adults Passage/Migration Passage at Mouth or Confluence G G G F G G G G G G
Winter Adults Passage/Migration Physical Barriers V V P F V V V V G P
Winter Adults Riparian Vegetation Tree Diameter (North of SF Bay) P F P P P F P P P F
Winter Adults Sediment Quantity & Distribution of Spawning Gravels G F P G G P F F G G
Winter Adults Velocity Refuge Floodplain Connectivity F F G P G F G G F F
Winter Adults Water Quality Toxicity F G F F G F G G F F
Winter Adults Water Quality Turbidity P P F F F P F F F F
Winter Adults Viability Density F P F F P F F G F P
Eggs Hydrology Flow Conditions (Instantaneous Condition) G F F G G G V V G G
Eggs Hydrology Redd Scour F F F G F F F G F F
Eggs Sediment Gravel Quality (Bulk) P F F F F P G F P F
Eggs Sediment Gravel Quality (Embeddedness) F P P P F P F F P F
Summer Rearing Juveniles Estuary/Lagoon Quality & Extent P P P P P P P P P P
Summer Rearing Juveniles Habitat Complexity Large Wood Frequency (BFW 0-10 meters) F F P P P F F F P P
Summer Rearing Juveniles Habitat Complexity Large Wood Frequency (BFW 10-100 meters) P P P P P F F F P P
Summer Rearing Juveniles Habitat Complexity Percent Primary Pools F F P P P P F P P P
Summer Rearing Juveniles Habitat Complexity Pool/Riffle/Flatwater Ratio F F V F P F F P P P
Summer Rearing Juveniles Habitat Complexity Shelter Rating P P P P P P P P P F
Summer Rearing Juveniles Hydrology Flow Conditions (Baseflow) P F F P P P F P F G
Summer Rearing Juveniles Hydrology Flow Conditions (Instantaneous Condition) F F F P F F F F F F
Summer Rearing Juveniles Hydrology Number, Condition and/or Magnitude of Diversions P V G P F P F G F F
Summer Rearing Juveniles Passage/Migration Passage at Mouth or Confluence P F G F F F G F F P
Summer Rearing Juveniles Passage/Migration Physical Barriers V V F P V G V V G F
Summer Rearing Juveniles Riparian Vegetation Canopy Cover F P V F P P P P F F
Summer Rearing Juveniles Riparian Vegetation Tree Diameter (North of SF Bay) P F P P P F P P P F
Summer Rearing Juveniles Sediment (Food Productivity) Gravel Quality (Embeddedness) F P P F F P F F P P
Summer Rearing Juveniles Water Quality Temperature (MWMT) P P F P P F P P F P
Summer Rearing Juveniles Water Quality Toxicity F G F F F F G G F V
Summer Rearing Juveniles Water Quality Turbidity P F F F F P G G G F
Summer Rearing Juveniles Viability Density F P P F P F F F F F
Summer Rearing Juveniles Viability Spatial Structure V V G F P G V G F P
Winter Rearing Juveniles Habitat Complexity Large Wood Frequency (BFW 0-10 meters) F F P P P F F F P P
Winter Rearing Juveniles Habitat Complexity Large Wood Frequency (BFW 10-100 meters) P P P P P F F F P P
Winter Rearing Juveniles Habitat Complexity Pool/Riffle/Flatwater Ratio F F V F P F F P P F
Winter Rearing Juveniles Habitat Complexity Shelter Rating P P P P P P F P P F
Winter Rearing Juveniles Passage/Migration Physical Barriers V G G F V G V V G F
Winter Rearing Juveniles Riparian Vegetation Tree Diameter (North of SF Bay) P F P P P F P P P F
Winter Rearing Juveniles Sediment (Food Productivity) Gravel Quality (Embeddedness) F P P F F P F F P P
Winter Rearing Juveniles Velocity Refuge Floodplain Connectivity F G G P F F G G F G
Winter Rearing Juveniles Water Quality Toxicity F G F F G F G G F F
Winter Rearing Juveniles Water Quality Turbidity P P F F F P F F F F
Smolts Estuary/Lagoon Quality & Extent P P P P P P P P P P
Smolts Habitat Complexity Shelter Rating P P P P P P F P P P
Smolts Hydrology Number, Condition and/or Magnitude of Diversions F V G F F P F G G G
Smolts Hydrology Passage Flows F F G F G F G F G P
Smolts Passage/Migration Passage at Mouth or Confluence F G G G F F F P G G
Smolts Smoltification Temperature P F G F F F G P F F
Smolts Water Quality Toxicity F G F F G F G G F V
Smolts Water Quality Turbidity F F F F F P F F F F
Smolts Viability Abundance G F P F P F F F F P
Watershed Processes Hydrology Impervious Surfaces V V V V V V V V V V
Watershed Processes Landscape Patterns Agriculture V V V F V F G V V V
Watershed Processes Landscape Patterns Timber Harvest G V V G V P P V V V
Watershed Processes Landscape Patterns Urbanization V V V F F V V V V V
Watershed Processes Riparian Vegetation Species Composition F F F F F V G F G F
Watershed Processes Sediment Transport Road Density P G G F G P P F V F
Watershed Processes Sediment Transport Streamside Road Density (100 m) P P P P P P P P P P
Summer Adults Habitat Complexity Percent Staging Pools F NA NA NA NA P NA P G F
Summer Adults Habitat Complexity Shelter Rating P NA NA NA NA P NA P P F
Summer Adults Hydrology Flow Conditions (Baseflow) P NA NA NA NA P NA P G G
Summer Adults Hydrology Passage Flows F NA NA NA NA P NA G G G
Summer Adults Passage/Migration Passage at Mouth or Confluence P NA NA NA NA F NA G G F
Summer Adults Passage/Migration Physical Barriers V NA NA NA NA V NA F F P
Summer Adults Sediment Gravel Quality (Bulk) P NA NA NA NA P NA F P F
Summer Adults Sediment Gravel Quality (Embeddedness) F NA NA NA NA P NA F P F
Summer Adults Sediment Quantity & Distribution of Spawning Gravels G NA NA NA NA P NA F G G
Summer Adults Velocity Refuge Floodplain Connectivity F NA NA NA NA F NA G F F
Summer Adults Water Quality Mainstem Temperature (MWMT) P NA NA NA NA F NA P F F
Summer Adults Water Quality Toxicity F NA NA NA NA F NA G G V
Summer Adults Viability Abundance P NA NA NA NA F NA P F P
NC Steelhead Population Conditions By Target Life Stage Lower InteriorNorth Mountain
Interior
Coastal Multispecies Recovery Plan Vol. III, Northern California Steelhead
Eel River Overview
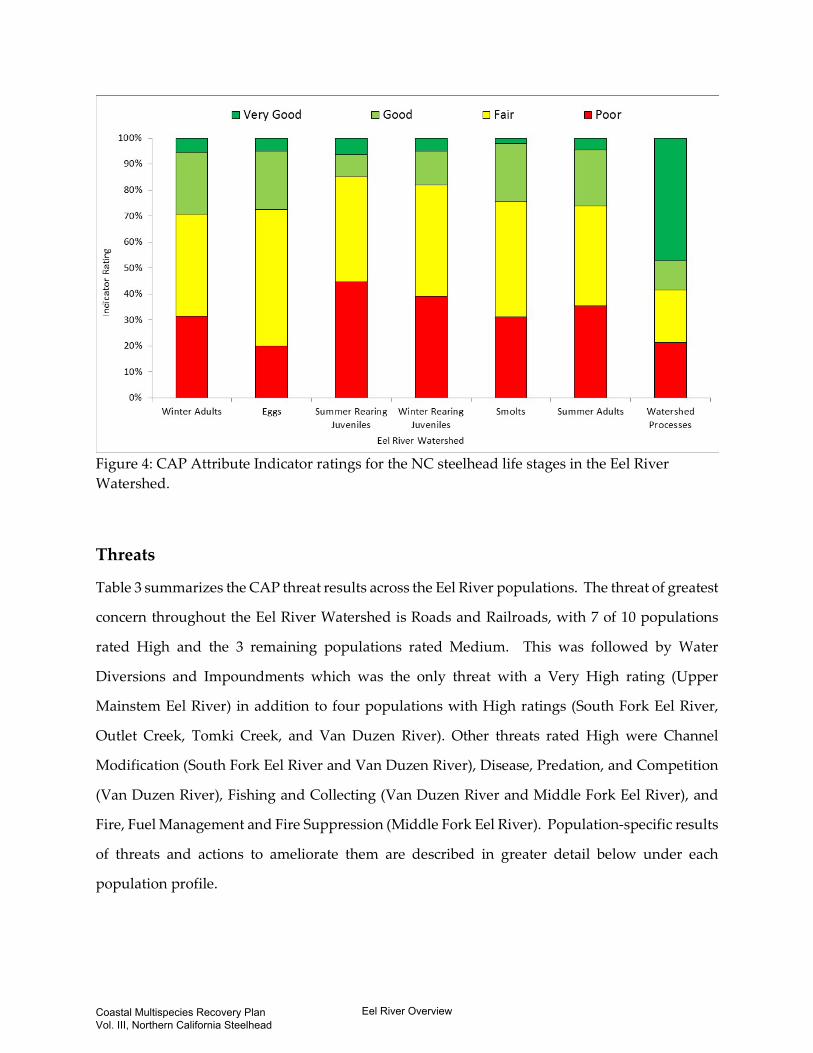
Figure 4: CAP Attribute Indicator ratings for the NC steelhead life stages in the Eel River Watershed.
Threats
Table 3 summarizes the CAP threat results across the Eel River populations. The threat of greatest
concern throughout the Eel River Watershed is Roads and Railroads, with 7 of 10 populations
rated High and the 3 remaining populations rated Medium. This was followed by Water
Diversions and Impoundments which was the only threat with a Very High rating (Upper
Mainstem Eel River) in addition to four populations with High ratings (South Fork Eel River,
Outlet Creek, Tomki Creek, and Van Duzen River). Other threats rated High were Channel
Modification (South Fork Eel River and Van Duzen River), Disease, Predation, and Competition
(Van Duzen River), Fishing and Collecting (Van Duzen River and Middle Fork Eel River), and
Fire, Fuel Management and Fire Suppression (Middle Fork Eel River). Population-specific results
of threats and actions to ameliorate them are described in greater detail below under each
population profile.
Coastal Multispecies Recovery Plan Vol. III, Northern California Steelhead
Eel River Overview
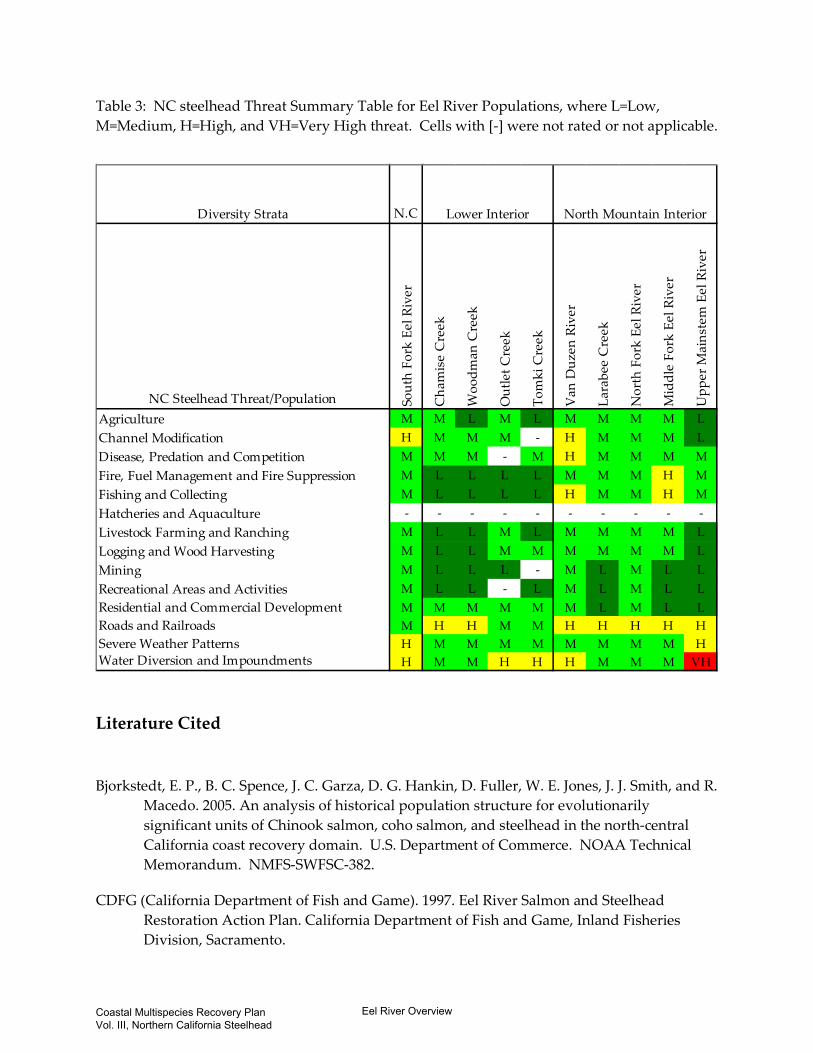
Table 3: NC steelhead Threat Summary Table for Eel River Populations, where L=Low, M=Medium, H=High, and VH=Very High threat. Cells with [-] were not rated or not applicable.
Literature Cited
Bjorkstedt, E. P., B. C. Spence, J. C. Garza, D. G. Hankin, D. Fuller, W. E. Jones, J. J. Smith, and R. Macedo. 2005. An analysis of historical population structure for evolutionarily significant units of Chinook salmon, coho salmon, and steelhead in the north-central California coast recovery domain. U.S. Department of Commerce. NOAA Technical Memorandum. NMFS-SWFSC-382.
CDFG (California Department of Fish and Game). 1997. Eel River Salmon and Steelhead Restoration Action Plan. California Department of Fish and Game, Inland Fisheries Division, Sacramento.
Diversity Strata N.C
NC Steelhead Threat/Population Sout
h Fo
rk E
el R
iver
Cha
mis
e C
reek
Woo
dman
Cre
ek
Out
let C
reek
Tom
ki C
reek
Van
Duz
en R
iver
Lara
bee
Cre
ek
Nor
th F
ork
Eel R
iver
Mid
dle
Fork
Eel
Riv
er
Upp
er M
ains
tem
Eel
Riv
er
Agriculture M M L M L M M M M LChannel Modification H M M M - H M M M LDisease, Predation and Competition M M M - M H M M M MFire, Fuel Management and Fire Suppression M L L L L M M M H MFishing and Collecting M L L L L H M M H MHatcheries and Aquaculture - - - - - - - - - -Livestock Farming and Ranching M L L M L M M M M LLogging and Wood Harvesting M L L M M M M M M LMining M L L L - M L M L LRecreational Areas and Activities M L L - L M L M L LResidential and Commercial Development M M M M M M L M L LRoads and Railroads M H H M M H H H H HSevere Weather Patterns H M M M M M M M M HWater Diversion and Impoundments H M M H H H M M M VH
Lower Interior North Mountain Interior
Coastal Multispecies Recovery Plan Vol. III, Northern California Steelhead
Eel River Overview
CDFG (California Department of Fish and Game). 2010. Lower Eel River Watershed Assessment. Coastal Watershed Planning and Assessment Program. California Department of Fish and Game. Inland Fisheries Division.
Kubicek, P. F. 1977. Summer water temperature conditions in the Eel River System; with reference to trout and salmon. Master's Thesis. Humboldt State University, Arcata, CA.
Moyle, P. B., J.A. Israel, and S.E. Purdy. 2008. Salmon, steelhead, and trout in California; status of an emblematic fauna. Report commissioned by California Trout. University of California Davis Center for Watershed Sciences, Davis, CA.
NMFS (National Marine Fisheries Service). 2002. Biological Opinion for the Proposed license amendment for the Potter Valley Project (Federal Energy Regulatory Commission Project Number 77-110). National Marine Fisheries Service, Santa Rosa, CA.
Shapovalov, L. 1939. Recommendations for management of the fisheries of the Eel River drainage basin, California. January 4, 1939. In: Report of the 1938 Eel River survey, conducted by the California Division of Fish and Game.
Spence, B. C., E. P. Bjorkstedt, S. Paddock, and L. Nanus. 2012. Updates to biological viability criteria for threatened steelhead populations in the North-Central California Coast Recovery Domain. National Marine Fisheries Service, Southwest Fisheries Science Center, Fisheries Ecology Division, Santa Cruz, CA.
SEC (Steiner Environmental Consulting). 1998. Potter Valley project monitoring program (FERC Project Number 77-110, Article 39): effects of operations on upper Eel River anadromous salmonids: March 1998 final report. Prepared for the Pacific Gas and Electric company San Ramon, CA.
Williams, T. H., S. T. Lindley, B. C. Spence, and D. A. Boughton. 2011. Status Review Update For Pacific Salmon and Steelhead Listed Under the Endangered Species Act: Southwest. NOAA's National Marine Fisheries Service, Southwest Fisheries Science Center, Santa Cruz, CA.
Yoshiyama, R. M., and P. B. Moyle. 2010. Historical review of Eel River anadromous salmonids, with emphasis on Chinook salmon, coho salmon and steelhead. University of California Davis, Center for Watershed Sciences working paper. A Report Commissioned by California Trout, 2010. Center for Watershed Sciences University of California, Davis, CA.
Coastal Multispecies Recovery Plan Vol. III, Northern California Steelhead
Eel River Overview