eeg neurofeedback as a tool to modulate creativity in music performance...
TRANSCRIPT
EEG Neurofeedback as a tool to modulate creativity inmusic performance.
Joseph Leach
Submitted in total fulfilment of the requirementsof the degree of Doctor of Philosophy
April 7, 2014
Department of Psychology

Declaration
I declare that the work presented in this thesis is my own, and that no portion of thiswork has been submitted in support of an application for another degree of this orany other university, or institute of learning.
2
Abstract
For millennia, anecdotal reports have described how creative insights have been expe-rienced during the transition from wake to sleep (hypnagogia). In the 1970’s, it wasreported that the fleeting moments in which hypnagogia and creativity interact areaccompanied by characteristic neuroelectric activity, which is disclosed by a specificfeature of the Electroencephalogram (): the increase of spectral power in the thetarange (5–8 Hz) in relation to alpha (8–11 Hz). Consequently, prior research, andexperiments documented in this thesis, have attempted to modulate the relationshipbetween hypnagogia and creativity using biofeedback.
e current thesis charts the historical development of neurofeedback, andevaluates the application of the two neurofeedback methods used most widely by clini-cians: the alpha-theta and protocols. Both therapeutic and ‘optimal performance’contexts are considered; the latter of which includes the study of creative behaviourin musicians, which in turn constitutes the area of experimental observation studiedhere.
e first of three experiments found that prior findings relating neurofeedback toimprovement in instrumental solo performance were replicable with the caveat thatimproving participants started from low baseline scores, and also further isolated theeffects of neurofeedback on creativity by suggesting differences in the performance ofspontaneous music creation following alpha-theta neurofeedback compared to con-trols. e second argued that short-term effects of neurofeedback are different fromthe longer-term outcomes, finding that an alpha-theta intervention impairs musicperformance in the short-term. e final experiment found that inhibitory activity inthe frontal and parietal lobes, distinguishes piano improvisation from the renditionof a score.
Overall, this thesis makes the case that creativity, hypnagogia and music improvi-sation share a common neurophyisology, and that this may be open to regulation bythe application of neurofeedback training that regulates alpha and theta .
3
Acknowledgements
I feel especially indebted to the unnamed participants who volunteered for the studiesand gave many hours of their time.
e musical judges also contributed many hours of their time to this research,selecting and evaluating tasks: Linda Hirst, Patricia Holmes and Sophie Grimmer.Together with the participants, they provided the all important data.
I would like to thank my supervisor John Gruzelier for developing me as a re-searcher, and for providing me with a glimpse into the exciting field of applied neu-roscience. I’d also like to thank Graham Welch and Adrian Burgess for helping me toimprove an earlier version of this dissertation, and Philomena Kelly and my daughters,who supported me throughout.
I worked closely with Tony Steffert, Felicia Cheng, Kate Bulpin, Shama Rahmanand Alexander Rass, who collaborated with me on some of the experiments in thisthesis.
Several of my colleagues encouraged me with their enthusiasm for neurofeedbackresearch: Tomas Ros, Max Chen, Boris Kleber and Aisha Cortoos.
ere are several researchers I was pleased to meet and correspond with during thecourse of my study: Arne Dietrich for his challenging and beautiful writing on creativ-ity and consciousness, Tom Perchard for sharing his understanding of the many typesof improvisation, and Sam ompson and Evangelos Himonides for their guidanceon music evaluation.
anks to the staff at Goldsmiths who helped to keep my studies afloat duringdifficult times: Pam Heaton, Lesley Hewings, Jo Mackarell, Elaine ompson, AnneCraven, Lauren Stewart and Frank Bond.
Finally, thanks to , Goldsmiths and Philomena Kelly for supporting thisresearch.
4
Contents
1 Introduction 21
1.1 Summary . . . . . . . . . . . . . . . . . . . . . . . . . . . . . . . 211.2 Electrophysiology in the brain, and neurofeedback applications . . . 22
1.2.1 e physiological origins of oscillations . . . . . . . . . 221.2.1.1 e origins of distinct frequencies . . . . . . 22
e frequencies . . . . . . . . . . . . . . . . . . . 231.2.1.2 Sleep and the thalamocortical circuit . . . . . 231.2.1.3 Non-sleep phenomena . . . . . . . . . . . . 25
eta . . . . . . . . . . . . . . . . . . . . . . 25Alpha . . . . . . . . . . . . . . . . . . . . . . 25Beta and gamma . . . . . . . . . . . . . . . . . 26
1.3 A Brief History of Neurofeedback . . . . . . . . . . . . . . . . . . 261.3.1 e foundation of neurofeedback methods . . . . . . . . . 27
1.3.1.1 Early studies . . . . . . . . . . . . . . . . . 271.3.1.2 Slow cortical potentials and fMRI studies . . . . . 28
Slow cortical potentials . . . . . . . . . . . . . . . . 28fMRI . . . . . . . . . . . . . . . . . . . . . . . . . 29
1.3.1.3 e continued importance of protocols . . . 30Modern . . . . . . . . . . . . . . . . . . . 31
Fast-wave . . . . . . . . . . . . . . . . . . . . 31Slow-wave . . . . . . . . . . . . . . . . . . . 31
1.3.2 e history of slow-wave protocols . . . . . . . . . . . . . . 321.3.2.1 Alpha in anxiety . . . . . . . . . . . . . . . 32
Joe Kamiya . . . . . . . . . . . . . . . . . . . . . . 32Martin Orne . . . . . . . . . . . . . . . . . . . . . 33
1.3.2.2 Alpha-eta and alcohol recovery . . . . . . 34Treating alpha deficiency and using theta therapeuti-
cally . . . . . . . . . . . . . . . . . . . 34e Peniston protocol . . . . . . . . . . . . . . . . 34
1.3.3 e history of fast-wave protocols . . . . . . . . . . . . . . 36
5
CONTENTS
1.3.3.1 in epilepsy . . . . . . . . . . . . . . . . 36Barry Sterman . . . . . . . . . . . . . . . . . . . . 36
1.3.3.2 /theta in adhd . . . . . . . . . . . . . . 38Joel Lubar . . . . . . . . . . . . . . . . . . . . . . 38
1.4 Optimal Performance Neurofeedback . . . . . . . . . . . . . . . . 381.4.1 e background to optimal performance applications of 391.4.2 Problematising optimal performance . . . . . . . . . . . . . 39
1.4.2.1 e Yerkes-Dodson law and performance anxiety . 391.4.2.2 Stage fright . . . . . . . . . . . . . . . . . . . . 40
reat and creative behaviour . . . . . . . . . . . . 41reat and motor performance . . . . . . . . . . . . 41
1.4.2.3 Novice performance . . . . . . . . . . . . . . . . 421.4.2.4 Motor creativity . . . . . . . . . . . . . . . . . . 42
1.4.3 Review of optimal performance applications . . . . . . 431.4.3.1 Comparing neurofeedback studies . . . . . . . . 431.4.3.2 Slow-wave neurofeedback . . . . . . . . . . . . . 43
e criticism of clinical alpha-theta training . . . . . 43A renewed emphasis on alpha-theta and creatvity . . 43Alpha-theta literature . . . . . . . . . . . . . . . . 44
1.4.3.3 Fast-wave neurofeedback . . . . . . . . . . . . . 58Motor inhibition as a safeguard against performance
anxiety . . . . . . . . . . . . . . . . . 58Fast-wave literature . . . . . . . . . . . . . . . . . 58
1.4.3.4 Summary of optimal performance studies . . . . . 721.5 Creativity, Hypnagogia and Music performance . . . . . . . . . . . 72
1.5.1 Problematising creativity . . . . . . . . . . . . . . . . . . . 721.5.1.1 Psychometric concepts . . . . . . . . . . . . . . 73
Joy Paul Guilford . . . . . . . . . . . . . . . . . . 73e alternate uses task . . . . . . . . . . . . . 73
Sarnoff A. Mednick . . . . . . . . . . . . . . . . . 74e Remote associates test . . . . . . . . . . . 74
Continued use of psychometric thinking tests . . . . 751.5.1.2 Social and evolutionary concepts of creativity . . . 76
6
CONTENTS
Teresa Amabile . . . . . . . . . . . . . . . . . . . . 76e ‘Criterion problem’ in creativity research . . 77e ‘Consensual assessment technique’ . . . . . 77
Dean Keith Simonton . . . . . . . . . . . . . . . . 77e evolutionary basis of creativity . . . . . . . 78e ‘Equal odds rule’ . . . . . . . . . . . . . . 78
e return of the behavioural paradigm . . . . . . . 791.5.1.3 e cognitive neuroscience of creative behaviour . 79
Existing psychometric measures of creativity appearuntractable in the brain . . . . . . . . . 79
Spontaneous processing of emotional content as a tractablecreative state? . . . . . . . . . . . . . . 80
1.5.2 Hypnagogic Creativity . . . . . . . . . . . . . . . . . . . . 811.5.2.1 Historical accounts of hypnagogic creativity . . . . 81
Arthur Koestler . . . . . . . . . . . . . . . . . . . 81Andreas Mavromatis . . . . . . . . . . . . . . . . . 82
1.5.2.2 Alpha-theta neurofeedback and hypnagogia . . . . 861.5.3 Musical creativity in performance . . . . . . . . . . . . . . 86
1.5.3.1 Improvisation as creative process . . . . . . . . . 861.5.3.2 Improvisation as creative product . . . . . . . . . 871.5.3.3 Comparing music rendition and improvisation . . 871.5.3.4 Hypnagogia, alpha-theta, and improvisation . . . 89
1.6 Summarising the background context . . . . . . . . . . . . . . . . 89
2 Aims 91
2.1 Research aims . . . . . . . . . . . . . . . . . . . . . . . . . . . . 912.1.1 Primary aims . . . . . . . . . . . . . . . . . . . . . . . . . 91
Exploring creativity by attempting to quantify andmodulate it . . . . . . . . . . . . . . . 91
1. Define creativity in an experimentally tractableway . . . . . . . . . . . . . . . 91
2. Regulate creativity via hypnagogia . . . . . . 913. Disclose creativity through improvisation . . 92
7
CONTENTS
2.1.2 Secondary aims . . . . . . . . . . . . . . . . . . . . . . . 92Optimise novice performance . . . . . . . . . . . . 92Replicate and re-focus Egner and Gruzelier (2003) . 92
2.2 Research questions . . . . . . . . . . . . . . . . . . . . . . . . . . 922.2.1 Converting aims to questions . . . . . . . . . . . . . . . . 92
2.2.1.1 List of research questions . . . . . . . . . . . . . 92. C . . . . . . . . . . . . . . . . . . . . 92. . . . . . . . . . . . . . . . . . . . 93. N . . . . . . . . . . . . . . 93. E . . . . . . . . . . . . . . . . . 93. H . . . . . . 93. I . . . . . . . . . . . 93. I E G () . . . 93
2.3 Research method . . . . . . . . . . . . . . . . . . . . . . . . . . . 932.3.1 E — Optimising music performance with neu-
rofeedback, a constructive replication . . . . . . . . . . . . 942.3.2 E — Interpreting the transient effects of neuro-
feedback on music performance . . . . . . . . . . . . . . . 952.3.3 E — Neuroelectric measures of music improvi-
sation and rendition, and the after-effects of transient diurnalsleep on motor performance and cognition . . . . . . . . . 95
2.4 Commonalities, differences, and links between the studies . . . . . . 96
3 Experiment One 98
3.1 Introduction . . . . . . . . . . . . . . . . . . . . . . . . . . . . . 983.2 Research questions . . . . . . . . . . . . . . . . . . . . . . . . . . 101
3.2.0.1 List of research questions . . . . . . . . . . . . . 102. C . . . . . . . . . . . . . . . . . . . . 102. . . . . . . . . . . . . . . . . . . . 102. N . . . . . . . . . . . . . . 102. E . . . . . . . . . . . . . . . . . 102. I E G () . . . 102
3.2.1 . C . . . . . . . . . . . . . . . . . . . . . . . . 102
8
CONTENTS
3.2.2 . . . . . . . . . . . . . . . . . . . . . . . . 1023.2.3 . N . . . . . . . . . . . . . . . . . . 1033.2.4 . E . . . . . . . . . . . . . . . . . . . . . 1033.2.5 . I E G () . . . . . . . 103
3.3 Method . . . . . . . . . . . . . . . . . . . . . . . . . . . . . . . 1043.3.1 Participants . . . . . . . . . . . . . . . . . . . . . . . . . 104
3.3.1.1 Power . . . . . . . . . . . . . . . . . . . . . . . 1053.3.2 Design . . . . . . . . . . . . . . . . . . . . . . . . . . . . 1063.3.3 Neurofeedback Procedure . . . . . . . . . . . . . . . . . . 1063.3.4 Neurofeedback Training . . . . . . . . . . . . . . . . . . . 107
3.3.4.1 Alpha-eta Neurofeedback Training . . . . . . . 1083.3.4.2 SMR Neurofeedback Training . . . . . . . . . . 109
3.3.5 Music Performance . . . . . . . . . . . . . . . . . . . . . 1103.3.5.1 Task One, Folk Singing . . . . . . . . . . . . . . 1113.3.5.2 Task Two, Stripsody . . . . . . . . . . . . . . . . 1113.3.5.3 Task ree, Instrumental Performance . . . . . . 1123.3.5.4 Instrumental Improvisation . . . . . . . . . . . . 1133.3.5.5 Contributions . . . . . . . . . . . . . . . . . . . 113
3.3.6 Statistical Analysis . . . . . . . . . . . . . . . . . . . . . . 1133.3.6.1 Neurofeedback training . . . . . . . . . . . . . . 1143.3.6.2 Music Performance . . . . . . . . . . . . . . . . 114
Summary of measures . . . . . . . . . . . . . . . . 114Inter Rater Agreement . . . . . . . . . . . . . . . . 118Differences pre-intervention . . . . . . . . . . . . . 118Differences post-intervention . . . . . . . . . . . . 118
3.3.6.3 Music and training changes . . . . . . . . . . . . 1183.4 Results . . . . . . . . . . . . . . . . . . . . . . . . . . . . . . . . 120
3.4.1 Neurofeedback training . . . . . . . . . . . . . . . . . . . 1203.4.1.1 Alpha-theta neurofeedback training . . . . . . . . 1203.4.1.2 SMR neurofeedback training . . . . . . . . . . . 1223.4.1.3 Neurofeedback Results Summary . . . . . . . . . 122
3.4.2 Music Performance . . . . . . . . . . . . . . . . . . . . . 1243.4.2.1 Instrumental Solo . . . . . . . . . . . . . . . . . 124
9
CONTENTS
Data Screening . . . . . . . . . . . . . . . . . . . . 124Creativity . . . . . . . . . . . . . . . . . . . . . . 127
3.4.2.2 Stripsody . . . . . . . . . . . . . . . . . . . . . 131Data Screening . . . . . . . . . . . . . . . . . . . . 131Creativity . . . . . . . . . . . . . . . . . . . . . . 131
3.4.2.3 Folk Song . . . . . . . . . . . . . . . . . . . . . 135Data Screening . . . . . . . . . . . . . . . . . . . . 135Novice Performance . . . . . . . . . . . . . . . . . 135
3.4.2.4 Instrumental Improvisation . . . . . . . . . . . . 140Data Screening . . . . . . . . . . . . . . . . . . . . 140Creativity . . . . . . . . . . . . . . . . . . . . . . 142
3.4.3 Within-subjects relationship between changes in - andmusic performance . . . . . . . . . . . . . . . . . . . . . . 1453.4.3.1 Instrumental Solo . . . . . . . . . . . . . . . . . 1453.4.3.2 Stripsody . . . . . . . . . . . . . . . . . . . . . 1463.4.3.3 Folk Song . . . . . . . . . . . . . . . . . . . . . 1463.4.3.4 Instrumental Improvisation . . . . . . . . . . . . 146
3.4.4 Music Results summary . . . . . . . . . . . . . . . . . . . 1493.5 Discussion . . . . . . . . . . . . . . . . . . . . . . . . . . . . . . 149
3.5.1 Neurofeedback Training . . . . . . . . . . . . . . . . . . . 1493.5.1.1 Alpha-theta training . . . . . . . . . . . . . . . . 1493.5.1.2 SMR training . . . . . . . . . . . . . . . . . . . 150
3.5.2 Music Performance . . . . . . . . . . . . . . . . . . . . . 1513.5.2.1 Instrumental Solo . . . . . . . . . . . . . . . . . 1523.5.2.2 Stripsody . . . . . . . . . . . . . . . . . . . . . 1543.5.2.3 Folk Songs . . . . . . . . . . . . . . . . . . . . 1553.5.2.4 Instrumental Improvisation . . . . . . . . . . . . 156
3.5.3 Summary of the study . . . . . . . . . . . . . . . . . . . . 1563.5.3.1 e following study . . . . . . . . . . . . . . . . 157
4 Experiment Two 158
4.1 Introduction . . . . . . . . . . . . . . . . . . . . . . . . . . . . . 1584.2 Method . . . . . . . . . . . . . . . . . . . . . . . . . . . . . . . 160
10
CONTENTS
4.2.1 Participants . . . . . . . . . . . . . . . . . . . . . . . . . 1604.2.2 Design . . . . . . . . . . . . . . . . . . . . . . . . . . . . 1604.2.3 Neurofeedback, Music Performance and Statistical methods . 160
4.3 Results . . . . . . . . . . . . . . . . . . . . . . . . . . . . . . . . 1614.3.1 Neurofeedback training . . . . . . . . . . . . . . . . . . . 161
4.3.1.1 Alpha-theta neurofeedback training . . . . . . . . 1614.3.1.2 SMR neurofeedback training . . . . . . . . . . . 163
4.3.2 Music Performance . . . . . . . . . . . . . . . . . . . . . 1654.3.2.1 Instrumental Solo . . . . . . . . . . . . . . . . . 165
Data Screening . . . . . . . . . . . . . . . . . . . . 165Creativity . . . . . . . . . . . . . . . . . . . . . . 165
4.3.2.2 Stripsody . . . . . . . . . . . . . . . . . . . . . 170Data Screening . . . . . . . . . . . . . . . . . . . . 170Creativity . . . . . . . . . . . . . . . . . . . . . . 170
4.3.2.3 Folk Song . . . . . . . . . . . . . . . . . . . . . 173Data Screening . . . . . . . . . . . . . . . . . . . . 173Novice Performance . . . . . . . . . . . . . . . . . 173
4.3.2.4 Instrumental Improvisation . . . . . . . . . . . . 177Data Screening . . . . . . . . . . . . . . . . . . . . 177Creativity . . . . . . . . . . . . . . . . . . . . . . 177
4.3.3 Within-subjects relationship between changes in - andmusic performance . . . . . . . . . . . . . . . . . . . . . . 1814.3.3.1 Instrumental Solo . . . . . . . . . . . . . . . . . 1814.3.3.2 Stripsody . . . . . . . . . . . . . . . . . . . . . 1824.3.3.3 Folk Song . . . . . . . . . . . . . . . . . . . . . 1824.3.3.4 Instrumental Improvisation . . . . . . . . . . . . 182
4.3.4 Music Results summary . . . . . . . . . . . . . . . . . . . 1854.4 Discussion . . . . . . . . . . . . . . . . . . . . . . . . . . . . . . 185
4.4.1 Neurofeedback Training . . . . . . . . . . . . . . . . . . . 1854.4.1.1 Alpha-theta training . . . . . . . . . . . . . . . . 1854.4.1.2 SMR training . . . . . . . . . . . . . . . . . . . 187
4.4.2 Music Performance . . . . . . . . . . . . . . . . . . . . . 1894.4.2.1 Instrumental Solo . . . . . . . . . . . . . . . . . 190
11
CONTENTS
4.4.2.2 Stripsody . . . . . . . . . . . . . . . . . . . . . 1914.4.2.3 Folk Songs . . . . . . . . . . . . . . . . . . . . 1924.4.2.4 Instrumental Improvisation . . . . . . . . . . . . 192
4.4.3 Summary of the study . . . . . . . . . . . . . . . . . . . . 1934.4.3.1 e following study . . . . . . . . . . . . . . . . 193
5 Experiment ree 195
5.1 Introduction . . . . . . . . . . . . . . . . . . . . . . . . . . . . . 1955.2 Methods . . . . . . . . . . . . . . . . . . . . . . . . . . . . . . . 201
5.2.1 Participants . . . . . . . . . . . . . . . . . . . . . . . . . 2015.2.2 Contributors . . . . . . . . . . . . . . . . . . . . . . . . . 2025.2.3 Equipment and Assessments . . . . . . . . . . . . . . . . . 202
5.2.3.1 EEG . . . . . . . . . . . . . . . . . . . . . . . 2035.2.3.2 Motor Performance . . . . . . . . . . . . . . . . 2045.2.3.3 Creativity . . . . . . . . . . . . . . . . . . . . . 2045.2.3.4 Cognitive performance . . . . . . . . . . . . . . 205
5.2.4 Measurement Procedures . . . . . . . . . . . . . . . . . . 205Rest . . . . . . . . . . . . . . . . . . . . . . . . . 205Music Tasks . . . . . . . . . . . . . . . . . . . . . 206
Task 1 — Scribble . . . . . . . . . . . . . . . 208Task 2 — Graphic score . . . . . . . . . . . . 209Task 3 — Melody . . . . . . . . . . . . . . . . 209Task 4 — Score . . . . . . . . . . . . . . . . . 210
Wisconsin Card Sort . . . . . . . . . . . . . . . . . 2105.2.5 Experimental Design . . . . . . . . . . . . . . . . . . . . . 210
5.2.5.1 Data analysis . . . . . . . . . . . . . . . . . . . 2125.3 Research questions . . . . . . . . . . . . . . . . . . . . . . . . . . 212
5.3.1 Between-tasks comparisons . . . . . . . . . . . . . . . . . 212EEG measures of improvisation will show greater in-
hibition compared to score rendition. . . 2125.3.2 Between-condition comparisons . . . . . . . . . . . . . . . 213
Alpha synchronisation and hypofrontality . . . . . . 213
12
CONTENTS
Music performance will modulate as a function ofprior rest . . . . . . . . . . . . . . . . 213
Response slowing . . . . . . . . . . . . . . . . 213Creativity . . . . . . . . . . . . . . . . . . . . 213
Cognitive performance will modulate as a functionof prior rest . . . . . . . . . . . . . . . 214
5.4 Results . . . . . . . . . . . . . . . . . . . . . . . . . . . . . . . . 2145.4.1 Data screening . . . . . . . . . . . . . . . . . . . . . . . . 214
5.4.1.1 Inter Rater Consistency . . . . . . . . . . . . . . 2145.4.2 Between-tasks study . . . . . . . . . . . . . . . . . . . . . 2145.4.3 Between-conditions study . . . . . . . . . . . . . . . . . . 217
5.4.3.1 Rest EEG . . . . . . . . . . . . . . . . . . . . . 217Fz alpha . . . . . . . . . . . . . . . . . . . . . . . 217Pz alpha . . . . . . . . . . . . . . . . . . . . . . . 217
5.4.3.2 Music performance . . . . . . . . . . . . . . . . 218Response slowing . . . . . . . . . . . . . . . . . . 218Creativity evaluations . . . . . . . . . . . . . . . . 220Alpha synchronisation . . . . . . . . . . . . . . . . 220
5.4.3.3 Cognitive performance . . . . . . . . . . . . . . 2215.4.4 Results summary . . . . . . . . . . . . . . . . . . . . . . . 222
5.5 Discussion . . . . . . . . . . . . . . . . . . . . . . . . . . . . . . 223Demographic considerations . . . . . . . . . . . . . 223Between tasks comparisons . . . . . . . . . . . . . . 224Between conditions comparisons . . . . . . . . . . . 226Conclusion . . . . . . . . . . . . . . . . . . . . . . 228
6 Conclusions 229
6.1 Research aims . . . . . . . . . . . . . . . . . . . . . . . . . . . . 2296.1.1 Primary aims . . . . . . . . . . . . . . . . . . . . . . . . . 229
Exploring creativity by attempting to quantify andmodulate it . . . . . . . . . . . . . . . 229
1. Define creativity in an experimentally tractableway . . . . . . . . . . . . . . . 229
13
CONTENTS
2. Regulate creativity via hypnagogia . . . . . . 2293. Disclose creativity through improvisation . . 229
6.1.2 Secondary aims . . . . . . . . . . . . . . . . . . . . . . . 230Optimise novice performance . . . . . . . . . . . . 230Replicate and re-focus Egner and Gruzelier (2003) . 230
6.2 Research questions . . . . . . . . . . . . . . . . . . . . . . . . . . 2306.2.1 List of research questions . . . . . . . . . . . . . . . . . . 230
6.2.1.1 . C . . . . . . . . . . . . . . . . . . . 2306.2.1.2 . . . . . . . . . . . . . . . . . . 2306.2.1.3 . N . . . . . . . . . . . . . 2306.2.1.4 . E . . . . . . . . . . . . . . . . 2306.2.1.5 . H . . . . . 2316.2.1.6 . I . . . . . . . . . 2316.2.1.7 . I E G () . 231
6.3 Review of aims and questions . . . . . . . . . . . . . . . . . . . . 2316.3.0.8 Aim 1. Define creativity in an experimentally tractable
way . . . . . . . . . . . . . . . . . . . . . . . . 2316.3.0.9 Aim 2. Regulate creativity via hypnagogia . . . . 2326.3.0.10 Aim 3. Disclose creativity through improvisation . 232
6.3.1 Answers to research questions . . . . . . . . . . . . . . . . 2326.3.1.1 . C . . . . . . . . . . . . . . . . . . . 2326.3.1.2 . . . . . . . . . . . . . . . . . . 235
Alpha theta training . . . . . . . . . . . . . . . . . 235 training . . . . . . . . . . . . . . . . . . . . . 236
6.3.1.3 . N . . . . . . . . . . . . . 2376.3.1.4 . E . . . . . . . . . . . . . . . . 2396.3.1.5 . H . . . . . 2406.3.1.6 . I . . . . . . . . . 2416.3.1.7 . I E G () . 243
6.4 Limitations and Future Directions . . . . . . . . . . . . . . . . . . 2446.4.1 Strengths . . . . . . . . . . . . . . . . . . . . . . . . . . . 2446.4.2 Weaknesses . . . . . . . . . . . . . . . . . . . . . . . . . 245
6.4.2.1 Defining creativity . . . . . . . . . . . . . . . . 245
14
CONTENTS
6.4.2.2 Guidance for experimenters . . . . . . . . . . . . 246Control for musical biography . . . . . . . . . . . . 246Statistical power . . . . . . . . . . . . . . . . . . . 247Variability of training timetable . . . . . . . . . . . 247Controlling for naturally occurring changes . . . 247Controlling for sleep habits . . . . . . . . . . . . . 248
6.5 Final Conclusions . . . . . . . . . . . . . . . . . . . . . . . . . . 249
A Clinical applications of the Alpha-eta protocol 250
B Clinical applications of the SMR protocol 271
C Folk Assessment 289
D Stripsody Assessment 290
E Instrumental Solo Assessment 291
F Instrumental Improvisation Assessment 292
G 10–20 system of EEG electrode locations 293
Appendices
Bibliography 294
15
List of Figures
1.1 Joe Kamiya pictured recording in 1972 . . . . . . . . . . . . . 281.2 Elmer Green pictured recording the of yogic meditation. . . . . 351.3 e discovery of the Sensorimotor rhythm . . . . . . . . . . . . . . 371.4 conditioning in polygraphic traces . . . . . . . . . . . . . . . . 371.5 from Steptoe (1982), who collected self-reported tension and perfor-
mance quality data for musicians playing in (labels from left to right)lessons; practice; public performance; dress rehearsal; audition. . . . 40
1.6 Mednick’s (1962) associative hierarchy of the word ‘Table’ . . . . . . 761.7 from Dietrich (2004a) who hypothesised that: “… there are four basic
types of creative insight” . . . . . . . . . . . . . . . . . . . . . . . 801.8 Image showing the structure of Benzene, as Kekulé claimed to have
first visualised as hypnagogic imagery of a snake holding its own tail. 821.9 Image from Mavromatis’s (1987) recounting of Dickens’s hypnagogic
experiences. . . . . . . . . . . . . . . . . . . . . . . . . . . . . . 831.10 e Edison statue at his home in Fort Myers, Florida. He’s shown
holding a steel ball, the type of which he reportedly used in capturinghypnagogic insights. . . . . . . . . . . . . . . . . . . . . . . . . . 84
1.11 e time-warping effects (1.11a) and precariousness (1.11b) of sleepin the work of Salvador Dalí. . . . . . . . . . . . . . . . . . . . . . 85
3.1 Photo of an alpha-theta training session . . . . . . . . . . . . . . . 1083.2 Photo of an training session . . . . . . . . . . . . . . . . . . . 1103.3 Stripsody graphic notation . . . . . . . . . . . . . . . . . . . . . . 1123.4 eta/alpha ratios shown over the course of the average session, course
and session × course relationship. . . . . . . . . . . . . . . . . . . 1213.5 /(theta+beta) ratios shown over the course of the average session,
course and session × course relationship. . . . . . . . . . . . . . . . 1233.6 Boxplot showing between group differences in pre-intervention mea-
sures of Instrumental performance . . . . . . . . . . . . . . . . . . 1253.7 Group changes in music performance evaluation . . . . . . . . . . . 129
16
LIST OF FIGURES
3.8 Boxplot showing between group differences in pre-intervention mea-sures of Stripsody performance . . . . . . . . . . . . . . . . . . . . 131
3.9 Group changes in music performance evaluation . . . . . . . . . . . 1343.10 Boxplot showing between group differences in pre-intervention mea-
sures of Folk Song performance . . . . . . . . . . . . . . . . . . . 1353.11 Group changes in music performance evaluation . . . . . . . . . . . 1393.12 Bland-Altman plot of instrumental improvisation ratings. . . . . . . 1403.13 Boxplot showing between group differences in pre-intervention mea-
sures of Instrumental Improvisation . . . . . . . . . . . . . . . . . 1413.14 Group changes in music performance evaluation . . . . . . . . . . . 144
4.1 Differences between observed changes in experimental groups acrosstwo experiments. . . . . . . . . . . . . . . . . . . . . . . . . . . . 159
4.2 eta/alpha ratios shown over the course of the average session, courseand session × course relationship. . . . . . . . . . . . . . . . . . . 162
4.3 /(theta+beta) ratios shown over the course of the average session,course and session × course relationship. . . . . . . . . . . . . . . . 164
4.4 Boxplot showing between group differences in pre-intervention mea-sures of Instrumental performance . . . . . . . . . . . . . . . . . . 166
4.5 Group changes in music performance evaluation . . . . . . . . . . . 1684.6 Boxplot showing between group differences in pre-intervention mea-
sures of Stripsody performance . . . . . . . . . . . . . . . . . . . . 1704.7 Group changes in music performance evaluation . . . . . . . . . . . 1724.8 Boxplot showing between group differences in pre-intervention mea-
sures of Folk Song performance . . . . . . . . . . . . . . . . . . . 1734.9 Group changes in music performance evaluation . . . . . . . . . . . 1764.10 Boxplot showing between group differences in pre-intervention mea-
sures of Instrumental Improvisation . . . . . . . . . . . . . . . . . 1774.11 Group changes in music performance evaluation . . . . . . . . . . . 1804.12 De Gennaro et al.’s (2001) spectral analysis of scalp-wide during
sleep onset - Note that alpha (8-11 Hz) begins to rise during initiation, and theta (merged with “sleep spindle” ) risesthroughout. . . . . . . . . . . . . . . . . . . . . . . . . . . . . . 186
17
LIST OF FIGURES
4.13 Morikawa et al.’s (1997) characterisation of the visual properties ofhypnagogic . . . . . . . . . . . . . . . . . . . . . . . . . . . . 187
5.1 Photo of the experimental setup . . . . . . . . . . . . . . . . . . . 2025.2 Wehinger’s (1970) graphic score for Georgy Ligeti’s Artikulation (1958)2095.3 Melodic-template for a 2-minute improvisation. . . . . . . . . . . . 2095.4 Score used as a non-improvisational control task . . . . . . . . . . . 2105.5 Computerised display of the Wisconsin card sort task. . . . . . . . . 2105.6 Flow of participants through the balanced-crossover design of the study2115.7 Comparison of Fz and Pz alpha amplitude during nap and movie
conditions . . . . . . . . . . . . . . . . . . . . . . . . . . . . . . 2175.8 Note duration distributions in different tasks . . . . . . . . . . . . 219
18
List of Tables
1.1 Example stimuli used in the Remote associates test (Mednick andMednick, 1967b) . . . . . . . . . . . . . . . . . . . . . . . . . . . 75
3.1 Observed power of music changes . . . . . . . . . . . . . . . . . . 1053.2 Included performance types and their assessment criteria . . . . . . 1173.3 Instrumental descriptive statistics . . . . . . . . . . . . . . . . . . 1283.4 Instrumental Solo — within-group changes . . . . . . . . . . . . . 1303.5 Stripsody descriptive statistics . . . . . . . . . . . . . . . . . . . . 1333.6 Folk Song descriptive statistics . . . . . . . . . . . . . . . . . . . . 1373.7 Instrumental improvisation descriptive statistics . . . . . . . . . . . 1433.8 Correlation between training and music change replicating Egner and
Gruzelier’s (2003) statistical analysis . . . . . . . . . . . . . . . . . 1453.9 Music covariance with within-session (F statistic) . . . . . . . . 147
4.1 Instrumental descriptive statistics . . . . . . . . . . . . . . . . . . 1674.2 Instrumental Solo — within-group changes . . . . . . . . . . . . . 1694.3 Stripsody descriptive statistics . . . . . . . . . . . . . . . . . . . . 1714.4 Folk Song descriptive statistics . . . . . . . . . . . . . . . . . . . . 1754.5 Instrumental improvisation descriptive statistics . . . . . . . . . . . 1794.6 Correlation between training and music change replicating Egner and
Gruzelier’s (2003) statistical analysis . . . . . . . . . . . . . . . . . 1814.7 Music covariance with within-session (F statistic) . . . . . . . . 183
5.1 Descriptive statistics of amplitudes in between-tasks comparisons 2155.2 amplitude contrasts . . . . . . . . . . . . . . . . . . . . . . . 2165.3 Descriptive statistics for alpha amplitude during nap and movie con-
ditions . . . . . . . . . . . . . . . . . . . . . . . . . . . . . . . . 2185.4 Descriptive statistics for the response slowing measures extracted from
data . . . . . . . . . . . . . . . . . . . . . . . . . . . . . . . 2195.5 Descriptive statistics of the creativity evaluation assessments . . . . . 2205.6 Descriptive statistics of the Fz/Pz alpha amplitudes in between-condition
comparisons. . . . . . . . . . . . . . . . . . . . . . . . . . . . . . 221
19

LIST OF TABLES
5.7 Wisconsin Card Sort Descriptive Statistics . . . . . . . . . . . . . . 222
B.1 Overview of studies used in Arns et al. (2009) . . . . . . . . . . . . 288
20
1Introduction
1.1 Summary
is chapter reviews developments in neuroscience, psychology and music perfor-mance that led to the experimental studies presented in this dissertation.
Initially the electroencephalograph () and its use in the application of biofeedback training, also called neurofeedback training () will be described. ehistorical origins of methods used today will be briefly summarised, prior to amore detailed analysis of the empirical literature specific to the ‘Optimal performance’application of in healthy subjects. e clinical literature is also surveyed inAppendices A and B on page 271). e proposed link between and creativity willbe introduced.
Creativity will then be examined, beginning with a review of how scientists havetried to make it experimentally tractable, although after 60+ years of discussions, thisremains a problematic issue — for the purposes of this dissertation, creativity is viewedas an interplay between spontaneous emotional neural processes and the social re-sponses that these evoke.
Hypnagogia, a candidate neural correlate of creativity, is then examined as a po-tential mechanism for regulating spontaneous emotional content processing. is isrelated to the literature.
Finally, music improvisation is presented as an experimental method for observingboth creative processing and the evoked social response.
21
CHAPTER 1. INTRODUCTION
1.2 Electrophysiology in the brain, and neurofeedback
applications
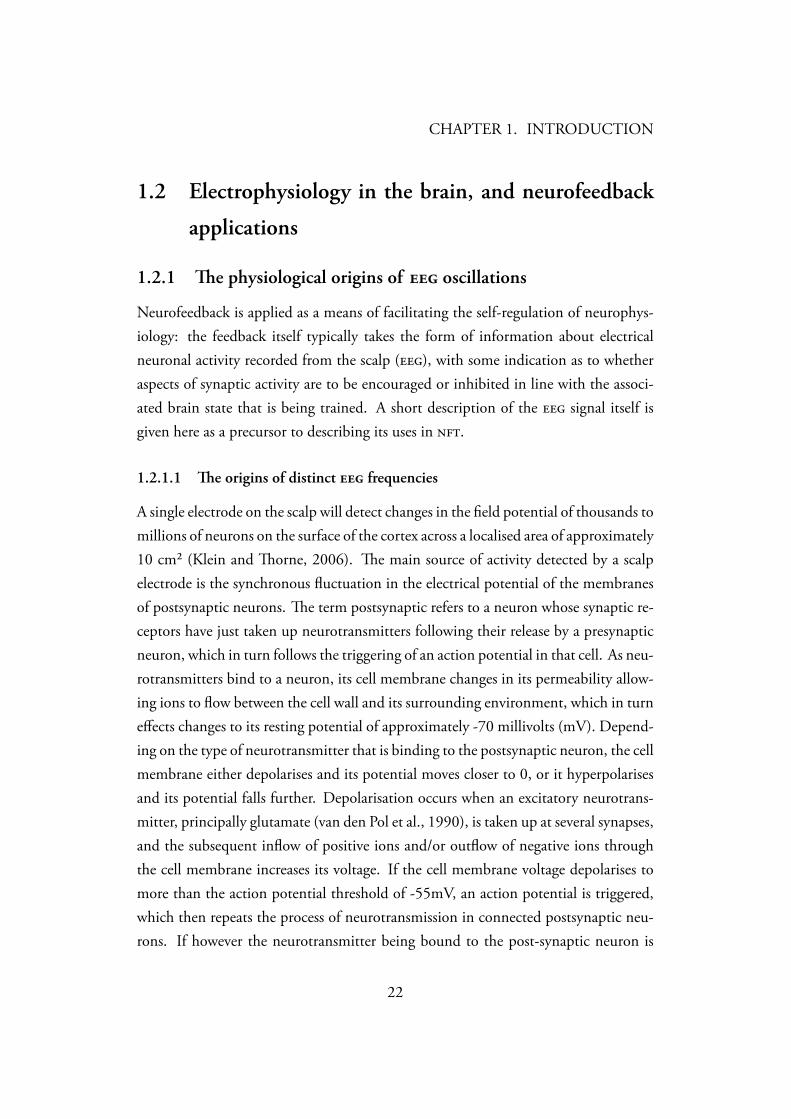
1.2.1 e physiological origins of oscillations
Neurofeedback is applied as a means of facilitating the self-regulation of neurophys-iology: the feedback itself typically takes the form of information about electricalneuronal activity recorded from the scalp (), with some indication as to whetheraspects of synaptic activity are to be encouraged or inhibited in line with the associ-ated brain state that is being trained. A short description of the signal itself isgiven here as a precursor to describing its uses in .
1.2.1.1 e origins of distinct frequencies
A single electrode on the scalp will detect changes in the field potential of thousands tomillions of neurons on the surface of the cortex across a localised area of approximately10 cm² (Klein and orne, 2006). e main source of activity detected by a scalpelectrode is the synchronous fluctuation in the electrical potential of the membranesof postsynaptic neurons. e term postsynaptic refers to a neuron whose synaptic re-ceptors have just taken up neurotransmitters following their release by a presynapticneuron, which in turn follows the triggering of an action potential in that cell. As neu-rotransmitters bind to a neuron, its cell membrane changes in its permeability allow-ing ions to flow between the cell wall and its surrounding environment, which in turneffects changes to its resting potential of approximately -70 millivolts (mV). Depend-ing on the type of neurotransmitter that is binding to the postsynaptic neuron, the cellmembrane either depolarises and its potential moves closer to 0, or it hyperpolarisesand its potential falls further. Depolarisation occurs when an excitatory neurotrans-mitter, principally glutamate (van den Pol et al., 1990), is taken up at several synapses,and the subsequent inflow of positive ions and/or outflow of negative ions throughthe cell membrane increases its voltage. If the cell membrane voltage depolarises tomore than the action potential threshold of -55mV, an action potential is triggered,which then repeats the process of neurotransmission in connected postsynaptic neu-rons. If however the neurotransmitter being bound to the post-synaptic neuron is
22
CHAPTER 1. INTRODUCTION
inhibitory the cell membrane hyperpolarises, reducing the likelihood that the cell willproduce an action potential (Bullock et al., 1977). Although action potentials areintegral to neurotransmission they are not thought to contribute greatly to scalp measures, which instead reflect rhythmic changes in ionic currents around dendritesin large numbers of postsynaptic neurons close to the surface electrode (Whittingstalland Logothetis, 2009).
e frequencies Either visual or spectral analysis of the signal indicate that largenumbers of neurons oscillate within a range of distinct frequency ranges. e isdescribed as being made up of several ‘band’ components broadly categorised as:
• Slow wave (0.1 to 1 Hz)
• Delta (1 to 4 Hz),
• eta (4 to 8 Hz),
• Alpha (8 to 13 Hz),
• Beta (13 to 30 Hz)
• Gamma (greater than 40 Hz).
Each of these specific frequency ranges is entrained by a pacemaking property ofneurons, either by intrinsically generating oscillations in electrical voltage, or by in-teracting with other neurons in an excitatory/inhibitory pattern, or in a combinationof the above (Steriade et al., 1990). Nonetheless, the drivers behind many of the frequencies have yet to be confirmed, and it is only in the case of the rhythmic activityarising from a network of neurons in the cortex, the reticular thalamus and the dorsalthalamus that the process generating sleep phenomena has been fully elucidated.
1.2.1.2 Sleep and the thalamocortical circuit
e thalamocortical circuit has a functional role in governing transitions betweenarousal and sleep, and the oscillations that are observed during these states aregenerated in the thalamus either alone or in concert with the cortex (Steriade et al.,1993b). e thalamus is the main gateway for the flow of incoming information tothe cortex, and in sleep a formation of cells in the reticular thalamus block this flow byinducing inhibitory postsynaptic potentials in the dorsal thalamus, closing the brain
23
CHAPTER 1. INTRODUCTION
to signals from the outside world. During sleep onset cortical neurons spontaneouslyoscillate creating a characteristic shape in the known as the K-complex (Loomiset al., 1938), a functionally significant phenomenon that governs increasing hyper-polarisation of thalamic neurons by triggering two types of oscillatory activity thatregulate sleep (Amzica and Steriade, 2002). Firstly, the cortical neurons that initiatea K-complex project along downward connections to large numbers of reticular tha-lamic nuclei. Intracellular field potentials measured in these cells show a 2–3 secondseries of inhibitory postsynaptic 7–14 Hz activity referred to as “sleep spindles” dueto their visual appearance on an trace. Reticular thalamic cells synchronously hy-perpolarise dorsal thalamic cells which, following a large decrease of positive charge,experience a rebound of positive ions back into the cell triggering a burst of actionpotentials that stimulate excitatory action potentials in connected pyramidal cells thecortex. ese cortical potentials mirror the thalamic oscillations with the same 7–14Hz in the scalp . Secondly, the cortical K-complex also prefigures the widespreadformation of delta oscillations in the dorsal thalamus, which are more hyperpolarisedthan during the production of sleep spindles, indicating the progression into a deeperlevel of sleep (Steriade et al., 1993b).
Evidence that the generation of sleep oscillations emanate from the thalamus hasbeen obtained from in vivo and in vitro experiments that isolated and measured activ-ity in each brain area in the thalamocortical network independently. It has thus beenfound that when severing network connections, sleep spindles only continue to occurin reticular thalamic cells (Steriade et al., 1987), and that the same is true of the dorsalthalamus in generating delta oscillations (Steriade et al., 1991). ese findings haveprovided evidence that spontaneously firing cells act as a ‘pacemaker’ for oscillatoryactivity, and have the functional role of maintaining the brain at rest, allowing cel-lular energetic stores to be replenished. During wakefulness, the production of sleeposcillations in thalamic and reticular thalamic nuclei is prevented by the release ofvarious neurotransmitters (acetylcholine, norepinephrine, serotonin, histamine andglutamate) from the upper brainstem, posterior thalamus and basal forebrain. In vivostudies have shown that electrical stimulation of cholinergic or noradrenergic neu-rons, or insertion of acetylcholine or norepinephrine into the thalamus depolarisesthalamocortical cells (McCormick and Huguenard, 1992), suppressing the formationof delta oscillations, and norepinephrine and serotonin depolarise reticular thalamic
24
CHAPTER 1. INTRODUCTION
nuclei, preventing sleep spindles (McCormick et al., 1993), and these patterns alsodisappear from scalp recorded and are replaced by fast-wave activity caused bydepolarisation of pyramidal cells (Steriade et al., 1993a).
1.2.1.3 Non-sleep phenomena
Whilst the pacemakers underlying the production of signatures prevalent duringsleep and awakening have been isolated, other rhythmic components of the arenot as clearly understood.
eta eta wave is thought to arise from the limbic system with networkactivity that reflects the on-line state of the hippocampus in humans, a brain areainvolved in the encoding of new autobiographical or spatial information in workingmemory (Buzsáki, 2005). e theta rhythm is observed in frontal midline areas ofthe cortex during working memory task processing, however the process by whichthis oscillation emerges remains the subject of continued exploration (Buzsáki, 2002).eta waves are also found in widespread areas of the cortex during drowsiness, sleeptransition and sleep, however it has been demonstrated that they are not coherentwith accompanying theta oscillations measured in the hippocampus (Cantero et al.,2003). It has therefore been proposed that cortical and hippocampal theta waves maybe produced by unrelated mechanisms.
Alpha Alpha band is also the subject of continuing investigation as to itsorigin. Like sleep oscillations alpha generation was initially associated with the thala-mocortical circuit (Andersen and Andersson, 1968), however the attempts of subse-quent research to clarify this assertion, have resulted in a number of different mech-anisms being proposed with both intracortical and corticothalamic coherence beingimplicated in alpha pace setting (da Silva et al., 1973). A lesion study in which tha-lamic alpha was measured in decorticated cats demonstrated that in the absence ofcortical projections, thalamic oscillations were disorganised and lacked localised syn-chrony, indicating that thalamic alpha is moderated by the cortex (Contreras et al.,1996). More recent studies that combined neuroelectric () and neuroimaging(/fMRI) measures provided further evidence that increased alpha power in the was positively correlated with thalamic metabolism (Schreckenberger et al., 2004) or
25
CHAPTER 1. INTRODUCTION
signal (Goldman et al., 2002). e study measured alpha activity followingthe effects of the sedative lorazepam against a placebo control, and additionally re-ported that the close functional relationship between the cortex and thalamus in theproduction of alpha rhythms is not affected by the amount of incoming sensory in-formation. is finding along with the lesion study suggests that as a sensory gateway,the thalamus is less implicated in the generation of the alpha rhythm than the sleeprhythms described previously, and that alpha activity might be more likely to stemfrom network interactions.
Beta and gamma e origins of faster beta and gamma rhythms also remainonly partly disclosed, partly due to the large number of ways in which these rhythmsare generated. e depolarisation of cortical cells occurs intrinsically in both so-matosensory and visual cortices (Gray and McCormick, 1996) as a function of wakefulmodes of processing including movement and sensory perception. Network interac-tions between cortical neurons also serve to generate fast rhythms, and these possiblyarise from the integration of different sources of sensory information in time (Singerand Gray, 1995), whilst pre-thalamic sites such as the cerebellum have additionallybeen implicated in the initiation of fast rhythms (Timofeev and Steriade, 1997).
In summary, and taking into consideration the previously described frequen-cies, it can be broadly stated that with the exception of theta rhythms possibly me-diated by interaction with the limbic system, the modulation of rhythms in aneurofeedback application would typically effect changes in network activity amongstcortical neurons below the electrode and the other cortical or thalamic neurons theyinteract with. Changes in rhythmicity would be effected through direct alteration ofneuronal excitability in specific cells, through changes to neuromodulator systems, ora combination of the two.
1.3 A Brief History of Neurofeedback
is section will start by briefly introducing the different types of neurofeedback ap-plications in current use, before summarising the discoveries that led to the formationof the two biofeedback protocols most widely used today: the alpha-theta and
26
CHAPTER 1. INTRODUCTION
sensorimotor rhythm () protocols.
1.3.1 e foundation of neurofeedback methods
Neurofeedback is part of a wider group of biofeedback applications, all of which havethe goal of facilitating the self-regulation of physiological functions with the goal ofnormalising them in clinical populations or optimising them in healthy subjects. Inthe earliest experiments that went on to influence the subsequent development ofneurofeedback methods, researchers sought to establish whether operant conditioning(Skinner, 1937) methods could be used to direct changes in the (Kamiya, 1962;Wyrwicka and Sterman, 1968).
1.3.1.1 Early studies
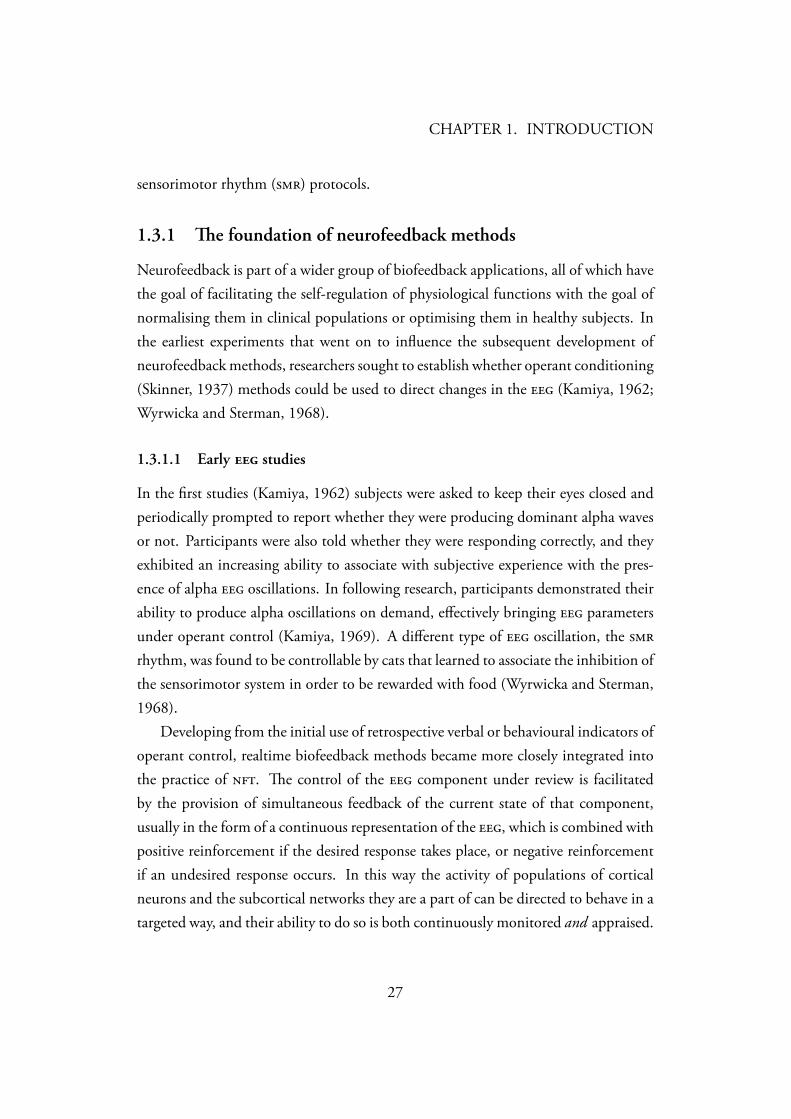
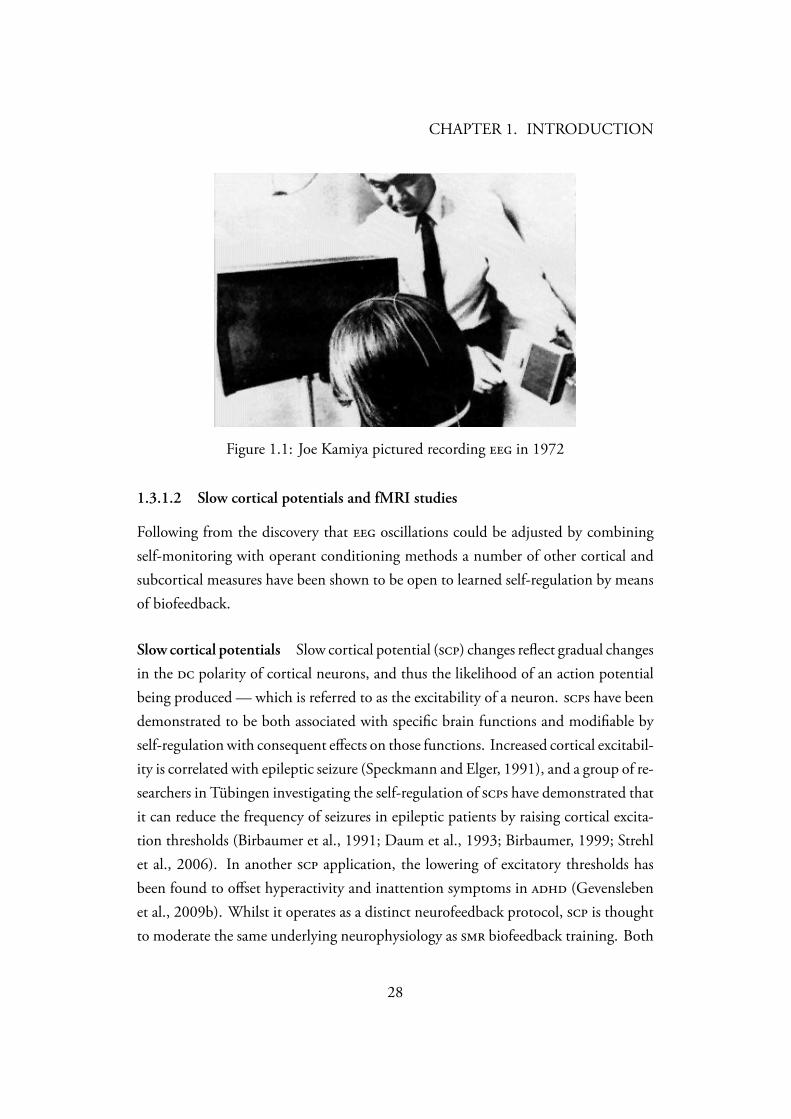
In the first studies (Kamiya, 1962) subjects were asked to keep their eyes closed andperiodically prompted to report whether they were producing dominant alpha wavesor not. Participants were also told whether they were responding correctly, and theyexhibited an increasing ability to associate with subjective experience with the pres-ence of alpha oscillations. In following research, participants demonstrated theirability to produce alpha oscillations on demand, effectively bringing parametersunder operant control (Kamiya, 1969). A different type of oscillation, the rhythm, was found to be controllable by cats that learned to associate the inhibition ofthe sensorimotor system in order to be rewarded with food (Wyrwicka and Sterman,1968).
Developing from the initial use of retrospective verbal or behavioural indicators ofoperant control, realtime biofeedback methods became more closely integrated intothe practice of . e control of the component under review is facilitatedby the provision of simultaneous feedback of the current state of that component,usually in the form of a continuous representation of the , which is combined withpositive reinforcement if the desired response takes place, or negative reinforcementif an undesired response occurs. In this way the activity of populations of corticalneurons and the subcortical networks they are a part of can be directed to behave in atargeted way, and their ability to do so is both continuously monitored and appraised.
27
CHAPTER 1. INTRODUCTION
Figure 1.1: Joe Kamiya pictured recording in 1972
1.3.1.2 Slow cortical potentials and fMRI studies
Following from the discovery that oscillations could be adjusted by combiningself-monitoring with operant conditioning methods a number of other cortical andsubcortical measures have been shown to be open to learned self-regulation by meansof biofeedback.
Slow cortical potentials Slow cortical potential () changes reflect gradual changesin the polarity of cortical neurons, and thus the likelihood of an action potentialbeing produced — which is referred to as the excitability of a neuron. s have beendemonstrated to be both associated with specific brain functions and modifiable byself-regulation with consequent effects on those functions. Increased cortical excitabil-ity is correlated with epileptic seizure (Speckmann and Elger, 1991), and a group of re-searchers in Tübingen investigating the self-regulation of s have demonstrated thatit can reduce the frequency of seizures in epileptic patients by raising cortical excita-tion thresholds (Birbaumer et al., 1991; Daum et al., 1993; Birbaumer, 1999; Strehlet al., 2006). In another application, the lowering of excitatory thresholds hasbeen found to offset hyperactivity and inattention symptoms in (Gevenslebenet al., 2009b). Whilst it operates as a distinct neurofeedback protocol, is thoughtto moderate the same underlying neurophysiology as biofeedback training. Both
28
CHAPTER 1. INTRODUCTION
protocols have been found to have similar effects in treating epilepsy and , andboth procedures are used to modulate cortical excitability: slow potentials reflect thepolarity of apical dendrites of cortical pyramidal neurons, whilst the rhythm re-flects inhibition of the sensorimotor system (Sterman and Egner, 2006; Egner andSterman, 2006). Neuroimaging of the basal ganglia has demonstrated that increase ofs and the presence of oscillations are both associated with increased metabolicactivity in the striatum of the basal ganglia nuclear complex, which suggests a sharedmechanism underlying both forms of training (Birbaumer, 2006).
fMRI Since the 1990’s the development of functional magnetic resonance imaging(fMRI), a non-invasive measure of blood oxygen within cerebral structures has seen itchange from being purely retrospective in terms of its utility, to having the potentialfor realtime applications including neurofeedback training and brain computer inter-faces (s). e most widely used fMRI method is the measure of the Blood Oxy-genation Level Dependency response that follows neuronal activation. When aneuron acts upon incoming neurotransmission (Logothetis et al., 2001), it exhaustsits supply of glucose and oxygen, and the process of hemodynamic response takesplace subsequently by increasing blood flow to that neuron in order to replenish thecell stores of energy. e movement of oxygenated blood into a brain area increasesthe ratio of oxyhemoglobin to deoxyhemoglobin in the surrounding veins, and thischange, as observed by fMRI, is directly related to brain function (Raichle, 2009).
In its application in cognitive neuroscience, the response under a test con-dition is contrasted with that observed during a control condition, and the resultingdifference indicates which brain areas were functionally (in)active during task pro-cessing. e three dimensional image of the response is spatially accurate upto 1 millimetre, and the entire brain is imaged, however, it takes up to six secondsfollowing neural activity for the signal to reach its peak, and the timing of acti-vations are approximate. If two separate neural assemblies were active within a shorttimespan, it would not be possible to infer which area was active at which point.
Starting in the 2000’s the first attempts at analysing fMRI in realtime began, firstlywith an application that sought to re-calibrate images following head motion in thescanner (esen et al., 2000). e authors argued that on-the-fly head motion correc-tion gave better measurement of responses indicated by greater test-retest relia-
29
CHAPTER 1. INTRODUCTION
bility. In 2002 it was reported that retrospective visual feedback of neural activationsin the somatosensory cortex following a short simple hand motor task could be usedin assisting participants to activate wider somatosensory areas (Yoo and Jolesz, 2002).is finding provided the first evidence that the response could be brought un-der operant control, even with an activity-feedback latency of 60 seconds.
Whilst near-realtime feedback was shown to have utility in an operant condition-ing exercise, the need to be able give a time specific representation of brain activityremains pressing, as has been discussed previously. Spatially separate brain activa-tions that occur within a short timeframe might not be temporally distinguished inmeasures of the response, and this distinction would be a requirement in a morecomplex task that required physiological self-regulation of more than one signal,for example distributed activity in the thalamocortical circuit, or concurrent process-ing in auditory and visual areas.
Attempts to reduce fMRI latency have considerably reduced the signal pro-cessing time to less than 2 seconds, largely by increasing the rapidity of signal pro-cessing, and using online signal estimation algorithms (deCharms et al., 2005; Hindset al., 2010). e significance of this development is that once brain activation inspecific areas can be self-regulated as an independent variable, the functional con-sequences on cognition, affect and behaviour can be assessed in experimental de-signs, with subsequent implications for clinical or cognitive questions (Weiskopf et al.,2004). e development of this technique remains largely in the experimental stageshowever, with methodological issues remaining central to research efforts.
1.3.1.3 e continued importance of protocols
Despite the strong empirical support for the practical application of neurofeed-back, and the emerging potential for the self regulation of spatially distinct brain areasin near-realtime fMRI applications, oscillations remain by far the most widelyused training measure in clinical and research based . e reason for this is proba-bly due to the fact that frequency components were the first measures of neuronalactivity to be used in clinical applications in the 1960’s, and have remained in use eversince, building a significant foundation from which to conduct follow-on work.
Not only is biofeedback the most widely used in clinical practice, it also has
30
CHAPTER 1. INTRODUCTION
the highest public profile of any form of biofeedback. is is largely thanks to thepopularisation of biofeedback in the 1970’s that followed from the publication ofseveral books by Barbara Brown, the first president of the Association for AppliedPsychophysiology and Biofeedback (Brown, 1974, 1975a,b). Early meetings of thisassociation were attended by a considerable number of members of the public (Rob-bins, 2008), and biofeedback has a high level of awareness in the public spherein contrast with more recently developed neurofeedback methods.
Modern Current neurofeedback research falls into two distinct camps,on one hand, the slow-wave protocols (the alpha and alpha-theta protocols), and onthe other the fast-wave protocols (such as , beta or gamma enhancement proto-cols).
Fast-wave In recent years the quality and amount of research conducted in fast-wave protocols has increased rapidly, and to the extent that both rhythmic and biofeedback have been empirically demonstrated to function as clinical alternatives topharmacological treatments for symptoms (for a review see the summary inTable B.1 on page 288 from Arns et al. (2009)).
Slow-wave Slow-wave regulation research has however has not seen such dra-matic advances being made, although a small number of researchers in the and (including my own lab) have continued to investigate this topic since the inceptionof the alpha-theta protocol in the mid 1970’s (Green et al., 1974).
In addition to these ‘standard’ protocols, experimental neurofeedback applicationshave been tested in treating a range of conditions including autism, asthma, coma andtinnitus (Hammond, 2008). Nonetheless, alpha-theta and based protocols con-tinue to dominate the field, remaining the most extensively investigated and applied,and the ensuing historical and literature reviews will cover them both, showing howtheir clinical applications have developed. e literature review will also documentmore recent applications of in ‘peak-performance’ applications designed to opti-mise brain functions in healthy subjects.
31
CHAPTER 1. INTRODUCTION
1.3.2 e history of slow-wave protocols
e modern alpha-theta protocol has its roots in the very first neurofeedbacktraining studies, which were based solely on the alpha rhythm. e first alpha condi-tioning studies are introduced here, along with the investigations into the role of alpha as a possible treatment for anxiety. e decline in this particular line of inquiryis then charted, as is the subsequent shift towards investigating the application of thealpha-theta protocol during recovery from alcohol addiction.
1.3.2.1 Alpha in anxiety
Joe Kamiya Joe Kamiya is considered the pioneer of , and it is possible to tracea direct line of descent from his studies of the operant conditioning of cortical alphaoscillations to the current use of the alpha-theta protocol. His early investigationsinto alpha conditioning were contemporary with a number of biofeedback experi-ments that sought to determine whether physiological monitoring techniques mightfacilitate the self-regulation of autonomic functions previously thought to be beyondvolitional control. ese included skin conductance (Crider et al., 1966), heart rate(Engel and Chism, 1967), blood pressure (Shapiro et al., 1969), and evoked corticalpotentials (Fox and Rudell, 1968), however alpha conditioning in particular capturedthe imagination of the public and the research community alike.
e historical background to Kamiya’s early investigations into alpha band as an index of anxiety and relaxation stemmed from the work of Berger, the pioneerof modern measurements who, observed alpha oscillations in relaxed individualssitting with their eyes closed in a darkened room (Berger, 1929). Berger noted theseoscillations disappeared when the individual became either drowsy or in response toa stimulus that induced anxiety. It was later proposed that alpha might be relatedto physiological and subjective arousal and anxiety according to an inverse U-shapedfunction (Yerkes and Dodson, 1908; Jasper, 1936), with alpha indicating optimalarousal. Subsequently attempts were made to validate this proposal (Lindsley, 1952;Stennett, 1957), and the possible therapeutic relevance of alpha began to emerge as ameans of regulating both over and under arousal (anxiety and dysphoria) (Orne andWilson, 1978).
In his earliest alpha experiments, Kamiya determined that it was possible with
32
CHAPTER 1. INTRODUCTION
a combination of practice and feedback, for individuals to discriminate the alphastate. In Kamiya (1962) the findings of an experiment were reported in which subjectskept their eyes closed and were given verbal feedback when 8–12 Hz oscillations werepresent in measurements of occipital . It was found that a significant number ofsubjects formed reliable associations between subjective experiences of pleasant calm-ness and the presence of alpha oscillations. Towards the end of the decade, Kamiyadocumented a case study in which the subject sat in a dimly lit room and was trainedto produce/block alpha by voluntarily controlling feedback (Kamiya, 1969).
Kamiya’s findings were well received, and enthusiasm for alpha biofeedback spreadrapidly, and a number of independent replications confirmed that experimental sub-jects could exert volitional control of alpha (Stoyva and Kamiya, 1968; Mullholland,1968; Brown, 1970a,b). With the exception of Mullholland (1968), these studiesfound that the alpha state was accompanied by subjective feelings of relaxation. Fromthat point, the possible therapeutic application of alpha training began to be exploredin earnest and Hardt and Kamiya (1978) reported that alpha training had a significanteffect in reducing high (but not moderate) levels of trait-anxiety.
Martin Orne Not all attempts to replicate Kamiya’s findings were able to demon-strate a clear link between alpha and relaxation. Paskewitz and Orne (1973) foundthat alpha increases were possibly predicted by eye lens refraction, which would inturn lead to inhibitory activity in the visual cortex. By testing subjects in completedarkness, they found that training levels of alpha simply returned to pre-training base-line levels. e authors also refuted the proposed inverse-U shaped relation betweenalpha and arousal (Lindsley, 1952; Stennett, 1957), finding alpha during both higharousal (fear of painful electric shock) and during changes in arousal during sleep(Orne and Wilson, 1978). e proposed link between alpha and anxiety was furtherweakened by Plotkin and Rice (1981), who reported a placebo effect wherein bothalpha suppression and enhancement facilitated anxiety reduction.
By the end of the 1970’s, ongoing investigations into alpha-biofeedback as therapyfor anxiety had ground to a halt. Several factors were responsible for this: Paskewitzand Orne’s (1973) discovery of confounding visual and placebo factors, the difficul-ties involved in comparing wide ranging individual differences in alpha production
33
CHAPTER 1. INTRODUCTION
(Kamiya, 1969), and Orne and Wilson’s (1978) realisation that alpha production didnot modulate as an inverse-U shaped function of neurophysiological arousal.
1.3.2.2 Alpha-eta and alcohol recovery
Treating alpha deficiency and using theta therapeutically Although the alpha-anxietyrelationship was largely disproved during the 1970’s, another potential application ofalpha biofeedback training emerged at this time. On the basis that those predisposedto alcohol addiction exhibited a deficiency of alpha production compared to controls(Funderburk, 1949), and that ethanol induces alpha production, a rationale was de-rived for treating alcoholism with alpha biofeedback training. A series of case studieswere published during this period which suggested that neurofeedback proceduresmight have clinical efficacy in treating substance use disorder (), and alpha train-ing was reported to reduce anxiety in alcoholics (Passini et al., 1977; Watson et al.,1978).
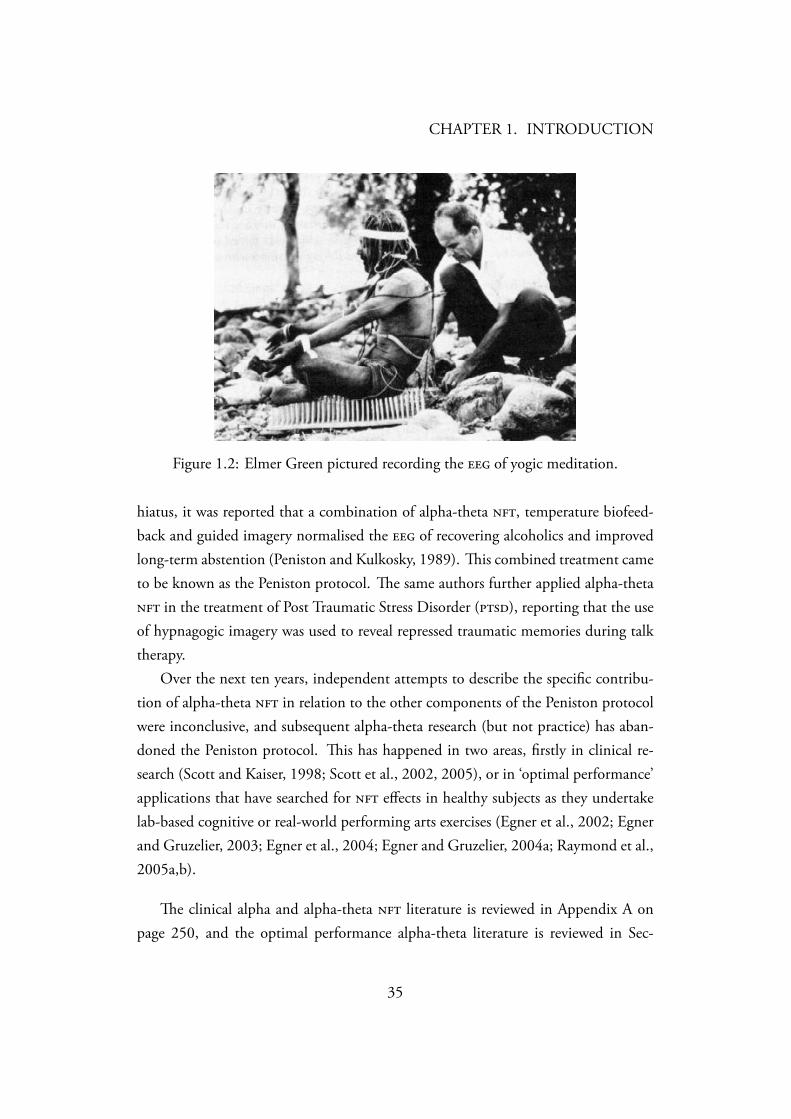
Also during 1970’s, and based on early observations of a ‘crossover’ from alpha totheta wave dominance in meditation (Green et al., 1970) (see Figure 1.2), a new procedure, the alpha-theta protocol, was developed to facilitate deeper relaxation thanalpha (Green et al., 1974). e transition from alpha to theta signal dominanceis one of a set of phenomena that occur during and is referred to as thehypnagogic state (Schacter, 1976). is transient period is also characterised by qual-itative changes in mental content (Tanaka et al., 1996) and reductions in muscle tone(which can lead to a sensation of falling which triggers the involuntary hypnagogicmyoclonus), and Green et al. (1970) reported that the point of crossover was alignedto subjective reports of profound relaxation and reverie accompanied by a sense of fo-cus. e first applications of the alpha-theta protocol were reported in uncontrolledstudies of its use in supporting alcohol withdrawal by augmenting psychotherapy withcontrolled relaxation (Goslinga, 1975), promoting self-actualisation as a product ofimagery experienced in theta states (Twemlow and Bowen, 1976), and promotinginsight and attitude change (Twemlow et al., 1977).
e Peniston protocol It was from these initial attempts to treat with alpha andthen alpha-theta , that this form of relaxation based training was ultimatelygiven a further opportunity to demonstrate its practical use. Following a ten-year
34
CHAPTER 1. INTRODUCTION
Figure 1.2: Elmer Green pictured recording the of yogic meditation.
hiatus, it was reported that a combination of alpha-theta , temperature biofeed-back and guided imagery normalised the of recovering alcoholics and improvedlong-term abstention (Peniston and Kulkosky, 1989). is combined treatment cameto be known as the Peniston protocol. e same authors further applied alpha-theta in the treatment of Post Traumatic Stress Disorder (), reporting that the useof hypnagogic imagery was used to reveal repressed traumatic memories during talktherapy.
Over the next ten years, independent attempts to describe the specific contribu-tion of alpha-theta in relation to the other components of the Peniston protocolwere inconclusive, and subsequent alpha-theta research (but not practice) has aban-doned the Peniston protocol. is has happened in two areas, firstly in clinical re-search (Scott and Kaiser, 1998; Scott et al., 2002, 2005), or in ‘optimal performance’applications that have searched for effects in healthy subjects as they undertakelab-based cognitive or real-world performing arts exercises (Egner et al., 2002; Egnerand Gruzelier, 2003; Egner et al., 2004; Egner and Gruzelier, 2004a; Raymond et al.,2005a,b).
e clinical alpha and alpha-theta literature is reviewed in Appendix A onpage 250, and the optimal performance alpha-theta literature is reviewed in Sec-
35
CHAPTER 1. INTRODUCTION
tion 1.4.3.2 on page 43.
1.3.3 e history of fast-wave protocols
1.3.3.1 in epilepsy
Barry Sterman e second main strand of research was pioneered by BarrySterman’s research laboratory investigating operant conditioning in cats (Roth et al.,1967; Sterman and Wyrwicka, 1967; Wyrwicka and Sterman, 1968). At the time, the correlates of sleep onset had begun to be investigated, and Barry Sterman and hiscolleagues used measurements to compare sleep to Ivan Pavlov’s proposed state of‘internal inhibition.’¹
Cats were initially taught to gain food rewards by pressing a lever. en a toneacting as a ‘conditional stimulus’ was gradually associated with absence of reward:pressing the lever when the tone sounded prevented reward and prolonged the tonesound; the cats would have to use internal inhibition to prevent the lever pressingresponse until the tone stopped. However, unlike Pavlov’s dogs, the cats respondedby assuming a motionless posture, much like that of hunting cat waiting to attack (seeFigure 1.3). e correlate of this response was the appearance of a distinct rhythm(12–20 Hz with spectral power peaking at 12–14 Hz) over the sensorimotor cortexleading the authors to label it the Sensorimotor Rhythm (). ey also observedthat it was similar to spindles observed in and suggested that theelicited state of internal-inhibition did have similar physiological properties to sleep.
Noting that Kamiya (1962) had previously discussed self-regulation of the alpha rhythm, Sterman then used production in place of lever pressing and foundit could be elicited voluntarily to obtain food Wyrwicka and Sterman (1968) (seeFigure 1.4).
In addition to discovering and that it could be self-regulated by cats, Stermanalso found that training could increase the epileptic seizure threshold by reducingcortical excitability. is discovery occurred when the cats that had participated inearly studies were amongst those recruited into an experiment investigating theepileptogenic properties of rocket fuel. Sterman found that cats who had previously
¹Pavlov proposed that when conflicting conditioned responses are simultaneously elicited (i.e. re-ward and punishment), the organism enters a state of internal inhibition identical to sleep onset.
36
CHAPTER 1. INTRODUCTION
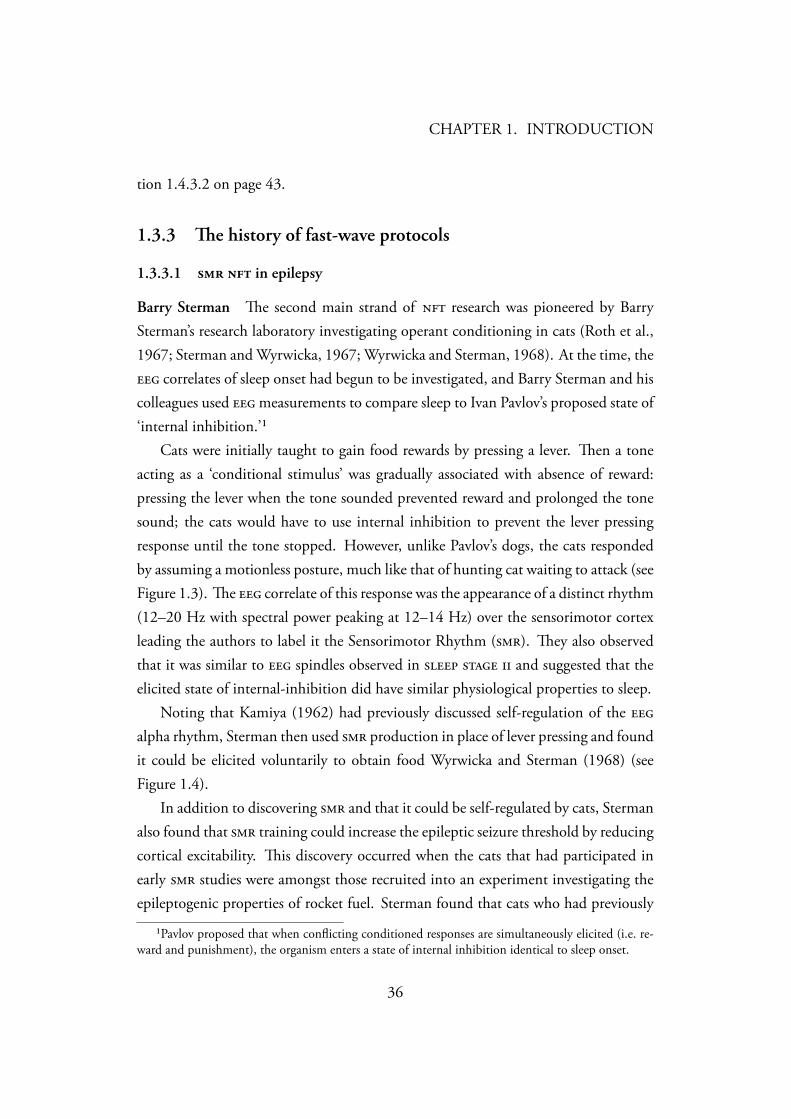
Figure 1.3: Bipolar recordings from sensorimotor (coronal) and parietal(marginal) cortex in a cat during alert motionless waking behaviour and quiet (non-) sleep — Sterman et al. (1970). When cats were trying to suppress a conditionedresponse, the signature over the Sensorimotor cortex resembled that of ‘sleep spin-dling.’ He termed it the Sensorimotor rhythm due to its specific location in thebrain.
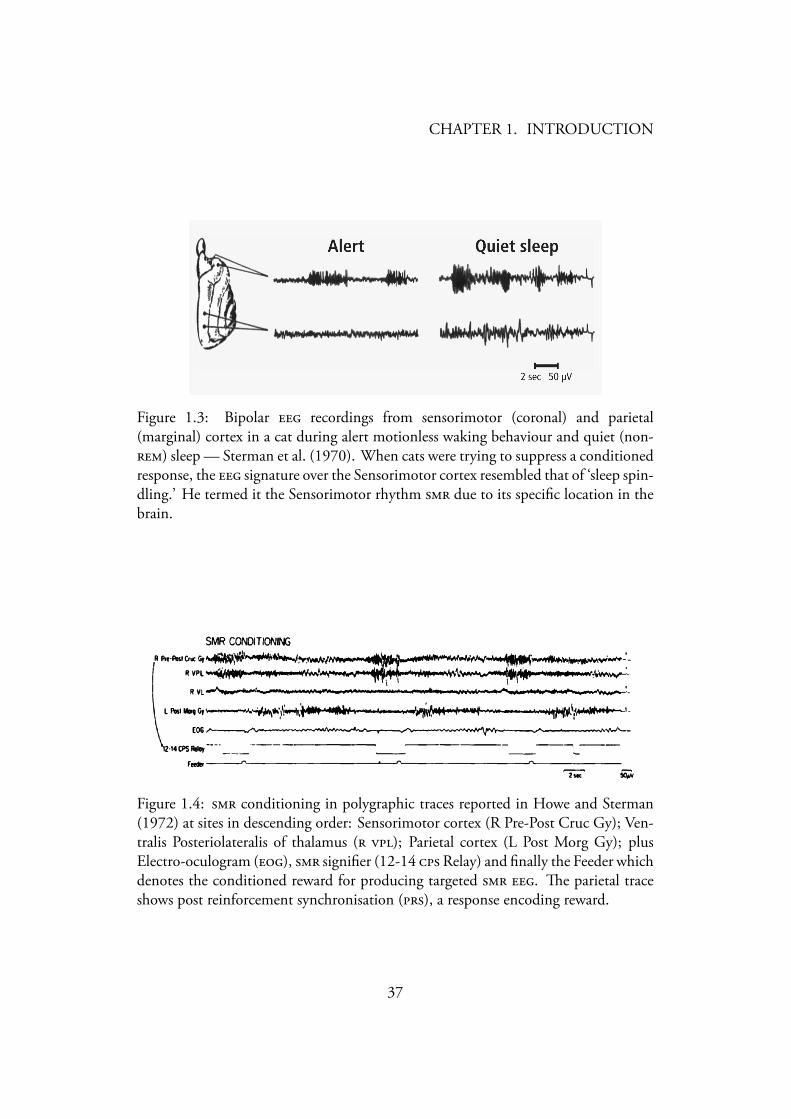
Figure 1.4: conditioning in polygraphic traces reported in Howe and Sterman(1972) at sites in descending order: Sensorimotor cortex (R Pre-Post Cruc Gy); Ven-tralis Posteriolateralis of thalamus ( ); Parietal cortex (L Post Morg Gy); plusElectro-oculogram (), signifier (12-14 Relay) and finally the Feeder whichdenotes the conditioned reward for producing targeted . e parietal traceshows post reinforcement synchronisation (), a response encoding reward.
37
CHAPTER 1. INTRODUCTION
learned to regulate had a much higher seizure threshold compared to those thathadn’t (Sterman et al., 1969). Subsequently a member of Sterman’s lab who hadepilepsy volunteered to undergo training, and reported a reduction in seizures,and Sterman went on to conduct a series of studies establishing the clinical efficacyof in reducing epileptic seizure rates in humans (Sterman and Friar, 1972;Sterman et al., 1974; Sterman and Macdonald, 1978; Lantz and Sterman, 1988).
1.3.3.2 /theta in adhd
Joel Lubar In response to Sterman’s findings, a laboratory run by Joel Lubar be-gan to explore applications in relation to cortical excitability in Attention DeficitHyperactive Disorder (). ey modified the protocol to simultaneously elevate whilst reducing theta (4–8 Hz) reporting that this protocol led to reductions inobservations of hyperactive behaviour (Lubar and Shouse, 1976). is protocol wasfurther modified to include the training of higher frequency components in thebeta range (16–22 Hz) in efforts to increase attentiveness in place of regulating motorexcitability. Neurofeedback applications for have since gone on to become themost widely used forms of in clinical and research use today, and the critical liter-ature review will focus specifically on this these. e empirical rigour with which for attention has been tested has recently enabled strong conclusions to be drawn as toits clinical efficacy (Arns et al., 2009), and, as with alpha-theta, ‘optimal performance’applications of have begun to be explored.
e clinical fast-wave literature is reviewed in Appendix B on page 271 andoptimal performance fast-wave , Section 1.4.3.3 on page 58.
1.4 Optimal Performance Neurofeedback
e previous sections briefly reviewed the historical development of what have goneon to become the two dominant training procedures used in Neurofeedback: theslow-wave types used to reduce anxiety, substance use and , and the fast-wavetypes associated with treating epilepsy and .
is section will examine how has come to be applied in healthy subjects,following a brief introduction to the background of for healthy subjects, and a
38
CHAPTER 1. INTRODUCTION
realisation of how the term ‘Optimal performance’ is used to define interventions thatoptmise physiology against impairments occurring under performance conditions.
1.4.1 e background to optimal performance applications of
Despite the majority of research being currently conducted through two broadlydefined protocols, investigators occasionally test novel, mainly clinical applications of including in autism, asthma, coma, tinnitus (Hammond, 2008).
In some cases, researchers have devised new protocols either by training at sitesand/or frequencies based on theoretical considerations or abnormalities detected intopographical diagnostics. Nonetheless, it is slow-wave (alpha-theta) and fast-wave (beta/) protocols that continue to dominate the field, and are the most ex-tensively developed and tested. e ensuing literature review will cover these twoapproaches in depth.
e review will also show how the initial themes of clinical efficacy (which are re-viewed in Appendices A on page 250 and B on page 271) have been extended into themore recent non-clinical applications of in ‘optimal performance’ applications.
1.4.2 Problematising optimal performance
1.4.2.1 e Yerkes-Dodson law and performance anxiety
In physiology, the term optimal performance stems from the Yerkes-Dodson law(Yerkes and Dodson, 1908), which describes an inverse-U shaped relationship be-tween arousal and performance. Increases in arousal predict improvements in perfor-mance up to an optimal level, beyond which performance degrades.
As described in Section 1.3.2 on page 32 Berger (1929) had noted that normalalpha wave activity reduced in intensity during drowsiness or anxiety. Lindsley(1952); Stennett (1957) then proposed that alpha production might be related tophysiological and anxiety according to the Yerkes-Dodson law and Kamiya (1962)tested augmenting alpha regulation as a possible means of optimising the neu-rophysiology of anxiety. As has been demonstrated, the reports of Orne and Wilson(1978) and Plotkin and Rice (1981) contested the inverse-U shaped relationship be-tween alpha and anxiety. Despite this, the idea that neurophysiological awareness
39
CHAPTER 1. INTRODUCTION
can be learned and regulated to support the execution of a given task is still worthyof investigation. In the current work both the alpha-theta and protocols are ex-plored as possible ways of optimising music performance against the impairing effectof performance anxiety by training neural activity underlying spontaneous emotionalcreative expression and motor performance respectively.
1.4.2.2 Stage fright
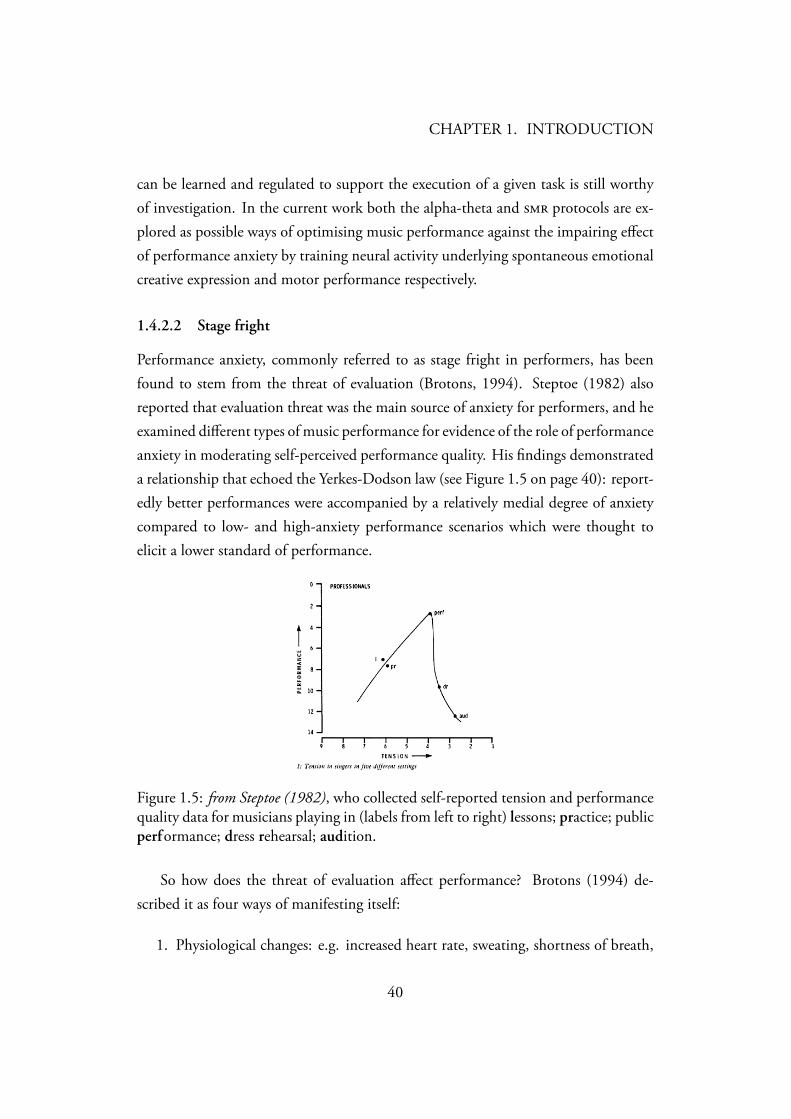
Performance anxiety, commonly referred to as stage fright in performers, has beenfound to stem from the threat of evaluation (Brotons, 1994). Steptoe (1982) alsoreported that evaluation threat was the main source of anxiety for performers, and heexamined different types of music performance for evidence of the role of performanceanxiety in moderating self-perceived performance quality. His findings demonstrateda relationship that echoed the Yerkes-Dodson law (see Figure 1.5 on page 40): report-edly better performances were accompanied by a relatively medial degree of anxietycompared to low- and high-anxiety performance scenarios which were thought toelicit a lower standard of performance.
Figure 1.5: from Steptoe (1982), who collected self-reported tension and performancequality data for musicians playing in (labels from left to right) lessons; practice; publicperformance; dress rehearsal; audition.
So how does the threat of evaluation affect performance? Brotons (1994) de-scribed it as four ways of manifesting itself:
1. Physiological changes: e.g. increased heart rate, sweating, shortness of breath,
40
CHAPTER 1. INTRODUCTION
shaking, numb fingers, clammy hands, dry mouth, upset stomach, headache,dizziness, nausea, and diarrhoea.
2. Psychological/emotional conditions: e.g. exaggerated feelings of apprehension,fear of failure, irritability, and panic.
3. Cognitive problems: e.g. loss of confidence, lack of concentration because ofworries about the situation, memory lapses, and inability to infuse life andcolour into the music (Hingley, 1985).
4. Behavioural changes: e.g. lips moistening, knees and hands trembling, armand neck stiffness, shoulder lifting, and deadpan face.
e potential for optimising neurophysiology with to mitigate against theabove symptoms can be defined according to the two training protocols currentlybeing explored:
reat and creative behaviour In applying the alpha-theta protocol, performanceoptimisation is defined as a means of regulating and thereby sustaining under threat,the neural processes that form spontaneous emotional responses (see Section 1.5.1 onpage 72 for the working definition of creativity) against the drive for enhanced sensoryprocessing. It has already been found that evaluation threat hinders performance on adivergent thinking task (Chamorro-Premuzic and Reichenbacher, 2008), and it mayalso be the case that the spontaneous emotional type of creativity is also diminishedby this threat in less experienced performers (Kokotsaki and Davidson, 2003; Vuustet al., 2010).
e debilitating effect of fear on behaviours contributing to creativity are hypoth-esised to stem from a fight-or-flight type response, in which the signal-to-noise ratio israised to increase sensory information processing capacity in a threatening situation —conversely, a creative response is thought to stem from distributed neural processesthat take longer as they draw from more far reaching semantic networks (Heilmanet al., 2003).
reat and motor performance In applying the protocol, optimal performanceis defined as a means of mitigating against fear related impairments to the motor re-sponse. Given that Sterman and Friar (1972) used the protocol to suppress epileptic
41
CHAPTER 1. INTRODUCTION
seizure, it may also be plausible that fine motor control, such as playing a musicalinstrument or singing, could be optimised against the impairment related to fear in-duced shaking for example. Impairments may differ according to the level of skill ac-quisition and expert music performers may have developed higher tolerance to stagefright so that they can actually benefit from it (Kokotsaki and Davidson, 2003; Vuustet al., 2010), whereas novice musicians may be more likely to suffer motor impair-ments without having developed such coping mechanisms.
1.4.2.3 Novice performance
As well as differentiating performance based on fear, skill acquisition is another factorthat may be optimised by regulating neurophysiology.
Trained musicians are known to have highly developed interactions between audi-tory and motor processing in the brain, and incoming auditory stimuli can automat-ically evoke finger movements in pianists (Haueisen and Knösche, 2001), and expertmusicians have also been found to be able to block stimulus driven sensory informa-tion in an improvising task (Berkowitz and Ansari, 2010). Whether the sensory-motorlink can be optimised by as well as sheer practice is a relatively new question, butRos et al. (2009) reported that optimised perceptuomotor skills in novicemicro-surgery. Novice musicians then, present another group whose sensory motorskills may be considered in relation to the sensory motor optimisations explored in .
1.4.2.4 Motor creativity
Brennan (1982) looked for inter-relationships between measures of ‘Divergent think-ing’ and perceived creativity ability in dance. As Gorder (1980) had previously foundwith music creation, no real relationship existed, leading Brennan to conclude thatthe cognitive behaviours contributing to ‘Divergent thinking’ were distinct from “…divergent production in dance.”
Considering that stage-fright has been argued to manifest differently in effectingcognitive and motor performance, and that spontaneous aspects of music performancesuch as jazz improvising trigger sequences of implicit procedures rather than explicitcortical representations (see Sections 1.5.3.3 (p.87) and 5.2.4 (p.206)) Brennan’s dis-
42
CHAPTER 1. INTRODUCTION
tinction of creativity in motor production may be plausible. is then invites theresearch question “Based on Dietrich’s (2004a) attempts to make creativity tractable,can creativity be further distinguished into explicit (higher-order cognitive responses)and implicit (reflexive motor responses) types?”
1.4.3 Review of optimal performance applications
1.4.3.1 Comparing neurofeedback studies
In order to be able to systematically compare different neurofeedback studies, thefollowing aspects of each publication will (where possible) be evaluated: (a) theeffect of neurofeedback on the (b) the effect of neurofeedback on an outcomemeasure (c) evidence of covariance between the above, in order to demonstrate thatthe mechanisms governing changes in both are associated.
1.4.3.2 Slow-wave neurofeedback
e criticism of clinical alpha-theta training During the course of the study ofclinical applications of the Peniston protocol (which combined alpha-theta withthermal biofeedback and guided hypnagogic imagery — for a review, see Appendix Aon page 250), a number of critical points were raised that cast doubt on the neces-sity of its alpha-theta component in promoting therapeutically insightful hypn-agogic and imagery. Lowe (1999) and Moore et al. (2000) found that membersof relaxation control groups modulated the theta/alpha (t/a) ratio just as effectivelyas those receiving alpha-theta training. ese findings apparently confirmed the as-sertion by Sterman (1996) that alpha-theta feedback might not train a distinct thetastate as proposed by Green and Green (1977) and Peniston and Kulkosky (1989)but rather “facilitates a functional transition towards sleep.” Sterman concluded thatwhilst alpha-theta feedback may promote hypnagogia in practice, it does not bring itunder operant control.
A renewed emphasis on alpha-theta and creatvity Perhaps because of the difficultiesencountered by some replications of the Peniston studies, subsequent investigations ofalpha-theta training have returned to the earlier theme of associations between theta
43
CHAPTER 1. INTRODUCTION
and creativity (Green et al., 1972; Hall, 1977). Green had observed in two casesthat ‘reverie’ accompanying theta production was associated with the manipulationof images leading to the creative synthesis of ideas and integrative experiences. Hallconducted follow-on work with 26 male college students, who apparently learned howto raise occipital alpha and theta waves, although no details of measurementswere documented. Hall’s report did however describe the content of the students’hypnagogic imageries, which centred on their relationships, their self-regard, and theircollege work. Hall additionally observed that 20 of the students associated extendedtheta training with integrative experiences, commenting on the psychological benefitsof the creative handling of these imageries.
Despite the anecdotal nature of Hall’s (1977) two reports, they did pose thetestable empirical question that theta, hypnagogia and creativity might be linked, andsince the turn of the century this three-way link has become the rationale for testingapplications of alpha-theta training in healthy populations. Subsequent work in thisarea has investigated the electrophysiological effects of alpha-theta (Egner et al.,2002, 2004; Egner and Gruzelier, 2004a), its association with hypnagogic imagery(Boynton, 2001), and its effects on behavioural, cognitive and affective measures inhealthy adults (Boynton, 2001; Egner and Gruzelier, 2003; Raymond et al., 2005a,b).Each of the relevant studies will be reviewed in the remainder of this section.
Alpha-theta literature In the first controlled experiment attempting to expand onprior associations between in alpha-theta training, hypnagogia and creativity Boyn-ton (2001) explored the effects of the alpha-theta protocol by comparing it to an eyesclosed relaxation control condition on measures of hypnagogic and a psychome-tric measure of creative behaviour.
Boynton’s participants were 62 in number, 29%/71% male/female, had a meanage of 46, and were rated as healthy on clinical measures of and anxiety. Partici-pants were randomly allocated to treatment (n=30) and control (n=32) conditionsupon entry to the study, and went on to attend weekly 20-minute training sessions for8 weeks in which they reclined in comfortable chair with their eyes closed. Trainingsessions were conducted in groups of between two and four people. All participantshad alpha (8–12 Hz) and theta (4–8 Hz) frequency bands recorded from Pz, and wereshown visual feedback of their at the end of each session. Only participants
44
CHAPTER 1. INTRODUCTION
received real-time audio feedback, which consisted of alpha and theta mapped midiaudio signals whose pitch modulated in line with fluctuations in signal amplitude.No details regarding instructions given to participants were reported.
ree measurements designed to identify hypnagogic per session were usedin this study; the t/a relationship was expressed as a proportion of their differencerelative to their sum (theta − alpha)/(theta + alpha).² In addition to the overallper-session measure of the t/a relationship, Boynton also measured the percentage oftime spent in crossover (time where theta was greater than alpha), and finally the depthof crossover, expressed as the value of theta minus alpha during periods of crossover.
Creativity was measured with the Torrance Tests of Creative inking (Torrance,1974) and the Alternate Uses Test () (Guilford, 1978). Both these tests are com-prised of sub scales measuring fluency, flexibility and originality. In addition to opera-tional measures of creativity, Boynton collected pre and post intervention assessmentsusing the Friedman Well-Being Scale (Friedman, 1994), on the basis that creativityand well-being co-vary (Rogers, 1954; Maslow et al., 1963).
e results section of Boynton’s report does not include any data stating sim-ply that there were no significant changes in any of the measures used, althoughit is not clear what comparisons were made in analysing the data. e author doesremark that participants were able to attain light to deep hypnagogic states in allrecordings made, which implies that one of the measures made was of within-sessionchange. e exclusion of any data makes it impossible to compare Boynton’sreported findings with those of previous controlled alpha-theta studies. She goes onto remark that control participants exhibited deeper measures of crossover than subjects, which appears to corroborate Sterman’s (1996) critique, that the ability ofalpha-theta training to sustain early hypnagogic in practice rests on the presenceof interruptive feedback that prevents progress into deeper sleep, and not the instru-
²Simple ratios (t/a, beta/theta) are commonly used in neurofeedback protocols as relative measuresare less sensitive to inter-session differences in uncontrolled factors that modulate absolute ampli-tudes. Boynton criticised the use of simple ratios however on the grounds that they are not symmetricalaround the point of equality, and can lead to misleading information when session ratios are averagedacross a large number of data points; by using theta as the numerator and alpha as denominator in afraction, at times when alpha is greater than theta, the expressed value will be somewhere between 0and 1, whilst when alpha is less than theta, values can range infinitely upwards from 1 and can createthe impression that the difference is far greater than it is. Despite this, it is rarely that t/a ratios exceeda value of 2, so Boynton’s revised measure wouldn’t result in substantially different results.
45
CHAPTER 1. INTRODUCTION
mental conditioning of a distinct theta state. is finding may also bear some relationto that of Moore et al. (2000) in which the occurrence of imagery was found to beinversely related to the degree by which theta was larger than alpha, and Lowe (1999),who found that participants receiving sham reported more imagery.
Group differences on measures of creativity were reported, and the author statedthat groups were neither significantly different on pre, post or change measures offluency, flexibility or originality. Boynton did however find that as a whole, the pop-ulation sample improved significantly on measures of flexibility in the , suggestingthat general relaxation therapy may benefit creativity, although this change may resultfrom test-familiarity in its second instance. Well-being changed in a similar way, withincreases in all participants being reported.
e study by Boynton (2001) represents the largest controlled study of alpha-theta training to date, based on a population sample of 62 healthy adults. Despitethis promising start, a number of issues undermine the ability to draw clear conclu-sions from this research. Whilst it is reported that groups of 2–6 people receivedthe intervention each week, the effect of variations in pattern of attendance and laterabsenteeism are not elaborated. e author acknowledged that post-training groupdiscussions varied a great deal, and may have impacted on later test measures in uncon-trolled ways. It was further revealed that a range of background music accompaniedtraining sessions, which again may have confounded the results of the study, and thata series of lectures given before the trial might have raised the possibility of placeboeffects.
Overall, the experimental design appears to have a number of limitations that mayblur its ability to draw specific conclusions regarding the effect of alpha-theta orgeneral relaxation on creativity and well-being. However, the picture that emerges thisand the other turn of the century alpha-theta studies is that when an attempt is madeto control for the effects of relaxation or placebo, the effect of alpha-theta trainingitself becomes practically indiscernible.
e next investigation into the alpha-theta protocol sought to resolve the ambi-guities highlighted by previous studies that controlled for relaxation. In addition toincluding a suitably relaxing sham condition, the study by Egner et al. (2002) alsodocumented a much closer analysis of the by examining previously unexploreddifferences in temporal dynamics of components recorded during training.
46
CHAPTER 1. INTRODUCTION
A population sample of 18 undergraduate medical students (6 females and 12males, mean age 23) participated in this study, and were randomly allocated intoequal sized groups of 9. Each participant received 5 training sessions lasting 15 min-utes, preceded by a 2-minute period in which initial alpha (8–11 Hz) and theta (5–8Hz) thresholds were measured at Pz. e intervention was completed over a two-weekperiod. During training experimental participants sat in a reclining chair with theireyes closed and listened to continual feedback that faded between a babbling brookif alpha amplitude was greater in relation to baseline measures than theta and oceanwaves if theta was greater in relation to baseline thresholds. After baseline amplitudethresholds had been set to ensure both bands exceeded the level 50% of the time,the experimenters manually adjusted thresholds for both bands during the remain-der of the session to ensure alpha and theta exceeded threshold 30 and 65% of thetime respectively. During training participants were instructed to “relax very deeplyin order to achieve an increase in the amount of theta sound representation,” whileavoiding falling asleep. e control participants had their recorded, but receivedpre-recorded feedback from a typical training session, in which alpha feedback pre-dominated at the start of the session and theta towards the end.
As well as measuring parameters the authors were interested in determin-ing whether any differences would be accompanied by alterations in subjectivemeasures of activation. is was measured before and after each session using theActivation-Deactivation Adjective Checklist (-; (ayer, 1967)) which incor-porates four scales: General Activation (e.g. lively), General Deactivation (e.g. calm),High Activation (e.g. tense), and Deactivation-Sleep (e.g. drowsy).
e experimental hypothesis was that the group receiving real alpha-theta feed-back would display higher t/a ratios and steeper t/a ratio increases within, and betweensessions, and that these trends would be accompanied by differences in subjective mea-sures of activation.
e changes of alpha and theta amplitudes within sessions were analysed by divid-ing each session into a series of 3-minute blocks, and comparing the mean t/a ratio ofeach period. Between-sessions comparisons were based on the mean t/a ratio of eachsession.
e two groups were assessed and compared on their mean t/a ratios and within-session as well as between-session t/a regression by 2 × 5 (Real vs. Sham Feedback
47
CHAPTER 1. INTRODUCTION
Group × Period/Session Levels) mixed-effects s. - variable scores wereanalysed in 2 × 2 (Before vs. After × Contingent vs. Mock Feedback Group) mixed-effects s, and subsequently - change scores were correlated with -measures.
e within-session analyses demonstrated that the group increased the t/aratio linearly whilst the mock feedback group did not. is resulted in significant dif-ference between group t/a ratios in the last two periods of an average session. Sessioncomparisons revealed that sessions 2 and 4 exhibited significantly greater t/a ratios inthe group. On comparisons of pre/post subjective measures of activation, bothgroups reported significant reductions in activation and increases in deactivation dur-ing an average session — with no differences between groups.
e experiment by Egner et al. (2002) is the first to isolate protocol specific effectsof alpha-theta training on the : In a non-clinical sample, and within an averagefeedback session from a series of 5, the t/a ratio can be progressively raised to levelsthat can not by controls. e linear rate at which the training ratio was raised wasinterpreted as evidence of a learning process in which subjects increasingly gainedvolitional control of the t/a ratio. Similar evidence of linearity was not however foundin the between-session analyses, although variation in tiredness might have affected levels in ways that were not controlled for in the study.
e finding that both groups reported significantly lower activational states aftertraining reveals a mismatch between the participants’ objective and subjective data.One reason all participants may have felt less activated following sessions was that theirinstructions were to relax deeply, and their responses to questions on activation mayhave reflected this expectancy. e fact that participants were not informed whethertheir feedback was real or from a previous recording may have also produced similarlevels of expectation between groups. In terms of further attempting to isolate theeffects of alpha-theta training on subjective experience, the authors suggest that asubjective measure of physiology might not be able to capture small yet significantchanges in physiological activation. e disparity between the study’s objective andsubjective measures is further demonstrated by the lack of correlation between changesin t/a ratio and - scores. Again, this indicates either that the reported relaxationin both groups may have been confounded by the effect of expectation on subjectiveexperience, or that subjective activation is not a close enough approximation of alpha-
48
CHAPTER 1. INTRODUCTION
theta effects in terms of personal experience.e main question concerning whether this study discloses a specific effect of
centres around its use of sham feedback as a control condition. Some clinical practitioners have rejected the use of sham feedback on ethical and validity grounds.Kotchoubey et al. (2001) reported on an epilepsy study where both experimenters andpatients were initially blind to the treatment modality, treatment or alpha trainingcontrol. erapists and patients quickly detected that alpha training was not affectingseizure rates, and refused to continue what they felt was an unethical study. Kaiser andOthmer (2000) reported that sham feedback is easily identifiable as such, stating thatit does not constitute a scientifically valid comparison — and proposes instead that aviable alternative is used as a control. Several recent randomised controlled trials of have used such a viable (‘active’) control, contrasting with treatments such as feedback or clinically effective attention training software (Bakhshayesh, 2010;Gevensleben et al., 2009b; Holtmann et al., 2009). In the study of healthy subjectsby Egner et al. (2002), ethical concerns were not as stringent however, as there wereno apparent negative implications of receiving placebo training. In terms of groupawareness, the authors stressed that both groups had doubts whether the feedback theymonitored was a sham, and so the use of pre-recorded session data appears to representa good control. e fact that the experimenters were not blind to participants’ groupmembership may still have affected the outcome of the study however.
By demonstrating protocol specific changes in the t/a ratio, this study contra-dicts the findings of Moore et al. (2000); Boynton (2001) who found that t/a ratiosincreased to a greater extent in biofeedback or simple relaxation than in alpha-theta . is contradiction may arise from a number of possible differences in thestudies; firstly, the previous studies used viable alternatives that had been previouslydemonstrated to support deep relaxation. Mock feedback on the other hand had notbeen shown to actively promote relaxation, it may even be that subjects listening tomock feedback were not able to reduce their level of arousal as they were continu-ally frustrated in their attempts to map feedback to subjective experience, as has beensuggested by Kaiser and Othmer (2000). A second difference between the studies isthat whilst Moore and Boynton compared entire sessions, this study found that re-liable differences only emerged towards the end of a session. is more fine-grainedtemporal analysis of change during constitutes an important step forward in
49
CHAPTER 1. INTRODUCTION
attempts to isolate effects on physiological change.e dynamic changes occurring within and between alpha-theta were explored in
a further study (Egner and Gruzelier, 2004a) which sought to further elucidate the changes underlying shifts in the t/a ratio. e study also analysed changesin alpha-theta training based on training contingent on activity at a frontal site(Fz) in comparison to that of a parietal one (Pz). eta activity at frontal midline sitesis of interest as it is distinct from sleep electrophysiology, and is thought to emanatefrom hippocampal-cortical projections implicated in higher cognitive process includ-ing working memory performance (Klimesch, 1999; Burgess and Gruzelier, 2000).e authors hypothesised that whilst alpha-theta training had hitherto been carriedout at occipital and parietal sites, the training effects may have manifested in alter-ations to frontal theta, and so tried to train this directly.
e methods of the experiment were largely identical to the previously reviewedstudy of 5 alpha-theta training sessions (Egner et al., 2002), as some of the participantdata (n=10) was taken from this study. Additional data from a study in which partic-ipants (n=28) received 10 sessions of alpha-theta training, was also included (Egnerand Gruzelier, 2003). Previously undocumented data of alpha-theta training at Fz wasincluded from a population of undergraduate students at Imperial College, London(n=10).
e study employed a correlational analysis comparing progressive increments intraining time to those in the t/a ratio during an average session. A significant associ-ation was found only in the group receiving 10 sessions of alpha-theta training at Pz,although a polynomial (linear) trend for change was observed in sessions 1–5 in bothstudies. Changes in the t/a ratio were described by decrements in theta amplitude andlarger decrements in alpha amplitude. is common reduction in amplitude demon-strates a different signature to that seen in sleep onset studies, which report that is expressed by decreases in alpha and increases in theta power, withboth frequency bands increasing in absolute power during stage 2 sleep (Morikawaet al., 1997; De Gennaro et al., 2001). In the light of this difference, it seems that thisstudy might lend some weight to earlier claims by Green and Green (1977) and Penis-ton and Kulkosky (1989) that alpha-theta promotes a physiological state distinctfrom sleep onset. Another interpretation is that the falling amplitudes in both bandsrepresent the of wakefulness prior to sleep onset (De Gennaro et al., 2001).
50
CHAPTER 1. INTRODUCTION
Between session analysis also showed a differential effect of alpha-theta train-ing in significantly raising theta amplitudes over the course of 10 sessions of trainingat Pz. is difference was found by comparing the final 5 sessions to the preceding 5,and indicates that had a long-term effect of promoting theta production.
e experimental alpha-theta conducted at the Fz site revealed that increasesin theta production occurred both within and between-sessions, leading the authors todraw a distinction between generators of theta activity recorded at frontal and parietalsites, concluding that Pz based alpha-theta training does not influence frontal thetacircuitry as had been provisionally speculated.
Just as the study showing that t/a ratio increases were not related to subjectivefeelings of deactivation (Egner et al., 2002), this study provides further evidence thatthe effects of alpha-theta on the are distinct from those observed in normalsleep physiology. e observed reduction of within-session theta and alpha amplitudesin Pz training suggests that on average participants were in a state of wakefulnessprior to early sleep as expressed by a general fall in spectral power and a relativelygreater fall in alpha power (Dumermuth et al., 1983). Overall, the study continues tosuggest that although a 15-min alpha-theta training session may accelerate the processof wake-sleep transition, and does so increasingly over the course of training, it doesnot on average provide scope for to occur widely.
A third study looking at electrophysiological change related to alpha-theta wasdocumented by the same authors. ey measured resting at a range of scalp lo-cations prior to and following two alpha-theta interventions (Egner et al., 2004).Participants (n=22/8) in the first/second experiments of Egner and Gruzelier (2003)received alpha-theta procedures identical to those described in the two previouslyreviewed studies,³. Pre/post training measures of resting spectral were recorded at28 scalp locations whilst participants remained with their eyes closed for 3 minutes.
In both experiments, post-training measures of prefrontal beta1 (15–18 Hz) werefound to be correlated with measures of alpha-theta ‘learning,’ indexed as “the slopeof regression across sessions of the correlation between theta-to-alpha amplitude ratiosand the number of 3-min periods within each session.” is measure represents anattempt to describe the changes in within-session dynamics across-sessions. e re-
³e study also examined the effects of training at c4 and beta1 c3 on resting these findingsare discussed in Section 1.4.3.3 on page 58.
51
CHAPTER 1. INTRODUCTION
ductions in resting measures of frontal beta following alpha-theta were interpretedas indicating reduced vigilant arousal and anxiety, and therefore possibly explained theanxiety reductions previously reported in a study of Vietnam veterans suffering withcombat related post traumatic stress disorder () Peniston and Kulkosky (1991).is interpretation was supported by the evidence that is characterised by exces-sive frontal beta1 and beta2 activity (Begic et al., 2001), and the authors concludedthat the clinical efficacy of alpha-theta may lie in its ability to down-regulate thiscomponent of resting .
e authors of the three previously evaluated electrophysiological studies also con-ducted a further alpha-theta study that extended the scope of the investigation be-yond physiology into a previously unexplored domain: music performance (Egnerand Gruzelier, 2003). At the outset, the rationale of the study was to determinewhether clinical protocols (alpha-theta, and beta1) could effect changes inecologically valid measures of behaviour in healthy music students. e participantdata was taken from the same source as the previously reviewed study, and was com-prised of two separate experiments. In experiment 1 participants (n=22) receivedtraining in a combined /beta1 protocol, followed by an alpha-theta protocol, asub-sample of which (n=12) then received training in physical exercise and mentalskills training. A separate group (n=12) were assigned to a no-training control group.In experiment 2, a different cohort of students were randomly allocated to one of sixtraining groups: alpha-theta neurofeedback (n=8), beta1 neurofeedback (n=9), neurofeedback (n=9), physical exercise (n=16), mental skills training used in a sportpsychology consultancy (Williamon, 2004) (n=9), and Alexander technique training(n=10).⁴
Before and after intervention all participants were filmed performing two musicalpieces of their choice. e footage was evaluated by 2 and 3 independent raters inexperiments 1 and 2 respectively. Panellists were blind to order of performance andexperimental grouping, and scored performances on a series of criteria using a 10-point scale. e criteria were adapted from examination standards used in the RoyalSchools of Music (Harvey, 1994). Self-reported measures of state-anxiety (Spielberger
⁴e Alexander technique refers to a system of kinaesthetic education aimed at avoiding exces-sive postural tension, and constitutes the most widely practised behavioural training in professionalorchestral musicians.
52
CHAPTER 1. INTRODUCTION
et al., 1983) were collected prior to performances.In experiment 1 only participants who received the neurofeedback protocols ex-
hibited improved performance after the intervention. ey improved on all measures,and the improvements correlated with the learning index described in the previ-ous study. In experiment 2 participants receiving alpha-theta training alone improvedon ratings in the categories of ‘Musicality’ (‘stylistic accuracy,’ ‘interpretative imagina-tion’ and ‘overall musicality’) and ‘Overall’ scores. In both experiments, it was foundthat all participants reported lowered state-anxiety in the second performance.
In combination, the above findings represented the first evidence of effectson real-world behavioural measures in a healthy population. Experiment 1, a within-subjects correlational design, disclosed a relationship between increases in technical,musicality and communication measures of music performance and t/a ratios in train-ing. Experiment 2, a between-groups design, observed improvements in musicalityand overall ratings of performance in an alpha-theta group equivalent to a class ofdegree honours or more. e results of experiment 2 did not find the previouslyobserved correlation between changes in t/a ratios and music performance to be repli-cable, which suggests that prior training in /beta1 protocols may have playeda part in previous results. A similar sequence of /beta followed by alpha-theta has been reported to increase treatment-participation and drug-abstinence in a popu-lation of mixed substance users (Scott et al., 2005), which suggests that prior beta and may affect the subsequent response to alpha-theta neurofeedback. Overall,the fact that a more closely controlled experiment led to significant post-alpha-thetaimprovements under the heading of musicality, which included measures of interpre-tative imagination, led to further associations between alpha-theta and creativity(Gruzelier and Egner, 2005; Gruzelier et al., 2006). is directly informed the ap-proach of the current thesis, which is using alpha-theta in attempts to isolate andmodulate the proposed relationship between hypnagogia and creativity.
Following the series of alpha-theta studies demonstrating efficacy in modulat-ing the t/a training ratio, resting frontal beta1, and music performance, members ofthe same laboratory went on to conduct two further studies examining the effects ofalpha-theta on mood and dance performance. In the first of these studies, Ray-mond et al. (2005b) recruited undergraduate medical students (n=12) who scoredhighly on a measure of ‘social withdrawal’. Half the group were given an average of 9
53
CHAPTER 1. INTRODUCTION
× 20-minute alpha-theta sessions similar to those used in the previous 4 reports.However 3 Hz frequency bands were shifted up or down the spectrum accordingto individual differences in the spectral alpha peak (Doppelmayr et al., 1998). participants were instructed to achieve predominance of theta feedback and to useit as a cue to “visualise themselves being the sort of person they most wanted to beand solving problems in the best way possible.” e other half of the sample receivedmock feedback, which consisted of a demonstration session supplied with the software. All sessions started and ended with self-reported measures of mood usingthe Profile of Mood States (POMS) questionnaire (McNair et al., 1992).
e results of the experiment demonstrated training effects on t/a ratios and moodmeasures. Both groups expressed confidence in their ability to control the feedback,indicating that the control group had not detected the placebo. e personality mea-sure used to select participants was also conducted following the intervention, and nochanges in measures of social withdrawal were found. e authors discussed this find-ing in relation to those of Peniston and Kulkosky (1990) who did observe personalityimprovements, concluding that the smaller amount of sessions and the different popu-lations probably confounded direct comparison. Overall, measures of mood indicatedthat real participants exhibited within-group improvements that fell marginallyshort of significance compared to control subjects looking at averaged session data.Measures of within-session parameters disclosed a significant correlation betweenincrements in time and t/a ratios.
In comparison with measures of subjective activation in response to alpha-theta, which didn’t show any difference compared to mock feedback (Egner et al.,2002), this study showed that a mood based measure of the subjective response toalpha-theta can disclose significant changes in self-reports not seen in controls.e improvements approached independence from those observed in a control condi-tion, and confirm the prediction by Egner et al. (2002) that an ‘emotive’ as opposed toan activational report might disclose personal effects more accurately. Unfortunatelythis study did not document any correlational analysis between the physiological andexperiential measures, so whilst this is a promising result, it remains unclear as towhether the changes were linked.
Raymond et al. (2005a) published another alpha-theta report including theresults of a preliminary investigation into its application in a novel area: dance per-
54
CHAPTER 1. INTRODUCTION
formance. In following from the previous work on music performance (Egner andGruzelier, 2003) this study set out to determine whether alpha-theta benefits mightextend into other areas of performance art.
Undergraduate students in a dancing team were recruited, and after adjusting forstudy dropouts, the sample was comprised of an alpha-theta group (n=6), a heart-rate variability () biofeedback group (n=4), and a no-training control group (n=8). training was conducted as in the previous study, although participants were in-structed to “visualise themselves dancing in the way they most wanted to dance” uponhearing theta feedback. e group had the goal of breathing at their ‘resonant’frequency,⁵ and this intervention was included as a suitable alternative performance-enhancing treatment as it had previously been found to reduce anxiety and improveperformance in gymnasts (Bessel and Gevirtz, 1998).
Prior to and following the experiment, participants were filmed dancing in pairs,and an order and group blind panel of two dance adjudicators assessed the footage.
e results of the study demonstrated that both biofeedback interventions im-proved the overall measure of dance performance relative to no-training controls, butthey were not significantly different from each other following the intervention. Mea-sures of biofeedback ‘learning,’ i.e. the correlation between time and t/a ratio or increase did not reach significance on within-session measures and were not docu-mented for between-session measures. e authors reported no correlation existedbetween physiological and performance changes.
As a preliminary study with a small sample size, a potentially confounding dropoutrate (n=6), the results of the study do not generalise to the wider population. Addi-tionally, at the end of the study, the three groups had each had differing amounts ofdance practice, and this was corrected by dividing the change in performance ratingsby the amount of practice each participant had. e resulting figure may be a suitablecorrection to apply, as it effectively lowered the music change scores of the controlsand group relative to alpha-theta. However, such an offset does assume that alldance practice sessions confer the same improvement on performance.
Despite the difficulties within operational comparisons, the design of the study
⁵e resonant frequency rate of breathing results in the largest swing in heart rate. In humans theresonant frequency depends on the individual, and usually lies between four and seven breaths perminute
55
CHAPTER 1. INTRODUCTION
represents a significant advance in research methodology, as Lowe (1999) hadpreviously called for alpha-theta to be compared not just to no-training controls,but suitable alternatives in efforts to isolate protocol specific effects.⁶
In Raymond et al. (2005a), comparing alpha-theta to both inactive and activecontrols represents a groundbreaking attempt to isolate protocol specific effects inrelation to a feasible alternative intervention. e results did indicate some differencesbetween the two active interventions, with alpha-theta improving measures oftiming and improving those of technique, so these results provide suggestiveevidence that alpha-theta training has protocol-specific effects on performance art.
In reference to the growing body of empirical work that identified effects of alpha-theta , a theoretical investigation into the possible mediators of those effects hasbeen contributed to the literature (Gruzelier, 2009). is paper considers the rangeof documented behavioural and affective responses to alpha-theta training, and thatthese effects extended beyond early associations with hypnagogic creativity. e widersignificance of conditioning theta activity is then considered in the light of the evi-dence that theta correlates not only with posterior in sleep-onset (De Gennaroet al., 2001), but hippocampal-frontocortical working memory encoding processes(Klimesch, 1999). eta also influences attention, (Sauseng et al., 2007) sensori-motor effort and sensory-motor integration (Kay, 2005), and mediates limbic emo-tional and motivational functions (Buzsáki, 2002), and arousal (O’Keefe, 1990).
e wider implications of theta oscillations are included into an integrative frame-work predicated on the basis that theta is paced in two distinct neuroanatomical cir-cuits: “the ascending mescencephalic-cortical arousal system and limbic circuits sub-serving cognitive as well as affective/motivational functions”. ese theta-generatingcircuits project to widely distributed neural connections mediating distributed net-works in the brain, which is interpreted as evidence that theta underlies both neuraland as a result psychological integration between distributed functions.
e effects of training theta oscillations in the cortex, and by association theirsub-cortical pacemakers is rarely investigated directly in humans, and the strongestevidence for the hippocampal pacing of cortical theta has hitherto come from direct
⁶In the literature, this approach has been applied in a number of recent studies followingthe difficulties encountered in mounting double blind placebo controlled trials (for a discussion of theresearch methodology in see Appendix B on page 271).
56
CHAPTER 1. INTRODUCTION
electrode recordings of hippocampal cells in studies of animals (Whishaw and Vander-wolf, 1973). However combined fMRI/ human studies have begun to take placein the 21 century that have been able to accelerate the investigation of brain activityunderlying cortical theta. A relevant result that recently emerged from this line ofinquiry discovered an inverse correlation between frontal theta and the default modenetwork Scheeringa et al. (2008). is network activates during states of defocused-attention, a proposed correlate of creative ideation (Martindale, 1977), which impliesthat hippocampal-frontocortical theta activity does not contribute to the alpha-thetalearning process, and in turn suggests that a different theta pacer contributes to slow-wave . In relation to this distinction, it has been found that frontal theta-to-alpharatio enhancement training was found to modulate the t/a relationship differentlyto the parietal protocol, with theta increments observed over time as opposed to thelesser decrease in theta than alpha (Egner and Gruzelier, 2004a). is suggests thatfrontal theta is generated differently from the form seen in the classic alpha-theta pro-tocol, and is possibly underlined by hippocampal-frontocortical phasic theta burstsaccompanying highly focused concentration (Gevins et al., 1997). Accordingly, thissets the stage for an fMRI study of alpha-theta to take place, which would beable to test the explanatory framework described — in particular by determining thelocation of sub-cortical parietal theta oscillations.
From the current review it can be concluded that alpha-theta specific effects havebeen documented on measures of the t/a ratio in training, post-training measures ofresting prefrontal beta1 , and measures of music and dance performance. Changesin music performance suggested that a possible link between alpha-theta training andfactors influencing creative behaviour may exist due to the isolation of alpha/thetaeffects in measures of musicality. e current thesis seeks to develop this line of inquirythrough further changes in the research methodology incorporating tasks requiringspontaneous music creation behaviours, and though attempts to derive measuresof music performance that might be used in identifying the physiological mediatorsof alpha-theta effects on music performance.
57
CHAPTER 1. INTRODUCTION
1.4.3.3 Fast-wave neurofeedback
As with the optimal performance trials that sought to explore the potential of alpha-theta beyond its clinical applications, the possibilities of training faster elementsof the spectrum in healthy subjects have also been explored.
Motor inhibition as a safeguard against performance anxiety Whilst and betaprotocols were initially conceived of in terms of their ability to normalise patholo-gies, the optimal performance applications have focused more specifically on reinforc-ing specific neural processes under conditions of load – e.g. the performance of a musi-cal task during stage fright induced shaking. For example, high levels of performanceanxiety impair attention and memory according to the Yerkes-Dodson law (Yerkesand Dodson, 1908), which predicts that performance is modulated as an inverse-Ushaped function of arousal. In relation to this, the association between andimproved motor inhibition (Sterman, 1996) and /beta protocols and improvedattentional performance (Lubar et al., 1995) raised the possibility that may beable to mitigate against the affects of performance anxiety on motoric and cognitivetasks.
Fast-wave literature In Section 1.4.3.2 on page 43 experiments on music studentsat the Royal College of Music were evaluated for their effects in terms of alpha-theta, but they also documented effects arising from and beta protocols, which arenow reviewed here.
In the first of these experiments (Egner and Gruzelier, 2001), 22 healthy partic-ipants received a mixed beta1 (15–18 Hz)/ (12–15 Hz) protocol training eachfrequency band at C3/C4 respectively. Training rewards in the form of audio-visualsignals were provided when band activity voltages were more than 0.8 of pre-trainingaverage. If theta (4–7 Hz) and the higher beta2 band (22–30 Hz) values exceededbaseline averages by 1.2 and 1.6 times respectively, then feedback was inhibited. erewere 10 sessions in total.
In this experiment, cognitive performance was measured as attentional perfor-mance on the Test of Variables of Attention () test, and as ‘target detection’expressed by P300 event related potentials (s) in an auditory oddball task.
58
CHAPTER 1. INTRODUCTION
learning was indexed as the number of 3-minute periods within each session that par-ticipants raised training band amplitudes (both absolute and relative to inhibit bandmeasures) above mean amplitudes in the preceding period.
e outcome of the experiment was that commission errors were signifi-cantly reduced, and perceptual sensitivity (a ratio of correct to false responses (Greenand Swets, 1966)) was marginally improved. e learning index was positivelycorrelated with changes in commission errors and perceptual sensitivity, whilst theopposite was true of beta1. Significant target detection improvements in mea-sures correlated positively with both and beta1 learning. Both training indicescorrelated with each other.
e authors concluded that because the learning-outcome associations were in-verted between protocols, this demonstrated their specificity: beta1 elevation was in-terpreted as increasing excitability in the motor cortex, thus increasing impulsivityand commission errors by promoting responsive but error-prone vigilant attention.On the other hand, elevation was found to improve response inhibition, pos-sibly by promoting the inhibitory function of reticular thalamic cells projecting tothe motor cortex. Increases in perceptually driven cortical s were similarly associ-ated with learning in both protocols, indicating that both protocols improved sensoryintegration similarly, despite their contrasting effects on the motor response.
By using the as an attentional measure the authors presented here the firstevidence that attention in healthy subjects can be improved by , extending the ap-plication of and beta1 training beyond the normalisation of attentional patholo-gies. Significant changes in attentional measures were demonstrated and correlatedwith training measures, however it was not documented whether training measureschanged significantly. e study was the first to introduce task-related measures ofcortical activity as a means of evaluating a neurofeedback intervention, and this initself represents is an important advance in experimental methodology. Some com-mentators have observed that differences or pathologies pertaining to attentionmay not be manifest in resting measures of the , which currently predominateover task-dependent measures in trials (Arns et al., 2009). is distinction be-tween resting and task-related measures is even more pertinent in healthy subjects, inwhom cognitive impairments are only predicted to become observable during task-performance itself (Yerkes and Dodson, 1908). us, cognitively demanding task-
59
CHAPTER 1. INTRODUCTION
based measures of attention would be more likely to expose an optimising effect of.
In continuing to explore event related measures of attention, Egner et al. (2004)documented a similar experiment to Egner and Gruzelier (2001). e populationsample was again taken from music students, but here participants were trained inindependent groups as part of the second experiment: (n=9), beta1 (n=8),and a group receiving Alexander technique training (n=8). All interventions werecomprised of 10 sessions lasting 15 minutes each, with (12–15 Hz) and beta1(15–18 Hz) recorded from Cz. As with Egner and Gruzelier (2001), the authors mea-sured and P300 s prior to and following training, and additionally measuredperformance on a divided attention .
Protocol-specific effects were discovered in that training participants exhib-ited increased perceptual sensitivity in performance, as well as reduced omis-sion errors and reaction time variability. Beta1 training participants demonstratedfaster reaction times and increased target detection P300 amplitudes post-training.No changes were shown amongst the Alexander training group. In following Egnerand Gruzelier (2001), these results replicated improvements in perceptual sensitiv-ity associated with previously, and target detection P300 s following beta1training. e additional results indicated a broader attentional effect than inregulating impulsivity alone, whilst beta1 continued to be associated with vigilantarousal, increasing sensory processing speed at the expense of accuracy. e previouscorrelations between learning indices and attentional outcomes were found not tobe replicable in this study, although the independent groups design made it possibleto draw associations in the absence of correlation. is indicates however that priorcorrelation may have been a function of the combined effects of the two protocolson outcome measures, and accordingly justifies the addition of this between-groupsexperiment in disambiguating prior results.
Members of the same laboratory also further expanded the scope of optimal per-formance research by documenting the effects of on semantic working mem-ory performance (Vernon et al., 2003). In a controlled trial, medical students wereallocated to 3 groups of n=10 matched on age, gender and measures of memory recalland attentional performance. participants received either 8 sessions elevating (12–15 Hz) whilst suppressing beta (18–22 Hz) and theta (4–8 Hz), or 8 sessions el-
60
CHAPTER 1. INTRODUCTION
evating theta and inhibiting delta (0–4 Hz) and alpha (8–12 Hz). e latter groupreceived an experimental protocol, hypothesised to improve memory recall byup-regulating theta related long-term potentiation between neurons (Pavlides et al.,1988) and thus mnemonic function. eta activity observed during memory encod-ing (Klimesch et al., 1997) and retrieval (Burgess and Gruzelier, 1997) also supportthe rationale that bringing theta under voluntary control might help to sustain thetaand thus working memory function under conditions that place demands on storageand recall. As with Egner and Gruzelier (2001), training was hypothesised tofacilitate attentional performance. All training was conducted with the Cz electrodeplacement, and a third control group received no intervention.
Somewhat surprisingly the results of the experiment disclosed improvements inmemory performance following training and not theta as had been anticipated. training was also shown to have elevated within-session amplitudes alongsideconcomitant decreases in both theta and beta bands. Attentional performance was alsoimproved to a limited extent in cases. e authors speculated that the memoryimprovements arose from 10–14 Hz oscillations, which overlapped the rangeand underpin fronto-posterior connectivity seen in maintaining sensory informationin working memory (Haarmann and Cameron, 2005). e inability of theta traineesto modulate theta in training or cognitive performance subsequently suggests thata physiological response incorporating theta activity is not as accessible to operantcontrol as the motor response. e authors consider this in relation to the fact thattheta enhancement protocols usually include eyes-closed training, which naturallyelevates theta as a function of cortical deactivation during the wake-sleep transition.In Egner and Gruzelier (2004a) we have already seen how eyes-closed theta trainingat Fz did lead to theta rises across 10 sessions, which appears to confirm Vernon’sinterpretation.
is report does not document inter-session changes – although this is justi-fied on the grounds that within-session measures of are less affected by interfer-ence from uncontrolled factors impacting on the such time of day and time sinceeating. Additionally, the report does not document correlations between training andoutcome measures, although the independent groups design nonetheless supports thenotion that training improved memory whereas no-training controls and an ex-pectation and experimenter contact matched group didn’t.
61
CHAPTER 1. INTRODUCTION
A novel application of the /theta protocol into reading performance was testedin this period that hypothesised that hemispheric dynamics, measured as hemisphericcontributions to word recognition, could be optimised by up-regulating the /thetaratio over the right hemisphere relative to the left hemisphere (Barnea et al., 2005).is experimental application was based on the grounds that (Weems and Zaidel,2004) had disclosed superior right hemispheric contributions to lexical processing.e experimenters trained /theta at central sites in 20 children aged 10–12 years,half boys and half girls. Half of the subjects received C3 training, which was hy-pothesised to impair lateralised lexical performance, and the other half C4 training toimprove it. Training consisted of 20 half-hour sessions over a four-week period.
Training did affect lexical processing differentially between C3 and C4, and in-creased hemispheric independence, although C3 training did not selectively affect theleft hemisphere and C4 training did not selectively affect the right hemisphere.. eauthors also noted unanticipated sex differences: in boys, C4 training improved LHaccuracy, whereas in girls C3 training improved LH accuracy. e authors concludedthat lateralised is effective in changing hemispheric word recognition, and thatcerebral asymmetries differentiated the sexes.
Overall, the results of the study suggest that despite attempts to train specifichemispheric activity, the operant response recruited inter-hemispheric networks, andthat these networks were organised by gender. is is the first neurofeedback studyto consider the operant response by sex, which suggests that protocols might betailored to individual differences in the .
Another approach introduced by Hanslmayr et al. (2005) sought to examine indi-vidual differences in the response by measuring performance on a mental rotationtask dichotomously based on high and low responsiveness to contingencies in theupper 2Hz of the alpha band. A further difference between this and prior studies wasthat comparisons were made following only one training session, and so by comparingresponders to non-responders after a single session, this study introduced a new accel-erated research design to the literature. Although the alpha-band applied here isnot directly relevant to the thesis that follows, this study is included for completeness.
e study recruited healthy students (n=18) who were initially measured on base-line readings of eyes open/closed alpha and theta frequencies at F3, Fz, F4, P3, Pz,and P4. Subsequently they performed a mental rotation task (Amthauer, 1970), then
62
CHAPTER 1. INTRODUCTION
trained eyes-open upper-alpha/theta band enhancement; then performed mental ro-tation; then trained theta/upper-alpha band suppression; and finally performed themental rotation task — the order of training was counterbalanced among partici-pants. is design enabled within-subjects comparisons between alpha enhancementand theta suppression , both of which were hypothesised to increase cognitive per-formance in relation to a previous Transcranical Magnetic Stimulation () study(Klimesch et al., 2003). e feedback was presented visually in the form of colouredsquares that changed between blue and red when training amplitudes were respec-tively low or high in relation to baseline measures of the frequency being trained: thegoal of upper alpha enhancement was to turn the square red, and in theta suppressionto turn the square blue.
e results of the study showed that mental rotation was only improved in onescenario: in upper alpha responders following upper alpha . is improvementcorrelated positively with a significant increase in upper alpha power following upperalpha . e authors also documented tonic enhancements in post-training parietalalpha power during rest and in pre-stimulus measures during task performance. ese findings indicate that upper-alpha training does tend to regulate alpha activity inthe same locations as trained.
e authors discuss the results in relation to performance gains in Egner andGruzelier (2001, 2004b) emphasising that in this case cognitive improvements areseen after a single training session. As with Vernon et al. (2003), attempts to beingtheta under operant control were unsuccessful, although in this case theta inhibitionwas attempted during training.
In evaluating this study, arguably its greatest contribution is to demonstrate thefeasibility of an accelerated testing procedure that sees groups split not by randomisa-tion but by responsiveness. is group selection method does affect generalisationof the effects to the wider population however, nonetheless, the fact that cognitiveand differences can be observed following a single intervention indicates that inthe design of pilot studies for example, a rapid research methodology can be imple-mented to explore novel applications. is is also an important study in that itnot only documented changes in , but also during subsequent rest and taskperformance, enabling a close physiological assessment of how effects impactedpost-training activities.
63
CHAPTER 1. INTRODUCTION
e next optimal performance study returned to the more familiar method of con-ducting a series of training sessions, and examining post-training differences on rat-ings of technique and task duration in a population of eye surgeons (Ros et al., 2009).e rationale for investigating effects on surgery were based on the prior evidencethat enhancement with theta suppression improved sustained attention andworking memory (Egner and Gruzelier, 2001; Vernon et al., 2003; Egner and Gruze-lier, 2004b) — it was thought that these improvements may have useful work-basedapplications in helping surgeons maintain task-performance standards under fatiguerelated cognitive impairment. It was also hypothesised that training might im-prove fine motor control via increased inhibitory regulation of thalamic projectionsto the motor cortex, as demonstrated in the epilepsy and literature (Sterman,1996). In the light of performance improvements seen in performing artists (Egnerand Gruzelier, 2003; Raymond et al., 2005a), it was additionally hypothesised thatan alpha-theta training intervention might improve surgical performance.
e design of this study employed a novel combination of qualitative and quan-titative analysis by combining 2 independent ratings of surgical video-footage withmeasures of time spent on task. Trainee ophthalmic microsurgeons (n = 20) wererandomly assigned to either or alpha-theta groups, whilst a subset of participantsalso formed part of a prior wait-list control group (n = 8) measured prior to the intervention. Neurofeedback groups received 8 × 30-minute training sessions, andtraining was based on the same alpha-theta and protocols previously describedin evaluations of Egner and Gruzelier (2001, 2003). Pre-post assessment included afilmed surgical training procedure with measures of execution time and expert ratingsof technique. State and trait anxiety were also measured ().
training demonstrated improvements not seen during the control period,with increased ratings of surgical skill and reductions in task-time. Both outcomemeasures correlated significantly, and task-time reductions correlated with growinginhibition of theta during training. As with Hanslmayr et al. (2005) the authorsinvestigated relative responsiveness. In the group they found that some casesincreased theta production towards the end of the study, and that significantly longerinter-session delays could be observed in these participants, suggesting that patternsof attendance are a factor in measures of learning; whether good attenders learnwell, or good learners attend well remains unknown however. In terms of anxiety,
64

CHAPTER 1. INTRODUCTION
trait measures were found to reduce following training, and within-session alpha-theta learning correlated with (non-significant) changes in state anxiety. Alpha-thetatraining was marginally associated with improved technique.
In evaluating this study, the authors highlighted a number of methodological is-sues that limit the interpretation and generalisation of these results. e control con-dition was based on a within-subjects design, with training following controls, sopractice related improvements might have benefited the groups to a greater ex-tent. ere is an additional problem that although several related improvementswere seen, none of them were significantly different from control measures; this lackof clear separation is compounded by the fact that the group exhibited higher ini-tial overall and task times than the other groups, introducing sampling error varianceinto the study. Overall, the key contribution of this study was to combine qualitativeand objective measures of performance in demonstrating a novel application of based . e examination of training attendance is also an important contributionto research as it shows that learning progress is not straightforwardly related to theamount of training received.
e next study to be reported discovered an association between and im-proved memory performance (Hoedlmoser et al., 2008). Whilst Vernon et al. (2003)had previously found training led to improvements in short-term memory, thisstudy examined post sleep differences in declarative memory recall compared to a con-trol group that received a novel form of . In this study participants either trained (12–1Hz) or a 3Hz control band that changed randomly in each training session(between 7–20Hz).
Participants were randomly and blindly assigned to (n=16) and control (n=11)groups, and received 10 sessions of . Before and after experimenters measuredperformance on a word pair recall test (Plihal and Born, 1997) carried out prior toand following a 90-minute afternoon nap.
Following the intervention, a pooled within-session analysis of training re-vealed increases of in-training amplitudes, more sleep spindles, and faster sleeponset. Improved performance on post- memory recall tests conducted prior tosleep was significantly greater in the group than in controls. Furthermore, theseimprovements correlated with in-training increases.
is study was initiated in an attempt to elucidate the possible role of sleep spin-
65
CHAPTER 1. INTRODUCTION
dles in the process of memory consolidation. Based on a prior study in which post-sleep memory performance was found to be predicted by nocturnal sleep spindle ac-tivity (Schabus et al., 2004), the authors had hypothesised that training mightfacilitate memory consolidation in napping. e results of the study did not confirmthis however, leading the authors to speculate that pre-sleep memory improvementsin participants may have derived from attentional gains, which parallels the con-clusions drawn by (Vernon et al., 2003). e use of a novel control condition deservessome further consideration as a novel implementation of an active alternative. Cer-tainly, providing a training procedure that is both immediately responsive yet hasno long-term training contingency seems to avoid the potential problem observedin some studies where experiments and/or participants have detected sham feedbackKaiser and Othmer (2000); Picard (2006); DeBeus (2006). Compared to the otherapproach used by researchers, that of a viable cognitive training exercise, using anever-changing protocol might be seen as a superior comparison condition as itmost closely resembles the main condition. is means that most of the possibleextraneous effects of are controlled for, even experimenter effects. Despite this,the changeable protocol may still see participants lose motivation resulting from a lackof long-term contingencies.
e previously explored theme of upper-alpha training was reprised in (Zoefelet al., 2011), who applied a protocol similar to that of Hanslmayr et al. (2005), but inthis case over a longer-term of 5 sessions. In this study, the upper alpha frequency bandin was once again investigated in relation to its ability to modulate performance ona mental rotation task. In this study however, trainees were compared to no-trainingcontrols, as opposed to responders versus non-responders.
(n=14) subjects were trained on five sessions within 5 days by means of feed-back dependent on the upper alpha amplitude of each participant’s spectral peak fre-quency. On the first and fifth day, cognitive ability was tested by a mental rotationtest. A no training control group (n=10) performed the mental rotation task on daysone and five only. e feedback was presented visually over 25-minutes in the formof coloured squares that changed between blue and red when alpha amplitudes wererespectively low or high in relation to baseline levels.
By comparing the baseline measures of session one to the last five minutes ofsession five, upper alpha was shown to have increased independently of other fre-
66
CHAPTER 1. INTRODUCTION
quency bands, and eleven of the fourteen subjects showed significant amplituderises. e enhancement of performance on the mental rotation task was significantlylarger for the group than for controls. is second upper-alpha study confirmsthat this form of eyes-open upper-alpha training is amenable to instrumental con-ditioning in the longer term in a randomised population sample. Prior measures ofpost-training improvements on mental rotation performance were replicated. Over-all, this study supports the findings from the earlier single-session trial docu-mented by (Hanslmayr et al., 2005). Taken together, these upper-alpha studies havereintroduced alpha training into the literature by avoiding some of the criticisms ofeyes-closed alpha training discussed in the work of Orne and Paskewitz (1974) (seeAppendix A on page 250). Unlike the single-session study, this paper does not doc-ument correlations between upper alpha and performance changes, which appears toconfirm the validity of the single-session approach as a possible means of controllingfor interference from extraneous factors that change the across training sessions.
e recent period of innovation giving rise to novel neurofeedback applications,protocols and methodologies has recently seen a diversification into the examinationof training gamma frequency components. In the last year, two studies of gamma(36–44Hz) in relation to beta (12–20 Hz) have been added to the optimal perfor-mance literature (Keizer et al., 2010b,a). Whilst all of the previously examined studiesin this field have revealed attentional or attention mediated memory improvements,gamma band activity was trained in efforts to modulate its association with in-telligence, which is purportedly mediated by visual feature-binding costs (Jausovec,2004).
e first gamma study measured intelligence with Raven’s standard progres-sive matrices (Raven, 1938) and a task based on Hommel (1998) designed to measurethe cost of feature binding expressed in timing and error. ese measures were carriedout prior to and following the experiment, and their sequencing was counterbalancedto adjust for order effects.
Each of the subjects was allocated randomly to a group promoting occipital (Oz)gamma relative to beta (n=7) or vice-versa (n=7). Participants completed 8 × 30-minute neurofeedback sessions over a period of 10 or 11 days. In a move to increaseexperimental control, the experimenters implemented a double-blind design, wherebyexpectation related effects were controlled for by making both participants and exper-
67
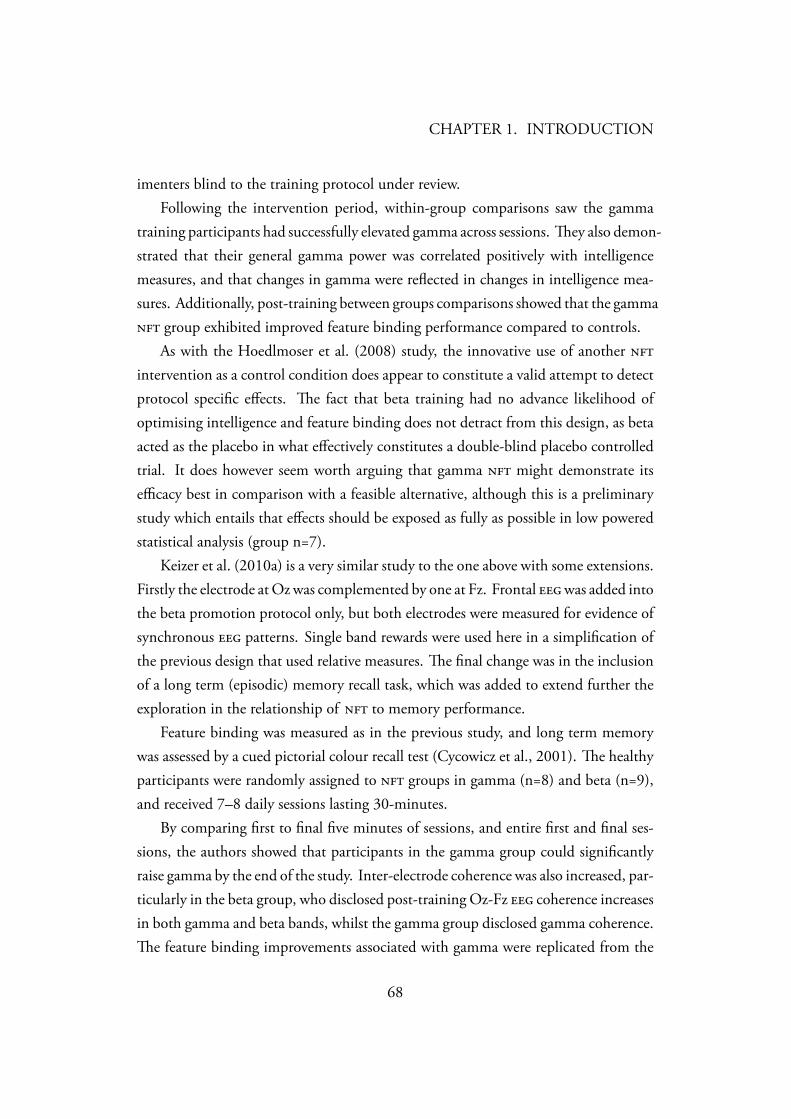
CHAPTER 1. INTRODUCTION
imenters blind to the training protocol under review.Following the intervention period, within-group comparisons saw the gamma
training participants had successfully elevated gamma across sessions. ey also demon-strated that their general gamma power was correlated positively with intelligencemeasures, and that changes in gamma were reflected in changes in intelligence mea-sures. Additionally, post-training between groups comparisons showed that the gamma group exhibited improved feature binding performance compared to controls.
As with the Hoedlmoser et al. (2008) study, the innovative use of another intervention as a control condition does appear to constitute a valid attempt to detectprotocol specific effects. e fact that beta training had no advance likelihood ofoptimising intelligence and feature binding does not detract from this design, as betaacted as the placebo in what effectively constitutes a double-blind placebo controlledtrial. It does however seem worth arguing that gamma might demonstrate itsefficacy best in comparison with a feasible alternative, although this is a preliminarystudy which entails that effects should be exposed as fully as possible in low poweredstatistical analysis (group n=7).
Keizer et al. (2010a) is a very similar study to the one above with some extensions.Firstly the electrode at Oz was complemented by one at Fz. Frontal was added intothe beta promotion protocol only, but both electrodes were measured for evidence ofsynchronous patterns. Single band rewards were used here in a simplification ofthe previous design that used relative measures. e final change was in the inclusionof a long term (episodic) memory recall task, which was added to extend further theexploration in the relationship of to memory performance.
Feature binding was measured as in the previous study, and long term memorywas assessed by a cued pictorial colour recall test (Cycowicz et al., 2001). e healthyparticipants were randomly assigned to groups in gamma (n=8) and beta (n=9),and received 7–8 daily sessions lasting 30-minutes.
By comparing first to final five minutes of sessions, and entire first and final ses-sions, the authors showed that participants in the gamma group could significantlyraise gamma by the end of the study. Inter-electrode coherence was also increased, par-ticularly in the beta group, who disclosed post-training Oz-Fz coherence increasesin both gamma and beta bands, whilst the gamma group disclosed gamma coherence.e feature binding improvements associated with gamma were replicated from the
68
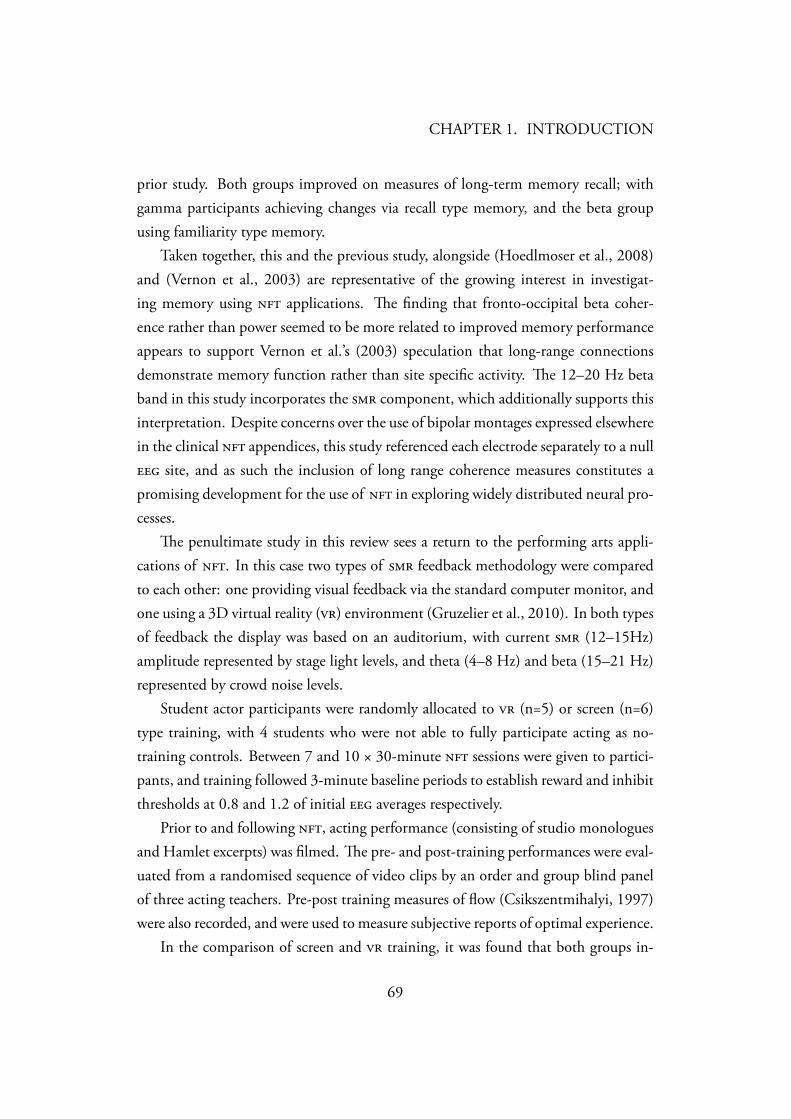
CHAPTER 1. INTRODUCTION
prior study. Both groups improved on measures of long-term memory recall; withgamma participants achieving changes via recall type memory, and the beta groupusing familiarity type memory.
Taken together, this and the previous study, alongside (Hoedlmoser et al., 2008)and (Vernon et al., 2003) are representative of the growing interest in investigat-ing memory using applications. e finding that fronto-occipital beta coher-ence rather than power seemed to be more related to improved memory performanceappears to support Vernon et al.’s (2003) speculation that long-range connectionsdemonstrate memory function rather than site specific activity. e 12–20 Hz betaband in this study incorporates the component, which additionally supports thisinterpretation. Despite concerns over the use of bipolar montages expressed elsewherein the clinical appendices, this study referenced each electrode separately to a null site, and as such the inclusion of long range coherence measures constitutes apromising development for the use of in exploring widely distributed neural pro-cesses.
e penultimate study in this review sees a return to the performing arts appli-cations of . In this case two types of feedback methodology were comparedto each other: one providing visual feedback via the standard computer monitor, andone using a 3D virtual reality () environment (Gruzelier et al., 2010). In both typesof feedback the display was based on an auditorium, with current (12–15Hz)amplitude represented by stage light levels, and theta (4–8 Hz) and beta (15–21 Hz)represented by crowd noise levels.
Student actor participants were randomly allocated to (n=5) or screen (n=6)type training, with 4 students who were not able to fully participate acting as no-training controls. Between 7 and 10 × 30-minute sessions were given to partici-pants, and training followed 3-minute baseline periods to establish reward and inhibitthresholds at 0.8 and 1.2 of initial averages respectively.
Prior to and following , acting performance (consisting of studio monologuesand Hamlet excerpts) was filmed. e pre- and post-training performances were eval-uated from a randomised sequence of video clips by an order and group blind panelof three acting teachers. Pre-post training measures of flow (Csikszentmihalyi, 1997)were also recorded, and were used to measure subjective reports of optimal experience.
In the comparison of screen and training, it was found that both groups in-
69
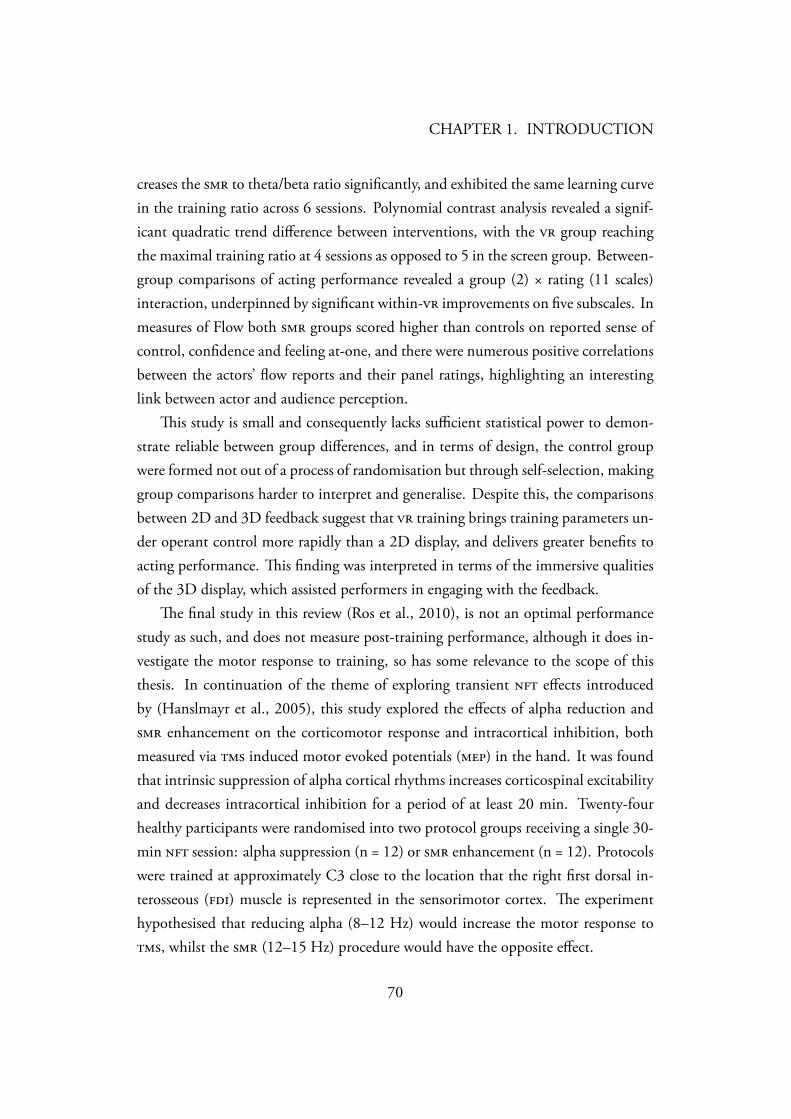
CHAPTER 1. INTRODUCTION
creases the to theta/beta ratio significantly, and exhibited the same learning curvein the training ratio across 6 sessions. Polynomial contrast analysis revealed a signif-icant quadratic trend difference between interventions, with the group reachingthe maximal training ratio at 4 sessions as opposed to 5 in the screen group. Between-group comparisons of acting performance revealed a group (2) × rating (11 scales)interaction, underpinned by significant within- improvements on five subscales. Inmeasures of Flow both groups scored higher than controls on reported sense ofcontrol, confidence and feeling at-one, and there were numerous positive correlationsbetween the actors’ flow reports and their panel ratings, highlighting an interestinglink between actor and audience perception.
is study is small and consequently lacks sufficient statistical power to demon-strate reliable between group differences, and in terms of design, the control groupwere formed not out of a process of randomisation but through self-selection, makinggroup comparisons harder to interpret and generalise. Despite this, the comparisonsbetween 2D and 3D feedback suggest that training brings training parameters un-der operant control more rapidly than a 2D display, and delivers greater benefits toacting performance. is finding was interpreted in terms of the immersive qualitiesof the 3D display, which assisted performers in engaging with the feedback.
e final study in this review (Ros et al., 2010), is not an optimal performancestudy as such, and does not measure post-training performance, although it does in-vestigate the motor response to training, so has some relevance to the scope of thisthesis. In continuation of the theme of exploring transient effects introducedby (Hanslmayr et al., 2005), this study explored the effects of alpha reduction and enhancement on the corticomotor response and intracortical inhibition, bothmeasured via induced motor evoked potentials () in the hand. It was foundthat intrinsic suppression of alpha cortical rhythms increases corticospinal excitabilityand decreases intracortical inhibition for a period of at least 20 min. Twenty-fourhealthy participants were randomised into two protocol groups receiving a single 30-min session: alpha suppression (n = 12) or enhancement (n = 12). Protocolswere trained at approximately C3 close to the location that the right first dorsal in-terosseous () muscle is represented in the sensorimotor cortex. e experimenthypothesised that reducing alpha (8–12 Hz) would increase the motor response to, whilst the (12–15 Hz) procedure would have the opposite effect.
70
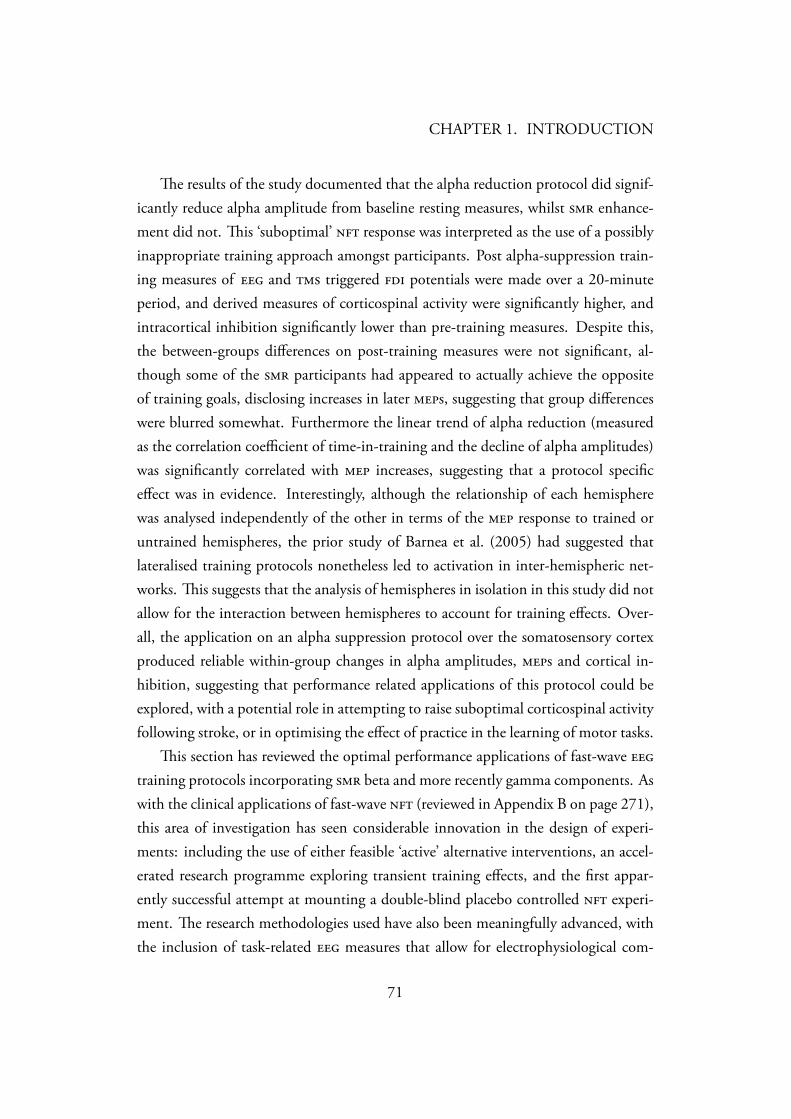
CHAPTER 1. INTRODUCTION
e results of the study documented that the alpha reduction protocol did signif-icantly reduce alpha amplitude from baseline resting measures, whilst enhance-ment did not. is ‘suboptimal’ response was interpreted as the use of a possiblyinappropriate training approach amongst participants. Post alpha-suppression train-ing measures of and triggered potentials were made over a 20-minuteperiod, and derived measures of corticospinal activity were significantly higher, andintracortical inhibition significantly lower than pre-training measures. Despite this,the between-groups differences on post-training measures were not significant, al-though some of the participants had appeared to actually achieve the oppositeof training goals, disclosing increases in later s, suggesting that group differenceswere blurred somewhat. Furthermore the linear trend of alpha reduction (measuredas the correlation coefficient of time-in-training and the decline of alpha amplitudes)was significantly correlated with increases, suggesting that a protocol specificeffect was in evidence. Interestingly, although the relationship of each hemispherewas analysed independently of the other in terms of the response to trained oruntrained hemispheres, the prior study of Barnea et al. (2005) had suggested thatlateralised training protocols nonetheless led to activation in inter-hemispheric net-works. is suggests that the analysis of hemispheres in isolation in this study did notallow for the interaction between hemispheres to account for training effects. Over-all, the application on an alpha suppression protocol over the somatosensory cortexproduced reliable within-group changes in alpha amplitudes, s and cortical in-hibition, suggesting that performance related applications of this protocol could beexplored, with a potential role in attempting to raise suboptimal corticospinal activityfollowing stroke, or in optimising the effect of practice in the learning of motor tasks.
is section has reviewed the optimal performance applications of fast-wave training protocols incorporating beta and more recently gamma components. Aswith the clinical applications of fast-wave (reviewed in Appendix B on page 271),this area of investigation has seen considerable innovation in the design of experi-ments: including the use of either feasible ‘active’ alternative interventions, an accel-erated research programme exploring transient training effects, and the first appar-ently successful attempt at mounting a double-blind placebo controlled experi-ment. e research methodologies used have also been meaningfully advanced, withthe inclusion of task-related measures that allow for electrophysiological com-
71
CHAPTER 1. INTRODUCTION
parisons between and task performance. is level of comparison suggests it hasthe promise of being able to disclose how effects on performance are mediatedby the brain. e major findings of the fast-wave research in healthy subjects havebeen the improvement of cognitive performance in measures of sustained attention,memory encoding/retrieval, and preliminary findings indicating a role for inmodulating acting performance.
1.4.3.4 Summary of optimal performance studies
is section has reviewed the literature documenting optimal performance applica-tions of neurofeedback as a precursor to detailing my own studies of music per-formance that include both alpha-theta and training procedures. Measures oftraining, electrophysiology and task performance, and their inter-relations have beenassessed, as have the research methods used.
1.5 Creativity, Hypnagogia and Music performance
As discussed in Section 1.4.3.2 on page 43 and also Appendix A on page 250, alpha-theta training seeks to modulate the t/a ratio with the objective of initiating and sus-taining hypnagogic , operationalised as . e following section willdefine how creativity will be realised in the fieldwork, assess the hypnagogia-creativitylink that underscores the research methodology of this thesis, and conclude by demon-strating the distinct role that music performance has in the empirical observation ofcreative behaviour.
1.5.1 Problematising creativity
Within psychology there are both reductionist and holistic approaches to bringingcreativity under experimental control. In the former category, psychometric tech-niques have been derived beginning with the process driven work of Guilford (1950)and Mednick et al. (1965); taking a product driven view, Amabile (1982) and Simon-ton (1997) emphasised the role of selective behaviour as the principal determinant ofcreative value. Most recently, the research community has returned to exploring therole of the process underlying creative behaviour, and Dietrich (2004a) has attempted
72
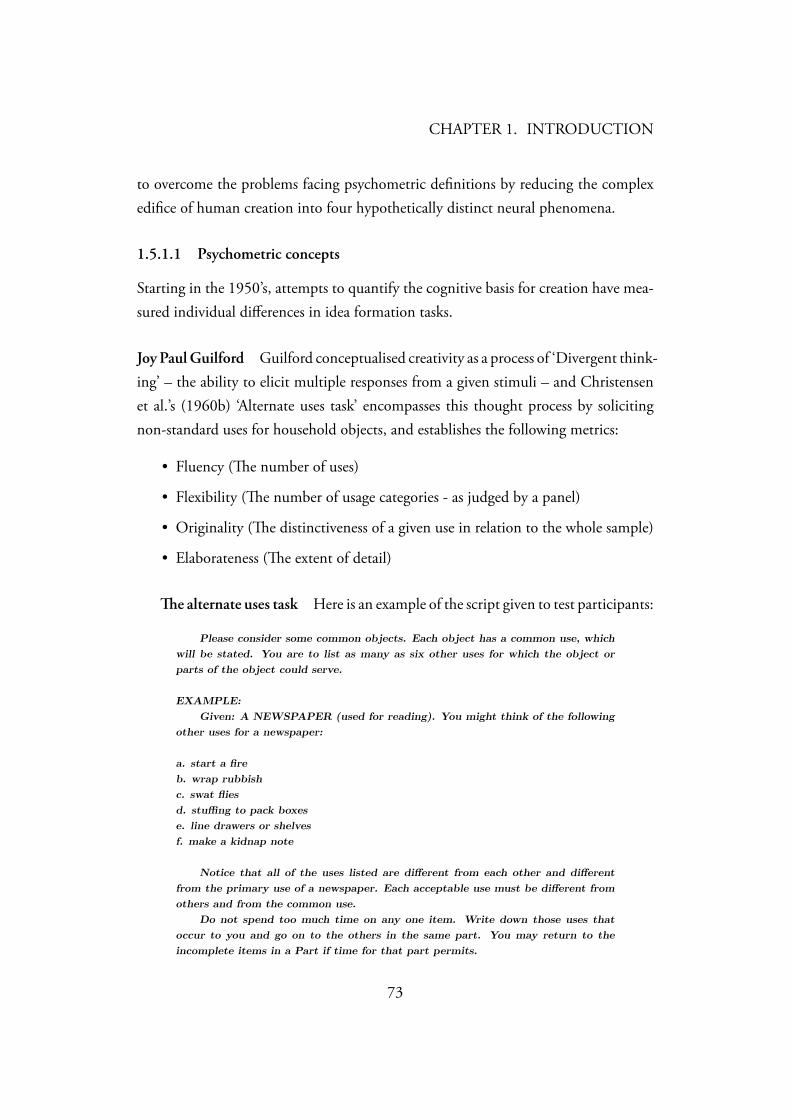
CHAPTER 1. INTRODUCTION
to overcome the problems facing psychometric definitions by reducing the complexedifice of human creation into four hypothetically distinct neural phenomena.
1.5.1.1 Psychometric concepts
Starting in the 1950’s, attempts to quantify the cognitive basis for creation have mea-sured individual differences in idea formation tasks.
Joy PaulGuilford Guilford conceptualised creativity as a process of ‘Divergent think-ing’ – the ability to elicit multiple responses from a given stimuli – and Christensenet al.’s (1960b) ‘Alternate uses task’ encompasses this thought process by solicitingnon-standard uses for household objects, and establishes the following metrics:
• Fluency (e number of uses)
• Flexibility (e number of usage categories - as judged by a panel)
• Originality (e distinctiveness of a given use in relation to the whole sample)
• Elaborateness (e extent of detail)
e alternate uses task Here is an example of the script given to test participants:
Please consider some common objects. Each object has a common use, whichwill be stated. You are to list as many as six other uses for which the object orparts of the object could serve.
EXAMPLE:Given: A NEWSPAPER (used for reading). You might think of the following
other uses for a newspaper:
a. start a fireb. wrap rubbishc. swat fliesd. stuffing to pack boxese. line drawers or shelvesf. make a kidnap note
Notice that all of the uses listed are different from each other and differentfrom the primary use of a newspaper. Each acceptable use must be different fromothers and from the common use.
Do not spend too much time on any one item. Write down those uses thatoccur to you and go on to the others in the same part. You may return to theincomplete items in a Part if time for that part permits.
73
CHAPTER 1. INTRODUCTION
There are two parts to this test, with three items per part. You will have 4
minutes for each part. — Christensen et al. (1960b,a)
In test scenarios, the written responses of participants to provided stimuli arescored by independent raters, and the raters’ attribution of categories, originality andelaborateness is then assessed by means of Inter-Rater-Agreement statistics, e.g. Finket al. (2006).
Sarnoff A. Mednick Whilst Guilford typified creativity as divergent thinking, hiscontemporary Mednick (1962) argued that the creative process was based on a formof combinatory association in which seemingly disparate concepts converge, citingPoincaré as a compelling articulation of this:
``To create consists of making new combinations of associativeelements which are useful. The mathematical facts worthy of beingstudied … are those which reveal to us unsuspected kinships be-tween other facts well known but wrongly believed to be strangersto one another. Among chosen combinations the most fertile willoften be those formed of elements drawn from domains which arefar apart.'' — Poincaré and Halsted (1913)
Mednick’s inferred measure of creativity, the ‘Remote associates test’ was then ex-amined for construct validity against college tutors’ subjective ratings of how creativetheir students were, and the extent to which leading architects score high or low onmeasures of originality. Furthermore, high scorers on the .. test were not gener-ally high scorers on gross point average measures of academic performance, possiblydistinguishing associational ability from general intelligence.
e Remote associates test e ‘Remote associates test’ (Mednick and Mednick,1967a,b) measures the extent to which a subject can associate three words by pairingeach of them with a fourth. For example the words: Broken, Clear and Eye can allbe interconnected with the word Glass (More examples at varying levels of difficultyare shown in Table 1.1). e test is scored according to the number and difficulty ofcorrect associations drawn.
74
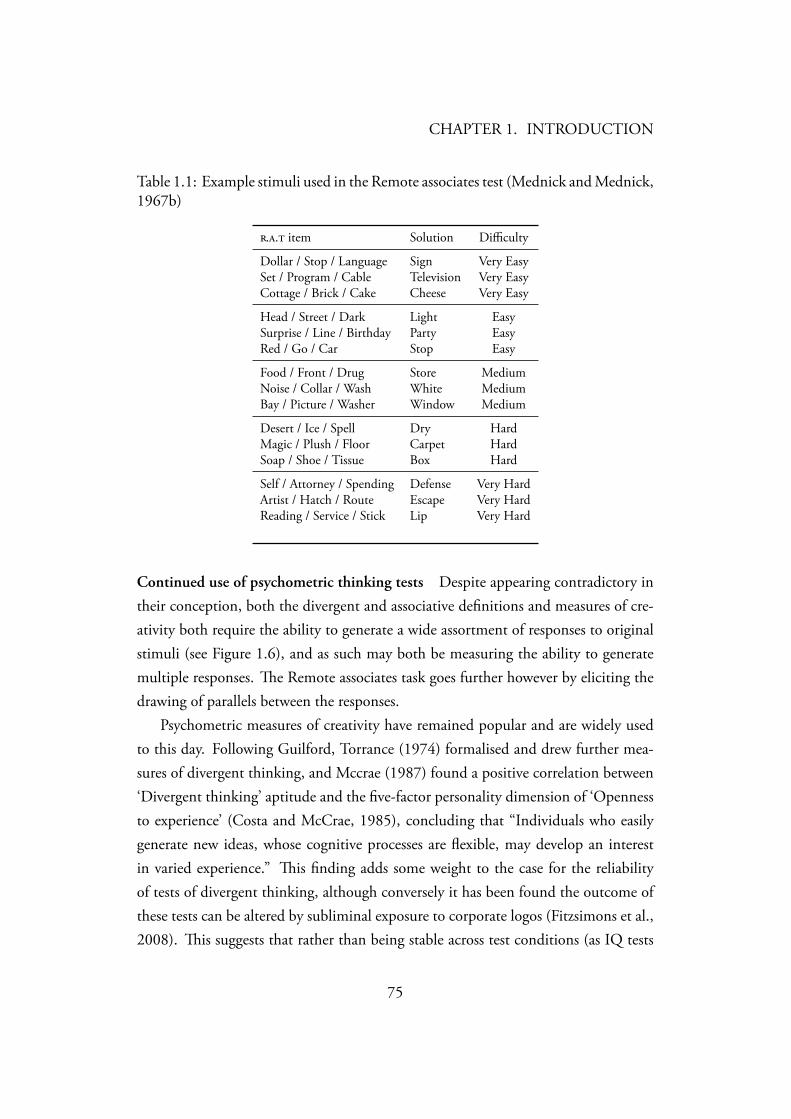
CHAPTER 1. INTRODUCTION
Table 1.1: Example stimuli used in the Remote associates test (Mednick and Mednick,1967b)
.. item Solution Difficulty
Dollar / Stop / Language Sign Very EasySet / Program / Cable Television Very EasyCottage / Brick / Cake Cheese Very Easy
Head / Street / Dark Light EasySurprise / Line / Birthday Party EasyRed / Go / Car Stop Easy
Food / Front / Drug Store MediumNoise / Collar / Wash White MediumBay / Picture / Washer Window Medium
Desert / Ice / Spell Dry HardMagic / Plush / Floor Carpet HardSoap / Shoe / Tissue Box Hard
Self / Attorney / Spending Defense Very HardArtist / Hatch / Route Escape Very HardReading / Service / Stick Lip Very Hard
Continued use of psychometric thinking tests Despite appearing contradictory intheir conception, both the divergent and associative definitions and measures of cre-ativity both require the ability to generate a wide assortment of responses to originalstimuli (see Figure 1.6), and as such may both be measuring the ability to generatemultiple responses. e Remote associates task goes further however by eliciting thedrawing of parallels between the responses.
Psychometric measures of creativity have remained popular and are widely usedto this day. Following Guilford, Torrance (1974) formalised and drew further mea-sures of divergent thinking, and Mccrae (1987) found a positive correlation between‘Divergent thinking’ aptitude and the five-factor personality dimension of ‘Opennessto experience’ (Costa and McCrae, 1985), concluding that “Individuals who easilygenerate new ideas, whose cognitive processes are flexible, may develop an interestin varied experience.” is finding adds some weight to the case for the reliabilityof tests of divergent thinking, although conversely it has been found the outcome ofthese tests can be altered by subliminal exposure to corporate logos (Fitzsimons et al.,2008). is suggests that rather than being stable across test conditions (as IQ tests
75
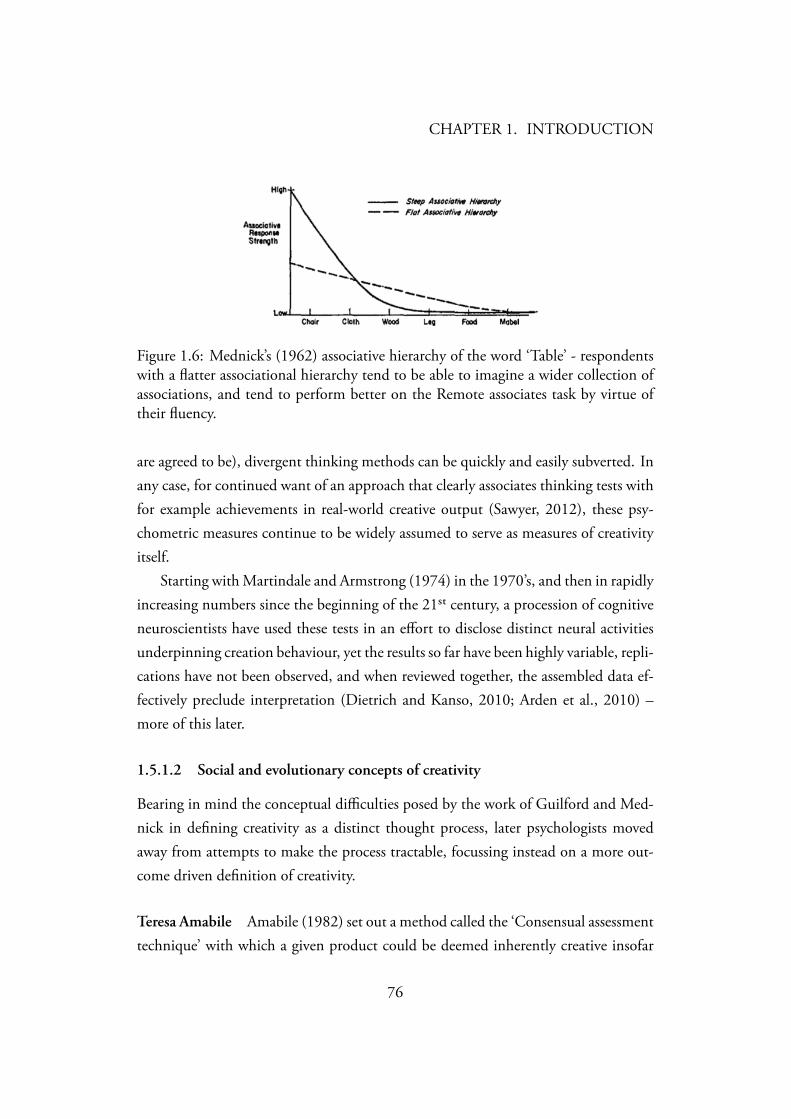
CHAPTER 1. INTRODUCTION
Figure 1.6: Mednick’s (1962) associative hierarchy of the word ‘Table’ - respondentswith a flatter associational hierarchy tend to be able to imagine a wider collection ofassociations, and tend to perform better on the Remote associates task by virtue oftheir fluency.
are agreed to be), divergent thinking methods can be quickly and easily subverted. Inany case, for continued want of an approach that clearly associates thinking tests withfor example achievements in real-world creative output (Sawyer, 2012), these psy-chometric measures continue to be widely assumed to serve as measures of creativityitself.
Starting with Martindale and Armstrong (1974) in the 1970’s, and then in rapidlyincreasing numbers since the beginning of the 21 century, a procession of cognitiveneuroscientists have used these tests in an effort to disclose distinct neural activitiesunderpinning creation behaviour, yet the results so far have been highly variable, repli-cations have not been observed, and when reviewed together, the assembled data ef-fectively preclude interpretation (Dietrich and Kanso, 2010; Arden et al., 2010) –more of this later.
1.5.1.2 Social and evolutionary concepts of creativity
Bearing in mind the conceptual difficulties posed by the work of Guilford and Med-nick in defining creativity as a distinct thought process, later psychologists movedaway from attempts to make the process tractable, focussing instead on a more out-come driven definition of creativity.
Teresa Amabile Amabile (1982) set out a method called the ‘Consensual assessmenttechnique’ with which a given product could be deemed inherently creative insofar
76
CHAPTER 1. INTRODUCTION
as:
1. A subsection of the population are able to achieve consensus as to what is acreative outcome, according to their own subjectively held views
2. ey are also able to agree how creative a given outcome is
3. eir consensus can be distinguished from aesthetic and technical factors, whichcan confound creative judgement.
e ‘Criterion problem’ in creativity research In her critique of the earlier psy-chometric attempts to study creativity, Amabile argued that they had only been suc-cessful in isolating abilities that contribute to creative performance by observing be-havioural characteristics – consequently, neither divergent thinking nor remote asso-ciation tests are able to define the creative value of an outcome, only the characteristicsof the person who produced it. Amabile characterised this as the ‘Criterion problem’:“e lack of a clear operational definition and an appropriate assessment methodol-ogy.”
e ‘Consensual assessment technique’ Arguing that creativity could effectivelybe both operationalised and assessed with reference to its value in a social context,Amabile’s method uses the social environment to both subjectively define and measurecreative value by gauging the extent to which an audience can agree on the creativemerit of a given real-world outcome.
Dean Keith Simonton In common with Amabile, Simonton (1999) also empha-sised the importance of the audience in defining creative merit, although he doesn’tfocus on the immediate social context. Instead his conceptualisation of the audienceis as a receiver of a random mix of variability, from which creativity is selected out.
Simonton defines the selection of creative value from random variation at threedistinct levels: the individual; the social; the cultural. His view is that creative out-comes originate from an entirely random process of variation, and that randomlygenerated outcomes are selectively retained according to a heuristic he compares tothe evolution of species.
77
CHAPTER 1. INTRODUCTION
e evolutionary basis of creativity Simonton (1999) argues that the ‘Randomvariation’ and ‘Selective retention’ of creative outcomes occurs in each of the threeaudiences: at the individual level, outcomes are generated seemingly at random butretained according to personal selection heuristics; the same process then repeats in thesocial plane as individual outcomes join a randomly assembled mix of outcomes, withselection proceeding according to socially derived criteria (which is what Amabile’s(1982) technique captures); finally, a culture continually encounters new creations atrandom, and selectively retains some according to cultural requirements.
e ‘Equal odds rule’ Unlike Amabile’s (1982) approach to defining judge-ments about creative value, Simonton doesn’t describe the mechanism underlying the‘Selective retention’ of creation. Instead, his empirical work focusses predominantlyon making the case for ‘Random variation’ as the basis of creative behaviour by pre-senting evidence in support of his ‘equal odds rule’ (Simonton, 1997): On average,the quantity of a person’s creations will predict the quality with which they will beperceived in any sphere. Two types of evidence are submitted to support this view:life-span and cross-sectional success rate measures.
In his longitudinal analysis of the successes and failures of the great composers,Simonton (1997) demonstrated that, on average, the ratio of successes to failuresremained constant. At the height of productivity, composers produced what went onto become critical hits and misses at the same rate as they did later in life, when itmight be anticipated that their hit rate would rise as a product of their experience.is is taken as evidence that the composers’ creative values can not predict social andcultural values because of the essential randomness with which they join the fray.
Simonton (2003) also observed the equal odds rule when looking cross-sectionallyat the relationship between academic productivity and extent of critical acceptance,which he expressed as the citation count. He found that on average, the most prolificscientists were those who produced the most cited works, furthermore, these prolificacademics also produced the majority of works receiving fewest citations. is wasinterpreted as evidence that the social or cultural retention of a given creation cannotreliably be foreseen by the individual, and that the key determinant of academic suc-cess is prolificacy. ere are exceptions to this general rule, but Simonton maintainsthat each level of selection takes place amid a random mix of outcomes.
78
CHAPTER 1. INTRODUCTION
e return of the behavioural paradigm Although Amabile and Simonton bothadvanced the view that creativity is, by definition, selection rather than inception,their refusal to define selection behaviour, coupled with the advent of cognitive neu-roscience methods, has seen a return to the focus on individual differences within thebehavioural paradigm.
1.5.1.3 e cognitive neuroscience of creative behaviour
Existing psychometric measures of creativity appear untractable in the brain Orig-inating in the studies of Martindale and Armstrong (1974), and increasinglygreatly with advances in of neuroelectric and neuroimaging methods, a great num-ber of studies comparing ‘Divergent thinking’ and ‘Remote association’ to controltasks have emerged. e accumulated studies have been reviewed by Dietrich andKanso (2010) and Arden et al. (2010) who found that in combination, the resultsprovided no reliable evidence of a distinct neural signature underlying performanceon creative tasks. Dietrich and Kanso’s (2010) review of 63 studies concluded that theneuroelectric results varied hugely and neuroimaging outcomes agreed only on “dif-fuse prefrontal activation.” Arden et al. (2010) reviewed 45 studies, and found theneuroelectric and neuroimaging evidence so variable as to preclude interpretation.
In both reviews, a way out of the current disarray was suggested. Arden et al.(2010) produced a manifesto proposing various methodological alignments that couldbe observed by the research community, including one that Dietrich and Kanso (2010)also promoted, that of domain specificity. Citing his earlier attempt to deconstructthe creative edifice, (see Figure 1.7 on page 80), Dietrich suggested that for neuro-scientists, a more promising approach to finding creativity in the brain would be todepart from tests of ‘Divergent thinking’ and instead concentrate on capturing specificmodes and domains of creation.
e subsequent work in this thesis accepts Dietrich’s (2004a) invitation to ap-proach a behavioural subset of creativity, and attempts to encapsulate his conceptionof ‘Emotional knowledge’ being exercised in the ‘Spontaneous processing’ mode. Inhis definition, the representation of emotional signals in working memory have a dis-tinct revelatory phenomenology, and he cites Coleridge’s (1816) conception of thepoem ‘Kubla Khan, or Vision in a Dream’ as a classic example of this type of creative
79
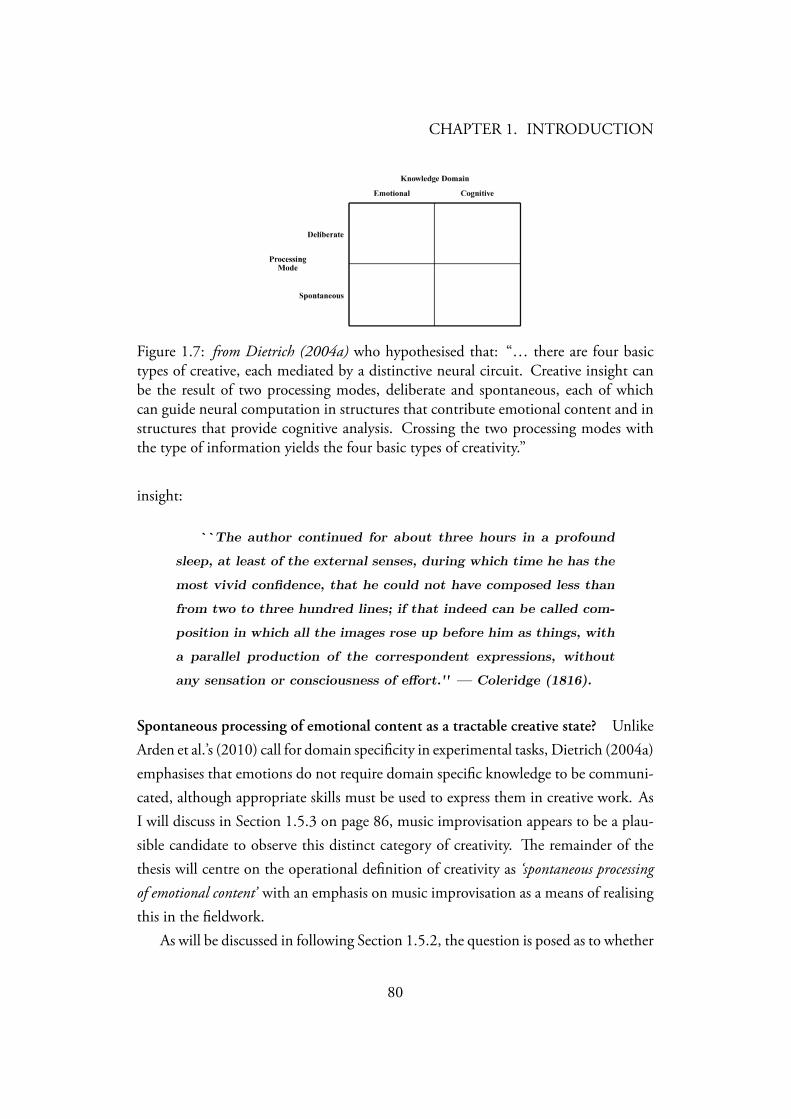
CHAPTER 1. INTRODUCTION
Figure 1.7: from Dietrich (2004a) who hypothesised that: “… there are four basictypes of creative, each mediated by a distinctive neural circuit. Creative insight canbe the result of two processing modes, deliberate and spontaneous, each of whichcan guide neural computation in structures that contribute emotional content and instructures that provide cognitive analysis. Crossing the two processing modes withthe type of information yields the four basic types of creativity.”
insight:
``The author continued for about three hours in a profoundsleep, at least of the external senses, during which time he has themost vivid confidence, that he could not have composed less thanfrom two to three hundred lines; if that indeed can be called com-position in which all the images rose up before him as things, witha parallel production of the correspondent expressions, withoutany sensation or consciousness of effort.'' — Coleridge (1816).
Spontaneous processing of emotional content as a tractable creative state? UnlikeArden et al.’s (2010) call for domain specificity in experimental tasks, Dietrich (2004a)emphasises that emotions do not require domain specific knowledge to be communi-cated, although appropriate skills must be used to express them in creative work. AsI will discuss in Section 1.5.3 on page 86, music improvisation appears to be a plau-sible candidate to observe this distinct category of creativity. e remainder of thethesis will centre on the operational definition of creativity as ‘spontaneous processingof emotional content’ with an emphasis on music improvisation as a means of realisingthis in the fieldwork.
As will be discussed in following Section 1.5.2, the question is posed as to whether
80
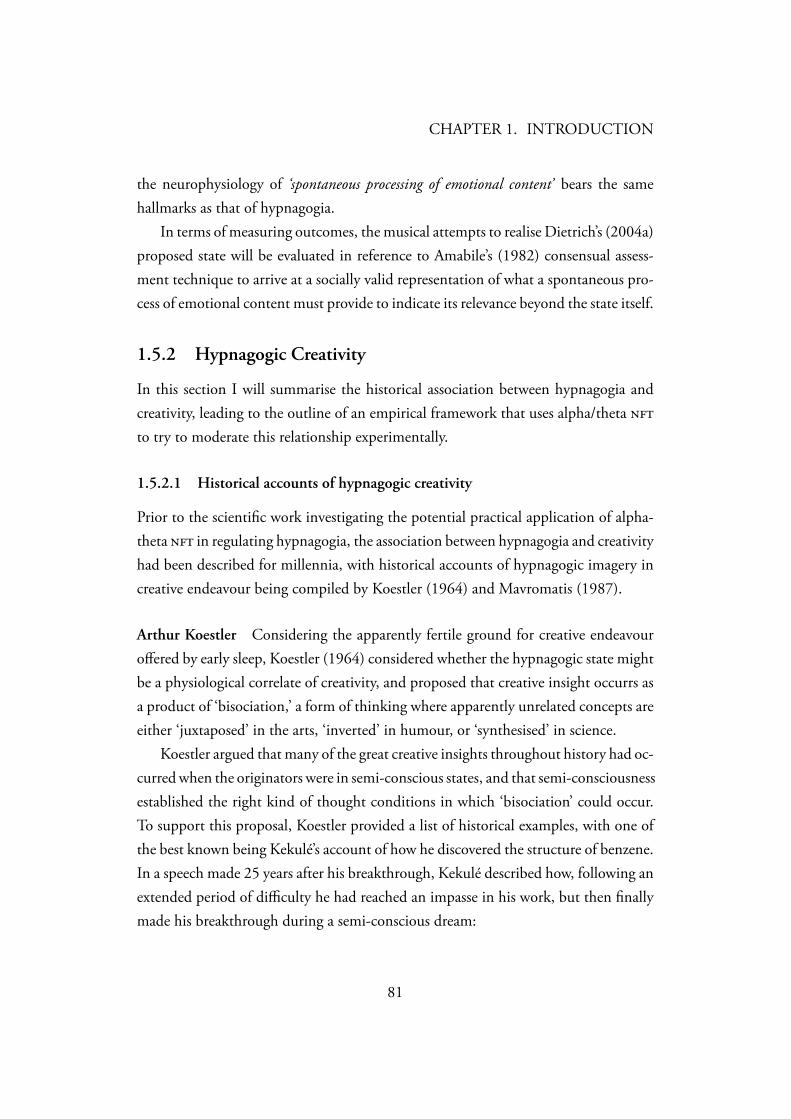
CHAPTER 1. INTRODUCTION
the neurophysiology of ‘spontaneous processing of emotional content’ bears the samehallmarks as that of hypnagogia.
In terms of measuring outcomes, the musical attempts to realise Dietrich’s (2004a)proposed state will be evaluated in reference to Amabile’s (1982) consensual assess-ment technique to arrive at a socially valid representation of what a spontaneous pro-cess of emotional content must provide to indicate its relevance beyond the state itself.
1.5.2 Hypnagogic Creativity
In this section I will summarise the historical association between hypnagogia andcreativity, leading to the outline of an empirical framework that uses alpha/theta to try to moderate this relationship experimentally.
1.5.2.1 Historical accounts of hypnagogic creativity
Prior to the scientific work investigating the potential practical application of alpha-theta in regulating hypnagogia, the association between hypnagogia and creativityhad been described for millennia, with historical accounts of hypnagogic imagery increative endeavour being compiled by Koestler (1964) and Mavromatis (1987).
Arthur Koestler Considering the apparently fertile ground for creative endeavouroffered by early sleep, Koestler (1964) considered whether the hypnagogic state mightbe a physiological correlate of creativity, and proposed that creative insight occurrs asa product of ‘bisociation,’ a form of thinking where apparently unrelated concepts areeither ‘juxtaposed’ in the arts, ‘inverted’ in humour, or ‘synthesised’ in science.
Koestler argued that many of the great creative insights throughout history had oc-curred when the originators were in semi-conscious states, and that semi-consciousnessestablished the right kind of thought conditions in which ‘bisociation’ could occur.To support this proposal, Koestler provided a list of historical examples, with one ofthe best known being Kekulé’s account of how he discovered the structure of benzene.In a speech made 25 years after his breakthrough, Kekulé described how, following anextended period of difficulty he had reached an impasse in his work, but then finallymade his breakthrough during a semi-conscious dream:
81
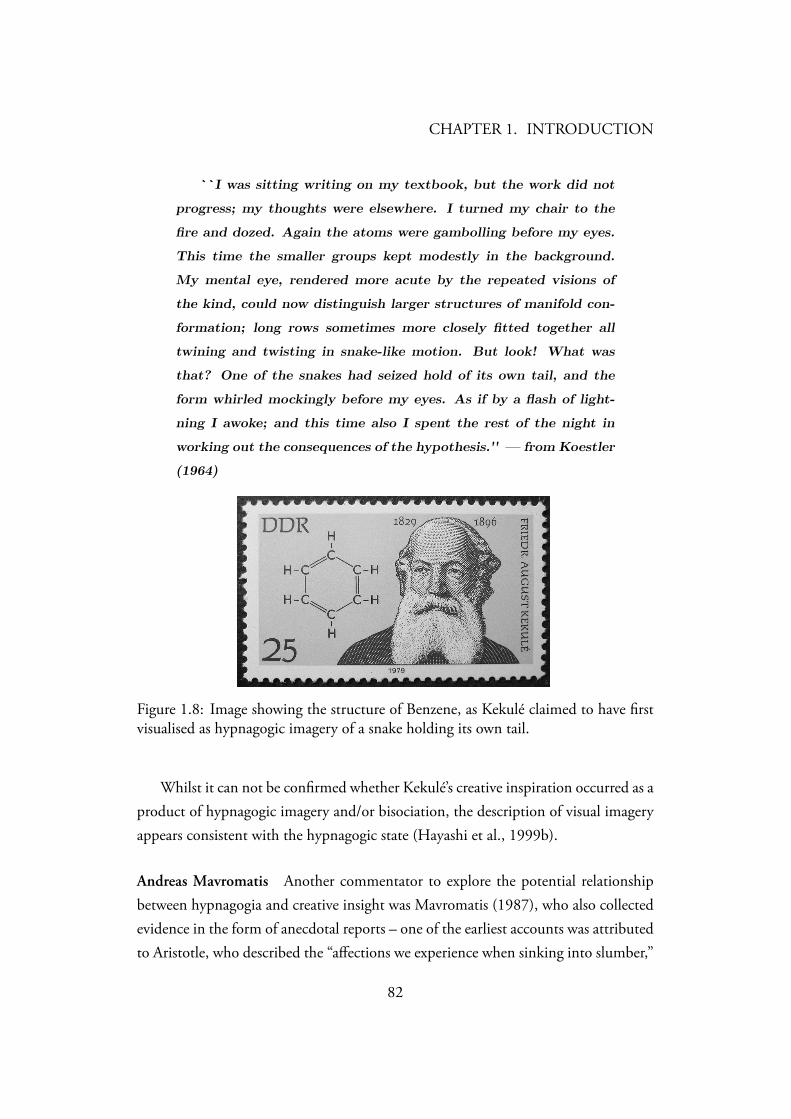
CHAPTER 1. INTRODUCTION
``I was sitting writing on my textbook, but the work did notprogress; my thoughts were elsewhere. I turned my chair to thefire and dozed. Again the atoms were gambolling before my eyes.This time the smaller groups kept modestly in the background.My mental eye, rendered more acute by the repeated visions ofthe kind, could now distinguish larger structures of manifold con-formation; long rows sometimes more closely fitted together alltwining and twisting in snake-like motion. But look! What wasthat? One of the snakes had seized hold of its own tail, and theform whirled mockingly before my eyes. As if by a flash of light-ning I awoke; and this time also I spent the rest of the night inworking out the consequences of the hypothesis.'' — from Koestler(1964)
Figure 1.8: Image showing the structure of Benzene, as Kekulé claimed to have firstvisualised as hypnagogic imagery of a snake holding its own tail.
Whilst it can not be confirmed whether Kekulé’s creative inspiration occurred as aproduct of hypnagogic imagery and/or bisociation, the description of visual imageryappears consistent with the hypnagogic state (Hayashi et al., 1999b).
Andreas Mavromatis Another commentator to explore the potential relationshipbetween hypnagogia and creative insight was Mavromatis (1987), who also collectedevidence in the form of anecdotal reports – one of the earliest accounts was attributedto Aristotle, who described the “affections we experience when sinking into slumber,”
82
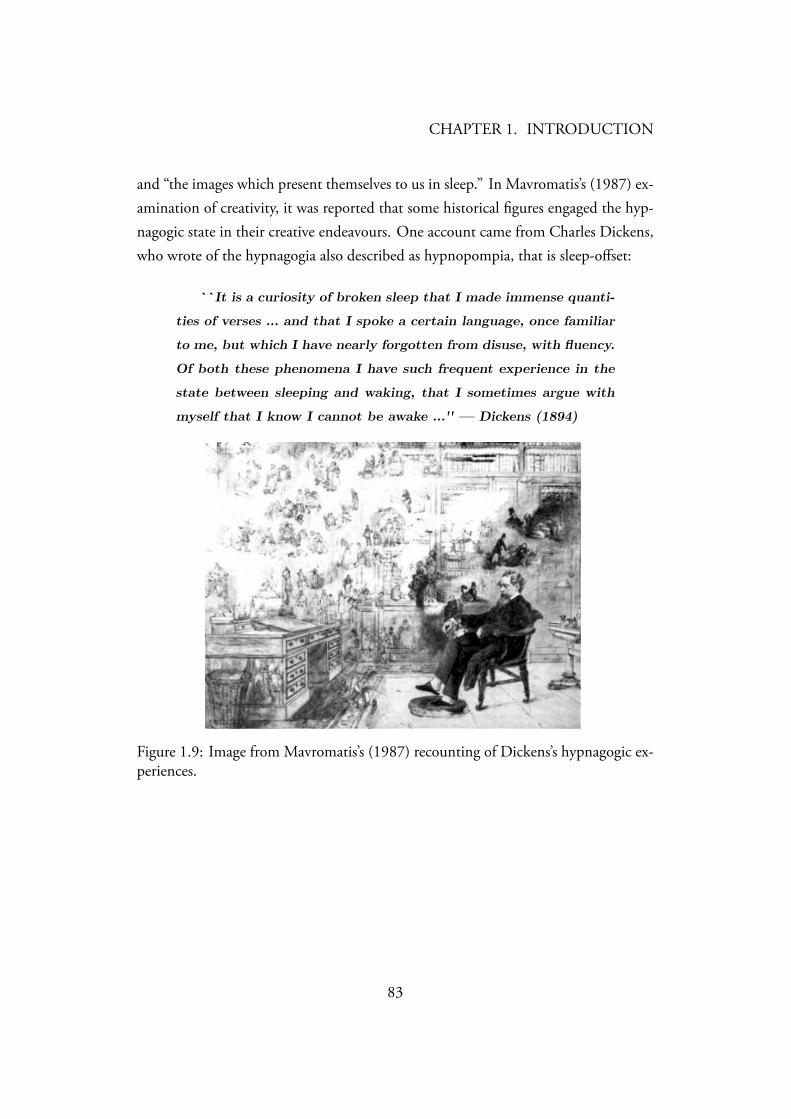
CHAPTER 1. INTRODUCTION
and “the images which present themselves to us in sleep.” In Mavromatis’s (1987) ex-amination of creativity, it was reported that some historical figures engaged the hyp-nagogic state in their creative endeavours. One account came from Charles Dickens,who wrote of the hypnagogia also described as hypnopompia, that is sleep-offset:
``It is a curiosity of broken sleep that I made immense quanti-ties of verses … and that I spoke a certain language, once familiarto me, but which I have nearly forgotten from disuse, with fluency.Of both these phenomena I have such frequent experience in thestate between sleeping and waking, that I sometimes argue withmyself that I know I cannot be awake …'' — Dickens (1894)
Figure 1.9: Image from Mavromatis’s (1987) recounting of Dickens’s hypnagogic ex-periences.
83
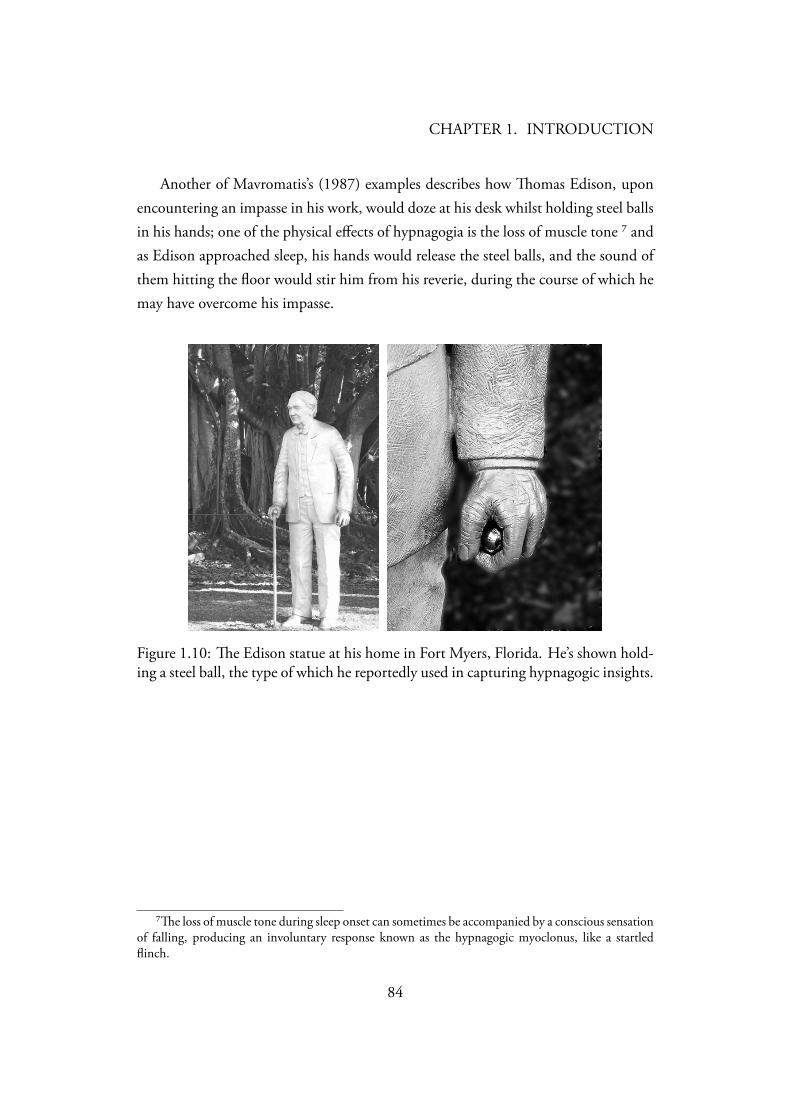
CHAPTER 1. INTRODUCTION
Another of Mavromatis’s (1987) examples describes how omas Edison, uponencountering an impasse in his work, would doze at his desk whilst holding steel ballsin his hands; one of the physical effects of hypnagogia is the loss of muscle tone ⁷ andas Edison approached sleep, his hands would release the steel balls, and the sound ofthem hitting the floor would stir him from his reverie, during the course of which hemay have overcome his impasse.
Figure 1.10: e Edison statue at his home in Fort Myers, Florida. He’s shown hold-ing a steel ball, the type of which he reportedly used in capturing hypnagogic insights.
⁷e loss of muscle tone during sleep onset can sometimes be accompanied by a conscious sensationof falling, producing an involuntary response known as the hypnagogic myoclonus, like a startledflinch.
84
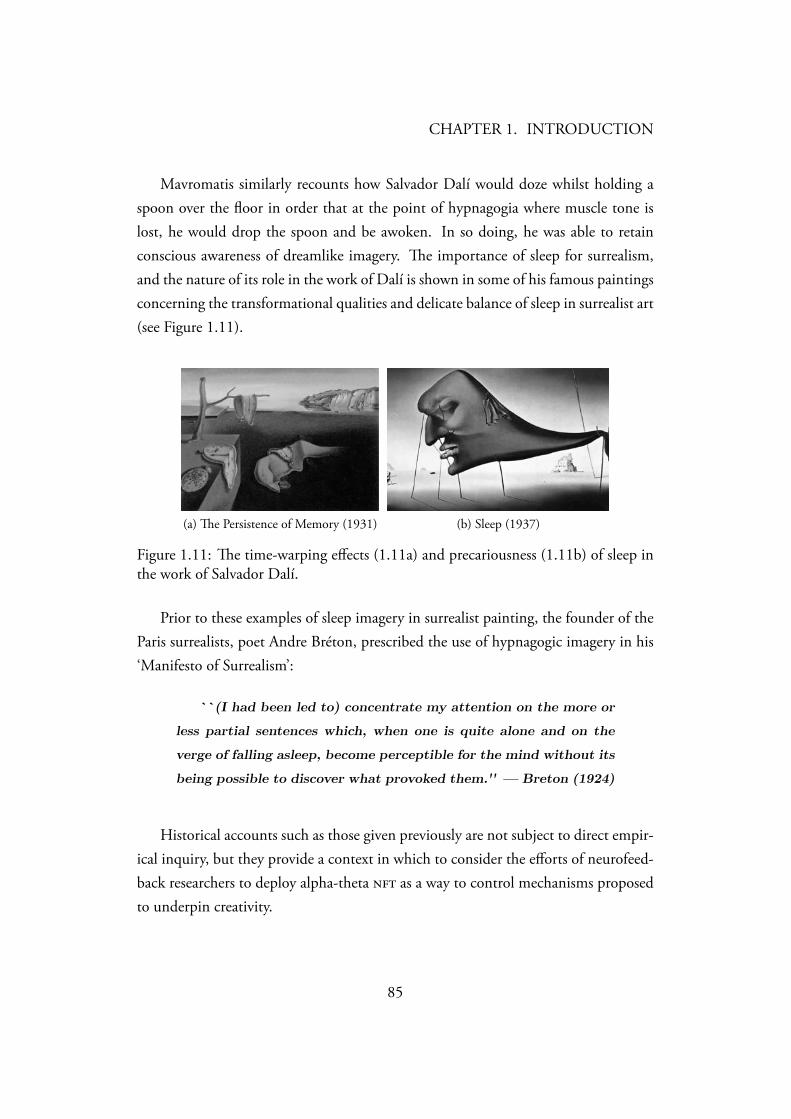
CHAPTER 1. INTRODUCTION
Mavromatis similarly recounts how Salvador Dalí would doze whilst holding aspoon over the floor in order that at the point of hypnagogia where muscle tone islost, he would drop the spoon and be awoken. In so doing, he was able to retainconscious awareness of dreamlike imagery. e importance of sleep for surrealism,and the nature of its role in the work of Dalí is shown in some of his famous paintingsconcerning the transformational qualities and delicate balance of sleep in surrealist art(see Figure 1.11).
(a) e Persistence of Memory (1931) (b) Sleep (1937)
Figure 1.11: e time-warping effects (1.11a) and precariousness (1.11b) of sleep inthe work of Salvador Dalí.
Prior to these examples of sleep imagery in surrealist painting, the founder of theParis surrealists, poet Andre Bréton, prescribed the use of hypnagogic imagery in his‘Manifesto of Surrealism’:
``(I had been led to) concentrate my attention on the more orless partial sentences which, when one is quite alone and on theverge of falling asleep, become perceptible for the mind without itsbeing possible to discover what provoked them.'' — Breton (1924)
Historical accounts such as those given previously are not subject to direct empir-ical inquiry, but they provide a context in which to consider the efforts of neurofeed-back researchers to deploy alpha-theta as a way to control mechanisms proposedto underpin creativity.
85
CHAPTER 1. INTRODUCTION
1.5.2.2 Alpha-theta neurofeedback and hypnagogia
Taking the previous accounts as a starting point, and comparing them with the knowl-edge that alpha-theta promotes hypnagogia via t/a ratio elevation (Egner et al.,2002), an outline of an empirical framework can be drawn.
is proposes that changes in t/a measures during , modulate the same psy-chological mechanisms that also accompany creative insight. Accordingly, changingthese mechanisms could thus predict changes in creativity (musicality) to a greater ex-tent than technique and communication. On this basis, the current thesis additionallysought to further isolate the possible link between alpha-theta and musical creativityby including an outcome measure specifically associated with music creation: musicimprovisation, which, as will emerge, is also thought to exhibit a similar pattern ofneuronal deactivation.
1.5.3 Musical creativity in performance
In recent years research into musical creativity in particular has increasingly used im-provisation as a means of observing the creative process as it takes place under labo-ratory conditions. Whilst it has been argued that all music performance is inherentlycreative, and the rendition of a score still requires interpretation, which may in it-self be creative (Heilman et al., 2003), the use of spontaneous ideation makes a moreexplicit call on the performer(s) to create at a given time, i.e. during an experiment.
Improvisation has been used in a series of experiments exploring the psychologicalcorrelates of music creation and assessment. (Sawyer, 2000) stresses the important roleof improvisation as a tool for examining creativity empirically, as it allows not onlythe final creative product to be examined, but it also discloses the process by which itwas created.
1.5.3.1 Improvisation as creative process
Human-human interaction has been documented as characterising the co-ordinatingbehaviours used to generate and select the content of group improvisation (Bryan-Kinns et al., 2007). In assessing musical creativity computationally, algorithmic com-position and improvisation have been compared due to their shared emergent prop-
86
CHAPTER 1. INTRODUCTION
erties (Papadopoulos and Wiggins, 1999), and the cognitive constraints on improvi-sation and creativity have also been compared in terms of the psychological structuresthat both enable and constrain both phenomena (Pearce and Wiggins, 2002).
In other psychological characterisations, musical improvisation has been likenedto Guilford’s (1950) psychometric definition of creativity as ‘Divergent inking’(Gorder, 1980; Wang, 1985) with ensuing attempts to bring musical creativity underexperimental control as measures of improvisational fluency, flexibility, elaborationand originality. ese attempts could not however distinguish measures of musical di-vergent thinking from technical competence and general intelligence. ese attemptsappeared to suffer from the same criterion problem posed by ‘Divergent inking’ asa definition of creativity in that they only encompass some attributes that may helpwith creativity, but not creativity itself.
1.5.3.2 Improvisation as creative product
More recently, the explicitly quantitative and process based approach to creativitymeasurement in improvisation has been eschewed in favour of the outcome evaluationmethod based on audience responses.
Eisenberg and ompson (2003) asked a panel to evaluate improvisation usingrating scales based on Amabile’s (1982) 3 factor Consensual Assessment Technique(). e explicitly sets out to distinguish evaluations of creativity from technicaland aesthetic valence, although as with Gorder (1980), the authors found that it wasnot possible to identify creative behaviour as a unitary phenomenon distinct fromtechnical and aesthetic factors.
1.5.3.3 Comparing music rendition and improvisation
In response to the difficulties experienced in isolating improvisational creativity fromother elements of music performance, some studies have explored the hypothesis thatmusic improvisation, as an explicit form of music creation, is substantively differentfrom music rendition. Before proceeding to consider this comparative approach, itshould however be qualified with Pressing’s (1988) assertion that no improvisation iscompletely novel, and no rendition is completely lacking in novelty.
In terms of music creation, in an online, experimentally comparable setting, im-
87
CHAPTER 1. INTRODUCTION
provisation provides an operational means of observing the mechanisms underlyingmusic creation. In comparison with offline, asynchronous music composition, impro-visation is more easily integrated into a research method as it controls for additionalinfluences on creative behaviour, and constrains the time-span in which musical rep-resentations can be evaluated, compared, and selected. is is not to say that feed-forward editing does not take place in improvisation (Pressing, 1988), however, theonline nature of both improvisation and rendition means that they are more directlycomparable than composition and rendition.
On this basis, and despite the ambiguities concerning the creative as opposedto technical/aesthetic merits of improvisation, this comparative approach is used inprocess based analyses of creativity, with a series of recent attempts to reveal the neuralcorrelates of improvisation appearing in neuroimaging studies.
e studies of Brown et al. (2006); Bengtsson et al. (2007); Limb and Braun(2008); Berkowitz and Ansari (2008) found activations across multiple brain areasduring music creation, suggesting that creativity can not be specifically associated withany brain region in isolation; this form of creativity is, in other words, a ‘moving target’(Dietrich, 2004a). However, one salient point that emerges from these studies is thatof activity in the prefrontal cortex. On the one hand Limb and Braun (2008) observedthat prefrontal areas deactivated during jazz-blues improvisation at a keyboard, whilston the other, Brown et al. (2006) found prefrontal activation during the vocalisation ofa musical response; (Bengtsson et al., 2007) found activations during an improvisationrecalled from memory; whilst (Berkowitz and Ansari, 2008) also found prefrontalactivations during the use of a five note diatonic keyboard.
is difference between fMRI studies has led Dietrich and Kanso (2010) to sur-mise that novel response generation in the Limb and Braun (2008) study was likelyto have arisen from freely selected ‘implicitly’ recalled motor sequences which didnot require the intervention of higher order cognitive functions, whilst the remainingstudies all included tasks requiring a greater degree of working memory and atten-tional organisation that would be expected to activate prefrontal brain areas. Dietrichthen goes on to draw parallels between Limb and Braun’s (2008) finding and hisown hypothesis (Dietrich, 2003), that creative responses can occur during fleetingmoments of hypofrontality: the transient inhibition of processes that organise work-ing memory, thereby allowing random and potentially creative combinations to be
88
CHAPTER 1. INTRODUCTION
mnemonically represented.
1.5.3.4 Hypnagogia, alpha-theta, and improvisation
It is worth noting at this point that in Dietrich’s (2003) hypothesis, it is argued that the signature (De Gennaro et al., 2001) that discloses “executive deficiencies” (Muzuret al., 2002) in sleep-onset, is the same signature that can be seen in alpha-theta (Egner and Gruzelier, 2004a) and the spontaneous processing of emotional content.
erefore, the previously described neurophysiolgical similarity between hypna-gogia, alpha-theta and the spontaneous processing of emotional content (creativ-ity), now expresses the latter as music improvisation, paving the way for a scientificinvestigation which examines whether modulating the common physiology modu-lates creativity.
1.6 Summarising the background context
is chapter first reviewed the origin of in the brain, and consequent the historyof .
Consequently, I reviewed applications of in healthy subjects designed to op-timise the self-regulation of hypnagogia (alpha-theta ) and motor inhibition (). Hypnagogia later forms the basis for the principal research question of thisthesis, and motor inhibition is examined secondarily.
e concept of ‘Optimal performance’ in the context of applications was con-sidered as a means of regulating the debilitating effects of performance anxiety on taskexecution, and the literature presenting prior optimal performance applicationswas reviewed.
e question of defining and measuring creativity, which forms that overridingresearch question of this dissertation was then reviewed, and the current operationaldefinition was set as the ‘Spontaneous processing of emotional content’ the productof which is subjectively and consensually agreed to be creative by a social audience.
Hypnagogia, a candidate neural correlate of creativity, was then examined as apotential mechanism for regulating creativity, especially in the light of the fact thatalpha-theta is thought to bring hypnagogia under volitional control.
89

CHAPTER 1. INTRODUCTION
Finally, music improvisation was presented as an experimental method for ob-serving both creative processing and the evoked social response, encapsulating thecombined process+product definition of creativity.
90
2Aims
2.1 Research aims
2.1.1 Primary aims
Exploring creativity by attempting to quantify and modulate it e overall aim ofthe research is to disclose creativity in a tractable way, and to attempt to modulate it.
is aim is composed of three smaller aims:
1. Define creativity in an experimentally tractable way Define creativity in away that addresses the tensions in psychology and cognitive neuroscience about howto make it experimentally tractable. e introduction to this dissertation tried toreduce this problem by exploring a proposed single basic type of creative behaviour— spontaneous processing of emotional content — through a social psychology of itscreative value.
2. Regulate creativity via hypnagogia To use applied neuroscience to modulatehypnagogia, a candidate neural correlate of spontaneous creative insight — and in sodoing reinforce physiologies underlying spontaneous creative insight.
is is a prospective aim that seeks to reinforce hypnagogic electrophysiology us-ing alpha-theta .
is reinforcement can be looked at as a short-term transient after-effect, ora long-term reinforcement effect.
91
CHAPTER 2. AIMS
3. Disclose creativity through improvisation To explore the application andcognitive neuroscience of music improvisation as a candidate scenario for observingcreativity. is is because improvisation provides a context in which two things canplausibly take place: a) the spontaneous processing of emotional content, b) the out-come of the process can be evaluated socially.
In combination, it is possible to explore whether a social definition of creativity(b) has a reliable personal antecedent (a).
2.1.2 Secondary aims
Optimise novice performance e possibility of optimising sensory-motor skill reg-ulation in novice musicians is explored.
Replicate and re-focus Egner and Gruzelier (2003) Replication of the first studyassociating with creativity is a starting point from which to advance the currentmethodology, and to begin re-focussing the approach to handle the type of basic typecreativity addressed here.
2.2 Research questions
2.2.1 Converting aims to questions
Given the aims of disclosing creativity as the spontaneous processing of emotionalcontent using music improvisation, and modulating this processing through rein-forcing hypnagogic with alpha-theta, plus the aim of reinforcing sensory-motorcontrol in novice performance — the main research questions of this dissertation areas follows:
2.2.1.1 List of research questions
. C Can measures of creativity be modulated by hypnagogia and alpha-theta ?
92
CHAPTER 2. AIMS
. Can alpha-theta be shown to regulate hypnagogic electro-physiology? Additionally, and in relation to R , can trainingbe shown to regulate sensorimotor activity?
. N Can measures relating to sensory-motor control in noviceperformance be elevated by reinforcement of sensory-motor inhibitory control via ?
. E Can changes in be associated with changes in perfor-mance?
. H As candidate neurophysiologies thoughtto disclose the spontaneous processing of emotional content, can these states be shownto address the transient hypofrontality hypothesis (Dietrich, 2003) using applied neu-roscience methods?
. I Does the operational definition of improvisationas spontaneous processing of emotional content work in distinction from other typesof performance — as a candidate for disclosing creativity in the brain and elicitinga social response that validates creative judgement, which forms of improvisation aremost useful to the experimenter.
ere’s also an additional research question about replication and picking up formprior work in this field:
. I E G () Are relevant earlier reports repli-cable?
2.3 Research method
To address the research questions, I will present the results of three studies:
93
CHAPTER 2. AIMS
2.3.1 E — Optimising music performance with neu-
rofeedback, a constructive replication
As the literature review has shown, alpha-theta has been associated with creativityimprovements in musicians (Egner and Gruzelier, 2003) and timing in dancers (Ray-mond et al., 2005a). is study serves as an attempt to replication and extend Egnerand Gruzelier (2003). As ever, replication is required, and even more so here giventhat Keizer et al. (2010a) have referred to their own failed attempt to enhance thetaband activity with . e replication part of Experiment 1 addresses R .
e proposed creativity association, has been interpreted as an interaction betweenalpha-theta and performance, possibly mediated by regulating frontal brain de-activation through ‘Transient hypofrontality’ in hypnagogia (Dietrich, 2003).
Hypofrontality has been shown to occur as a function of alpha-theta training (Eg-ner et al., 2004), sleep onset (Muzur et al., 2002), psychometric tests of creative think-ing (Fink et al., 2006) and spontaneous musical creativity (Limb and Braun, 2008).
Experiment 1 replicates Egner and Gruzelier (2003), and in so doing addressesR , , , with the additional standpoint of the transient hy-pofrontality hypothesis (Dietrich, 2003) as the mediating factor in the interactionbetween alpha-theta and creativity.
Experiment 1 also introduces the question of novice performance (R ) into the mix, given that the ‘Optimal performance’ application of may potentially augment sensory-motor processing in an unaccustomed music task.
Experiment 1 touches on the need for R (I ), although without systematically addressing the issue of improvisationtype and creative disclosure.
Finally, Experiment 1 serves as a replication of Egner and Gruzelier (2003) inaddressing R .
94
CHAPTER 2. AIMS
2.3.2 E — Interpreting the transient effects of neuro-
feedback on music performance
Experiment 1 had low statistical power due to the size of the three participant groups(n = 8). Given that the design had nonetheless appeared to shine a light on differ-ences in improvisation after — addressing R — it wasdecided to add an additional cohort to this study.
Accordingly, Experiment 2 has the same design as that of Experiment 1, howeverthe final session was immediately followed by the post-training performances,and in so doing, the design of the study was effectively changed to one that explorednot only the long-term training effects of but also the transient after-effects.
Investigations of short-term effects in Hoedlmoser et al. (2008); Ros et al.(2010) have indicated that for at least 20 minutes after , training related physi-ological effects can be observed. Exploratory comparisons between the two cohortsconfirmed that reliable differences occurred between the two alpha-theta cohorts, ra-tionalising the break-up of this design into two studies.
As a consequence, Experiment 2 becomes an examination of short-term ef-fects as an adjunct to addressing R , , , in common withExperiment 1.
2.3.3 E — Neuroelectric measures of music improvi-
sation and rendition, and the after-effects of transient diurnal
sleep on motor performance and cognition
Whilst the prior work had operated on the assumption that the transient hypofrontal-ity in hypnagogia had parallels in the spontaneous processing of emotional contentin improvisation; the missing link — confirmatory measures of improvisation —had yet to be established.
Accordingly this study set out to address R (H ) by examining evidence for transient hypofrontality in impro-visation as a preliminary step in confirming the parallels between different scenariosgiving rise to spontaneous processing of emotional content.
Additionally, and in extensions of Experiments 1 & 2, the aim of Experiment 3
95
CHAPTER 2. AIMS
was to systematically address R (I )by considering the merits of different improvisation types for creative disclosure.
Finally, and considering that Experiment 2 had raised the question of transientafter-effects of hypnagogia on motor performance, Experiment 3 considered R (C) from a new perspective. It considered frontal lobe and mo-tor function in cognitive and music performance tasks following hypnagogia. isexamined whether the short-term priming of hypofrontality with hypnagogia mighttransiently down-regulate motor function whilst up-regulating cognitive function -effectively leading to the divergent post alpha-theta results in Experiments 1 and2.
2.4 Commonalities, differences, and links between the
studies
e studies share R (C) in common. In building onprior associations between alpha-theta, hypnagogia and creativity, all the studies con-sider attempt to address Dietrich’s (2003) proposal that “transient hypofrontality isthe unifying feature of all altered states,” including sleep and moments underlyingspontaneous creative insight. In the first two studies, this proposal is assumed to bethe case, whereas the third actively explores this by examining the of improvisa-tion for frontal hypofunction.
e studies also share R (I ) incommon. e overall design of the fieldwork holds that improvisation is the idealcandidate to observe the working definition of creativity as a spontaneous processingof emotional content (online) that can also be socially evaluated as being creative (of-fline). e studies also ask the question “Which type of improvisation is appropriatefor this aim?” Experiment 3 in particular considers that improvisational skill may bea pre-requisite for attaining spontaneous processing.
e first two experiments are ostensibly part of the same data capture, yet theirdesign diverged on the key issue of post- test timing. Participants in Experiment1 waited at least one hour before carrying out post- assessments of music perfor-mance, whereas those in Experiment 2 performed immediately - revealing a hitherto
96
CHAPTER 2. AIMS
undocumented transient effect of alpha-theta . is design alteration led to thedata being treated independently.
Experiment 3 is quite different from its predecessors in that it does not employ methods to regulate hypnagogia and creativity. It does however continue to ex-amine creativity after of hypnagogia, particularly in transient mode as a response tothe surprise encounter of Experiment 2. Additionally, the role of improvisation as ameans of disclosing creativity is further developed from prior work.
e appearance of R in all three studies provides thecommon thread that unites the dissertation, and will hopefully provide useful infor-mation for those wishing to work with creativity as spontaneous processing of emo-tional content, perceived as creative in the social context.
97
3Experiment One
3.1 Introduction
e problem addressed by this experiment is that whilst alpha-theta has beenassociated with changes in creative behaviour in at least four neurofeedback studies(Green et al., 1972; Boynton, 2001; Egner and Gruzelier, 2003; Raymond et al.,2005a), clear, controlled evidence of this has yet to be discovered. e theoreticalimplications of this will be considered in the light of the long held yet empiricallylacking link between hypnagogia and creative insight, and the practical implicationswill be considered in relation to the introduction of musical improvisation as a meansof observing creative insight in laboratory conditions.
An additional problem is introduced in this study: the previously unexploredpossibility that may benefit novice music performance.
is experiment is a constructive replication of second of two studies carriedout in a population of conservatory instrumentalists, both studies were reported in Eg-ner and Gruzelier (2003). e first study, a correlational design, provided evidencethat changes in theta/alpha (t/a) dynamics across 10 sessions of alpha-theta trainingwere associated with improvements in evaluations of instrumental competence, musi-cality, and communication. e first experiment also showed within-subject effectsof a mixed /beta protocol in reducing attentional errors on the Go-NoGotask (Egner and Gruzelier, 2001). e second experiment, a between-subjects design,provided further evidence of modulated attentional performance following andbeta (Egner and Gruzelier, 2004b), and some of its data were used in disclosing
98
CHAPTER 3. EXPERIMENT ONE
resting frontal beta reductions following alpha-theta (Egner et al., 2004). issecond trial also showed further musical changes following alpha-theta , with im-provements in measures of musicality and, as a result, overall quality.
is musicality finding of the latter experiment drew some parallels withthe prior observation that alpha-theta training and the practice of hypnagogia it isthought to regulate might be harnessed in raising creative achievement (Green et al.,1972). As documented in Section 1.4.3.2, Boynton (2001) explored this associationempirically, suggesting that the wilful use of hypnagogia in either alpha-theta or re-laxation training predicted increased creative flexibility as measured psychometricallywith the Torrance Tests of Creative inking (Torrance, 1974). Additionally, Ray-mond et al. (2005a) provided some evidence that evaluations of timing and overallperformance in ballroom dance was improved following alpha-theta . Taken to-gether, the empirical support for the association between alpha-theta and creativity aswell as overall performance is equivocal, although it is considered promising that thestrongest evidence thus far came from the most rigourous investigation (Egner andGruzelier, 2003).
An empirical framework encompassing historical associations between hypna-gogia and creativity, and the potential role of alpha-theta as a means of moderatingthis relationship is outlined in Chapter 1 Section 1.5. e framework incorporatesthe role of music improvisation as an operational measure of creativity.
In the current study, the next step in using music performance to analyse thepossible link between alpha-theta, hypnagogia and creativity was to select a form ofimprovisation that whilst providing scope for creative behaviour, nonetheless alloweddifferent performances to be compared against each other. Most musical improvisa-tion (with the possible exception of free improvisation) explicitly incorporates formsof musical constraint in time and/or frequency domains, and all the empirical stud-ies discussed in Section 1.5, with the exception of Bryan-Kinns et al. (2007), used ahighly constrained ‘melodic template’ approach to measuring performance: In thisapproach, a melodic framework is provided, within which the performer makes vari-ations. e current study adopted a different method however, selecting a graphicscore called Stripsody (Berberian, 1966) (Figure 3.3 shows an excerpt of the score).Unlike the prevailing ‘melodic template’ technique, the use of a graphic score placesless constraint on the actual pitches used, but more constraint on the way content
99
CHAPTER 3. EXPERIMENT ONE
changes over time. It does so by maintaining the same stimuli over the course of theperformance - and this may help judges to compare one performance to another asthe creative differences can be compared against a set series of stimuli-response pairsrather than an evolving process of variation.
e criteria for selecting Stripsody for this study was that a vocal only improvi-sation was sought - principally to explore whether reducing instrument differencesmight also reduce error variance in analysis. Stripsody is one of the two vocal impro-visations practised at Trinity’s voice faculty¹. e technical details of the Stripsodyscore are further discussed in Section 3.3.5. e other voice improvisation techniqueused at Trinity is singing based on a phrase, e.g. “A walk in the woods.” Furtherexamples of the phrase stimuli used are listed in Section 3.3.5.3. is technique wasalso used in the study, although not for voice but instrumental improvisations, as thestudy also sought a non-vocal improvisation test that was based on the repertory thatTrinity staff were accustomed to evaluating. It was considered important that panelwho evaluated the performances had some familiarity with the improvisation methodsbeing practised as Amabile (1982) asserts that prior experience of a subject providesthe basis for identifying creativity within that subject.
In addition to testing whether the findings of the study are replicable in rela-tion to creativity, the current study introduces some further additional music perfor-mance tasks in order to consider a previously unexplored rationale for using train-ing in music performance. Considering that the preceding studies assessed expertinstrumental performance, it was proposed that novel music performance might bedifferentially affected following training.
e rationale underlying this statement is based on two points, firstly musical ex-pertise in relation to sensory-motor performance shows marked differences betweennovices and experts, with trained musicians exhibiting much stronger interaction be-tween auditory and motor processing in the brain, with auditory stimuli even evokinginvoluntary finger movements in pianists (Haueisen and Knösche, 2001), and expertmusicians disclosing a greater ability to sustain attention on a musical task (Berkowitzand Ansari, 2010); secondly, Ros et al. (2009) reported technical improvements andreduced task-time of perceptuo-motor performance in trainee micro-surgeons follow-
¹Trinity’s head of voice, Linda Hirst, was recorded giving a performance of Stripsody on the album“Songs Cathy Sang” (1988)
100
CHAPTER 3. EXPERIMENT ONE
ing training. Given these two points, it is speculated that training, whichhas already been shown to optimise trainee surgical skills, may be more likely to raiseperceptuo-motor performance in novice performance than its expert counterpart, asthe stimulus-response interaction is less likely to be operating at ceiling levels than hasbeen observed in conservatory musicians, who even at undergraduate level have expe-rienced many more years of practice than surgeons at a similar stage in their training.
A further consideration taken in staging a constructive replication of the stud-ies was in the attempt to increase the experimental control of the trial by controllingfor instrument. In both the experiments alpha-theta protocol was associatedwith improvements in music performance, yet clear difference between alpha-thetaand other groups was not observed. A possible confounding factor was that per-formances were made using different instruments, which may have interfered withratings to some extent as the instrument played or the instrument played by the asses-sor changes how performance is evaluated (Stanley et al., 2002). For this reason, thenovice-singing task also had the advantage of reducing the difference in instrumentto some degree.
In summary the current study addresses both the theoretical and practical impli-cations of previous investigations into optimising aspects of task performance.e implication of Egner and Gruzelier (2003), that alpha-theta may specificallymodulate measures relating to creativity gave rise to a new experiment, focussed onusing explicitly creative performance as an outcome measure of an intervention.Ros et al. (2009) indicated that motor performance was modulated by , giv-ing rise to an experimental rationale for using to facilitate inhibitory control innovice music performance.
3.2 Research questions
Primarily, this study explored whether sleep-onset regulation can modulate cre-ative performance. e creative behaviours explored either replicate those used inpreceding studies at the same lab (Egner and Gruzelier, 2003), or reflected the accu-mulating research interest in improvised performance as a means of observing musiccreation in the action.
Secondarily, this research also sought to examine whether the regulation of senso-
101
CHAPTER 3. EXPERIMENT ONE
rimotor would modulate novice music performance.
3.2.0.1 List of research questions
ere were five research questions in this study (see Section 2.2.1.1):
. C Can measures of creativity be modulated by hypnagogia and alpha-theta ?
. Can alpha-theta be shown to regulate hypnagogic electro-physiology? Additionally, and in relation to R , can trainingbe shown to regulate sensorimotor activity?
. N Can measures relating to sensory-motor control in noviceperformance be elevated by reinforcement of sensory-motor inhibitory control via ?
. E Can changes in be associated with changes in perfor-mance?
. I E G () Are relevant earlier reports repli-cable?
3.2.1 . C
Given the previously described framework, which proposes that alpha-theta , hyp-nagogia and creative insight all share the same reduction in higher order cognitivefunctionality, it is explored whether evaluations of musicality will be elevated follow-ing alpha-theta .
3.2.2 .
In the alpha-theta protocol, it was explored whether that the t/a ratio would be el-evated as a function of training, both within- and across-sessions. In prior work,(Egner et al., 2002; Egner and Gruzelier, 2004a) it was found that the within-session
102
CHAPTER 3. EXPERIMENT ONE
t/a increases could be predicted more reliably, with only the latter study observing t/aincreases by comparing the first and final five sessions. In the protocol it was ex-plored whether the /(theta+beta) ratio would be elevated. Reliable within-sessionincreases in the to theta, and a trend for within-session increases in the tobeta ratio have previously been documented by Vernon et al. (2003).
3.2.3 . N
As described previously, motor aspects of novice performance were explored for im-provement by . e previous theoretical discussion had proposed that self-regulation of task-based motor responses are already highly adapted in student musi-cians due to their many years of prior training, and it was held that motor regulationwas already at or close to a ceiling level in expert performance in that population,which may account for the lack of appreciable effects on music performance in(Egner and Gruzelier, 2003). In contrast, it was explored whether novice perfor-mance would be optimised following , and that this would be manifested inimproved measures of technical competence.
3.2.4 . E
Although the experiment was primarily designed to enable between-groups compar-isons in identifying protocol specific effects on aspects of music performance, it wasadditionally explored whether within-subjects measures of changes in music perfor-mance would co-vary as a function of within-subjects measures of neurofeedback re-lated .
changes are characterised as within- and across-session changes in ratios(t/a within the alpha-theta group, and /(theta+beta) within the group), andit was explored whether that changes in these measures would correspond to changesin audience evaluations of creativity and technical competence within the alpha-thetaand groups respectively.
3.2.5 . I E G ()
Are relevant prior post alpha-theta results replicable?
103
CHAPTER 3. EXPERIMENT ONE
3.3 Method
3.3.1 Participants
An advertisement inviting volunteers to join the experiment was distributed by emailand flyer around , the Royal College of Music, Goldsmiths University of London,Guildhall and Kings College. 24 music students volunteered for participation in theexperiment (10 females, 13 males; mean age 26, ± 9.20). All of the participants wereinstrumentalists with a non-expert level of singing ability - this ensured participantswere able to perform both non-expert singing and expert instrumental tasks. eywere allocated to experimental groups in the order of joining the study. No paymentwas made for participation. An internal ethics committee at Goldsmiths approvedthe study with no alterations.
Creech et al. (2008) provided evidence disclosing differences of musical historyon musical behaviour by comparing musicians that played in non-classical and clas-sical traditions. e current study was comprised of 1 Jazz bassist, and 23 classicalinstrumentalists: 7 pianists, 4 guitarists, 3 flautists, two violinists, and a single bassist,percussionist, oboeist, cellist, clarinetist, and trumpeter. Creech et al.’s (2008) studyfound that non-classical musicians attached greater importance to improvising music,whereas their classical counterparts ranked ability to improvise as the least importantmusical skill. In a study such as this, which uses improvisation to elicit and measurecreative behaviour, the effect of such musical histories on performance is likely to bea contributory factor in the response of participants to the intervention.
From a neuroscientific perspective, recent electrophysiological studies of classicaland jazz improvisation (Bengtsson et al. (2007) and Limb and Braun (2008) respec-tively) have shown differing frontal neurophysiologies. e neural differences were, inpart, attributed to the finely developed improvisational skill of Jazz musicians (Limband Braun, 2008), and the relative deactivation of frontal cortices seen in the Jazzstudy supports the approach transient hypofrontality hypothesis (Dietrich, 2003) thatthis study also explores. Given the dominance of classical musicians in this study, theparticipants’ level of improvisation skills was basic at best, and thus the study investi-gated improvisation ability from a position of minimal prior engagement.
104
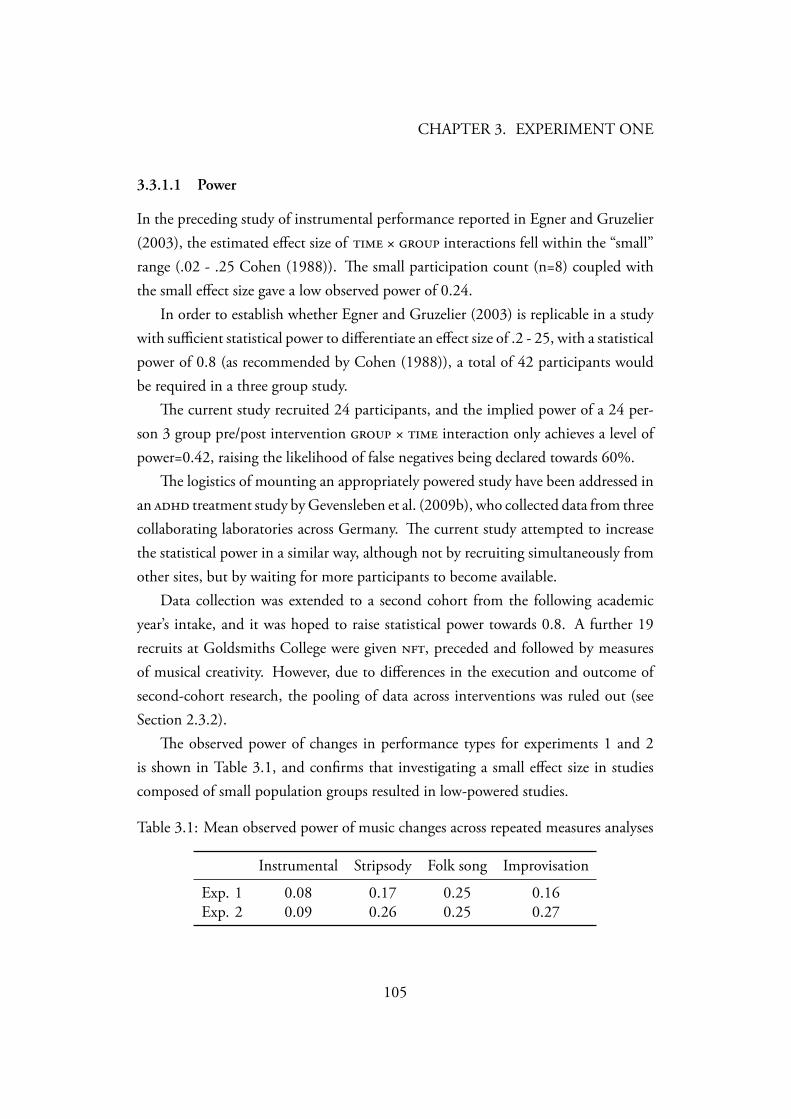
CHAPTER 3. EXPERIMENT ONE
3.3.1.1 Power
In the preceding study of instrumental performance reported in Egner and Gruzelier(2003), the estimated effect size of × interactions fell within the “small”range (.02 - .25 Cohen (1988)). e small participation count (n=8) coupled withthe small effect size gave a low observed power of 0.24.
In order to establish whether Egner and Gruzelier (2003) is replicable in a studywith sufficient statistical power to differentiate an effect size of .2 - 25, with a statisticalpower of 0.8 (as recommended by Cohen (1988)), a total of 42 participants wouldbe required in a three group study.
e current study recruited 24 participants, and the implied power of a 24 per-son 3 group pre/post intervention × interaction only achieves a level ofpower=0.42, raising the likelihood of false negatives being declared towards 60%.
e logistics of mounting an appropriately powered study have been addressed inan treatment study by Gevensleben et al. (2009b), who collected data from threecollaborating laboratories across Germany. e current study attempted to increasethe statistical power in a similar way, although not by recruiting simultaneously fromother sites, but by waiting for more participants to become available.
Data collection was extended to a second cohort from the following academicyear’s intake, and it was hoped to raise statistical power towards 0.8. A further 19recruits at Goldsmiths College were given , preceded and followed by measuresof musical creativity. However, due to differences in the execution and outcome ofsecond-cohort research, the pooling of data across interventions was ruled out (seeSection 2.3.2).
e observed power of changes in performance types for experiments 1 and 2is shown in Table 3.1, and confirms that investigating a small effect size in studiescomposed of small population groups resulted in low-powered studies.
Table 3.1: Mean observed power of music changes across repeated measures analyses
Instrumental Stripsody Folk song Improvisation
Exp. 1 0.08 0.17 0.25 0.16Exp. 2 0.09 0.26 0.25 0.27
105
CHAPTER 3. EXPERIMENT ONE
3.3.2 Design
Instrumental musicians volunteering to participate in the study were allocated intothree experimental groups in the order of joining the study: the first, second andthird members were allocated to alpha-theta, and control groups respectively,and this pattern continued with all following participants.
In total participant groups numbered:
• alpha-theta (n=8)
• (n=8)
• no-training controls (n=8).
On joining, all participants commenced the experiment with a filmed perfor-mance comprising 4 pieces:
• Folk song with accompaniment (Britten, 1948)
• Vocal improvisation from graphic score (Berberian, 1966)
• Instrumental from participant’s own repertoire
• Instrumental improvisation on a theme
Subsequently, participants in groups received training sessions every 3 (±4)until they had received 10 sessions; controls received no intervention for 30 (±17)days. is group was included to control for the effects of time and practice on thepost-training measures. One control participant dropped out of the study as theywere unable to attend post-intervention testing appointments.
Finally, all participants repeated the performance carried out at the start of thestudy.
3.3.3 Neurofeedback Procedure
Neurofeedback training was carried out with Spectrum International, Inc. EEgersoftware (Version 4.13c) using the ought Technology pre-amp and Procomp am-plifier. e software provides both alpha-theta and feedback protocols.
106
CHAPTER 3. EXPERIMENT ONE
e signal was recorded referentially with 3 passive electrodes: the signal electrodeover the cortical location being recorded (Pz in alpha-theta and Cz in ); the ref-erence electrode on the left earlobe; the ground electrode on the right earlobe. eelectrode locations were prepared with ‘NuPrep,’ a gentle abrasive detergent to re-move loose skin, and the electrodes were attached with ‘Ten20’ conductive paste. e is interpreted as voltage differences between signal and reference, with respect tothe ground electrode, an isolated current-limited input used to provide a zero voltagepoint.
e recording was amplified, impedance was kept below 5 kilo-ohms, and thesignal acquired at a 256 Hz sampling rate. e raw samples were lowpass-filtered bya 40 Hz filter to remove ambient noise (mainly in the form of European standardelectrical mains interference at 50 Hz). A voltage threshold was set at 60 microvoltsto remove electrical potentials created by muscle cells, which have an average range ofbetween 50 microvolts and 30 millivolts.
e resulting lowpass signal was fed to a number of processing streams, whicheither trigger the provision of rewarding feedback, or inhibit rewards. In each stream,the lowpass signal is bandpass-filtered into various frequency bands using Infinite Im-pulse Response () digital filters. e filter output is fed to an exponentially weighted30 second moving average filter which produces a short-term average (peak-to-peak),the time constant of the averaging filter being 0.5 seconds. e peak-to-peak voltageis calculated as the voltage difference between the maximum and minimum points ofa signal. e moving average from each stream is displayed to the trainee, and is usedto determine whether reward should be provided (EEGer Neurofeedback Software,2005).
Training and protocol specific details regarding feedback are given in the followingsection.
3.3.4 Neurofeedback Training
In order to determine whether neurofeedback can be used to learn how to change parameters, participants attended a course of ten training sessions. Training sessionswere time-tabled and carried out by the experimenter who ensured recordingswere made above the same cortical location each time, with the minimum of inter-
107
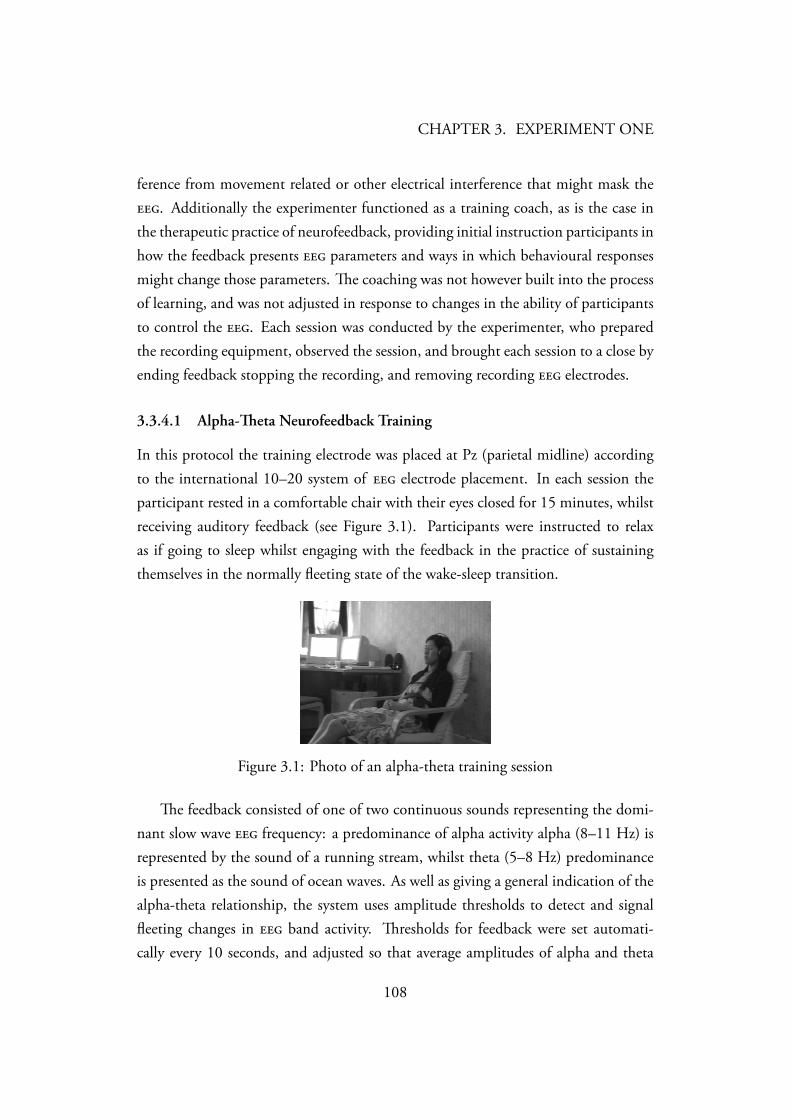
CHAPTER 3. EXPERIMENT ONE
ference from movement related or other electrical interference that might mask the. Additionally the experimenter functioned as a training coach, as is the case inthe therapeutic practice of neurofeedback, providing initial instruction participants inhow the feedback presents parameters and ways in which behavioural responsesmight change those parameters. e coaching was not however built into the processof learning, and was not adjusted in response to changes in the ability of participantsto control the . Each session was conducted by the experimenter, who preparedthe recording equipment, observed the session, and brought each session to a close byending feedback stopping the recording, and removing recording electrodes.
3.3.4.1 Alpha-eta Neurofeedback Training
In this protocol the training electrode was placed at Pz (parietal midline) accordingto the international 10–20 system of electrode placement. In each session theparticipant rested in a comfortable chair with their eyes closed for 15 minutes, whilstreceiving auditory feedback (see Figure 3.1). Participants were instructed to relaxas if going to sleep whilst engaging with the feedback in the practice of sustainingthemselves in the normally fleeting state of the wake-sleep transition.
Figure 3.1: Photo of an alpha-theta training session
e feedback consisted of one of two continuous sounds representing the domi-nant slow wave frequency: a predominance of alpha activity alpha (8–11 Hz) isrepresented by the sound of a running stream, whilst theta (5–8 Hz) predominanceis presented as the sound of ocean waves. As well as giving a general indication of thealpha-theta relationship, the system uses amplitude thresholds to detect and signalfleeting changes in band activity. resholds for feedback were set automati-cally every 10 seconds, and adjusted so that average amplitudes of alpha and theta
108
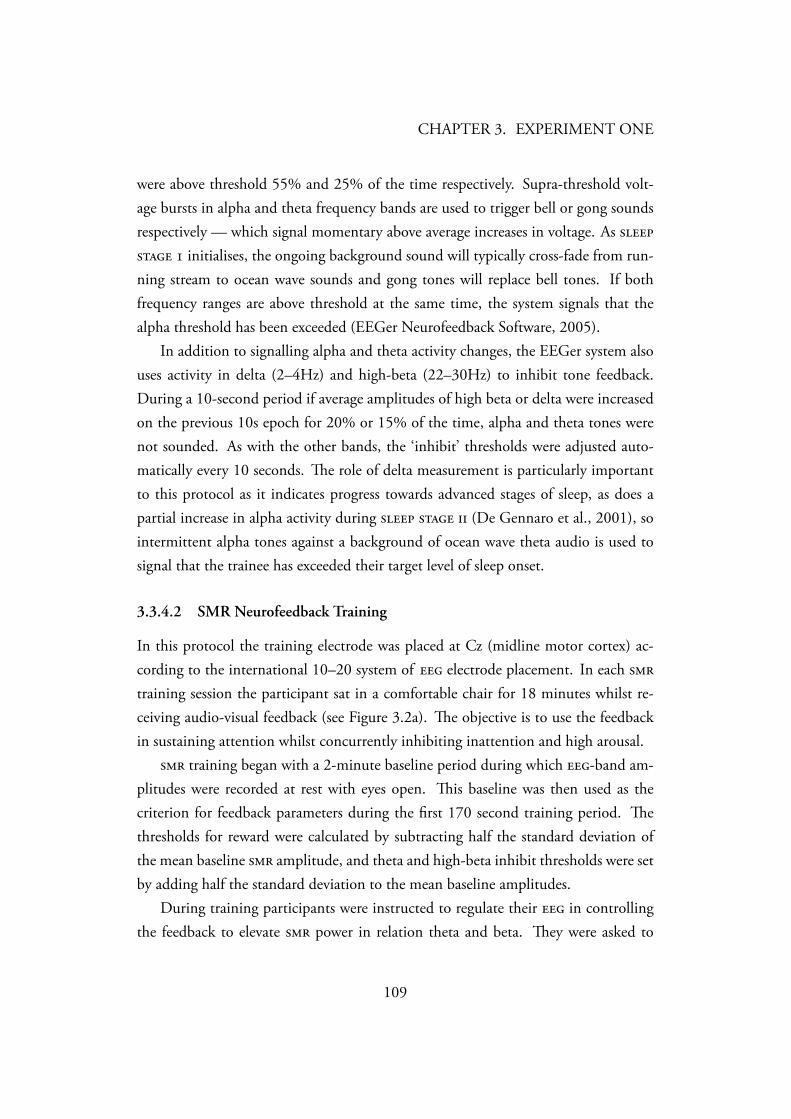
CHAPTER 3. EXPERIMENT ONE
were above threshold 55% and 25% of the time respectively. Supra-threshold volt-age bursts in alpha and theta frequency bands are used to trigger bell or gong soundsrespectively — which signal momentary above average increases in voltage. As initialises, the ongoing background sound will typically cross-fade from run-ning stream to ocean wave sounds and gong tones will replace bell tones. If bothfrequency ranges are above threshold at the same time, the system signals that thealpha threshold has been exceeded (EEGer Neurofeedback Software, 2005).
In addition to signalling alpha and theta activity changes, the EEGer system alsouses activity in delta (2–4Hz) and high-beta (22–30Hz) to inhibit tone feedback.During a 10-second period if average amplitudes of high beta or delta were increasedon the previous 10s epoch for 20% or 15% of the time, alpha and theta tones werenot sounded. As with the other bands, the ‘inhibit’ thresholds were adjusted auto-matically every 10 seconds. e role of delta measurement is particularly importantto this protocol as it indicates progress towards advanced stages of sleep, as does apartial increase in alpha activity during (De Gennaro et al., 2001), sointermittent alpha tones against a background of ocean wave theta audio is used tosignal that the trainee has exceeded their target level of sleep onset.
3.3.4.2 SMR Neurofeedback Training
In this protocol the training electrode was placed at Cz (midline motor cortex) ac-cording to the international 10–20 system of electrode placement. In each training session the participant sat in a comfortable chair for 18 minutes whilst re-ceiving audio-visual feedback (see Figure 3.2a). e objective is to use the feedbackin sustaining attention whilst concurrently inhibiting inattention and high arousal.
training began with a 2-minute baseline period during which -band am-plitudes were recorded at rest with eyes open. is baseline was then used as thecriterion for feedback parameters during the first 170 second training period. ethresholds for reward were calculated by subtracting half the standard deviation ofthe mean baseline amplitude, and theta and high-beta inhibit thresholds were setby adding half the standard deviation to the mean baseline amplitudes.
During training participants were instructed to regulate their in controllingthe feedback to elevate power in relation theta and beta. ey were asked to
109
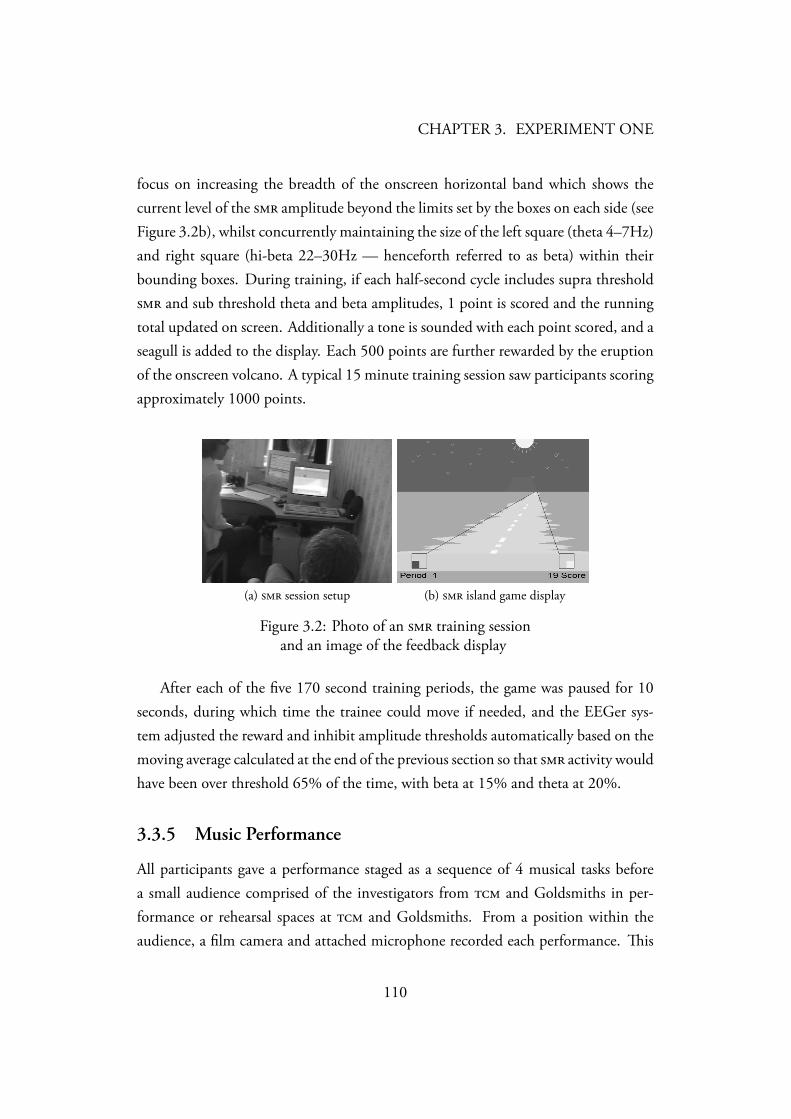
CHAPTER 3. EXPERIMENT ONE
focus on increasing the breadth of the onscreen horizontal band which shows thecurrent level of the amplitude beyond the limits set by the boxes on each side (seeFigure 3.2b), whilst concurrently maintaining the size of the left square (theta 4–7Hz)and right square (hi-beta 22–30Hz — henceforth referred to as beta) within theirbounding boxes. During training, if each half-second cycle includes supra threshold and sub threshold theta and beta amplitudes, 1 point is scored and the runningtotal updated on screen. Additionally a tone is sounded with each point scored, and aseagull is added to the display. Each 500 points are further rewarded by the eruptionof the onscreen volcano. A typical 15 minute training session saw participants scoringapproximately 1000 points.
(a) session setup (b) island game display
Figure 3.2: Photo of an training sessionand an image of the feedback display
After each of the five 170 second training periods, the game was paused for 10seconds, during which time the trainee could move if needed, and the EEGer sys-tem adjusted the reward and inhibit amplitude thresholds automatically based on themoving average calculated at the end of the previous section so that activity wouldhave been over threshold 65% of the time, with beta at 15% and theta at 20%.
3.3.5 Music Performance
All participants gave a performance staged as a sequence of 4 musical tasks beforea small audience comprised of the investigators from and Goldsmiths in per-formance or rehearsal spaces at and Goldsmiths. From a position within theaudience, a film camera and attached microphone recorded each performance. is
110
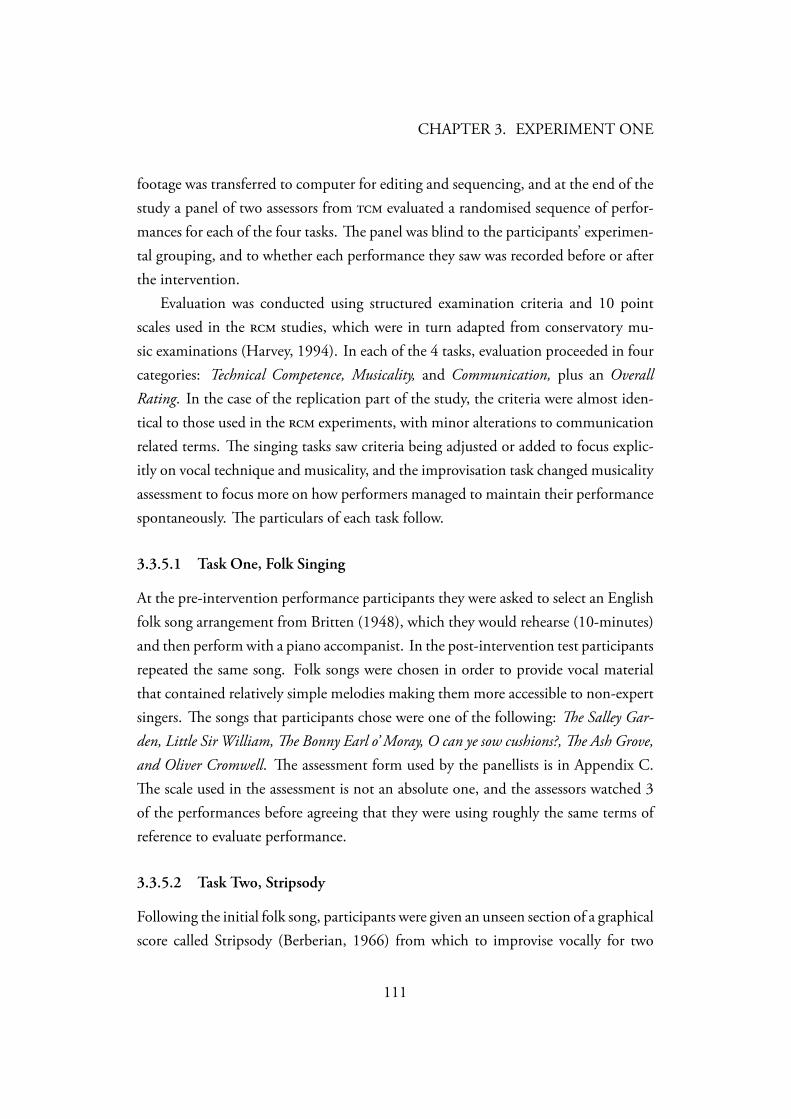
CHAPTER 3. EXPERIMENT ONE
footage was transferred to computer for editing and sequencing, and at the end of thestudy a panel of two assessors from evaluated a randomised sequence of perfor-mances for each of the four tasks. e panel was blind to the participants’ experimen-tal grouping, and to whether each performance they saw was recorded before or afterthe intervention.
Evaluation was conducted using structured examination criteria and 10 pointscales used in the studies, which were in turn adapted from conservatory mu-sic examinations (Harvey, 1994). In each of the 4 tasks, evaluation proceeded in fourcategories: Technical Competence, Musicality, and Communication, plus an OverallRating. In the case of the replication part of the study, the criteria were almost iden-tical to those used in the experiments, with minor alterations to communicationrelated terms. e singing tasks saw criteria being adjusted or added to focus explic-itly on vocal technique and musicality, and the improvisation task changed musicalityassessment to focus more on how performers managed to maintain their performancespontaneously. e particulars of each task follow.
3.3.5.1 Task One, Folk Singing
At the pre-intervention performance participants they were asked to select an Englishfolk song arrangement from Britten (1948), which they would rehearse (10-minutes)and then perform with a piano accompanist. In the post-intervention test participantsrepeated the same song. Folk songs were chosen in order to provide vocal materialthat contained relatively simple melodies making them more accessible to non-expertsingers. e songs that participants chose were one of the following: e Salley Gar-den, Little Sir William, e Bonny Earl o’ Moray, O can ye sow cushions?, e Ash Grove,and Oliver Cromwell. e assessment form used by the panellists is in Appendix C.e scale used in the assessment is not an absolute one, and the assessors watched 3of the performances before agreeing that they were using roughly the same terms ofreference to evaluate performance.
3.3.5.2 Task Two, Stripsody
Following the initial folk song, participants were given an unseen section of a graphicalscore called Stripsody (Berberian, 1966) from which to improvise vocally for two
111
CHAPTER 3. EXPERIMENT ONE
minutes. Stripsody is a ‘graphic notation’ taking its name from cartoon strips, andwas briefly described in Section 3.1. e first page of the score is shown in Figure 3.3.It is a cued improvisation that is loosely constrained in time and frequency; musicalstimuli are found within a series of cartoon-strips, and their position and size representtheir pitch, timing and volume. In the pre-training performances participants weregiven the first half of the score from which to perform, and the latter half in post-training tests. e assessment form used by the panellists is in Appendix D, and aswith the folk singing, the panel applied the scale in an ad-hoc, subjective way.
Figure 3.3: e strips are prefaced with the instructions: “e score should be per-formed as if by a radio sound man who must provide all the sound effects with hisvoice.” (Berberian, 1966)
3.3.5.3 Task ree, Instrumental Performance
In replication of the methods in the study, participants were invited to play thesame solo instrumental piece from their repertoire in pre- and post-training tests. eassessment form used by the panellists is in Appendix E. Unlike the vocal perfor-mances, the panel were encouraged to compare and assess instrumental performances
112
CHAPTER 3. EXPERIMENT ONE
in relation to music degree standards.
3.3.5.4 Instrumental Improvisation
Finally participants were given a task that was based on an auditioning exercise givento prospective students at . At both pre- and post-training stages, participantsselected any descriptive phrase from a list, which they then interpreted as the basisfor a 2-minute instrumental improvisation. No further instructions were given. ephrases were: “First steps on the moon,” “Day at the market,” “Afternoon at the zoo,” “Tripon safari,” “Flying over London,” “Walk through the woods,” “Bank robbery,” “High speedcar chase,” “Crossing a derelict rope bridge,” “Deep sea dive,” “A tearful farewell,” and “Araging storm.” As with the instrumental solo, the marking scheme applied here wasbased on degree classification standards, and is contained in Appendix F.
3.3.5.5 Contributions
Some of the data for this experiment (12 cases) was collected with the collab-oration of co-students Shama Rahman, Katie Bulpin, and Alexander Rass. esestudents also helped with arranging music performances for twelve cases, and filmedone performance. I completed filming, collected further and control participantdata (11 cases), and edited and presented the performance footage to the panellists(Linda Hirst and Patricia Holmes) who provided the music evaluations documentedbelow. equipment and training was provided by Tony Steffert and Tomas Ros,and Tony also helped to set up the laboratory at Trinity College of Music. emusic appraisal criteria were reviewed from the studies, and agreed or added to incollaboration with Linda Hirst, Sophie Grimmer, Clare Nelson and Patricia Holmesat Trinity College of Music. Kit Venables and Tom Gisby assisted with the setupof sound and video recording equipment, and Claire Nelson and Fred Mollitor pro-vided me with access to the Trinity College of Music site and resources, including theperformance spaces, the laboratory, and the library and computing facilities.
3.3.6 Statistical Analysis
e study design included two main components to be analysed statistically: the train-ing data in alpha-theta and training groups, and the panel assessment of pre-post
113
CHAPTER 3. EXPERIMENT ONE
intervention music performance in three groups. e relations between the two werealso examined.
3.3.6.1 Neurofeedback training
For logistical reasons, the time of day for training appointments could not be heldconstant across the study. Comparisons across sessions could consequently introduceconfounding factors resulting from changes in amount of sleep on the preceding nightor nights (Cajochen et al., 1995; Aeschbach et al., 2001), spontaneous cognitive ac-tivity (Laufs et al., 2003), and time between eating and recording (Fishbein et al.,1990). us, according to the method introduced by Lubar et al. (1995) neurofeed-back learning was assessed as an increase in the training ratio, that is the amplitudeof the (rewarded) training frequency relative to another (inhibited) frequency or fre-quencies. In the case of the alpha-theta protocol training effectiveness was measuredas the t/a ratio, and in the protocol the /(theta+beta) ratio.
Neurofeedback ‘learning’ was expressed as evidence of a progressive raising oftraining ratios either within or across sessions. is was analysed with a repeatedmeasures two-way ² assessing two factors: the 10 sessions, and the 5 × 3-minutetraining periods³ within each of those 15-minute sessions. is analytical approachis consistent with related studies (Egner et al. (2002); Egner and Gruzelier (2004a)documented within-session increases in the t/a ratio, and Vernon et al. (2003) foundincreases in to theta and to beta relations with this approach).
3.3.6.2 Music Performance
Summary of measures In summary, the selected music performances and their mea-sures are shown in Table 3.2. e judges who provided performance measurementsevaluated the vocal tasks as novice performances, applying scores in relation to theother performances in the set and according to their intuitions about performancevalue. In the assessing the creative value of behaviour, rater agreement and social
²In all calculations, Mauchly’s test was used to screen compared data sets for homogeneityof (co)variance; in cases where assumed sphericity was not met, Greenhouse-Geisser corrections to thedegrees of freedom were applied.
³this method is in itself a product of training procedures, in which trainees are given 10-second“blink-breaks” every three minutes to move if necessary, and review their performance.
114
CHAPTER 3. EXPERIMENT ONE
psychology is the chosen method of determining creative worth relative to the do-main in which it is being carried out (as practised by Amabile (1996) and Martindale(1999)). With instrumental performances, and since the participants were studentinstrumentalists, the judges used the music degree scoring framework, so a score of7 to 10 would equate to a first class performance for example. e score sheets usedby the panel are shown in Appendices C, D, E and F. Where panel ratings demon-strated agreement; their combined score was then used to generate a single measureof change for use as the dependent variable in an analysis that assessed effects on performance. e participants were not provided with information on anyof the measures being drawn from their performances.
e impact of a given creativity rating scheme on raters, and the way they ap-ply the scheme, has been conceptualised in several ways in the area of creativity re-search. e initial psychometric style developed by (Mednick and Mednick, 1967a)and (Guilford, 1978) operationalises creativity into a metric enabling stimulus re-sponse pairs to be counted and compared under experimental conditions. Gorder(1980) applied Guilford’s (1978) metric to music phrase completion tasks, but foundthat high counts of stimulus-response pairs were reliably predicted by high technicalcompetence rather than perceived creativity. Amabile (1982) employed a holistic ap-proach towards defining creativity, arguing that the reductionist approach was stillprone to unmitigated subjectivity in the setting and measurement of creative metrics.Having confirmed the agreement within a given panel’s subjective view, her techniquethen uses factor analysis to distinguish their conception of creativity from potentiallyconfounding factors: aesthetics and technicality.
e conceptualisation of assessment dimensions has also taken place in the con-servatory evaluation tradition, although McPherson and ompson (1998) describehow this clashes to a greater degree with the holistic approach advocated by someassessors. Whilst it is true that the statistical approach to evaluating performance ascomponents is a good way of profiling inter-rater-reliability; the validity of such anassessment is challenged by those who argue that the holistic impression supersedesthe componential view because of the complex inter-variations that give an overallimpression. Perhaps because of this conceptual tension, the conservatory literaturehas not advanced a specific measure of creativity in the way that psychologists haveattempted to.
115
CHAPTER 3. EXPERIMENT ONE
e current study employed assessment criteria from the conservatory tradition(Taylor, 2005), asking raters to score overall, technical, interpretative and presenta-tional values. In their standard usage for music exams, these variables are used toproduce a single final grade, and the selected panellists from Trinity college of mu-sic were familiar with their application. For the purpose of measuring inter-rater-reliability however, and of isolating possible creativity differences on interpretativemeasures, the individual ratings were used in the study’s statistical analyses.
116
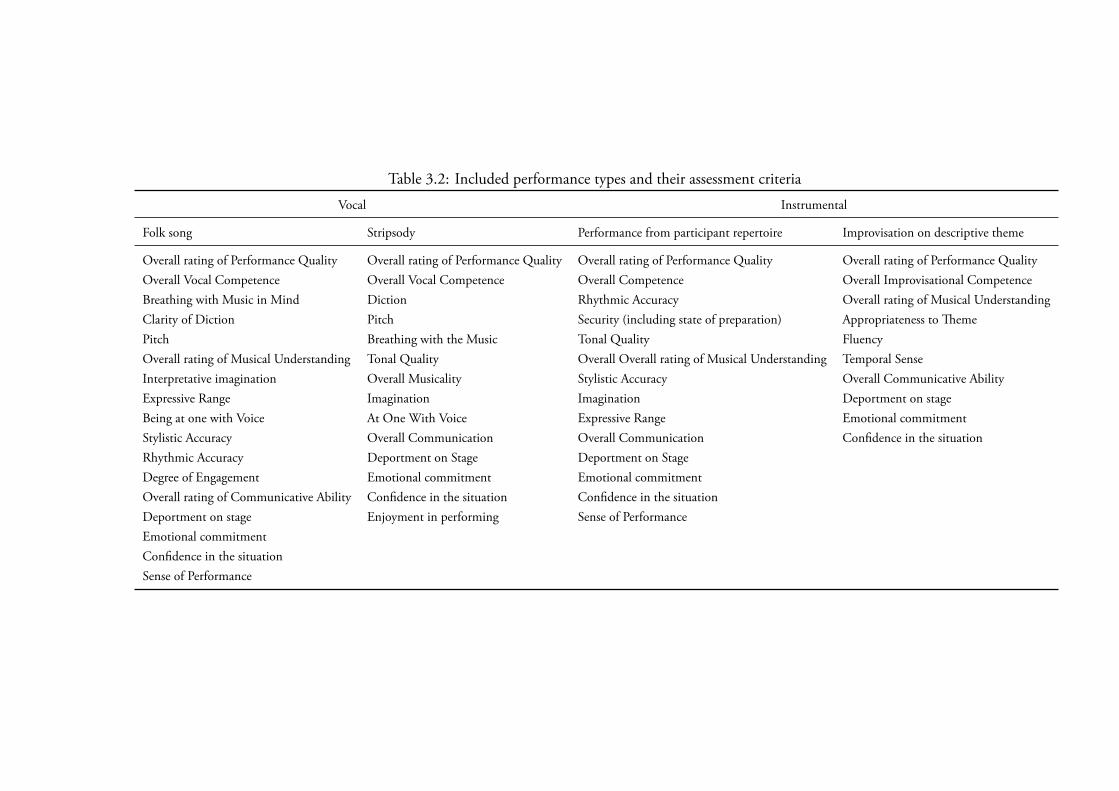
Table 3.2: Included performance types and their assessment criteria
Vocal Instrumental
Folk song Stripsody Performance from participant repertoire Improvisation on descriptive theme
Overall rating of Performance Quality Overall rating of Performance Quality Overall rating of Performance Quality Overall rating of Performance QualityOverall Vocal Competence Overall Vocal Competence Overall Competence Overall Improvisational CompetenceBreathing with Music in Mind Diction Rhythmic Accuracy Overall rating of Musical UnderstandingClarity of Diction Pitch Security (including state of preparation) Appropriateness to emePitch Breathing with the Music Tonal Quality FluencyOverall rating of Musical Understanding Tonal Quality Overall Overall rating of Musical Understanding Temporal SenseInterpretative imagination Overall Musicality Stylistic Accuracy Overall Communicative AbilityExpressive Range Imagination Imagination Deportment on stageBeing at one with Voice At One With Voice Expressive Range Emotional commitmentStylistic Accuracy Overall Communication Overall Communication Confidence in the situationRhythmic Accuracy Deportment on Stage Deportment on StageDegree of Engagement Emotional commitment Emotional commitmentOverall rating of Communicative Ability Confidence in the situation Confidence in the situationDeportment on stage Enjoyment in performing Sense of PerformanceEmotional commitmentConfidence in the situationSense of Performance
CHAPTER 3. EXPERIMENT ONE
Inter Rater Agreement Subjective ratings of performance amongst the panel weresubject to agreement analysis as a first step to assessing the validity of the assessmentexercise. An Intraclass Correlation Coefficient () was calculated to measure con-sistency of agreement. is is defined as a two-way random effects model, and wasemployed on the basis that both the performers and judges came from random sam-ples. e average measures coefficient (‘C-k type’ — McGraw and Wong (1996)) isused to assess consistency between ratings.
Differences pre-intervention A one-way was performed on the pre-interventionmeasures of music performance to probe for group differences at baseline. e resultsof this analysis determined the choice of test the measure post intervention change
Differences post-intervention Contingent on rater-consistency, a rater averaged pre-and post-intervention rating of performance was calculated for each participant, anapproach used in comparable studies of panel assessment (Egner and Gruzelier, 2003;ompson and Williamon, 2003; ompson et al., 1998).
If groups differed at baseline on a given performance measure (see previous sec-tion 3.3.6.2), the post intervention means were compared in an analysis of covari-ance (), with the pre-intervention measure as the covariate, and the post-intervention measure as the dependent variable. e was chosen over themore widely used repeated measures as it improves the analysis of the Indepen-dent/Dependent Variable relationship by minimising sampling error variance. Anal-ysis of covariance achieves this by adjusting for pre-intervention differences, providedthe regression of each group is sufficiently homogeneous with other groups.
If groups did not significantly differ at baseline, their pre-post changes were com-pared by means of a repeated measures with two levels (pre and post interven-tion).
3.3.6.3 Music and training changes
e within-subjects relationship between changes in music performance and ra-tios were assessed by assessing the significance of training as a covariate of musicchange, the dependent variable. In both and music measures, the index of change
118

CHAPTER 3. EXPERIMENT ONE
was calculated as latter data minus former data (e.g. second half of training minus for-mer half ), divided by former data. is approach measures late data in proportion toearly data.
Change =(post− pre)
pre
119
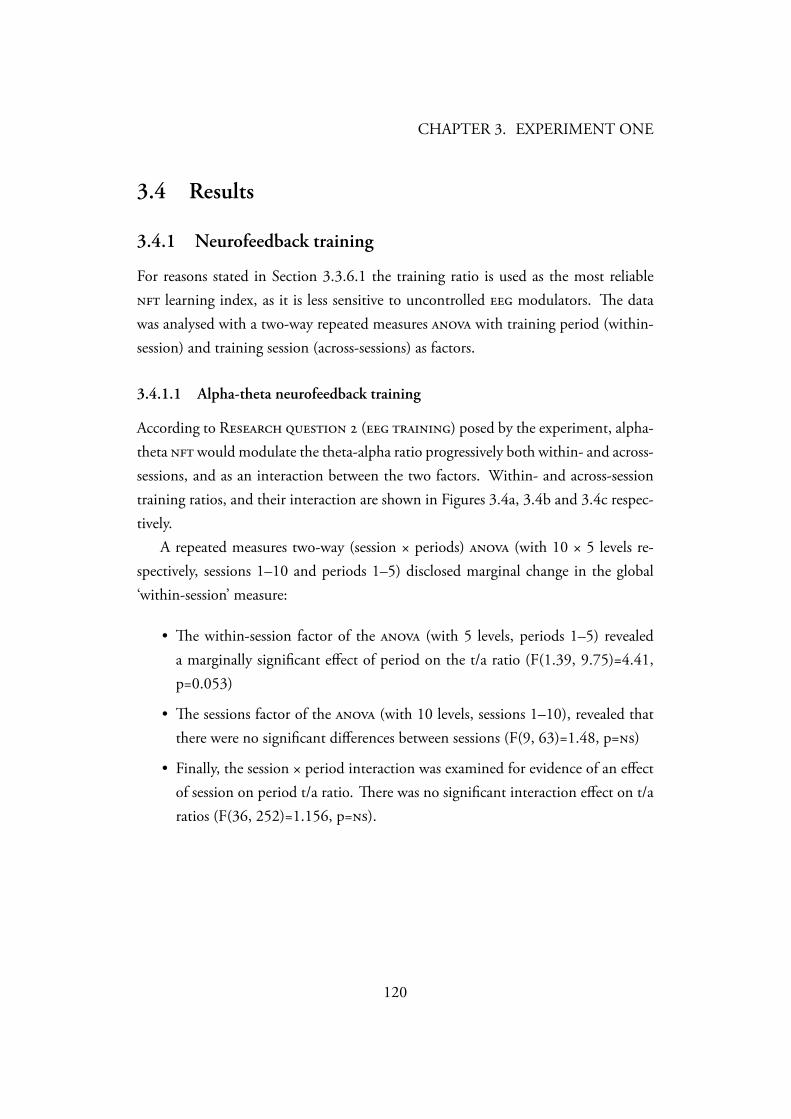
CHAPTER 3. EXPERIMENT ONE
3.4 Results
3.4.1 Neurofeedback training
For reasons stated in Section 3.3.6.1 the training ratio is used as the most reliable learning index, as it is less sensitive to uncontrolled modulators. e datawas analysed with a two-way repeated measures with training period (within-session) and training session (across-sessions) as factors.
3.4.1.1 Alpha-theta neurofeedback training
According to R ( ) posed by the experiment, alpha-theta would modulate the theta-alpha ratio progressively both within- and across-sessions, and as an interaction between the two factors. Within- and across-sessiontraining ratios, and their interaction are shown in Figures 3.4a, 3.4b and 3.4c respec-tively.
A repeated measures two-way (session × periods) (with 10 × 5 levels re-spectively, sessions 1–10 and periods 1–5) disclosed marginal change in the global‘within-session’ measure:
• e within-session factor of the (with 5 levels, periods 1–5) revealeda marginally significant effect of period on the t/a ratio (F(1.39, 9.75)=4.41,p=0.053)
• e sessions factor of the (with 10 levels, sessions 1–10), revealed thatthere were no significant differences between sessions (F(9, 63)=1.48, p=)
• Finally, the session × period interaction was examined for evidence of an effectof session on period t/a ratio. ere was no significant interaction effect on t/aratios (F(36, 252)=1.156, p=).
120
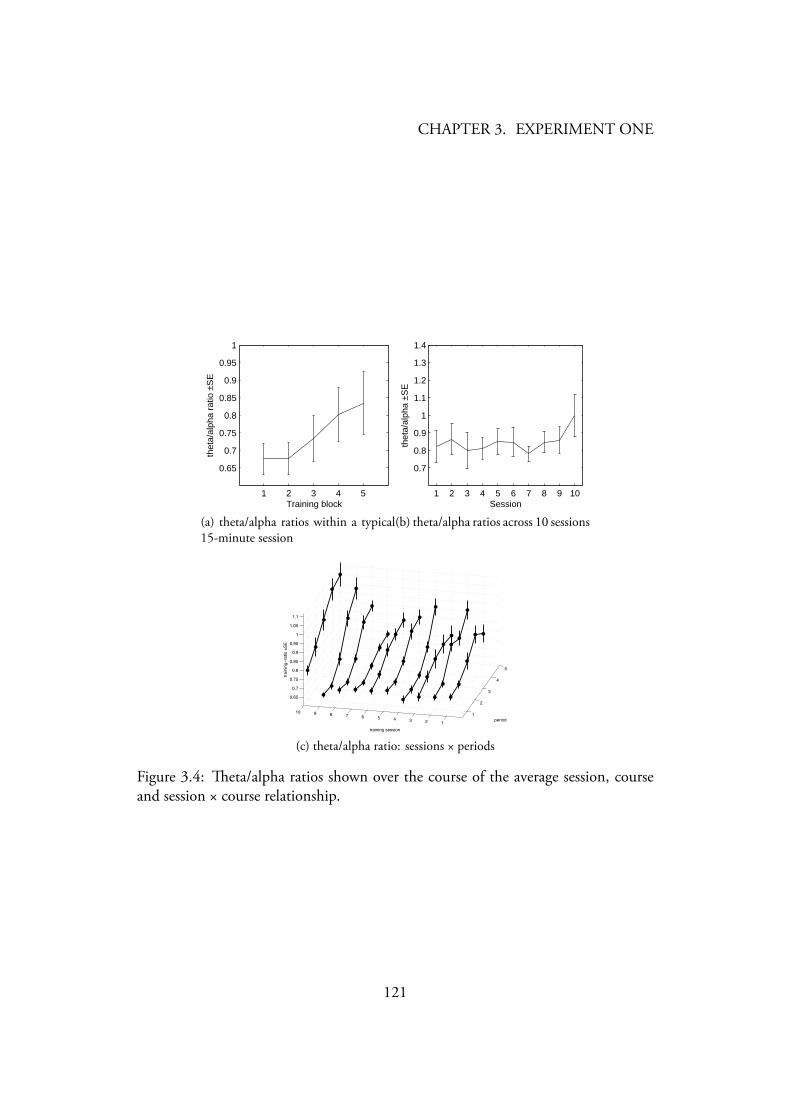
CHAPTER 3. EXPERIMENT ONE
1 2 3 4 5
0.65
0.7
0.75
0.8
0.85
0.9
0.95
1
Training block
thet
a/al
pha
ratio
±S
E
(a) theta/alpha ratios within a typical15-minute session
1 2 3 4 5 6 7 8 9 10
0.7
0.8
0.9
1
1.1
1.2
1.3
1.4
Session
thet
a/al
pha
±SE
(b) theta/alpha ratios across 10 sessions
1
2
3
4
5
12345678910
0.65
0.7
0.75
0.8
0.85
0.9
0.95
1
1.05
1.1
period
training session
trai
ning−
ratio
±S
E
(c) theta/alpha ratio: sessions × periods
Figure 3.4: eta/alpha ratios shown over the course of the average session, courseand session × course relationship.
121
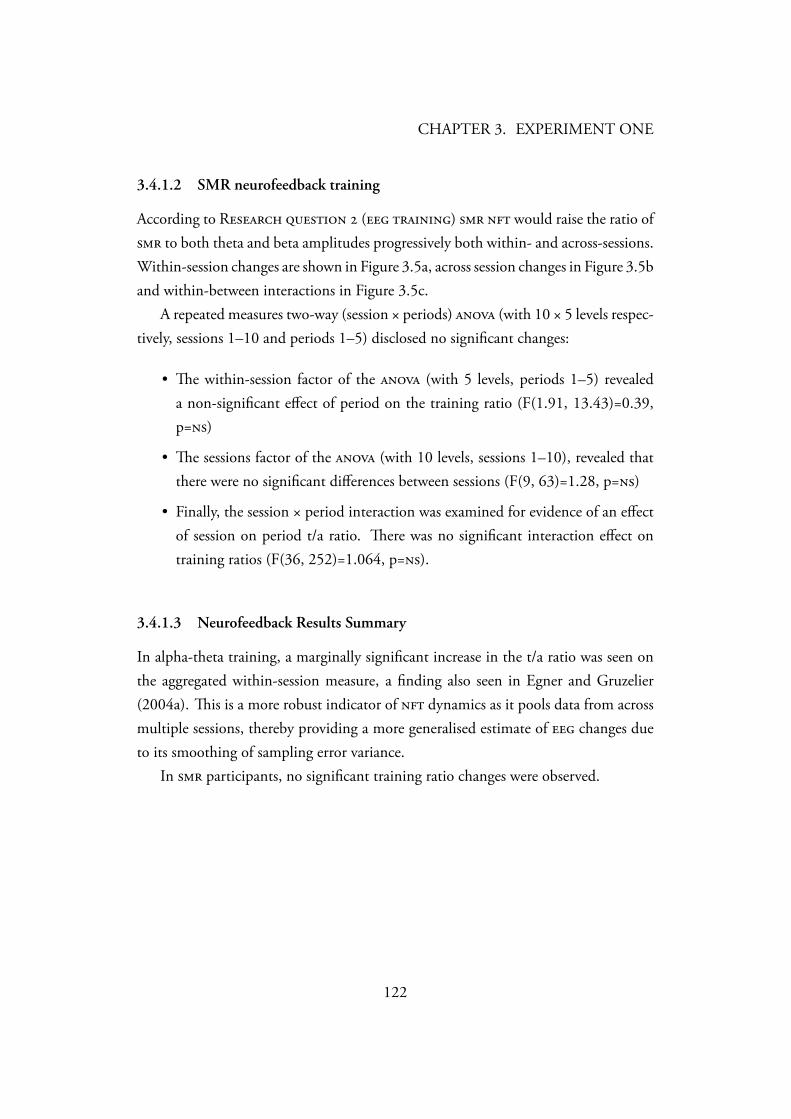
CHAPTER 3. EXPERIMENT ONE
3.4.1.2 SMR neurofeedback training
According to R ( ) would raise the ratio of to both theta and beta amplitudes progressively both within- and across-sessions.Within-session changes are shown in Figure 3.5a, across session changes in Figure 3.5band within-between interactions in Figure 3.5c.
A repeated measures two-way (session × periods) (with 10 × 5 levels respec-tively, sessions 1–10 and periods 1–5) disclosed no significant changes:
• e within-session factor of the (with 5 levels, periods 1–5) revealeda non-significant effect of period on the training ratio (F(1.91, 13.43)=0.39,p=)
• e sessions factor of the (with 10 levels, sessions 1–10), revealed thatthere were no significant differences between sessions (F(9, 63)=1.28, p=)
• Finally, the session × period interaction was examined for evidence of an effectof session on period t/a ratio. ere was no significant interaction effect ontraining ratios (F(36, 252)=1.064, p=).
3.4.1.3 Neurofeedback Results Summary
In alpha-theta training, a marginally significant increase in the t/a ratio was seen onthe aggregated within-session measure, a finding also seen in Egner and Gruzelier(2004a). is is a more robust indicator of dynamics as it pools data from acrossmultiple sessions, thereby providing a more generalised estimate of changes dueto its smoothing of sampling error variance.
In participants, no significant training ratio changes were observed.
122
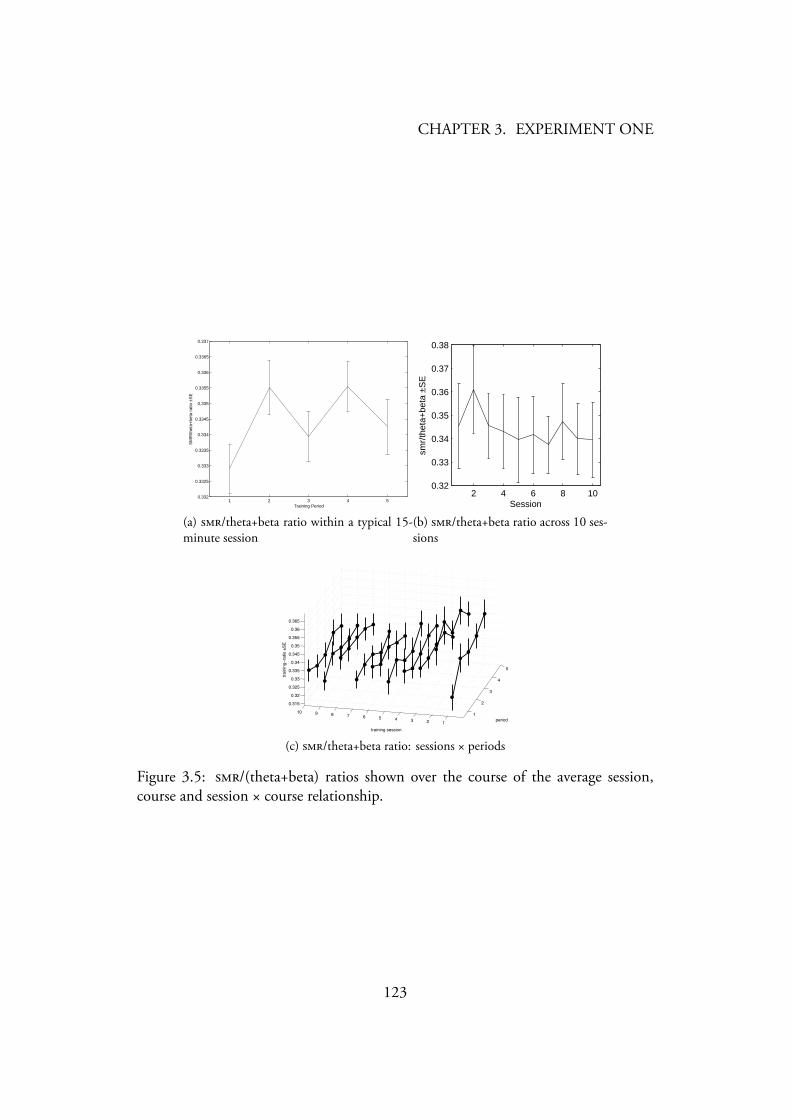
CHAPTER 3. EXPERIMENT ONE
1 2 3 4 50.332
0.3325
0.333
0.3335
0.334
0.3345
0.335
0.3355
0.336
0.3365
0.337
Training Period
SM
R/th
eta+
beta
rat
io ±
SE
(a) /theta+beta ratio within a typical 15-minute session
2 4 6 8 100.32
0.33
0.34
0.35
0.36
0.37
0.38
Session
smr/
thet
a+be
ta ±
SE
(b) /theta+beta ratio across 10 ses-sions
1
2
3
4
5
12345678910
0.315
0.32
0.325
0.33
0.335
0.34
0.345
0.35
0.355
0.36
0.365
period
training session
trai
ning−
ratio
±S
E
(c) /theta+beta ratio: sessions × periods
Figure 3.5: /(theta+beta) ratios shown over the course of the average session,course and session × course relationship.
123
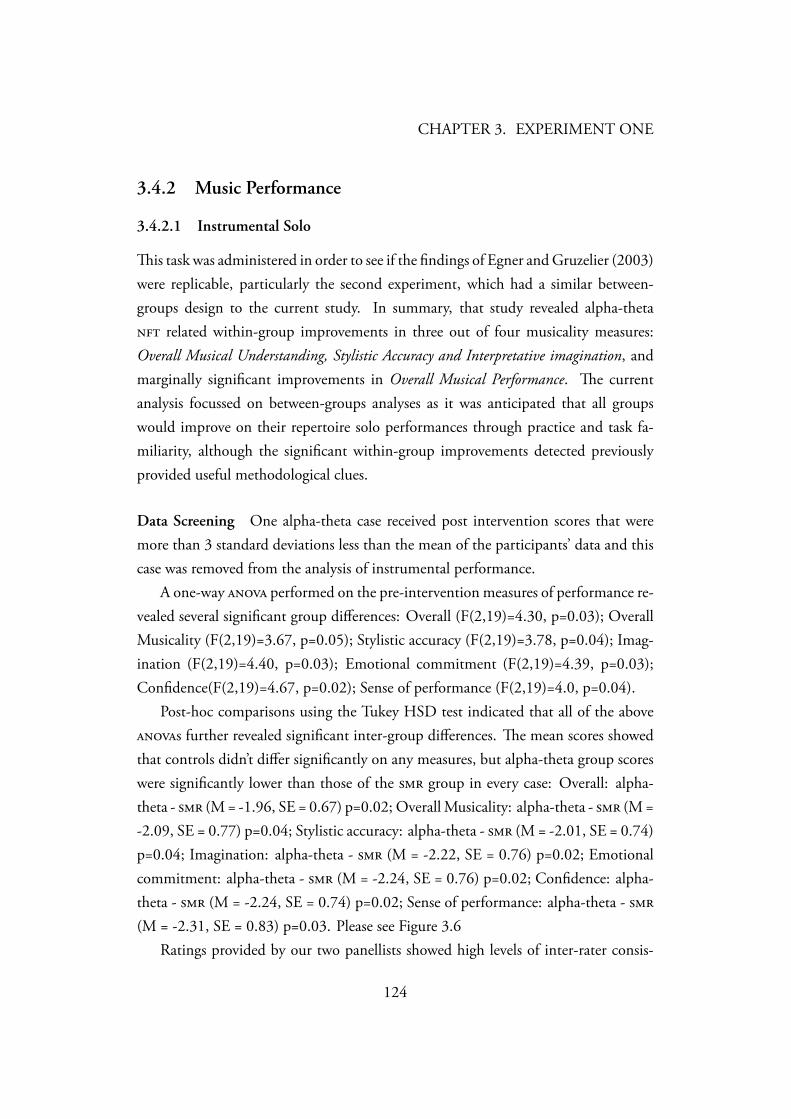
CHAPTER 3. EXPERIMENT ONE
3.4.2 Music Performance
3.4.2.1 Instrumental Solo
is task was administered in order to see if the findings of Egner and Gruzelier (2003)were replicable, particularly the second experiment, which had a similar between-groups design to the current study. In summary, that study revealed alpha-theta related within-group improvements in three out of four musicality measures:Overall Musical Understanding, Stylistic Accuracy and Interpretative imagination, andmarginally significant improvements in Overall Musical Performance. e currentanalysis focussed on between-groups analyses as it was anticipated that all groupswould improve on their repertoire solo performances through practice and task fa-miliarity, although the significant within-group improvements detected previouslyprovided useful methodological clues.
Data Screening One alpha-theta case received post intervention scores that weremore than 3 standard deviations less than the mean of the participants’ data and thiscase was removed from the analysis of instrumental performance.
A one-way performed on the pre-intervention measures of performance re-vealed several significant group differences: Overall (F(2,19)=4.30, p=0.03); OverallMusicality (F(2,19)=3.67, p=0.05); Stylistic accuracy (F(2,19)=3.78, p=0.04); Imag-ination (F(2,19)=4.40, p=0.03); Emotional commitment (F(2,19)=4.39, p=0.03);Confidence(F(2,19)=4.67, p=0.02); Sense of performance (F(2,19)=4.0, p=0.04).
Post-hoc comparisons using the Tukey HSD test indicated that all of the aboves further revealed significant inter-group differences. e mean scores showedthat controls didn’t differ significantly on any measures, but alpha-theta group scoreswere significantly lower than those of the group in every case: Overall: alpha-theta - (M = -1.96, SE = 0.67) p=0.02; Overall Musicality: alpha-theta - (M =-2.09, SE = 0.77) p=0.04; Stylistic accuracy: alpha-theta - (M = -2.01, SE = 0.74)p=0.04; Imagination: alpha-theta - (M = -2.22, SE = 0.76) p=0.02; Emotionalcommitment: alpha-theta - (M = -2.24, SE = 0.76) p=0.02; Confidence: alpha-theta - (M = -2.24, SE = 0.74) p=0.02; Sense of performance: alpha-theta - (M = -2.31, SE = 0.83) p=0.03. Please see Figure 3.6
Ratings provided by our two panellists showed high levels of inter-rater consis-
124
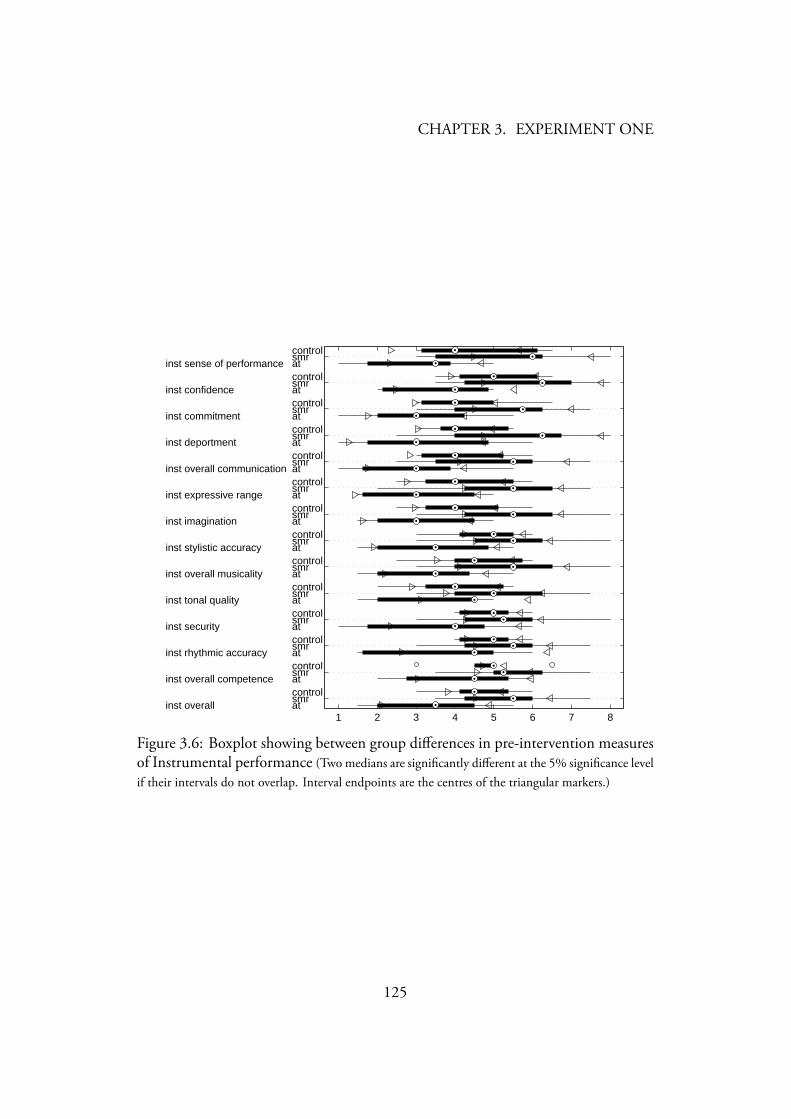
CHAPTER 3. EXPERIMENT ONE
1 2 3 4 5 6 7 8inst overall
inst overall competence
inst rhythmic accuracy
inst security
inst tonal quality
inst overall musicality
inst stylistic accuracy
inst imagination
inst expressive range
inst overall communication
inst deportment
inst commitment
inst confidence
inst sense of performance
atsmrcontrolatsmrcontrolatsmrcontrolatsmrcontrolatsmrcontrolatsmrcontrolatsmrcontrolatsmrcontrolatsmrcontrolatsmrcontrolatsmrcontrolatsmrcontrolatsmrcontrolatsmrcontrol
Figure 3.6: Boxplot showing between group differences in pre-intervention measuresof Instrumental performance (Two medians are significantly different at the 5% significance levelif their intervals do not overlap. Interval endpoints are the centres of the triangular markers.)
125

CHAPTER 3. EXPERIMENT ONE
tency at r=0.76, p<0.005. e two sets of ratings were then combined into a singlerater-average score for further analyses.
126
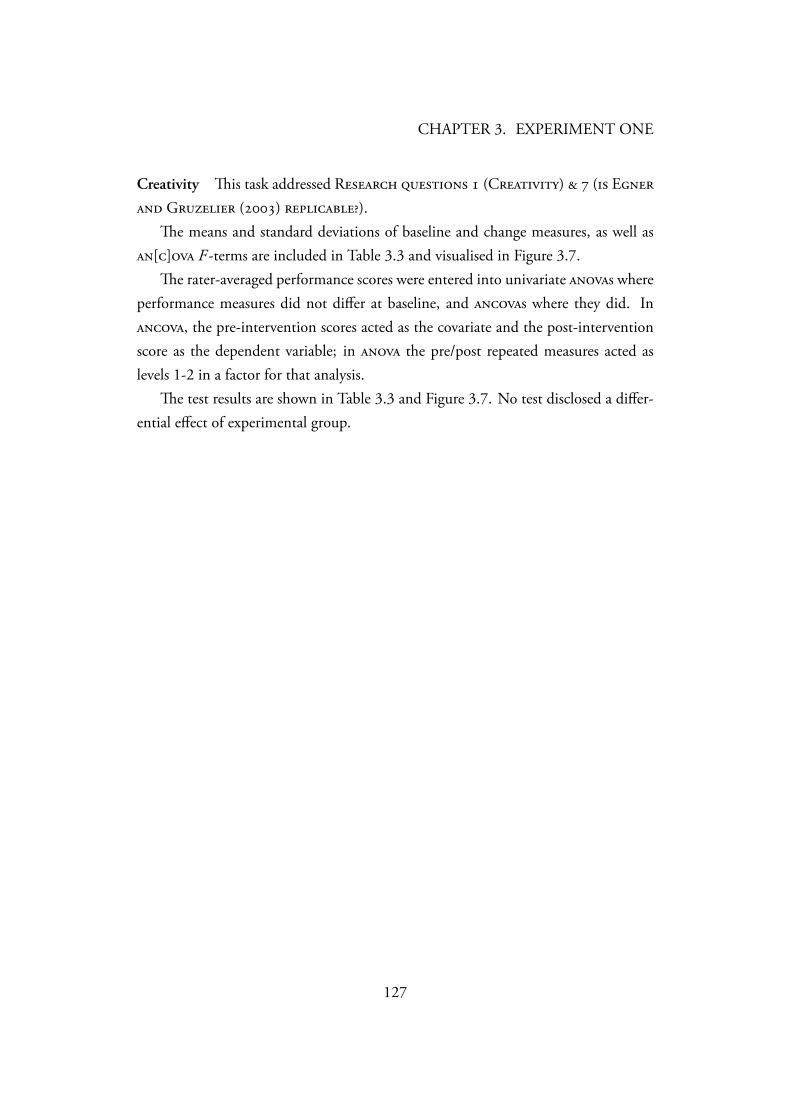
CHAPTER 3. EXPERIMENT ONE
Creativity is task addressed R (C) ( E G () ).
e means and standard deviations of baseline and change measures, as well as[] F -terms are included in Table 3.3 and visualised in Figure 3.7.
e rater-averaged performance scores were entered into univariate s whereperformance measures did not differ at baseline, and s where they did. In, the pre-intervention scores acted as the covariate and the post-interventionscore as the dependent variable; in the pre/post repeated measures acted aslevels 1-2 in a factor for that analysis.
e test results are shown in Table 3.3 and Figure 3.7. No test disclosed a differ-ential effect of experimental group.
127
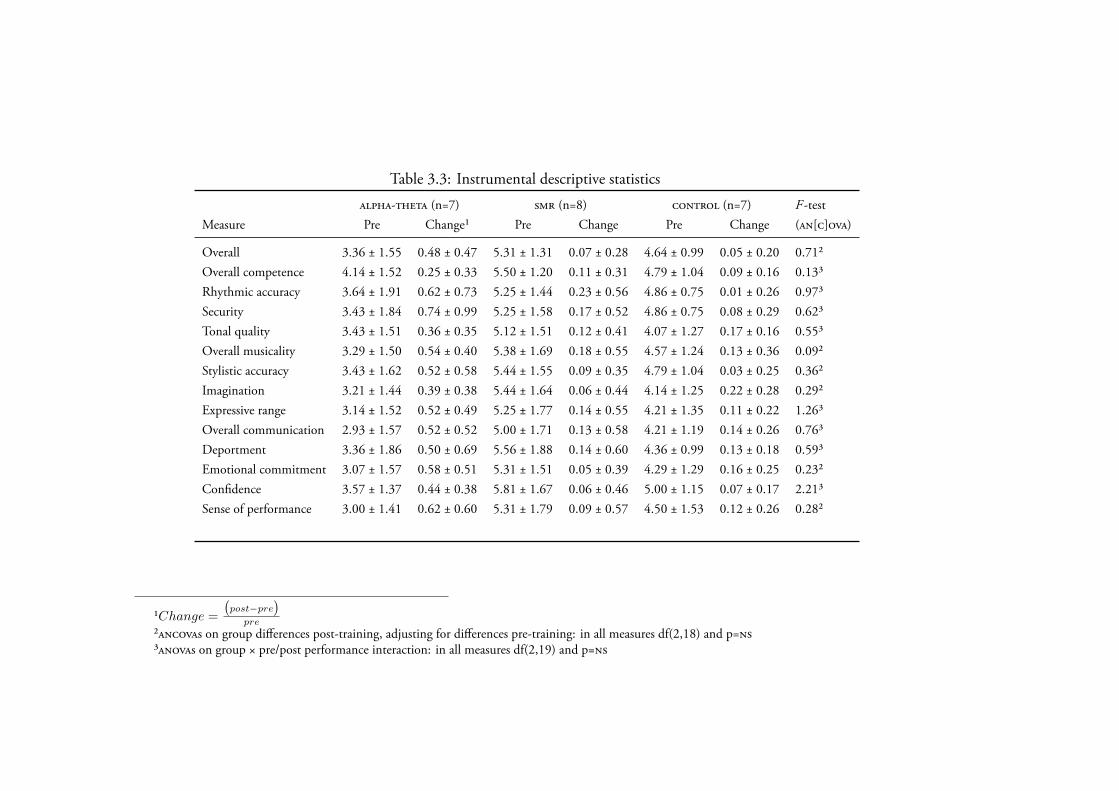
Table 3.3: Instrumental descriptive statistics
- (n=7) (n=8) (n=7) F -testMeasure Pre Change¹ Pre Change Pre Change ([])
Overall 3.36 ± 1.55 0.48 ± 0.47 5.31 ± 1.31 0.07 ± 0.28 4.64 ± 0.99 0.05 ± 0.20 0.71²Overall competence 4.14 ± 1.52 0.25 ± 0.33 5.50 ± 1.20 0.11 ± 0.31 4.79 ± 1.04 0.09 ± 0.16 0.13³Rhythmic accuracy 3.64 ± 1.91 0.62 ± 0.73 5.25 ± 1.44 0.23 ± 0.56 4.86 ± 0.75 0.01 ± 0.26 0.97³Security 3.43 ± 1.84 0.74 ± 0.99 5.25 ± 1.58 0.17 ± 0.52 4.86 ± 0.75 0.08 ± 0.29 0.62³Tonal quality 3.43 ± 1.51 0.36 ± 0.35 5.12 ± 1.51 0.12 ± 0.41 4.07 ± 1.27 0.17 ± 0.16 0.55³Overall musicality 3.29 ± 1.50 0.54 ± 0.40 5.38 ± 1.69 0.18 ± 0.55 4.57 ± 1.24 0.13 ± 0.36 0.09²Stylistic accuracy 3.43 ± 1.62 0.52 ± 0.58 5.44 ± 1.55 0.09 ± 0.35 4.79 ± 1.04 0.03 ± 0.25 0.36²Imagination 3.21 ± 1.44 0.39 ± 0.38 5.44 ± 1.64 0.06 ± 0.44 4.14 ± 1.25 0.22 ± 0.28 0.29²Expressive range 3.14 ± 1.52 0.52 ± 0.49 5.25 ± 1.77 0.14 ± 0.55 4.21 ± 1.35 0.11 ± 0.22 1.26³Overall communication 2.93 ± 1.57 0.52 ± 0.52 5.00 ± 1.71 0.13 ± 0.58 4.21 ± 1.19 0.14 ± 0.26 0.76³Deportment 3.36 ± 1.86 0.50 ± 0.69 5.56 ± 1.88 0.14 ± 0.60 4.36 ± 0.99 0.13 ± 0.18 0.59³Emotional commitment 3.07 ± 1.57 0.58 ± 0.51 5.31 ± 1.51 0.05 ± 0.39 4.29 ± 1.29 0.16 ± 0.25 0.23²Confidence 3.57 ± 1.37 0.44 ± 0.38 5.81 ± 1.67 0.06 ± 0.46 5.00 ± 1.15 0.07 ± 0.17 2.21³Sense of performance 3.00 ± 1.41 0.62 ± 0.60 5.31 ± 1.79 0.09 ± 0.57 4.50 ± 1.53 0.12 ± 0.26 0.28²
¹Change =
(post−pre
)pre
²s on group differences post-training, adjusting for differences pre-training: in all measures df(2,18) and p=³s on group × pre/post performance interaction: in all measures df(2,19) and p=
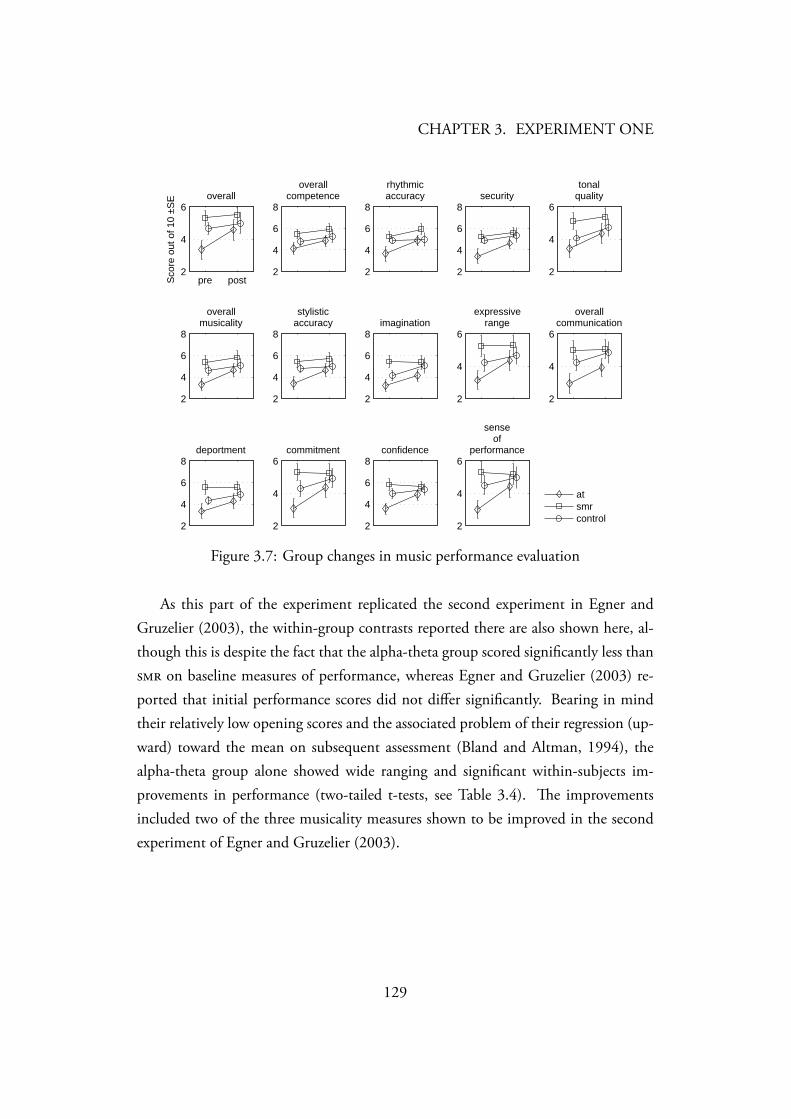
CHAPTER 3. EXPERIMENT ONE
pre post2
4
6
Sco
re o
ut o
f 10
±SE overall
2
4
6
8
overallcompetence
2
4
6
8
rhythmicaccuracy
2
4
6
8security
2
4
6
tonalquality
2
4
6
8
overallmusicality
2
4
6
8
stylisticaccuracy
2
4
6
8imagination
2
4
6
expressiverange
2
4
6
overallcommunication
2
4
6
8deportment
2
4
6commitment
2
4
6
8confidence
2
4
6
senseof
performance
atsmrcontrol
Figure 3.7: Group changes in music performance evaluation
As this part of the experiment replicated the second experiment in Egner andGruzelier (2003), the within-group contrasts reported there are also shown here, al-though this is despite the fact that the alpha-theta group scored significantly less than on baseline measures of performance, whereas Egner and Gruzelier (2003) re-ported that initial performance scores did not differ significantly. Bearing in mindtheir relatively low opening scores and the associated problem of their regression (up-ward) toward the mean on subsequent assessment (Bland and Altman, 1994), thealpha-theta group alone showed wide ranging and significant within-subjects im-provements in performance (two-tailed t-tests, see Table 3.4). e improvementsincluded two of the three musicality measures shown to be improved in the secondexperiment of Egner and Gruzelier (2003).
129
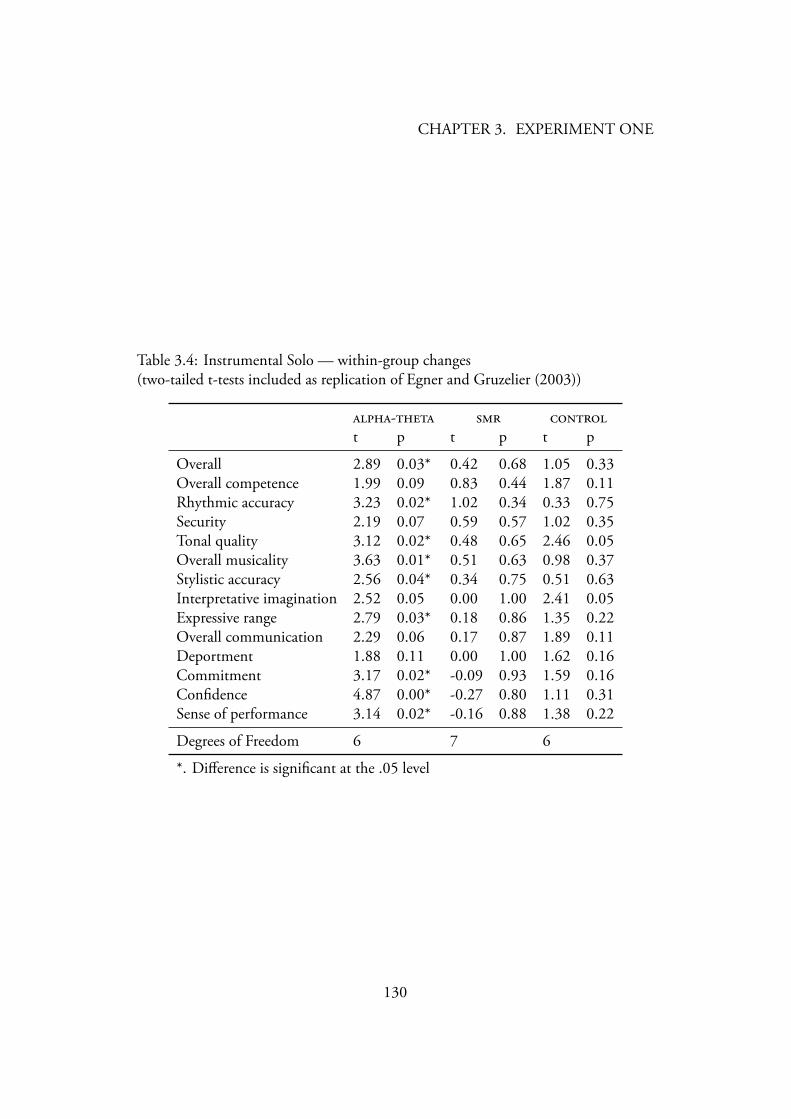
CHAPTER 3. EXPERIMENT ONE
Table 3.4: Instrumental Solo — within-group changes(two-tailed t-tests included as replication of Egner and Gruzelier (2003))
- t p t p t p
Overall 2.89 0.03* 0.42 0.68 1.05 0.33Overall competence 1.99 0.09 0.83 0.44 1.87 0.11Rhythmic accuracy 3.23 0.02* 1.02 0.34 0.33 0.75Security 2.19 0.07 0.59 0.57 1.02 0.35Tonal quality 3.12 0.02* 0.48 0.65 2.46 0.05Overall musicality 3.63 0.01* 0.51 0.63 0.98 0.37Stylistic accuracy 2.56 0.04* 0.34 0.75 0.51 0.63Interpretative imagination 2.52 0.05 0.00 1.00 2.41 0.05Expressive range 2.79 0.03* 0.18 0.86 1.35 0.22Overall communication 2.29 0.06 0.17 0.87 1.89 0.11Deportment 1.88 0.11 0.00 1.00 1.62 0.16Commitment 3.17 0.02* -0.09 0.93 1.59 0.16Confidence 4.87 0.00* -0.27 0.80 1.11 0.31Sense of performance 3.14 0.02* -0.16 0.88 1.38 0.22
Degrees of Freedom 6 7 6
*. Difference is significant at the .05 level
130
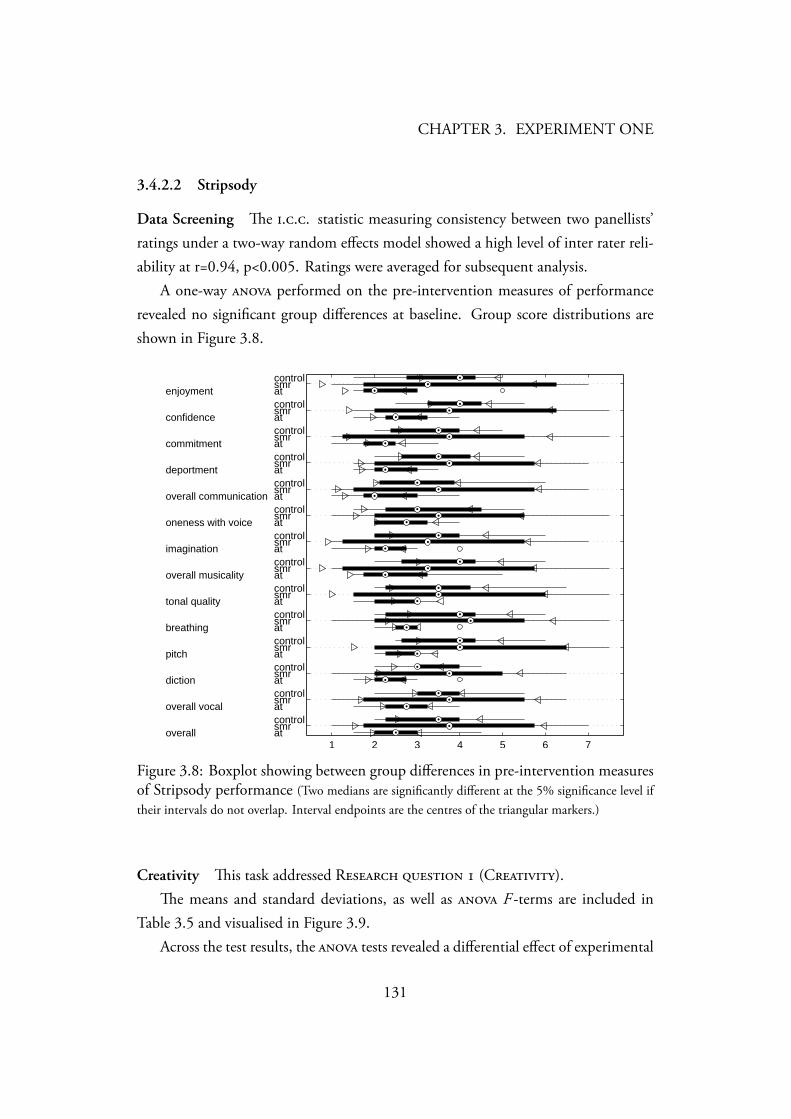
CHAPTER 3. EXPERIMENT ONE
3.4.2.2 Stripsody
Data Screening e ... statistic measuring consistency between two panellists’ratings under a two-way random effects model showed a high level of inter rater reli-ability at r=0.94, p<0.005. Ratings were averaged for subsequent analysis.
A one-way performed on the pre-intervention measures of performancerevealed no significant group differences at baseline. Group score distributions areshown in Figure 3.8.
1 2 3 4 5 6 7overall
overall vocal
diction
pitch
breathing
tonal quality
overall musicality
imagination
oneness with voice
overall communication
deportment
commitment
confidence
enjoyment
atsmrcontrolatsmrcontrolatsmrcontrolatsmrcontrolatsmrcontrolatsmrcontrolatsmrcontrolatsmrcontrolatsmrcontrolatsmrcontrolatsmrcontrolatsmrcontrolatsmrcontrolatsmrcontrol
Figure 3.8: Boxplot showing between group differences in pre-intervention measuresof Stripsody performance (Two medians are significantly different at the 5% significance level iftheir intervals do not overlap. Interval endpoints are the centres of the triangular markers.)
Creativity is task addressed R (C).e means and standard deviations, as well as F -terms are included in
Table 3.5 and visualised in Figure 3.9.Across the test results, the tests revealed a differential effect of experimental
131

CHAPTER 3. EXPERIMENT ONE
group on measures of ‘Confidence’. A Tukey HSD post-hoc analysis did not revealsignificant inter-group differences: alpha-theta - (M = -0.5, SE = 0.80) p=;alpha-theta - control (M = -0.36, SE = 0.82) p=.
132
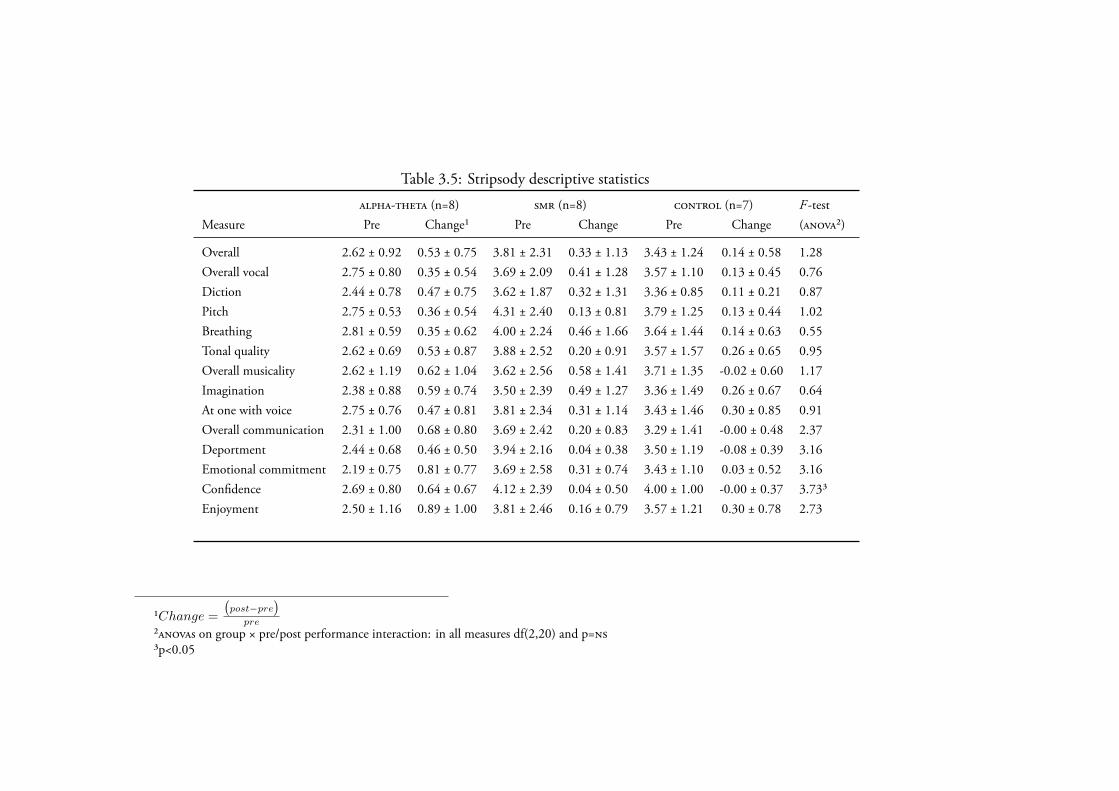
Table 3.5: Stripsody descriptive statistics
- (n=8) (n=8) (n=7) F -testMeasure Pre Change¹ Pre Change Pre Change (²)
Overall 2.62 ± 0.92 0.53 ± 0.75 3.81 ± 2.31 0.33 ± 1.13 3.43 ± 1.24 0.14 ± 0.58 1.28Overall vocal 2.75 ± 0.80 0.35 ± 0.54 3.69 ± 2.09 0.41 ± 1.28 3.57 ± 1.10 0.13 ± 0.45 0.76Diction 2.44 ± 0.78 0.47 ± 0.75 3.62 ± 1.87 0.32 ± 1.31 3.36 ± 0.85 0.11 ± 0.21 0.87Pitch 2.75 ± 0.53 0.36 ± 0.54 4.31 ± 2.40 0.13 ± 0.81 3.79 ± 1.25 0.13 ± 0.44 1.02Breathing 2.81 ± 0.59 0.35 ± 0.62 4.00 ± 2.24 0.46 ± 1.66 3.64 ± 1.44 0.14 ± 0.63 0.55Tonal quality 2.62 ± 0.69 0.53 ± 0.87 3.88 ± 2.52 0.20 ± 0.91 3.57 ± 1.57 0.26 ± 0.65 0.95Overall musicality 2.62 ± 1.19 0.62 ± 1.04 3.62 ± 2.56 0.58 ± 1.41 3.71 ± 1.35 -0.02 ± 0.60 1.17Imagination 2.38 ± 0.88 0.59 ± 0.74 3.50 ± 2.39 0.49 ± 1.27 3.36 ± 1.49 0.26 ± 0.67 0.64At one with voice 2.75 ± 0.76 0.47 ± 0.81 3.81 ± 2.34 0.31 ± 1.14 3.43 ± 1.46 0.30 ± 0.85 0.91Overall communication 2.31 ± 1.00 0.68 ± 0.80 3.69 ± 2.42 0.20 ± 0.83 3.29 ± 1.41 -0.00 ± 0.48 2.37Deportment 2.44 ± 0.68 0.46 ± 0.50 3.94 ± 2.16 0.04 ± 0.38 3.50 ± 1.19 -0.08 ± 0.39 3.16Emotional commitment 2.19 ± 0.75 0.81 ± 0.77 3.69 ± 2.58 0.31 ± 0.74 3.43 ± 1.10 0.03 ± 0.52 3.16Confidence 2.69 ± 0.80 0.64 ± 0.67 4.12 ± 2.39 0.04 ± 0.50 4.00 ± 1.00 -0.00 ± 0.37 3.73³Enjoyment 2.50 ± 1.16 0.89 ± 1.00 3.81 ± 2.46 0.16 ± 0.79 3.57 ± 1.21 0.30 ± 0.78 2.73
¹Change =
(post−pre
)pre
²s on group × pre/post performance interaction: in all measures df(2,20) and p=³p<0.05
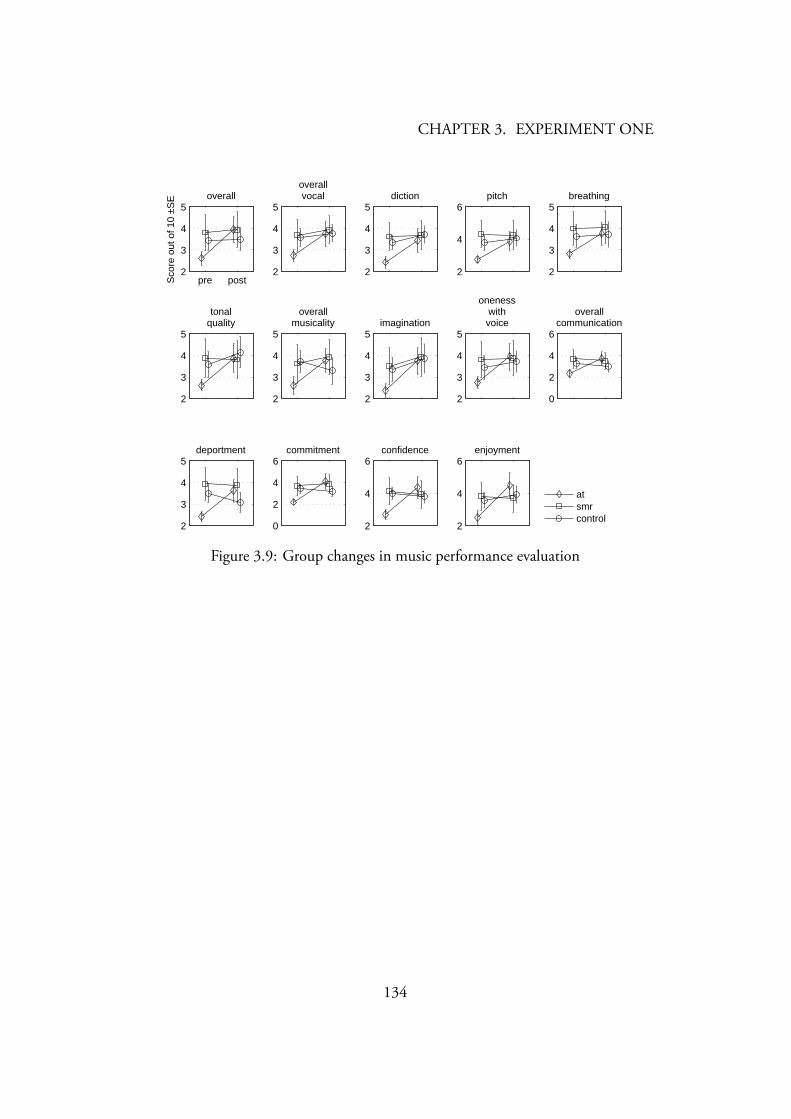
CHAPTER 3. EXPERIMENT ONE
pre post2
3
4
5
Sco
re o
ut o
f 10
±SE overall
2
3
4
5
overallvocal
2
3
4
5diction
2
4
6pitch
2
3
4
5breathing
2
3
4
5
tonalquality
2
3
4
5
overallmusicality
2
3
4
5imagination
2
3
4
5
onenesswithvoice
0
2
4
6
overallcommunication
2
3
4
5deportment
0
2
4
6commitment
2
4
6confidence
2
4
6enjoyment
atsmrcontrol
Figure 3.9: Group changes in music performance evaluation
134
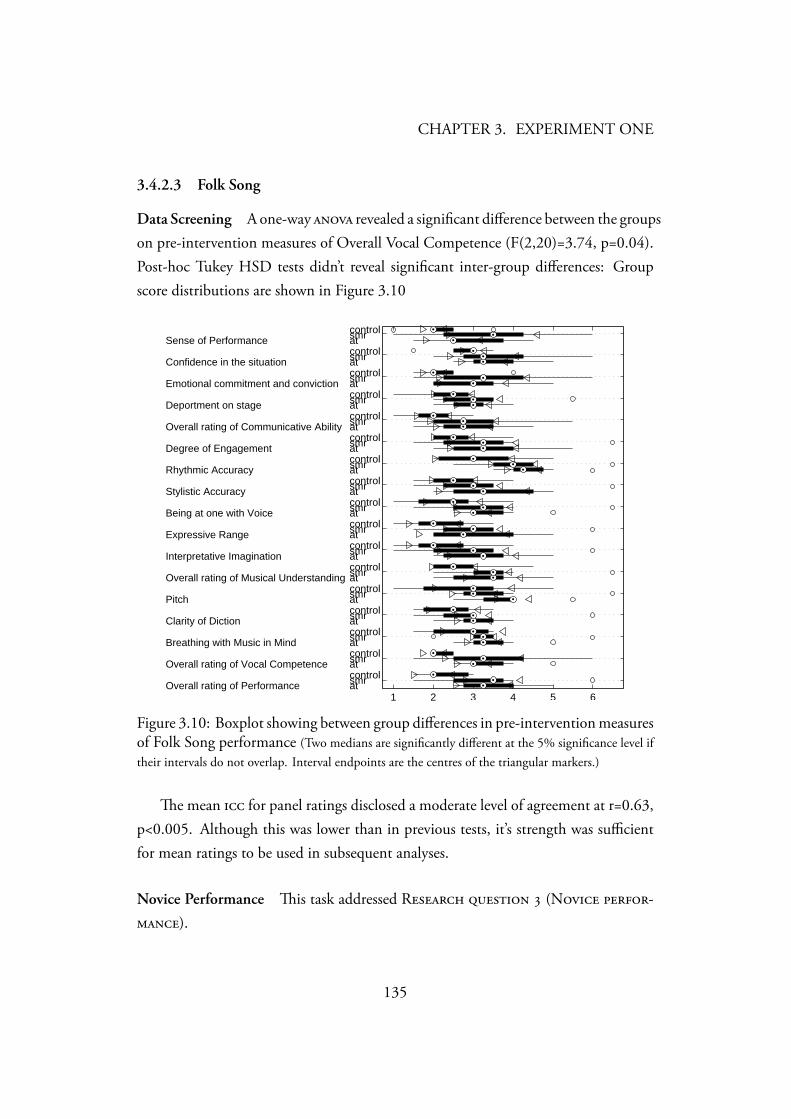
CHAPTER 3. EXPERIMENT ONE
3.4.2.3 Folk Song
Data Screening A one-way revealed a significant difference between the groupson pre-intervention measures of Overall Vocal Competence (F(2,20)=3.74, p=0.04).Post-hoc Tukey HSD tests didn’t reveal significant inter-group differences: Groupscore distributions are shown in Figure 3.10
1 2 3 4 5 6Overall rating of Performance
Overall rating of Vocal Competence
Breathing with Music in Mind
Clarity of Diction
Pitch
Overall rating of Musical Understanding
Interpretative Imagination
Expressive Range
Being at one with Voice
Stylistic Accuracy
Rhythmic Accuracy
Degree of Engagement
Overall rating of Communicative Ability
Deportment on stage
Emotional commitment and conviction
Confidence in the situation
Sense of Performance
atsmrcontrolatsmrcontrolatsmrcontrolatsmrcontrolatsmrcontrolatsmrcontrolatsmrcontrolatsmrcontrolatsmrcontrolatsmrcontrolatsmrcontrolatsmrcontrolatsmrcontrolatsmrcontrolatsmrcontrolatsmrcontrolatsmrcontrol
Figure 3.10: Boxplot showing between group differences in pre-intervention measuresof Folk Song performance (Two medians are significantly different at the 5% significance level iftheir intervals do not overlap. Interval endpoints are the centres of the triangular markers.)
e mean for panel ratings disclosed a moderate level of agreement at r=0.63,p<0.005. Although this was lower than in previous tests, it’s strength was sufficientfor mean ratings to be used in subsequent analyses.
Novice Performance is task addressed R (N -).
135

CHAPTER 3. EXPERIMENT ONE
e means and standard deviations of baseline and change measures, as well as[] F -terms are included in Table 3.6 and visualised in Figure 3.11.
e performed on measures of Pitch revealed a group difference. Post-hocTukey HSD measures revealed no inter-group differences: - alpha-theta (M =0.13, SE = 0.55) p=; - control (M = 1.00, SE = 0.59) p=.
136
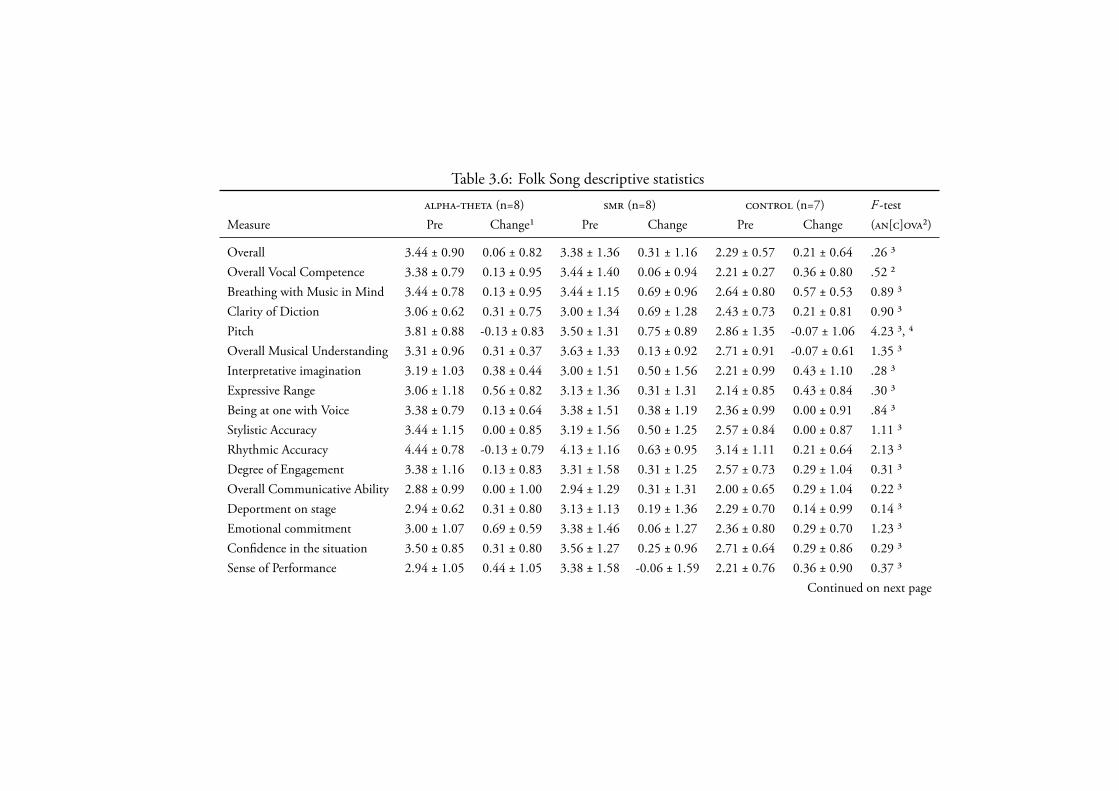
Table 3.6: Folk Song descriptive statistics
- (n=8) (n=8) (n=7) F -testMeasure Pre Change¹ Pre Change Pre Change ([]²)
Overall 3.44 ± 0.90 0.06 ± 0.82 3.38 ± 1.36 0.31 ± 1.16 2.29 ± 0.57 0.21 ± 0.64 .26 ³Overall Vocal Competence 3.38 ± 0.79 0.13 ± 0.95 3.44 ± 1.40 0.06 ± 0.94 2.21 ± 0.27 0.36 ± 0.80 .52 ²Breathing with Music in Mind 3.44 ± 0.78 0.13 ± 0.95 3.44 ± 1.15 0.69 ± 0.96 2.64 ± 0.80 0.57 ± 0.53 0.89 ³Clarity of Diction 3.06 ± 0.62 0.31 ± 0.75 3.00 ± 1.34 0.69 ± 1.28 2.43 ± 0.73 0.21 ± 0.81 0.90 ³Pitch 3.81 ± 0.88 -0.13 ± 0.83 3.50 ± 1.31 0.75 ± 0.89 2.86 ± 1.35 -0.07 ± 1.06 4.23 ³, ⁴Overall Musical Understanding 3.31 ± 0.96 0.31 ± 0.37 3.63 ± 1.33 0.13 ± 0.92 2.71 ± 0.91 -0.07 ± 0.61 1.35 ³Interpretative imagination 3.19 ± 1.03 0.38 ± 0.44 3.00 ± 1.51 0.50 ± 1.56 2.21 ± 0.99 0.43 ± 1.10 .28 ³Expressive Range 3.06 ± 1.18 0.56 ± 0.82 3.13 ± 1.36 0.31 ± 1.31 2.14 ± 0.85 0.43 ± 0.84 .30 ³Being at one with Voice 3.38 ± 0.79 0.13 ± 0.64 3.38 ± 1.51 0.38 ± 1.19 2.36 ± 0.99 0.00 ± 0.91 .84 ³Stylistic Accuracy 3.44 ± 1.15 0.00 ± 0.85 3.19 ± 1.56 0.50 ± 1.25 2.57 ± 0.84 0.00 ± 0.87 1.11 ³Rhythmic Accuracy 4.44 ± 0.78 -0.13 ± 0.79 4.13 ± 1.16 0.63 ± 0.95 3.14 ± 1.11 0.21 ± 0.64 2.13 ³Degree of Engagement 3.38 ± 1.16 0.13 ± 0.83 3.31 ± 1.58 0.31 ± 1.25 2.57 ± 0.73 0.29 ± 1.04 0.31 ³Overall Communicative Ability 2.88 ± 0.99 0.00 ± 1.00 2.94 ± 1.29 0.31 ± 1.31 2.00 ± 0.65 0.29 ± 1.04 0.22 ³Deportment on stage 2.94 ± 0.62 0.31 ± 0.80 3.13 ± 1.13 0.19 ± 1.36 2.29 ± 0.70 0.14 ± 0.99 0.14 ³Emotional commitment 3.00 ± 1.07 0.69 ± 0.59 3.38 ± 1.46 0.06 ± 1.27 2.36 ± 0.80 0.29 ± 0.70 1.23 ³Confidence in the situation 3.50 ± 0.85 0.31 ± 0.80 3.56 ± 1.27 0.25 ± 0.96 2.71 ± 0.64 0.29 ± 0.86 0.29 ³Sense of Performance 2.94 ± 1.05 0.44 ± 1.05 3.38 ± 1.58 -0.06 ± 1.59 2.21 ± 0.76 0.36 ± 0.90 0.37 ³
Continued on next page
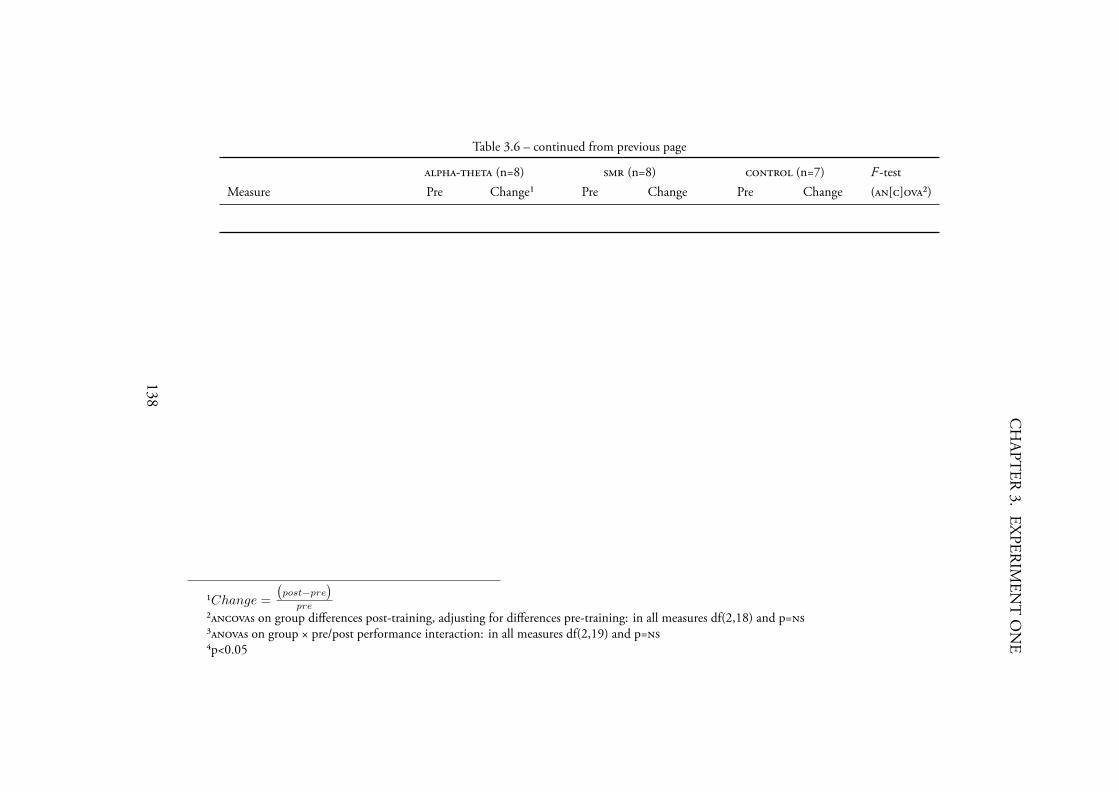
CH
APTER
3.EX
PERIM
ENT
ON
E
Table 3.6 – continued from previous page
- (n=8) (n=8) (n=7) F -testMeasure Pre Change¹ Pre Change Pre Change ([]²)
¹Change =
(post−pre
)pre
²s on group differences post-training, adjusting for differences pre-training: in all measures df(2,18) and p=³s on group × pre/post performance interaction: in all measures df(2,19) and p=⁴p<0.05
138
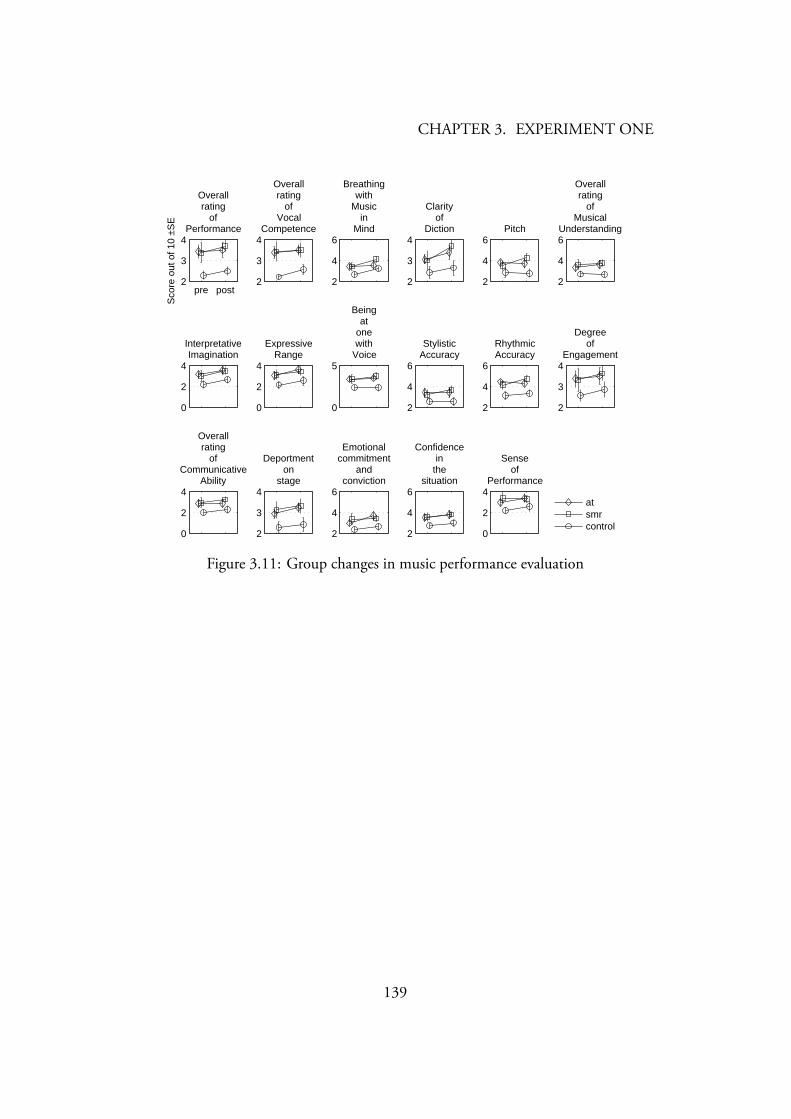
CHAPTER 3. EXPERIMENT ONE
pre post2
3
4
Sco
re o
ut o
f 10
±SE
Overallrating
ofPerformance
2
3
4
Overallrating
ofVocal
Competence
2
4
6
Breathingwith
Musicin
Mind
2
3
4
Clarityof
Diction
2
4
6Pitch
2
4
6
Overallrating
ofMusical
Understanding
0
2
4
InterpretativeImagination
0
2
4
ExpressiveRange
0
5
Beingat
onewith
Voice
2
4
6
StylisticAccuracy
2
4
6
RhythmicAccuracy
2
3
4
Degreeof
Engagement
0
2
4
Overallrating
ofCommunicative
Ability
2
3
4
Deportmenton
stage
2
4
6
Emotionalcommitment
andconviction
2
4
6
Confidencein
thesituation
0
2
4
Senseof
Performance
atsmrcontrol
Figure 3.11: Group changes in music performance evaluation
139
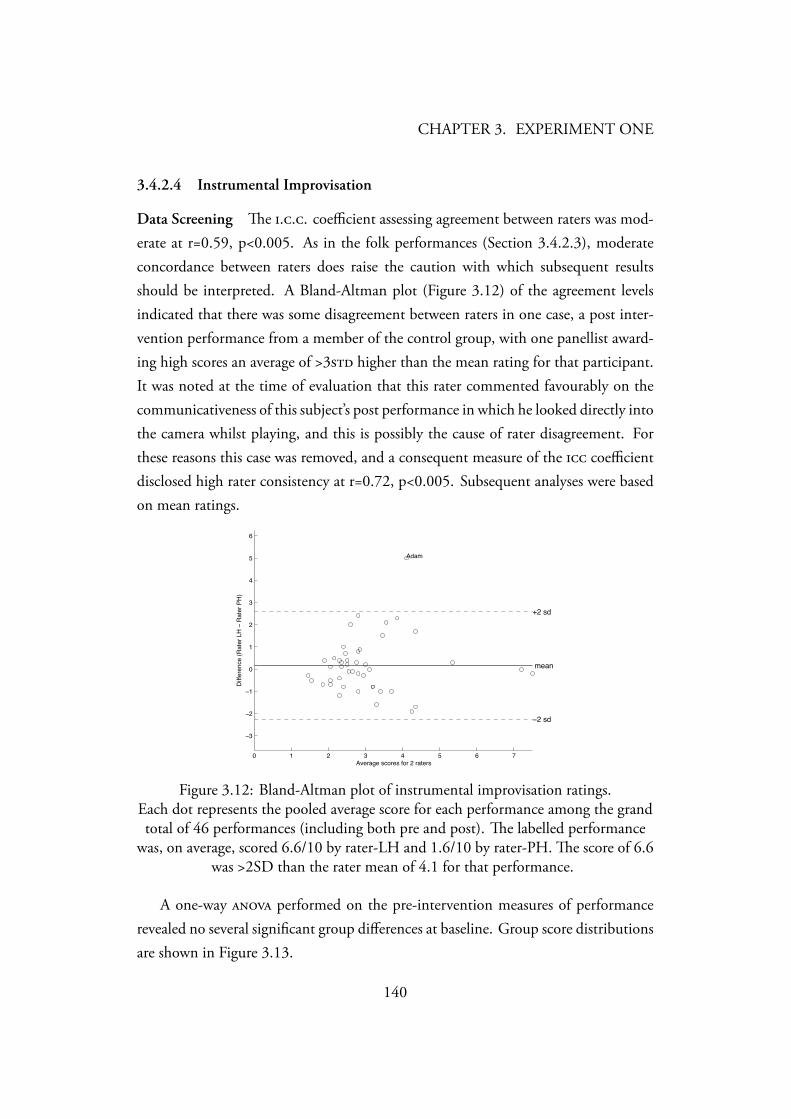
CHAPTER 3. EXPERIMENT ONE
3.4.2.4 Instrumental Improvisation
Data Screening e ... coefficient assessing agreement between raters was mod-erate at r=0.59, p<0.005. As in the folk performances (Section 3.4.2.3), moderateconcordance between raters does raise the caution with which subsequent resultsshould be interpreted. A Bland-Altman plot (Figure 3.12) of the agreement levelsindicated that there was some disagreement between raters in one case, a post inter-vention performance from a member of the control group, with one panellist award-ing high scores an average of >3 higher than the mean rating for that participant.It was noted at the time of evaluation that this rater commented favourably on thecommunicativeness of this subject’s post performance in which he looked directly intothe camera whilst playing, and this is possibly the cause of rater disagreement. Forthese reasons this case was removed, and a consequent measure of the coefficientdisclosed high rater consistency at r=0.72, p<0.005. Subsequent analyses were basedon mean ratings.
0 1 2 3 4 5 6 7
−3
−2
−1
0
1
2
3
4
5
6
Average scores for 2 raters
Diff
eren
ce (
Rat
er L
H −
Rat
er P
H)
+2 sd
−2 sd
mean
Adam
Figure 3.12: Bland-Altman plot of instrumental improvisation ratings.Each dot represents the pooled average score for each performance among the grandtotal of 46 performances (including both pre and post). e labelled performance
was, on average, scored 6.6/10 by rater-LH and 1.6/10 by rater-PH. e score of 6.6was >2SD than the rater mean of 4.1 for that performance.
A one-way performed on the pre-intervention measures of performancerevealed no several significant group differences at baseline. Group score distributionsare shown in Figure 3.13.
140
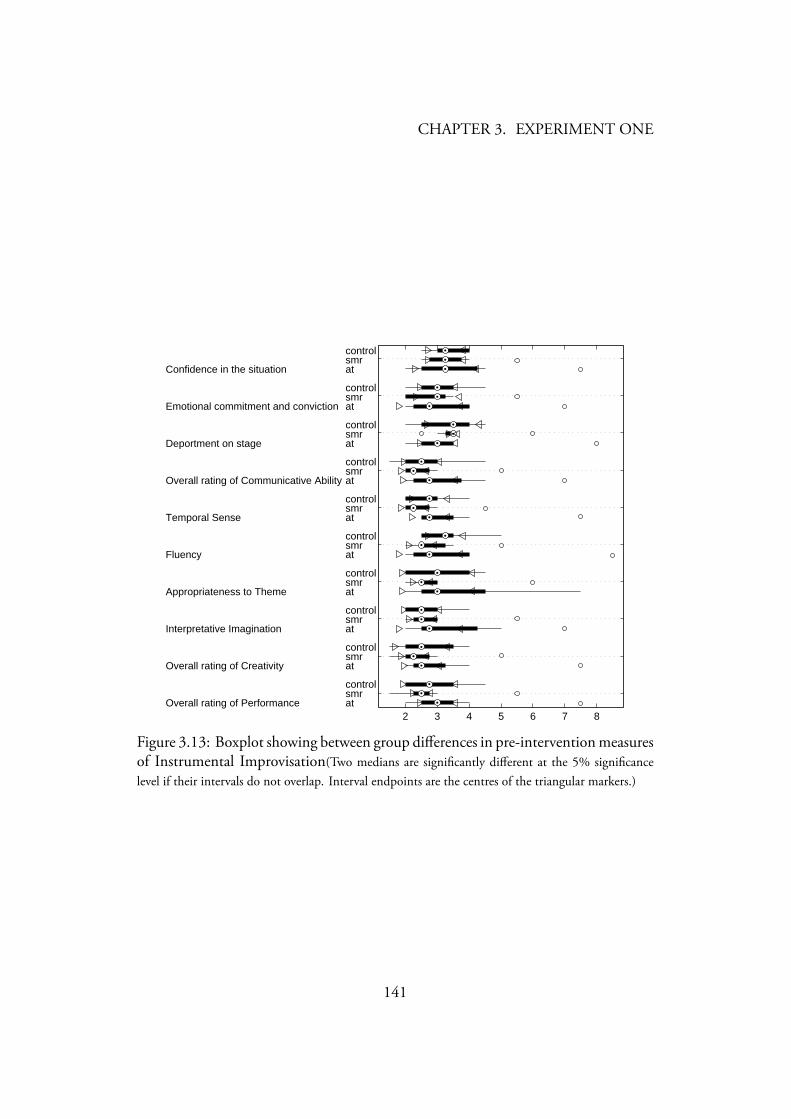
CHAPTER 3. EXPERIMENT ONE
2 3 4 5 6 7 8Overall rating of Performance
Overall rating of Creativity
Interpretative Imagination
Appropriateness to Theme
Fluency
Temporal Sense
Overall rating of Communicative Ability
Deportment on stage
Emotional commitment and conviction
Confidence in the situation
atsmrcontrol
atsmrcontrol
atsmrcontrol
atsmrcontrol
atsmrcontrol
atsmrcontrol
atsmrcontrol
atsmrcontrol
atsmrcontrol
atsmrcontrol
Figure 3.13: Boxplot showing between group differences in pre-intervention measuresof Instrumental Improvisation(Two medians are significantly different at the 5% significancelevel if their intervals do not overlap. Interval endpoints are the centres of the triangular markers.)
141

CHAPTER 3. EXPERIMENT ONE
Creativity is task addressed R (C).e means and standard deviations of baseline and change measures, as well as
F -terms are included in Table 3.7 and visualised in Figure 4.11.As in the previous tasks, group differences were not shown to be significant.
142
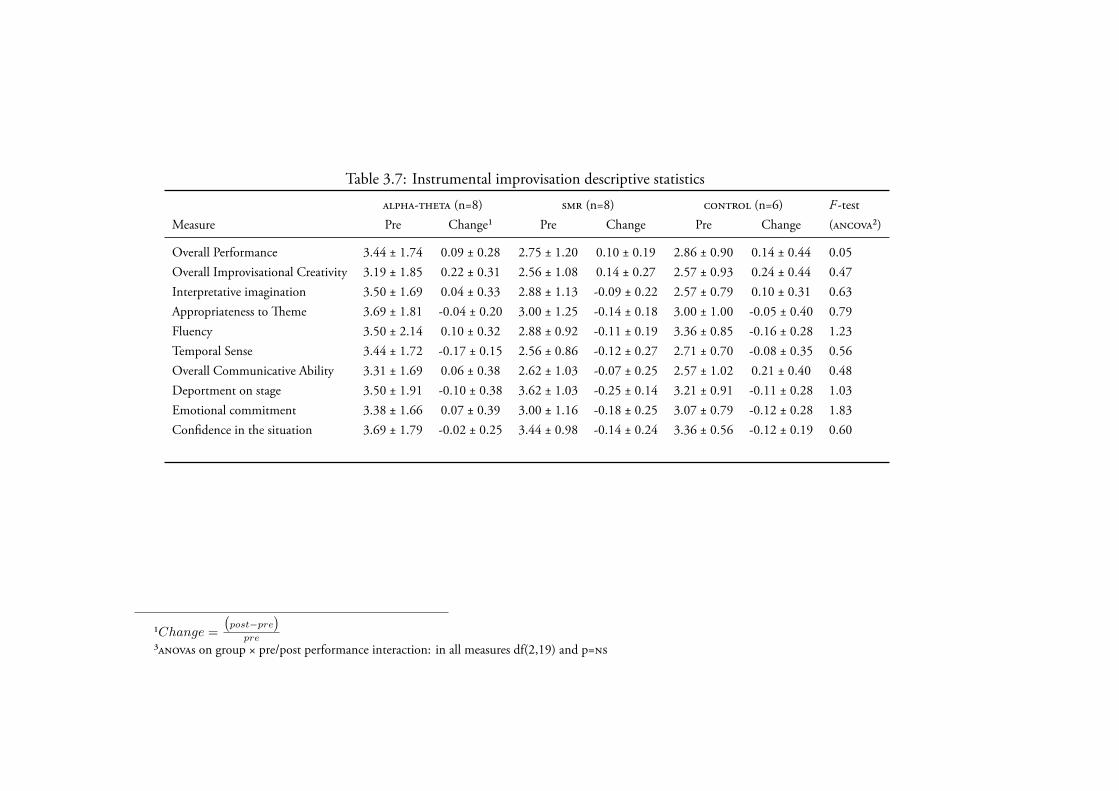
Table 3.7: Instrumental improvisation descriptive statistics
- (n=8) (n=8) (n=6) F -testMeasure Pre Change¹ Pre Change Pre Change (²)
Overall Performance 3.44 ± 1.74 0.09 ± 0.28 2.75 ± 1.20 0.10 ± 0.19 2.86 ± 0.90 0.14 ± 0.44 0.05Overall Improvisational Creativity 3.19 ± 1.85 0.22 ± 0.31 2.56 ± 1.08 0.14 ± 0.27 2.57 ± 0.93 0.24 ± 0.44 0.47Interpretative imagination 3.50 ± 1.69 0.04 ± 0.33 2.88 ± 1.13 -0.09 ± 0.22 2.57 ± 0.79 0.10 ± 0.31 0.63Appropriateness to eme 3.69 ± 1.81 -0.04 ± 0.20 3.00 ± 1.25 -0.14 ± 0.18 3.00 ± 1.00 -0.05 ± 0.40 0.79Fluency 3.50 ± 2.14 0.10 ± 0.32 2.88 ± 0.92 -0.11 ± 0.19 3.36 ± 0.85 -0.16 ± 0.28 1.23Temporal Sense 3.44 ± 1.72 -0.17 ± 0.15 2.56 ± 0.86 -0.12 ± 0.27 2.71 ± 0.70 -0.08 ± 0.35 0.56Overall Communicative Ability 3.31 ± 1.69 0.06 ± 0.38 2.62 ± 1.03 -0.07 ± 0.25 2.57 ± 1.02 0.21 ± 0.40 0.48Deportment on stage 3.50 ± 1.91 -0.10 ± 0.38 3.62 ± 1.03 -0.25 ± 0.14 3.21 ± 0.91 -0.11 ± 0.28 1.03Emotional commitment 3.38 ± 1.66 0.07 ± 0.39 3.00 ± 1.16 -0.18 ± 0.25 3.07 ± 0.79 -0.12 ± 0.28 1.83Confidence in the situation 3.69 ± 1.79 -0.02 ± 0.25 3.44 ± 0.98 -0.14 ± 0.24 3.36 ± 0.56 -0.12 ± 0.19 0.60
¹Change =
(post−pre
)pre
³s on group × pre/post performance interaction: in all measures df(2,19) and p=
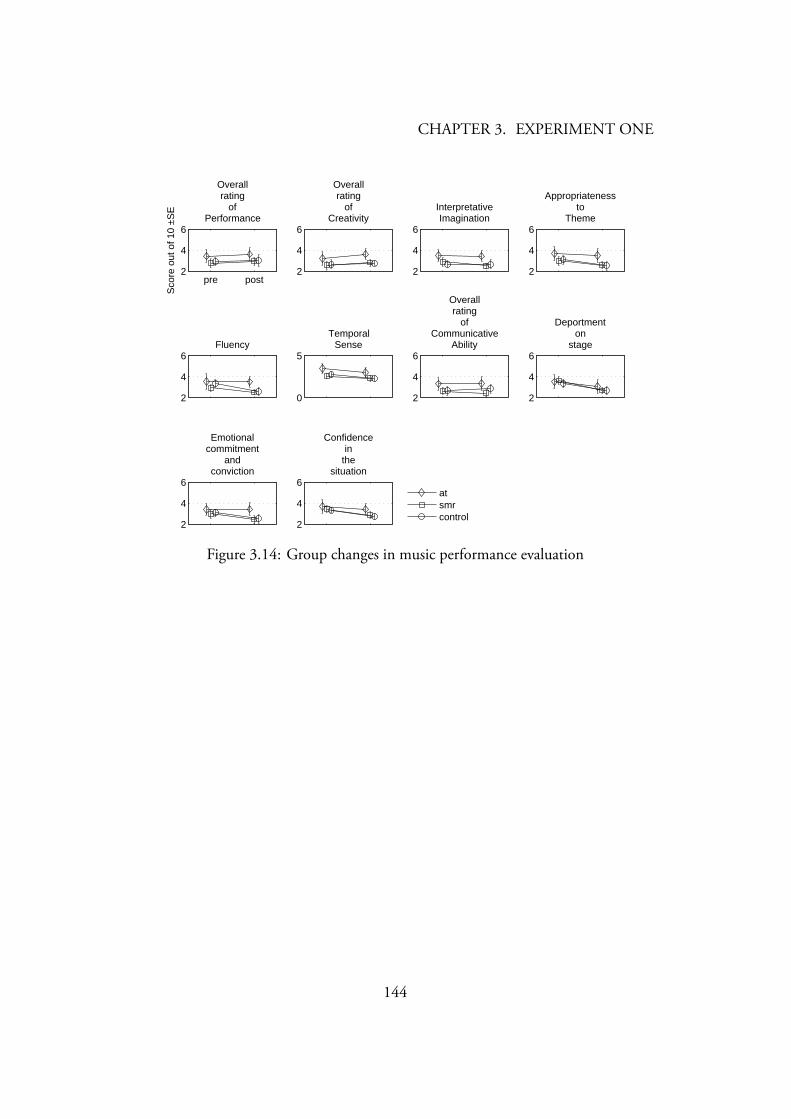
CHAPTER 3. EXPERIMENT ONE
pre post2
4
6
Sco
re o
ut o
f 10
±SE
Overallrating
ofPerformance
2
4
6
Overallrating
ofCreativity
2
4
6
InterpretativeImagination
2
4
6
Appropriatenessto
Theme
2
4
6Fluency
0
5
TemporalSense
2
4
6
Overallrating
ofCommunicative
Ability
2
4
6
Deportmenton
stage
2
4
6
Emotionalcommitment
andconviction
2
4
6
Confidencein
thesituation
atsmrcontrol
Figure 3.14: Group changes in music performance evaluation
144
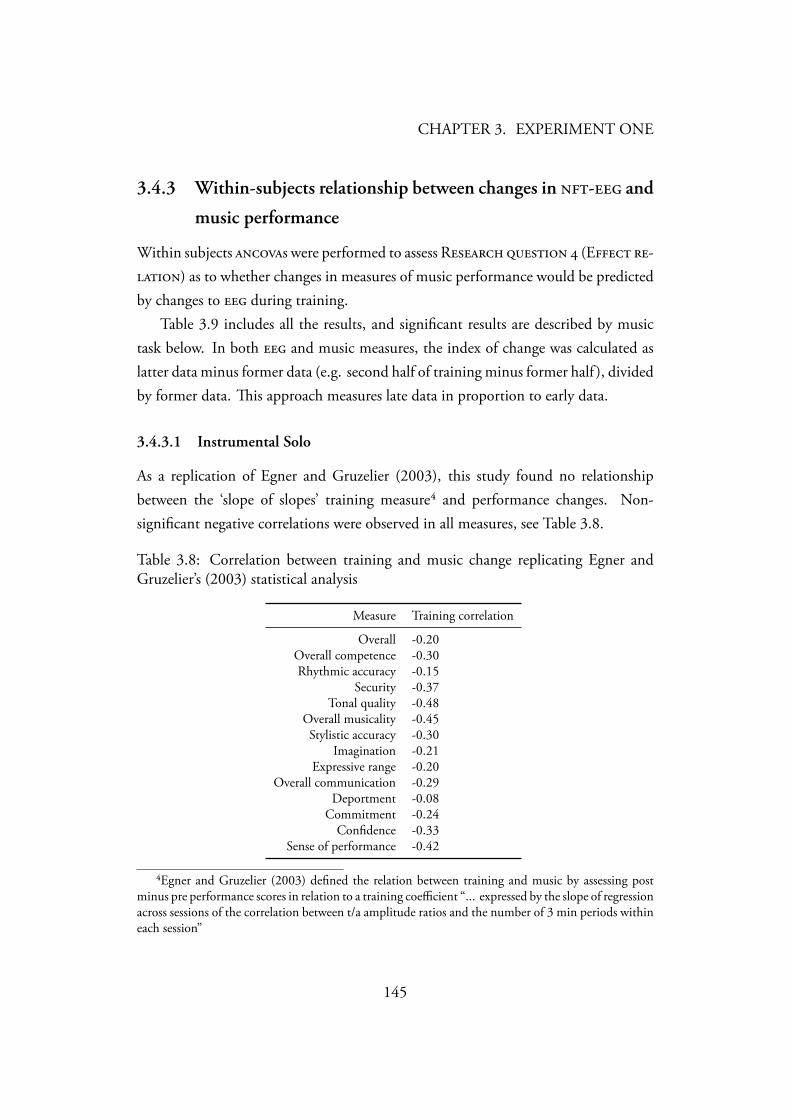
CHAPTER 3. EXPERIMENT ONE
3.4.3 Within-subjects relationship between changes in - and
music performance
Within subjects s were performed to assess R (E -) as to whether changes in measures of music performance would be predictedby changes to during training.
Table 3.9 includes all the results, and significant results are described by musictask below. In both and music measures, the index of change was calculated aslatter data minus former data (e.g. second half of training minus former half ), dividedby former data. is approach measures late data in proportion to early data.
3.4.3.1 Instrumental Solo
As a replication of Egner and Gruzelier (2003), this study found no relationshipbetween the ‘slope of slopes’ training measure⁴ and performance changes. Non-significant negative correlations were observed in all measures, see Table 3.8.
Table 3.8: Correlation between training and music change replicating Egner andGruzelier’s (2003) statistical analysis
Measure Training correlation
Overall -0.20Overall competence -0.30Rhythmic accuracy -0.15
Security -0.37Tonal quality -0.48
Overall musicality -0.45Stylistic accuracy -0.30
Imagination -0.21Expressive range -0.20
Overall communication -0.29Deportment -0.08
Commitment -0.24Confidence -0.33
Sense of performance -0.42
⁴Egner and Gruzelier (2003) defined the relation between training and music by assessing postminus pre performance scores in relation to a training coefficient “... expressed by the slope of regressionacross sessions of the correlation between t/a amplitude ratios and the number of 3 min periods withineach session”
145
CHAPTER 3. EXPERIMENT ONE
Using the analysis of covariance applied in the remainder of this study and inChapter 4, it was found that no musical measures of this task (either pre- or post-training) co-varied with within-session ratios.
3.4.3.2 Stripsody
It was found that no pre- or post-training musical measures of this task co-varied withwithin-session ratios.
3.4.3.3 Folk Song
It was found that the within-session training ratio was a significant covariate ofpost-training ‘Overall musical understanding,’ ‘Interpretative imagination,’ ‘Stylisticaccuracy’ and to a marginal extent ‘Rhythmic accuracy.’
3.4.3.4 Instrumental Improvisation
It was found that no pre- or post-training musical measures of this task co-varied withwithin-session ratios.
146
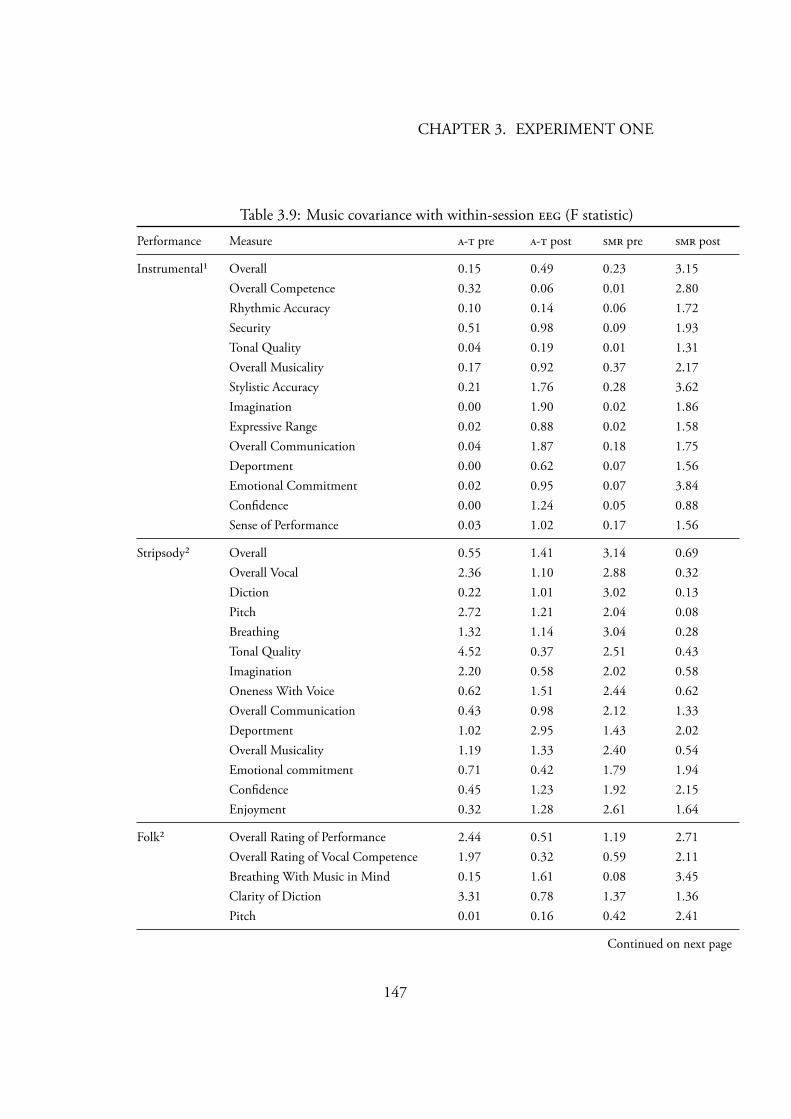
CHAPTER 3. EXPERIMENT ONE
Table 3.9: Music covariance with within-session (F statistic)
Performance Measure - pre - post pre post
Instrumental¹ Overall 0.15 0.49 0.23 3.15Overall Competence 0.32 0.06 0.01 2.80Rhythmic Accuracy 0.10 0.14 0.06 1.72Security 0.51 0.98 0.09 1.93Tonal Quality 0.04 0.19 0.01 1.31Overall Musicality 0.17 0.92 0.37 2.17Stylistic Accuracy 0.21 1.76 0.28 3.62Imagination 0.00 1.90 0.02 1.86Expressive Range 0.02 0.88 0.02 1.58Overall Communication 0.04 1.87 0.18 1.75Deportment 0.00 0.62 0.07 1.56Emotional Commitment 0.02 0.95 0.07 3.84Confidence 0.00 1.24 0.05 0.88Sense of Performance 0.03 1.02 0.17 1.56
Stripsody² Overall 0.55 1.41 3.14 0.69Overall Vocal 2.36 1.10 2.88 0.32Diction 0.22 1.01 3.02 0.13Pitch 2.72 1.21 2.04 0.08Breathing 1.32 1.14 3.04 0.28Tonal Quality 4.52 0.37 2.51 0.43Imagination 2.20 0.58 2.02 0.58Oneness With Voice 0.62 1.51 2.44 0.62Overall Communication 0.43 0.98 2.12 1.33Deportment 1.02 2.95 1.43 2.02Overall Musicality 1.19 1.33 2.40 0.54Emotional commitment 0.71 0.42 1.79 1.94Confidence 0.45 1.23 1.92 2.15Enjoyment 0.32 1.28 2.61 1.64
Folk² Overall Rating of Performance 2.44 0.51 1.19 2.71Overall Rating of Vocal Competence 1.97 0.32 0.59 2.11Breathing With Music in Mind 0.15 1.61 0.08 3.45Clarity of Diction 3.31 0.78 1.37 1.36Pitch 0.01 0.16 0.42 2.41
Continued on next page
147
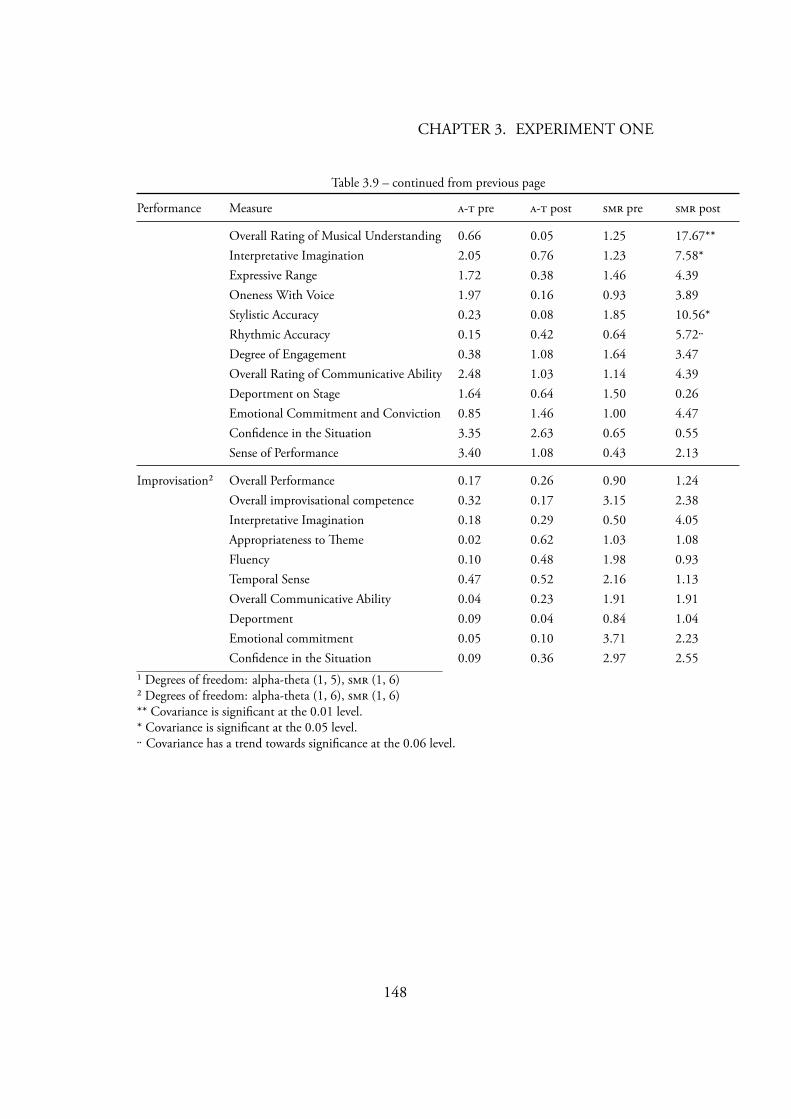
CHAPTER 3. EXPERIMENT ONE
Table 3.9 – continued from previous page
Performance Measure - pre - post pre post
Overall Rating of Musical Understanding 0.66 0.05 1.25 17.67**Interpretative Imagination 2.05 0.76 1.23 7.58*Expressive Range 1.72 0.38 1.46 4.39Oneness With Voice 1.97 0.16 0.93 3.89Stylistic Accuracy 0.23 0.08 1.85 10.56*Rhythmic Accuracy 0.15 0.42 0.64 5.72Degree of Engagement 0.38 1.08 1.64 3.47Overall Rating of Communicative Ability 2.48 1.03 1.14 4.39Deportment on Stage 1.64 0.64 1.50 0.26Emotional Commitment and Conviction 0.85 1.46 1.00 4.47Confidence in the Situation 3.35 2.63 0.65 0.55Sense of Performance 3.40 1.08 0.43 2.13
Improvisation² Overall Performance 0.17 0.26 0.90 1.24Overall improvisational competence 0.32 0.17 3.15 2.38Interpretative Imagination 0.18 0.29 0.50 4.05Appropriateness to eme 0.02 0.62 1.03 1.08Fluency 0.10 0.48 1.98 0.93Temporal Sense 0.47 0.52 2.16 1.13Overall Communicative Ability 0.04 0.23 1.91 1.91Deportment 0.09 0.04 0.84 1.04Emotional commitment 0.05 0.10 3.71 2.23Confidence in the Situation 0.09 0.36 2.97 2.55
¹ Degrees of freedom: alpha-theta (1, 5), (1, 6)² Degrees of freedom: alpha-theta (1, 6), (1, 6)** Covariance is significant at the 0.01 level.* Covariance is significant at the 0.05 level. Covariance has a trend towards significance at the 0.06 level.
148
CHAPTER 3. EXPERIMENT ONE
3.4.4 Music Results summary
e results of the Instrumental solo task confirmed R (is (Egnerand Gruzelier, 2003) replicable) as to whether measures of creativity would be im-proved in the alpha-theta theta group alone according to the within-group analysesreplicated from the prior study; these included ‘Overall musicality’, ‘Stylistic accu-racy’ and ‘Expressive range’. Deportment co-varied with longitudinal t/a changes.is is qualified however by the understanding that alpha-theta participants receiveddistinctly low scores to begin with, yet relatively equivalent scores post-intervention.
In analyses of the Stripsody scores, Confidence disclosed significant groupdifferences, being the first time a group × musical task interaction had been observed,although this was without post-hoc distinction. is addressed R . (C) in that a task involving the spontaneous processing of emotionalcontent may have interacted with alpha-theta reinforced hypnagogia.
e folk song task revealed group differences in evaluations of Pitch, althoughwithout supporting post-hoc disclosure. Post-intervention measures of ‘Overall Mu-sical Understanding,’ ‘Interpretative imagination’ and ‘Stylistic accuracy’ all co-variedwith within-session changes in the training ratio.
In instrumental improvisation, no group differences emerged.
3.5 Discussion
3.5.1 Neurofeedback Training
3.5.1.1 Alpha-theta training
In the alpha-theta group, changes in the t/a ratio were observed in both the within-and across-session analyses, the changes were marginally significant (p<0.053) in theformer comparison. is measure is considered the more robust estimator of learning as it smoothes inter-session variability (Vernon et al., 2003).
In across-sessions and period × session interaction analyses, no significant changeswere observed. is is comparable with the findings of prior alpha-theta studies(Moore et al. (2000), Boynton (2001), Egner et al. (2002), Egner and Gruzelier(2004a) and Raymond et al. (2005a)): none of which were able to detect across session
149
CHAPTER 3. EXPERIMENT ONE
training effects in the t/a ratio. Of the above studies, Egner and Gruzelier (2004a) didhowever detect an increase in absolute theta over the course of training, although theintroduction of training ratios into the methodology (Lubar and Shouse, 1976)was specifically designed to counteract the effect of non-training factors such as prioractivity on absolute measures, although the method was introduced for train-ing and sleep onset is characterised by rising theta and a combination of rising andthen falling alpha. is calls into question the use of ratios which do not account forspectral differences Overall however, and as acknowledged by Vernon (2005), the ag-gregated within-session training effect serves as a more reliable measure of learningratios and a reliable measure of longitudinal learning has not been tested.
3.5.1.2 SMR training
In the within-session analysis, training was not shown to invoke the exploredchanges in the promotion of synchronisation against both theta and beta.
A comparable study by Vernon et al. (2003) found however that the training re-lationship (separated into /theta and /beta measures) changed reliably whencollapsing measures across 8 × 15 minute sessions. e most immediate differencebetween that study and the present one is that Vernon’s method measured beta in the18–22 Hz band whereas the present study measured beta in the 22–30 Hz range pre-cluding direct comparison. Despite the failure of the protocol to elicit targeted changein beta band, it is noteworthy that as with the sensorimotor rhythm, increases in betaband over the motor cortex occur as a function of cortical deactivation when haltingmovement (Pfurtscheller and Lopes da Silva, 1999). For this reason it is speculatedthat participants in the group exhibited a tendency to elevate beta as a conse-quence of their efforts to inhibit the motor response, yet did not manage to achievethis by regulating the distinct rhythm (the 12–15 Hz peak in frequency spectra),and instead modulated the broader beta frequency band (22–30 Hz), possibly for thereason that it occupies a larger part of the spectrum and thus provides greater scopefor change. It is also possible that beta amplitudes, which rise with spontaneous cog-nitive activity (Laufs et al., 2003), may have risen as a function of changes in trainingstrategy.
In the across-sessions analysis it was observed that the training ratio fell slightly
150
CHAPTER 3. EXPERIMENT ONE
over the course of intervention. e overall training ratio fell, as did the /thetaratio, whilst the /beta ratio increased. Between frequency dynamics were mediatedto a larger extent by changes in theta and beta activity than modulation.
eta production during wakefulness has been implicated in the encoding of newinformation in working memory arising from oscillatory activity in a hippocampo-cortical loop that presents in frontal-midline areas (Buzsáki, 2002), and hippocampaltheta is thought to reflect sensorimotor integration during the preparation of a mo-tor response (Bland and Oddie, 2001). Despite the association between theta andsensorimotor integration, theta over the motor cortex is not as well understood as itsfrontal counterpart. To date theta activity in the motor region has been most directlyexplored through Repetitive Transcranial Magnetic Stimulation studies applying thetaburst stimulation (Huang et al., 2005; Di Lazzaro et al., 2005). ese studies haveobserved that the stimulation of theta cycling in motor areas depresses intracorticalexcitability, supporting the interpretation that motor theta is related to cortical de-activation, as seen in sleep, and in accordance with Lubar et al. (1995), who treatedabnormally high theta in cases as evidence of low arousal. Given that frontaltheta activity is related to the preparation of an action, whilst elicited motor thetais associated with the depression of cortical excitability, it is surmised that progres-sive theta/ increases seen across-training are more likely to have been predictedby cortical deactivation because participants responded to the training goal of main-taining motor stillness by promoting deactivation rather than regulation of the motorresponse. e slight falls in beta across the course of training also support the interpre-tation that deactivation occurred, and taken together the downward shift in spectralpower over the course of training suggests a fall in vigilant arousal.
3.5.2 Music Performance
is section concentrates first on the replication (Egner and Gruzelier, 2003) partof the study, and continues by covering each of the experimental tasks newly intro-duced into the methodology. Given the probing nature of this study, the effectof intervention across all measures is not evaluated, and focus is given to the apparentusability of each task as a reliable indicator of related change.
151
CHAPTER 3. EXPERIMENT ONE
3.5.2.1 Instrumental Solo
As with the replication precursor (Egner and Gruzelier, 2003), a post-interventionbetween-groups difference in instrumental performance was not disclosed. In thelight of this is seems reasonable to assume that whilst this and previous explorationprovided limited evidence for alpha-theta effects on performance, the level of experi-mental control required to isolate the effect is beyond the scope of the current researchmethodology.
ere are several contributory factors that might have increased sampling errorvariance in this study, which in turn might blur protocol specific effects. Firstly thesmall sample size reduces the statistical power of the analyses used. ere were alsouncontrolled methodological factors that are likely to contribute to differences in rat-ings, with the highest amount of interference stemming from the open choice of musicto be played, and the instrument to play it on. Although the current study retainedthis particular approach for consistency with prior work, Wapnick et al. (2004, 2005)documented the significant effect of a number of variables on audience evaluationsincluding tempo, duration, style, and composer, which suggests that controlling forinstrument and score might reduce sampling error variance in future attempts to iso-late protocol specific effects.
e replication of Egner and Gruzelier (2003) in assessing within-subjects changesare discussed below, although with the caveat that a treatment effect may be blurred bythe statistical phenomenon of regression to the mean as performance measures weresignificantly lower initially than post-intervention (Morton and Torgerson, 2005).
e a priori hypothesis that improvements in instrumental performance wouldreplicate the findings of the second experiment in Egner and Gruzelier (2003) wasconfirmed in as far as between-groups differences were found in neither study, andwithin-group changes were seen in the alpha-theta group alone. A very similar mark-ing scheme to that used in the previous work had been used here, and some exploratorywithin-group comparisons were compared to the Egner and Gruzelier (2003) studyand showed that all the previously significant changes were replicated. However, inthe current study, the alpha-theta group gained significantly lower scores on base-line measures of instrumental solo performance than the other groups and equivalentscores post-training, so the scope for improvement was greater than in other groups.
152
CHAPTER 3. EXPERIMENT ONE
e current study extends the second experiment in Egner and Gruzelier (2003)by additionally disclosing the influence of the long term alpha-theta training covari-ate on within-subjects improvements in ratings of Deportment. e reason for thisdifference might be accounted for by the different analyses used; Egner and Gruze-lier (2003) indexed learning as across-session changes in within-session changes(a slope of slopes), whilst the current study used a early-late training comparativemeasure of learning (first 5 against final 5 sessions). is approach is consistent withthe assertion that collapsing training data reduces sampling error variance caused byinter-session differences in uncontrolled factors that might modulate (Vernonet al., 2003). Egner and Gruzelier’s (2003) index had however disclosed a correlationbetween t/a and music change in the first experiment, in which alpha-theta trainingwas given following a course of and beta training, and so it is speculated thatacross-session t/a increases in Egner’s first experiment may have been improved as aresult of prior training. Scott et al. (2005) also used training to opti-mise attentional performance prior to applying alpha-theta as a treatment for mixedchemical dependency withdrawal. Taken together, these reports suggest that the twoprotocols may interact.
e measure of ‘Deportment on stage’ itself is classed as a Communication vari-able, and if this were not a chance finding, it would suggest that the longitudinalchange of sleep-onset seen in training was positively related to this aspect of mu-sic performance. Considering that alpha-theta regulates sleep onset and was reportedto influence associated mood measures (Raymond et al., 2005b), the self-control ofphysical aspects of performance might also be affected.
In combination, these findings did not significantly isolate protocol specific train-ing effects, but rather replicated within-subjects improvements and added a singlepiece of evidence linking changes in and perceived competence, indicating pos-sible electrophysiological mediation. Extending the method to verify this form ofmediation is covered in Chapter 5, which introduces a means of measuring musicelectrophysiology commensurate with . Such an extension of the method pro-vides the basis for testing the theoretical framework discussed in Section 1.5.2, inwhich the hypofrontal neurophysiologies of both sleep-onset and creative ideationare paralleled (Dietrich, 2003). Dietrich’s hypothesis could be tested by measuringhypofrontality in both and creative behaviour.
153
CHAPTER 3. EXPERIMENT ONE
3.5.2.2 Stripsody
Post-intervention changes in ratings of ‘Confidence’ were shown to be significantlydifferent between groups, yet post-hoc inter-group comparisons did not reveal distinctprotocol differences. is measure was part of the ‘Communication’ category thatwas introduced into the study from the standard conservatory assessment measures(Taylor, 2005).
Of the four experimental tasks presented here, Stripsody and Folk song (see Sec-tion 3.5.2.3) were the only tasks that disclosed between-groups differences post-intervention,and even then on solitary measures out of many. is suggests chance outcomes, al-though in this task associated communication measures of ‘Deportment on stage,’‘Emotional commitment’ and ‘Enjoyment on stage’ all showed trends towards signif-icance, so there are additional clues that this task may interact with the experimentalintervention. Confidence changes were not shown to co-vary with training .
On the basis that this is not a chance finding, the result suggests that the method-ology has advanced through R (C), by further isolatingpost differences, and such an outcome invites further consideration.
As outlined in Section 3.3.5.2, the Stripsody task was selected to provide a con-trolled scope for spontaneous creativity, resulting in performances that afford bothnovel creative insight and empirical comparison. is attempt to control for some ofthe many variables impacting on music appraisal (Wapnick et al., 2004) does appearto have taken a step towards isolating protocol specific effects.
Confidence and alpha-theta have previously been investigated by Raymond et al.(2005b), who documented alpha-theta related improvements in this measure withinthe Profile of Mood States scale (Lorr et al., 1971). Raymond et al.’s (2005b) studyalso demonstrated post alpha-theta training increases in participants’ feelings of be-ing composed, agreeable and elevated, leading to the suggestion that combined moodimprovements might underline the efficacy of alpha-theta in task-related appli-cations. In relation to this, a study by Petsche et al. (1997) found that increases inlower alpha amplitude (7.5–9 Hz) were related to elevated mood, which suggests thata downward shift in spectral power, as observed in the alpha-theta protocol, mighthave positive implications for mood via similar physiological mechanisms to creativebehaviour. In addition it has been reported that mood measures of depression were
154
CHAPTER 3. EXPERIMENT ONE
reduced following music listening (Tornek et al., 2003), and in the current studysignificant confidence improvements were only observed in the alpha-theta group,suggesting that mood elevation occurred separately from music effects, implicatingthe t/a ratio as the main contributory factor in confidence differences.
In itself, performing confidently may not give rise to creative behaviour, but in atask such as this, which explicitly requires the performer to be spontaneous and pro-duce fast responses during music creation, it is possible that the confidence to attemptnew ideas may lead to innovation, and Phelan and Young (2003) reported suggestiveevidence linking creative confidence to innovative behaviour in the workplace.
Furthermore, the stage fright literature (see Section 1.4.2.2) indicates that confi-dence is impaired by fear (Brotons, 1994), and so this result could be interpreted asan optimisation against performance anxiety.
3.5.2.3 Folk Songs
e folk song element of this study explored neurofeedback training effects in noviceperformance for the first time, and in line with research linking motor skill improve-ment with training (Ros et al., 2009), this study explored whether trainingwould interact with sensory/motor components of performance as a result of regulation.
A group difference in Pitch changes was observed, with the group showingmost improvement, however this change was not found to co-vary with changes inneurofeedback training ratios, which suggests that technical gains may not have beenmediated by electrophysiological change. It is noteworthy that the other technicalmeasures: ‘Clarity of Diction,’ ‘Breathing with the music in mind,’ or ‘Overall vocalcompetence’ did not exhibit similar positive changes following training suggest-ing that technical gains were quite marginal, or perhaps that Pitch, as a relativelyobjective measure isolated motor skill changes most clearly.
Post- scores of ‘Overall Musical Understanding,’ ‘Interpretative imagination’and ‘Stylistic accuracy’ all co-varied with the within-session training ratio. issuggests that Artistry may have changed as a function of , but not to a marked ex-tent. e idea that training might influence perceived artistic qualities in perfor-mance can be interpreted as performance optimisation not in the anticipated technical
155
CHAPTER 3. EXPERIMENT ONE
sense, but in the sense that mitigating physiological arousal in stage fright interactswith emotional performance - possibly in the way that experienced performers areable to control stage fright in maintaining optimal arousal (Brotons, 1994).
3.5.2.4 Instrumental Improvisation
Looking at global changes across all performance measures, all participants received re-duced scores as a function of time, and this was confirmed by repeated measures Mul-tivariate that showed a main effect of testing stage (F(10,10)=9.759, p=0.001).e fact that scores fell as a function of repeat testing can be interpreted based on thenature of the task. In the first performance participants were asked to choose froma list of descriptive scenes from which to improvise, and in the second performanceto choose another from the same list. is leads to the speculation that participantsmight have had more difficulty in the second instance as their choice of source mate-rial was more restricted, and did not include their previous selection which may havebeen made on the basis of their ability to improvise with it. On this basis, it appearsthat the task became harder on the second attempt.
3.5.3 Summary of the study
As a constructive replication of the second experiment in Egner and Gruzelier (2003),the present study sought to determine whether post alpha-theta musicality improve-ments might be replicable in Instrumental solo performances. e results of the cur-rent study indicate that protocol specific improvements in Musicality may be replica-ble, although the evidence in favour was hampered by the low opening scores in thealpha-theta group (R ).
Stripsody and Instrumental improvisation were included into the current studyas they were speculated to isolate creativity related effects more specifically throughtheir explicit inclusion of music creation behaviours. Post-intervention measures ofconfidence in the Stripsody task disclosed a significant different in group means. isfinding, despite being the first example of a between-groups difference in the opti-mal performance literature, did not support the explorations of the study as theimprovements fell in the category of communication rather than artistry. is resultwas interpreted as being associated with the mood enhancing properties of the alpha-
156
CHAPTER 3. EXPERIMENT ONE
theta protocol as opposed to its role in modulating creativity, although it is notablethat confidence in improvisation may offset stage-fright (Brotons, 1994), optimisingspontaneous emotional processing (R ).
e global reduction in improvisational quality was interpreted in terms of appar-ent methodological shortcomings of the experimental method, principally the use ofa reduced choice of improvisational stimuli in the post-intervention measures.
Finally, the Folk song task was included to assess the novel question that training would specifically optimise technical aspects of performance in a novice per-formance task (R ) — and post-intervention measures did showsignificant variance of Pitch between group means, although without post-hoc dis-tinction. e Folk task did however show several relations between and Artisticvariables, suggesting that such aspects of performance, potentially reduced by stagefight, may be supported through training.
3.5.3.1 e following study
Given the results of the present study were able to address primary R - , , to a limited extent, the addition of an additional population cohortinto the current study was planned in order to raise statistical power.
An increased data capture was sought and a second group of participants recruited.In the implementation of the extended experiment, a methodological difference in-troduced a previously unobserved effect on music performance that altered the designof the study.
In this second cohort, post-training performances were recorded immediately fol-lowing the final session, whereas the participants in the current study waited atleast one hour before performing music.
e transient after-effects of alpha-theta appeared to lead to marked differ-ences in post-training performance measures amongst participants who had emergedfrom a period of sleep-onset only minutes before.
Interestingly this raised a hitherto undocumented short-term effect of alpha-theta, and the results of this altered study design are accordingly isolated and docu-mented in Chapter 4.
157
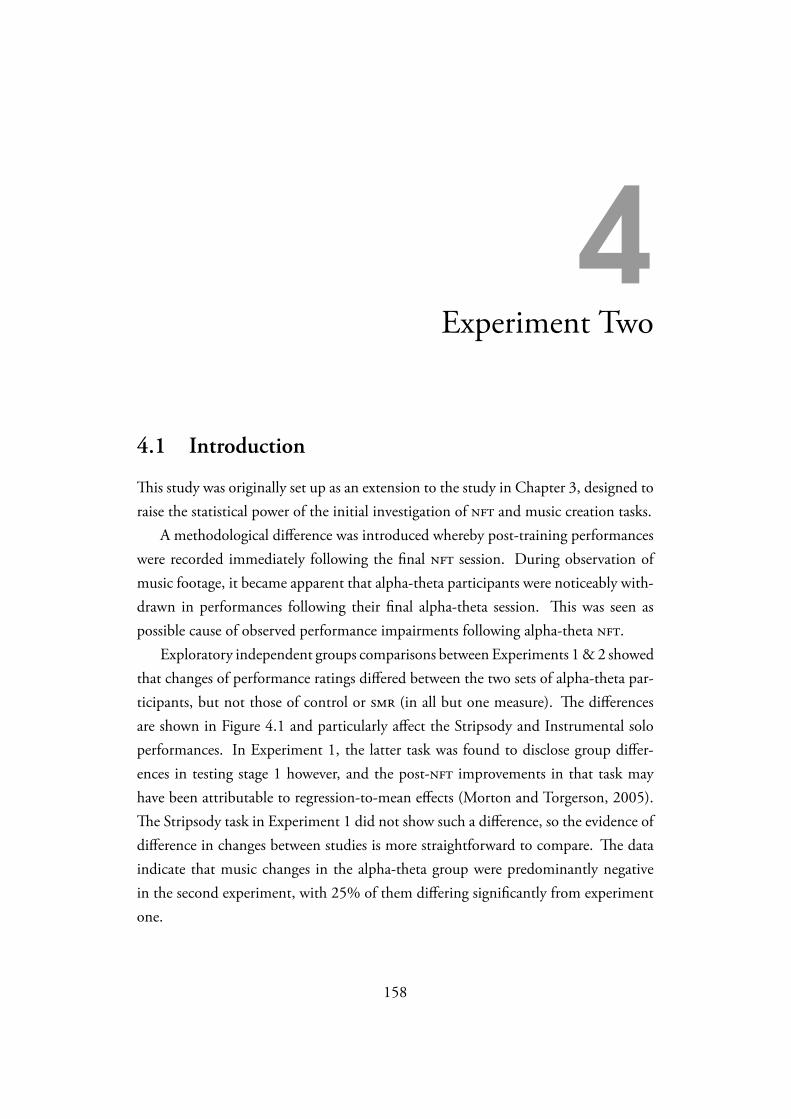
4Experiment Two
4.1 Introduction
is study was originally set up as an extension to the study in Chapter 3, designed toraise the statistical power of the initial investigation of and music creation tasks.
A methodological difference was introduced whereby post-training performanceswere recorded immediately following the final session. During observation ofmusic footage, it became apparent that alpha-theta participants were noticeably with-drawn in performances following their final alpha-theta session. is was seen aspossible cause of observed performance impairments following alpha-theta .
Exploratory independent groups comparisons between Experiments 1 & 2 showedthat changes of performance ratings differed between the two sets of alpha-theta par-ticipants, but not those of control or (in all but one measure). e differencesare shown in Figure 4.1 and particularly affect the Stripsody and Instrumental soloperformances. In Experiment 1, the latter task was found to disclose group differ-ences in testing stage 1 however, and the post- improvements in that task mayhave been attributable to regression-to-mean effects (Morton and Torgerson, 2005).e Stripsody task in Experiment 1 did not show such a difference, so the evidence ofdifference in changes between studies is more straightforward to compare. e dataindicate that music changes in the alpha-theta group were predominantly negativein the second experiment, with 25% of them differing significantly from experimentone.
158
CHAPTER 4. EXPERIMENT TWO
1 2 3 4 5 6 7 8 9 10 11 12 13 14 15 16 17 18 19 20 21 22 23 24 25 26 27 28 29 30 31 32 33 34 35 36 37 38 39 40 41 42 43 44 45 46 47 48 49 50 51 52
−0.2
0
0.2
0.4
0.6
0.8
1
Rat
ings
: (po
st−
pre)
/pre
± S
E
Experiment 1Experiment 2
(a) alpha-theta
1 2 3 4 5 6 7 8 9 10 11 12 13 14 15 16 17 18 19 20 21 22 23 24 25 26 27 28 29 30 31 32 33 34 35 36 37 38 39 40 41 42 43 44 45 46 47 48 49 50 51 52
−0.2
0
0.2
0.4
0.6
0.8
1
Rat
ings
: (po
st−
pre)
/pre
± S
E
Experiment 1Experiment 2
(b)
1 2 3 4 5 6 7 8 9 10 11 12 13 14 15 16 17 18 19 20 21 22 23 24 25 26 27 28 29 30 31 32 33 34 35 36 37 38 39 40 41 42 43 44 45 46 47 48 49 50 51 52
−0.2
0
0.2
0.4
0.6
0.8
1
Rat
ings
: (po
st−
pre)
/pre
± S
E
Experiment 1Experiment 2
(c) control
Figure 4.1: Significant differences are highlighted in the plots (× for and ∗ foralpha-theta). Variable names and significant test results are shown below:Folk: 1– overall rating of performance, 2–overall rating of vocal competence, 3–clarity of diction× (t(8.07)=2.53, p=0.035), 4–pitch, 5–overall rating of musical un-
derstanding, 6–interpretative imagination, 7–expressive range, 8–stylistic accuracy, 9–rhythmic accuracy, 10–overall rating of communicative ability, 11–deportment on
stage, 12–emotional commitment and conviction, 13–confidence in the situation, 14–sense of performance;
Stripsody: 15–overall, 16–overall vocal, 17–diction, 18–pitch, 19–breathing, 20–tonal, 21–overall musicality, 22–imagination, 23–oneness with voice, 24–overall com-
munication, 25–deportment, 26–commitment∗ (t(7.54)=2.87, p=0.02), 27–confidence∗ (t(12)=2.27, p=0.04), 28–enjoyment;
Instrumental: 29–overall∗ (t(12)=2.94, p=0.01), 30–overall competence, 31–rhythmic accuracy∗ (t(7.67)=2.58, p=0.03), 32–security, 33–tonal quality∗ t(12)=2.69,
p=0.02, 34–overall musicality∗ (t(12)=3.29, p=0.01), 35–stylistic accuracy∗ (t(12)=2.120, p=0.05), 36–imagination∗ (t(12)=2.83, p=0.02), 37–expressive range,
38–overall communication∗ (t(12)=2.85, p=0.02), 39–deportment, 40–commitment∗ (t(12)=3.20, p=0.3.20), 41–confidence∗ (t(12)=3.00, 0.01), 42–sense of
performance∗ (t(12)=2.81, p=0.02);
Improv: 43–overall rating of performance∗ (t(12)=2.20, p=0.05), 44–overall rating of creativity∗ *t(12)=2.25, p=0.04, 45–interpretative imagination, 46–appropriateness
to theme, 47–fluency, 48–temporal sense, 49–overall rating of communicative ability, 50–deportment on stage, 51–emotional commitment and conviction, 52–confidence
in the situation.
159
CHAPTER 4. EXPERIMENT TWO
4.2 Method
4.2.1 Participants
19 undergraduate music students from Goldsmiths University of London volunteeredfor participation (12 males, 7 females, mean age 24, ± 10.30). As in the previouscohort all who joined were instrumentalists with non-expert singing experience, andwere assigned in the order of joining to one of three experimental groups: alpha-theta (n=7), (n=6), controls (n=6). On completion of participation each subjectreceived a payment of £20.
Participants played a variety of instruments, mostly but not exclusively in theclassical tradition: 2 bassists; 1 clarinettist; 1 flautist; 3 guitarists; 7 pianists; 1 saxo-phonist; 1 tuba player; 3 violinists. One bassist played pop/rock, and the saxophonistplayed traditional jazz and classical. As with the previous participants, the prevailingmusical orthodoxy was of playing music notation only, and improvisational skill hadnot been formally developed by any participants. Only the pop/rock musician wasaccustomed to the importance of jams, riffs and solos in the rock tradition.
4.2.2 Design
Prior to and following the intervention, participants in all groups performed the samebattery of four musical tasks used in Chapter 3. e experimental intervention ofeither 10 training sessions or a passive control period lasted for 72 (±25) days,with sessions taking place every 8±3 days.
4.2.3 Neurofeedback, Music Performance and Statistical methods
Neurofeedback training provided was implemented according to procedures detailedin Section 3.3.3 and alpha-theta and protocols detailed in Section 3.3.4. Mu-sic performance tasks were the same as those described in Section 3.3.5, however thepost-performances did immediately follow the final training session, rendering themopen to potential transient effects, a key difference from the first cohort. Mu-sic performance ratings were conducted by the same two-member panel in the case
160
CHAPTER 4. EXPERIMENT TWO
of Stripsody and Folk-song performances, however in the case of Instrumental so-los and improvisations, only one of the panel evaluated the performances, althoughgiven good prior agreement on assessment of these tasks, the use of single ratings wasvalidated. e statistical methods used were previously introduced in Section 3.3.6.
4.3 Results
4.3.1 Neurofeedback training
For reasons stated in Section 3.3.6.1 the training ratio is used as the most reliable learning index, as it is less sensitive to uncontrolled modulators. However,absolute component measures are included here to explore the factors underlyingrelative changes.
4.3.1.1 Alpha-theta neurofeedback training
According to the research questions of the experiment, alpha-theta would mod-ulate the theta-alpha ratio progressively both within- and across-sessions, plus thesemeasures would interact (R ). A repeated measures two-way (ses-sion × periods) (with 10 × 5 levels respectively, sessions 1–10 and periods 1–5)disclosed marked changes across all measures:
• e within-session factor of the revealed a significant effect of period onthe t/a ratio (F(1.206, 7.236)=7.076, p=0.001), see Figure 4.2a
• e sessions factor of the revealed a significant effect of session on thet/a ratio (F(9, 54)=2.301, p=0.029), see Figure 4.2b
• e session × period interaction showed a significant effect of session on periodt/a ratios (F(36, 216)=1.517, p=0.038), see Figure 4.2c.
161
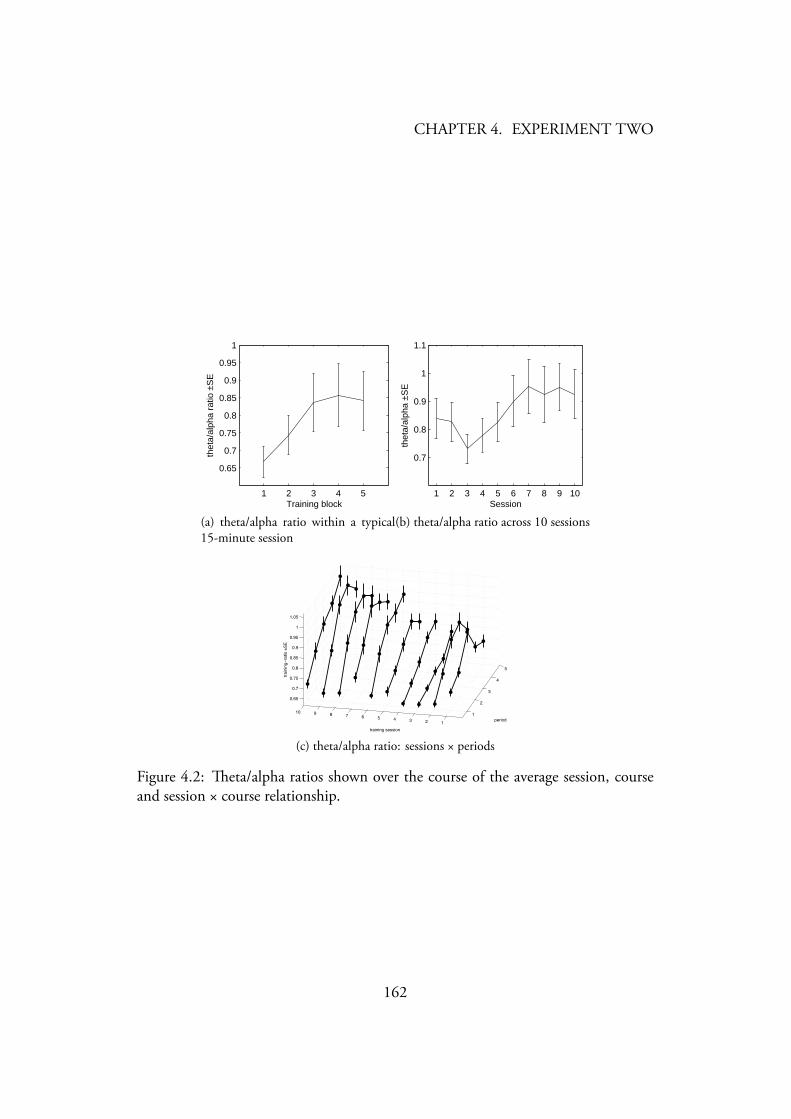
CHAPTER 4. EXPERIMENT TWO
1 2 3 4 5
0.65
0.7
0.75
0.8
0.85
0.9
0.95
1
Training block
thet
a/al
pha
ratio
±S
E
(a) theta/alpha ratio within a typical15-minute session
1 2 3 4 5 6 7 8 9 10
0.7
0.8
0.9
1
1.1
Session
thet
a/al
pha
±SE
(b) theta/alpha ratio across 10 sessions
1
2
3
4
5
12345678910
0.65
0.7
0.75
0.8
0.85
0.9
0.95
1
1.05
period
training session
trai
ning−
ratio
±S
E
(c) theta/alpha ratio: sessions × periods
Figure 4.2: eta/alpha ratios shown over the course of the average session, courseand session × course relationship.
162
CHAPTER 4. EXPERIMENT TWO
4.3.1.2 SMR neurofeedback training
According to the research questions of the experiment, would raise the ratio of to both theta and beta amplitudes progressively both within- and across-sessions,plus these measures would interact (R ).
A repeated measures two-way (session × periods) (with 10 × 5 levels respec-tively, sessions 1–10 and periods 1–5) disclosed marked changes in only the aggregated‘within-session’ measure:
• e within-session factor of the revealed a significant effect of period onthe training ratio (F(4, 20)=3.10, p=0.039), see Figure 4.3a
• e sessions factor of the revealed that there were no significant differ-ences between sessions (F(9, 45)=1.22, p=), see Figure 4.3b
• e session × period interaction was examined for evidence of an effect of ses-sion on period t/a ratio. ere was no significant interaction effect on thetraining ratio (F(36, 180)=0.778, p=), see Figure 4.3c.
163
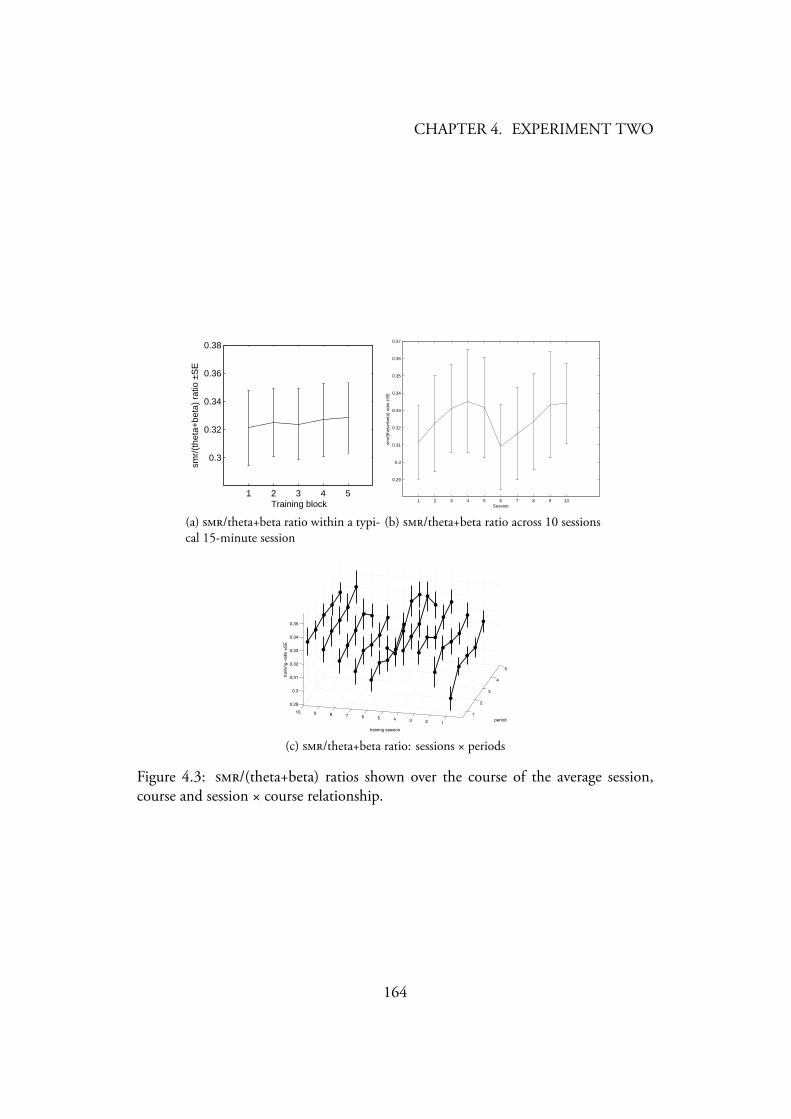
CHAPTER 4. EXPERIMENT TWO
1 2 3 4 5
0.3
0.32
0.34
0.36
0.38
Training block
smr/
(the
ta+
beta
) ra
tio ±
SE
(a) /theta+beta ratio within a typi-cal 15-minute session
1 2 3 4 5 6 7 8 9 10
0.29
0.3
0.31
0.32
0.33
0.34
0.35
0.36
0.37
Session
smr/
(the
ta+
beta
) ra
tio ±
SE
(b) /theta+beta ratio across 10 sessions
1
2
3
4
5
12345678910
0.29
0.3
0.31
0.32
0.33
0.34
0.35
period
training session
trai
ning−
ratio
±S
E
(c) /theta+beta ratio: sessions × periods
Figure 4.3: /(theta+beta) ratios shown over the course of the average session,course and session × course relationship.
164
CHAPTER 4. EXPERIMENT TWO
4.3.2 Music Performance
4.3.2.1 Instrumental Solo
Data Screening Ratings were provided by one of the panellists from the prior study.Conservative ‘single-measures’ estimates of absolute rater agreement on prior instru-mental data were computed — this approach is used in cases where high agreementbetween multiple raters on a subset of data is used as a precursor to continuing withone rater (’A-1’ type, (Wong, 1981)). In instrumental ratings in the prior study,absolute agreement between the panel was high at r=0.73, p<0.0001, and thus thecurrent set of ratings were interpreted as being representative of the panel’s approachto marking this type of performance.
A one-way on the pre-intervention measures of Instrumental performancerevealed no differences between groups at baseline. Group score distributions areshown in Figure 4.4.
Creativity is task addressed R (C).e means and standard deviations of baseline and change measures, as well as
F -terms are included in Table 4.1 and visualised in Figure 4.5.e ratings of performance were entered into repeated measures s, with the
pre-intervention scores as the covariate and the post-intervention score as the depen-dent variable. None of the tests showed a significant effect of experimental group.
165
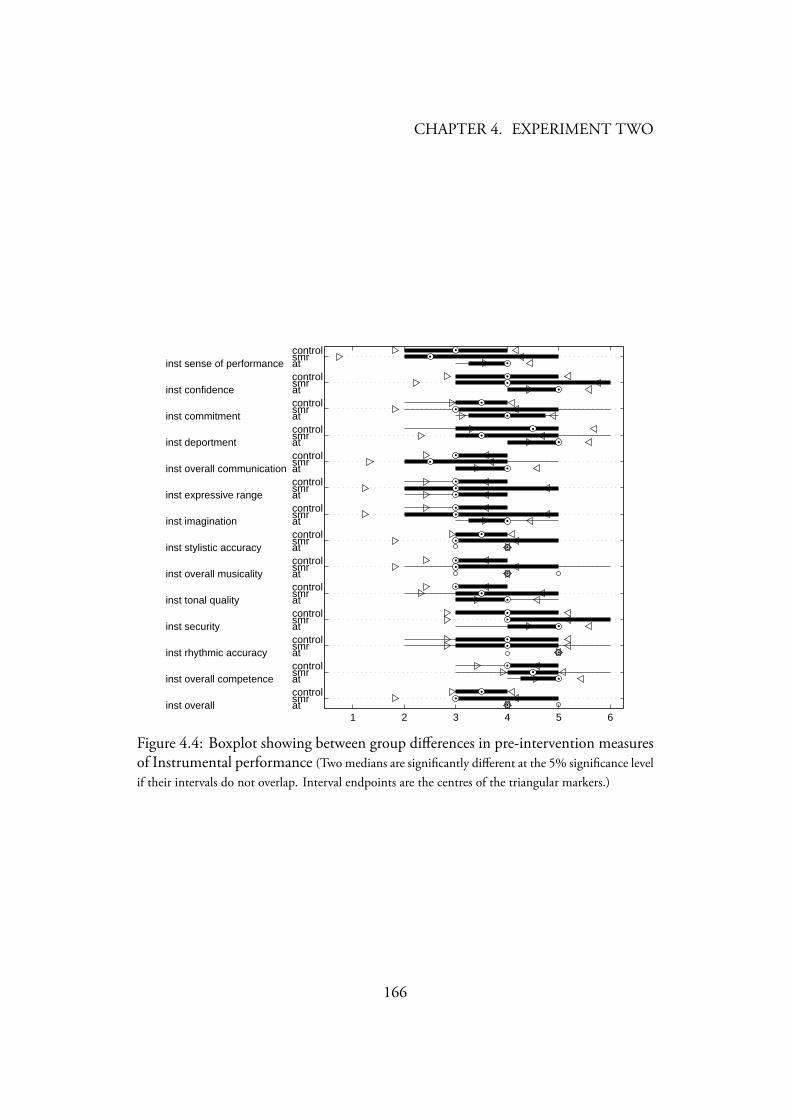
CHAPTER 4. EXPERIMENT TWO
1 2 3 4 5 6inst overall
inst overall competence
inst rhythmic accuracy
inst security
inst tonal quality
inst overall musicality
inst stylistic accuracy
inst imagination
inst expressive range
inst overall communication
inst deportment
inst commitment
inst confidence
inst sense of performance
atsmrcontrolatsmrcontrolatsmrcontrolatsmrcontrolatsmrcontrolatsmrcontrolatsmrcontrolatsmrcontrolatsmrcontrolatsmrcontrolatsmrcontrolatsmrcontrolatsmrcontrolatsmrcontrol
Figure 4.4: Boxplot showing between group differences in pre-intervention measuresof Instrumental performance (Two medians are significantly different at the 5% significance levelif their intervals do not overlap. Interval endpoints are the centres of the triangular markers.)
166
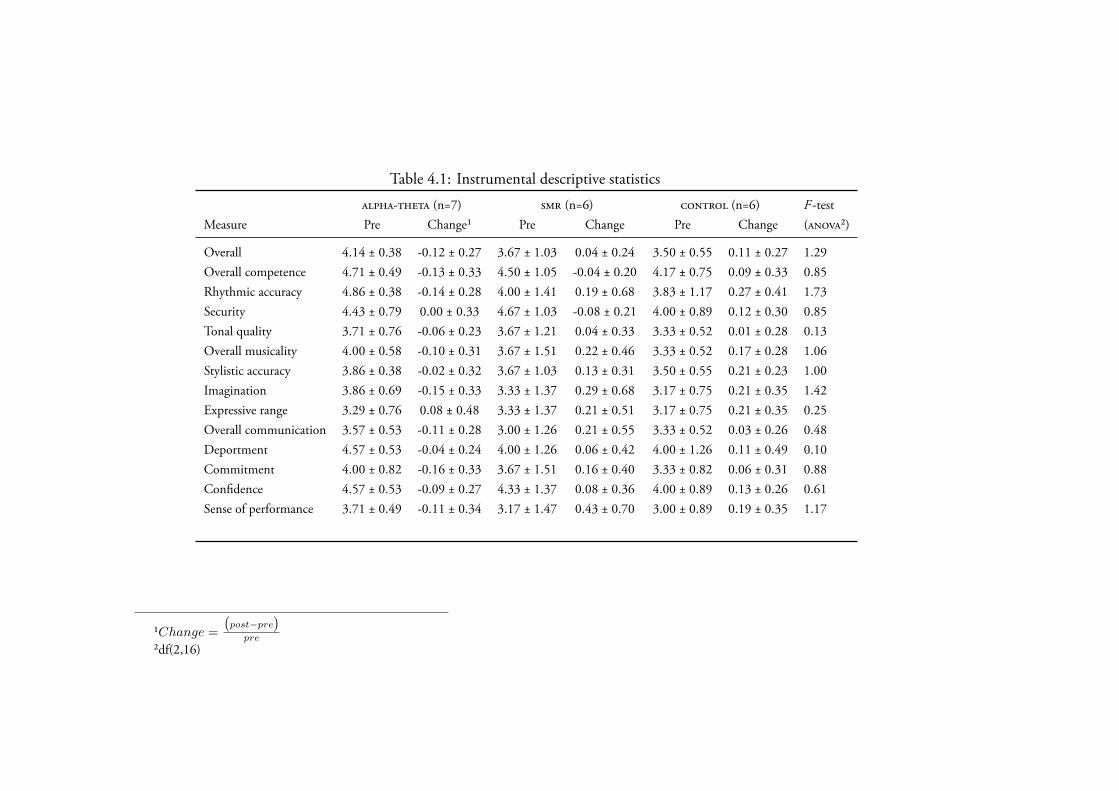
Table 4.1: Instrumental descriptive statistics
- (n=7) (n=6) (n=6) F -testMeasure Pre Change¹ Pre Change Pre Change (²)
Overall 4.14 ± 0.38 -0.12 ± 0.27 3.67 ± 1.03 0.04 ± 0.24 3.50 ± 0.55 0.11 ± 0.27 1.29Overall competence 4.71 ± 0.49 -0.13 ± 0.33 4.50 ± 1.05 -0.04 ± 0.20 4.17 ± 0.75 0.09 ± 0.33 0.85Rhythmic accuracy 4.86 ± 0.38 -0.14 ± 0.28 4.00 ± 1.41 0.19 ± 0.68 3.83 ± 1.17 0.27 ± 0.41 1.73Security 4.43 ± 0.79 0.00 ± 0.33 4.67 ± 1.03 -0.08 ± 0.21 4.00 ± 0.89 0.12 ± 0.30 0.85Tonal quality 3.71 ± 0.76 -0.06 ± 0.23 3.67 ± 1.21 0.04 ± 0.33 3.33 ± 0.52 0.01 ± 0.28 0.13Overall musicality 4.00 ± 0.58 -0.10 ± 0.31 3.67 ± 1.51 0.22 ± 0.46 3.33 ± 0.52 0.17 ± 0.28 1.06Stylistic accuracy 3.86 ± 0.38 -0.02 ± 0.32 3.67 ± 1.03 0.13 ± 0.31 3.50 ± 0.55 0.21 ± 0.23 1.00Imagination 3.86 ± 0.69 -0.15 ± 0.33 3.33 ± 1.37 0.29 ± 0.68 3.17 ± 0.75 0.21 ± 0.35 1.42Expressive range 3.29 ± 0.76 0.08 ± 0.48 3.33 ± 1.37 0.21 ± 0.51 3.17 ± 0.75 0.21 ± 0.35 0.25Overall communication 3.57 ± 0.53 -0.11 ± 0.28 3.00 ± 1.26 0.21 ± 0.55 3.33 ± 0.52 0.03 ± 0.26 0.48Deportment 4.57 ± 0.53 -0.04 ± 0.24 4.00 ± 1.26 0.06 ± 0.42 4.00 ± 1.26 0.11 ± 0.49 0.10Commitment 4.00 ± 0.82 -0.16 ± 0.33 3.67 ± 1.51 0.16 ± 0.40 3.33 ± 0.82 0.06 ± 0.31 0.88Confidence 4.57 ± 0.53 -0.09 ± 0.27 4.33 ± 1.37 0.08 ± 0.36 4.00 ± 0.89 0.13 ± 0.26 0.61Sense of performance 3.71 ± 0.49 -0.11 ± 0.34 3.17 ± 1.47 0.43 ± 0.70 3.00 ± 0.89 0.19 ± 0.35 1.17
¹Change =
(post−pre
)pre
²df(2,16)
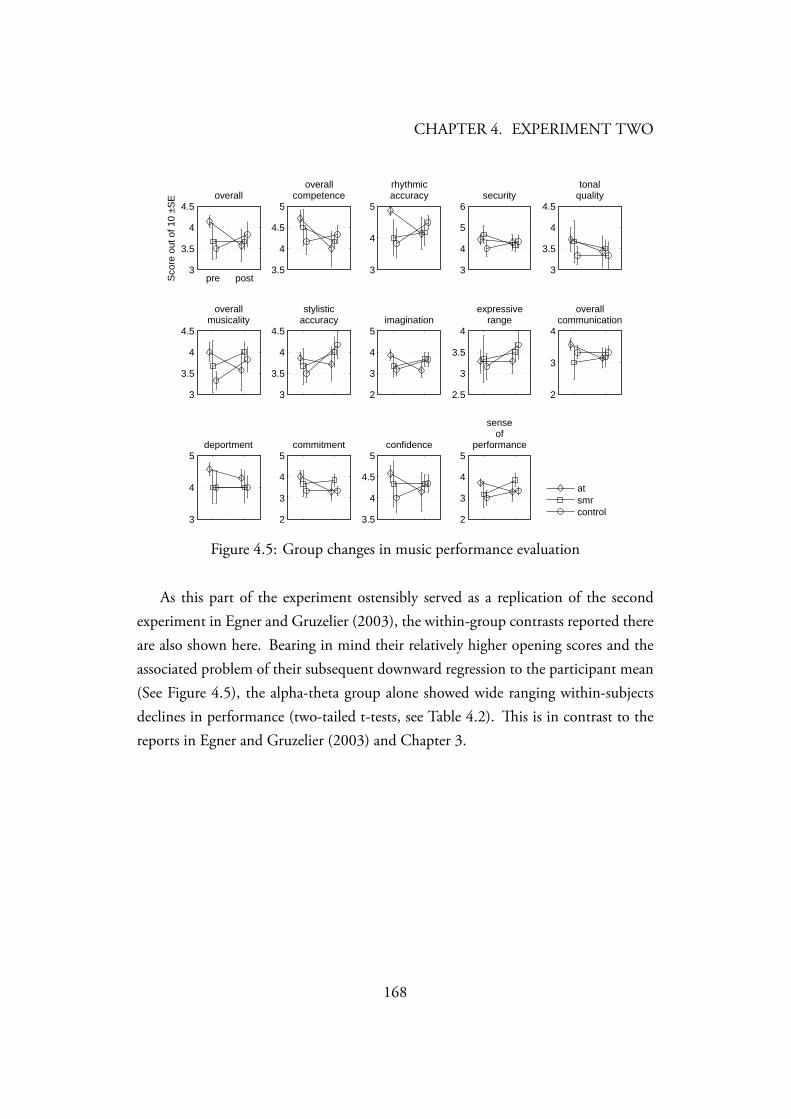
CHAPTER 4. EXPERIMENT TWO
pre post3
3.5
4
4.5
Sco
re o
ut o
f 10
±SE overall
3.5
4
4.5
5
overallcompetence
3
4
5
rhythmicaccuracy
3
4
5
6security
3
3.5
4
4.5
tonalquality
3
3.5
4
4.5
overallmusicality
3
3.5
4
4.5
stylisticaccuracy
2
3
4
5imagination
2.5
3
3.5
4
expressiverange
2
3
4
overallcommunication
3
4
5deportment
2
3
4
5commitment
3.5
4
4.5
5confidence
2
3
4
5
senseof
performance
atsmrcontrol
Figure 4.5: Group changes in music performance evaluation
As this part of the experiment ostensibly served as a replication of the secondexperiment in Egner and Gruzelier (2003), the within-group contrasts reported thereare also shown here. Bearing in mind their relatively higher opening scores and theassociated problem of their subsequent downward regression to the participant mean(See Figure 4.5), the alpha-theta group alone showed wide ranging within-subjectsdeclines in performance (two-tailed t-tests, see Table 4.2). is is in contrast to thereports in Egner and Gruzelier (2003) and Chapter 3.
168
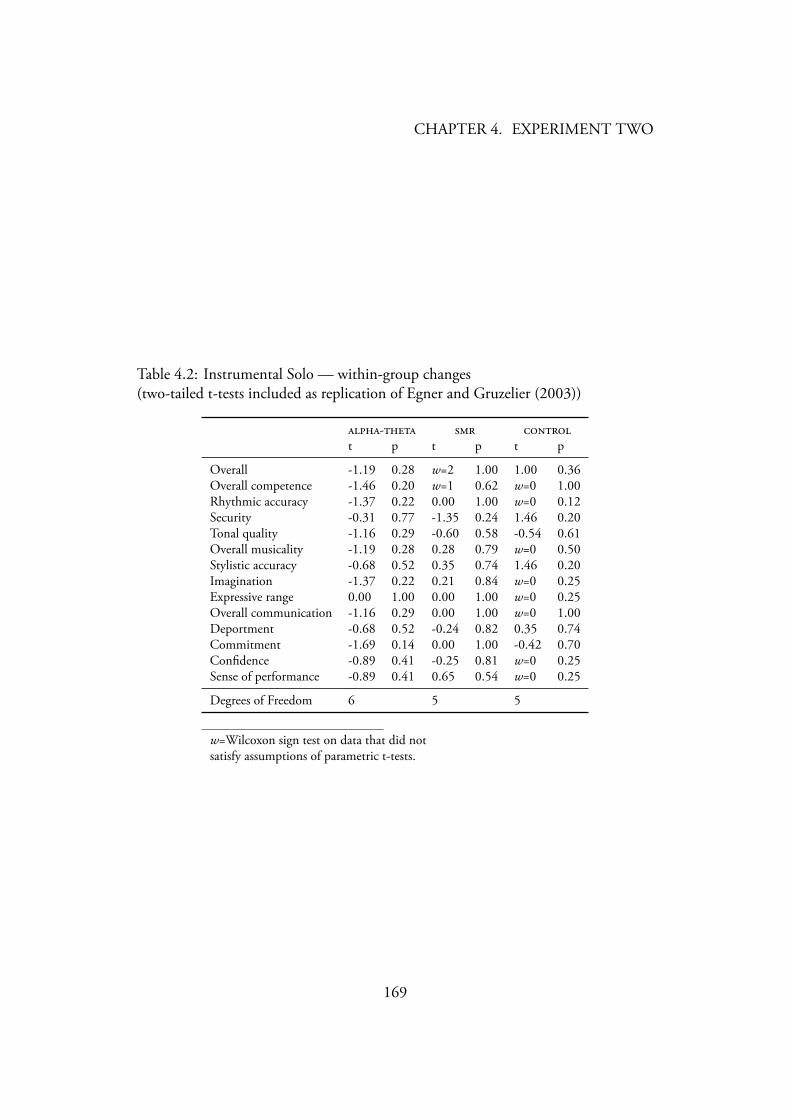
CHAPTER 4. EXPERIMENT TWO
Table 4.2: Instrumental Solo — within-group changes(two-tailed t-tests included as replication of Egner and Gruzelier (2003))
- t p t p t p
Overall -1.19 0.28 w=2 1.00 1.00 0.36Overall competence -1.46 0.20 w=1 0.62 w=0 1.00Rhythmic accuracy -1.37 0.22 0.00 1.00 w=0 0.12Security -0.31 0.77 -1.35 0.24 1.46 0.20Tonal quality -1.16 0.29 -0.60 0.58 -0.54 0.61Overall musicality -1.19 0.28 0.28 0.79 w=0 0.50Stylistic accuracy -0.68 0.52 0.35 0.74 1.46 0.20Imagination -1.37 0.22 0.21 0.84 w=0 0.25Expressive range 0.00 1.00 0.00 1.00 w=0 0.25Overall communication -1.16 0.29 0.00 1.00 w=0 1.00Deportment -0.68 0.52 -0.24 0.82 0.35 0.74Commitment -1.69 0.14 0.00 1.00 -0.42 0.70Confidence -0.89 0.41 -0.25 0.81 w=0 0.25Sense of performance -0.89 0.41 0.65 0.54 w=0 0.25
Degrees of Freedom 6 5 5
w=Wilcoxon sign test on data that did notsatisfy assumptions of parametric t-tests.
169
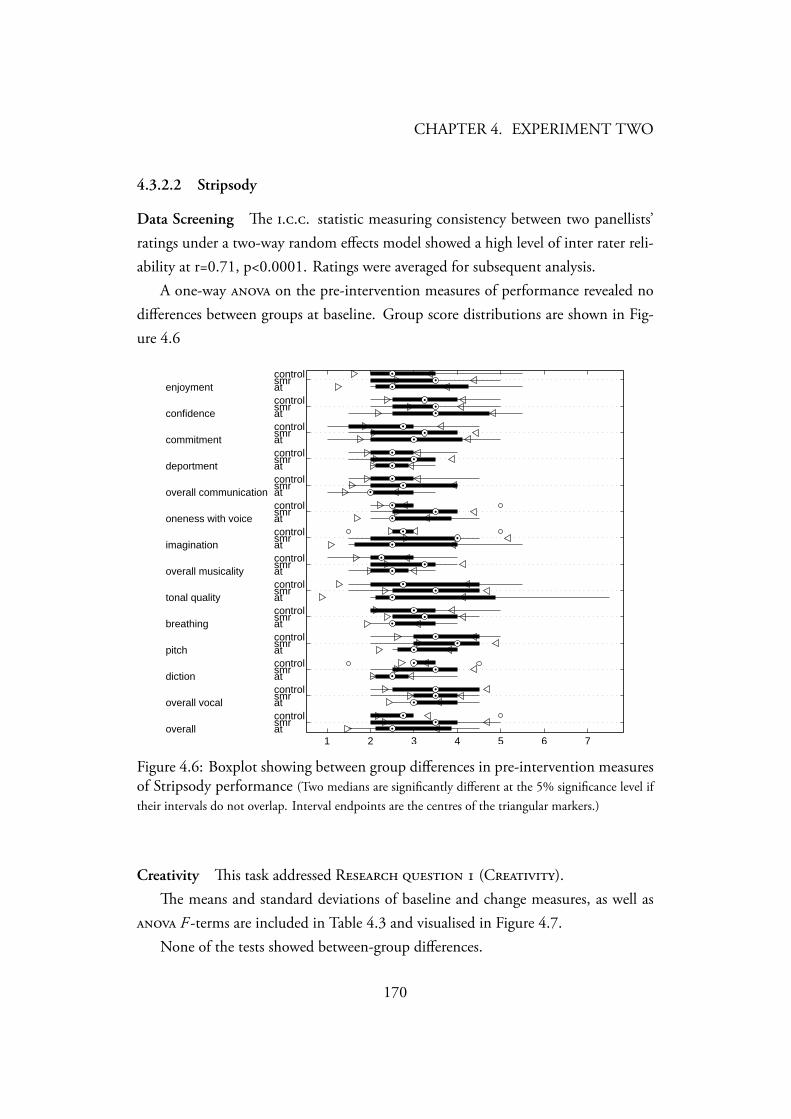
CHAPTER 4. EXPERIMENT TWO
4.3.2.2 Stripsody
Data Screening e ... statistic measuring consistency between two panellists’ratings under a two-way random effects model showed a high level of inter rater reli-ability at r=0.71, p<0.0001. Ratings were averaged for subsequent analysis.
A one-way on the pre-intervention measures of performance revealed nodifferences between groups at baseline. Group score distributions are shown in Fig-ure 4.6
1 2 3 4 5 6 7overall
overall vocal
diction
pitch
breathing
tonal quality
overall musicality
imagination
oneness with voice
overall communication
deportment
commitment
confidence
enjoyment
atsmrcontrolatsmrcontrolatsmrcontrolatsmrcontrolatsmrcontrolatsmrcontrolatsmrcontrolatsmrcontrolatsmrcontrolatsmrcontrolatsmrcontrolatsmrcontrolatsmrcontrolatsmrcontrol
Figure 4.6: Boxplot showing between group differences in pre-intervention measuresof Stripsody performance (Two medians are significantly different at the 5% significance level iftheir intervals do not overlap. Interval endpoints are the centres of the triangular markers.)
Creativity is task addressed R (C).e means and standard deviations of baseline and change measures, as well as
F -terms are included in Table 4.3 and visualised in Figure 4.7.None of the tests showed between-group differences.
170
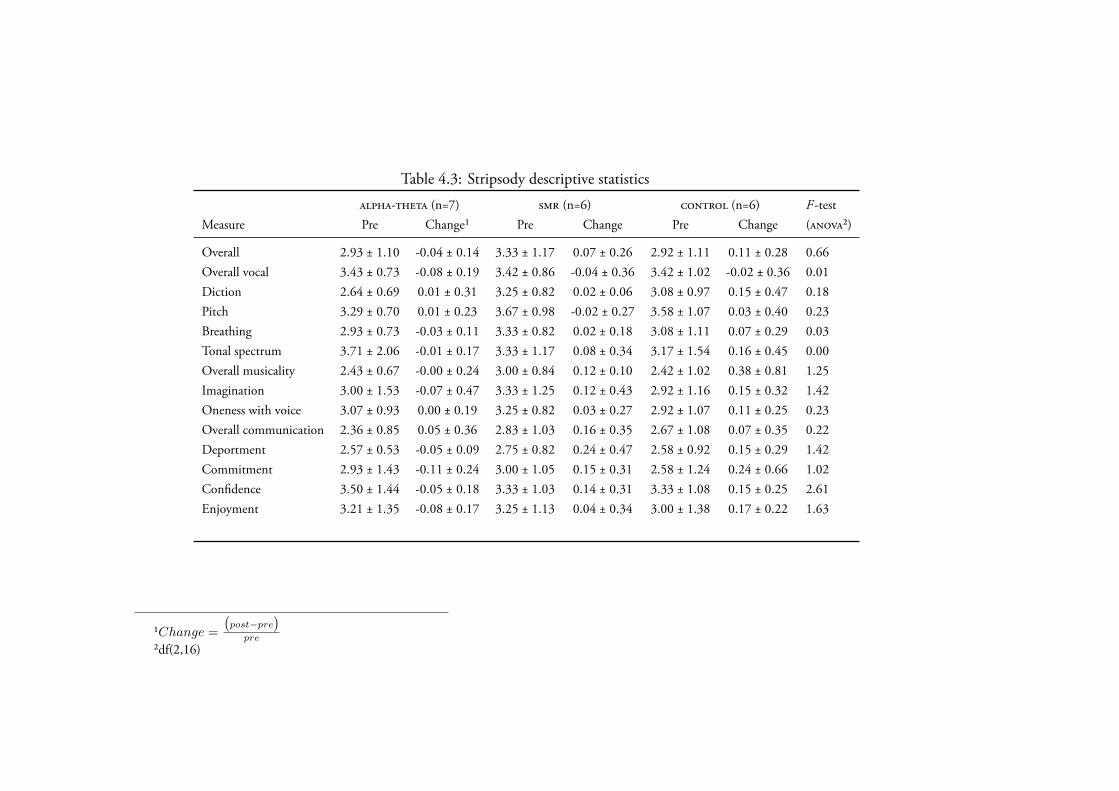
Table 4.3: Stripsody descriptive statistics
- (n=7) (n=6) (n=6) F -testMeasure Pre Change¹ Pre Change Pre Change (²)
Overall 2.93 ± 1.10 -0.04 ± 0.14 3.33 ± 1.17 0.07 ± 0.26 2.92 ± 1.11 0.11 ± 0.28 0.66Overall vocal 3.43 ± 0.73 -0.08 ± 0.19 3.42 ± 0.86 -0.04 ± 0.36 3.42 ± 1.02 -0.02 ± 0.36 0.01Diction 2.64 ± 0.69 0.01 ± 0.31 3.25 ± 0.82 0.02 ± 0.06 3.08 ± 0.97 0.15 ± 0.47 0.18Pitch 3.29 ± 0.70 0.01 ± 0.23 3.67 ± 0.98 -0.02 ± 0.27 3.58 ± 1.07 0.03 ± 0.40 0.23Breathing 2.93 ± 0.73 -0.03 ± 0.11 3.33 ± 0.82 0.02 ± 0.18 3.08 ± 1.11 0.07 ± 0.29 0.03Tonal spectrum 3.71 ± 2.06 -0.01 ± 0.17 3.33 ± 1.17 0.08 ± 0.34 3.17 ± 1.54 0.16 ± 0.45 0.00Overall musicality 2.43 ± 0.67 -0.00 ± 0.24 3.00 ± 0.84 0.12 ± 0.10 2.42 ± 1.02 0.38 ± 0.81 1.25Imagination 3.00 ± 1.53 -0.07 ± 0.47 3.33 ± 1.25 0.12 ± 0.43 2.92 ± 1.16 0.15 ± 0.32 1.42Oneness with voice 3.07 ± 0.93 0.00 ± 0.19 3.25 ± 0.82 0.03 ± 0.27 2.92 ± 1.07 0.11 ± 0.25 0.23Overall communication 2.36 ± 0.85 0.05 ± 0.36 2.83 ± 1.03 0.16 ± 0.35 2.67 ± 1.08 0.07 ± 0.35 0.22Deportment 2.57 ± 0.53 -0.05 ± 0.09 2.75 ± 0.82 0.24 ± 0.47 2.58 ± 0.92 0.15 ± 0.29 1.42Commitment 2.93 ± 1.43 -0.11 ± 0.24 3.00 ± 1.05 0.15 ± 0.31 2.58 ± 1.24 0.24 ± 0.66 1.02Confidence 3.50 ± 1.44 -0.05 ± 0.18 3.33 ± 1.03 0.14 ± 0.31 3.33 ± 1.08 0.15 ± 0.25 2.61Enjoyment 3.21 ± 1.35 -0.08 ± 0.17 3.25 ± 1.13 0.04 ± 0.34 3.00 ± 1.38 0.17 ± 0.22 1.63
¹Change =
(post−pre
)pre
²df(2,16)
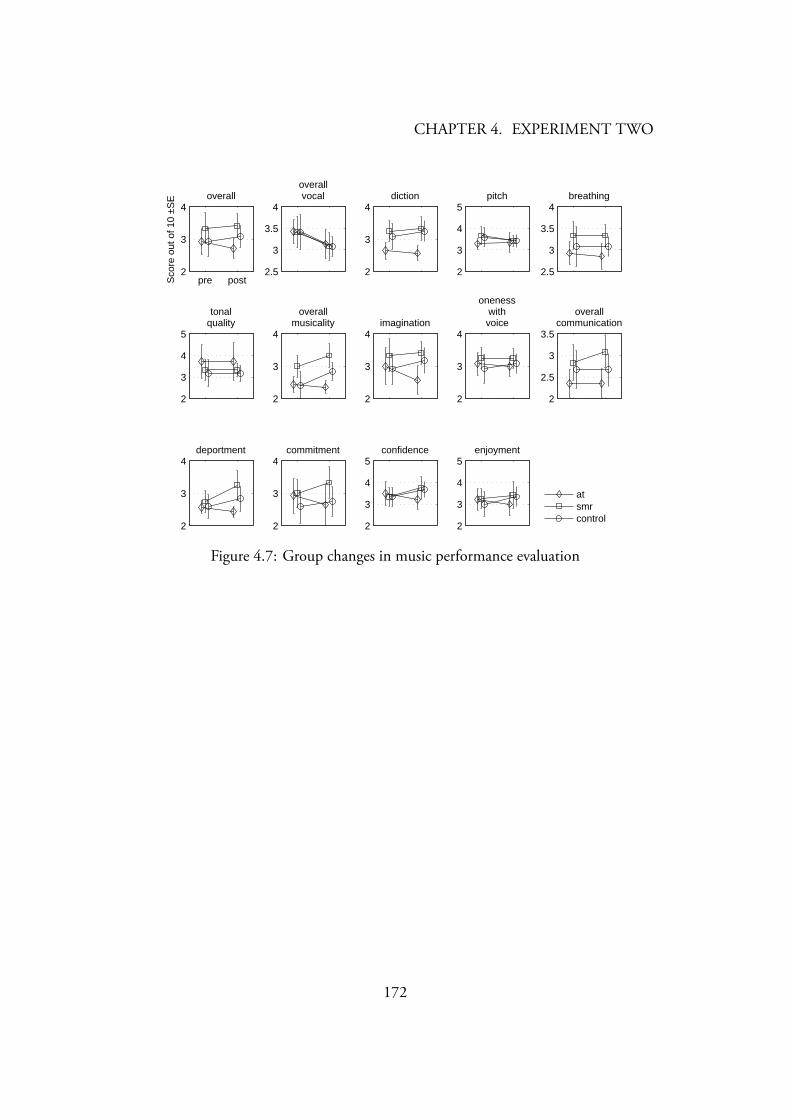
CHAPTER 4. EXPERIMENT TWO
pre post2
3
4
Sco
re o
ut o
f 10
±SE overall
2.5
3
3.5
4
overallvocal
2
3
4diction
2
3
4
5pitch
2.5
3
3.5
4breathing
2
3
4
5
tonalquality
2
3
4
overallmusicality
2
3
4imagination
2
3
4
onenesswithvoice
2
2.5
3
3.5
overallcommunication
2
3
4deportment
2
3
4commitment
2
3
4
5confidence
2
3
4
5enjoyment
atsmrcontrol
Figure 4.7: Group changes in music performance evaluation
172
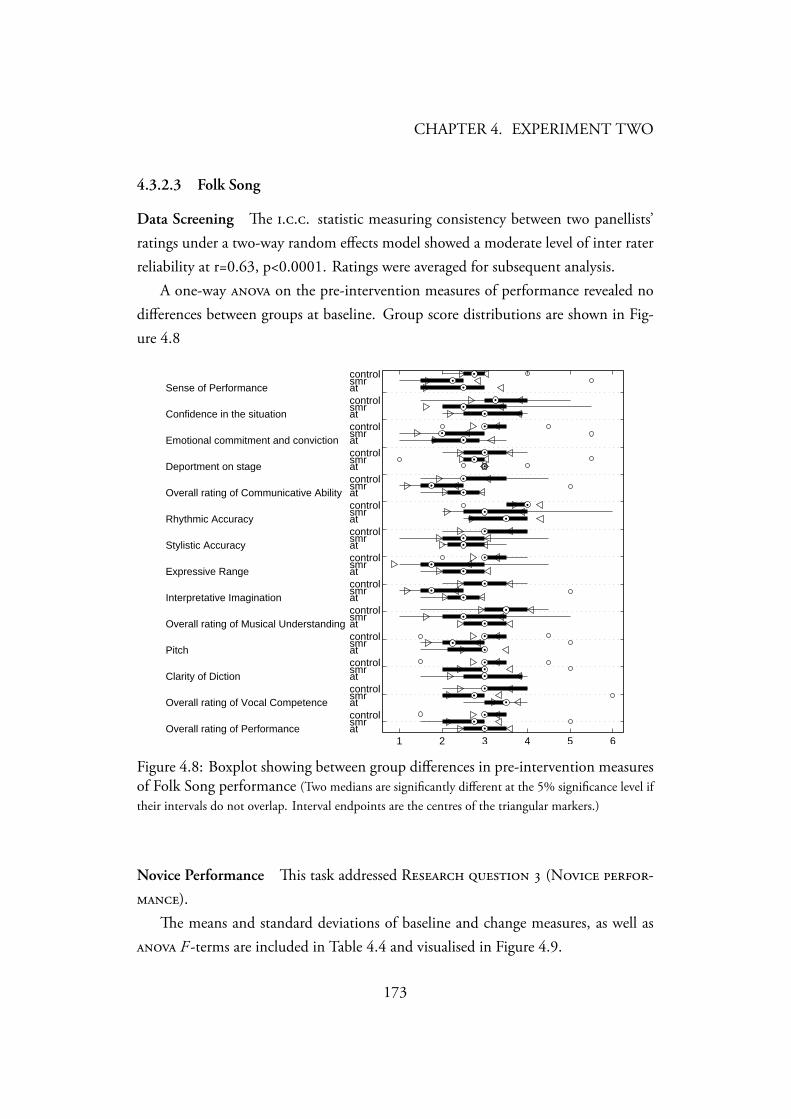
CHAPTER 4. EXPERIMENT TWO
4.3.2.3 Folk Song
Data Screening e ... statistic measuring consistency between two panellists’ratings under a two-way random effects model showed a moderate level of inter raterreliability at r=0.63, p<0.0001. Ratings were averaged for subsequent analysis.
A one-way on the pre-intervention measures of performance revealed nodifferences between groups at baseline. Group score distributions are shown in Fig-ure 4.8
1 2 3 4 5 6Overall rating of Performance
Overall rating of Vocal Competence
Clarity of Diction
Pitch
Overall rating of Musical Understanding
Interpretative Imagination
Expressive Range
Stylistic Accuracy
Rhythmic Accuracy
Overall rating of Communicative Ability
Deportment on stage
Emotional commitment and conviction
Confidence in the situation
Sense of Performance
atsmrcontrolatsmrcontrolatsmrcontrolatsmrcontrolatsmrcontrolatsmrcontrolatsmrcontrolatsmrcontrolatsmrcontrolatsmrcontrolatsmrcontrolatsmrcontrolatsmrcontrolatsmrcontrol
Figure 4.8: Boxplot showing between group differences in pre-intervention measuresof Folk Song performance (Two medians are significantly different at the 5% significance level iftheir intervals do not overlap. Interval endpoints are the centres of the triangular markers.)
Novice Performance is task addressed R (N -).
e means and standard deviations of baseline and change measures, as well as F -terms are included in Table 4.4 and visualised in Figure 4.9.
173

CHAPTER 4. EXPERIMENT TWO
e initial use of revealed a group difference in measures of ‘Expressiverange’ (F(2, 16)=5.80, p<0.05). Post-hoc comparisons however showed no inter-group differences - alpha-theta (M = 0, SE = 0.49) p=; - control (M =-0.33, SE = 0.57) p=.
174
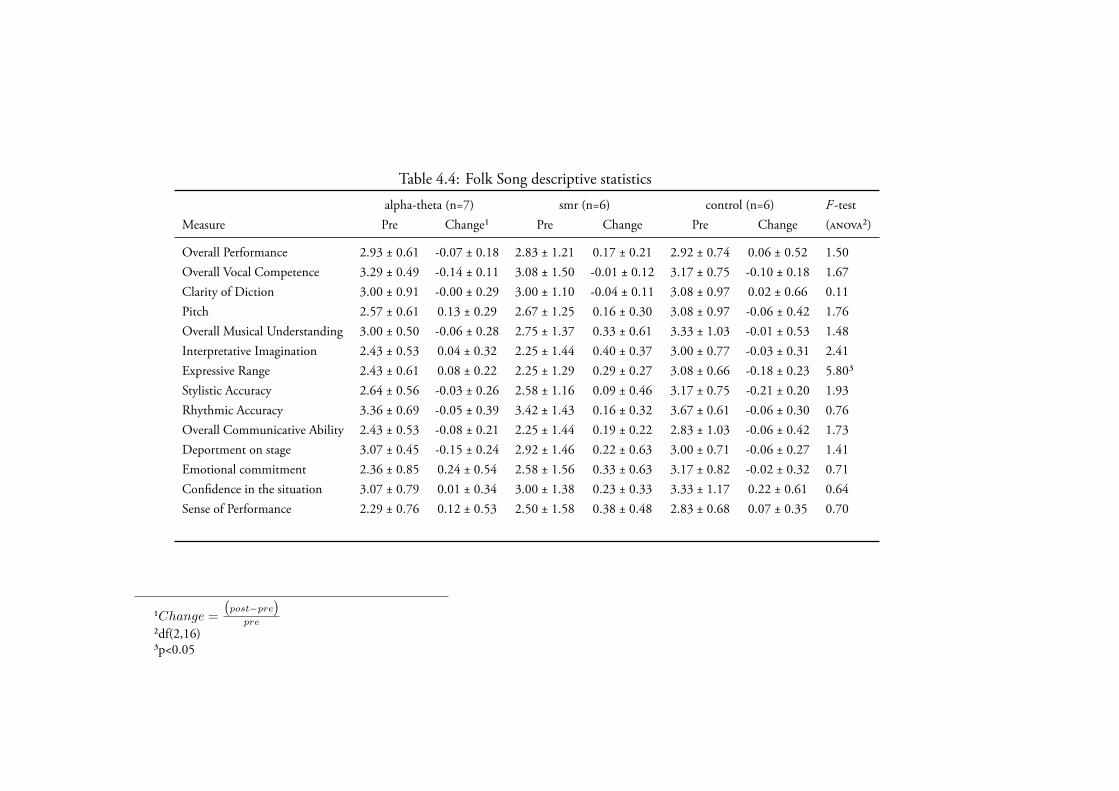
Table 4.4: Folk Song descriptive statistics
alpha-theta (n=7) smr (n=6) control (n=6) F -testMeasure Pre Change¹ Pre Change Pre Change (²)
Overall Performance 2.93 ± 0.61 -0.07 ± 0.18 2.83 ± 1.21 0.17 ± 0.21 2.92 ± 0.74 0.06 ± 0.52 1.50Overall Vocal Competence 3.29 ± 0.49 -0.14 ± 0.11 3.08 ± 1.50 -0.01 ± 0.12 3.17 ± 0.75 -0.10 ± 0.18 1.67Clarity of Diction 3.00 ± 0.91 -0.00 ± 0.29 3.00 ± 1.10 -0.04 ± 0.11 3.08 ± 0.97 0.02 ± 0.66 0.11Pitch 2.57 ± 0.61 0.13 ± 0.29 2.67 ± 1.25 0.16 ± 0.30 3.08 ± 0.97 -0.06 ± 0.42 1.76Overall Musical Understanding 3.00 ± 0.50 -0.06 ± 0.28 2.75 ± 1.37 0.33 ± 0.61 3.33 ± 1.03 -0.01 ± 0.53 1.48Interpretative Imagination 2.43 ± 0.53 0.04 ± 0.32 2.25 ± 1.44 0.40 ± 0.37 3.00 ± 0.77 -0.03 ± 0.31 2.41Expressive Range 2.43 ± 0.61 0.08 ± 0.22 2.25 ± 1.29 0.29 ± 0.27 3.08 ± 0.66 -0.18 ± 0.23 5.80³Stylistic Accuracy 2.64 ± 0.56 -0.03 ± 0.26 2.58 ± 1.16 0.09 ± 0.46 3.17 ± 0.75 -0.21 ± 0.20 1.93Rhythmic Accuracy 3.36 ± 0.69 -0.05 ± 0.39 3.42 ± 1.43 0.16 ± 0.32 3.67 ± 0.61 -0.06 ± 0.30 0.76Overall Communicative Ability 2.43 ± 0.53 -0.08 ± 0.21 2.25 ± 1.44 0.19 ± 0.22 2.83 ± 1.03 -0.06 ± 0.42 1.73Deportment on stage 3.07 ± 0.45 -0.15 ± 0.24 2.92 ± 1.46 0.22 ± 0.63 3.00 ± 0.71 -0.06 ± 0.27 1.41Emotional commitment 2.36 ± 0.85 0.24 ± 0.54 2.58 ± 1.56 0.33 ± 0.63 3.17 ± 0.82 -0.02 ± 0.32 0.71Confidence in the situation 3.07 ± 0.79 0.01 ± 0.34 3.00 ± 1.38 0.23 ± 0.33 3.33 ± 1.17 0.22 ± 0.61 0.64Sense of Performance 2.29 ± 0.76 0.12 ± 0.53 2.50 ± 1.58 0.38 ± 0.48 2.83 ± 0.68 0.07 ± 0.35 0.70
¹Change =
(post−pre
)pre
²df(2,16)³p<0.05
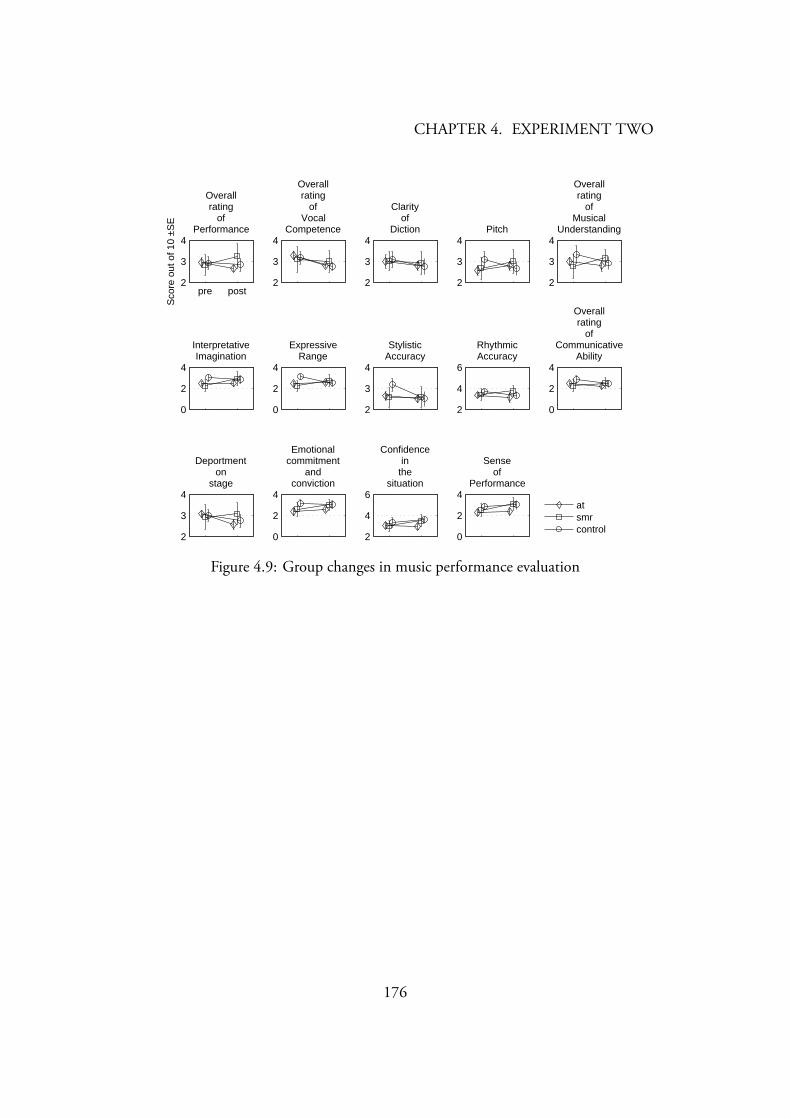
CHAPTER 4. EXPERIMENT TWO
pre post2
3
4
Sco
re o
ut o
f 10
±SE
Overallrating
ofPerformance
2
3
4
Overallrating
ofVocal
Competence
2
3
4
Clarityof
Diction
2
3
4Pitch
2
3
4
Overallrating
ofMusical
Understanding
0
2
4
InterpretativeImagination
0
2
4
ExpressiveRange
2
3
4
StylisticAccuracy
2
4
6
RhythmicAccuracy
0
2
4
Overallrating
ofCommunicative
Ability
2
3
4
Deportmenton
stage
0
2
4
Emotionalcommitment
andconviction
2
4
6
Confidencein
thesituation
0
2
4
Senseof
Performance
atsmrcontrol
Figure 4.9: Group changes in music performance evaluation
176
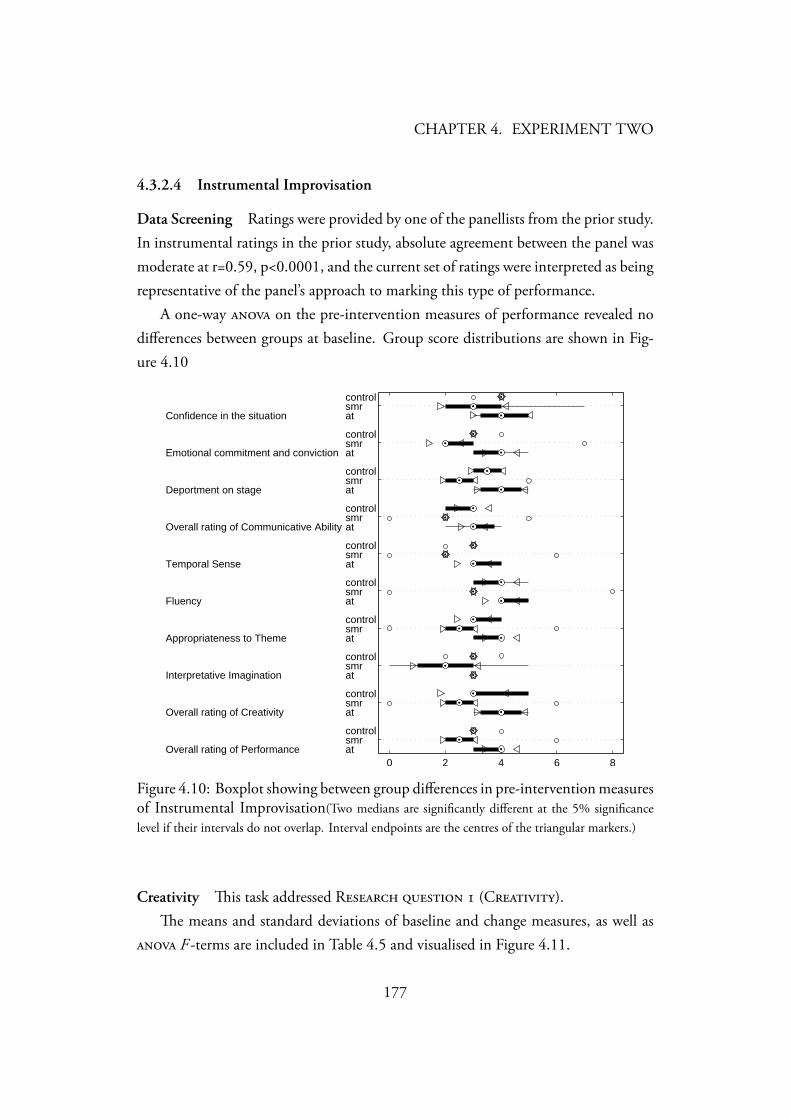
CHAPTER 4. EXPERIMENT TWO
4.3.2.4 Instrumental Improvisation
Data Screening Ratings were provided by one of the panellists from the prior study.In instrumental ratings in the prior study, absolute agreement between the panel wasmoderate at r=0.59, p<0.0001, and the current set of ratings were interpreted as beingrepresentative of the panel’s approach to marking this type of performance.
A one-way on the pre-intervention measures of performance revealed nodifferences between groups at baseline. Group score distributions are shown in Fig-ure 4.10
0 2 4 6 8Overall rating of Performance
Overall rating of Creativity
Interpretative Imagination
Appropriateness to Theme
Fluency
Temporal Sense
Overall rating of Communicative Ability
Deportment on stage
Emotional commitment and conviction
Confidence in the situation
atsmrcontrol
atsmrcontrol
atsmrcontrol
atsmrcontrol
atsmrcontrol
atsmrcontrol
atsmrcontrol
atsmrcontrol
atsmrcontrol
atsmrcontrol
Figure 4.10: Boxplot showing between group differences in pre-intervention measuresof Instrumental Improvisation(Two medians are significantly different at the 5% significancelevel if their intervals do not overlap. Interval endpoints are the centres of the triangular markers.)
Creativity is task addressed R (C).e means and standard deviations of baseline and change measures, as well as
F -terms are included in Table 4.5 and visualised in Figure 4.11.
177

CHAPTER 4. EXPERIMENT TWO
A marginal group difference in scores of ‘Emotional commitment’ was found by tests.
178
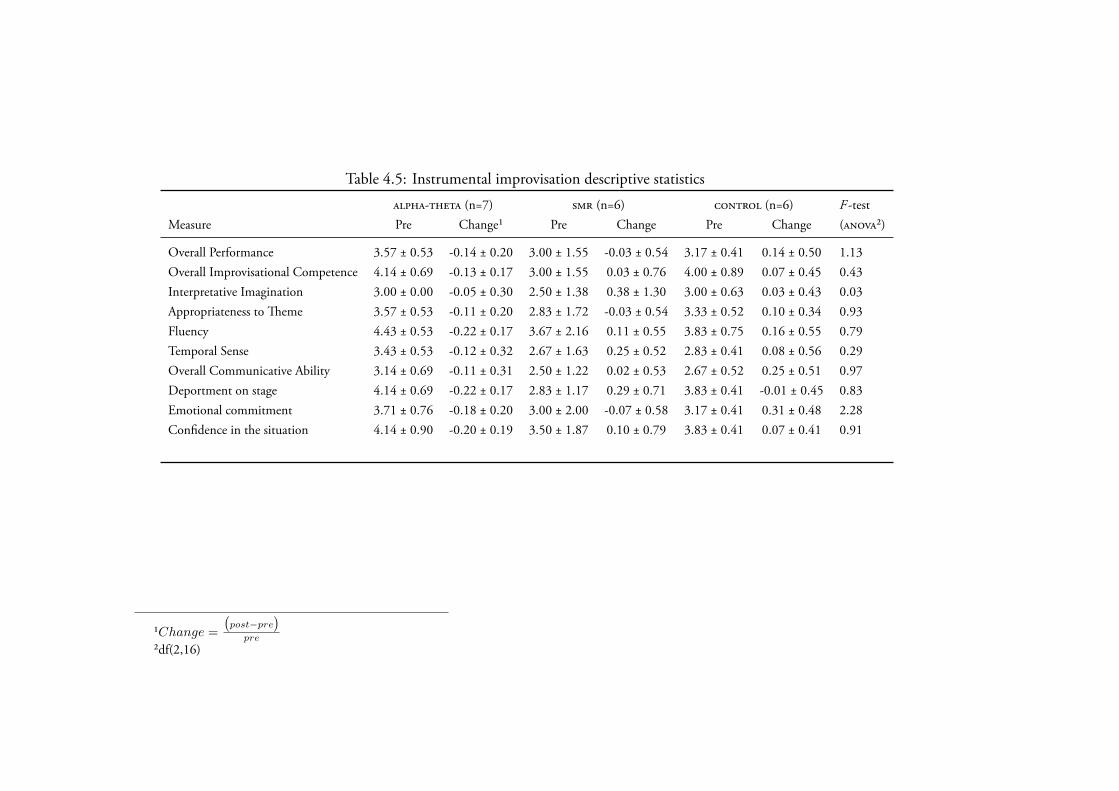
Table 4.5: Instrumental improvisation descriptive statistics
- (n=7) (n=6) (n=6) F -testMeasure Pre Change¹ Pre Change Pre Change (²)
Overall Performance 3.57 ± 0.53 -0.14 ± 0.20 3.00 ± 1.55 -0.03 ± 0.54 3.17 ± 0.41 0.14 ± 0.50 1.13Overall Improvisational Competence 4.14 ± 0.69 -0.13 ± 0.17 3.00 ± 1.55 0.03 ± 0.76 4.00 ± 0.89 0.07 ± 0.45 0.43Interpretative Imagination 3.00 ± 0.00 -0.05 ± 0.30 2.50 ± 1.38 0.38 ± 1.30 3.00 ± 0.63 0.03 ± 0.43 0.03Appropriateness to eme 3.57 ± 0.53 -0.11 ± 0.20 2.83 ± 1.72 -0.03 ± 0.54 3.33 ± 0.52 0.10 ± 0.34 0.93Fluency 4.43 ± 0.53 -0.22 ± 0.17 3.67 ± 2.16 0.11 ± 0.55 3.83 ± 0.75 0.16 ± 0.55 0.79Temporal Sense 3.43 ± 0.53 -0.12 ± 0.32 2.67 ± 1.63 0.25 ± 0.52 2.83 ± 0.41 0.08 ± 0.56 0.29Overall Communicative Ability 3.14 ± 0.69 -0.11 ± 0.31 2.50 ± 1.22 0.02 ± 0.53 2.67 ± 0.52 0.25 ± 0.51 0.97Deportment on stage 4.14 ± 0.69 -0.22 ± 0.17 2.83 ± 1.17 0.29 ± 0.71 3.83 ± 0.41 -0.01 ± 0.45 0.83Emotional commitment 3.71 ± 0.76 -0.18 ± 0.20 3.00 ± 2.00 -0.07 ± 0.58 3.17 ± 0.41 0.31 ± 0.48 2.28Confidence in the situation 4.14 ± 0.90 -0.20 ± 0.19 3.50 ± 1.87 0.10 ± 0.79 3.83 ± 0.41 0.07 ± 0.41 0.91
¹Change =
(post−pre
)pre
²df(2,16)
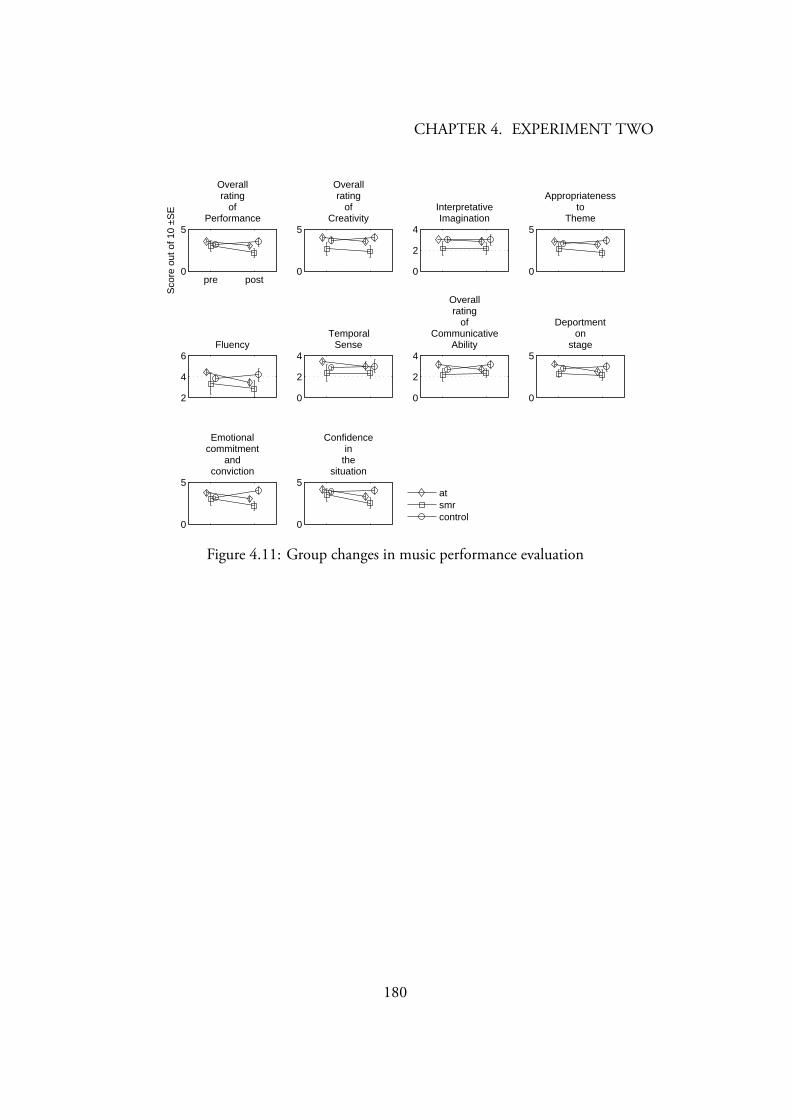
CHAPTER 4. EXPERIMENT TWO
pre post0
5
Sco
re o
ut o
f 10
±SE
Overallrating
ofPerformance
0
5
Overallrating
ofCreativity
0
2
4
InterpretativeImagination
0
5
Appropriatenessto
Theme
2
4
6Fluency
0
2
4
TemporalSense
0
2
4
Overallrating
ofCommunicative
Ability
0
5
Deportmenton
stage
0
5
Emotionalcommitment
andconviction
0
5
Confidencein
thesituation
atsmrcontrol
Figure 4.11: Group changes in music performance evaluation
180
CHAPTER 4. EXPERIMENT TWO
4.3.3 Within-subjects relationship between changes in - and
music performance
Within subjects s were performed to assess the research question as to whetherchanges in measures of music performance would be predicted by changes to during training (R ).
Table 4.7 includes all the results, and significant results are described by musictask below. In both and music measures, the index of change was calculated aslatter data minus former data (e.g. second half of training minus former half ), dividedby former data. is approach measures late data in proportion to early data.
4.3.3.1 Instrumental Solo
It was found that no pre- or post-training musical measures of this task co-varied withwithin-session ratios.
is task, which replicates the task in Egner and Gruzelier (2003) is also analysedusing the approach adopted there (see Section 3.3.6.3). e training coefficients allcorrelated negatively and non-significantly (see Table 4.6).
Table 4.6: Correlation between training and music change replicating Egner andGruzelier’s (2003) statistical analysis
Measure Training correlation
Overall -0.71Overall competence -0.28Rhythmic accuracy -0.55
Security -0.51Tonal quality -0.47
Overall musicality -0.72Stylistic accuracy -0.72
Imagination -0.87Expressive range -0.63
Overall communication -0.78Deportment -0.59
Commitment -0.92Confidence -0.74
Sense of performance -0.76
181
CHAPTER 4. EXPERIMENT TWO
4.3.3.2 Stripsody
e within-session ratio was a covariate of pre-training ‘Overall musicality’ and‘Confidence’ measures, plus post-training ‘Overall communication.’ To a marginalextent, it was a covariate of post-training ‘Breathing’ and ‘Emotional commitment.’
4.3.3.3 Folk Song
It was found that no pre- or post-training musical measures of this task co-varied withwithin-session ratios.
4.3.3.4 Instrumental Improvisation
e within-session alpha-theta ratio was a covariate of post-training ‘Overall Impro-visational Competence,’ ‘Fluency’ and ‘Overall Communicative Ability.’
182
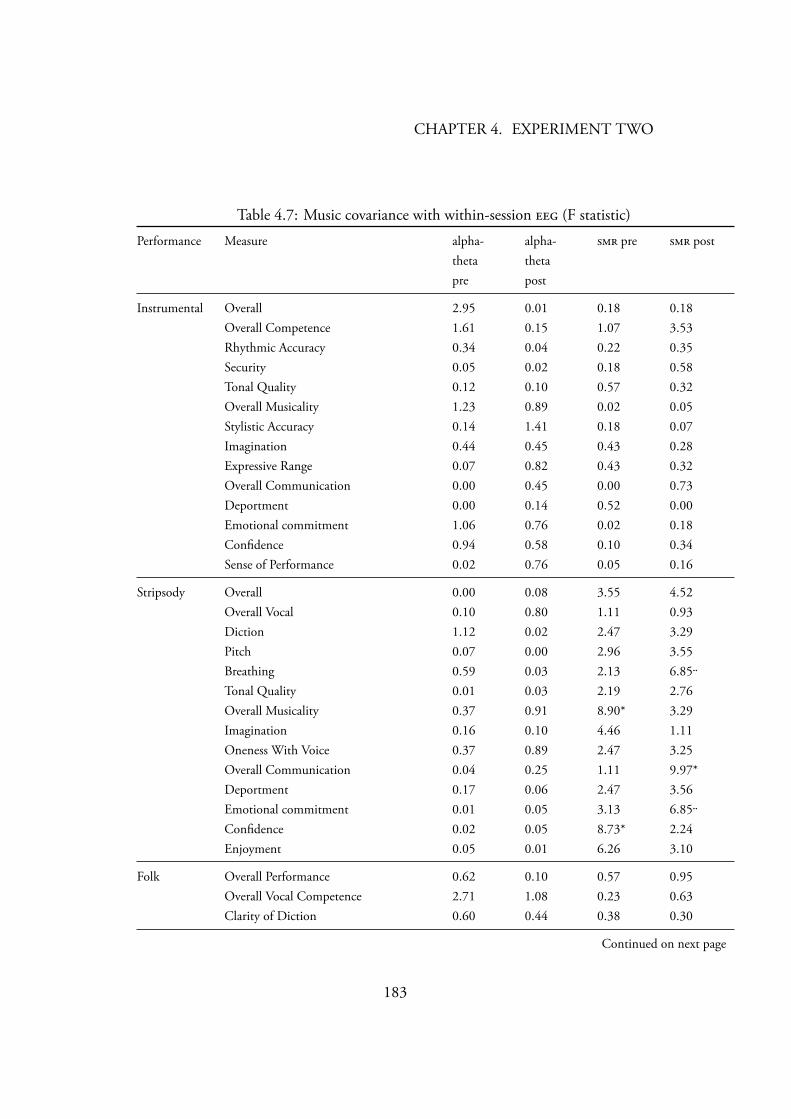
CHAPTER 4. EXPERIMENT TWO
Table 4.7: Music covariance with within-session (F statistic)
Performance Measure alpha-thetapre
alpha-thetapost
pre post
Instrumental Overall 2.95 0.01 0.18 0.18Overall Competence 1.61 0.15 1.07 3.53Rhythmic Accuracy 0.34 0.04 0.22 0.35Security 0.05 0.02 0.18 0.58Tonal Quality 0.12 0.10 0.57 0.32Overall Musicality 1.23 0.89 0.02 0.05Stylistic Accuracy 0.14 1.41 0.18 0.07Imagination 0.44 0.45 0.43 0.28Expressive Range 0.07 0.82 0.43 0.32Overall Communication 0.00 0.45 0.00 0.73Deportment 0.00 0.14 0.52 0.00Emotional commitment 1.06 0.76 0.02 0.18Confidence 0.94 0.58 0.10 0.34Sense of Performance 0.02 0.76 0.05 0.16
Stripsody Overall 0.00 0.08 3.55 4.52Overall Vocal 0.10 0.80 1.11 0.93Diction 1.12 0.02 2.47 3.29Pitch 0.07 0.00 2.96 3.55Breathing 0.59 0.03 2.13 6.85Tonal Quality 0.01 0.03 2.19 2.76Overall Musicality 0.37 0.91 8.90* 3.29Imagination 0.16 0.10 4.46 1.11Oneness With Voice 0.37 0.89 2.47 3.25Overall Communication 0.04 0.25 1.11 9.97*Deportment 0.17 0.06 2.47 3.56Emotional commitment 0.01 0.05 3.13 6.85Confidence 0.02 0.05 8.73* 2.24Enjoyment 0.05 0.01 6.26 3.10
Folk Overall Performance 0.62 0.10 0.57 0.95Overall Vocal Competence 2.71 1.08 0.23 0.63Clarity of Diction 0.60 0.44 0.38 0.30
Continued on next page
183
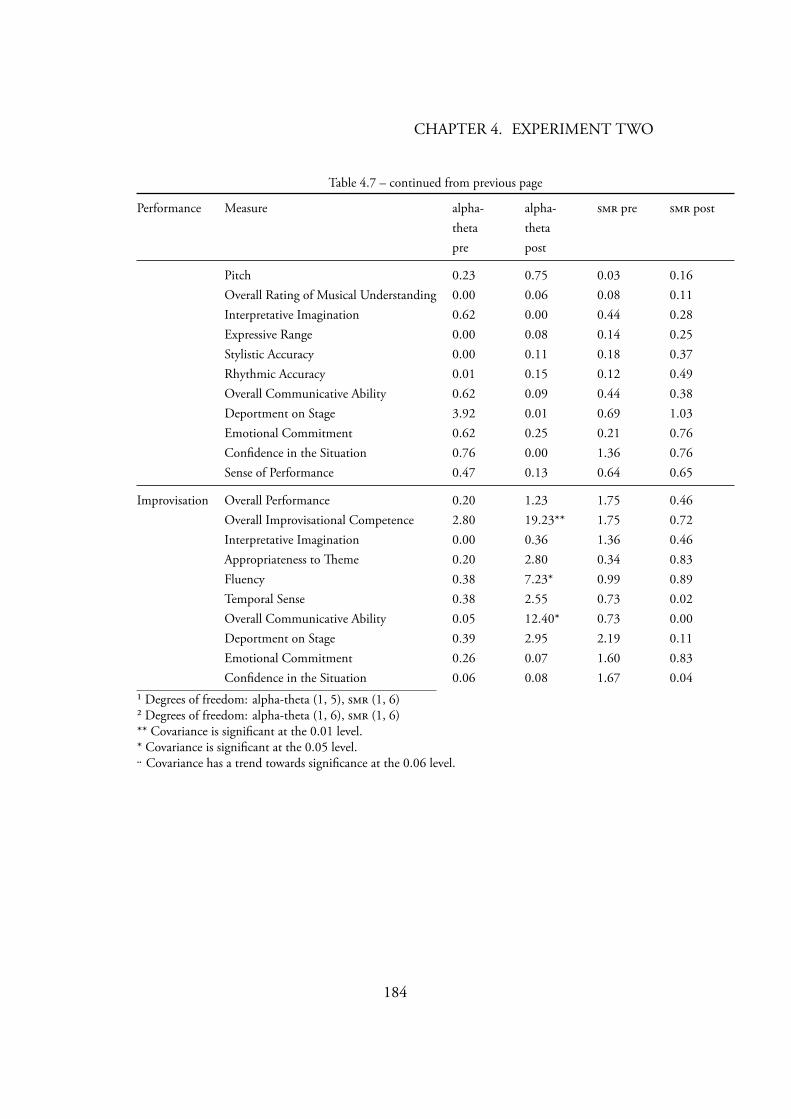
CHAPTER 4. EXPERIMENT TWO
Table 4.7 – continued from previous page
Performance Measure alpha-thetapre
alpha-thetapost
pre post
Pitch 0.23 0.75 0.03 0.16Overall Rating of Musical Understanding 0.00 0.06 0.08 0.11Interpretative Imagination 0.62 0.00 0.44 0.28Expressive Range 0.00 0.08 0.14 0.25Stylistic Accuracy 0.00 0.11 0.18 0.37Rhythmic Accuracy 0.01 0.15 0.12 0.49Overall Communicative Ability 0.62 0.09 0.44 0.38Deportment on Stage 3.92 0.01 0.69 1.03Emotional Commitment 0.62 0.25 0.21 0.76Confidence in the Situation 0.76 0.00 1.36 0.76Sense of Performance 0.47 0.13 0.64 0.65
Improvisation Overall Performance 0.20 1.23 1.75 0.46Overall Improvisational Competence 2.80 19.23** 1.75 0.72Interpretative Imagination 0.00 0.36 1.36 0.46Appropriateness to eme 0.20 2.80 0.34 0.83Fluency 0.38 7.23* 0.99 0.89Temporal Sense 0.38 2.55 0.73 0.02Overall Communicative Ability 0.05 12.40* 0.73 0.00Deportment on Stage 0.39 2.95 2.19 0.11Emotional Commitment 0.26 0.07 1.60 0.83Confidence in the Situation 0.06 0.08 1.67 0.04
¹ Degrees of freedom: alpha-theta (1, 5), (1, 6)² Degrees of freedom: alpha-theta (1, 6), (1, 6)** Covariance is significant at the 0.01 level.* Covariance is significant at the 0.05 level. Covariance has a trend towards significance at the 0.06 level.
184
CHAPTER 4. EXPERIMENT TWO
4.3.4 Music Results summary
e results of the Instrumental solo task did not confirm the possibility that measuresof creativity would be improved in the alpha-theta theta group alone; and did notsupport the findings of the first experiment, or (Egner and Gruzelier, 2003). No sig-nificant changes in performance were observed, or training/performance covariance.
In post-intervention performances of the Stripsody the group difference in ‘Con-fidence’ was not reproduced from the study in Chapter 3. Within-session changespredicted pre-training ‘Overall musicality’ and ‘Confidence’ measures, plus post-training‘Overall communication,’ and a marginal extent, post-training ‘Breathing’ and ‘Emo-tional commitment.’
e Folk song results revealed that the change in ‘Expressive range’ was signifi-cant between groups, although without follow-on post-hoc confirmation. No train-ing/performance covariances were observed.
Improvisation results showed no group differences in performance change, whilstwithin-session t/a ratio changes predicted declining performance scores in ‘OverallImprovisational Competence,’ ‘Fluency’ and ‘Overall Communicative Ability.’
4.4 Discussion
4.4.1 Neurofeedback Training
4.4.1.1 Alpha-theta training
e training results are similar to those in comparable experiments in Chapter 3 andin Egner and Gruzelier (2004a): t/a ratios clearly changed on within-session mea-sures. ey also changed definitively across 10 training sessions and in the session ×period interaction, demonstrating cumulative within-session changes over the courseof training.
Given an experimental control, such as the use of mock feedback (Egner et al.,2002) or relaxation (Boynton, 2001), this evidence could be interpreted as assistedregulation of hypnagogic (Green et al., 1974; Peniston and Kulkosky, 1999). ecurrent results, whilst promising, do not show that changes occurred over-and-abovewhat happens in normal sleep onset.
185
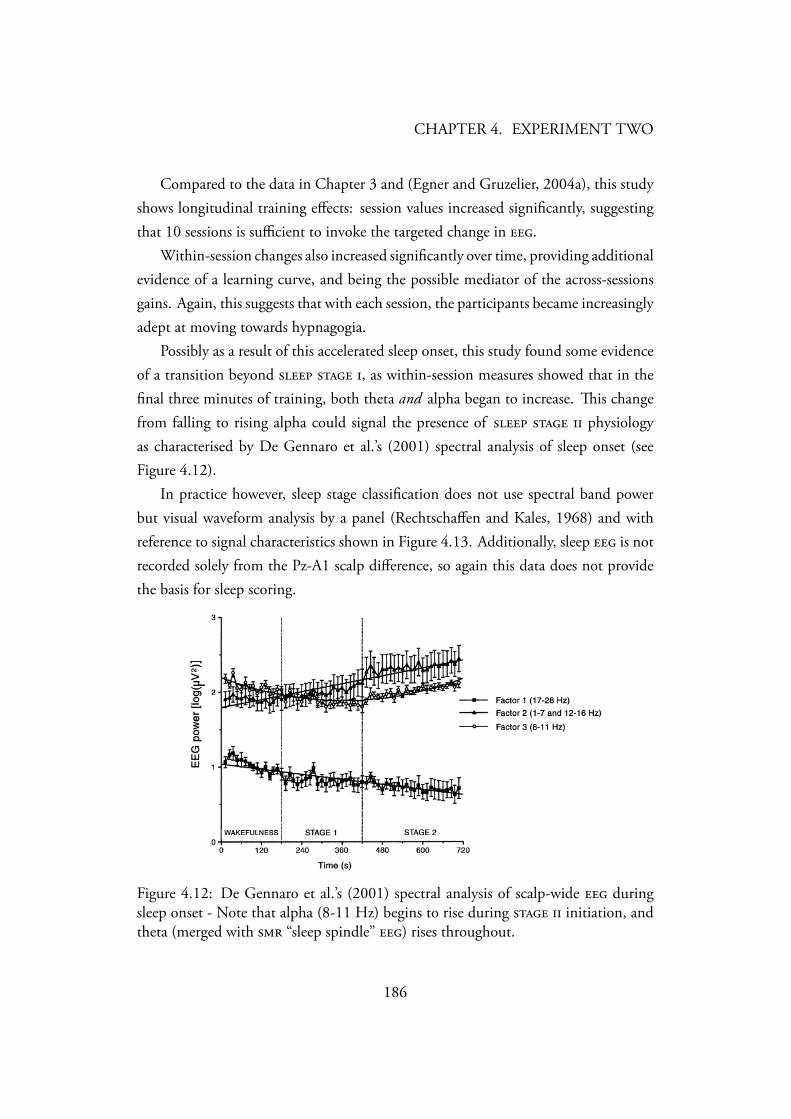
CHAPTER 4. EXPERIMENT TWO
Compared to the data in Chapter 3 and (Egner and Gruzelier, 2004a), this studyshows longitudinal training effects: session values increased significantly, suggestingthat 10 sessions is sufficient to invoke the targeted change in .
Within-session changes also increased significantly over time, providing additionalevidence of a learning curve, and being the possible mediator of the across-sessionsgains. Again, this suggests that with each session, the participants became increasinglyadept at moving towards hypnagogia.
Possibly as a result of this accelerated sleep onset, this study found some evidenceof a transition beyond , as within-session measures showed that in thefinal three minutes of training, both theta and alpha began to increase. is changefrom falling to rising alpha could signal the presence of physiologyas characterised by De Gennaro et al.’s (2001) spectral analysis of sleep onset (seeFigure 4.12).
In practice however, sleep stage classification does not use spectral band powerbut visual waveform analysis by a panel (Rechtschaffen and Kales, 1968) and withreference to signal characteristics shown in Figure 4.13. Additionally, sleep is notrecorded solely from the Pz-A1 scalp difference, so again this data does not providethe basis for sleep scoring.
Figure 4.12: De Gennaro et al.’s (2001) spectral analysis of scalp-wide duringsleep onset - Note that alpha (8-11 Hz) begins to rise during initiation, andtheta (merged with “sleep spindle” ) rises throughout.
186
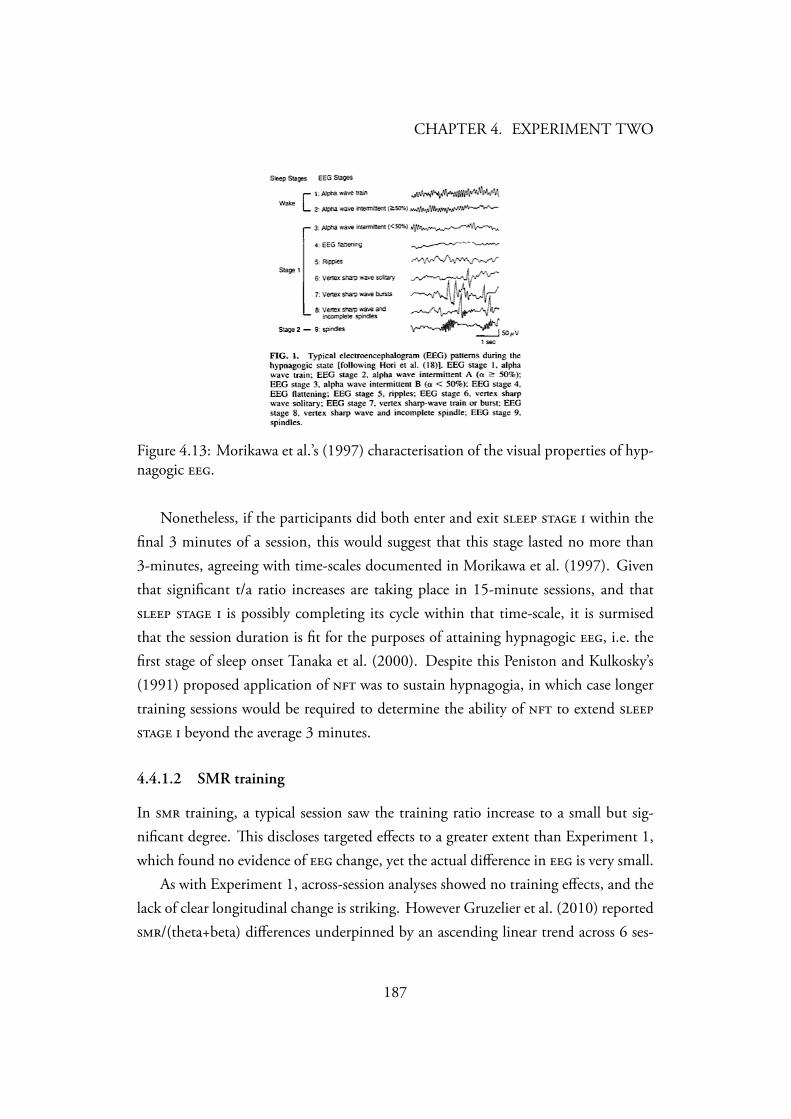
CHAPTER 4. EXPERIMENT TWO
Figure 4.13: Morikawa et al.’s (1997) characterisation of the visual properties of hyp-nagogic .
Nonetheless, if the participants did both enter and exit within thefinal 3 minutes of a session, this would suggest that this stage lasted no more than3-minutes, agreeing with time-scales documented in Morikawa et al. (1997). Giventhat significant t/a ratio increases are taking place in 15-minute sessions, and that is possibly completing its cycle within that time-scale, it is surmisedthat the session duration is fit for the purposes of attaining hypnagogic , i.e. thefirst stage of sleep onset Tanaka et al. (2000). Despite this Peniston and Kulkosky’s(1991) proposed application of was to sustain hypnagogia, in which case longertraining sessions would be required to determine the ability of to extend beyond the average 3 minutes.
4.4.1.2 SMR training
In training, a typical session saw the training ratio increase to a small but sig-nificant degree. is discloses targeted effects to a greater extent than Experiment 1,which found no evidence of change, yet the actual difference in is very small.
As with Experiment 1, across-session analyses showed no training effects, and thelack of clear longitudinal change is striking. However Gruzelier et al. (2010) reported/(theta+beta) differences underpinned by an ascending linear trend across 6 ses-
187
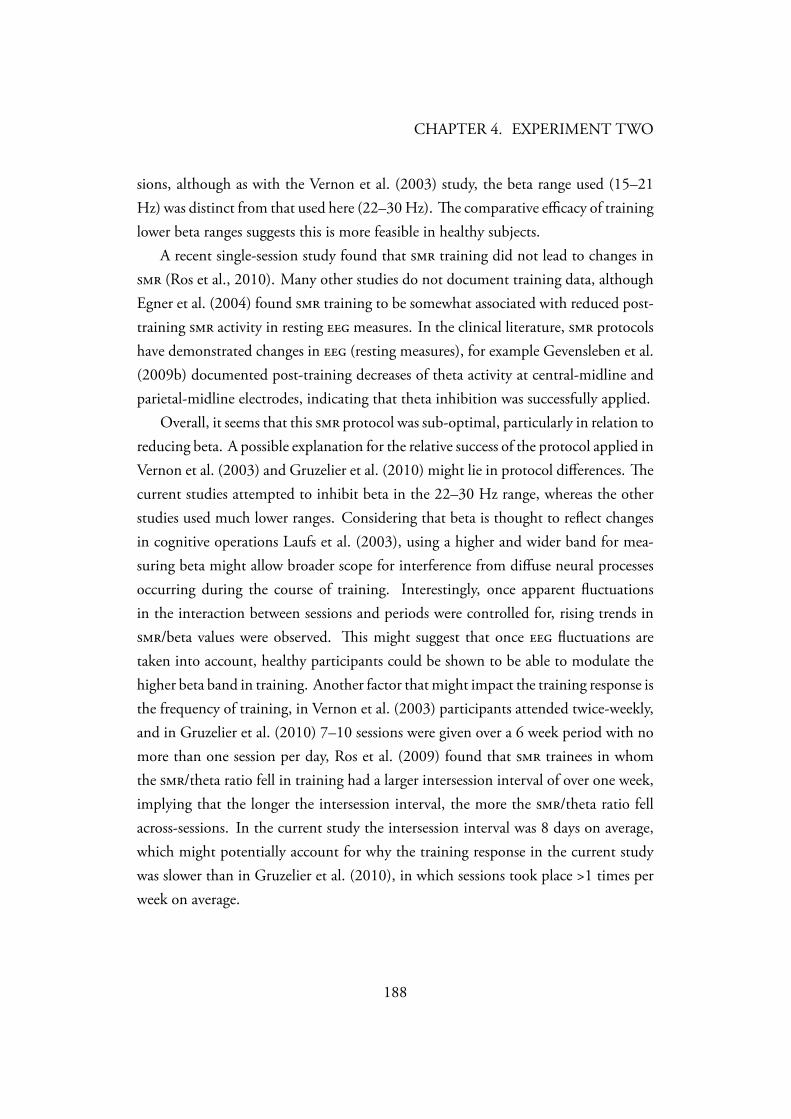
CHAPTER 4. EXPERIMENT TWO
sions, although as with the Vernon et al. (2003) study, the beta range used (15–21Hz) was distinct from that used here (22–30 Hz). e comparative efficacy of traininglower beta ranges suggests this is more feasible in healthy subjects.
A recent single-session study found that training did not lead to changes in (Ros et al., 2010). Many other studies do not document training data, althoughEgner et al. (2004) found training to be somewhat associated with reduced post-training activity in resting measures. In the clinical literature, protocolshave demonstrated changes in (resting measures), for example Gevensleben et al.(2009b) documented post-training decreases of theta activity at central-midline andparietal-midline electrodes, indicating that theta inhibition was successfully applied.
Overall, it seems that this protocol was sub-optimal, particularly in relation toreducing beta. A possible explanation for the relative success of the protocol applied inVernon et al. (2003) and Gruzelier et al. (2010) might lie in protocol differences. ecurrent studies attempted to inhibit beta in the 22–30 Hz range, whereas the otherstudies used much lower ranges. Considering that beta is thought to reflect changesin cognitive operations Laufs et al. (2003), using a higher and wider band for mea-suring beta might allow broader scope for interference from diffuse neural processesoccurring during the course of training. Interestingly, once apparent fluctuationsin the interaction between sessions and periods were controlled for, rising trends in/beta values were observed. is might suggest that once fluctuations aretaken into account, healthy participants could be shown to be able to modulate thehigher beta band in training. Another factor that might impact the training response isthe frequency of training, in Vernon et al. (2003) participants attended twice-weekly,and in Gruzelier et al. (2010) 7–10 sessions were given over a 6 week period with nomore than one session per day, Ros et al. (2009) found that trainees in whomthe /theta ratio fell in training had a larger intersession interval of over one week,implying that the longer the intersession interval, the more the /theta ratio fellacross-sessions. In the current study the intersession interval was 8 days on average,which might potentially account for why the training response in the current studywas slower than in Gruzelier et al. (2010), in which sessions took place >1 times perweek on average.
188
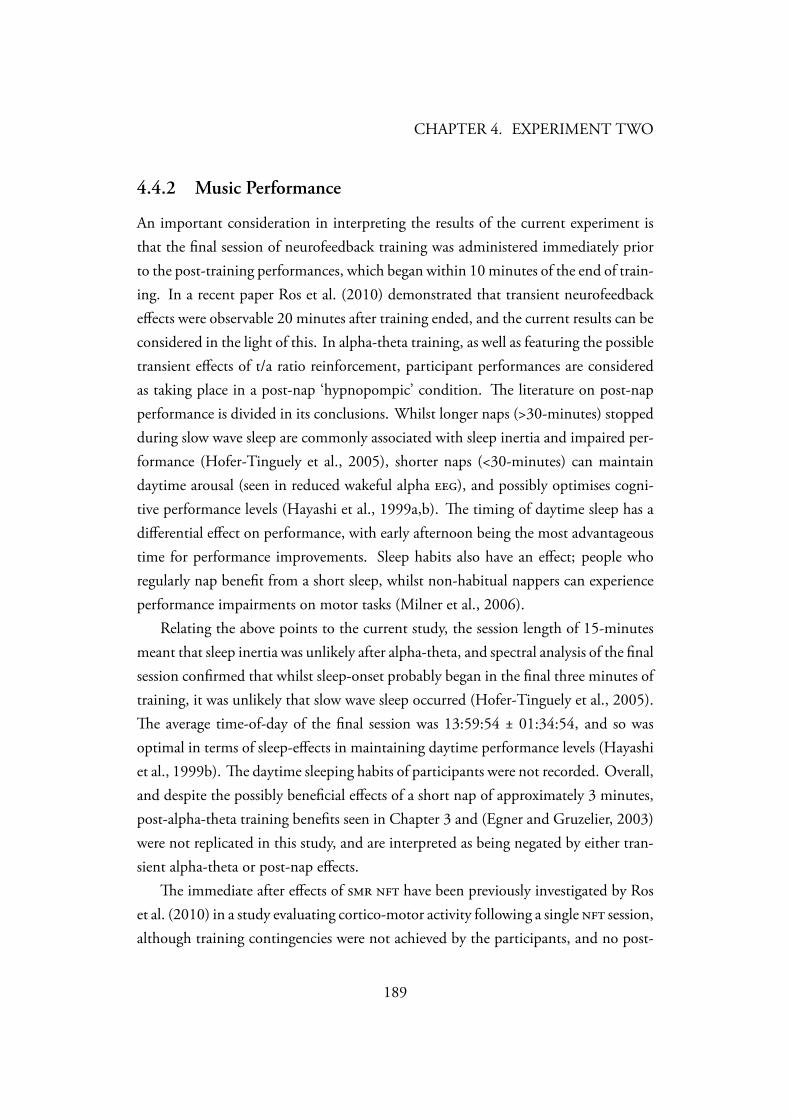
CHAPTER 4. EXPERIMENT TWO
4.4.2 Music Performance
An important consideration in interpreting the results of the current experiment isthat the final session of neurofeedback training was administered immediately priorto the post-training performances, which began within 10 minutes of the end of train-ing. In a recent paper Ros et al. (2010) demonstrated that transient neurofeedbackeffects were observable 20 minutes after training ended, and the current results can beconsidered in the light of this. In alpha-theta training, as well as featuring the possibletransient effects of t/a ratio reinforcement, participant performances are consideredas taking place in a post-nap ‘hypnopompic’ condition. e literature on post-napperformance is divided in its conclusions. Whilst longer naps (>30-minutes) stoppedduring slow wave sleep are commonly associated with sleep inertia and impaired per-formance (Hofer-Tinguely et al., 2005), shorter naps (<30-minutes) can maintaindaytime arousal (seen in reduced wakeful alpha ), and possibly optimises cogni-tive performance levels (Hayashi et al., 1999a,b). e timing of daytime sleep has adifferential effect on performance, with early afternoon being the most advantageoustime for performance improvements. Sleep habits also have an effect; people whoregularly nap benefit from a short sleep, whilst non-habitual nappers can experienceperformance impairments on motor tasks (Milner et al., 2006).
Relating the above points to the current study, the session length of 15-minutesmeant that sleep inertia was unlikely after alpha-theta, and spectral analysis of the finalsession confirmed that whilst sleep-onset probably began in the final three minutes oftraining, it was unlikely that slow wave sleep occurred (Hofer-Tinguely et al., 2005).e average time-of-day of the final session was 13:59:54 ± 01:34:54, and so wasoptimal in terms of sleep-effects in maintaining daytime performance levels (Hayashiet al., 1999b). e daytime sleeping habits of participants were not recorded. Overall,and despite the possibly beneficial effects of a short nap of approximately 3 minutes,post-alpha-theta training benefits seen in Chapter 3 and (Egner and Gruzelier, 2003)were not replicated in this study, and are interpreted as being negated by either tran-sient alpha-theta or post-nap effects.
e immediate after effects of have been previously investigated by Roset al. (2010) in a study evaluating cortico-motor activity following a single session,although training contingencies were not achieved by the participants, and no post-
189
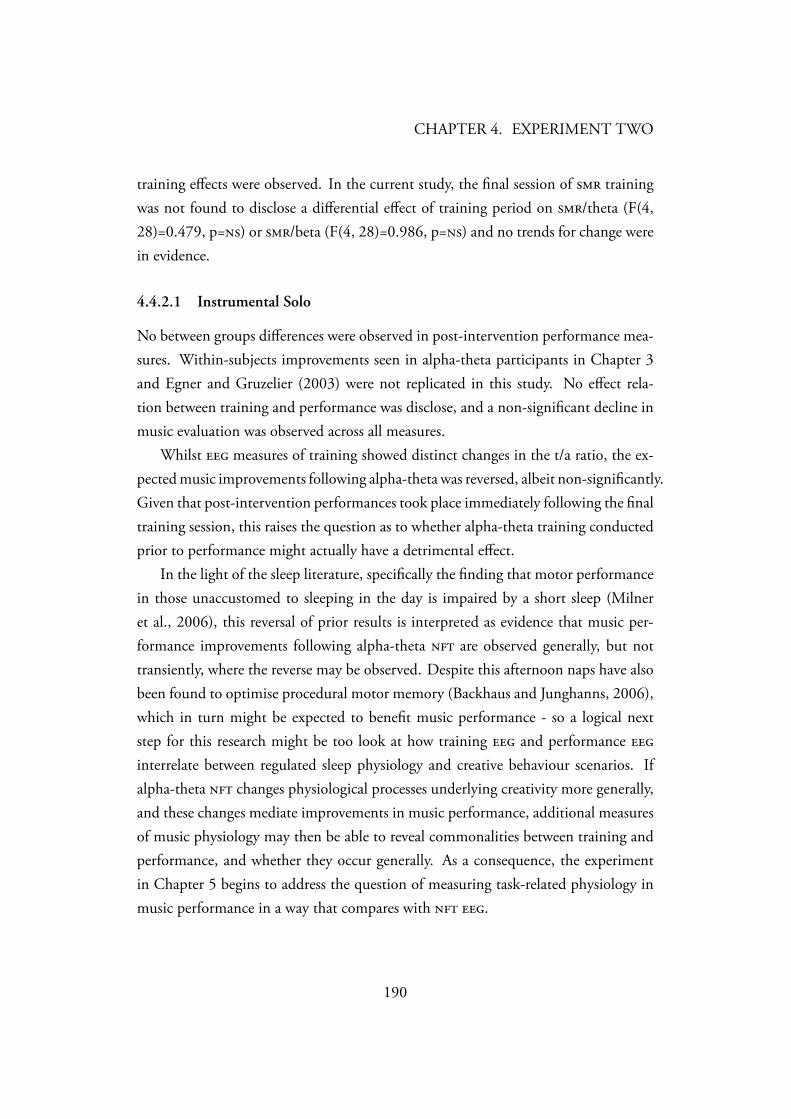
CHAPTER 4. EXPERIMENT TWO
training effects were observed. In the current study, the final session of trainingwas not found to disclose a differential effect of training period on /theta (F(4,28)=0.479, p=) or /beta (F(4, 28)=0.986, p=) and no trends for change werein evidence.
4.4.2.1 Instrumental Solo
No between groups differences were observed in post-intervention performance mea-sures. Within-subjects improvements seen in alpha-theta participants in Chapter 3and Egner and Gruzelier (2003) were not replicated in this study. No effect rela-tion between training and performance was disclose, and a non-significant decline inmusic evaluation was observed across all measures.
Whilst measures of training showed distinct changes in the t/a ratio, the ex-pected music improvements following alpha-theta was reversed, albeit non-significantly.Given that post-intervention performances took place immediately following the finaltraining session, this raises the question as to whether alpha-theta training conductedprior to performance might actually have a detrimental effect.
In the light of the sleep literature, specifically the finding that motor performancein those unaccustomed to sleeping in the day is impaired by a short sleep (Milneret al., 2006), this reversal of prior results is interpreted as evidence that music per-formance improvements following alpha-theta are observed generally, but nottransiently, where the reverse may be observed. Despite this afternoon naps have alsobeen found to optimise procedural motor memory (Backhaus and Junghanns, 2006),which in turn might be expected to benefit music performance - so a logical nextstep for this research might be too look at how training and performance interrelate between regulated sleep physiology and creative behaviour scenarios. Ifalpha-theta changes physiological processes underlying creativity more generally,and these changes mediate improvements in music performance, additional measuresof music physiology may then be able to reveal commonalities between training andperformance, and whether they occur generally. As a consequence, the experimentin Chapter 5 begins to address the question of measuring task-related physiology inmusic performance in a way that compares with .
190
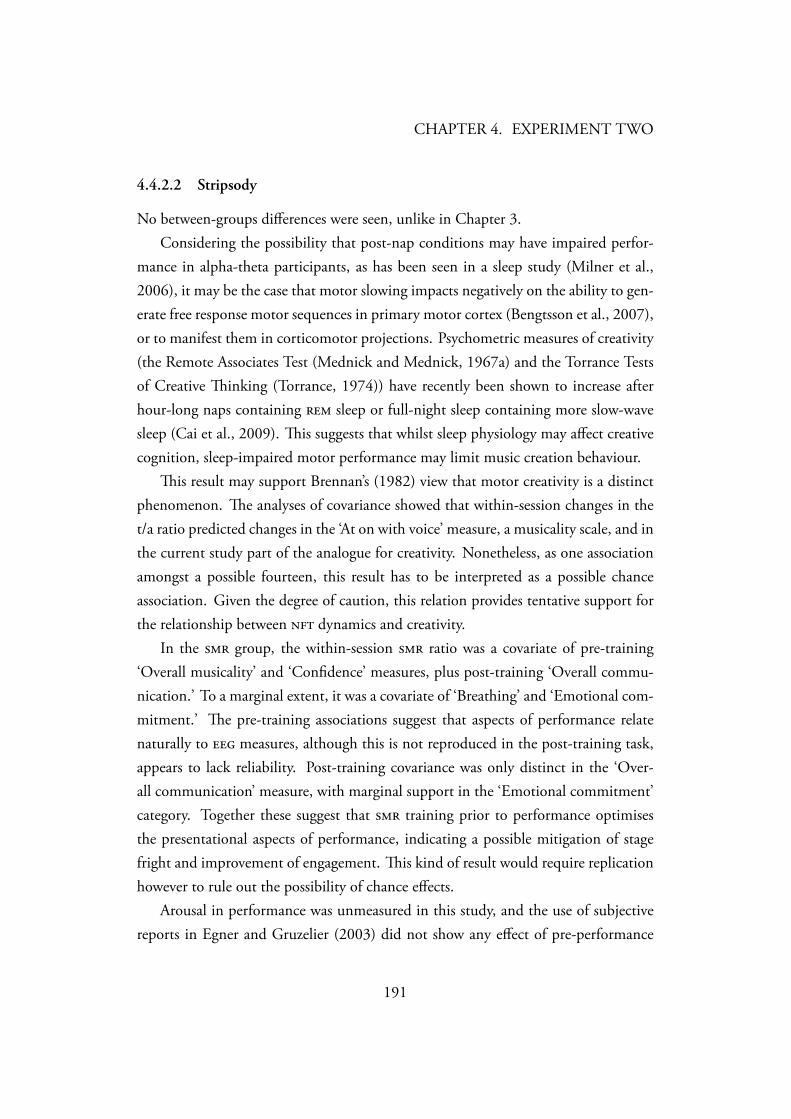
CHAPTER 4. EXPERIMENT TWO
4.4.2.2 Stripsody
No between-groups differences were seen, unlike in Chapter 3.Considering the possibility that post-nap conditions may have impaired perfor-
mance in alpha-theta participants, as has been seen in a sleep study (Milner et al.,2006), it may be the case that motor slowing impacts negatively on the ability to gen-erate free response motor sequences in primary motor cortex (Bengtsson et al., 2007),or to manifest them in corticomotor projections. Psychometric measures of creativity(the Remote Associates Test (Mednick and Mednick, 1967a) and the Torrance Testsof Creative inking (Torrance, 1974)) have recently been shown to increase afterhour-long naps containing sleep or full-night sleep containing more slow-wavesleep (Cai et al., 2009). is suggests that whilst sleep physiology may affect creativecognition, sleep-impaired motor performance may limit music creation behaviour.
is result may support Brennan’s (1982) view that motor creativity is a distinctphenomenon. e analyses of covariance showed that within-session changes in thet/a ratio predicted changes in the ‘At on with voice’ measure, a musicality scale, and inthe current study part of the analogue for creativity. Nonetheless, as one associationamongst a possible fourteen, this result has to be interpreted as a possible chanceassociation. Given the degree of caution, this relation provides tentative support forthe relationship between dynamics and creativity.
In the group, the within-session ratio was a covariate of pre-training‘Overall musicality’ and ‘Confidence’ measures, plus post-training ‘Overall commu-nication.’ To a marginal extent, it was a covariate of ‘Breathing’ and ‘Emotional com-mitment.’ e pre-training associations suggest that aspects of performance relatenaturally to measures, although this is not reproduced in the post-training task,appears to lack reliability. Post-training covariance was only distinct in the ‘Over-all communication’ measure, with marginal support in the ‘Emotional commitment’category. Together these suggest that training prior to performance optimisesthe presentational aspects of performance, indicating a possible mitigation of stagefright and improvement of engagement. is kind of result would require replicationhowever to rule out the possibility of chance effects.
Arousal in performance was unmeasured in this study, and the use of subjectivereports in Egner and Gruzelier (2003) did not show any effect of pre-performance
191
CHAPTER 4. EXPERIMENT TWO
arousal (anxiety) on musical tasks, so the experiment in Chapter 5 introduces theuse of monitoring into the methodology to provide a basis for measuring arousalelectrophysiologically.
4.4.2.3 Folk Songs
Analyses of post-intervention changes revealed ‘Expressive range’ showed group differ-ences across the intervention, but without follow-on post-hoc differences. No train-ing/music covariances were observed.
In relation to the novice performance question investigating possible post-technical improvements, this result provides limited support. ‘Expressive range’ as-sesses artistic as opposed to technical aspects of performance, and if did interactwith artistry, it was not anticipated.
If this association were found to hold in related studies, this would suggest thatthere may be a role for in optimising arousal prior to performance, as dis-cussed in Section 4.4.2.2. is bears some relation to the proposal that arousal in-creases benefit performance up to an optimal point, above which impairment be-comes observable (Steptoe, 1982). is possible -arousal optimisation was notseen in Chapter 3 or Egner and Gruzelier (2003), although training was posi-tively associated with improvements in ‘perceptual sensitivity’ and reduced false hitsin a Go-NoGo task (Egner and Gruzelier, 2001, 2004b). is might suggest thatwider aspects of music performance could benefit from attentional optimisation dueto reduced error incidence in task performance. Some further support for this inter-pretation is seen in Ros et al. (2009) where technical improvements in micro-surgerywere found following . e alpha-theta group was found to have decreasedin overall ratings of overall vocal competence and this result is interpreted as beingpossibly due to post-nap motor impairment, as in the prior tasks.
4.4.2.4 Instrumental Improvisation
is task revealed a predictive association between within-session t/a changes andpost-training measures of ‘Overall Improvisational Competence,’ ‘Fluency’ and ‘Com-municative Ability’. Given that these measures fell after training, it may have beenthe case that performers who could most regulate sleep onset may have also been able
192
CHAPTER 4. EXPERIMENT TWO
to manage sleep offset too, and thus mitigate post-sleep impairment effects. If thishad happened, Technical, Artistic and Presentational measures may have disclosedparallels with sleep physiology.
4.4.3 Summary of the study
e neurofeedback results showed much greater evidence of targeted change com-pared to Chapter 3. Alpha-theta training changed within, between and within × be-tween session t/a ratios; training changed within-session training ratios. In alpha-theta analyses it was concluded that the 15-minute length of sessions was fit for thepurpose of invoking and possibly sustaining hypnagogic as there was suggestiveevidence that completed its cycle in these data (R ).
e music results were quite different from those in Chapter 3, and this was inter-preted in terms of the timing of post-intervention performances, which immediatelyfollowed final sessions, rendering them open to possible transient after effectsof . is difference apparently counteracted the improved scores seen after theprevious alpha-theta intervention, and this was interpreted in terms of possible motorimpairments following a period of sleep-onset. R was challengedby the possibility that in the short-term, hypnagogia could impair spontaneous pro-cessing of emotional content expressed as physical performance.
e results were however slightly more promising, with the novice perfor-mance task (Folk song) disclosing the only significant in measures of ‘Expres-sive range’. is change was not distinguished by post-hoc analysis, and addressedR (N ) to a very limited extent.
Several instances of music score changes co-varying with training changes wereobserved, although these were isolated amongst measures and did not tie-in with dis-tinct changes to performance scores.
Overall the absence of effects and the difference with the previous cohort was moststriking, and the study was interpreted in the light of possible transient effects of .
4.4.3.1 e following study
e changes seen in this study did not replicate those seen previously, and a subse-quent study was designed to further explore the effects of post-sleep physiology on
193

CHAPTER 4. EXPERIMENT TWO
music performance, and to investigate the possible relationship between arousal andperceived performance quality hinted at in the current results.
To carry out this type of analysis the next experiment employed task-related measures of music performance using neurofeedback methods, and in so doingsought to begin the examination of electrophysiological mediators of effects onbehaviour.
194
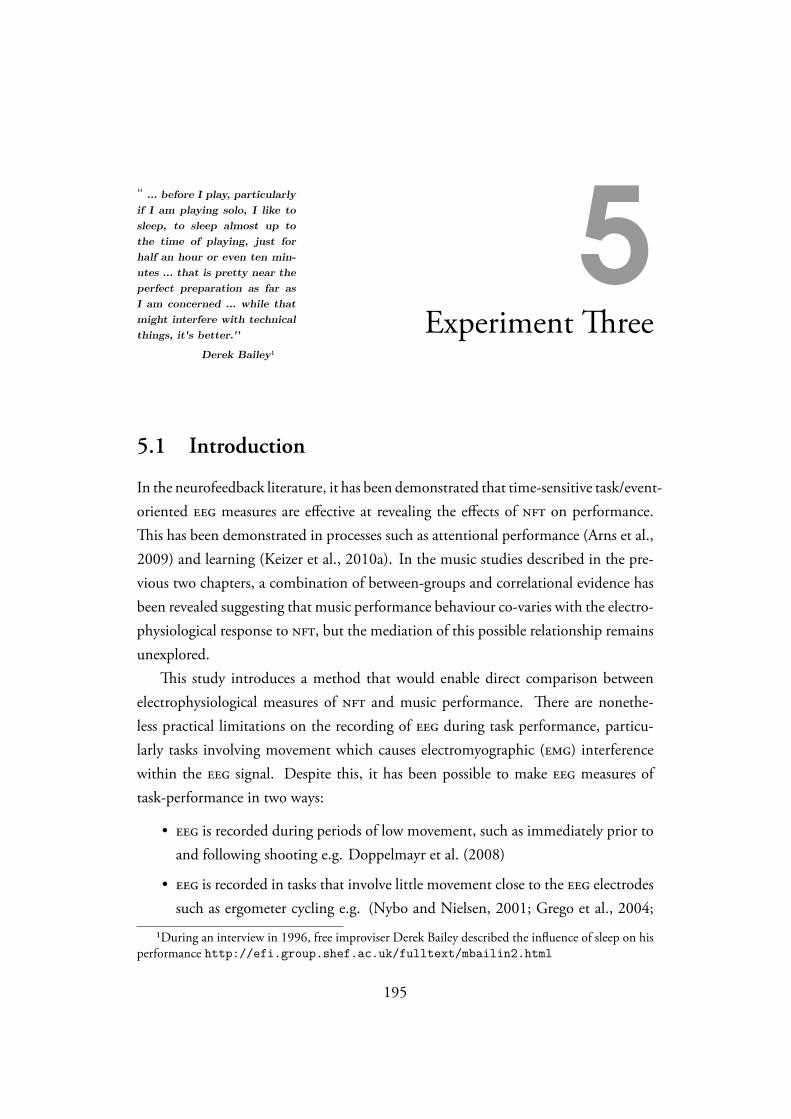
“ … before I play, particularlyif I am playing solo, I like tosleep, to sleep almost up tothe time of playing, just forhalf an hour or even ten min-utes … that is pretty near theperfect preparation as far asI am concerned … while thatmight interfere with technicalthings, it's better.''
Derek Bailey¹
5Experiment ree
5.1 Introduction
In the neurofeedback literature, it has been demonstrated that time-sensitive task/event-oriented measures are effective at revealing the effects of on performance.is has been demonstrated in processes such as attentional performance (Arns et al.,2009) and learning (Keizer et al., 2010a). In the music studies described in the pre-vious two chapters, a combination of between-groups and correlational evidence hasbeen revealed suggesting that music performance behaviour co-varies with the electro-physiological response to , but the mediation of this possible relationship remainsunexplored.
is study introduces a method that would enable direct comparison betweenelectrophysiological measures of and music performance. ere are nonethe-less practical limitations on the recording of during task performance, particu-larly tasks involving movement which causes electromyographic () interferencewithin the signal. Despite this, it has been possible to make measures oftask-performance in two ways:
• is recorded during periods of low movement, such as immediately prior toand following shooting e.g. Doppelmayr et al. (2008)
• is recorded in tasks that involve little movement close to the electrodessuch as ergometer cycling e.g. (Nybo and Nielsen, 2001; Grego et al., 2004;
¹During an interview in 1996, free improviser Derek Bailey described the influence of sleep on hisperformance http://efi.group.shef.ac.uk/fulltext/mbailin2.html
195
CHAPTER 5. EXPERIMENT THREE
Pontifex and Hillman, 2007).
In these studies, researchers have used neuroelectric measures to obtain a profile ofspectral and/or event related recorded during task performance.
In the study of music, the recording method has also been applied to pianoperformance in experiments that investigated co-activation between auditory and mo-tor areas of the brain by measuring event-related (Bangert and Altenmüller, 2003;Ruiz et al., 2009a) and spectral (Ruiz et al., 2009b). In all of the above studies, the recordings were made using procedures similar to those used in neurofeedback,although artefact rejection was conducted with either electro-oculogram ()detection or wavelet enhanced independent component analysis (ICA) methods. Incontrast, neurofeedback applications require realtime signal feedback which the afore-mentioned methods do not currently provide, and so use an e.g. >60–100 microvoltamplitude filter to remove electrical activity in a range that includes average am-plitudes (EEGer Neurofeedback Software, 2005). is approach does however alsolead to the discarding of some data too.
In relation to the current investigations of creative behaviour, task-related neuro-physiological analysis of piano performance has recently been incorporated into thefMRI literature, notably in experiments investigating the neural correlates of impro-visation. Bengtsson et al. (2007) documented a higher signal in improvisationcompared to a memorised reproduction of prior improvisation for the right dorsolat-eral prefrontal cortex (-) and pre-supplementary motor area. Limb and Braun(2008) conducted a jazz-blues study comparing improvised accompaniment to mem-orised accompaniment, finding widespread deactivation in almost all areas of the pre-frontal cortex, except for selective activation of the frontal polar cortex ( ) andactivations in neocortical sensorimotor areas, anterior cingulate cortex and rightlateral cerebellar hemisphere — activations during improvisation were matched by de-activations during the control task (playback of pre-learned 12 bar blues). Berkowitzand Ansari (2008) compared improvisation to scored performance, finding relative increases for both melodic and rhythmic improvisation in premotor areas, pos-terior , inferior frontal gyrus, left sensorimotor cortex, some parietal areas, andthe cerebellum. Berkowitz and Ansari (2010) repeated the previous method, compar-ing highly trained and novice musicians, and finding relative deactivation of the righttemporoparietal junction in experts.
196
CHAPTER 5. EXPERIMENT THREE
e differences in the above results have been interpreted in the light of the tran-sient hypofrontality hypothesis, that is the fleeting deactivation of selective attentionprocesses in working memory control (Dietrich and Kanso, 2010). It was contendedthat the design of Limb and Braun’s (2008) study alone provided scope for previ-ously memorised (implicitly stored) motor sequences to be triggered spontaneously;with metacognition downplayed, participants could produce more intuitive musicalresponses. e other fMRI studies engaged attentional and working memory func-tions, as improvising participants were asked to retain internal representations of mu-sic or non-standard keyboards during task execution, and as a result activated higherorder control mechanisms that Limb and Braun’s (2008) jazz-blues improvisationswere shown to deactivate.
Given that hypofrontality during music improvisation could, due to its neocor-tical associations, also be observed from surface measures, and that creativity re-lated hypofrontality has been observed during the performance of Christensen et al.’s(1960b) ‘Alternate uses’ creativity task (Fink et al., 2006), an experimental rationalefor testing improvisational hypofrontality in an study presents itself. An methodology such as this could in turn be used to draw closer comparisons betweenelectrophysiology in both and music performance, potentially illuminating in-termediary processes. Accordingly, the objective of the current study was to examineseveral different types of piano performance, as a preliminary step in identifying wherehypofrontality occurs in music creation, as a precursor to designing future optimalperformance studies of .
e generated research question is that electrophysiological measures of music cre-ation (improvisation) will differ from a control task (rendition), with improvisationsbeing characterised by greater hypofrontality (measured as frontal alpha synchronisa-tion) — this addresses (R (I )).
e functional significance of frontal alpha synchronisation during creative tasksis the subject of some debate, a more traditional view maintains that alpha activ-ity represents cortical idling in unused areas during activation of specific neuronalnetworks implicated. An example of this might be the sensation of ‘Muscle mem-ory’ in which frontal areas deactivate whilst a specific motor circuit operates betweenthe basal ganglia, the supplementary motor cortex, the motor thalamus and the hip-pocampus (Dietrich, 2004b). Alternatively, cortical alpha may reflect a top-down,
197
CHAPTER 5. EXPERIMENT THREE
executive process that selectively inhibits stimulus driven attention from disturbingthe content of working memory. Pressing (1988) proposed that improvisation incor-porated higher cognitive feed-forward editing to “set the design of motor programs”and monitor efferent activity to enhance processing speed and accuracy — such aprocess would require not just activation in motor circuits, but also in those incor-porating cognitive control. is perspective has received some support from a recent study comparing professional to novice dancers Fink et al. (2009). e authorsassociated dance expertise with greater alpha synchronisation in the parietotemporalcortex during imagined dance improvisation, especially in the right hemisphere. Itwas surmised that dancers disclose a specialised process whereby stimulus driven at-tention is inhibited in order to block visual input — this difference was not observedin measures of the imagined performance of a waltz, suggesting that it is specificto creative behaviour. A subsequent fMRI study comparing expert and non-expertmusicians also supported this perspective; Berkowitz and Ansari (2010) demonstratedthat expert musicians selectively inhibit the right temporoparietal junction in orderto inhibit stimulus driven attention. e authors also identified weaker evidence ofactivations in the as a possible indication that inhibition emanates from an areaimplicated in cognitive control.
To this end, a secondary improvisation research question was also introduced:improvisation would contain relatively higher parietal inhibition (Pz alpha) than therendition of a musical score — addressing R (H ).
In addition to testing methods in which effect mediation might be in-vestigated, the current study drew up supplementary research questions relating toR (C) — raised by the apparently negative after-effectof alpha-theta on spontaneous processing in music performance seen in Chap-ter 4.
e failed replication was interpreted in the light of the fact that participants inthe second experiment carried out post-training tasks immediately following their fi-nal session, and this was interpreted as possible evidence that the alpha-thetaparticipants experienced post-nap response-slowing (Milner et al., 2006), which hadhindered music performance. In contrast, the research on cognitive performance sug-gests that napping is beneficial to subsequent cognition (Lovato and Lack, 2010),
198
CHAPTER 5. EXPERIMENT THREE
and so this study set out to assess whether napping might simultaneously impair andenhance motor and cognitive performance respectively, specifically in relation to thehypofrontality framework explored in this thesis.
is trial did not however employ an alpha-theta intervention, but rather soughtconfirmation of some of the issues in current sleep research regarding post-nap perfor-mance as a preliminary step in devising a methodology for comparing transient and sleep-offset effects. is in turn is related to the overall investigative approach ofthis thesis in addressing the possible mediating role of hypofrontality in both sleeptransition and creativity. To this end, the current study was designed to comparefrontal inhibitory activity in napping and wakefulness to ascertain whether nappingis characterised by hypofrontality, in line with Muzur et al.’s (2002) contention that sleep down-regulates the , leading to executive deficiencies that ‘deprivedream mentation of logical reasoning capacities.’
e generated research question here is that napping would contain more frontalinhibitory activity than wakeful rest — this relates to R (C-) and its interest in the relation between hypnagogia and spontaneous emo-tional processing in the short-term.
e rest type chosen in the current study was watching a 30-minute silent movie:Charlie Chaplin’s “A Night Out” (1915). is type of waking activity was selectedas a no-nap control as it placed participants in a common condition in which theyremained motionless whilst encountering the same ‘visual environment’ (Smith andGevins, 2004). e effects of watching silent-movie footage on neural function arenot entirely clear however; on the one hand it is thought that movie-watching is ac-companied by hypofrontality, possibly as a result of reduced self-awareness when theviewer becomes immersed in the narrative (Hasson et al., 2004), but on the otherhand some footage, for example advertisements, attenuate frontal alpha activityin line with processing demands raised by the orienting-response or episodic memoryencoding (Smith and Gevins, 2004). Overall, it was not entirely clear in advance whatthe difference between nap and silent movie watching might be when measured in the, although it was nonetheless anticipated that hypofrontality would be in greaterevidence during napping due to the difference between sleep and wakefulness.
In terms of motor performance, the discussion of the results in Chapter 4 positedthat post-nap motor impairments mitigated against post-alpha-theta musical improve-
199
CHAPTER 5. EXPERIMENT THREE
ments seen in previous studies (Chapter 3, and Egner and Gruzelier (2003)).In response, the research question here is that measures of (a) motor activity and
consequently (b) musical processing would be reduced following a nap in comparisonto a period of wakeful rest — this approach assesses R (C-) as a product of hypnagogia’s after-effects during sleep-offset. e identificationof post-nap response-slowing in the music performance data was sought in terms ofthe amount and velocity of piano notes played, which were predicted to be reduceddue to transient motor impairment, and the duration of notes which were predictedto be longer immediately following napping.
Despite the possible negative impacts of sleep-offset on motor aspects of musicperformance, cognitive performance has been found to be improved by daytime nap-ping (Takahashi and Arito, 2000; Brooks and Lack, 2006). is is possibly as a resultof the restorative effects of napping on daytime arousal levels, expressed as reducedalpha band (Hayashi et al., 1999a,b). Alternatively post-nap cognitive improve-ments have been described as the “rapid dissipation of inhibition in the ‘wake-active’cells associated with the ‘sleep-switch’ mechanism” (Lovato and Lack, 2010). Con-sidering that napping may simultaneously impair and enhance motor and cognitiveperformance respectively, the current experiment included the study of post-nap cog-nition, particularly in frontal function relating to the investigation of hypofrontality.
e generated research question in response to this is that measures of frontalcognitive function will be enhanced following nap compared to wakeful-rest — ad-dressing R (C). A cognitive test associated with thefunction of the prefrontal cortex, specifically the (Cabeza and Nyberg, 2000)is the Wisconsin card sorting test () (Berg, 1948), a measure of “top-down” pro-cessing in which behaviour must be controlled not in terms of implicitly stored re-sponses to incoming sensory information, but according to explicitly held intentions(Miller and Cohen, 2001). e test works by providing subjects with cards to sortaccording to a rule (colour, shape, quantity), however the rule changes periodicallyand without notice, at which point the participant must infer the new rule, requiringa non stimulus-driven executive response. e electrophysiological correlates of performance include greater alpha power during prior rest, and reduced left-frontalalpha power during task performance (Ciçek and Nalçaci, 2001), as well as increasedparietal alpha (Ciçek and Nalçaci, 2001; González-Hernández et al., 2002).
200
CHAPTER 5. EXPERIMENT THREE
e associated research question generated in response to this is that measures offrontal alpha made during execution will be reduced in comparison to thosemade after wakeful-rest, and these will correlate with cognitive performance. isaddresses R (C) in the relation between hypnagogiaand the role of frontal hypofunction in spontaneous processing of emotional content.
To address the , motor, creativity, and cognitive research questions introducedabove, the current experiment was implemented as two studies. Firstly, a repeated-measures design compared improvisation and rendition tasks for evidence of neuraland creative differences. Secondly, a between-groups design compared nap and wake-ful rest physiologies, plus their after-effects on motor and creative aspects of musicperformance, and frontal cognitive processing. e design of the study is detailed inSection 5.2.5.
5.2 Methods
5.2.1 Participants
Twelve healthy pianists participated in the study. All of them had been musicallytrained and been playing the piano for more than 10 years. eir ages ranged from20 to 29 years old (mean 24.33 ± 2.90), and 3 of them were male, 9 of them female.Of the twelve, two had prior experience of improvising. One had previously workedas a church organist and had extensive experience of improvising at weddings, fu-nerals and other ceremonies wherein the use of improvisation allowed the player tothematically extend or curtail a piece of music based on the running-time of the cer-emony. e other improvising participant had a long-term hobby of practising butnot performing jazz improvisation. Both of these individuals were familiar with themelodic template approach to improvisation, that is the ‘variation-on-a-theme’ style.All the other participants played in the classical tradition, and were unaccustomed toimprovising.
201
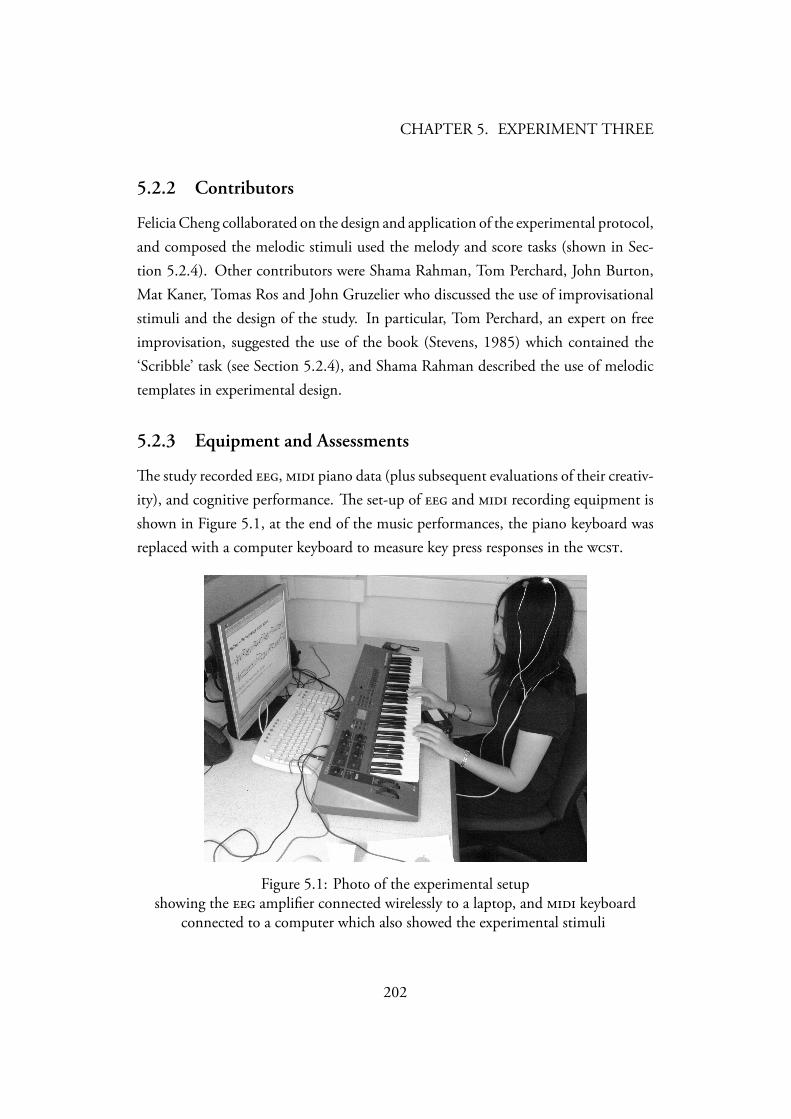
CHAPTER 5. EXPERIMENT THREE
5.2.2 Contributors
Felicia Cheng collaborated on the design and application of the experimental protocol,and composed the melodic stimuli used the melody and score tasks (shown in Sec-tion 5.2.4). Other contributors were Shama Rahman, Tom Perchard, John Burton,Mat Kaner, Tomas Ros and John Gruzelier who discussed the use of improvisationalstimuli and the design of the study. In particular, Tom Perchard, an expert on freeimprovisation, suggested the use of the book (Stevens, 1985) which contained the‘Scribble’ task (see Section 5.2.4), and Shama Rahman described the use of melodictemplates in experimental design.
5.2.3 Equipment and Assessments
e study recorded , piano data (plus subsequent evaluations of their creativ-ity), and cognitive performance. e set-up of and recording equipment isshown in Figure 5.1, at the end of the music performances, the piano keyboard wasreplaced with a computer keyboard to measure key press responses in the .
Figure 5.1: Photo of the experimental setupshowing the amplifier connected wirelessly to a laptop, and keyboard
connected to a computer which also showed the experimental stimuli
202
CHAPTER 5. EXPERIMENT THREE
5.2.3.1 EEG
measurements were made with a Nexus 4 amplifier connected wirelessly to a lap-top running the Biotrace 2009a software (both made by Mind Media B.V.). Record-ing electrodes were placed at Fz and Pz, referenced to the right and left mastoidsrespectively, with the ground electrode at Cz. e Alpha (8–11 Hz) band wasextracted via online transformations.
e current study measured frontal/parietal inhibition as alpha band recordedat Fz/Pz. ere are however several limitations of this approach. Firstly the spatialresolution of the is poor, a single scalp electrode detects potential changes in sur-face neurons across an area of 10cm², efforts to improve the resolution of the breadthand depth of measures require a larger amount of electrodes (between 25 and128 for example (Pascual-Marqui, 2002)), from which higher resolution sourcelocalisation can be calculated. e second problem associated with using single elec-trode measures is that of artefact removal; again, methods for detecting and removingnon- data components from the recording require the use of multiple electrodesto enable the extraction of characteristic features composing the recorded signal (De-lorme and Makeig, 2004).
Considering these points means that the specific association of an Fz/Pz signalto prefrontal/parietal function is limited. Fz recordings are for example likely to beaffected by neuronal assemblies extending beyond surface neurons in the Dorsolateralprefrontal cortex (to which Fz is closest) into the premotor and primary motor areas.Whilst the Dorsolateral prefrontal cortex is de-activated during improvisation, mo-tor cortices are both activated and inhibited (Limb and Braun, 2008), which couldsubsequently affect evidence of prefrontal alpha synchronisation by incorporating syn-chronisation/desynchronisation of alpha in motor areas (Klimesch et al., 2007).Moreover, the signal-to-noise ratio problem is crudely addressed in the current study;by rejecting datapoints based on raw amplitudes above a fixed level, and bandamplitudes outside a standardised dispersion of values. Whilst this means that somenoise is rejected, some signal is too, and furthermore only high amplitude noise com-ponents are detected. is basic methodology was nevertheless adopted for con-sistency with the methods used in itself, in which t/a ratio changes at Fz havebeen observed over 10 sessions (Egner and Gruzelier, 2004a), indicating that it may
203
CHAPTER 5. EXPERIMENT THREE
be possible to detect changes in prefrontal using this methodology.
5.2.3.2 Motor Performance
Piano performances were recorded as files using a digital piano wired to a laptoprunning the MidiSwing sequencer software (Version 0.3.5b).
Various parameters of piano performance were used to probe for evidenceof ‘response-slowing’ following napping (Milner et al., 2006). For each performance,the following measures were extracted: (a) the number of notes played; (b) the meanvelocity of notes played; (c) the number of notes played in different duration ranges(units of one beat). ese experimental measures were extracted from the midi record-ings using the midi toolbox (Eerola and Toiviainen, 2004).
5.2.3.3 Creativity
e operational definition of creativity in this experiment was formed according totwo criteria:
• e type of neural process being explored, defined in Section 1.5.1 as ‘sponta-neous processing of emotional content’.
• A socially validated consensus about the creative value of music arising fromthe elicited process.
In the current study, and in accordance with Amabile’s (1982) assertion that eval-uators must not be primed as to how they might define creativity, the experimentalmeasure was simply stated as ‘creativity.’ is is important for Amabile’s (1982) tech-nique as the analysis of social psychology rests on the view that assessors can achieveconsensus without having being trained what to think in relation to the experiment.Creative evaluation was measured on a scale of 1–10, again in line with the Amabile’s(1982) method of measuring agreement on the extent to which a social group valuethe content created in the experiment.
e recordings made during the course of the study were presented in arandomised order to a panel of two music psychology students who were familiarwith piano performance, and who were asked to score each piece according to their
204
CHAPTER 5. EXPERIMENT THREE
subjective view of how creative it was. Subsequently the level of agreement betweenthe raters was analysed statistically, and is detailed in Section 5.2.5.1.
5.2.3.4 Cognitive performance
e was administered by computer, with the stimuli being displayed onscreenand responses made using the computer keyboard.
Cognitive performance in relation to frontal brain function was measured with acomputerised implementation of the Wisconsin card sort task ¹, which providedthe 9 measures of performance:
1. Number of Trials
2. Categories Done/Seen
3. Correct Responses
4. Total Errors
5. Perseverative Responses
6. Perseverative Errors
7. Non-Perseverative Errors
8. Unique Errors
9. Trials to complete 1 category
5.2.4 Measurement Procedures
e experimental assessments detailed above were implemented according to proce-dures outlined here:
Rest e nap condition in this study was a 30-minute ‘sleep opportunity’ whereparticipants rested in an easy chair with their eyes closed whilst was recorded.In the wakeful-rest (control) condition, participants sat in an easy chair watching a30-minute silent movie. Before the movie began, participants were told that they
¹e was performed with the software: http://pebl.sourceforge.net/
205
CHAPTER 5. EXPERIMENT THREE
would be asked comprehension questions about the movie to ensure they followed toprotocol.
All sleep and movie sessions were held at 3pm (±90 minutes), to coincide ap-proximately with the timing of the afternoon ‘dip’ (Nishida and Walker, 2007). It isworthwhile mentioning that the current study does not study napping using standardpolysomnographic methods. In standard sleep research, the use of (C3/A2²) iscombined with measures of ocular and muscular electrophysiology in the identifica-tion of sleep stages and electrical artefacts. Furthermore, the classifying sleep stagesis performed according to visual waveform characteristics, as opposed to the spectralapproach used here and informed by De Gennaro et al. (2001), who used standardsleep-study electrode placements, in difference from those used here.
Music Tasks In this study, evidence of a distinct neurophysiology associated withspontaneous processing of emotional content was explored for through a music im-provisation paradigm. e creative aspects of improvisation, particularly in respect tothe experimental observation of music creation is discussed in Section 1.5.3.
e correlates of music creation were explored in this study by comparingthree forms of improvisation to a control condition in which participants played ascore.
is study maintains the exploration of improvisation from Chapters 3 and 4as the operational means of realising spontaneous emotional neural activity and be-haviour that might translate into socially defined creativity, but it also intensifies thefocus on improvisation by further deconstructing it into subtypes that vary accordingto the degree of constraint that is placed on randomness.
As Simonton (2003) argued, creation originates at random - and improvisationdoes seem to provide opportunities for random variations, yet his notion of selectiveretention suggests a heuristic process at work too, and constraint is important in musicimprovisation as it is used to mediate selection criteria. Since a top-down selectionprocess is limited by working memory capacity (Pinker, 1999), the need to makehigh-level choices in live improvisation is reduced by some of the heuristic techniquesemployed by improvisers.
²A2 is the right earlobe or mastoid; C3 (or C4) is the cortical lead recommended for standard sleepscoring (Rechtschaffen and Kales, 1968)
206
CHAPTER 5. EXPERIMENT THREE
e first heuristic is the use of feed-back driven responses. Both Sawyer (2000)and Dietrich (2004b) observe that free-jazz improvisation is made up of a series ofmusical phrases or motor procedures that are represented sub-cortically and are havebeen previously acquired in the form of musical skill and practice. In improvisation, orin any complex process that feeds-back motor responses to changing sensory input,the execution of one motor sequence can trigger subsequent procedures reflexively,and with limited recourse to conscious intervention³. Dietrich (2004b) illustratesthis point in reference to the lightning fast escape manoeuvres of a squirrel trying toget to safety:
``Lacking an overall strategy or plan, the squirrel gets to safetyentirely by relying on moment to moment adjustments. Suchsmooth feedback-driven sensory-motor integration can produce ex-tremely complex movement patterns that can serve an overalland/or higher goal (safety), yet requires no more than the reactionto immediately preceding input.'' — (Dietrich, 2004b)
In the music improvisation scenario, the limitation on the motor response is notdriven by the same requirements. Rather than an escape manoeuvre, where the onlylimit on a response is how safe it is, most improvisation contains restrictions such astempo, meter, timbre, tone and pitch — one notable exception to this rule is free‘non-idiomatic’ improvisation, although even that is limited by the sonic capabilitiesof the instrument being played.
In any case, the initiation of musical responses is, by virtue of human conscious-ness, also available to a second heuristic for response selection: ‘feed-forward’ editing(Pressing, 1988). e counting of bars, the changing of mode and the conscious mod-eration of dynamics are examples of how explicit meta-representations enable forwardplanning in realtime during music improvisation. Despite this, it is not necessary tocontrol all motor procedures via higher-order functions, and given that the reflexiveinduction of sub-cortical motor sequences provides faster responses in realtime (Diet-rich, 2004b), it is plausible that improvisation also diminishes higher-order cognitivefunctions, and ‘transient hypofrontality’ occurs (Dietrich, 2003).
³e sensation of sequences of motor procedures forming chains with minimal conscious interven-tion is often referred to by musicians as ‘muscle memory’
207
CHAPTER 5. EXPERIMENT THREE
Considering that the role of randomness in the spontaneous processing of emo-tional content might be mediated by the scope for musical variation, the current studyexplores the role of constraint on on improvisation by introducing tasks that gradu-ally reduce the potential for randomness. e final task is a control performancethat nominally gives no scope for randomness. e reason the tasks were given inan increasing order of constraint was an attempt to design a study that avoided thepotential ‘melodic anchoring’ effect (Bharucha, 1984). at is, that if the tasks hadbegun with highly limited scope for variation, participants may have found it harderto move beyond that initial reference point. Admittedly, performing a largely uncon-strained task to begin could also influence subsequent activity by initiating a musicalreference or anchor, but the design of this order (also shown in Section 5.2.5) was anattempt to set a standard in each task that excluded prior activity.
Task 1 — Scribble is task is taken from the first part of a task from the bookSearch & Reflect (Stevens, 1985). e exercise was originally envisaged as a form ofpractice in which musicians were encouraged to start by simply playing in a techni-cally undemanding way referred to as ‘scribbling,’ without self-evaluation for a period,before gradually increasing concentration and enabling a phrase to be picked out anddeveloped. In this study only the scribble part of the task was used, and lasted for 2minutes.
e instruction given for scribble task is as follows:
``Take your instrument and scribble on it – that is, let anythingcome out, don't think about the sound you are producing, justkeep a rapid activity going. You should be detached from youractivity in the sense that your playing is undirected – you are nottrying to play a tune or anything specific, you are merely playing.You could be looking out of the window or at a picture whilstkeeping the rapid activity going. Don't worry about being musical– there is nothing that you can do on a musical instrument, whichdoes not in some way involve the rudiments of music.'' — Stevens(1985)
After two minutes, the recording automatically stopped, and the midi record-
208
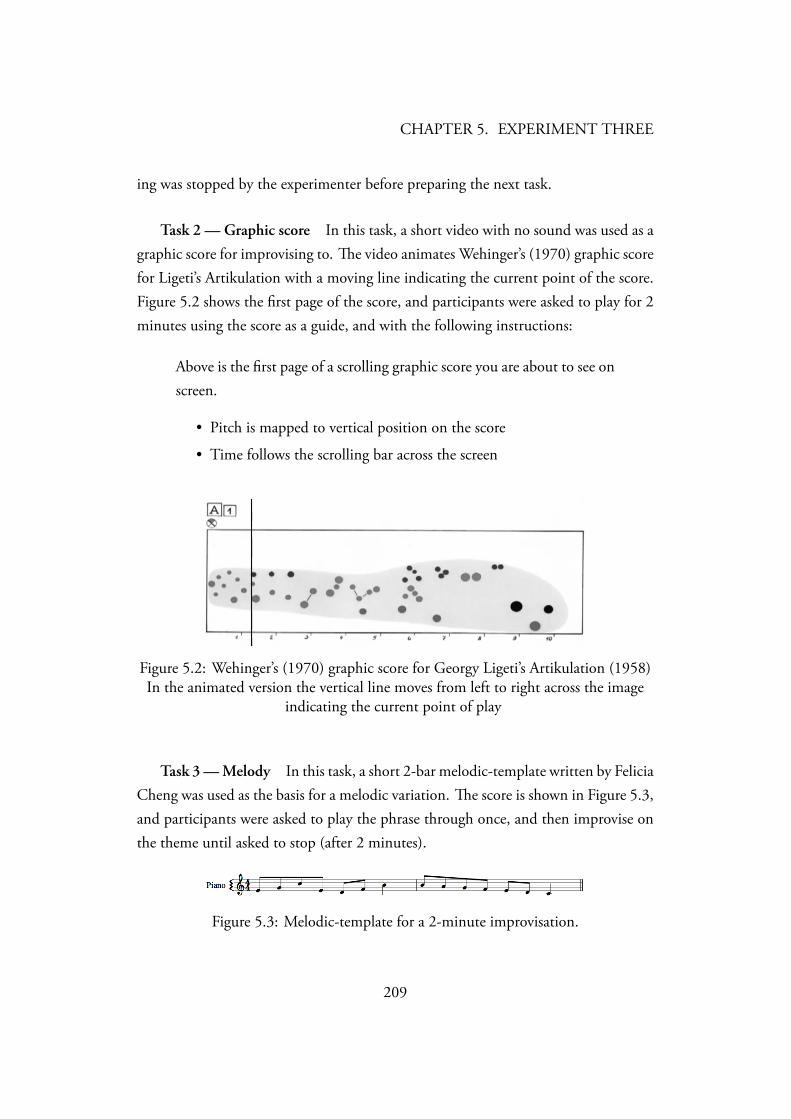
CHAPTER 5. EXPERIMENT THREE
ing was stopped by the experimenter before preparing the next task.
Task 2 — Graphic score In this task, a short video with no sound was used as agraphic score for improvising to. e video animates Wehinger’s (1970) graphic scorefor Ligeti’s Artikulation with a moving line indicating the current point of the score.Figure 5.2 shows the first page of the score, and participants were asked to play for 2minutes using the score as a guide, and with the following instructions:
Above is the first page of a scrolling graphic score you are about to see onscreen.
• Pitch is mapped to vertical position on the score
• Time follows the scrolling bar across the screen
Figure 5.2: Wehinger’s (1970) graphic score for Georgy Ligeti’s Artikulation (1958)In the animated version the vertical line moves from left to right across the image
indicating the current point of play
Task 3 — Melody In this task, a short 2-bar melodic-template written by FeliciaCheng was used as the basis for a melodic variation. e score is shown in Figure 5.3,and participants were asked to play the phrase through once, and then improvise onthe theme until asked to stop (after 2 minutes).
Figure 5.3: Melodic-template for a 2-minute improvisation.
209
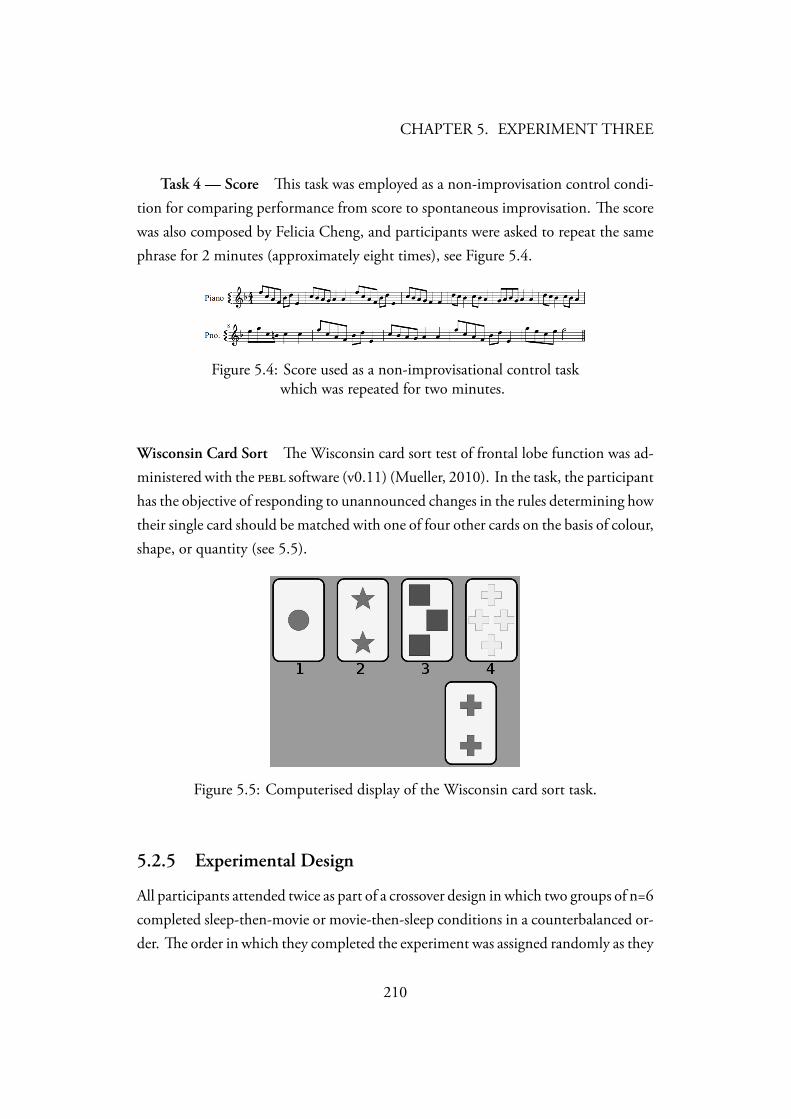
CHAPTER 5. EXPERIMENT THREE
Task 4 — Score is task was employed as a non-improvisation control condi-tion for comparing performance from score to spontaneous improvisation. e scorewas also composed by Felicia Cheng, and participants were asked to repeat the samephrase for 2 minutes (approximately eight times), see Figure 5.4.
!
Figure 5.4: Score used as a non-improvisational control taskwhich was repeated for two minutes.
Wisconsin Card Sort e Wisconsin card sort test of frontal lobe function was ad-ministered with the software (v0.11) (Mueller, 2010). In the task, the participanthas the objective of responding to unannounced changes in the rules determining howtheir single card should be matched with one of four other cards on the basis of colour,shape, or quantity (see 5.5).
Figure 5.5: Computerised display of the Wisconsin card sort task.
5.2.5 Experimental Design
All participants attended twice as part of a crossover design in which two groups of n=6completed sleep-then-movie or movie-then-sleep conditions in a counterbalanced or-der. e order in which they completed the experiment was assigned randomly as they
210
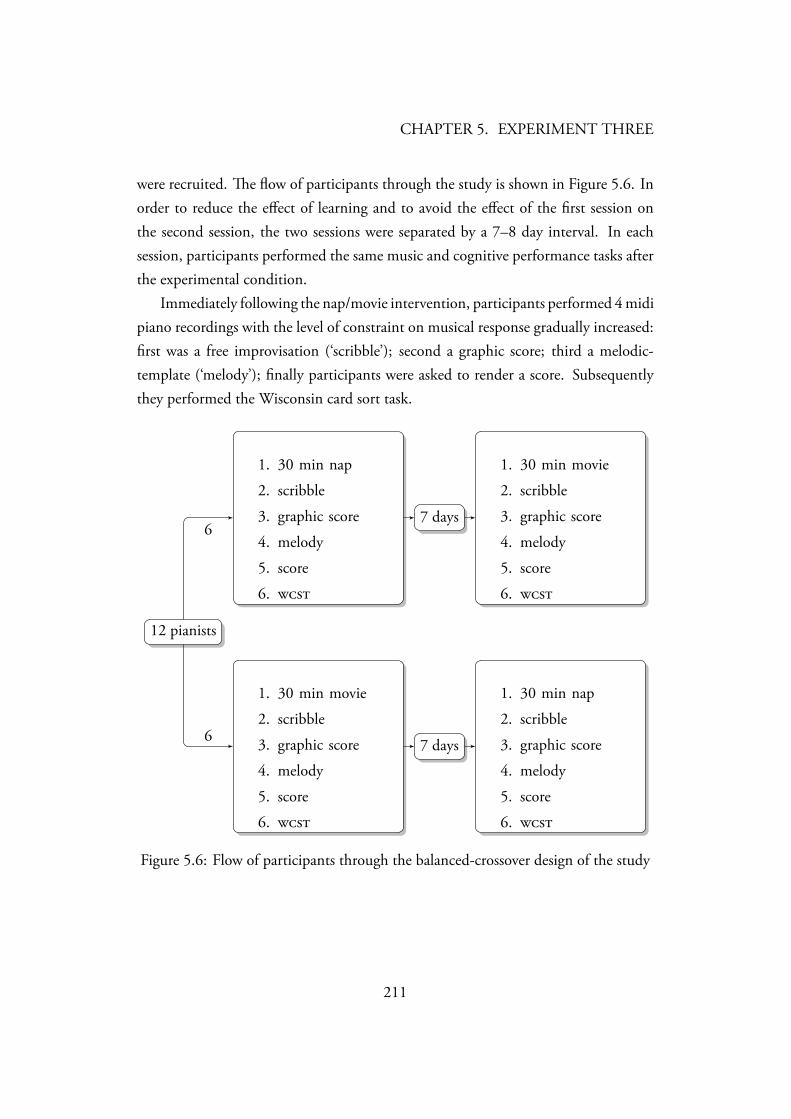
CHAPTER 5. EXPERIMENT THREE
were recruited. e flow of participants through the study is shown in Figure 5.6. Inorder to reduce the effect of learning and to avoid the effect of the first session onthe second session, the two sessions were separated by a 7–8 day interval. In eachsession, participants performed the same music and cognitive performance tasks afterthe experimental condition.
Immediately following the nap/movie intervention, participants performed 4 midipiano recordings with the level of constraint on musical response gradually increased:first was a free improvisation (‘scribble’); second a graphic score; third a melodic-template (‘melody’); finally participants were asked to render a score. Subsequentlythey performed the Wisconsin card sort task.
..
. ..
1. 30 min nap
2. scribble
3. graphic score
4. melody
5. score
6.
..7 days ..
1. 30 min movie
2. scribble
3. graphic score
4. melody
5. score
6.
..12 pianists
. ..
1. 30 min movie
2. scribble
3. graphic score
4. melody
5. score
6.
..7 days ..
1. 30 min nap
2. scribble
3. graphic score
4. melody
5. score
6.
.
6
.
6
Figure 5.6: Flow of participants through the balanced-crossover design of the study
211
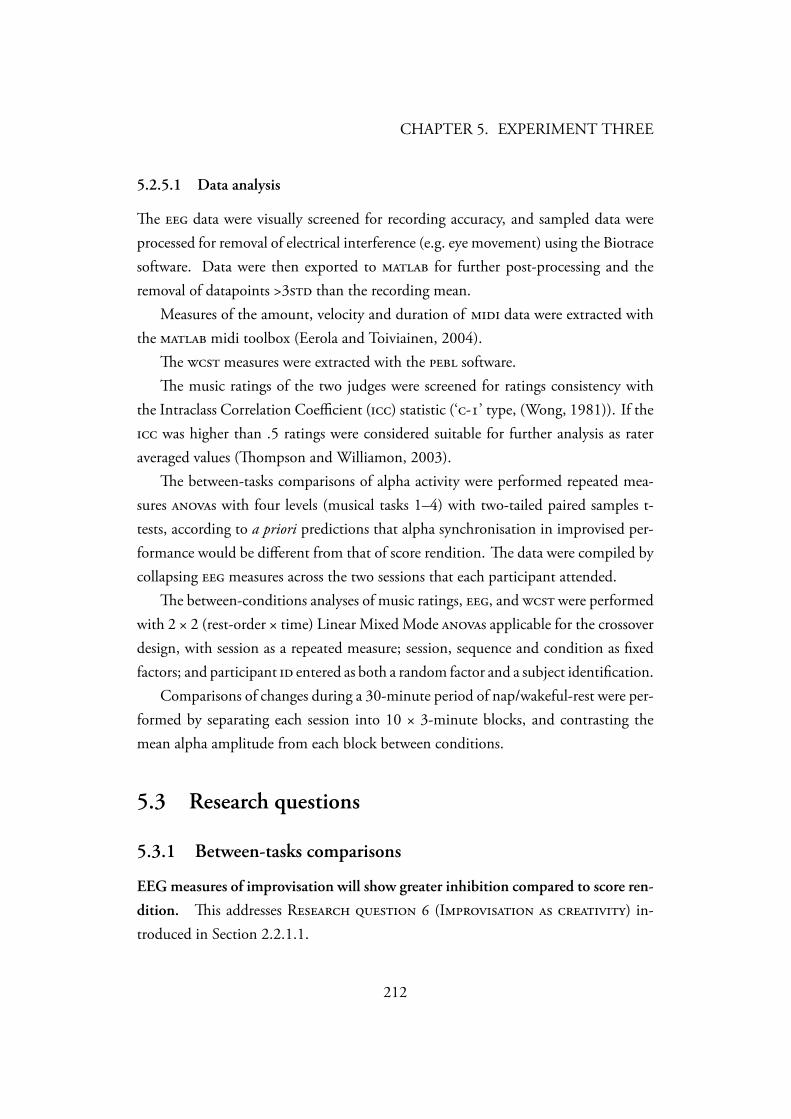
CHAPTER 5. EXPERIMENT THREE
5.2.5.1 Data analysis
e data were visually screened for recording accuracy, and sampled data wereprocessed for removal of electrical interference (e.g. eye movement) using the Biotracesoftware. Data were then exported to for further post-processing and theremoval of datapoints >3 than the recording mean.
Measures of the amount, velocity and duration of data were extracted withthe midi toolbox (Eerola and Toiviainen, 2004).
e measures were extracted with the software.e music ratings of the two judges were screened for ratings consistency with
the Intraclass Correlation Coefficient () statistic (‘-’ type, (Wong, 1981)). If the was higher than .5 ratings were considered suitable for further analysis as rateraveraged values (ompson and Williamon, 2003).
e between-tasks comparisons of alpha activity were performed repeated mea-sures s with four levels (musical tasks 1–4) with two-tailed paired samples t-tests, according to a priori predictions that alpha synchronisation in improvised per-formance would be different from that of score rendition. e data were compiled bycollapsing measures across the two sessions that each participant attended.
e between-conditions analyses of music ratings, , and were performedwith 2 × 2 (rest-order × time) Linear Mixed Mode s applicable for the crossoverdesign, with session as a repeated measure; session, sequence and condition as fixedfactors; and participant entered as both a random factor and a subject identification.
Comparisons of changes during a 30-minute period of nap/wakeful-rest were per-formed by separating each session into 10 × 3-minute blocks, and contrasting themean alpha amplitude from each block between conditions.
5.3 Research questions
5.3.1 Between-tasks comparisons
EEG measures of improvisation will show greater inhibition compared to score ren-
dition. is addresses R (I ) in-troduced in Section 2.2.1.1.
212
CHAPTER 5. EXPERIMENT THREE
Frontal and parietal neural processes in music improvisation are different fromthose of musical score rendition: during improvisation, frontal/parietal inhibition isgreater than in score rendition.
5.3.2 Between-condition comparisons
Alpha synchronisation and hypofrontality is addresses R (C) as it explores sleep for evidence of hypofrontality in the form of alphasynchronisation.
It is explored whether a period of nap will contain more alpha synchronisationat Fz and Pz than in a comparative period of wakeful rest (watching a silent movie).It is additionally explored whether during a sleep-offset period after napping/resting,this difference will be reversed, with less inhibitory activity after nap comparedto wakeful rest.
According to Dietrich’s (2003) hypofrontality hypothesis, the nap condition ofthis experiment would be characterised by greater alpha amplitude measures than themovie condition. Measures of parietal alpha were predicted to be in accordance withthose of Fz, and furthermore reflect trajectories observed in Pz alpha-theta neurofeed-back training.
Music performance will modulate as a function of prior rest
Response slowing is addresses R (C) and con-siders the short-term after-effects of hypnagogia on the motor response in spontaneousperformance and cognitive performance in tasks examining frontal function.
values (notes played, note velocity and note duration), would differ followingdifferent types of prior rest, with nap (in relation to wakeful rest) impacting negativelyas a result of transient motor impairment following napping: reducing the numberand velocity of notes played, and lengthening note durations.
Creativity Evidence of motor impairments would additionally be reflected inreduced creativity measures following nap compared to rest.
213
CHAPTER 5. EXPERIMENT THREE
Cognitive performance will modulate as a function of prior rest In line with thequestion as to whether there will be less frontal inhibition following napping — R- (C) — it is questioned whether measures of frontal lobecognitive performance will be enhanced following nap compared to rest.
5.4 Results
5.4.1 Data screening
5.4.1.1 Inter Rater Consistency
e panel ratings were assessed for inter rater consistency, with a mean level of con-sistency (Intraclass Correlation Coefficient ‘C-1’ type (Wong, 1981)) of r(23)=0.74,p<0.01, and ratings were subsequently averaged for further analysis.
5.4.2 Between-tasks study
ese comparisons were conducted to compare differences between differentforms of improvisation against a scored control condition in relation to R (H ) that relatively more frontal/parietalalpha synchronisation would be in evidence during improvised performance; it wasnot predicted in advance which form of improvisation would contain the most alphasynchronisation. Task data were collapsed across 2 repeated measures to provide an nof 12 when averaged across sessions.
Table 5.1 documents the means and standard deviations of all the measuresin this analysis.
A repeated measures one-way (with 4 levels, music tasks 1–4) revealeda near significant difference in Fz alpha measures between tasks (F(3, 33)=2.813,p=0.054), and subsequent planned contrasts (see Table 5.2) revealed that the melodytask contained relatively more hypofrontality than performing a score, indicating thatelectrophysiological processes in these performances differed. Further comparisonsbetween the different improvisation types revealed a difference in Fz alpha amplitudesbetween the melody and graphic score tasks, with melody being relatively greater,
214
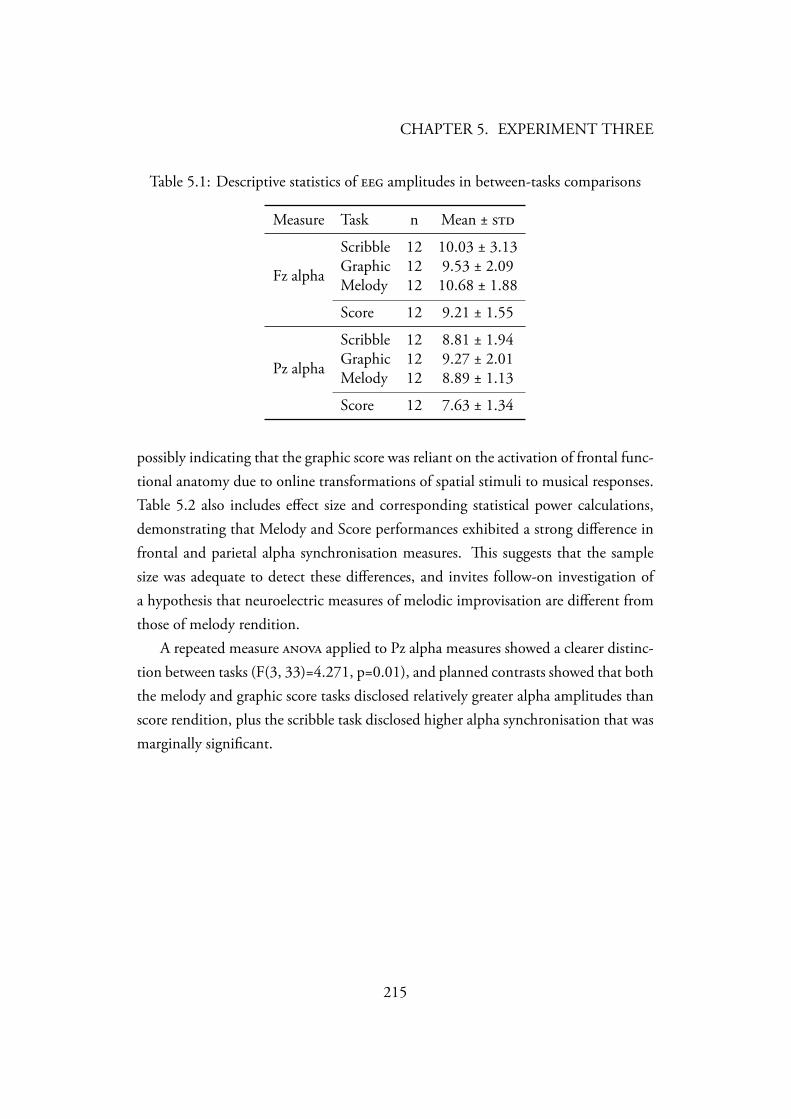
CHAPTER 5. EXPERIMENT THREE
Table 5.1: Descriptive statistics of amplitudes in between-tasks comparisons
Measure Task n Mean ±
Fz alpha
Scribble 12 10.03 ± 3.13Graphic 12 9.53 ± 2.09Melody 12 10.68 ± 1.88
Score 12 9.21 ± 1.55
Pz alpha
Scribble 12 8.81 ± 1.94Graphic 12 9.27 ± 2.01Melody 12 8.89 ± 1.13
Score 12 7.63 ± 1.34
possibly indicating that the graphic score was reliant on the activation of frontal func-tional anatomy due to online transformations of spatial stimuli to musical responses.Table 5.2 also includes effect size and corresponding statistical power calculations,demonstrating that Melody and Score performances exhibited a strong difference infrontal and parietal alpha synchronisation measures. is suggests that the samplesize was adequate to detect these differences, and invites follow-on investigation ofa hypothesis that neuroelectric measures of melodic improvisation are different fromthose of melody rendition.
A repeated measure applied to Pz alpha measures showed a clearer distinc-tion between tasks (F(3, 33)=4.271, p=0.01), and planned contrasts showed that boththe melody and graphic score tasks disclosed relatively greater alpha amplitudes thanscore rendition, plus the scribble task disclosed higher alpha synchronisation that wasmarginally significant.
215
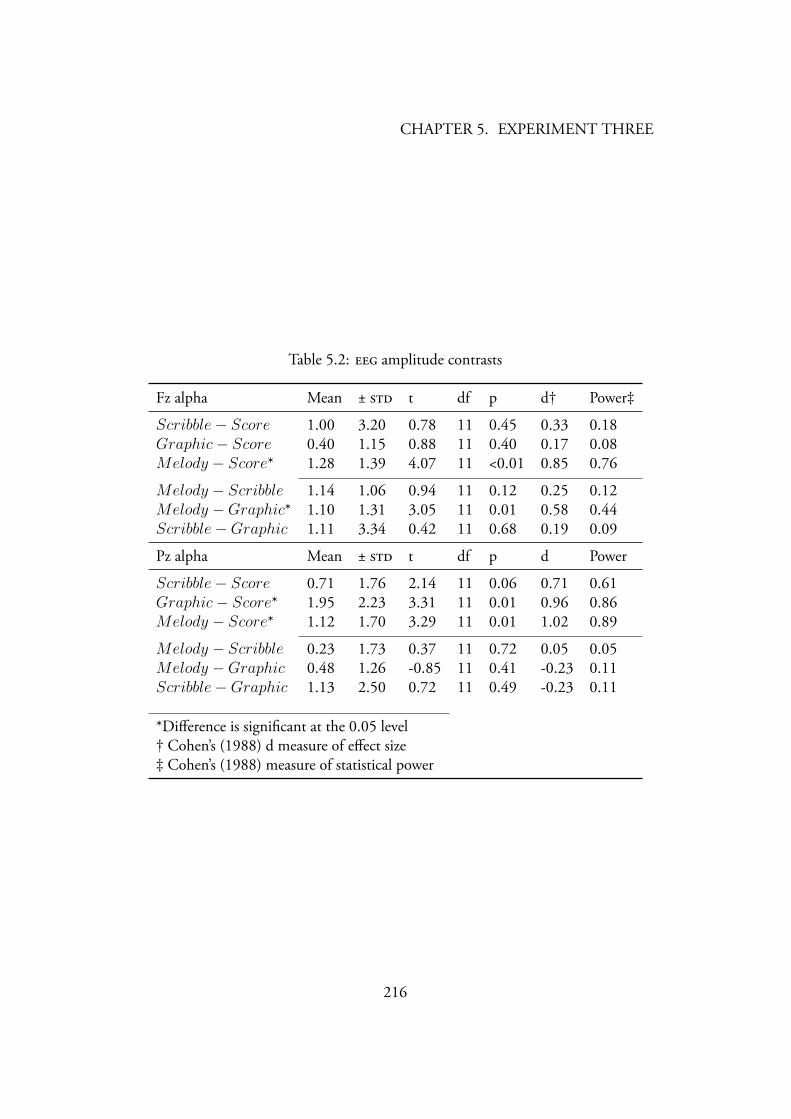
CHAPTER 5. EXPERIMENT THREE
Table 5.2: amplitude contrasts
Fz alpha Mean ± t df p d† Power‡
Scribble− Score 1.00 3.20 0.78 11 0.45 0.33 0.18Graphic− Score 0.40 1.15 0.88 11 0.40 0.17 0.08Melody − Score* 1.28 1.39 4.07 11 <0.01 0.85 0.76
Melody − Scribble 1.14 1.06 0.94 11 0.12 0.25 0.12Melody −Graphic* 1.10 1.31 3.05 11 0.01 0.58 0.44Scribble−Graphic 1.11 3.34 0.42 11 0.68 0.19 0.09
Pz alpha Mean ± t df p d Power
Scribble− Score 0.71 1.76 2.14 11 0.06 0.71 0.61Graphic− Score* 1.95 2.23 3.31 11 0.01 0.96 0.86Melody − Score* 1.12 1.70 3.29 11 0.01 1.02 0.89
Melody − Scribble 0.23 1.73 0.37 11 0.72 0.05 0.05Melody −Graphic 0.48 1.26 -0.85 11 0.41 -0.23 0.11Scribble−Graphic 1.13 2.50 0.72 11 0.49 -0.23 0.11
*Difference is significant at the 0.05 level† Cohen’s (1988) d measure of effect size‡ Cohen’s (1988) measure of statistical power
216
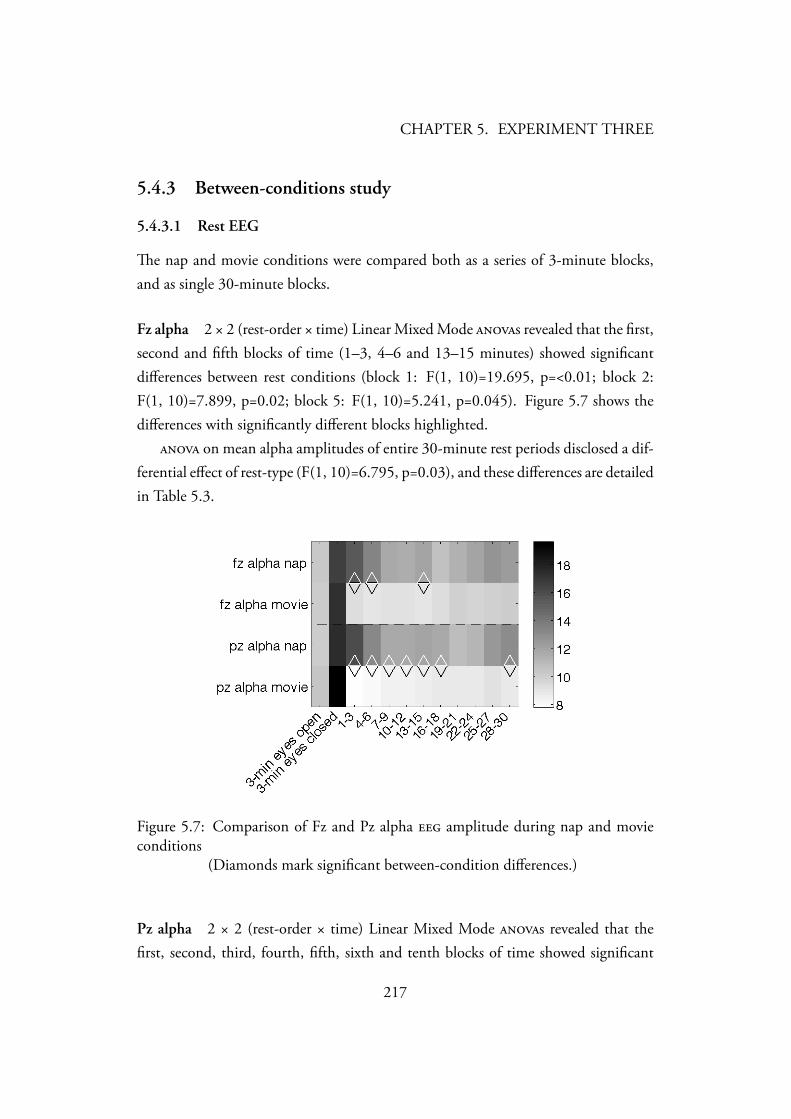
CHAPTER 5. EXPERIMENT THREE
5.4.3 Between-conditions study
5.4.3.1 Rest EEG
e nap and movie conditions were compared both as a series of 3-minute blocks,and as single 30-minute blocks.
Fz alpha 2 × 2 (rest-order × time) Linear Mixed Mode s revealed that the first,second and fifth blocks of time (1–3, 4–6 and 13–15 minutes) showed significantdifferences between rest conditions (block 1: F(1, 10)=19.695, p=<0.01; block 2:F(1, 10)=7.899, p=0.02; block 5: F(1, 10)=5.241, p=0.045). Figure 5.7 shows thedifferences with significantly different blocks highlighted.
on mean alpha amplitudes of entire 30-minute rest periods disclosed a dif-ferential effect of rest-type (F(1, 10)=6.795, p=0.03), and these differences are detailedin Table 5.3.
Figure 5.7: Comparison of Fz and Pz alpha amplitude during nap and movieconditions
(Diamonds mark significant between-condition differences.)
Pz alpha 2 × 2 (rest-order × time) Linear Mixed Mode s revealed that thefirst, second, third, fourth, fifth, sixth and tenth blocks of time showed significant
217
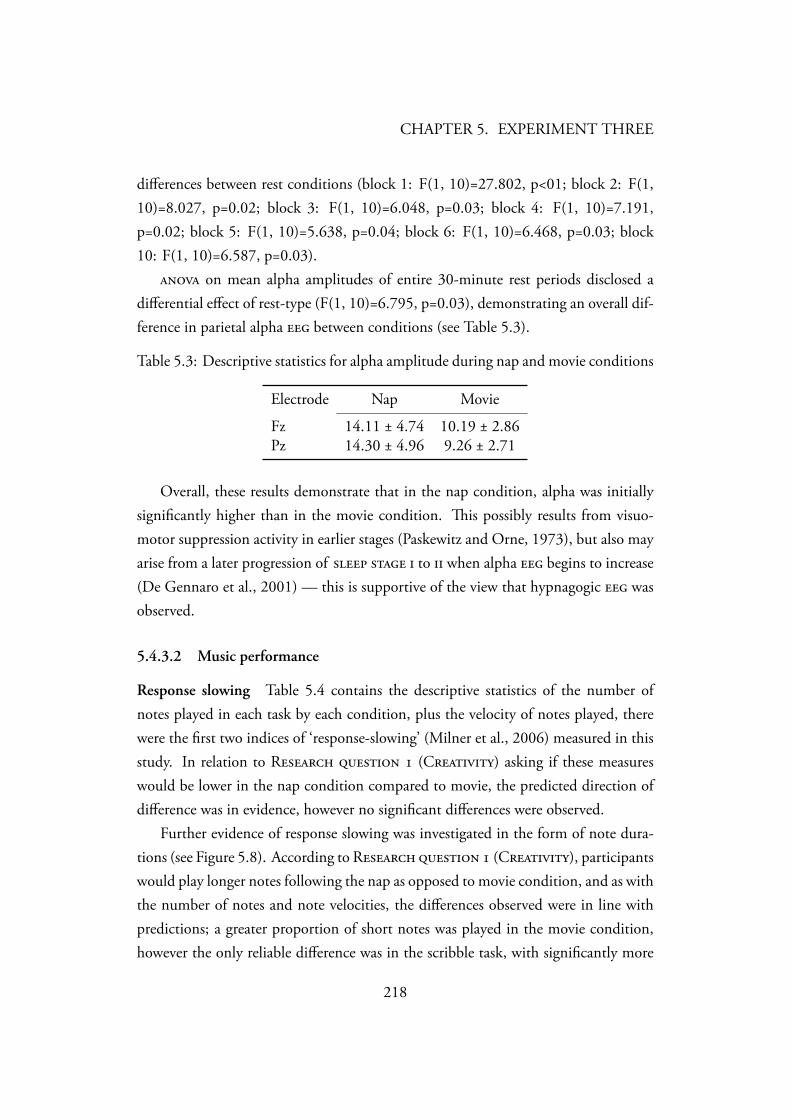
CHAPTER 5. EXPERIMENT THREE
differences between rest conditions (block 1: F(1, 10)=27.802, p<01; block 2: F(1,10)=8.027, p=0.02; block 3: F(1, 10)=6.048, p=0.03; block 4: F(1, 10)=7.191,p=0.02; block 5: F(1, 10)=5.638, p=0.04; block 6: F(1, 10)=6.468, p=0.03; block10: F(1, 10)=6.587, p=0.03).
on mean alpha amplitudes of entire 30-minute rest periods disclosed adifferential effect of rest-type (F(1, 10)=6.795, p=0.03), demonstrating an overall dif-ference in parietal alpha between conditions (see Table 5.3).
Table 5.3: Descriptive statistics for alpha amplitude during nap and movie conditions
Electrode Nap Movie
Fz 14.11 ± 4.74 10.19 ± 2.86Pz 14.30 ± 4.96 9.26 ± 2.71
Overall, these results demonstrate that in the nap condition, alpha was initiallysignificantly higher than in the movie condition. is possibly results from visuo-motor suppression activity in earlier stages (Paskewitz and Orne, 1973), but also mayarise from a later progression of to when alpha begins to increase(De Gennaro et al., 2001) — this is supportive of the view that hypnagogic wasobserved.
5.4.3.2 Music performance
Response slowing Table 5.4 contains the descriptive statistics of the number ofnotes played in each task by each condition, plus the velocity of notes played, therewere the first two indices of ‘response-slowing’ (Milner et al., 2006) measured in thisstudy. In relation to R (C) asking if these measureswould be lower in the nap condition compared to movie, the predicted direction ofdifference was in evidence, however no significant differences were observed.
Further evidence of response slowing was investigated in the form of note dura-tions (see Figure 5.8). According to R (C), participantswould play longer notes following the nap as opposed to movie condition, and as withthe number of notes and note velocities, the differences observed were in line withpredictions; a greater proportion of short notes was played in the movie condition,however the only reliable difference was in the scribble task, with significantly more
218
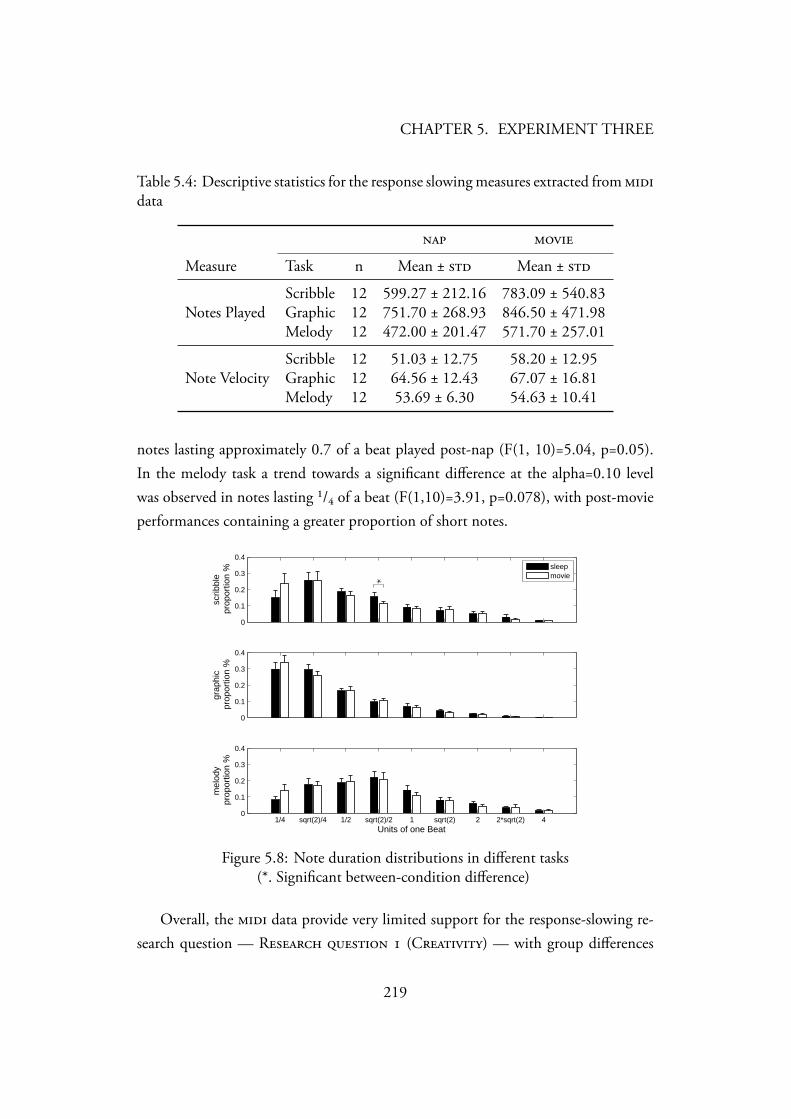
CHAPTER 5. EXPERIMENT THREE
Table 5.4: Descriptive statistics for the response slowing measures extracted from data
Measure Task n Mean ± Mean ±
Notes PlayedScribble 12 599.27 ± 212.16 783.09 ± 540.83Graphic 12 751.70 ± 268.93 846.50 ± 471.98Melody 12 472.00 ± 201.47 571.70 ± 257.01
Note VelocityScribble 12 51.03 ± 12.75 58.20 ± 12.95Graphic 12 64.56 ± 12.43 67.07 ± 16.81Melody 12 53.69 ± 6.30 54.63 ± 10.41
notes lasting approximately 0.7 of a beat played post-nap (F(1, 10)=5.04, p=0.05).In the melody task a trend towards a significant difference at the alpha=0.10 levelwas observed in notes lasting ¹/₄ of a beat (F(1,10)=3.91, p=0.078), with post-movieperformances containing a greater proportion of short notes.
0
0.1
0.2
0.3
0.4
scrib
ble
pro
port
ion
%
sleepmovie
0
0.1
0.2
0.3
0.4
grap
hic
pro
port
ion
%
1/4 sqrt(2)/4 1/2 sqrt(2)/2 1 sqrt(2) 2 2*sqrt(2) 40
0.1
0.2
0.3
0.4
mel
ody
pro
port
ion
%
Units of one Beat
Figure 5.8: Note duration distributions in different tasks(*. Significant between-condition difference)
Overall, the data provide very limited support for the response-slowing re-search question — R (C) — with group differences
219
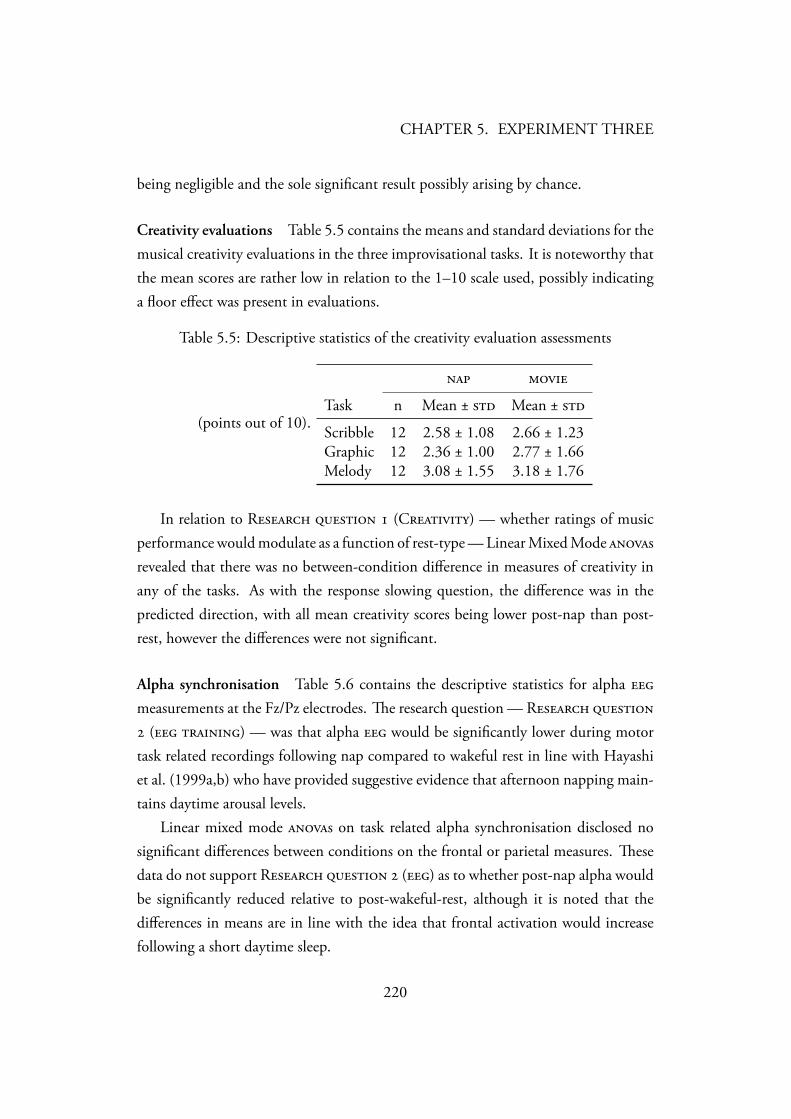
CHAPTER 5. EXPERIMENT THREE
being negligible and the sole significant result possibly arising by chance.
Creativity evaluations Table 5.5 contains the means and standard deviations for themusical creativity evaluations in the three improvisational tasks. It is noteworthy thatthe mean scores are rather low in relation to the 1–10 scale used, possibly indicatinga floor effect was present in evaluations.
Table 5.5: Descriptive statistics of the creativity evaluation assessments
(points out of 10).
Task n Mean ± Mean ±
Scribble 12 2.58 ± 1.08 2.66 ± 1.23Graphic 12 2.36 ± 1.00 2.77 ± 1.66Melody 12 3.08 ± 1.55 3.18 ± 1.76
In relation to R (C) — whether ratings of musicperformance would modulate as a function of rest-type — Linear Mixed Mode srevealed that there was no between-condition difference in measures of creativity inany of the tasks. As with the response slowing question, the difference was in thepredicted direction, with all mean creativity scores being lower post-nap than post-rest, however the differences were not significant.
Alpha synchronisation Table 5.6 contains the descriptive statistics for alpha measurements at the Fz/Pz electrodes. e research question — R ( ) — was that alpha would be significantly lower during motortask related recordings following nap compared to wakeful rest in line with Hayashiet al. (1999a,b) who have provided suggestive evidence that afternoon napping main-tains daytime arousal levels.
Linear mixed mode s on task related alpha synchronisation disclosed nosignificant differences between conditions on the frontal or parietal measures. esedata do not support R () as to whether post-nap alpha wouldbe significantly reduced relative to post-wakeful-rest, although it is noted that thedifferences in means are in line with the idea that frontal activation would increasefollowing a short daytime sleep.
220
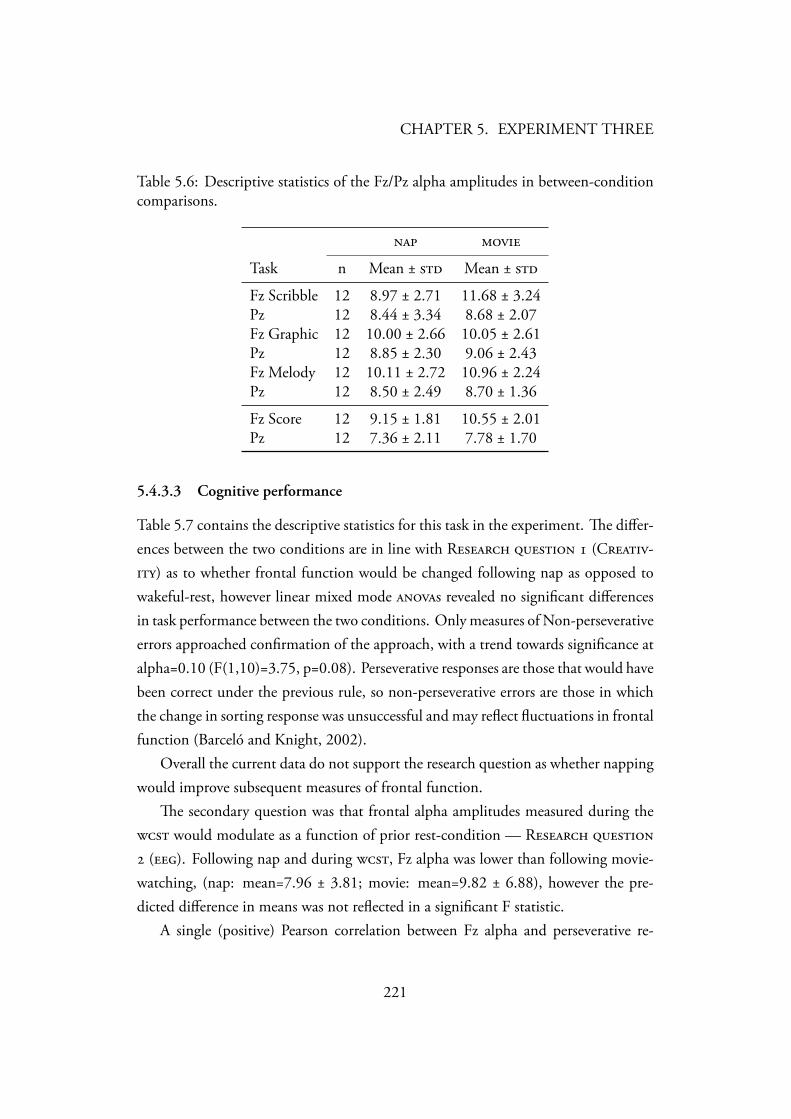
CHAPTER 5. EXPERIMENT THREE
Table 5.6: Descriptive statistics of the Fz/Pz alpha amplitudes in between-conditioncomparisons.
Task n Mean ± Mean ±
Fz Scribble 12 8.97 ± 2.71 11.68 ± 3.24Pz 12 8.44 ± 3.34 8.68 ± 2.07Fz Graphic 12 10.00 ± 2.66 10.05 ± 2.61Pz 12 8.85 ± 2.30 9.06 ± 2.43Fz Melody 12 10.11 ± 2.72 10.96 ± 2.24Pz 12 8.50 ± 2.49 8.70 ± 1.36
Fz Score 12 9.15 ± 1.81 10.55 ± 2.01Pz 12 7.36 ± 2.11 7.78 ± 1.70
5.4.3.3 Cognitive performance
Table 5.7 contains the descriptive statistics for this task in the experiment. e differ-ences between the two conditions are in line with R (C-) as to whether frontal function would be changed following nap as opposed towakeful-rest, however linear mixed mode s revealed no significant differencesin task performance between the two conditions. Only measures of Non-perseverativeerrors approached confirmation of the approach, with a trend towards significance atalpha=0.10 (F(1,10)=3.75, p=0.08). Perseverative responses are those that would havebeen correct under the previous rule, so non-perseverative errors are those in whichthe change in sorting response was unsuccessful and may reflect fluctuations in frontalfunction (Barceló and Knight, 2002).
Overall the current data do not support the research question as whether nappingwould improve subsequent measures of frontal function.
e secondary question was that frontal alpha amplitudes measured during the would modulate as a function of prior rest-condition — R (). Following nap and during , Fz alpha was lower than following movie-watching, (nap: mean=7.96 ± 3.81; movie: mean=9.82 ± 6.88), however the pre-dicted difference in means was not reflected in a significant F statistic.
A single (positive) Pearson correlation between Fz alpha and perseverative re-
221
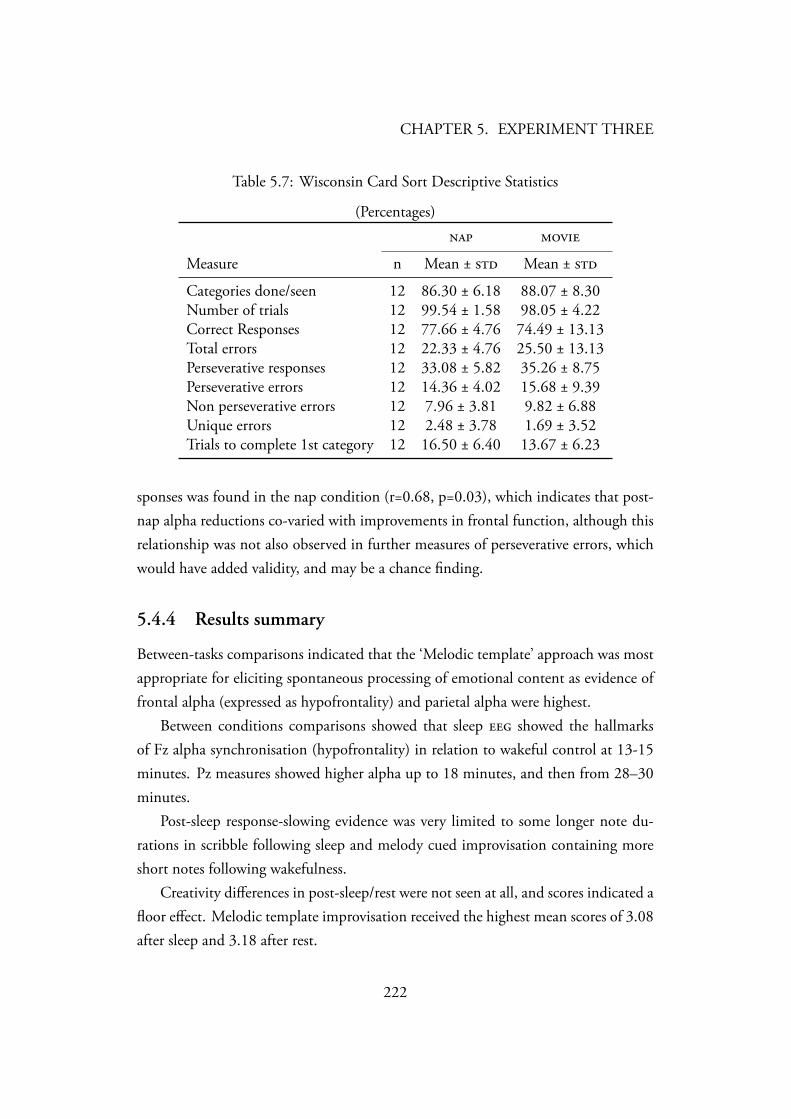
CHAPTER 5. EXPERIMENT THREE
Table 5.7: Wisconsin Card Sort Descriptive Statistics
(Percentages)
Measure n Mean ± Mean ±
Categories done/seen 12 86.30 ± 6.18 88.07 ± 8.30Number of trials 12 99.54 ± 1.58 98.05 ± 4.22Correct Responses 12 77.66 ± 4.76 74.49 ± 13.13Total errors 12 22.33 ± 4.76 25.50 ± 13.13Perseverative responses 12 33.08 ± 5.82 35.26 ± 8.75Perseverative errors 12 14.36 ± 4.02 15.68 ± 9.39Non perseverative errors 12 7.96 ± 3.81 9.82 ± 6.88Unique errors 12 2.48 ± 3.78 1.69 ± 3.52Trials to complete 1st category 12 16.50 ± 6.40 13.67 ± 6.23
sponses was found in the nap condition (r=0.68, p=0.03), which indicates that post-nap alpha reductions co-varied with improvements in frontal function, although thisrelationship was not also observed in further measures of perseverative errors, whichwould have added validity, and may be a chance finding.
5.4.4 Results summary
Between-tasks comparisons indicated that the ‘Melodic template’ approach was mostappropriate for eliciting spontaneous processing of emotional content as evidence offrontal alpha (expressed as hypofrontality) and parietal alpha were highest.
Between conditions comparisons showed that sleep showed the hallmarksof Fz alpha synchronisation (hypofrontality) in relation to wakeful control at 13-15minutes. Pz measures showed higher alpha up to 18 minutes, and then from 28–30minutes.
Post-sleep response-slowing evidence was very limited to some longer note du-rations in scribble following sleep and melody cued improvisation containing moreshort notes following wakefulness.
Creativity differences in post-sleep/rest were not seen at all, and scores indicated afloor effect. Melodic template improvisation received the highest mean scores of 3.08after sleep and 3.18 after rest.
222
CHAPTER 5. EXPERIMENT THREE
Evidence for post-sleep frontal-cognitive improvements and alpha reduction werelimited to a single correlation positively linking alpha to perseverative responses.
is study failed to support the first aim of the research: to link evidence of spon-taneous processing of emotional content — expressed as hypofrontality in this study– to social perception of creative worth. Frustratingly, differences across all measures,including the brain/social measures of creativity, were in the direction anticipated bythe research questions, but only a very small amount were distinctively so.
5.5 Discussion
Demographic considerations In their discussion of the difference in neural mech-anisms observed in a study of improvisation in musicians from a non-improvisingEuropean classical tradition (Bengtsson et al., 2007) and their own study of jazz im-provisers, Limb and Braun (2008) attributed these differences in part to demograph-ics. It was pointed out that the jazz musicians had finely developed improvisationalskills, whereas Creech et al. (2008) observed that musicians in the European traditionregarded the ability to improvise as the least important musical skill.
In relation to this, the novelty of the music tasks in this study was likely to havebeen greater for the classical musician participants in the current study, and that senseof novelty may have undermined the attempt of this study to elicit spontaneous pro-cessing of emotional content.
Whilst Limb and Braun (2008) attributed observed deactivation in the Dorsolat-eral prefrontal cortex () in jazz musicians to transient hypofrontality (Dietrich,2003) – and this can also be interpreted as spontaneous reflexiveness arising from im-provisational skill (Dietrich, 2004b) – the processing of novel information activatesprocess in the (Kishiyama et al., 2009).
A comment made by one of the participants has some relevance to the discussionof task novelty and creative performance. During the post-experiment debrief, whereit was explained that spontaneous processing of emotional content was being explored,the participant who has been a church organist commented that the ‘melodic tem-plate’ task (see Section 5.2.4) was the one in which he’d “ … felt most able to playcreatively.” is observation is interesting in the light of Dietrich’s (2004b) and Limband Braun’s (2008) that prior improvisation skill is a precondition for a kind of spon-
223
CHAPTER 5. EXPERIMENT THREE
taneous processing being explored, furthermore the data bore this out too, with thistask receiving the highest creativity scores in the audience response.
Between tasks comparisons e between-tasks comparisons revealed some support-ing evidence for the transient hypofrontality hypothesis (Dietrich, 2003). It wasfound that alpha synchronisation at Fz was higher during the melody task than duringrendition of both a standard score and a graphic score.
Alpha synchronisation during the ‘scribble’ task was not significantly differentfrom any of the above. e reasons for these differences and similarities might beattributable to the design of the experiment: the melody task possibly provided themost scope for the pianists to use top-down inhibition of prefrontal cortex and as-sociated executive functions; it began with the playing of a 2-bar musical phrase, inwhich the tonal constraints imposed on the rest of the task were set, however beyondthis point the pianists could activate internalised pitch sequences stored at a lowerlevel of processing (Dietrich, 2004a). e graphic score and score tasks on the otherhand required the pianists to monitor their performance and to map sensory informa-tion into motor responses, requiring attentional control and top-down activation andmonitoring of motor responses during the task. e scribble task ostensibly providedscope for hypofrontality by freeing the pianists of all idiomatic constraints (Stevens,1985), however eight of the twelve participants performed tonal music, which sug-gests they combined some selective behaviour in deciding how to interpret the taskand establishing a template, with some reflexive playing as in the template task.
Taken together the performance task results reply to R (I- ) suggesting that in a largely classically trained population,the melodic template means of disclosing spontaneous processing of emotional con-tent is most appropriate and most closely uses their reflexive skills.
e measures of Fz alpha amplitude suggest that the melodically cued improvi-sation contains more hypofrontality, and that this is a neural characteristic of musiccreation behaviour. is finding complements the fMRI results of Limb and Braun(2008), which reported deactivation of the during jazz-blues free accompani-ment in comparison to rendition of a pre-learned piano solo.
Although R (C) is mainly examined in relation tohypofrontality, parietal (Pz) alpha synchronisation — recorded in line with the alpha-
224
CHAPTER 5. EXPERIMENT THREE
theta method — was also explored in relation to two recent studies documentingparietal inhibitory activity in creative behaviour amongst performance artists (Finket al., 2009; Berkowitz and Ansari, 2010).
As with Fz measures, Pz results showed that the melody task featured greater alphasynchronisation in relation to the score task, providing a preliminary answer to R- H which considers the similaritybetween the two states.
e improvisation/score Pz difference was additionally observed during renditionof the graphic score. Considering that the melody task featured increased alpha atboth electrodes, this invites the question “where is inhibition originating?” In theintroduction to the study two candidate sources of cortical alpha were considered: (a)an idling process in some cortical areas to optimise energy demands when underlyingneuronal populations are more active (Pfurtscheller and Lopes da Silva, 1999); (b)intracortical inhibition in which irrelevant or potentially interfering parts of neuralnetworks are closed off (Klimesch, 1996). In the case of the melody task, the corticalidling explanation may apply, whereby motor sequences stored at a lower level of pro-cessing are respondent, for example in the so-called ‘muscle memory’ phenomenon.Again however, this is where the limitations of the current study begin to show, as thelack of spatial coverage precludes the investigation of cortical and sub-cortical activitybeyond the two sites showing inhibition.
e fact that the graphic score task included significantly more parietal but notfrontal alpha might be interpreted as a form of parietal inhibition when stimulusdriven attention is suppressed in order to retain feed-forward motor sequences inworking memory Pressing (1988). Despite this, the graphic score task would be ex-pected to activate visual processing pathways in parietal areas as the score was pre-sented as a computer screen animation. is in turn suggests that parietal inhibitionof the type implicated in Fink et al. (2009); Berkowitz and Ansari (2010) would notbe present in the current study. A possible resolution to this discrepancy may lie in thefinding of Gevins et al. (1997) who reported practice dependent increases of poste-rior alpha power during working memory tasks; in this case habituation to the graphicscore may underlie alpha amplitude increases relative to those in the score task. A lim-itation of the current study here is that whilst the graphic score task featured evidenceof parietal inhibition, this preliminary analysis did not include a measure of commu-
225
CHAPTER 5. EXPERIMENT THREE
nication between neurons at Fz and Pz, which could have tested for evidence thatfrontal neurons regulate posterior ones as part of a network. Sauseng et al. (2005a,b)has demonstrated that frontal neurons modulate the excitability of the parietal cor-tex via alpha phase coupling during both working memory and attention tasks, andBerkowitz and Ansari (2010) suggested that the may down-regulate the primaryvisual areas during music improvisation, so further investigation is required if thesource of inhibition is to be identified.
Overall the Pz results provided some support for the question that parietal brainareas are inhibited during creative behaviour, although the two improvisation studiescompared here both implicated right-hemisphere inhibition to a greater extent, andthe current study lacked analysis of lateralised activity.
Turning now to the creativity evaluations, the analysis did not reveal any signif-icant differences between the perceived creativity of improvisations, and the meanscores were found to be close to the floor level, (the maximum creativity rating was6). Amabile (1982) stresses that evaluations should be given relative to the sample,in which case the most creative piece(s) in the experiment should be awarded scoresapproaching the ceiling level, however in practice this would require the judgementof music performances to be conducted according to a ranking exercise. Despite this,reliable differences would have emerged if they existed, and so whilst R - (I ) was addressed in terms of physiology, it wasnot validated against social perception and this undermines the aim of mapping per-sonal processes to social ones.
Between conditions comparisons e second element of this study was to exploresleep-offset effects on music performance, in part to ascertain whether post-nap response-slowing might impair impact subsequent behavioural and perceived measures of musicperformance.
is addressed R (C) in terms of the immediateafter-effects of hypnagogia, and was conducted in relation to the findings of Chap-ter 4, in which transient effects of alpha-theta physiology were interpreted as beingdetrimental of performance. e current study was then conducted specifically todetermine whether post-nap physiology may affect performance substantively.
e comparison between nap and wakeful rest did confirm that measures
226
CHAPTER 5. EXPERIMENT THREE
of frontal alpha were significantly different, both at specific points in the recording(1–3 and 22–24 minutes) and in whole recording contrasts. Whilst the early dif-ference may have been attributable to visuomotor factors which enhance alpha-thetaas a function of the eye lenses adjusting to darkness (Paskewitz and Orne, 1973),the difference at 22–24 minutes is possibly reflective of a progression beyond (De Gennaro et al., 2001), and furthermore provides some evidence of non-visuomotor hypofrontality during a 30-minute period of sleep opportunity, which isalso consistent with Muzur et al.’s (2002) contention that hypofrontality is a featureof sleep.
Despite the generalised indications of sleep related hypofrontality in the sample,post-napping measures did not confirm the response-slowing hypothesis in the vastmajority of motor measures drawn. e number and velocity of notes played follow-ing napping were, on average, lower than after wakeful rest, whilst the distributionsof note durations included less shorter notes, and in the scribble task significantlymore notes lasting approximately 70% of a beat. Overall however no clear differenceemerged, and the same was true of the creativity comparisons: lower means follow-ing nap, but not substantively so. e lack of clear separation between conditionsmay possibly be due to one of two factors: the amount of sleep, and the effect ofmovie-watching. As stated previously, the current study utilised non-standard analy-sis of napping, and did not measure the amount or staging of sleep for participants,the correlational analysis went some way towards addressing individual differences innapping, and the negative relationship between nap Fz alpha and note velocities inthe scribble and melodic-template tasks indicates that an analysis based more closelyon sleep parameters might come closer to disclosing post-nap response slowing. eeffect of movie watching on the participants could also be considered as a possiblefactor confounding hypofrontality between conditions, since deactivation of the pre-frontal cortex has been associated with reduced self-awareness during movie watchingin an fMRI study (Hasson et al., 2004), although in this study participants were madeaware they would be given a comprehension test after the movie, and so it is likelythey would have maintained some degree of self-monitoring, and thus prefrontal ac-tivation, in order to monitor the storage of the plotline.
e subsequent analysis of frontal alpha between-conditions showed no significantdifferences, possibly for the reasons outlined above, although it is notable that alpha
227
CHAPTER 5. EXPERIMENT THREE
was higher following sleep in the graphic score whilst all other comparisons were inline with predictions. Similarly, the comparisons of post-nap performance on the showed non-significant differences that were in line with predictions, and asingle (positive) correlation was found between perseverative behaviour and alpha,which provides very limited, and possibly chance support for the association betweenpost-nap alpha and cognitive performance. Due to the focus of the current studyon cognition associated with frontal brain areas, cognitive tests of creativity were notincluded in this study, however some recent sleep research has indicated that sleepmay additionally enhance performance on creative problem solving tasks seen priorto and solved following a period of sleep (Cai et al., 2009), as well as evidence ofcorrelations between components of sleep and subsequent divergent thinkingperformance.
Conclusion In conclusion, and with respect to future studies designed to modulatemusic creation behaviours, or to explore their neural correlates, the use of melodic-templates for improvisation offers the experimenter both the opportunity to observehypofrontality in relation to R (I )as well as exploring parietal inhibition in R H and finding parietal inhibition in improvisation as with hypnagogia.
Music created during hypofrontality was not reliably connected to the social per-ception of creativity however — and the assessment technique did not distinguish anyperformances as being distinctively creative.
e comparison between nap and movie conditions was very limited in the scopeof its conclusions: there was however some very tentative evidence suggesting thatthere might be dissociated post-nap reductions in motor performance and improve-ments in cognitive performance, relating to R (C) bysuggesting that transiently, hypnagogia aids cognitive performance but hinders themotor response.
228
6Conclusions
6.1 Research aims
6.1.1 Primary aims
Exploring creativity by attempting to quantify and modulate it e overall aim ofthe research was to gain a greater understanding of creativity by defining it in a waythat could be realised in neuroscientific studies.
Furthermore, and using an applied neuroscience approach, the research aimed tomodulate the working definition of creativity.
Realising these two broad aims in practice gave three smaller aims:
1. Define creativity in an experimentally tractable way Define creativity in away that addresses the tensions in psychology and cognitive neuroscience about howto make it experimentally tractable.
2. Regulate creativity via hypnagogia To use applied neuroscience to modulatehypnagogia — and in so doing reinforce physiologies underlying spontaneous creativeinsight.
3. Disclose creativity through improvisation To explore the application andcognitive neuroscience of music improvisation as a candidate scenario for measuringcreativity.
229
CHAPTER 6. CONCLUSIONS
6.1.2 Secondary aims
Optimise novice performance e possibility of optimising sensory-motor skill reg-ulation in novice musicians was explored.
Replicate and re-focus Egner and Gruzelier (2003) Replication of the first studyassociating with creativity was a starting point from which to advance the currentmethodology.
6.2 Research questions
e aims translated as the following questions for use in practice
6.2.1 List of research questions
6.2.1.1 . C
Can measures of creativity be modulated by hypnagogia and alpha-theta ?
6.2.1.2 .
Can alpha-theta be shown to regulate hypnagogic electrophysiology? Addition-ally, and in relation to R , can training be shown to regulatesensorimotor activity?
6.2.1.3 . N
Can measures relating to sensory-motor control in novice performance be elevated byreinforcement of sensory-motor inhibitory control via ?
6.2.1.4 . E
Can changes in be associated with changes in performance?
230
CHAPTER 6. CONCLUSIONS
6.2.1.5 . H
As candidate neurophysiologies thought to disclose the spontaneous processing ofemotional content, can these states be shown to address the transient hypofrontalityhypothesis (Dietrich, 2003) using applied neuroscience methods?
6.2.1.6 . I
Does the operational definition of improvisation as spontaneous processing of emo-tional content work in distinction from other types of performance — as a candidatefor disclosing creativity in the brain and eliciting a social response that validates cre-ative judgement, which forms of improvisation are most useful to the experimenter.
6.2.1.7 . I E G ()
Are relevant earlier reports replicable?
6.3 Review of aims and questions
6.3.0.8 Aim 1. Define creativity in an experimentally tractable way
e tensions in the psychology and neuroscience literature were considered in the lightof ongoing difficulties in finding creativity in the brain. Psychometric tests of creativethinking were thought to pose a ‘Criterion problem’ in that they encompass somebehaviours that contribute to some creativity, but not creativity itself. Extensive cog-nitive neuroscience studies profiled tests of ‘Divergent thinking’, but taken togetherwere not able to show underlying patterns of activity leading to calls for the tests tobe replaced with more basic measures of creativity (Dietrich, 2004a). One of the pro-posed basic types, ‘Spontaneous processing of emotional content’ has been reportedhistorically in the form of hypnagogic insight and discussed in research concerningmusic creation.
Prior to current neuroscientific interest in the creative process, commentators hadaddressed the criterion problem by emphasising the importance of social and culturalselection in defining creativity according to subjective and implicitly held values.
231
CHAPTER 6. CONCLUSIONS
is dissertation attempts to resolve these two areas of investigation by using neu-roscience to profile spontaneous processing of emotional content, and social psychol-ogy to explore whether the outcome in society has any definable relationship with thepersonal process from which it originated.
6.3.0.9 Aim 2. Regulate creativity via hypnagogia
Hypnagogia is classically thought to give rise to spontaneous creative insight. Alpha-theta is designed to regulate hypnagogia, and so as well as profiling neural activityunderlying improvisation, is used to try and modulate that self-same activity withthe aim of reinforcing creative neurophysiology.
6.3.0.10 Aim 3. Disclose creativity through improvisation
In realising the implications of the literature review leading to in Aim 1, music impro-visation was selected as a plausible candidate for disclosing the process of spontaneousmusic creation, which in turn is characterised as being formed of emotional content(Dietrich, 2004a).
Furthermore, improvisation can also disclose a socially subjective and implicitlyheld view of creativity in audiences (Amabile, 1982).
is combination of tractable personal and social features appears to make impro-visation ideal as a means of reveal creativity in the brain and society in parallel, andin so doing address Aim 1.
6.3.1 Answers to research questions
6.3.1.1 . C
Can measures of creativity be modulated by hypnagogia and alpha-theta ?e underlying assumption of the whole dissertation is that hypnagogic neuro-
physiology is a correlate of creative neurophysiology, and so by attempting to regulateand condition the former with applied neuroscience, the latter might be brought un-der experimental control.
Experiment 1 provided the first controlled evidence of post- differences inspontaneous performance. e Stripsody task disclosed a difference in perceived mea-
232
CHAPTER 6. CONCLUSIONS
sures of ‘Confidence’ rather than a measure more closely identified with creativity suchas ‘Interpretative imagination’ in (Egner and Gruzelier, 2003). e results appearedto advantage those receiving alpha-theta in comparison to or no trainingcontrols, but were not distinguished in post-hoc analysis.
e difference in variance suggests that alpha-theta interacted with a task elicitingspontaneous creative behaviour: Stripsody. e benefit was seen in a category notclosely identified with creativity: Communication. Despite this, Confidence, plustwo further communication measures that showed a trend for difference — ‘Emo-tional commitment’ and ‘Deportment’ — might facilitate spontaneous processing ofemotional content, as confidence instils increased options for performing. Examplesof this include Kurtzberg and Amabile’s (2001) association of self-confidence and risk-taking as antecedents to creative behaviour, and Tierney and Farmer (2002) who notethat confidence gives rise to the adoption of non-conforming perspectives.
Confidence is also an interesting variable in the context of stage fright, which isknown to manifest in reduced confidence (Brotons, 1994), and so given the threatof evaluation in Experiments 1 & 2 (in which cameras were training on participants,and cameras have been found to impair performance on tests of divergent thinking(Chamorro-Premuzic and Reichenbacher, 2008)), it is of interest that confidence mayhave been optimised following alpha-theta . Raymond et al. (2005b) too associ-ated alpha-theta with increases in self-reported confidence, and so this outcomecan be interpreted in the light of confidence impairments in other experimental groupsthat did not manifest in alpha-theta participants. Nonetheless, the absence of effectmediation data — confidence changes did not co-vary with alpha-theta changeshowever, and so it is not possible to attribute the change to neurophysiology basedchange.
e role of Stripsody, as a graphic score, is also interesting in the light of outcomesseen in Chapter 5 in examining task-related measures of a different graphic score.Unlike its predecessors, Experiment 3 measured during graphic score response,and showed that parietal alpha activity was different to that recorded during musicalscore performance. is finding shows that in the absence of relations between alpha-theta dynamics and Stripsody, a graphic score in piano performance nonetheless dis-tinguished parietal alpha from a standard performance. In summary, the interactionbetween , graphic score and the social perception of performer confidence suggests
233
CHAPTER 6. CONCLUSIONS
that the use of graphic scores may continue to have a role in eliciting distinct neu-rophysiology as part of the search for creativity in the brain. Other studies of music(Berkowitz and Ansari, 2010) and imagined dance (Fink et al., 2009) improvisationhave found lateralised deactivation in parietal areas, and so the inclusion of graphicscore tasks does appear to constitute a means of exploring parietal activity underlyingspontaneous performance.
Experiment 2 introduced the possibility that in the short-term, alpha-theta canimpair spontaneous processing of emotional content. Post alpha-theta changes werealmost all negative, and significantly different from those in the first cohort on mea-sures of Stripsody and Instrumental solo performance. and control group perfor-mance appeared undiminished in the second round, and ‘Clarity of diction’ in folksinging suggested trainees were distinguished by their improvement. Literatureon motor performance, cognitive performance and sleep indicated that whilst daytimesleep benefited cognitive performance including attention (Lovato et al., 2009; Lovatoand Lack, 2010), it impaired motor function in non-habitual daytime sleepers (Milneret al., 2006). is indicates that whilst alpha-theta might reinforce neurophysiologyunderlying spontaneous processing more generally, it may not be appropriate as ameans of priming motor function for spontaneous emotional processing.
Experiment 3 further examined the short term effects of hypnagogia on motorand cognitive function implicated in spontaneous creativity. Limited evidence wasfound to sustain the view developed in Experiment 2, that daytime sleep may ben-efit cognition, yet impair motor function. A response slowing measure found thatafter sleep, the scribble task contained more long notes, and the melodic templatetask contained less short notes than wakeful rest. Evidence of frontal cognitive rein-forcement was limited to a single, and potentially chance correlation between alphaand perserverative responses in a cognitive flexibility task. Perceived creativity scoresshowed no effects, and appeared to suffer from floor effects.
If post-hypnagogia did transiently impair spontaneous processing of emotionalcontent, this would invite the question as to how the long-term reinforcement ofneurophysiology for spontaneous processing is achieved via alpha-theta . isquestion remains unanswered, although having conducted an experiment in whichtask related has been recorded in a way that is comparable with — thestage as been set for combined alpha-theta and music improvisation data to be com-
234
CHAPTER 6. CONCLUSIONS
pared.
6.3.1.2 .
Can alpha-theta be shown to regulate hypnagogic electrophysiology? Addition-ally, and in relation to R , can training be shown to regulatesensorimotor activity?
Alpha theta training Experiment 1 provided marginal evidence of within-sessiondifferences in the ratio of theta to alpha at Pz — this served as the experimentalmeasure of crossover, that is the degree to which theta raised over and above alpha intraining.
Experiment 2 provided strong evidence of within- and across-session effects onthe training ratio. Furthermore these measures interacted, and the within-sessionratio increased with each session.
Overall, the alpha-theta protocol provided the best evidence that a spectral (asopposed to sleep scoring) representation of hypnagogia can be reinforced in practice.
e question remains however whether the changes resulted from volitional con-trols acquired as a result of training, or another phenomenon such as progressive re-laxation. e alpha-theta literature from the turn of the 21 century is relevant inthis respect: Lowe (1999), Moore et al. (2000) and Boynton (2001) all reported thatalpha-theta did not elevate the t/a ratio any more than other forms of relaxation.Nonetheless, hypnagogia, expressed as (Tanaka et al., 1996), falls awaywhen the t/a ratio stops increasing in (De Gennaro et al., 2001). It wasobserved in Experiment 2 that the t/a ratio began to fall during the final 3 minutesof a typical 15 minute session, and so whilst the evidence is supportive of the viewthat hypnagogia occurred, may have also occurred — and the extent towhich the protocol sustained the borderline state in comparison with an alternativerelaxation intervention is unknown.
Sterman (1996) argued that the alpha-theta protocol sustained hypnagogia be-cause the audio feedback cues hypnagogia simply by preventing a subject from goingto sleep, rather than by reinforcing a distinct state. Despite this strong criticism, Eg-ner et al.’s (2002) found that the final 6 of 15 minutes of alpha-theta compared
235
CHAPTER 6. CONCLUSIONS
to pre-recorded playback of an alpha-theta session disclosed higher t/a ratios, chal-lenging Sterman’s (1996) proposal, which suggests that mock feedback would elicitthe same t/a ratio as contingent feedback.
e other interesting thing about alpha-theta training in the current review isthe difference in training outcomes between Experiments 1 & 2. e first cohort oftrainees produced t/a ratios roughly equivalent to those in Egner and Gruzelier (2003),differentiating ratios on within-session measures of period. e second experimentshowed reliable changes in the t/a ratio in each of the three indices of training. Spec-ulatively, this is perhaps attributable to the fact that a slightly more private traininglocation was used, less experimenters were present, and the feedback was deliveredthrough headphones rather than computer speakers, shielding the participant fromthe sounds of the experimenter making adjustments to the feedback thresholds usinga computer keyboard.
In the absence of controls — recorded from a relaxation alternative shamalternative condition for example — it is not clear that hypnagogia was reinforced by. By extension, the analysis of covariance between and music changes couldhave made a stronger case for mediated performance changes.
training In training, only Experiment 2 was shown to raise the trainingratio of in relation to theta and beta at Cz, but only in the within-sessionmeasure.
e training data showed a far less reliable pattern of change than alpha-theta.Only Experiment 2 disclosed a reliable difference between periods within-session. In-terestingly, the actual gains in amplitude were very small, suggesting that in healthysubjects, the scope for moderating in relation to both theta and beta frequencieswas limited using the protocol applied.
Other studies demonstrating training in healthy subjects do not generallyreport the training ratio in this way: most similarly, Vernon et al. (2003) comparedindividual blocks of Cz to theta and beta separately — and was able to demon-strate changes between certain epochs; Ros et al. (2009) used a median split to contrastthose able to significantly raise /theta ratios to those unable to do so; Hoedlmoseret al. (2008) compared C3 amplitudes between sessions 2-4 and 8-10.
Given the variety of ways that related studies which reported data have anal-
236
CHAPTER 6. CONCLUSIONS
ysed this type of training, it is difficult to contrast the training data with other labs’findings. Despite this, it is clear that in relation to the available data, other studieshave clearly shown that can be progressively raised in healthy participants, whilstthe current approach showed this only to a limited extent in Experiment 2. It is notknown why the protocol appeared to be sub-optimal at moderating the targeted re-lationship, but it appears that participants found it difficult to map the feedback toself-regulated parameters in a way they could control.
6.3.1.3 . N
Can measures relating to sensory-motor control in novice performance be elevated byreinforcement of sensory-motor inhibitory control via ?
A secondary question explored in Experiments 1 & 2 was that mightmodulate novice performance. e rationale for this was that sensory-motor integra-tion might be optimised following a series of studies demonstrating protocol relatedgains for healthy subjects in attention (Egner and Gruzelier, 2004b), memory (Vernonet al., 2003), perceptuo-motor skill acquisition (Ros et al., 2009) and sleep/learning(Hoedlmoser et al., 2008).
Furthermore, and in relation to optimal performance (Loomis et al., 1938) andclinical (Sterman and Friar, 1972) literature, the context for understanding pre-viously described performance gains stemmed from the idea that in optimisation forhealthy subjects, performance impairments under conditions of load might be miti-gated.
In the context of performing arts, stage fright and the threat of evaluation, symp-tomised by over-arousal in fine motor control for example (Brotons, 1994), is an ap-propriate candidate for exploring the idea of optimised motor neurophysiology.e early work of Sterman and Friar (1972) in conditioning the inhibitory responsein sensory motor cortex and mitigating the symptoms of epilepsy was considered as acandidate mechanism by which over-arousal during stage fright might be managed.
Highly experienced performers are considered able to turn stage fright to theiradvantage (Kokotsaki and Davidson, 2003; Vuust et al., 2010), possibly through con-ditioning their performance skills to states of high arousal, and so novice performersmay be more susceptible to stage fright under the threat of evaluation.
237
CHAPTER 6. CONCLUSIONS
Experiments 1 & 2 contained a Folk song task selected specifically in an attemptto disclose any protocol effects in novice singing, with a particular emphasis on rein-forcing inhibitory control
Stage fright induced over arousal is also known to effect emotions in performance,such as the loss of confidence (Brotons, 1994), and it was additionally consideredwhether the proposed parallel between hypnagogia and spontaneous processing ofemotional content might be interact with alpha-theta via reinforcement of spon-taneous emotional processing against stage fright. Again, and since all participants inExperiments 1 & 2 were non-singers, the task is performed at the novice level, andallowed the novice performance question to be asked of alpha-theta too.
In Experiment 1’s post-intervention performances of the Stripsody task, Confi-dence disclosed significant group differences, without post-hoc distinction betweengroups however. Additionally, ‘Overall vocal competence’ and Pitch scores co-variedwith within-session training ratio changes.
e parallel between Brotons’s (1994) description of lost confidence in stage fright,and Experiment 1’s suggestion that confidence varied between group means invitesthe the possibility that emotional processing may have been interacted with hypna-gogia reinforcement. Confidence did not however co-vary with t/a changes, so themediation of this finding is not known, and the likelihood that it occurred by chanceis considerable due to its being one of many variables measured. In Experiment 2,Stripsody did not reveal any group differences, and this was attributed to the signif-icant drop in performance outcomes in Experiments 2 compared to its predecessor— these score reductions particularly affected the Stripsody performance measures ofcommitment and confidence indicating that the threat of evaluation was not miti-gated in Experiment 2.
Within-session t/a ratio changes predicted the slight falls in the ‘At one with voice’measure and ‘Overall Musicality’ co-varied with across-session training measures.Neither of these relations are explicitly identifiable with the symptoms stage fright,precluding a clear argument for optimisation.
Turning now to the ‘Folk song’ task, Experiment 1 revealed group differences inevaluations of Pitch, although without supporting post-hoc disclosure. Pitch changesco-varied with longitudinal changes in alpha-theta training . e ability to pitcha vocal performance during stage fright is considered a potential area in which
238
CHAPTER 6. CONCLUSIONS
might plausibly moderate the motor response, so the fact that changes in this measureco-varied with alpha-theta training precludes relating to the novice framework in use.
e same task in Experiment 2 revealed that the change in ‘Expressive range’ wassignificant between groups, although without post-hoc confirmation. Again, an artis-tic interpretative as opposed to technical variable shows a possible optimisation effect,but an isolated one that does not relate to the stage fright symptoms being considered.
6.3.1.4 . E
Can changes in be associated with changes in performance?As stated previously, measuring in the control group would have enabled
stronger claims to be made regarding the electrophysiological mediation of outcomes.As it was Experiments 1 & 2 used within-subject relations only to analyse the covari-ance of and music performance.
In summary:Experiment 1 found that in Folk singing, ‘Overall Musical Understanding,’ ‘In-
terpretative imagination’ and ‘Stylistic accuracy’ all co-varied with the within-session training ratio. No other relations were observed.
Experiment 2 found no relations between Instrumental solo and Folk singing and training ratios. In Stripsody, within-session changes predicted pre-training‘Overall musicality’ and ‘Confidence’ measures, plus post-training ‘Overall commu-nication,’ and a marginal extent, post-training ‘Breathing’ and ‘Emotional commit-ment.’ Improvisation results showed within-session t/a ratio changes predicted de-clining performance scores in ‘Overall Improvisational Competence,’ ‘Fluency’ and‘Overall Communicative Ability.’
As with music and training measures, the covariance analyses differed consider-ably between Experiments 1 & 2. is too may be attributable to the differences ofexperimental design that saw post- performances taking place immediately fol-lowing the final session, introducing transient effects of training into the study.It may also be the case that the relations observed in Experiment 1 were not reliableenough to be replicable.
Some of the observed relations did address the overriding questions about the rela-tionship between and performance optimisation in Experiment 1, relating train-
239
CHAPTER 6. CONCLUSIONS
ing to Musicality measures only however. is may fit the idea that moderatesarousal in novice performance and mitigates stage fright, but this was not replicatedin Experiment 2 however, undermining this interpretation. Furthermore, within-session did not change the training ratio decisively in Experiment 1, whichit did in Experiment 2, and given that Experiment 2 participants did not appearto suffer post-training performance impairments, it might plausibly be expected thatthe relation with novice performance would replicate in Experiment 2, which itdidn’t. is indicates that observed changes might not be reliable.
It’s interesting that although training changes to were more clearly demon-strated in Experiment 2, fewer musical changes co-varied with , which again seemscounter to the view that mediates music performance, transient effects notwith-standing.
In the replication of Egner and Gruzelier (2003), the alpha-theta training corre-lations with music changes observed in their first experiment were not found to bereplicable in their second, and neither were they replicable in the current analysis.
Taken together, the case for effect mediation is weak — unlike Sterman and Friar’s(1972) finding that training mitigated symptoms of epilepsy, the idea thatregulating dynamics in might for example condition that same dynamic inmusic performance has not been reliably observed.
6.3.1.5 . H
As candidate neurophysiologies thought to disclose the spontaneous processing ofemotional content, can these states be shown to address the transient hypofrontalityhypothesis (Dietrich, 2003) using applied neuroscience methods?
Having run into severe doubts over the relation between hypnagogic and mu-sic performance, the next step was to collect music performance and examine itfor commonalities with sleep-onset. is was approached from the theoretical angleof the ‘Transient hypofrontality hypothesis’ (Dietrich, 2003) which predicts that allaltered states share frontal hypofunction in common. ese states include sleep andmusic improvisation, and given that Limb and Braun (2008) discovered supportingevidence in jazz-blues 12-bar improvisation, and Muzur et al. (2002) described ex-ecutive deficiencies brought on in sleep onset, an study examining both states
240
CHAPTER 6. CONCLUSIONS
together was conceived.e same experiment additionally adopted an empirical approach, and explored
parietal in keeping with the alpha-theta protocol, which records at the lo-cation where alpha in eyes closed wakefulness is most distinct (Niedermeyer, 2005).Interestingly recent studies of spontaneity in performance art have found alpha (Finket al., 2009) and deactivation (Berkowitz and Ansari, 2010) in parietal lateralareas by differentiating expert performers. is invites the possibility that parietalalpha-theta training may regulate parietal alpha in a way that contributes to spon-taneity in creative behaviour. e current study sought to explore this possibility,although did not differentiate analysis based on musical expertise.
Experiment 3 compared 30-minutes of eyes-closed daytime rest/sleep to eyes-openrest (watching a Charlie Chaplin film). It also compared improvisation to rendition.
Between conditions comparisons showed that sleep-onset had more hypofrontal-ity (Fz alpha) in relation to wakefulness at 13-15 minutes. Pz measures showed higheralpha from 0–18 minutes, and then from 28–30 minutes.
Muzur et al.’s (2002) analyses of sleep-onset suggest that hypnagogia ( ) occurred alongside hypofrontality at 13–15 minutes, and this is in agreement withthe t/a ratio data in Experiments 1 & 2 that indicated (using different measures) occurring at this point in time.
In parallel, improvisation, particularly the ‘Melodic template’ approach, also demon-strated both hypofrontality and parietal alpha relative to score rendition.
ese were among the more promising results of the dissertation, supporting the‘Transient hypofrontality hypothesis’ and the recent empirical data indicating the roleof parietal deactivation in both sleep-onset and improvisation. is approach haslent some support to the idea that alpha-theta , in attempts to reinforce sleep-onset physiology, might simultaneously be conditioning cortical processes underlyingimprovisation. Whether the application works as effectively as in Sterman and Friar’s(1972) management of epilepsy symptoms remains to be seen however.
6.3.1.6 . I
Does improvisation — the spontaneous processing of emotional content — work indistinction from non-improvised performance? As a candidate for disclosing creativity
241
CHAPTER 6. CONCLUSIONS
in the brain and eliciting a social response that validates creative judgement, whichforms of improvisation are most useful to the experimenter?
Experiment 1 introduced the role of improvisation into the methodology for test-ing the historical association between alpha-theta and creativity (Green et al., 1972).It also provided suggestive evidence of a link between and improvements in theaudience perception of ‘Confidence’ in alpha-theta trainees, which was interpreted asan emotional optimisation against stage fright.
If the alpha-theta/Stripsody interaction can be shown to hold in replication, thenthe idea that Stripsody is creativity — the audience perception of creativity in spon-taneous emotional processing — can be sustained.
Experiments 1 & 2 also considered another type of improvisation, descriptivecues, e.g. ‘A walk in the woods.’ is tasks tended provided no evidence that impro-visation is creativity, and provoked such a variety of responses from the varied choiceof cues that the audience may not have been able to readily compare performances.
Being able to compare is of course important for experimentation, and the Strip-sody task, with its combination of stimuli that remain comparable over time, butwhich also provide room for difference in interpretation, does afford spontaneity overand above that which might be done in a rendition of a normal musical score, whereinterpretational differences are limited within the confines of music theory.
e methodological implications of using different improvisation methods tomake creativity tractable were further explored in Experiment 3, which looked at 3types of improvisation, each with a different way of limiting the musical bounds ofvariation. e outcome was what the most familiar task, that of ‘Melodic variation’on a short score, provided the highest scores of perceived creativity, although not dis-tinctively so. is task also most clearly elicited the neural patterns identified withcreativity, hypofrontality and parietal deactivation.
e role of melodic cues for improvisation were interpreted in the light of (Di-etrich, 2004b), who conceptualised jazz-improvisation as a sequence of pre-existingphrases that reflexively trigger each other with minimal interference from meta-cognition— which might only be needed to count bars or intervene to stop playing. e use ofa melodic template in this context can then be seen as as task that triggers musicians’pre-existing musical patterns, whereas the other tasks recruited high-level interpreta-tions on an ongoing basis to monitor the task in relation to the brief. is is not
242
CHAPTER 6. CONCLUSIONS
to say that non-melodic improvisation cannot invoke spontaneity in musicians, butin the non-improvising European tradition from which all but one participant came,melody provides the most direct route to reflexive play.
e question of music tradition was also discussed by Limb and Braun (2008),who thus far has provided the best case for transient hypofrontality — attributingthis in part to the fact that the Jazz-blues musicians in that study had finely developedimprovisational skills which could extemporise quite naturally from a 12-bar bluesmotif, and in so doing down-regulate higher order cognition.
Overall, the introduction of improvisation into the methodology appears tohave been fruitful, and as such is worthy of further exploration, particularly given thatthe same measures used in alpha-theta can demonstrate neural differencesbetween improvisation and other forms of music performance.
6.3.1.7 . I E G ()
Are relevant earlier reports replicable?Egner and Gruzelier (2003) was comprised of two studies, and Experiment 1 repli-
cated the latter of the two. Experiment 1 replicated the within-subjects improvementsin alpha-theta participants in ‘Overall quality,’ ‘Stylistic accuracy,’ ‘Musicality’ andmarginally ‘Interpretative imagination.’ Experiment 2 found that all Instrumentalsolo scores went down after alpha-theta .
Although Experiment 1 replicated prior alpha-theta outcomes, it is noteworthythat it did so having seen alpha-theta participants start at a distinctly lower baselineevaluation than counterparts in and control protocols. is was not the case inEgner and Gruzelier (2003), in which baseline audience ratings showed equivalence.
ere is no data in (Egner and Gruzelier, 2003), although based on an as-sociated report (Egner and Gruzelier, 2004a) in which alpha-theta was found toelicit significant within-session t/a ratio changes, the current study showed marginallysignificant agreement.
Intriguingly Keizer et al. (2010a) claimed to have unsuccessfully attempted toreplicate Egner and Gruzelier (2003), although they did not report the findings, andconfirmed via correspondence that they had only tested theta (finding no effects)without measuring music performance outcomes.
243
CHAPTER 6. CONCLUSIONS
Taken together then, none of the above studies conclusively replicated the first and music study.
6.4 Limitations and Future Directions
6.4.1 Strengths
e main strengths of the dissertation are in its addressing of R , . e most important, R . D was not addressed closely enough.
e design of Experiment 1 might have been able to answer R if the apparent benefits of alpha-theta in Stripsody performance were controlledin an active way, such as in the use of alternative relaxation therapies (Lowe, 1999;Moore et al., 2000; Boynton, 2001). Experiment 2 introduced the consideration thattransient alpha-theta effects on creativity might be negative, forcing the questionto be re-conceptualised in the light of conflicting cognitive and motor processing.
R was addressed with some strength. e data was able todemonstrate targeted t/a changes in data, particularly in Experiment 2, whichshowed consistent changes across all measures. e lack of control data holds backthe claim that this change emanates from however. Alpha-theta and data inExperiments 1 & 2 respectively showed within-session changes.
R saw Experiment 3 providing evidence of relative frontalalpha synchronisation in both daytime napping and melodically cued improvisation.is added evidence to the claim that transient hypofrontality underlies many alteredstates of consciousness by effectively limiting the policing role of conscious awarenessin managing attention and working memory (Dietrich, 2003).
R saw Experiments 1 & 3 both being able to address thequestion about whether improvisation constitutes creativity in a lab setting. e roleof Stripsody in disclosing group differences was interpreted as a differentiation thatrested on the role of confidence in spontaneous performance, reinforced against stagefright by alpha-theta training. Experiment 3 provided suggestive evidence that melod-ically cued improvisation was perceived by an audience as more creative than othertypes which were less closely associated with reflexive spontaneous processing. is
244
CHAPTER 6. CONCLUSIONS
difference was not reliable however, although alongside evidence of hypofrontality inmelodically cued improvisation, it does appear that improvisation has a methodolog-ical role that deserves further consideration in the field of creativity.
6.4.2 Weaknesses
6.4.2.1 Defining creativity
It has been said that: “To most neuroscientists, the prospect of looking for creativity inthe brain must seem like trying to nail jelly to the wall. — Dietrich and Kanso (2010)”e evasiveness of creativity, the lack of advance awareness of spontaneous insight, andthe conceptual difficulties in trying to explore it from a reductionist standpoint hasresulted in a collection of neuroscientific data that “precludes interpretation — Ardenet al. (2010).”
Prior to the current wave of creativity neuroscience, the problem of measurementwas approached from a relatively holistic perspective that inferred creativity in ret-rospect, that is, once something has implicitly held to be creative in relation to itsenvironment. is selection proceeds without ever explicitly saying how creativity isdefined other than it is selected from a randomly assembled choice of offerings (Si-monton, 2003) or that it is selected according values that aren’t guided by aestheticand technical considerations (Amabile, 1982).
In an attempt to resolve the previous approaches, this dissertation proposed thatby examining a basic type of creativity: ‘Spontaneous processing of emotional content’(Dietrich, 2004a) using cognitive and applied neuroscience methods, and then by ex-amining outcomes in the retrospective way detailed by (Amabile, 1982), it could thendetermine whether a common ground might be established. is was approached byusing improvisation as the method of observation, rather than tests of ‘Divergentthinking’ which had resulted in the mess of data discussed previously.
In some ways this worked, Experiment 3 found some parallel between improvisa-tional and audience response, but not in a reliable sense. In other ways, the ideathat creativity is tractable as spontaneous processing of emotional content was shownto be a concept that might be yet further distinguished into motor and non-motorresponses. Experiment 2 introduced the possibility that motor processes involved increativity may have different requirements than cognitive ones — especially in the
245
CHAPTER 6. CONCLUSIONS
context of sleep, which by down-regulating higher-order cognition can provide morescope for spontaneous combinations to be represented, but can also down-regulatemotor function and as a result reflexive interplay (‘muscle memory’) in sensory-motorintegration.
is definitional approach then invites questions about spontaneous processing,and whether this might further be isolated to motor specific production (Brennan,1982) in future work.
Despite misgivings over the extent of concept reduction, improvisation does ap-pear to be fit for purpose as a means of eliciting spontaneous processing of emotionalcontent. e application of Amabile’s (1982) consensual assessment technique ingaining retrospective accounts of creativity was sub-optimal in the present studiesthough. Factor distinction between creative, aesthetic and technical measures wasprecluded by the amount of data.
In order to fully test this combined definition that encompasses neural and so-cial indices of creativity, a large study capable of factor analysis should be attempted(n=100 (MacCallum et al., 1999)). Considering that participants typically at-tend 10-12 appointments, this constitutes a large-scale undertaking, although singlesession studies ( e.g. Ros et al. (2010)) may provide a way around this — not thatsingle-session alpha-theta training is advised for optimising motor performance giventhe results of Experiment 2. e best way forward from here then is to mount a studylike Experiment 3, on a larger scale.
Another important issue when thinking about further investigation of improvisa-tion creativity is this advice. Use expertise, either in the sense of profiling musicianswith finely honed sensory-motor integration (Haueisen and Knösche, 2001), so thatthe musical response is reflexive, or perhaps better still, do not profile musicians fromthe European classical tradition who tend to shun improvisation. Instead, Jazz musi-cians for example, have already developed their improvisational skills (Creech et al.,2008) and may be better able to exhibit reflexiveness in an experimental setting (Limband Braun, 2008).
6.4.2.2 Guidance for experimenters
246
CHAPTER 6. CONCLUSIONS
Control for musical biography Although the profiling of Jazz musicians is one pos-sible way of advancing the methodology, variations exist within all musical traditions,so controlling for the amount of improvisational expertise, skill acquired, music the-ory limitations applied and of course for instrument may help to isolate the role ofimprovisation in disclosing spontaneous processing of emotional content.
Statistical power A limitation of the first two studies is the small number of partic-ipants, which when considered alongside the small estimated effect size of previoussignificant reports (.02 - .25 in Egner and Gruzelier (2003)), resulted in underpow-ered studies. e research questions were largely rejected, and the possibility existsthat these may have been false negatives.
Other experimenters are recommended to raise statistical power to a level of 0.8by increasing the sample size to a minimum of 14 per group in a three-group study.
e third study showed differences in comparisons of all the music taskalpha measures, plus paired comparisons. Large effect sizes were observed in bothfrontal and parietal electrode sites when focussing on the melody− score difference,and other experimenters are recommended to follow this line of investigation using agroup size of 12 or more.
Variability of training timetable As is a common problem in neurofeedback stud-ies, the first and second studies were both characterised by variation in attendancepatterns that did not control for time of day or inter-session delay for example. De-spite using relative measures to adjust for spectra-wide power changes, it wasfound that measures of within-session (collapsed across sessions) provided morerobust estimates of ‘learning’ than did across sessions comparisons. e latter indexwas also possibly compromised by the amount of training sessions held, and only ledto marginally significant changes in training parameters. is is also a feature ofother studies conducting 10 training sessions, and according to linear predictions, justone additional training session may have been able to consolidate learning differences.
Controlling for naturally occurring changes e design of experiments oneand two did not include measurements of controls. is means it’s not possible todetermine whether the changes described in the active groups may have occurred any-
247
CHAPTER 6. CONCLUSIONS
way. Had the non-active controls had their measurements taken during the courseof the studies, changes in the active groups could have been compared against these topartial out non training related changes. Similarly, had participants received an activecontrol such as cognitive sleep onset regulation (Haimov and Shatil, 2013) againstalpha-theta, or attention training games (Gevensleben et al., 2009b) against - the of this control could have been compared against that of to determine theefficacy of the intervention against alternatives. Another control for might havebeen a placebo in which non-contingent feedback is administered to replicate the par-ticipation scenario without physiological cues. Equipped with such controls, theinterpretation of effects in the first two studies could have been conducted againstalternative measures rather than within-subjects training/performance covariance.
Controlling for sleep habits e third study did not document the napping habitsof participants, and given that one of its hypotheses was based on evidence suggestingthat non-habitual daytime sleepers maintain alertness less effectively after daytimesleep, this information could have been used as a covariate in analysis, possibly helpingto distinguish the effects of sleep-offset with more precision. is study also did nottake account of individual differences in sleep stages experienced, which also may havebeen able to differentiate the post-nap performances to a greater extent.
Overall, the recommendations for future research as are follows:
• Further attempts to isolate the interaction between alpha-theta and cre-ativity should continue to use improvisation as the first experiment suggestedthat improvised performance may interact with neurofeedback.
• Further attempts to identify the mediator(s) of alpha-theta effects on creativityshould employ task-related measures, either at the electrode site(s) used in, or at sites hypothesised to interact with training neurons, or, if equipmentallows: whole scalp . Additionally, parallels may be sought between task and by capturing whole scalp of training. Furthermore, additional measures such as phase coherence could be used if evidence of network activityis being investigated.
• e surprise findings concerning transient effects of protocols suggests thatshort-term effects are worthy of further investigation in their own right, due to
248
CHAPTER 6. CONCLUSIONS
their apparent distinction from longitudinal applications.
• To control for changes during , by measuring the of control par-ticipants during the intervention stage of trials. An alternative or placebointervention could be administered to controls - enabling measurement of thecomparative efficacy of in regulating .
• e use of piano improvisation specifically has some merits that deserve consid-eration. Firstly, this constraint imposes experimental control on instrumentalvariation (the first two studies incorporated instruments of several types: per-cussion, piano, wind and string; and this may have affected comparability).Secondly, piano affords the additional capture of data that can be used toanalyse the musical properties of performance using quantitative methods. Itis worth pointing out that many of the musicological techniques for analysingperformance are based on monophonic music, and so it is worthwhile incor-porating monophonic tasks depending on the experimental hypotheses.
6.5 Final Conclusions
is thesis incorporates a series of studies which further distinguished the interplaybetween hypnagogia, and creativity through increasing protocol specificity of ef-fects on spontaneously created music, differentiating between short- and long-termeffects of alpha-theta , and demonstrating the applicability of electrophysiologicalmeasures of improvisation into the research methodology.
249
AClinical applications of the Alpha-eta
protocol
During the same period that Kamiya (1962) began to investigate alpha discrimina-tion and training, high amplitude measurements of alpha were being found in studiesexamining altered states of consciousness in meditating yogis (Anand et al., 1961;Wenger and Bagchi, 1961), and Zen masters (Kasamatsu and Hirai, 1966). In addi-tion to alpha, theta activity (4–8Hz) was observed during meditation by Green et al.(1970), who noted that following an initial rise and fall of alpha amplitude, thetaactivity increased to the point of ‘crossover,’ where it became more powerful. etransition between alpha and theta signal dominance is one of a set of phenomenathat occur during the wake-sleep transition, collectively referred to as the hypnagogicstate (Schacter, 1976) or . is transient period is also characterised byqualitative changes in mental content (Tanaka et al., 1996) and reductions in mus-cle tone (leading to the sensation of falling that causes the hypnagogic jerk), andGreen sought to use neurofeedback to increase volitional control of this state. Analpha-theta protocol was developed (Green et al., 1974), whereby both oscillationswere monitored, and Green reported that the point of crossover was aligned to sub-jective reports of profound relaxation and reverie. Green stressed that whereas the changes produced are similar to , the subjects were maintained in arelaxed yet focused condition, subjectively similar to a hypnotic trance with reverie.
Goslinga (1975) was first to test alpha-theta feedback as part of a larger courseof treatment for alcoholics at the Topeka Veterans Affairs Medical Center, a clinic for
250
APPENDIX A. CLINICAL APPLICATIONS OF THE ALPHA-THETAPROTOCOL
recovering armed forces personnel. e clinic specialises in biofeedback treatments,and in this study alpha-theta neurofeedback was provided along with electromyo-gram () and temperature control biofeedback, and the 12-step alcohol recoveryprogram used by Alcoholics Anonymous. e neurofeedback treatment consisted ofdaily 20-minute sessions over a period of 6 weeks. Patients were brought together ingroups to discuss their insights and experiences associated with biofeedback severaltimes a week. e outcome from group discussions was that participants reportedbeing more able to create free, loose associations, and experienced heightened sensi-tivity and increased suggestibility. is study was not controlled, and by combiningneurofeedback with other treatments, it was not therefore possible to isolate any pro-tocol specific effects. However, as an anecdotal report, it did provide scope for furtherexploration.
e next study of alpha-theta training took place at the same veterans medicalcentre. Twemlow and Bowen (1976) explored the impact of alpha-theta training in67 chronic male alcoholic inpatients. In this non-controlled study, the examinationof psychodynamic factors that ‘religiousness’ as a predictor of ‘self-actualization’ mayhave increased as a result of imagery experienced during periods of dominant thetasynchronisation. In line with the emphasis on faith within the 12-step program, theauthors concluded that alpha-theta biofeedback served to augment the motivationalgoals of the recovery program. Shortly afterwards the same first author published apaper in which he indicated that appealed to the high suggestibility of his morereligious patients; “treatments such as brainwave training, which utilize abstract, illunderstood techniques are potential repositories of magical projection and fantasy andwould logically be more acceptable to alcoholics who are able to have ‘faith’ (devoutlyor moderately religious)” (Twemlow and Bowen, 1977). In a further uncontrolledstudy by the same author, it was reported that 21 alcoholics exhibited within andacross session increases in the amplitude of occipital theta oscillations. is was in-terpreted as an manifestation of the ability to achieve an increasingly deeper stateof relaxation (Twemlow et al., 1977). Taken together, these four initial studies ad-vanced the possibility that neurofeedback might have an application in promotinginsight and attitude change that could enhance a period of recovery from alcoholaddiction. eir anecdotal nature and the lack of experimental control in these stud-ies preclude their ability to attribute the reported psychodynamic or changes to
251
APPENDIX A. CLINICAL APPLICATIONS OF THE ALPHA-THETAPROTOCOL
alpha-theta exclusively, and their publication occurred at a time when the activeresearch of neurofeedback in general was going into decline. However, these earlystudies did establish a possible new application of neurofeedback, and preceded thefirst randomised controlled trials of alpha-theta by over 10 years.
Alongside the relatively new alpha-theta protocol, the more established alphatraining procedure was also being examined as a possible form of treatment for al-coholism (Passini et al., 1977; Watson et al., 1978). In line with the arousal model ofalpha synchronisation, the authors hypothesised that the high anxiety accompanyingalcohol withdrawal might be offset by down-regulating arousal with alpha as areplacement for the anxiety relieving effects of ethanol. 50 male alcoholics who hadbeen hospitalised for their condition and were without any other psychiatric or neu-rological conditions were assigned to age-matched groups of alpha (n = 25) or ano- training control group (n = 25). Each group was tested before and after the inter-vention on subjective measures of anxiety (the State/Trait Anxiety Inventory (),(Spielberger et al., 1983)), the Multiple Affect Adjectives Check List () (Zuck-erman et al., 1965), the Brief Psychiatric Rating Scale () (Overall et al., 1962),the Minnesota Multiphasic Personality Inventory () (Hathaway and McKinley,1940), the Anhedonia Scale (Watson, 1972), and the Sensation Seeking Scales ()(Zuckerman, 1971). e authors set out to establish whether the changes in self-report data might correlate with changes in resting alpha measured before and af-ter the experiment, with resting eyes-closed/open measures of alpha synchronisationacross scalp locations. Alpha change was analysed in terms of the percentage of timealpha amplitude was higher than a baseline level. e training group received during 10 hour-long sessions, over the course of 12 days. During training, partici-pants relaxed with their eyes closed whilst alpha measurements were recorded fromoccipital sites dependent on handedness (O1 in right-handers, O2 in left-handers¹). feedback was auditory, and was presented when alpha amplitude was raised abovebaseline measures from the start of the session.
e authors reported a significant between groups difference in percentage oftime post intervention alpha exceeded baseline thresholds. In the eyes-closed con-dition, training subjects increased time above baseline alpha from 38–55%, and from20–32% in the eyes-open condition. e control group did not exhibit significant
¹e international 10–20 scalp location sites are listed in Appendix G
252
APPENDIX A. CLINICAL APPLICATIONS OF THE ALPHA-THETAPROTOCOL
changes. Effects on the self-ratings were seen on anxiety only (Spielberger’s ); theexperimental group significantly reduced their subjective scores of both state and traitanxiety, with no reported changes amongst controls. However, the authors drew at-tention to the lack of correlation between the changes in resting alpha and state/traitanxiety, concluding that a placebo effect on reported anxiety change could not bediscounted. A further concern relating to the placebo effect in particular was thatexperimental participants had a far greater amount of experimenter contact than didthe controls, whose inclusion was mainly to correct for test-retest and time dependentchanges in the population. e higher level of contact time between experimentersand participants may then have raised the expectation of a treatment effect in thepatients, leading to the reported reduction in anxiety. is concern is however par-tially offset however, as expectation effects might have also led to improved scoreson the other self-report measures used in the trial, which was not the case. e ef-fect of placebo is thought to attenuate over time, with the actual duration rangingfrom 8 weeks (Coryell and Noyes, 1988) to 2.5 years (Traut and Passarelli, 1957),and so the authors carried out a follow up study 18 months later in order to deter-mine the persistency of anxiety reductions (Watson et al., 1978). ey interviewed46 of the original 50 participants, and collected further self-report assessments on thedependent measures used in the initial study. e Alcohol Rehabilitation Follow-upQuestionnaire ( (Pucel, 1972). e authors found that differences between thealpha training and control groups in reported state and trait anxiety were “essentiallyidentical” to those immediately following the initial study. is result was signifi-cant for two reasons, firstly it suggested that the placebo effect was not responsiblefor the initial anxiety reductions as its power would be expected to have dwindledin the intervening 18 months, and that being the case it was reasonable to assumethat the long-term anxiety reductions were attributable to alpha training. e resultsof the newly included follow-up questionnaire did not show a significant betweengroups difference on 12 of 13 comparisons; the exception being that the alpha train-ing group had longer abstinence periods (248 days in comparison to 142 amongstcontrols). e authors interpreted this result with caution since 1 change in 13 mightarise by chance. Nonetheless, the suggestion that abstinence might be greater fol-lowing , coupled with the durable reductions in anxiety indicated that furtherinvestigation was warranted, which eventually happened, eleven years later!
253
APPENDIX A. CLINICAL APPLICATIONS OF THE ALPHA-THETAPROTOCOL
e case for the therapeutic benefits of alpha training on anxiety received furthersupport from Hardt and Kamiya (1978). e design of this study was formulatedin response to Orne and Paskewitz (1974), which challenged the prevailing view thatalpha accompanied pleasant calm. In Orne’s study, high alpha density in the was found to occur simultaneously with state anxiety (being in jeopardy of receivingelectric shock) alongside other autonomic indicators of anxiety (increased heart rateand galvanic skin response). Hardt and Kamiya sought to redress what they proposedto be an imbalance in Orne’s study, from which 12 cases had dropped out due tofear of electrocution. Although Orne had stated that the drop-outs exhibited similarpatterns of resting alpha activity to those that continued with the painful part of theexperiment, the criticism of his experiment was that it effectively excluded those ofa more anxious disposition, and was thereby not a representative population sample.e response by Hardt and Kamiya was to compare both high (n = 8) and low (n = 8)anxiety cases, as measured by the anxiety scale. is sample was drawn from alarger one of 100 male volunteers. e study assessed participants’ responsivenessto alpha . Over 7 days, a daily alpha training session consisted of 8 minutesof resting baseline recording, 32-minutes of alpha-enhancement , a further8 minutes of resting measures, ending with a period of 16 minutes of alpha-suppression . e authors collected self-report anxiety data before and after eachsession, and assessed affect scales prior to each session’s baseline , and afterboth alpha-enhancement and suppression periods. was recorded from OZ,O1, and C3, with null voltage reference electrodes attached to earlobes. fromlocation OZ was used for , and alpha (8 – 13 Hz) amplitude changes were mappedto changes in the volume of the feedback tone. e recordings showed that inthe high-anxiety group alpha measures changed at all sites (OZ, O1, C3), in bothamplitude and percentage of time above baseline levels. e increase in alpha wasinversely related to state anxiety, either when alpha was being trained up or down.e authors also examined the sum of alpha increases across all 10 sessions, andit emerged that the resulting figure was inversely related to trait-anxiety reductionsamongst high-anxiety participants, who were shown to have produced large within-session alpha increases.
Whilst the findings of Orne and Paskewitz (1974) ran contrary to the prevailinghypothesis that there was an inverted-U shaped relationship between alpha and arousal
254
APPENDIX A. CLINICAL APPLICATIONS OF THE ALPHA-THETAPROTOCOL
(Lindsley, 1952; Stennett, 1957), Hardt and Kamiya raised the possibility that Orne’sparticipants possibly came from a low-anxiety population, and thereby would have toincrease arousal to increase alpha, which is what Hardt then observed in low-anxietyparticipants. Hardt’s high-anxiety group on the other hand arguably lowered anxietyto increase alpha, and taken together these findings support the inverse-U shapedalpha-arousal relationship. e contradictions between these studies may nonethelessarise from methodological problems in both experiments. Whilst it might be true thatOrne’s use of electrocution excluded high-anxiety participants, the group selectionprocess used by Hardt may equally be flawed as it was based on solely subjectivereports of state and trait anxiety, which are prone to ‘hindsight perspective’ effectswhere the participant has expectations of the outcome of an experiment (Ross et al.,1977). On balance, the outcome of the 1970’s investigations into the therapeuticapplications of slow-wave for anxiety was equivocal, and over the course of thenext ten years there were no attempts to bring robust experimental control to bear onthis question.
In the first reported randomised controlled trial of alpha-theta , Peniston andKulkosky (1989) strengthened the case for the clinical validity of this protocol bydemonstrating positive long-term outcomes amongst a sample of recovering alco-holics. e subjects were 30 inpatients in an armed forces veterans administrationmedical centre treatment program (Fort Lyon, Colorado). All participants were male,20 of which had chronic alcoholism that had proved resistant to more than 4 previoushospital treatments. e 10 remaining participants were non-alcoholics who were in-cluded in the study for comparison with alcoholics in terms of alpha activity. At theoutset the rationale of the study was informed by the fact that those with a predis-position to alcohol addiction (alcoholics and their descendants) are characterised bya deficiency of alpha activity compared to controls (Funderburk, 1949; Funkhouseret al., 1953), and that this deficiency is redressed by ethanol use (Pollock et al., 1983).It was also known that alcohol withdrawal is accompanied by symptoms of anxi-ety (Roelofs, 1985), so it was hypothesised that the combined alpha deficiency andanxiety in alcoholics might be treatable with alpha training. As well as rationalisingthe use of alpha training, Peniston’s experimental protocol also included theta train-ing, although the justification for doing this was not as well established. e authordrew parallels between the observation of theta in meditation (Anand et al., 1961;
255
APPENDIX A. CLINICAL APPLICATIONS OF THE ALPHA-THETAPROTOCOL
Green et al., 1970) and the use of learning to meditate and long-term abstentionfrom chemical use (Wong, 1981). Surprisingly, the author appeared to be unaware ofthe alpha-theta studies of the 1970’s (Goslinga, 1975; Twemlow and Bowen, 1976,1977), although the similarities between the methods used are striking.
Experimental participants were divided into three groups: an alpha-theta al-coholic group (n=10), a talk therapy alcoholic group (n=10) and a non-alcoholic con-trol group (n=10). e subjects completed 15 30-minute sessions of eyes closedoccipital (O1) alpha-theta . In addition to , the first 8 sessions of alpha-thetatraining were preceded by a hand temperature biofeedback exercise in self-warmingthat was speculated to stimulate the transition towards a ‘theta state’ (Hall, 1977). Asan additional further step prior to , participants received specific guidance as towhat they should do. ey were instructed to close their eyes and “construct visualizedabstinence/alcohol rejection scenes, and imageries of increased alpha rhythm ampli-tude and scenes of the normalization of their personalities,” and then to “sink-down”towards a “theta (reverie) state keeping the mind quiet and alert (but not active), andthe body calm.” After having given the instructions, the experimenter would leavethe participant alone resting in a comfortable chair for the remainder of the session.e subject would hear feedback tones when alpha amplitude exceeded a pre-trainingbase-rate, and a different tone when theta amplitude was no less than basal alpha−10microvolts.
e talk therapy alcoholic control group attended daily talk sessions normallyoffered at the medical centre, whilst the non-alcoholic controls were measured ondependent variables during the pre/post intervention assessments.
Both prior to and following the intervention all participants were assessed on threetypes of measure: resting , Beck’s Depression Inventory () (Beck and Steer,1984), and vascular beta-endorphin. e recordings were made over 60 minutesat 6 scalp locations (C3, C4, P3, P4, O1, O2). e alpha and theta production wasmeasured by visual inspections carried out by two raters who were blind to theexperimental condition that each was recorded in. e is a self-report scale,and beta-endorphin, an endogenous opioid that increases in blood at times of stress(Naber et al., 1981; Watabe et al., 1987; Kalin and Loevinger, 1983) was measuredin blood samples.
In comparison to the other participants, alcoholics receiving showed signif-
256
APPENDIX A. CLINICAL APPLICATIONS OF THE ALPHA-THETAPROTOCOL
icant overall increases in percentages of recorded in both the alpha and thetarhythms across the scalp, and increased alpha rhythm amplitudes at occipital site pairsP3-O1 and P4-O2. e group exhibited significant reductions in the scorescompared to both other groups, and their depression fell from high initial levels seenin both alcoholic groups to equality with the non-alcoholic group, which had re-mained normally low throughout. Control subjects who received standard treatmentalone showed increased levels of vascular beta-endorphin, which was speculated tostem from stress caused by alcohol withdrawal. e and non-alcoholic group didnot change in levels of blood beta-endorphin.
As in the 1970’s studies testing alpha for recovering alcoholics (Passini et al.,1977; Watson et al., 1978), Peniston also measured the long-term outcomes for partic-ipants in the study in order to determine whether acted as a cure for alcoholism,whilst also probing for the erosion of post-treatment differences that might be ex-pected if they were only governed by placebo effects. Monthly telephone interviewswere conducted over 13 months, and at the end of this period 2 out of 10 par-ticipants had relapsed (drank constantly for a week or more) compared to 8 out of 10alcoholic controls.
Whilst the results of Peniston’s study provide a strong indication that his approachoffers clinical benefits, there are a number of critical issues with the way his researchwas designed and reported that make it hard to say with confidence how the out-comes were mediated. e design of the experiment was such that the experimentaltreatment, which later became known as the Peniston protocol, was comprised ofthree different interventions (1) temperature biofeedback training (2) guided alcoholavoidance imagery, and (3) . Whilst this combined method may be effective initself, it is difficult to measure the extent to which patients derived clinical benefitsfrom any one aspect of the treatment. e authors could have attempted to isolatethe clinical effects of alpha-theta training by correlating shifts in alpha and theta ac-tivity across 15 sessions with changes in resting , as they did measure activityat the same scalp location in training and pre/post assessments. is was not donehowever, and no association between the dependent and independent measureswere reported. e report did not disclose its random selection criteria or describe thecontrol treatment used, which hinder abilities to replicate these results independently.e anticipated lower alpha amplitudes in alcoholics compared to non-alcoholics were
257
APPENDIX A. CLINICAL APPLICATIONS OF THE ALPHA-THETAPROTOCOL
not observed in this study, and the alcoholic groups both exhibited marginally higheralpha amplitudes at baseline. e extremely large increases in the visually detecteddominance of alpha (12-fold) and theta (7-fold) oscillations, plus the doubling ofalpha amplitude at selected electrode pairings were suggested by Graap and Freides(1998) to possibly arise from habituation towards the recording process amongstsubjects receiving . Alpha naturally occurs on eye closure, but may not occur inunfamiliar surroundings because of an orienting or blocking response, related to cog-nitive vigilance. Graap found that amongst participants providing readings theirinitial apprehension would attenuate alpha activity, yet as participants became morefamiliar with the experiment, alpha blocking would reduce, and this was proposed tobe a possible cause of Peniston’s reportedly large increases in alpha. e same mightbe said for theta, as again, greater familiarity with the process of recording mightmake it easier for subjects to relax sufficiently to enter sleep onset and thus producemore theta activity. Peniston’s measure of relapse into alcohol use is also potentiallymisleading as it does not take into the amount of alcohol consumed, only whethersubjects had maintained abstinence for more than 7 days per month, and thereforelacks sensitivity to binge drinking.
Following their first report, (Peniston and Kulkosky, 1990) went on to demon-strate that the experimental participants in their first study also underwent changesin measures of personality compared to controls that were still apparent at a 4 yearfollow up. Prior to and following the first experiment, the authors administered theMillon Clinical Multiaxial Inventory () (Millon, 1983), which is used in screen-ing for personality disorders/pathologies as well as clinical syndromes, including sub-stance dependency. Amongst the experimental treatment group, improvements wereseen in 13 measures: schizoid, avoidant, passive aggression, schitzotypal, borderline,paranoid, anxiety, somatoform, dysthymia, alcohol abuse, psychotic thinking, psy-chotic depression, and psychotic delusion. In comparison, the alcoholics who receivedstandard (undisclosed) therapy showed significant decreases only in two scales,avoidant and psychotic thinking and an increase in one scale — compulsive. eauthors argued that this indicated greater improvements amongst the group receivingthe Peniston protocol in both clinical and personality measures. However, it is inter-esting to note that, at post-test, the alcoholic controls were only significantly differentfrom the experimental participants in two scales, schizoid and avoidant person-
258
APPENDIX A. CLINICAL APPLICATIONS OF THE ALPHA-THETAPROTOCOL
ality. is indicates that the experimental group scored more highly at baseline on anumber of measures. is raises some concern since the authors omitted to mentionthe difference between the alcoholic groups at baseline, only stating that that 8 alco-holic control and 12 experimental group scales were significantly different fromthe non-alcoholic group at baseline. Visual inspection of plotted scores indicates thatall 16 of the 20 scales are higher for the experimental group compared to alcoholiccontrols. is indicates that the (undisclosed) random selection of subjects may nothave resulted in homogeneous alcoholic groups being selected in the study, and un-dermines the assumption of homogeneity of variance integral to parametric statistics.e authors speculated that the personality changes seen in the experimental groupmight be implicated in the long-term abstention from alcohol and normal levels ofvascular beta-endorphins, although this is not supported with evidence of correlationbetween changes in any of the purportedly covarying measures and it remains unclearhow personality changes might be causally related to training. A further criticism ofthis study is that it contrasts the reported clinical benefits in the experimental groupwith the apparently ineffectual standard therapy. Without knowing what the stan-dard therapy consisted of, it is not really possible to say whether strategic comparisonssuch as these are valid, however in a separate study of outcome measures in agroup of alcoholics, conventional 6 week community therapy treatment resulted inimprovements in 14 of 20 scales (McMahon et al., 1985). So had the control treat-ment been more effective, and the control participants equally positioned on clinicalscales at the beginning of the study, the outcome of this study might have been quitedifferent.
Following their reported successes in managing alcohol withdrawal with biofeed-back, Peniston and Kulkosky moved on to test the application of in the treatmentof combat related Post Traumatic Stress Disorder () (Peniston and Kulkosky,1991). Experimental participants were recruited from a population of Vietnam Warveterans, and were divided into two groups, an experimental group receiving the samePeniston protocol as in the previous study (n=15), and a control group receiving an-tidepressant, antipsychotic and anxiolytic medication plus psychotherapy (n=14). etraining group were also receiving medication at the start of the study, however duringthe course of the intervention all but one in each group voluntarily began to reducetheir dosage. Although the training protocol was mostly reused from the previous
259
APPENDIX A. CLINICAL APPLICATIONS OF THE ALPHA-THETAPROTOCOL
experiment, the course of treatment was extended from 15 to 30 sessions, and theguidance given prior to was modified, with alcohol withdrawal scenarios beingreplaced with combat related traumatic memories. e protocol for guiding the con-tent of hypnagogic imagery was given to patients by the medical psychotherapist as follows:
“Now, go back to Vietnam where these traumatic combat events oc-curred.” en, they were instructed to visualize imageries of increasedalpha rhythm amplitude and scenes of the normalization of their per-sonalities. en the instructed the subjects to “sink-down” into atheta state keeping the mind quiet and alert (but not active), and thebody calm. Finally, subjects were instructed by the to initialize thesession with a quiet command: “Do it.”
Prior to and following the experimental stage, all participants completed an questionnaire, and subsequently remained in monthly telephone contact with theexperimenters for 30 months, in order to screen for symptoms of includingflashbacks, panic attacks and nightmares.
In comparing the experimental and control groups’ scores on the the au-thors found a group time interaction effect arising from significant decreases in clin-ical scales amongst the experimental participants. Robust interaction effects coupledwith significant post-hoc analyses of scale reductions and a lower score in the post-test were seen in the experimental group on the following scales: “hypochondriasis”“depression,” “hysteria,” “psychopathic deviate” (Conflict, struggle, anger, respect forsociety’s rules), “masculinity-femininity” (Stereotypical masculine or feminine inter-ests/behaviours), “paranoia,” “psychesthenia” (Worry, Anxiety, tension, doubts, ob-sessiveness). Both groups significantly reduced in reported symptoms of “schizophre-nia,” with the experimental group were significantly lower following the interven-tion. Less robust group differences were seen in measures of “hypomania” and “socialintroversion-extroversion,” although a similar trend was in evidence.
Analysis of the scale demonstrated that whilst both groups were equalat the beginning of the experiment, the group receiving the Peniston protocol treat-ment significantly reduced on this scale, and were significantly lower than the controlgroup post-intervention. e control group marginally reduced in this scale.
260
APPENDIX A. CLINICAL APPLICATIONS OF THE ALPHA-THETAPROTOCOL
e also includes validity measures designed to detect exaggeration or down-playing of psychological symptoms. On the Frequency (exaggeration) scale, the ex-perimental group reduced significantly and were significantly lower post-intervention,and on the Lie scale (down-playing), a group x time interaction was disclosed andstemmed from a slight increase in the experimental group.
e reduction in psychotropic medication that had been started during the exper-iment was reported to have been maintained over the 28-day course of the study inthe experimental group only. 14 of 15 participants in that group had reduced theirdose, whilst 1 of the control group had.
e final measure, follow up telephone interviews carried out over 30 months,disclosed that 3 of 15 experimental participants reported a relapse of symptoms,whilst all 14 controls did.
e clinical outcomes for the patients involved in this study indicate that talktherapy and medication appears to have little benefit for sufferers of . e groupreceiving the Peniston protocol on the other hand reported dramatic improvementsin their condition. e authors observed that during training, some patients expe-rienced a so-called “abreaction,” the re-experience of traumatic memories that hadbeen repressed by guilt and were the underlying cause of their nightmares, flashbacksand anxiety. e authors suggested that these traumatic memories were accessed con-sciously through hypnagogic imagery experienced during theta dominance. Hav-ing identified the key events that underlay their symptoms, patients were then able todiscuss them in a way they previously had not.
As with the application of the Peniston protocol in treating alcohol withdrawal(Peniston and Kulkosky, 1989), the study suffers has some methodological weak-nesses that partly undermine the ability to draw clear conclusions as to whether thereported effects are related. For example, whilst scales are measured prior to andfollowing training, they are not reported as part of the follow up measures. is meansthat it is not possible to clearly identify the long-term reductions in symptomswith the post-intervention reductions in clinical symptoms amongst the experimen-tal participants. Similarly, the results section does not include any data from the30 training sessions, any changes in which could have been compared with clinicalchanges, and could have been used to deflect the assertion that the changes inthe experimental group were mediated by training and not placebo effects that might
261
APPENDIX A. CLINICAL APPLICATIONS OF THE ALPHA-THETAPROTOCOL
be expected in a study that involved a high degree of patient-experimenter contact.Again in relation to the previous study, whilst the authors suggest that the alpha-theta training component of their protocol is instrumental in inducing hypnagogicimageries, and provide anecdotal evidence to support this (presumably gained frompost training session reports), there is no empirical evidence to indicate that abreac-tions occurred during dominant theta oscillations.
Peniston et al. (1993) followed their preceding studies of alcohol recovery andcombat related with a similar study that compared synchrony between elec-trode pairs and component amplitudes in a pre-training measurement and a final session during which abreactive hypnagogic imageries were observed.
ere were 20 participants in this study, all of whom were given the same Penis-ton protocol treatment as reported in the previous two studies. e subjects weredrawn from the population of patients at a veterans clinic, and had both diagnoses ofalcoholism and combat related .
e measures used in this experiment were informed by a previous study byBanquet (1973) which analysed the characteristics of Transcendental Meditation.e meditation study reported increased synchronous activity between anteriorand posterior channels as well as a gradual movement of non-sleep frontal theta intoposterior channels.² In keeping with the proposal that the neuroscientific basis for thetherapeutic effects of alpha-theta , the authors sought to examine training data forevidence of changes in neural activity that might underpin the changes in alcoholuse and symptoms. To this end the study was conducted as a within subjectsanalysis.
In order to explore synchrony, the authors derived their own measure, which ap-peared to be largely determined by the equipment they were using (a four channelCapScan Prism Five). e authors measured from 4 locations (F7, F8, O1, andO2), and adjacent signals were considered synchronous in a given 1-second intervalwhen the largest amplitude component in the spectrum of the first signal occurs atthe same frequency as its counterpart for the second signal, and secondly the -derived phase angles of the two dominant amplitude components lay in the samevector quadrant (i.e., 0–90, 180–270, 270–360). e authors used these measures as
²Frontal theta is the most commonly observed manifestation of this rhythm outside sleep onset,and is correlated with encoding new information in working memory (Klimesch, 1999).
262
APPENDIX A. CLINICAL APPLICATIONS OF THE ALPHA-THETAPROTOCOL
evidence of synchrony defined as the predominance of a single brainwave frequency(from alpha: 9–13Hz, theta: 4–8Hz, or beta: 14–29Hz) throughout several lobes,both hemispheres, or the entire cortex. Additionally the authors compared the av-erage amplitudes of alpha, theta and beta band activity between baseline and finaltraining sessions.
By comparing the 4 possible electrode pairings arising from their method, theauthors reported that observation of synchrony between sites was close to 0% of thetime during a 30-minute baseline measurement. e final training session on theother hand saw all site pairings exhibiting synchrony around 70% of the time, withthe neighbouring occipital channels showing a marginally smaller amount. e re-peated measures s analysis showed a significant main effect of time, howeverthe reported within-groups degrees of freedom reported with the F statistic was 3040,which is incorrect considering that the number of participants was 20, the number ofmeasures was 2 and the number of electrodes was 4. e data appears to have beenanalysed incorrectly, which means that despite the apparently dramatic change in syn-chrony, the reported statistic should be interpreted with severe caution. e authorsconcluded that this finding indicated a whole-cortex distribution of synchronous ac-tivity.
e authors additionally reported significant increases of theta and beta band amplitudes when comparing final training session data to that of the baseline mea-sures, whilst alpha amplitude remained relatively consistent, dropping below that oftheta during the latter observation. It is not clear which electrode(s) the reported dataare from.
e final reported outcome of the study was that of the 26 month follow up,which showed that during the period following treatment relapse occurred in 4of the 20 participants, although alcohol use is not reported here.
e methodological flaws in this study do not add credibility to the previous worksof Peniston and Kulkosky. A major criticism of this uncontrolled study is that it basesit’s conclusions regarding synchrony and amplitude changes on the comparisonof two completely different test situations; the first being a measure of resting ,and the second being an session, during which subjects are visualising traumaticmemories through hypnagogic imagery. e reported long-term benefits in terms ofreducing symptoms of are not however linked by way of correlation analysis with
263
APPENDIX A. CLINICAL APPLICATIONS OF THE ALPHA-THETAPROTOCOL
the changes. Although the results are so unclear as to be unusable, this study didbegin to generate testable neuroscientific hypotheses for examining the therapeuticeffects of alpha-theta in ways the preceding reports did not. e report providedsuggestive evidence in support of the association between alpha-theta and medi-tative states by disclosing higher than resting amounts of theta frequency ampli-tudes, and the authors also suggested that increased synchrony between brain areasmight be instrumental in enabling repressed long-term memories to be representedin working memory.
Prior to withdrawing from active research, Peniston was involved with one furtheralpha-theta study, (Saxby and Peniston, 1995). is study was designed as an uncon-trolled replication of the prior uses of the Peniston protocol in treating alcoholism(Peniston and Kulkosky, 1989, 1990). is study selected 14 participants randomlyfrom a mixed gender population of outpatients at a biofeedback centre in California,none of whom had any psychotic symptoms or other known dysfunction. e out-comes measured by the study were personality ( and ) and alcohol use (21month follow ups).
e training procedure differed slightly from previous attempts insofar as the tem-perature biofeedback training was conducted in isolation over four sessions, with afurther session being devoted to the construction of imagery associated with alco-hol abstinence in situations relevant to previous alcohol use, and with the increasingof brainwave amplitudes. Subsequently patients had 20 40-minute alpha-theta sessions, each of which was followed by a short interview to review any hypnagogicimageries perceived.
After treatment, the participants reported significantly reduced scores on the depression inventory, and 14 of the 20 scales. Alcohol relapse was only reportedin one case. Whilst this report indicates that Peniston’s successes in using alpha-theta to manage alcohol withdrawal are replicable, it does not otherwise improve thevalidity of the Peniston protocol. e study contained no control group, so whilst thereport has the benefit of reporting similar results in a slightly different population,the lack of experimental control limits the claims to efficacy that can be made by thisstudy. In common with previous reports, the link between intervention and outcomemeasures is not even explored, and the continued problem of the mixed treatmentprogram means that it’s not possible to tell which part of that program is effecting the
264
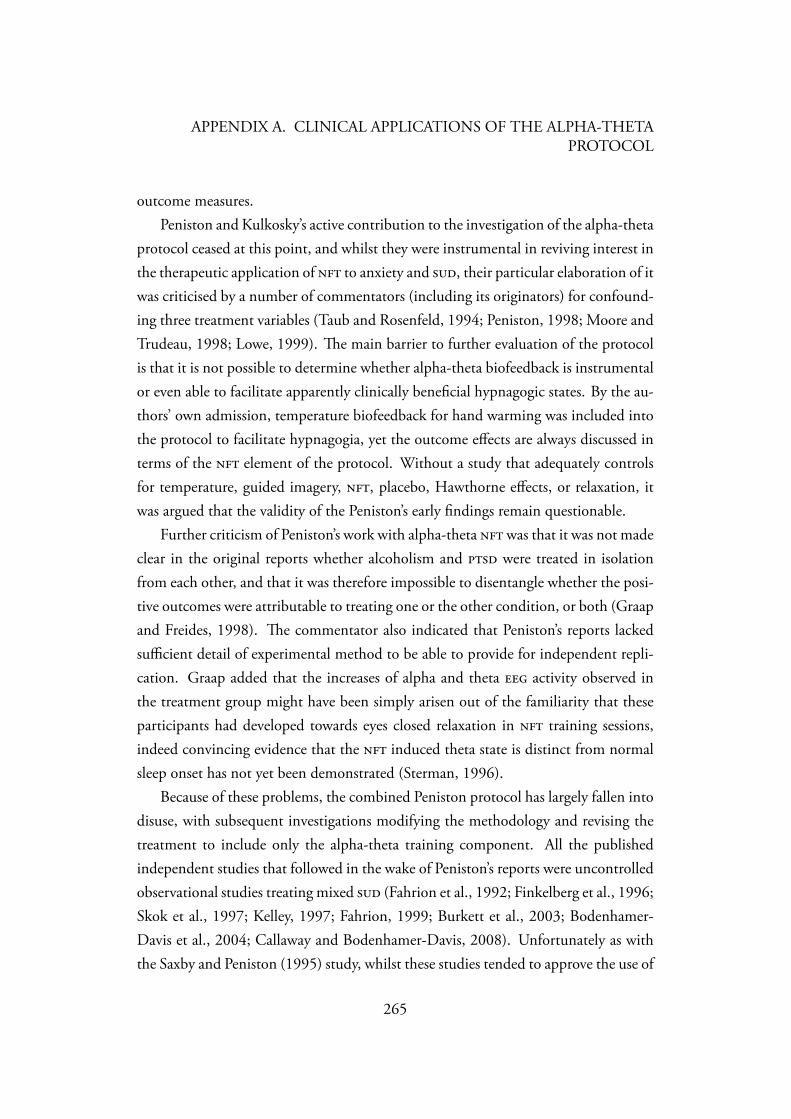
APPENDIX A. CLINICAL APPLICATIONS OF THE ALPHA-THETAPROTOCOL
outcome measures.Peniston and Kulkosky’s active contribution to the investigation of the alpha-theta
protocol ceased at this point, and whilst they were instrumental in reviving interest inthe therapeutic application of to anxiety and , their particular elaboration of itwas criticised by a number of commentators (including its originators) for confound-ing three treatment variables (Taub and Rosenfeld, 1994; Peniston, 1998; Moore andTrudeau, 1998; Lowe, 1999). e main barrier to further evaluation of the protocolis that it is not possible to determine whether alpha-theta biofeedback is instrumentalor even able to facilitate apparently clinically beneficial hypnagogic states. By the au-thors’ own admission, temperature biofeedback for hand warming was included intothe protocol to facilitate hypnagogia, yet the outcome effects are always discussed interms of the element of the protocol. Without a study that adequately controlsfor temperature, guided imagery, , placebo, Hawthorne effects, or relaxation, itwas argued that the validity of the Peniston’s early findings remain questionable.
Further criticism of Peniston’s work with alpha-theta was that it was not madeclear in the original reports whether alcoholism and were treated in isolationfrom each other, and that it was therefore impossible to disentangle whether the posi-tive outcomes were attributable to treating one or the other condition, or both (Graapand Freides, 1998). e commentator also indicated that Peniston’s reports lackedsufficient detail of experimental method to be able to provide for independent repli-cation. Graap added that the increases of alpha and theta activity observed inthe treatment group might have been simply arisen out of the familiarity that theseparticipants had developed towards eyes closed relaxation in training sessions,indeed convincing evidence that the induced theta state is distinct from normalsleep onset has not yet been demonstrated (Sterman, 1996).
Because of these problems, the combined Peniston protocol has largely fallen intodisuse, with subsequent investigations modifying the methodology and revising thetreatment to include only the alpha-theta training component. All the publishedindependent studies that followed in the wake of Peniston’s reports were uncontrolledobservational studies treating mixed (Fahrion et al., 1992; Finkelberg et al., 1996;Skok et al., 1997; Kelley, 1997; Fahrion, 1999; Burkett et al., 2003; Bodenhamer-Davis et al., 2004; Callaway and Bodenhamer-Davis, 2008). Unfortunately as withthe Saxby and Peniston (1995) study, whilst these studies tended to approve the use of
265
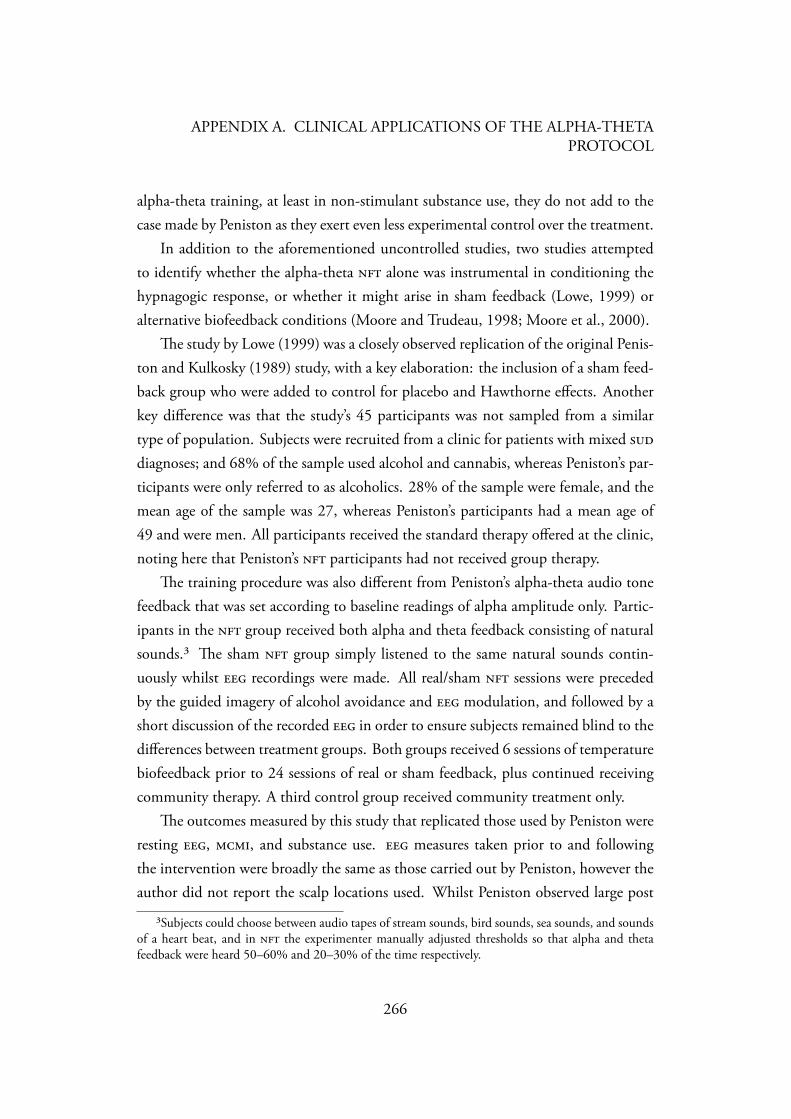
APPENDIX A. CLINICAL APPLICATIONS OF THE ALPHA-THETAPROTOCOL
alpha-theta training, at least in non-stimulant substance use, they do not add to thecase made by Peniston as they exert even less experimental control over the treatment.
In addition to the aforementioned uncontrolled studies, two studies attemptedto identify whether the alpha-theta alone was instrumental in conditioning thehypnagogic response, or whether it might arise in sham feedback (Lowe, 1999) oralternative biofeedback conditions (Moore and Trudeau, 1998; Moore et al., 2000).
e study by Lowe (1999) was a closely observed replication of the original Penis-ton and Kulkosky (1989) study, with a key elaboration: the inclusion of a sham feed-back group who were added to control for placebo and Hawthorne effects. Anotherkey difference was that the study’s 45 participants was not sampled from a similartype of population. Subjects were recruited from a clinic for patients with mixed diagnoses; and 68% of the sample used alcohol and cannabis, whereas Peniston’s par-ticipants were only referred to as alcoholics. 28% of the sample were female, and themean age of the sample was 27, whereas Peniston’s participants had a mean age of49 and were men. All participants received the standard therapy offered at the clinic,noting here that Peniston’s participants had not received group therapy.
e training procedure was also different from Peniston’s alpha-theta audio tonefeedback that was set according to baseline readings of alpha amplitude only. Partic-ipants in the group received both alpha and theta feedback consisting of naturalsounds.³ e sham group simply listened to the same natural sounds contin-uously whilst recordings were made. All real/sham sessions were precededby the guided imagery of alcohol avoidance and modulation, and followed by ashort discussion of the recorded in order to ensure subjects remained blind to thedifferences between treatment groups. Both groups received 6 sessions of temperaturebiofeedback prior to 24 sessions of real or sham feedback, plus continued receivingcommunity therapy. A third control group received community treatment only.
e outcomes measured by this study that replicated those used by Peniston wereresting , , and substance use. measures taken prior to and followingthe intervention were broadly the same as those carried out by Peniston, however theauthor did not report the scalp locations used. Whilst Peniston observed large post
³Subjects could choose between audio tapes of stream sounds, bird sounds, sea sounds, and soundsof a heart beat, and in the experimenter manually adjusted thresholds so that alpha and thetafeedback were heard 50–60% and 20–30% of the time respectively.
266
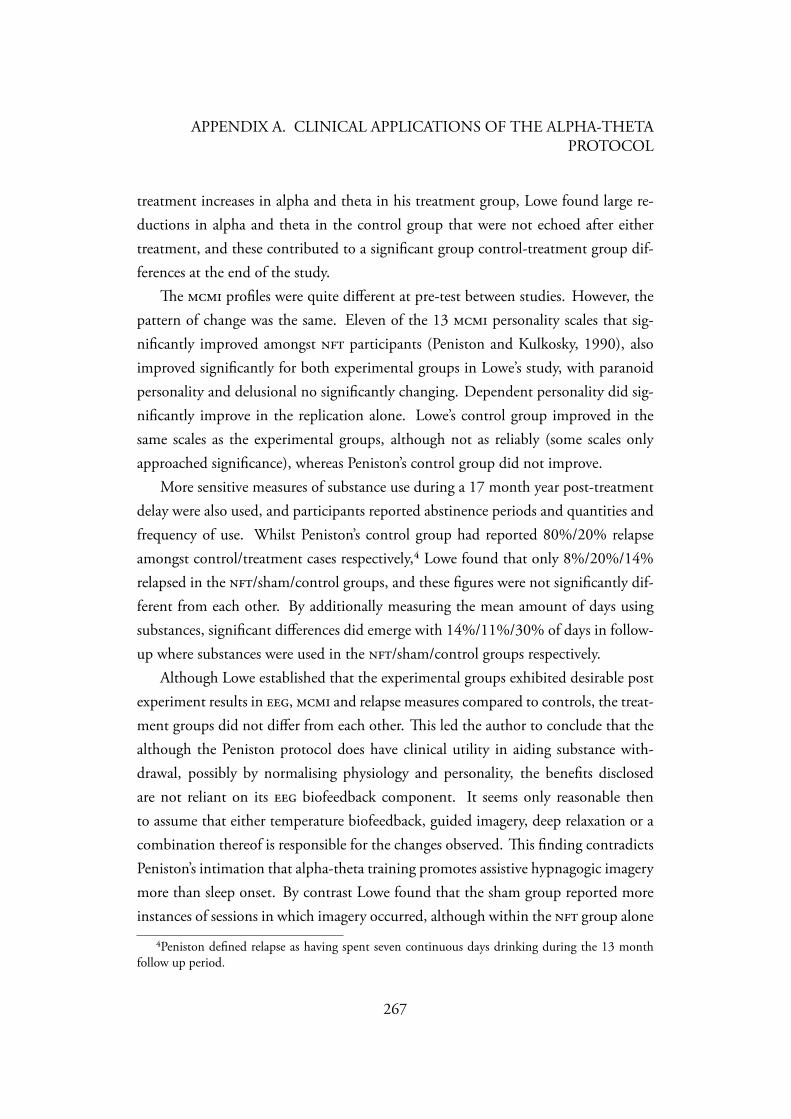
APPENDIX A. CLINICAL APPLICATIONS OF THE ALPHA-THETAPROTOCOL
treatment increases in alpha and theta in his treatment group, Lowe found large re-ductions in alpha and theta in the control group that were not echoed after eithertreatment, and these contributed to a significant group control-treatment group dif-ferences at the end of the study.
e profiles were quite different at pre-test between studies. However, thepattern of change was the same. Eleven of the 13 personality scales that sig-nificantly improved amongst participants (Peniston and Kulkosky, 1990), alsoimproved significantly for both experimental groups in Lowe’s study, with paranoidpersonality and delusional no significantly changing. Dependent personality did sig-nificantly improve in the replication alone. Lowe’s control group improved in thesame scales as the experimental groups, although not as reliably (some scales onlyapproached significance), whereas Peniston’s control group did not improve.
More sensitive measures of substance use during a 17 month year post-treatmentdelay were also used, and participants reported abstinence periods and quantities andfrequency of use. Whilst Peniston’s control group had reported 80%/20% relapseamongst control/treatment cases respectively,⁴ Lowe found that only 8%/20%/14%relapsed in the /sham/control groups, and these figures were not significantly dif-ferent from each other. By additionally measuring the mean amount of days usingsubstances, significant differences did emerge with 14%/11%/30% of days in follow-up where substances were used in the /sham/control groups respectively.
Although Lowe established that the experimental groups exhibited desirable postexperiment results in , and relapse measures compared to controls, the treat-ment groups did not differ from each other. is led the author to conclude that thealthough the Peniston protocol does have clinical utility in aiding substance with-drawal, possibly by normalising physiology and personality, the benefits disclosedare not reliant on its biofeedback component. It seems only reasonable thento assume that either temperature biofeedback, guided imagery, deep relaxation or acombination thereof is responsible for the changes observed. is finding contradictsPeniston’s intimation that alpha-theta training promotes assistive hypnagogic imagerymore than sleep onset. By contrast Lowe found that the sham group reported moreinstances of sessions in which imagery occurred, although within the group alone
⁴Peniston defined relapse as having spent seven continuous days drinking during the 13 monthfollow up period.
267
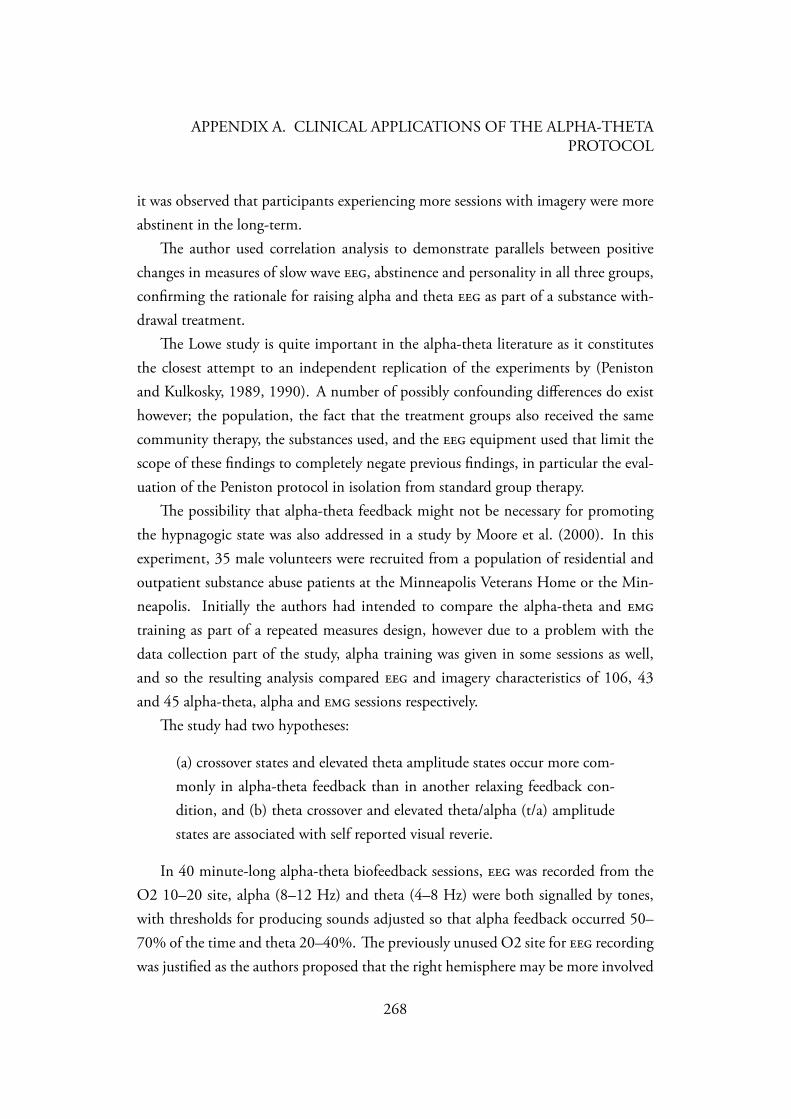
APPENDIX A. CLINICAL APPLICATIONS OF THE ALPHA-THETAPROTOCOL
it was observed that participants experiencing more sessions with imagery were moreabstinent in the long-term.
e author used correlation analysis to demonstrate parallels between positivechanges in measures of slow wave , abstinence and personality in all three groups,confirming the rationale for raising alpha and theta as part of a substance with-drawal treatment.
e Lowe study is quite important in the alpha-theta literature as it constitutesthe closest attempt to an independent replication of the experiments by (Penistonand Kulkosky, 1989, 1990). A number of possibly confounding differences do existhowever; the population, the fact that the treatment groups also received the samecommunity therapy, the substances used, and the equipment used that limit thescope of these findings to completely negate previous findings, in particular the eval-uation of the Peniston protocol in isolation from standard group therapy.
e possibility that alpha-theta feedback might not be necessary for promotingthe hypnagogic state was also addressed in a study by Moore et al. (2000). In thisexperiment, 35 male volunteers were recruited from a population of residential andoutpatient substance abuse patients at the Minneapolis Veterans Home or the Min-neapolis. Initially the authors had intended to compare the alpha-theta and training as part of a repeated measures design, however due to a problem with thedata collection part of the study, alpha training was given in some sessions as well,and so the resulting analysis compared and imagery characteristics of 106, 43and 45 alpha-theta, alpha and sessions respectively.
e study had two hypotheses:
(a) crossover states and elevated theta amplitude states occur more com-monly in alpha-theta feedback than in another relaxing feedback con-dition, and (b) theta crossover and elevated theta/alpha (t/a) amplitudestates are associated with self reported visual reverie.
In 40 minute-long alpha-theta biofeedback sessions, was recorded from theO2 10–20 site, alpha (8–12 Hz) and theta (4–8 Hz) were both signalled by tones,with thresholds for producing sounds adjusted so that alpha feedback occurred 50–70% of the time and theta 20–40%. e previously unused O2 site for recordingwas justified as the authors proposed that the right hemisphere may be more involved
268
APPENDIX A. CLINICAL APPLICATIONS OF THE ALPHA-THETAPROTOCOL
in visual processing. In training participants attempted to reduce amplitudesbelow the threshold set, with higher and lower levels being represented with the sametones as for alpha and theta in the alpha-theta protocol. e report does not makeit entirely clear where electrodes were placed, although the authors indicatedthat the protocol was designed to be indistinguishable in experience to alpha-thetatraining. e alpha protocol differed in the sounds that were used and was comprisedof three tones and was designed to promote progressive relaxation.
Training was carried out in groups of 2 to 6, and following each session partic-ipants were asked to complete forms and talk about their experiences; a treatmentblind rater counted instances of hypnagogic imagery per session from this data, andthe ensuing figure served as the first outcome measure. e second dependent mea-sure was that of t/a ‘crossover’, Peniston’s proposed indicator of the neural correlateof hypnagogic imagery. e authors measured crossover as the mean session ratio oftheta to alpha and the mean percentage of time spent in crossover.
Due to the previously stated problems with experimental design leading to partic-ipants effectively being members of more than one experimental group, the authorsanalysed each session as a data point that was independent of the subject. In the useof this entailed that the within subjects degrees of freedom was around 190,which artificially raises the statistical power of the test, leading to increased likelihoodof a false positive. Indeed the authors did report a significant difference between thegroups, with post-hoc analysis indicating that cases exhibited greater mean t/aratios than the alpha participants. is result however is not necessarily valid. Nogroup differences were reported concerning percentage of time spent in theta alphacrossover. Considering the incidence of reported imagery, it was found that no groupdifferences existed, but in analysing all sessions together the authors found an unex-pected inverse relation between the mean theta>alpha measure and the presence ofimagery in a session.
Since the study data was analysed incorrectly, coupled with the report that manyparticipants dropped out of the study, the findings of this experiment are suggestiveat best. Nonetheless, the comparison of alpha-theta training with an control isa valid approach in attempting to isolate any protocol specific effects of alpha-thetatraining. relaxation has been used in other alcohol withdrawal studies (e.g. Den-ney and Baugh (1992)) that reported its ability to promote self regulation of anxi-
269
APPENDIX A. CLINICAL APPLICATIONS OF THE ALPHA-THETAPROTOCOL
ety during alcohol withdrawal. is study suggests that relaxation leads to t/acrossover just as effectively as alpha-theta training, and this would support the asser-tion by Sterman (1996) that alpha-theta feedback might not train a distinct theta stateas suggested by Green and Green (1977); Peniston and Kulkosky (1989) but simplyfacilitates a “functional transition towards sleep.” If this were the case, one mightexpect any other form of relaxation to have a similar effect in promoting sleep physi-ology; and this appears to have been observed by Moore. Sterman proposes that theefficacy of alpha-theta in sustaining hypnagogic lies not in training volitionalcontrol of sleep onset, which is naturally accompanied by a loss of self-regulation, butrather that the subject is prevented from progressing beyond due to thecontinued reinforcement of alpha or by experimenter intervention⁵. Sterman con-cludes that whilst alpha-theta feedback may promote hypnagogia, it does not bring itunder operant control. In the light of this remark Moore’s finding that theta>alphameasures are inversely related to occurrences of imagery would possibly indicate thatabove an undefined level, the t/a ratio expresses not only the transient crossover pe-riod, but also further stages of sleep onset too. It follows then that neither form oftraining prevented progression beyond the hypnagogic indicative of . Although Moore’s study does not constitute an empirically valid challenge to theefficacy of the alpha-theta protocol, it does nevertheless raise questions about the pro-posal by Green et al. (1974); Peniston and Kulkosky (1989), that theta dominanceoccurs in a state distinct from normal sleep onset. In the light of the comments bySterman (1996) a further question is raised regarding the ability of alpha-theta tobring the hypnagogic state under operant control. is question could be addressedby comparing measurements of hypnagogia prior to and following alpha-theta.
⁵ere is some evidence that auditory awareness attenuates during theta cycles accompanyingdrowsiness (Makeig and Jung, 1996; Makeig et al., 2000) which would indicate that experimenterintervention would be more important in preventing a deepening of sleep
270
BClinical applications of the SMR
protocol
Although procedures designed to train attentional networks include both /betaand methods, this review will focus on /beta applications. ere are two rea-sons for doing this. Firstly, the historical development of /beta protocols paral-lel that of the slow wave methods seen in the previous section and reviewing themhere provides an overall illustration of the development of the field. Secondly, frequency band conditioning as opposed to excitability or imaging measures are cur-rently the most widely used in clinical and research practice, and this thesis reflectsthe dominance of these methods.
Neurofeedback training for attention processes began with the 1976 publicationof an case study (Lubar and Shouse, 1976). e previous work demonstrating arelationship between and motor inhibition in epilepsy (Sterman and Friar, 1972)provided the rationale for examining whether this relationship might be observed,and treated in another condition characterised by ‘overactivity,’ .
e data for Lubar and Shouse (1976) came from a single case study drawn froma group of 4 who had participated in the first study of training for . De-pendent measures consisted of treatment-stage blind classroom observations of hyper-activity and inattention (Wahler et al., 1975), and 40 minute recordings whichprovided counts of events where exceeded 5 microvolts whilst theta (4–7 Hz)remained below 12.5 microvolts. e experimental design was made up of five stageswhich were as follows: Stages 1 and 2- baseline measures of and behaviour without
271
APPENDIX B. CLINICAL APPLICATIONS OF THE SMR PROTOCOL
then with Ritalin medication respectively; Stage 3- training with Ritalin (75 ses-sions); Stage 4- reversed training with Ritalin (40 sessions); Stage 5- trainingwith Ritalin (30 sessions). e final three stages consisted of an design in whichinitial training goals were reversed and then reinstated to control for extraneous vari-ables influences such as maturation.
e protocol itself comprised divergent regulation of and theta frequen-cies, was recorded from C3 and C4 as in a previous epilepsy study by Stermanand Friar (1972). Feedback consisted of the presentation of lights, tones, and moneyduring targeted responses and a different light during un-targeted signatures.Sessions lasted 40 minutes, with a five minute baseline and 15 minute training periodbeing repeated. was recorded from the chin in order to probe for evidence ofmotor inhibition.
Being a study of a single case, descriptive data only was provided. Targeted valuesof and theta are shown to have progressively increased during stages 3 and 5, anddecreased in stage 4.
ese trends were inverted in measures, suggesting that motor inhibition didoccur in training. Session baseline measures of activity also changed in line withthe amount of training, suggesting that training effects carried-over beyond training.Classroom measures of hyperactivity and inattention further attest to the persistenceof training effects, and the study indicated that 8 of 13 measures changed in linewith the training and reverse-training conditions. and behavioural improvementshappened to a greater extent than under medication alone.
Whilst the preliminary nature of the results in a single subject are stressed, theauthors nonetheless felt that this line of inquiry warranted further investigation in agreater population sample. e fact that their study illustrated bi-directional effectson both training parameters and behavioural measures provided encouragementthat these measures might be linearly related. e addition of reversal training didclearly demonstrate effects of /theta in contrast to its inversion rather thanagainst controls, although using a treatment to worsen clinical symptoms is ethicallyquestionable, and a suitable control is preferable. e use of the design doesnonetheless demonstrate relationship between /theta parameters and mea-sures, which, for what was a brand new protocol adds some credence to the inclusionof theta training into the protocol. e mixing of and theta does however
272
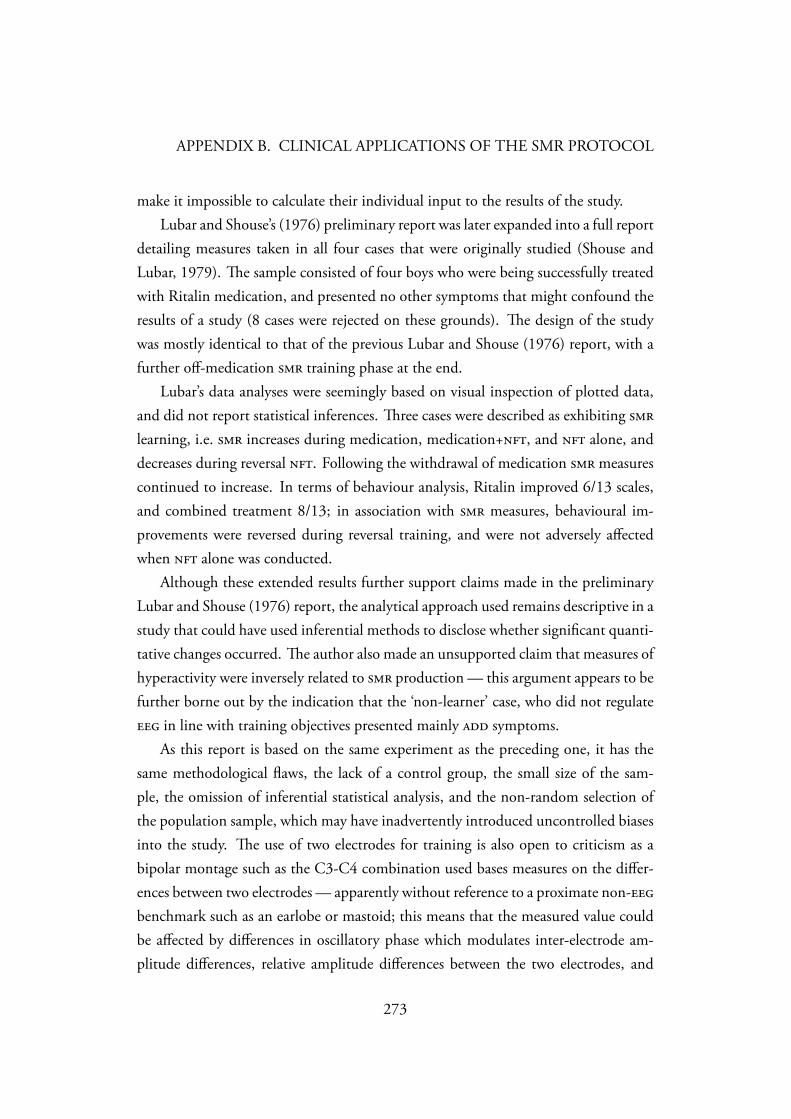
APPENDIX B. CLINICAL APPLICATIONS OF THE SMR PROTOCOL
make it impossible to calculate their individual input to the results of the study.Lubar and Shouse’s (1976) preliminary report was later expanded into a full report
detailing measures taken in all four cases that were originally studied (Shouse andLubar, 1979). e sample consisted of four boys who were being successfully treatedwith Ritalin medication, and presented no other symptoms that might confound theresults of a study (8 cases were rejected on these grounds). e design of the studywas mostly identical to that of the previous Lubar and Shouse (1976) report, with afurther off-medication training phase at the end.
Lubar’s data analyses were seemingly based on visual inspection of plotted data,and did not report statistical inferences. ree cases were described as exhibiting learning, i.e. increases during medication, medication+, and alone, anddecreases during reversal . Following the withdrawal of medication measurescontinued to increase. In terms of behaviour analysis, Ritalin improved 6/13 scales,and combined treatment 8/13; in association with measures, behavioural im-provements were reversed during reversal training, and were not adversely affectedwhen alone was conducted.
Although these extended results further support claims made in the preliminaryLubar and Shouse (1976) report, the analytical approach used remains descriptive in astudy that could have used inferential methods to disclose whether significant quanti-tative changes occurred. e author also made an unsupported claim that measures ofhyperactivity were inversely related to production — this argument appears to befurther borne out by the indication that the ‘non-learner’ case, who did not regulate in line with training objectives presented mainly symptoms.
As this report is based on the same experiment as the preceding one, it has thesame methodological flaws, the lack of a control group, the small size of the sam-ple, the omission of inferential statistical analysis, and the non-random selection ofthe population sample, which may have inadvertently introduced uncontrolled biasesinto the study. e use of two electrodes for training is also open to criticism as abipolar montage such as the C3-C4 combination used bases measures on the differ-ences between two electrodes — apparently without reference to a proximate non-benchmark such as an earlobe or mastoid; this means that the measured value couldbe affected by differences in oscillatory phase which modulates inter-electrode am-plitude differences, relative amplitude differences between the two electrodes, and
273
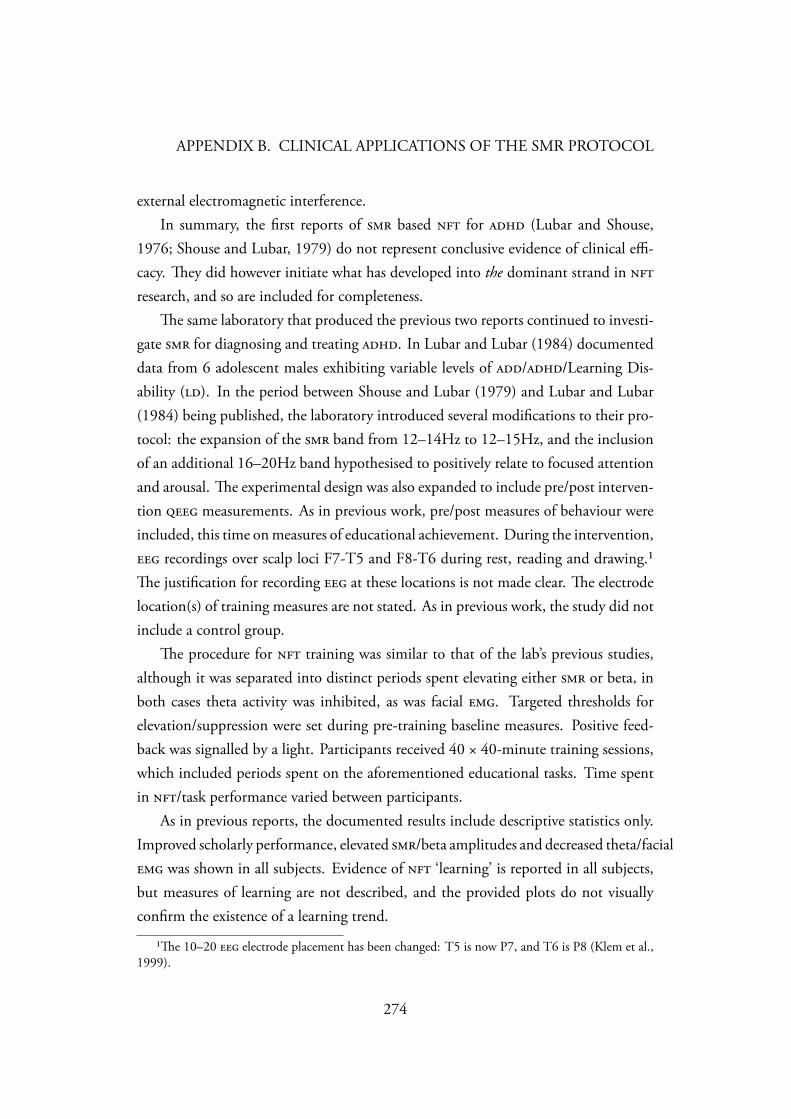
APPENDIX B. CLINICAL APPLICATIONS OF THE SMR PROTOCOL
external electromagnetic interference.In summary, the first reports of based for (Lubar and Shouse,
1976; Shouse and Lubar, 1979) do not represent conclusive evidence of clinical effi-cacy. ey did however initiate what has developed into the dominant strand in research, and so are included for completeness.
e same laboratory that produced the previous two reports continued to investi-gate for diagnosing and treating . In Lubar and Lubar (1984) documenteddata from 6 adolescent males exhibiting variable levels of //Learning Dis-ability (). In the period between Shouse and Lubar (1979) and Lubar and Lubar(1984) being published, the laboratory introduced several modifications to their pro-tocol: the expansion of the band from 12–14Hz to 12–15Hz, and the inclusionof an additional 16–20Hz band hypothesised to positively relate to focused attentionand arousal. e experimental design was also expanded to include pre/post interven-tion measurements. As in previous work, pre/post measures of behaviour wereincluded, this time on measures of educational achievement. During the intervention, recordings over scalp loci F7-T5 and F8-T6 during rest, reading and drawing.¹e justification for recording at these locations is not made clear. e electrodelocation(s) of training measures are not stated. As in previous work, the study did notinclude a control group.
e procedure for training was similar to that of the lab’s previous studies,although it was separated into distinct periods spent elevating either or beta, inboth cases theta activity was inhibited, as was facial . Targeted thresholds forelevation/suppression were set during pre-training baseline measures. Positive feed-back was signalled by a light. Participants received 40 × 40-minute training sessions,which included periods spent on the aforementioned educational tasks. Time spentin /task performance varied between participants.
As in previous reports, the documented results include descriptive statistics only.Improved scholarly performance, elevated /beta amplitudes and decreased theta/facial was shown in all subjects. Evidence of ‘learning’ is reported in all subjects,but measures of learning are not described, and the provided plots do not visuallyconfirm the existence of a learning trend.
¹e 10–20 electrode placement has been changed: T5 is now P7, and T6 is P8 (Klem et al.,1999).
274
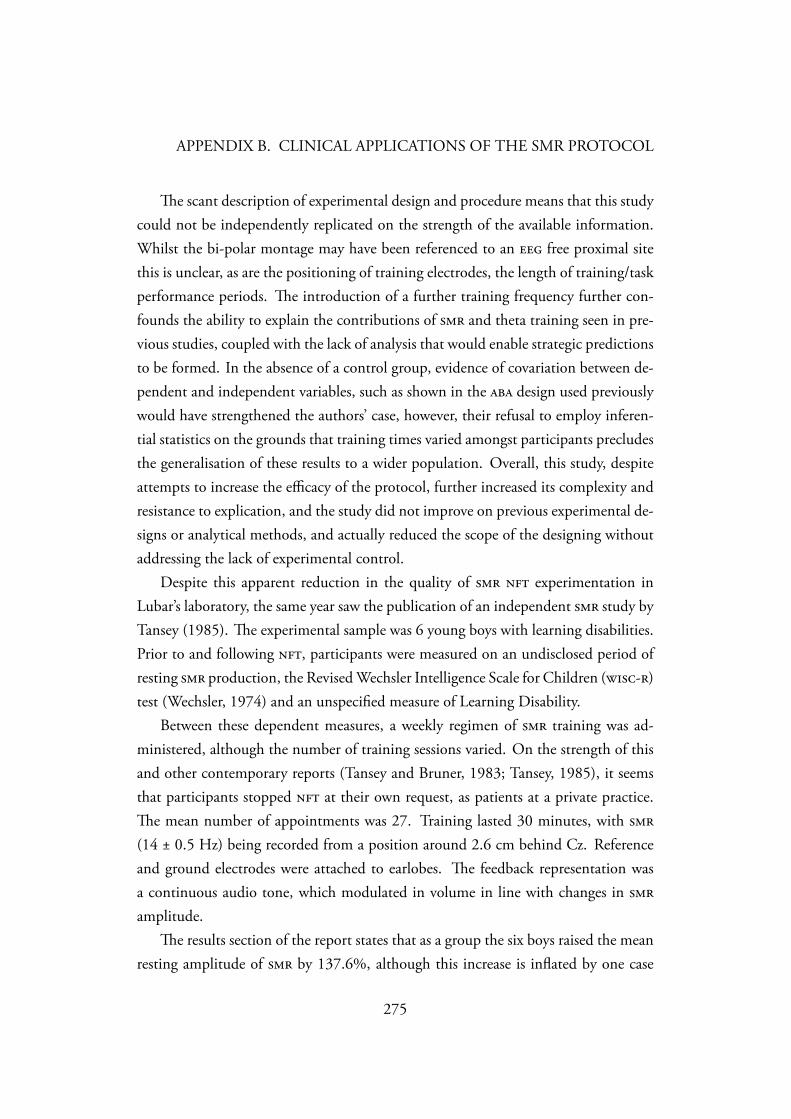
APPENDIX B. CLINICAL APPLICATIONS OF THE SMR PROTOCOL
e scant description of experimental design and procedure means that this studycould not be independently replicated on the strength of the available information.Whilst the bi-polar montage may have been referenced to an free proximal sitethis is unclear, as are the positioning of training electrodes, the length of training/taskperformance periods. e introduction of a further training frequency further con-founds the ability to explain the contributions of and theta training seen in pre-vious studies, coupled with the lack of analysis that would enable strategic predictionsto be formed. In the absence of a control group, evidence of covariation between de-pendent and independent variables, such as shown in the design used previouslywould have strengthened the authors’ case, however, their refusal to employ inferen-tial statistics on the grounds that training times varied amongst participants precludesthe generalisation of these results to a wider population. Overall, this study, despiteattempts to increase the efficacy of the protocol, further increased its complexity andresistance to explication, and the study did not improve on previous experimental de-signs or analytical methods, and actually reduced the scope of the designing withoutaddressing the lack of experimental control.
Despite this apparent reduction in the quality of experimentation inLubar’s laboratory, the same year saw the publication of an independent study byTansey (1985). e experimental sample was 6 young boys with learning disabilities.Prior to and following , participants were measured on an undisclosed period ofresting production, the Revised Wechsler Intelligence Scale for Children (-)test (Wechsler, 1974) and an unspecified measure of Learning Disability.
Between these dependent measures, a weekly regimen of training was ad-ministered, although the number of training sessions varied. On the strength of thisand other contemporary reports (Tansey and Bruner, 1983; Tansey, 1985), it seemsthat participants stopped at their own request, as patients at a private practice.e mean number of appointments was 27. Training lasted 30 minutes, with (14 ± 0.5 Hz) being recorded from a position around 2.6 cm behind Cz. Referenceand ground electrodes were attached to earlobes. e feedback representation wasa continuous audio tone, which modulated in volume in line with changes in amplitude.
e results section of the report states that as a group the six boys raised the meanresting amplitude of by 137.6%, although this increase is inflated by one case
275
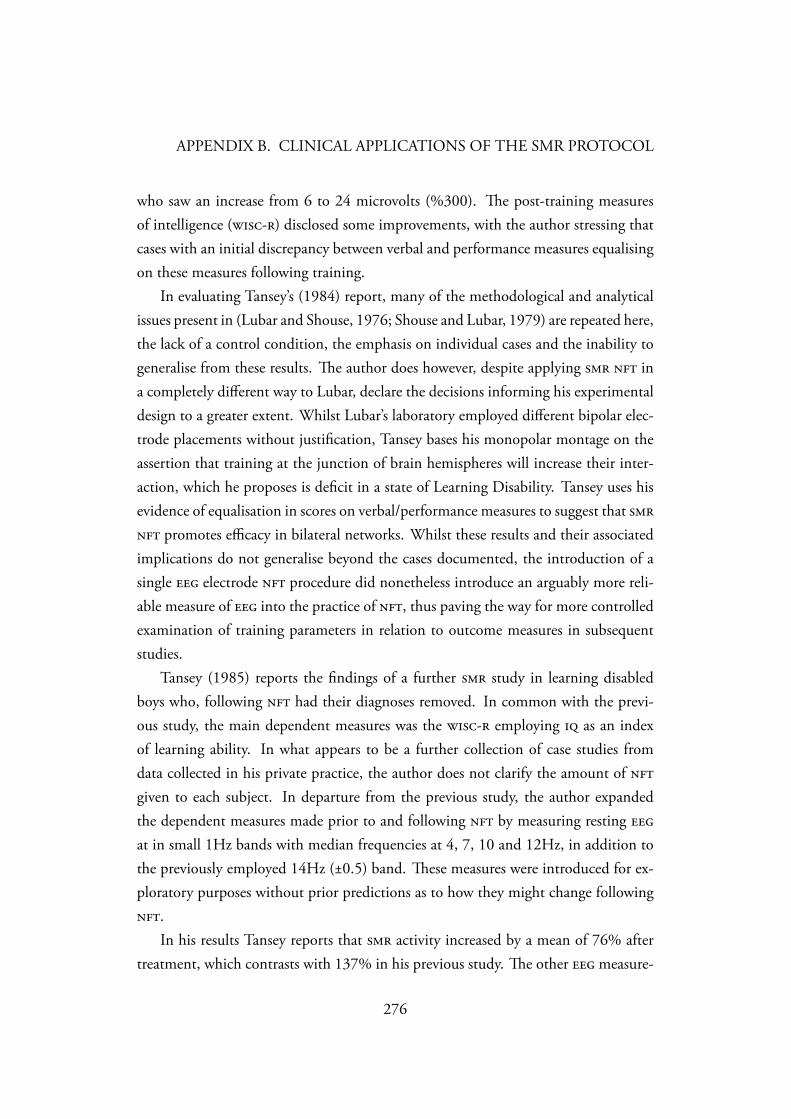
APPENDIX B. CLINICAL APPLICATIONS OF THE SMR PROTOCOL
who saw an increase from 6 to 24 microvolts (%300). e post-training measuresof intelligence (-) disclosed some improvements, with the author stressing thatcases with an initial discrepancy between verbal and performance measures equalisingon these measures following training.
In evaluating Tansey’s (1984) report, many of the methodological and analyticalissues present in (Lubar and Shouse, 1976; Shouse and Lubar, 1979) are repeated here,the lack of a control condition, the emphasis on individual cases and the inability togeneralise from these results. e author does however, despite applying ina completely different way to Lubar, declare the decisions informing his experimentaldesign to a greater extent. Whilst Lubar’s laboratory employed different bipolar elec-trode placements without justification, Tansey bases his monopolar montage on theassertion that training at the junction of brain hemispheres will increase their inter-action, which he proposes is deficit in a state of Learning Disability. Tansey uses hisevidence of equalisation in scores on verbal/performance measures to suggest that promotes efficacy in bilateral networks. Whilst these results and their associatedimplications do not generalise beyond the cases documented, the introduction of asingle electrode procedure did nonetheless introduce an arguably more reli-able measure of into the practice of , thus paving the way for more controlledexamination of training parameters in relation to outcome measures in subsequentstudies.
Tansey (1985) reports the findings of a further study in learning disabledboys who, following had their diagnoses removed. In common with the previ-ous study, the main dependent measures was the - employing as an indexof learning ability. In what appears to be a further collection of case studies fromdata collected in his private practice, the author does not clarify the amount of given to each subject. In departure from the previous study, the author expandedthe dependent measures made prior to and following by measuring resting at in small 1Hz bands with median frequencies at 4, 7, 10 and 12Hz, in addition tothe previously employed 14Hz (±0.5) band. ese measures were introduced for ex-ploratory purposes without prior predictions as to how they might change following.
In his results Tansey reports that activity increased by a mean of 76% aftertreatment, which contrasts with 137% in his previous study. e other measure-
276
APPENDIX B. CLINICAL APPLICATIONS OF THE SMR PROTOCOL
ments described in the methods are not documented. As in Tansey (1984), -performance are described as equalising in cases who previously had disparity betweenverbal and performance measures, and once again the author speculated that learningimprovements were mediated by increased inter-hemispheric interaction promotedby .
Tansey’s (1984) contribution to research at this point did not substantiallydevelop upon prior claims as to the efficacy of this form of . As with Lubar andShouse (1976); Shouse and Lubar (1979); Lubar and Lubar (1984), the use of solelydescriptive results precludes generalisation, and the experimental designs continued tobe uncontrolled. Support for Tansey’s hypothetical linear association between inter-hemispheric interaction and learning ability is limited, and his evidence in support ofthis hypothesis is based on speculative interpretation of data based on single electrodedata that does not provide strong evidence of distributed functional connectivity.
With the exception of a review attempting to gather the findings of the previouslyevaluated 5 papers into a cohesive argument for the efficacy of (Lubar, 1991),investigation of applications in relation to attention disorders or their supersetof learning disabilities was largely abandoned between 1985 and 1995. In the latteryear however, Lubar et al. (1995) reported on a study that represented a attempt toimprove on previous experimental designs. A sample of 23 8–19 year olds from apopulation presenting behavioural symptoms indicative of disordered attention, noconfounding illness, and based diagnosis of .²
e dependent measures of the study incorporated the -, presumably in anattempt to replicate Tansey; Tansey’s (1984; 1985) findings in a specifically sample. Parents completed the Evaluation Scale () (McCarney and Ser-vices, 1989) at the start and end of the study. e Test of Variables of Attention() (Greenberg, 1987) was also introduced to the study, and has since gone on tobecome a widely used diagnostic tool in attention disorder applications in clinicsand research. e assesses several measures, principally impulsivity and inatten-tion, and the resulting test scores indicate ability to sustain attention over an extendedperiod in comparison to a normal performance for the age and sex of the participant.e authors also examined changes by comparing levels of theta to the amount
²Lubar used diagnosis of based on deficient beta and excessive theta compared to acharacteristically normal (Mann et al., 1992).
277
APPENDIX B. CLINICAL APPLICATIONS OF THE SMR PROTOCOL
of training sessions held.All participants received the same protocol in 40 training sessions over the course
of approximately 10 weeks, with each session lasting 50 minutes. As in Lubar’s pre-vious work, was measured as the difference between bipolar electrodes, althoughrecording locations were at CPz and FCz. During training positive feedback was pro-vided on the basis that beta (16–20Hz) exceeded pre-training baseline values whilsttheta (4–8Hz) and values were below those established at the session start.
As in previous studies the authors looked for evidence that subjects learned toreduce theta in line with training contingencies, and compared subjects whose thetaamplitudes correlated negatively with the amount of sessions held (n=12) to those thatdidn’t (n=6). is measure is presumably based on absolute measures of theta, whichmight be contaminated by uncontrolled factors such as baseline theta — Lubar andcolleagues had previously analysed the /theta ratio: a more reliable of inter-sessiondynamics. Whilst beta frequencies were trained in this study, they are conspicuouslyabsent from the analysis.
Having divided the sample into ‘learners’ and ‘non-learners,’ efficacy was as-sessed based on the number of measures in which improvements had been made,with learners improving on an average of 3 and non-learners on 1.5. is assumesthat improving on one measure, say impulsivity, is equal to improving on another,say inattention, when these are mutually exclusive in some cases. ere appeared tobe little prior justification for taking this analytical approach apart from that it doesprovide a more general measure of learning disability. Despite having disclosed abetween-group difference, within-group changes were not assessed.
A subset of the sample was analysed for changes in the (n=13) and -(n=10) scales, although it is not clear which of the total of 18 cases are documentedhere, although the - data is reported as coming from learners. measuresdisclosed improvements in ratings of inattention, impulsivity and hyperactivity al-though improvements are uncorrelated with learning. - measures showedimprovements in verbal and overall measures.
In evaluating the contribution of Lubar et al. (1995) to the literature, the moststriking gain is the increase in the sample size extending the scope of attention researchbeyond the level of case studies. e derivation of a formal measure of learningand its inter-relation with changes in dependent measures is also an important step
278
APPENDIX B. CLINICAL APPLICATIONS OF THE SMR PROTOCOL
in controlling for extraneous influences and represents good design. However, theomission of beta training measures from the learning index undermines their use inthe protocol, plus the use of absolute measures makes the learning data sensitiveto differences between session baseline values. Finally, whilst some inferential statisticsare used, representing an improvement on previous reports, their inclusion is sporadic,making it difficult to draw general inferences from this paper.
Despite the shortcomings of (Lubar et al., 1995), the year of its publication markssomething of a turning point in the literature concerning for . From thispoint on, controlled trials became increasingly used, and this process of refining ex-perimental designs culminated in several randomised controlled trials. In Arns et al.(2009) the literature to-date was subjected to a meta-analysis, which will beevaluated here. Some studies were not included in this meta-analysis, either becausethe mean and standard deviation of pre and post treatment measures of werenot available for further analysis (Lubar et al., 1995; Linden et al., 1996) or in thecase of two double-blind placebo controlled trials, were disseminated in the form ofunpublished conference presentations (Picard, 2006; DeBeus, 2006).³ e omittedstudy by Lubar et al. (1995) has been reviewed, and prior to examining the Arns et al.(2009) meta-analysis, the other omitted paper will be evaluated.
Linden et al. (1996) reported on a controlled trial of a beta (16–20 Hz)/theta(4–8Hz) protocol in comparison with a passive (waitlist) control group. 18 children with including some with between the ages of 5 and 15 took part in the firstrandomised controlled trial of for attention disorders. Treatment consisted of 40× 45-minute sessions of training in elevating beta activity whilst inhibiting theta. etrial took place over a 6 month period, with a concurrent control group participatingin prior and subsequent measures with the Kaufman-Brief Intelligence Test (-)(Kaufman, 1990) and parent rating scales for inattention, hyperactivity, and opposi-tional behaviours with the IOWA-Conners Behaviour Rating Scale (Conners, 1969)and the Rating scale for diagnosing (Swanson et al., 1981).
e procedure was composed of 10 minute periods spent either attending tofeedback, reading + feedback, or listening to a story + feedback. was recorded as
³One of the criticisms of the meta-analysis method is that inflates overall effect-size by omitting un-published data, which is more likely to contain null results. e Arns et al. (2009) paper addresses thisissue by discarding data violating assumed heterogeneity of effect-size, and by calculating the numberof null results required to negate a significant effect-size.
279
APPENDIX B. CLINICAL APPLICATIONS OF THE SMR PROTOCOL
the difference between Cz and Pz, and feedback was contingent on the presence/absenceof beta/theta in respect to baseline levels.
Following intervention the training group demonstrated improvements in -and inattention measures although there were no between group differences. e au-thors speculated that improvements were mediated by attentional performance,although they were unable to confirm this assertion as they did not explicitly measureattention. training data was not analysed because two different types of equip-ment had been used during the trial, and these had calculated training thresholdsdifferently, making it impossible to provide a consistent analysis of activity acrossthe study.
Linden et al. (1996) constitutes an important turning point in the lit-erature as it marks the beginning of an era of controlled study. It is the first to beconducted in the style of a clinical trial, and to include a control group. It does how-ever have several shortcomings. Firstly, the control condition was inactive, and soonly controlled for environmental effects without adjusting for the possible benefitsof participation. Secondly the data was not analysed, and as such the authorswere unable to demonstrate evidence of a link between training and outcome mea-sures. Finally, the assertion that improvements in were mediated by reductions inmeasures of inattention was not supported through correlation.
Although Linden et al. (1996) might be criticised for failing to disclose the termsof the relationship between and clinical measures, this discrepancy is also true ofthe field as a whole. Evidence in support of the clinical efficacy of in treating has grown rapidly in recent years, but this rate of progress has not been ac-companied by similar gains in the understanding of how neurofeedback works. In arecent meta-analysis of trials in treatment, Arns et al. (2009) argued thatin clinical terms at least, the question “Does work?” can be addressed withoutrecourse to understanding “How works.” For this reason the meta-analysis doesnot discriminate between different protocols and includes both spectral and trials.
e rationale for conducting a meta-analysis appears to have been performed inorder to re-consider the previous classification⁴ of as a “probably efficacious” form
⁴e Association for Applied Psychophysiology and Biofeedback () and the Society for Neu-ronal Regulation () jointly agreed a template for assessing the clinical efficacy of a biofeedback
280
APPENDIX B. CLINICAL APPLICATIONS OF THE SMR PROTOCOL
of treatment for (Monastra et al., 2005) in the light of the studies that hadsubsequently taken place, particularly those employing a randomised controlled trial design.
Studies included in the analysis were either collected from a neurofeedback bibli-ography (Hammond, 2008), a keyword search of the PubMed bibliographic database,or by approaching presenters at meetings of the Society of Applied Neuroscience() or the International Society for Neurofeedback and Research (). e stud-ies evaluated in the meta-analysis studies met specific inclusion criteria: participantshad a prior diagnosis of ; between-groups designs had either passive or com-parable active control groups; within-group designs were also included, as was a ret-rospective within-group study that had a large (n>500) population sample (Kaiserand Othmer, 2000). In addition to design requirements, all included studies werepublished in peer-reviewed journals, with one exception, documented in a PhD
intervention under scientific review (La Vaque et al., 2002). e levels of evidence of efficacy are asfollows:
1. Supported only by anecdotal reports and/or case studies in nonpeer reviewed venues. Notempirically supported.
2. Possibly Efficacious. At least one study of sufficient statistical power with well identified out-come measures, but lacking randomized assignment to a control condition internal to the study.
3. Probably Efficacious. Multiple observational studies, clinical studies, wait list controlled stud-ies, and within-subject and intrasubject replication studies that demonstrate efficacy.
4. Efficacious In a comparison with a no-treatment control group, alternative treatment group,or sham (placebo) control utilizing randomized assignment, the investigational treatment isshown to be statistically significantly superior to the control condition or the investigationaltreatment is equivalent to a treatment of established efficacy in a study with sufficient power todetect moderate differences,
(a) e studies have been conducted with a population treated for a specific problem, forwhom inclusion criteria are delineated in a reliable, operationally defined manner,
(b) e study used valid and clearly specified outcome measures related to the problem beingtreated,
(c) e data are subjected to appropriate data analysis,(d) e diagnostic and treatment variables and procedures are clearly defined in a manner
that permits replication of the study by independent researchers, and(e) e superiority or equivalence of the investigational treatment have been shown in at
least two independent research settings.
5. Efficacious and Specific. e investigational treatment has been shown to be statistically supe-rior to credible sham therapy, pill, or alternative bona fide treatment in at least two independentresearch settings.
281
APPENDIX B. CLINICAL APPLICATIONS OF THE SMR PROTOCOL
thesis (Bakhshayesh, 2010). Studies were only included if was conducted in a“standardized manner,” although in practice this is a fairly loose criterion as there areno established international standards for other than a tendency to use protocolsbased on previous studies. Included studies had to contain at least one measurefrom Impulsivity, Hyperactivity, or Inattention at pre and post intervention stages,and these measures had to be available as mean and standard deviation () statistics,either in the original report or by personal communication.
Considering the above criteria, several reports were deemed unsuitable. Two stud-ies were excluded as the s were not obtainable (Lubar et al., 1995; Linden et al.,1996); the only double-blind placebo controlled trials of (Picard, 2006; DeBeus,2006) and a controlled study (Fine et al., 1994) were excluded as they had been dis-seminated at conferences only.
e authors simplified the dataset before proceeding with analysis, categorisingall spectral training as one form, whether it was based on enhancement/thetasuppression, enhancement/beta-2 suppression, or beta-1 enhancement/theta sup-pression. Furthermore studies are also included under the category as it is hasbeen found that this type of helps to regulate cortical excitability via the samemechanism as based protocols: the striatum of the basal ganglia nuclear complex(Birbaumer, 2006).
e results of the analysis were principally based on two effect-size calculations, incontrolled studies the between-subjects post-pre differences in each group were com-pared to pooled pre-test s to calculate the size of between-group effects. in betweenand within-subjects studies pre and post means and s were used to calculateeffect-size. e extent of effect-sizes were adjusted to express their 95% confidenceintervals, and grand means of all studies were computed to give an overall indicationof clinical relevance in measures of Inattention, Hyperactivity and Impulsivity. emeta-analysis included two safeguarding measures designed to improve the validity ofthe exercise, firstly the heterogeneity of effect-size (the Qt statistic) was used to filterout studies with especially diverse results, and secondly the fail-safe number calculatedthe amount of unpublished null results that would be required to reject a significantgrand-average effect-size.
In inattention and impulsivity vs. control effect-size was described as large(Cohen, 1992). e fail-safe figure established that more than 52 unpublished null
282
APPENDIX B. CLINICAL APPLICATIONS OF THE SMR PROTOCOL
results would be required to revoke the effect on inattention, and 37 on impulsivity. Inhyperactivity the contrast disclosed a medium effect-size, with a fail-safe figure of 15.4. vs. methylphenidate comparisons were only possible in impulsivity measures, andshowed no difference in effect-size. In pre-post comparisons all contrasts revealedlarge effect-sizes and fail-safe figures of more than 320 — effect-sizes were larger inwithin- than between-subject studies, which the authors attributed to the effectivenessof active controls such as computerised attention training (Gevensleben et al., 2009b;Holtmann et al., 2009) or biofeedback training (Bakhshayesh, 2010).
Having pooled studies that were different in potentially significant ways, post-hocchecks were performed to probe for difference in effect-size by protocol (smr/theta,beta/theta, smr/high-beta, and ), studies conducted before and after 2006, stud-ies employing or not, and studies in which no participants were on medicationagainst those with some. Of the above comparisons, only randomisation proved sig-nificant, with s producing studies with a significantly lower effect-size in hyper-activity only, which indicates the importance of randomisation. e final post-hoccheck was a correlation between effect and outcome measures, and it was found thatthat studies with more training produced a greater reduction in inattention measures.
In summing up, the authors take the addition of 3 s (Gevensleben et al.,2009b; Holtmann et al., 2009; Bakhshayesh, 2010) into the literature as evidenceenough that for is suitable for classification as ‘efficacious and specific,’the highest rating of clinical efficacy according to the / template (La Vaqueet al., 2002). is assertion is largely based on the grounds that the s mentionedused ‘semi-active’ controls that also had some efficacy in reducing symptoms,and controlled for the ‘cognitive training’ criticism levelled at s use of attentiondemanding exercises (Loo and Barkley, 2005).
In evaluating this analysis, the first critical issue is its scope. e authors explic-itly forego any examination of ‘how’ works, preferring instead to concentrate onthe principal issue of ‘if ’ works. Whilst this allows a straightforward analysis of amixed dataset with many protocol differences, it is also unable to show how theydiffer, leading the authors to speculate that the same mechanism underlies all the variant and protocols. e problem then is that this method, whilst demonstrat-ing the efficacy of in treating symptoms of inattention and impulsivity is not ableto address the question of why doesn’t effectively modulate hyperactivity. De-
283
APPENDIX B. CLINICAL APPLICATIONS OF THE SMR PROTOCOL
spite this concern, it should be noted that that hyperactivity is measured by parentand teacher questionnaires, whilst inattention and impulsivity are often measured byGo-NoGo tasks such as the , which may be more sensitive to small changes inbehaviour. Another criticism of the analysis is that although the fail-safe statistics ap-pear to offer a reasonable margin of error: 52 for inattention, 37 for impulsivity and15 for hyperactivity, there have been approximately 60 papers published on and since 1995 (Hammond, 2008), so the problem of bias can not be completelyruled out. e authors attempt to deflect this issue by indicating that they includedadditional unpublished data, obtained by personal communication with the writersof the original studies, so to an extent it does appear that unpublished data are at leastpartly represented here, although the actual amount is unclear. Inspection of the for-est plots of effect-size do indicate a positive bias, and although this may be a productof effects, the inherent issue of exclusivity in meta-analysis may explain why, intheir closing statement, the authors emphasise the results of the s on inattentionand impulsivity over and above those of the meta-analysis.
Of the three recent s analysed by Arns et al. (2009), there is strong contrast inthe reach of the trials. Holtmann et al. (2009) is a pilot study published in a Germanjournal, and Bakhshayesh (2010) is a PhD thesis, in German. On the other hand(Gevensleben et al., 2009b,a, 2010) are published in international journals written inEnglish, but more significantly, this trial contains the best experimental design seenin an study to date, including a large sample (n=94) recruited at three researchcentres across Germany, a suitable alternative control treatment, both clinical and based outcome measures, a comparison of spectral and potential based protocols,and a long-term clinical follow-up study. As such, this study in particular is worthsingling out for further examination.
Besides having the best experimental design of any study, the Gevenslebenet al. (2009b) study also marks a turning point in the use of randomisation. In themid-2000’s several researchers who, bearing in mind that is considered an al-ternative to pharmacological intervention in , attempted to subject to thesame kind of comparisons used in medical trials, namely the double blind placebocontrolled trial (Picard, 2006; DeBeus, 2006; Orlandi and Greco, 2005). Yet allattempts to do so have remained unpublished. In Orlandi and Greco (2005) theauthor described the problem of high-drop out rates in a control group as these sub-
284
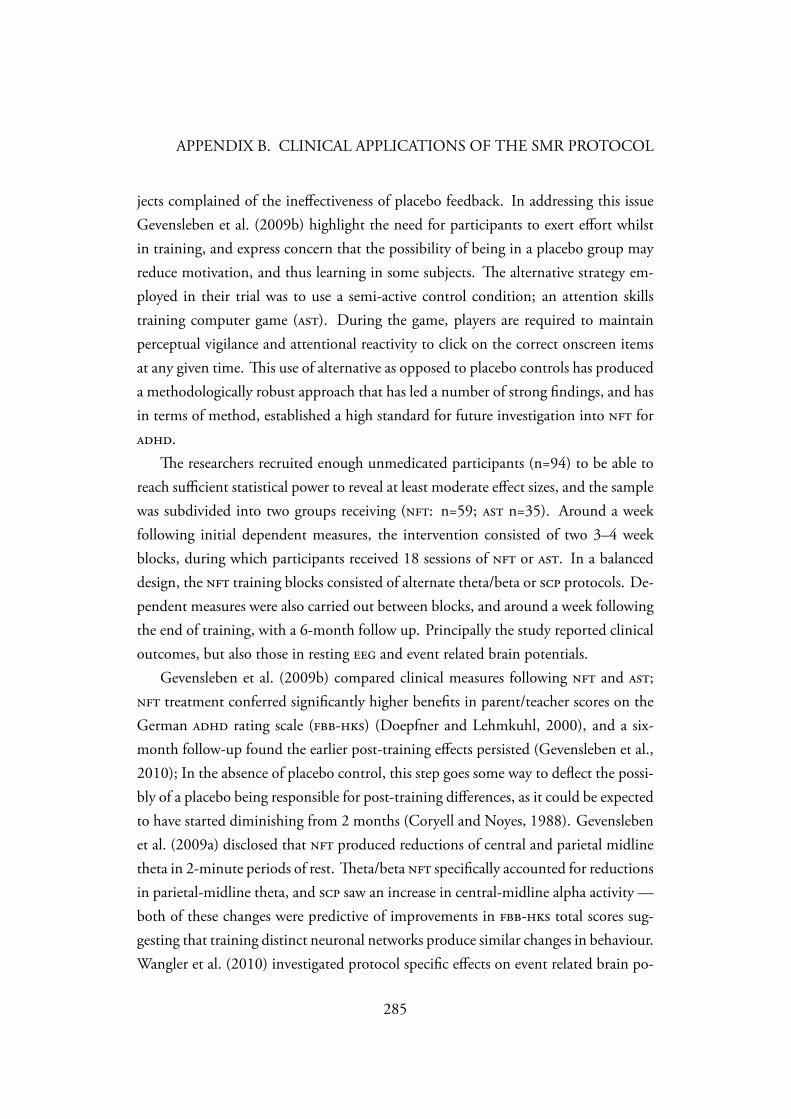
APPENDIX B. CLINICAL APPLICATIONS OF THE SMR PROTOCOL
jects complained of the ineffectiveness of placebo feedback. In addressing this issueGevensleben et al. (2009b) highlight the need for participants to exert effort whilstin training, and express concern that the possibility of being in a placebo group mayreduce motivation, and thus learning in some subjects. e alternative strategy em-ployed in their trial was to use a semi-active control condition; an attention skillstraining computer game (). During the game, players are required to maintainperceptual vigilance and attentional reactivity to click on the correct onscreen itemsat any given time. is use of alternative as opposed to placebo controls has produceda methodologically robust approach that has led a number of strong findings, and hasin terms of method, established a high standard for future investigation into for.
e researchers recruited enough unmedicated participants (n=94) to be able toreach sufficient statistical power to reveal at least moderate effect sizes, and the samplewas subdivided into two groups receiving (: n=59; n=35). Around a weekfollowing initial dependent measures, the intervention consisted of two 3–4 weekblocks, during which participants received 18 sessions of or . In a balanceddesign, the training blocks consisted of alternate theta/beta or protocols. De-pendent measures were also carried out between blocks, and around a week followingthe end of training, with a 6-month follow up. Principally the study reported clinicaloutcomes, but also those in resting and event related brain potentials.
Gevensleben et al. (2009b) compared clinical measures following and ; treatment conferred significantly higher benefits in parent/teacher scores on theGerman rating scale (-) (Doepfner and Lehmkuhl, 2000), and a six-month follow-up found the earlier post-training effects persisted (Gevensleben et al.,2010); In the absence of placebo control, this step goes some way to deflect the possi-bly of a placebo being responsible for post-training differences, as it could be expectedto have started diminishing from 2 months (Coryell and Noyes, 1988). Gevenslebenet al. (2009a) disclosed that produced reductions of central and parietal midlinetheta in 2-minute periods of rest. eta/beta specifically accounted for reductionsin parietal-midline theta, and saw an increase in central-midline alpha activity —both of these changes were predictive of improvements in - total scores sug-gesting that training distinct neuronal networks produce similar changes in behaviour.Wangler et al. (2010) investigated protocol specific effects on event related brain po-
285
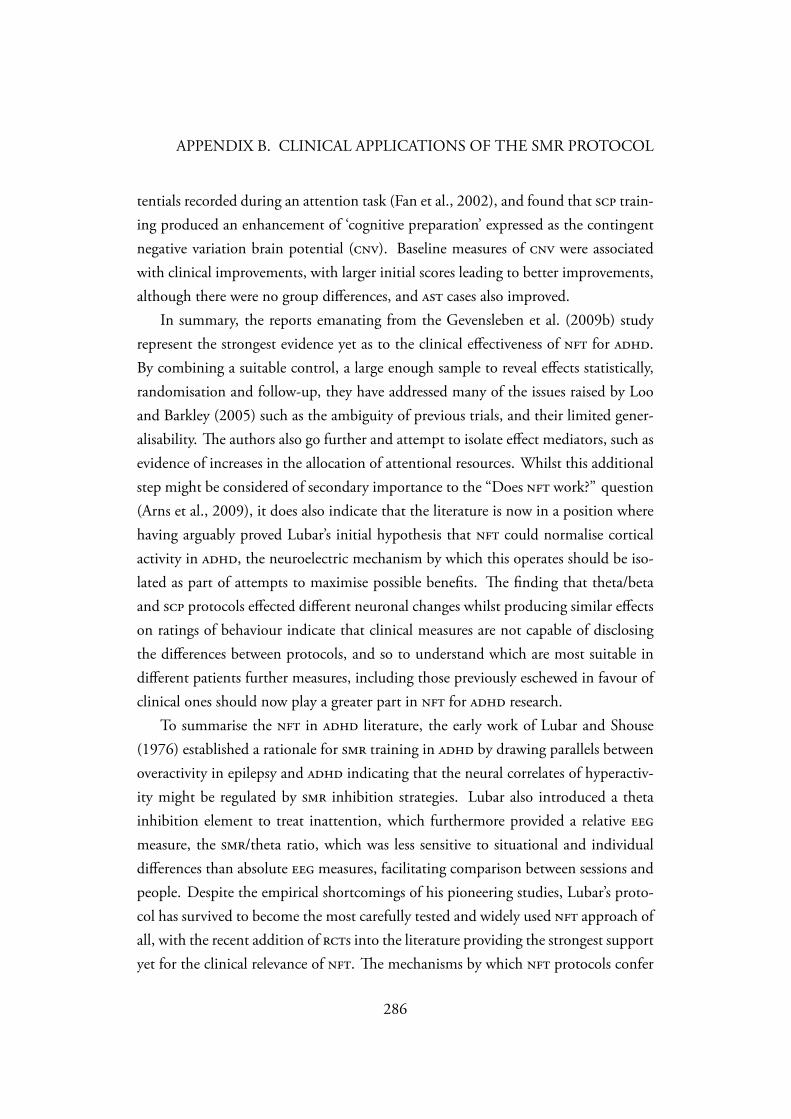
APPENDIX B. CLINICAL APPLICATIONS OF THE SMR PROTOCOL
tentials recorded during an attention task (Fan et al., 2002), and found that train-ing produced an enhancement of ‘cognitive preparation’ expressed as the contingentnegative variation brain potential (). Baseline measures of were associatedwith clinical improvements, with larger initial scores leading to better improvements,although there were no group differences, and cases also improved.
In summary, the reports emanating from the Gevensleben et al. (2009b) studyrepresent the strongest evidence yet as to the clinical effectiveness of for .By combining a suitable control, a large enough sample to reveal effects statistically,randomisation and follow-up, they have addressed many of the issues raised by Looand Barkley (2005) such as the ambiguity of previous trials, and their limited gener-alisability. e authors also go further and attempt to isolate effect mediators, such asevidence of increases in the allocation of attentional resources. Whilst this additionalstep might be considered of secondary importance to the “Does work?” question(Arns et al., 2009), it does also indicate that the literature is now in a position wherehaving arguably proved Lubar’s initial hypothesis that could normalise corticalactivity in , the neuroelectric mechanism by which this operates should be iso-lated as part of attempts to maximise possible benefits. e finding that theta/betaand protocols effected different neuronal changes whilst producing similar effectson ratings of behaviour indicate that clinical measures are not capable of disclosingthe differences between protocols, and so to understand which are most suitable indifferent patients further measures, including those previously eschewed in favour ofclinical ones should now play a greater part in for research.
To summarise the in literature, the early work of Lubar and Shouse(1976) established a rationale for training in by drawing parallels betweenoveractivity in epilepsy and indicating that the neural correlates of hyperactiv-ity might be regulated by inhibition strategies. Lubar also introduced a thetainhibition element to treat inattention, which furthermore provided a relative measure, the /theta ratio, which was less sensitive to situational and individualdifferences than absolute measures, facilitating comparison between sessions andpeople. Despite the empirical shortcomings of his pioneering studies, Lubar’s proto-col has survived to become the most carefully tested and widely used approach ofall, with the recent addition of s into the literature providing the strongest supportyet for the clinical relevance of . e mechanisms by which protocols confer
286

APPENDIX B. CLINICAL APPLICATIONS OF THE SMR PROTOCOL
clinical benefits in have not been isolated, although protocol specificity is beingaddressed in recent literature.
287
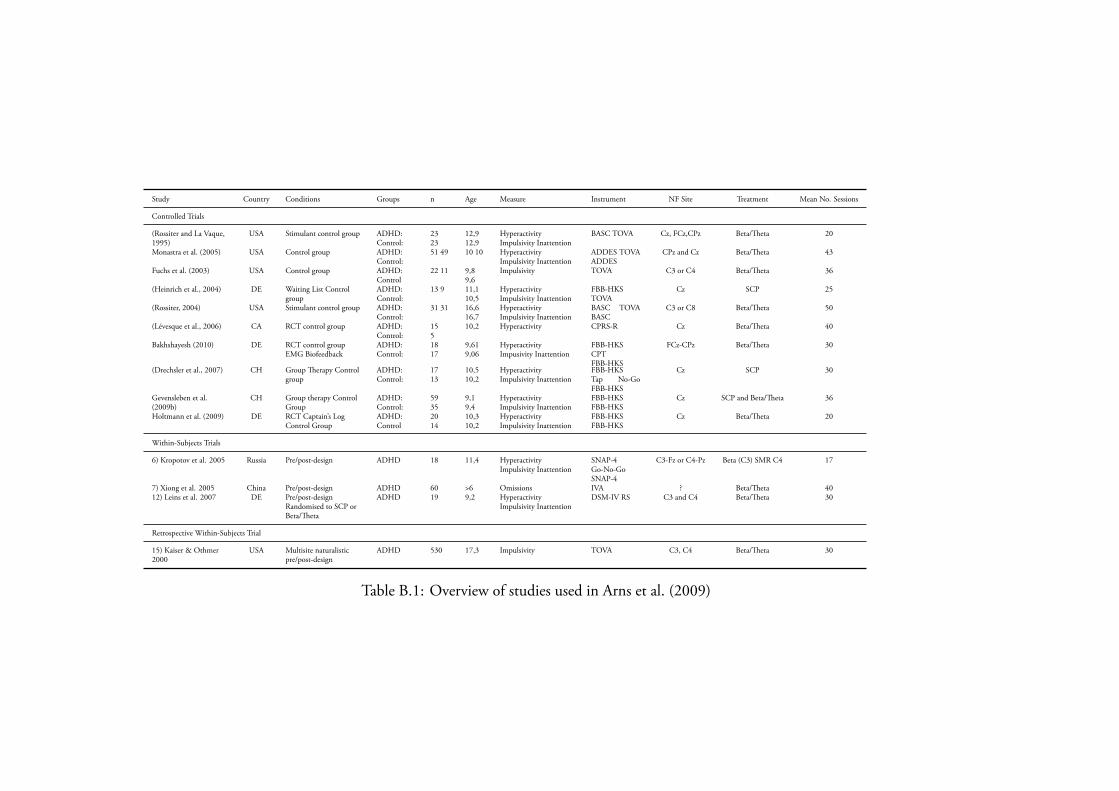
Study Country Conditions Groups n Age Measure Instrument NF Site Treatment Mean No. Sessions
Controlled Trials
(Rossiter and La Vaque,1995)
USA Stimulant control group ADHD:Control:
2323
12,912,9
HyperactivityImpulsivity Inattention
BASC TOVA Cz, FCz,CPz Beta/eta 20
Monastra et al. (2005) USA Control group ADHD:Control:
51 49 10 10 HyperactivityImpulsivity Inattention
ADDES TOVAADDES
CPz and Cz Beta/eta 43
Fuchs et al. (2003) USA Control group ADHD:Control
22 11 9,89,6
Impulsivity TOVA C3 or C4 Beta/eta 36
(Heinrich et al., 2004) DE Waiting List Controlgroup
ADHD:Control:
13 9 11,110,5
HyperactivityImpulsivity Inattention
FBB-HKSTOVA
Cz SCP 25
(Rossiter, 2004) USA Stimulant control group ADHD:Control:
31 31 16,616,7
HyperactivityImpulsivity Inattention
BASC TOVABASC
C3 or C8 Beta/eta 50
(Lévesque et al., 2006) CA RCT control group ADHD:Control:
155
10,2 Hyperactivity CPRS-R Cz Beta/eta 40
Bakhshayesh (2010) DE RCT control groupEMG Biofeedback
ADHD:Control:
1817
9,619,06
HyperactivityImpusivity Inattention
FBB-HKSCPTFBB-HKS
FCz-CPz Beta/eta 30
(Drechsler et al., 2007) CH Group erapy Controlgroup
ADHD:Control:
1713
10,510,2
HyperactivityImpulsivity Inattention
FBB-HKSTap No-GoFBB-HKS
Cz SCP 30
Gevensleben et al.(2009b)
CH Group therapy ControlGroup
ADHD:Control:
5935
9,19,4
HyperactivityImpulsivity Inattention
FBB-HKSFBB-HKS
Cz SCP and Beta/eta 36
Holtmann et al. (2009) DE RCT Captain’s LogControl Group
ADHD:Control
2014
10,310,2
HyperactivityImpulsivity Inattention
FBB-HKSFBB-HKS
Cz Beta/eta 20
Within-Subjects Trials
6) Kropotov et al. 2005 Russia Pre/post-design ADHD 18 11,4 HyperactivityImpulsivity Inattention
SNAP-4Go-No-GoSNAP-4
C3-Fz or C4-Pz Beta (C3) SMR C4 17
7) Xiong et al. 2005 China Pre/post-design ADHD 60 >6 Omissions IVA ? Beta/eta 4012) Leins et al. 2007 DE Pre/post-design
Randomised to SCP orBeta/eta
ADHD 19 9,2 HyperactivityImpulsivity Inattention
DSM-IV RS C3 and C4 Beta/eta 30
Retrospective Within-Subjects Trial
15) Kaiser & Othmer2000
USA Multisite naturalisticpre/post-design
ADHD 530 17,3 Impulsivity TOVA C3, C4 Beta/eta 30
Table B.1: Overview of studies used in Arns et al. (2009)
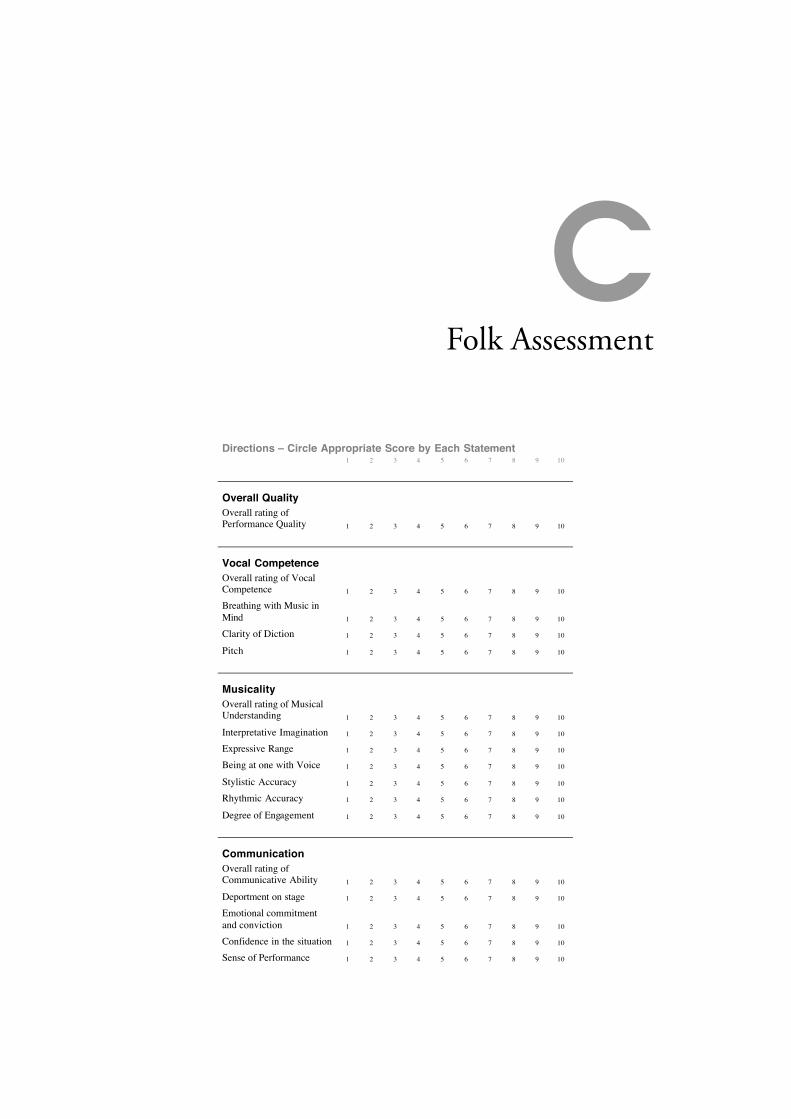
CFolk Assessment
Making Waves – Folk Song Performance
Assessors Name …………………………
Date …………………………
Performance ID …………………………
Directions – Circle Appropriate Score by Each Statement
1 2 3 4 5 6 7 8 9 10
Overall Quality
Overall rating of Performance Quality 1 2 3 4 5 6 7 8 9 10
Vocal Competence
Overall rating of Vocal Competence 1 2 3 4 5 6 7 8 9 10
Breathing with Music in
Mind 1 2 3 4 5 6 7 8 9 10
Clarity of Diction 1 2 3 4 5 6 7 8 9 10
Pitch 1 2 3 4 5 6 7 8 9 10
Musicality
Overall rating of Musical Understanding 1 2 3 4 5 6 7 8 9 10
Interpretative Imagination 1 2 3 4 5 6 7 8 9 10
Expressive Range 1 2 3 4 5 6 7 8 9 10
Being at one with Voice 1 2 3 4 5 6 7 8 9 10
Stylistic Accuracy 1 2 3 4 5 6 7 8 9 10
Rhythmic Accuracy 1 2 3 4 5 6 7 8 9 10
Degree of Engagement 1 2 3 4 5 6 7 8 9 10
Communication
Overall rating of Communicative Ability 1 2 3 4 5 6 7 8 9 10
Deportment on stage 1 2 3 4 5 6 7 8 9 10
Emotional commitment
and conviction 1 2 3 4 5 6 7 8 9 10
Confidence in the situation 1 2 3 4 5 6 7 8 9 10
Sense of Performance 1 2 3 4 5 6 7 8 9 10
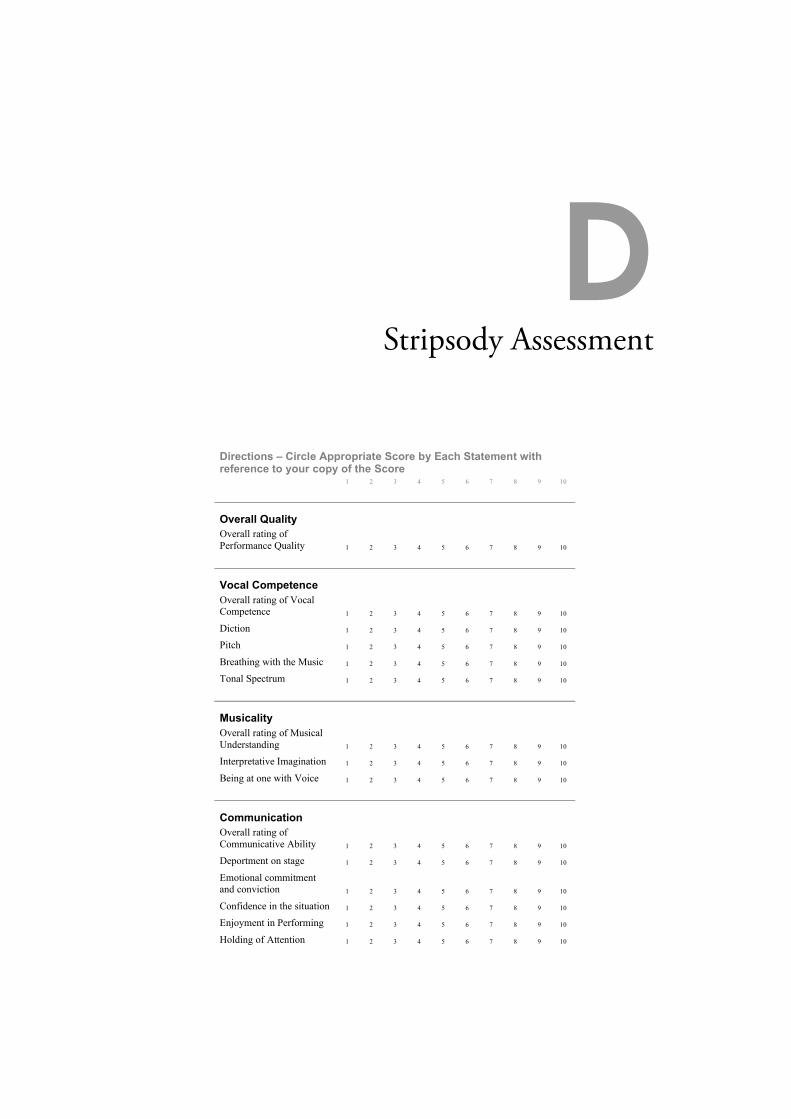
DStripsody Assessment
Making Waves – Stripsody Performance
Assessors Name …………………………
Date …………………………
Performance ID …………………………
Directions – Circle Appropriate Score by Each Statement with reference to your copy of the Score
1 2 3 4 5 6 7 8 9 10
Overall Quality
Overall rating of
Performance Quality 1 2 3 4 5 6 7 8 9 10
Vocal Competence
Overall rating of Vocal
Competence 1 2 3 4 5 6 7 8 9 10
Diction 1 2 3 4 5 6 7 8 9 10
Pitch 1 2 3 4 5 6 7 8 9 10
Breathing with the Music 1 2 3 4 5 6 7 8 9 10
Tonal Spectrum 1 2 3 4 5 6 7 8 9 10
Musicality
Overall rating of Musical
Understanding 1 2 3 4 5 6 7 8 9 10
Interpretative Imagination 1 2 3 4 5 6 7 8 9 10
Being at one with Voice 1 2 3 4 5 6 7 8 9 10
Communication
Overall rating of
Communicative Ability 1 2 3 4 5 6 7 8 9 10
Deportment on stage 1 2 3 4 5 6 7 8 9 10
Emotional commitment
and conviction 1 2 3 4 5 6 7 8 9 10
Confidence in the situation 1 2 3 4 5 6 7 8 9 10
Enjoyment in Performing 1 2 3 4 5 6 7 8 9 10
Holding of Attention 1 2 3 4 5 6 7 8 9 10
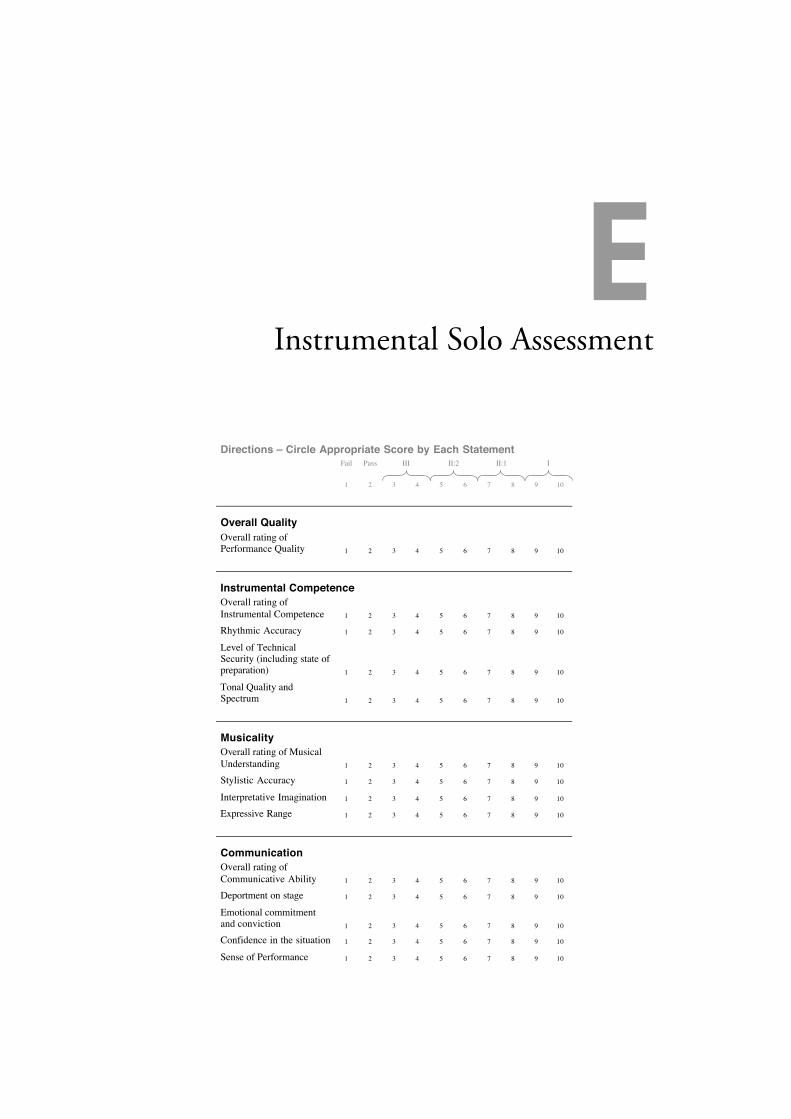
EInstrumental Solo Assessment
Making Waves – Instrumental Performance 1
Assessors Name …………………………
Date …………………………
Performance ID …………………………
Directions – Circle Appropriate Score by Each Statement
Fail Pass III II:2 II:1 I
1 2 3 4 5 6 7 8 9 10
Overall Quality
Overall rating of Performance Quality 1 2 3 4 5 6 7 8 9 10
Instrumental Competence
Overall rating of
Instrumental Competence 1 2 3 4 5 6 7 8 9 10
Rhythmic Accuracy 1 2 3 4 5 6 7 8 9 10
Level of Technical Security (including state of preparation) 1 2 3 4 5 6 7 8 9 10
Tonal Quality and Spectrum 1 2 3 4 5 6 7 8 9 10
Musicality
Overall rating of Musical
Understanding 1 2 3 4 5 6 7 8 9 10
Stylistic Accuracy 1 2 3 4 5 6 7 8 9 10
Interpretative Imagination 1 2 3 4 5 6 7 8 9 10
Expressive Range 1 2 3 4 5 6 7 8 9 10
Communication
Overall rating of
Communicative Ability 1 2 3 4 5 6 7 8 9 10
Deportment on stage 1 2 3 4 5 6 7 8 9 10
Emotional commitment and conviction 1 2 3 4 5 6 7 8 9 10
Confidence in the situation 1 2 3 4 5 6 7 8 9 10
Sense of Performance 1 2 3 4 5 6 7 8 9 10
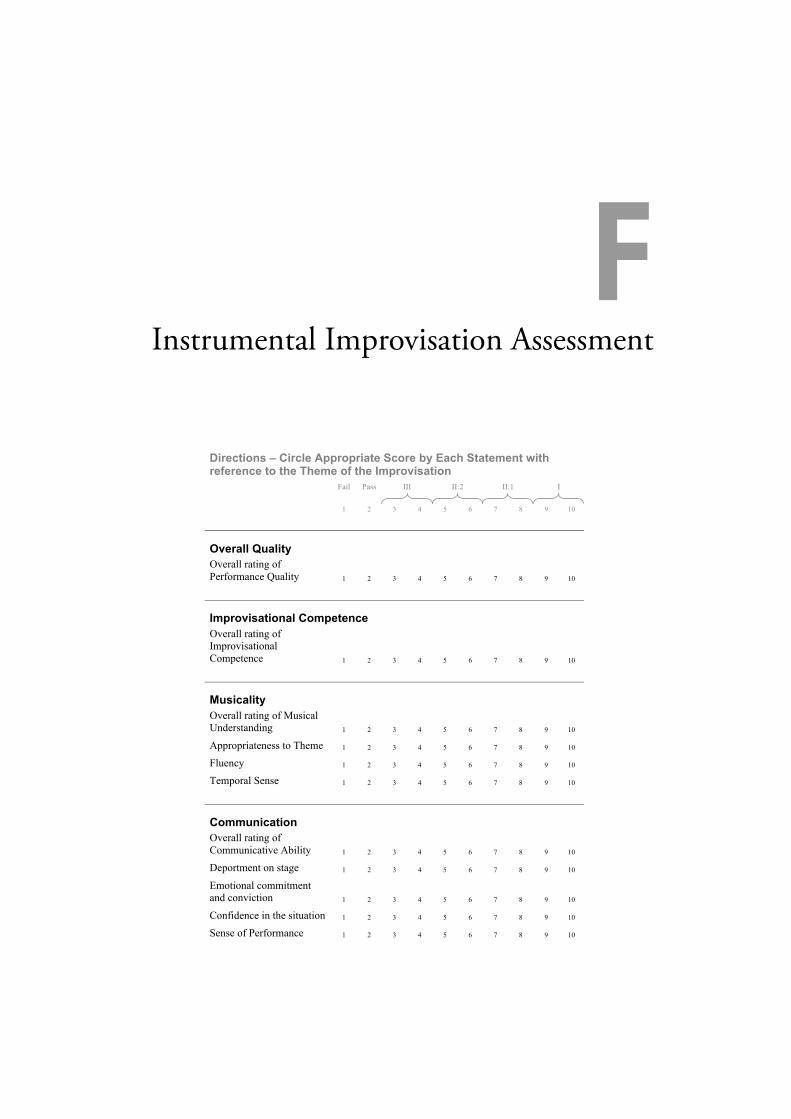
FInstrumental Improvisation AssessmentMaking Waves – Instrumental Improvisation
Assessors Name
Date
Performance ID
Improvisation Theme
Directions – Circle Appropriate Score by Each Statement with reference to the Theme of the Improvisation
Fail Pass III II:2 II:1 I
1 2 3 4 5 6 7 8 9 10
Overall Quality
Overall rating of
Performance Quality 1 2 3 4 5 6 7 8 9 10
Improvisational Competence
Overall rating of
Improvisational
Competence 1 2 3 4 5 6 7 8 9 10
Musicality
Overall rating of Musical
Understanding 1 2 3 4 5 6 7 8 9 10
Appropriateness to Theme 1 2 3 4 5 6 7 8 9 10
Fluency 1 2 3 4 5 6 7 8 9 10
Temporal Sense 1 2 3 4 5 6 7 8 9 10
Communication
Overall rating of
Communicative Ability 1 2 3 4 5 6 7 8 9 10
Deportment on stage 1 2 3 4 5 6 7 8 9 10
Emotional commitment
and conviction 1 2 3 4 5 6 7 8 9 10
Confidence in the situation 1 2 3 4 5 6 7 8 9 10
Sense of Performance 1 2 3 4 5 6 7 8 9 10

G10–20 system of EEG electrode
locations
Bibliography
Aeschbach, D., Postolache, T. T., Sher, L., Matthews, J. R., Jackson, M. A., and Wehr, T. A. (2001).Evidence from the waking electroencephalogram that short sleepers live under higher homeostaticsleep pressure than long sleepers. Neuroscience, 102(3):493–502.
Amabile, T. (1982). Social psychology of creativity: A consensual assessment technique. J. Pers. Soc.Psychol., 43(5):997–1013.
Amabile, T. (1996). Creativity in Context: Update to the Social Psychology of Creativity. Westview Press,Cumnor Hill, Oxford.
Amthauer, R. (1970). Intelligenz struktur test (ist 70, 4. aufl.).[test of the structure of intelligence].Gottingen, Stuttgart: Hogrefe.
Amzica, F. and Steriade, M. (2002). e functional significance of K-complexes. Sleep MedicineReviews, 6(2):139–149.
Anand, B., Chhina, G., and Singh, B. (1961). Some aspects of electroencephalographic studies inyogis. Electroencephalogr. Clin. Neurophysiol., 13(3):452–456.
Andersen, P. and Andersson, S. (1968). Physiological basis of the alpha rhythm. Plenum Pub Corp, NewYork.
Arden, R., Chavez, R. S., Grazioplene, R., and Jung, R. E. (2010). Neuroimaging creativity: A psy-chometric view. Behav. Brain Res., 214(2):143–156.
Arns, M., de Ridder, S., Strehl, U., Breteler, M., and Coenen, A. (2009). Efficacy of neurofeedbacktreatment in adhd: the effects on inattention, impulsivity and hyperactivity: a meta-analysis. Clin.EEG Neurosci., 40(3):180–9.
Backhaus, J. and Junghanns, K. (2006). Daytime naps improve procedural motor memory. SleepMedicine, 7(6):508.
Bakhshayesh, A. (2010). Die Wirksamkeit von Neurofeedback im Vergleich zum EMG-Biofeedback beider Behandlung von ADHS-Kindern. GRIN Verlag.
Bangert, M. and Altenmüller, E. O. (2003). Mapping perception to action in piano practice: a longi-tudinal DC-EEG study. BMC Neurosci, 4:26.
Banquet, J. (1973). Spectral analysis of the EEG in meditation. Electroencephalogr. Clin. Neurophysiol.,35(2):143–151.
294
BIBLIOGRAPHY
Barceló, F. and Knight, R. T. (2002). Both random and perseverative errors underlie wcst deficits inprefrontal patients. Neuropsychologia, 40(3):349–56.
Barnea, A., Rassis, A., and Zaidel, E. (2005). Effect of neurofeedback on hemispheric word recognition.Brain Cogn., 59(3):314–21.
Beck, A. T. and Steer, R. A. (1984). Internal consistencies of the original and revised beck depressioninventory. J. Clin. Psychol., 40(6):1365–7.
Begic, D., Hotujac, L., and Jokic-Begic, N. (2001). Electroencephalographic comparison of veter-ans with combat-related post-traumatic stress disorder and healthy subjects. Int. J. Psychophysiol.,40(2):167–72.
Bengtsson, S., Csikszentmihalyi, M., and Ullen, F. (2007). Cortical Regions Involved in the Genera-tion of Musical Structures during Improvisation in Pianists. J. Cogn. Neurosci., 19(5):830–842.
Berberian, C. (1966). Stripsody. C.F. Peters.
Berg, E. A. (1948). A simple objective technique for measuring flexibility in thinking. J. Gen. Psychol.,39:15–22.
Berger, H. (1929). Uber das elektrenkephalogramm des menschen. Arch. Psychiatr. Nervenkr., 87:527–570.
Berkowitz, A. and Ansari, D. (2008). Generation of novel motor sequences: e neural correlates ofmusical improvisation. Neuroimage.
Berkowitz, A. and Ansari, D. (2010). Expertise-related deactivation of the right temporoparietal junc-tion during musical improvisation. Neuroimage, 49(1):712–719.
Bessel, J. and Gevirtz, R. (1998). Effects of breathing retraining versus cognitive techniques on cog-nitive and somatic components of state anxiety and on performance of female gymnasts. BiologicalPsychology, 48(1):18.
Bharucha, J. J. (1984). Anchoring effects in music: e resolution of dissonance. Cognit. Psychol.,16(4):485–518.
Birbaumer, N. (1999). Slow cortical potentials: Plasticity, operant control, and behavioral effects. eNeuroscientist, 5(2):74.
Birbaumer, N. (2006). Breaking the silence: brain-computer interfaces (bci) for communication andmotor control. Psychophysiology, 43(6):517–32.
295
BIBLIOGRAPHY
Birbaumer, N., Elbert, T., Rockstroh, B., Daum, I., Wolf, P., and Canavan, A. (1991). Clinical-psychological treatment of epileptic seizures: A controlled study. Perspectives and promises in clinicalpsychology, pages 81–96.
Bland, B. H. and Oddie, S. D. (2001). eta band oscillation and synchrony in the hippocampalformation and associated structures: the case for its role in sensorimotor integration. Behav. BrainRes., 127(1-2):119–36.
Bland, J. M. and Altman, D. G. (1994). Regression towards the mean. BMJ, 308(6942):1499.
Bodenhamer-Davis, E., Callaway, T., and DeBeus, M. (2004). Extended follow-up of peniston pro-tocol results with chemical dependency. Journal of Neurotherapy, 8:135–135.
Boynton, T. (2001). Applied research using alpha/theta training for enhancing creativity and well-being. Journal of Neurotherapy, 5(1/2):5–18.
Brennan, M. (1982). Relationship Between Creative Ability in Dance and Selected Creative Attributes.Percept. Mot. Skills, 55(1):p47–56.
Breton, A. (1924). Le manifeste du surréalisme. Manifesto.
Britten, B. (1948). Folksong arrangements volume 1 british isles : Medium voice. Boosey and Hawkespp22.
Brooks, A. and Lack, L. (2006). A brief afternoon nap following nocturnal sleep restriction: whichnap duration is most recuperative? Sleep, 29(6):831–40.
Brotons, M. (1994). Effects of performing conditions on music performance anxiety and performancequality. J. Music er., 31:63–63.
Brown, B. (1974). New mind, new body: bio-feedback: new directions for the mind. Harper & Row,New York.
Brown, B. (1975a). Biofeedback: An exercise in self control. Saturday Rev.
Brown, B. (1975b). e biofeedback syllabus: A handbook for the psychophysiologic study of biofeedback.Charles C. omas Publisher, Springfield, Ill.
Brown, B. B. (1970a). Awareness of EEG-subjective activity relationships detected within a closedfeedback system. Psychophysiology, 7(3):451–64.
Brown, B. B. (1970b). Recognition of aspects of consciousness through association with EEG alphaactivity represented by a light signal. Psychophysiology, 6(4):442–52.
296
BIBLIOGRAPHY
Brown, S., Martinez, M., and Parsons, L. (2006). Music and language side by side in the brain: a PETstudy of the generation of melodies and sentences. Eur. J. Neurosci., 23(10):2791–2803.
Bryan-Kinns, N., Healey, P. G., and Leach, J. (2007). Exploring mutual engagement in creativecollaborations. In Proceedings of the 6th ACM SIGCHI conference on Creativity & cognition, pages223–232. ACM.
Bullock, T., Orkand, R., and Grinnell, A. (1977). Introduction to nervous systems. WH Freeman SanFrancisco, San Francisco.
Burgess, A. P. and Gruzelier, J. H. (1997). Short duration synchronization of human theta rhythmduring recognition memory. Neuroreport, 8(4):1039–42.
Burgess, A. P. and Gruzelier, J. H. (2000). Short duration power changes in the EEG during recognitionmemory for words and faces. Psychophysiology, 37(5):596–606.
Burkett, S., Cummins, J., Dickson, R., and Skolnick, M. (2003). Neurofeedback in the treatment ofaddiction with a homeless population. In ISNR 11 annual conference, Houston, September, pages18–21.
Buzsáki, G. (2002). eta oscillations in the hippocampus. Neuron, 33(3):325–40.
Buzsáki, G. (2005). eta rhythm of navigation: link between path integration and landmark naviga-tion, episodic and semantic memory. Hippocampus, 15(7):827–40.
Cabeza, R. and Nyberg, L. (2000). Imaging cognition ii: An empirical review of 275 PET and fmristudies. J. Cogn. Neurosci., 12(1):1–47.
Cai, D., Mednick, S., Harrison, E., Kanady, J., and Mednick, S. (2009). REM, not incubation,improves creativity by priming associative networks. Proceedings of the National Academy of Sciences,106(25):10130.
Cajochen, C., Brunner, D. P., Kräuchi, K., Graw, P., and Wirz-Justice, A. (1995). Power density intheta/alpha frequencies of the waking EEG progressively increases during sustained wakefulness.Sleep, 18(10):890–4.
Callaway, T. and Bodenhamer-Davis, E. (2008). Long-term follow-up of a clinical replication of thepeniston protocol for chemical dependency. Journal of Neurotherapy, 12(4):243–259.
Cantero, J. L., Atienza, M., Stickgold, R., Kahana, M. J., Madsen, J. R., and Kocsis, B. (2003). Sleep-dependent theta oscillations in the human hippocampus and neocortex. J. Neurosci., 23(34):10897–903.
Chamorro-Premuzic, T. and Reichenbacher, L. (2008). Effects of personality and threat of evaluationon divergent and convergent thinking. Journal of Research in Personality.
297
BIBLIOGRAPHY
Christensen, P., Guilford, J., Merrifield, P., and Wilson, R. (1960a). Alternate uses form B and C.
Christensen, P., Guilford, J., Merrifield, R., and Wilson, R. (1960b). Alternate uses test. Beverly Hills,CA: Sheridan Psychological Service.
Ciçek, M. and Nalçaci, E. (2001). Interhemispheric asymmetry of EEG alpha activity at rest andduring the wisconsin card sorting test: relations with performance. Biol. Psychol., 58(1):75–88.
Cohen, J. (1988). Statistical Power Analysis for the Behavioral Sciences (2nd Edition). L. ErlbaumAssociates, Hillsdale, New Jersey.
Cohen, J. (1992). A power primer. Psychol. Bull., 112(1):155–9.
Coleridge, S. (1816). Kubla khan, or a vision in a dream. a fragment. poem.
Conners, C. (1969). A teacher rating scale for use in drug studies with children. Am. J. Psychiatry,126(6):884.
Contreras, D., Destexhe, A., Sejnowski, T., and Steriade, M. (1996). Control of spatiotemporal co-herence of a thalamic oscillation by corticothalamic feedback. Science, 274(5288):771.
Coryell, W. and Noyes, R. (1988). Placebo response in panic disorder. Am. J. Psychiatry, 145(9):1138–40.
Costa, P. T. and McCrae, R. R. (1985). e NEO personality inventory: Manual, form S and form R.Psychological Assessment Resources, Odessa, Fla.
Creech, A., Papageorgi, I., Duffy, C., Morton, F., Hadden, E., Potter, J., De Bezenac, C., Whyton,T., Himonides, E., and Welch, G. (2008). Investigating musical performance: commonality anddiversity among classical and non-classical musicians. Music education research, 10(2):215–234.
Crider, A., Shapiro, D., and Tursky, B. (1966). Reinforcement of spontaneous electrodermal activity.J. Comp. Physiol. Psychol., 61(1):20–27.
Csikszentmihalyi, M. (1997). Flow and the psychology of discovery and invention. HarperPerennial,New York.
Cycowicz, Y. M., Friedman, D., and Snodgrass, J. G. (2001). Remembering the color of objects: anerp investigation of source memory. Cereb. Cortex, 11(4):322–34.
da Silva, F. H., van Lierop, T. H., Schrijer, C. F., and van Leeuwen, W. S. (1973). Organization ofthalamic and cortical alpha rhythms: spectra and coherences. Electroencephalogr. Clin. Neurophysiol.,35(6):627–39.
298
BIBLIOGRAPHY
Daum, I., Rockstroh, B., Birbaumer, N., Elbert, T., Canavan, A., and Lutzenberger, W. (1993). Be-havioural treatment of slow cortical potentials in intractable epilepsy: neuropsychological predictorsof outcome. J. Neurol. Neurosurg. Psychiatry, 56(1):94–7.
De Gennaro, L., Ferrara, M., and Bertini, M. (2001). e boundary between wakefulness and sleep:quantitative electroencephalographic changes during the sleep onset period. Neuroscience, 107(1):1–11.
DeBeus, R. (2006). Efficacy of attention training for children with adhd: Efficacy of attention trainingfor children with adhd: A randomized double-blind placebo-controlled study. In ISNR conference,Atlanta, GA, USA.
deCharms, R. C., Maeda, F., Glover, G. H., Ludlow, D., Pauly, J. M., Soneji, D., Gabrieli, J. D. E., andMackey, S. C. (2005). Control over brain activation and pain learned by using real-time functionalMRI. Proc. Natl. Acad. Sci. U. S. A., 102(51):18626–31.
Delorme, A. and Makeig, S. (2004). EEGlab: an open source toolbox for analysis of single-trial EEGdynamics including independent component analysis. J. Neurosci. Methods, 134(1):9–21.
Denney, M. and Baugh, J. (1992). Symptom reduction and sobriety in the male alcoholic. SubstanceUse & Misuse, 27(11):1293–1300.
Di Lazzaro, V., Pilato, F., Saturno, E., Oliviero, A., Dileone, M., Mazzone, P., Insola, A., Tonali, P. A.,Ranieri, F., Huang, Y. Z., and Rothwell, J. C. (2005). eta-burst repetitive transcranial magneticstimulation suppresses specific excitatory circuits in the human motor cortex. J Physiol, 565(Pt3):945–50.
Dickens, C. (1894). e uncommercial traveller: and, Pictures from Italy. Houghton, Mifflin, Boston.
Dietrich, A. (2003). Functional neuroanatomy of altered states of consciousness: e transient hy-pofrontality hypothesis. Conscious. Cogn., 12(2):231–256.
Dietrich, A. (2004a). e cognitive neuroscience of creativity. Psychon Bull Rev, 11(6):1011–26.
Dietrich, A. (2004b). Neurocognitive mechanisms underlying the experience of flow. Conscious. Cogn.,13(4):746–61.
Dietrich, A. and Kanso, R. (2010). A review of EEG, erp, and neuroimaging studies of creativity andinsight. Psychol. Bull., 136(5):822–48.
Doepfner, M. and Lehmkuhl, G. (2000). Fbb-hks [rating-scale for hyperkinetic disorder from thediagnostic system for mental disorders in childhood and adolescence according to ICd-10 and DSm-iv (disyps-kj)]. Gottingen: Hogrefe.
299
BIBLIOGRAPHY
Doppelmayr, M., Finkenzeller, T., and Sauseng, P. (2008). Frontal midline theta in the pre-shot phaseof rifle shooting: differences between experts and novices. Neuropsychologia, 46(5):1463–7.
Doppelmayr, M., Klimesch, W., Pachinger, T., and Ripper, B. (1998). Individual differences in braindynamics: important implications for the calculation of event-related band power. Biol. Cybern.,79(1):49–57.
Drechsler, R., Straub, M., Doehnert, M., Heinrich, H., Steinhausen, H.-C., and Brandeis, D. (2007).1controlled evaluation of a neurofeedback training of slow cortical potentials in children with at-tention deficit/hyperactivity disorder (adhd). Behav Brain Funct, 3:35.
Dumermuth, G., Lange, B., Lehmann, D., Meier, C. A., Dinkelmann, R., and Molinari, L. (1983).Spectral analysis of all-night sleep EEG in healthy adults. Eur. Neurol., 22(5):322–39.
EEGer Neurofeedback Software, Operator’s Manual, V. c. (2005). EEGer Neurofeedback Software,Operator’s Manual, Version 4.1.3c. EEGer.
Eerola, T. and Toiviainen, P. (2004). Midi toolbox: Matlab tools for music research, university ofjyv�§skyl�§: Kopijyv�§, jyv�§skyl�§, finland.
Egner, T. and Gruzelier, J. (2003). Ecological validity of neurofeedback: modulation of slow waveEEG enhances musical performance. Neuroreport, Vol 14 No 9 1 July 2003.
Egner, T. and Gruzelier, J. (2004a). e temporal dynamics of electroencephalographic responses toalpha/theta neurofeedback training in healthy subjects. Journal of Neurotherapy, 8(1):43–57.
Egner, T. and Gruzelier, J. H. (2001). Learned self-regulation of EEG frequency components affectsattention and event-related brain potentials in humans. Neuroreport, 12(18):4155–9.
Egner, T. and Gruzelier, J. H. (2004b). EEG biofeedback of low beta band components: frequency-specific effects on variables of attention and event-related brain potentials. Clin. Neurophysiol.,115(1):131–139.
Egner, T. and Sterman, M. B. (2006). Neurofeedback treatment of epilepsy: from basic rationale topractical application. Expert Rev. Neurother., 6(2):247–57.
Egner, T., Strawson, E., and Gruzelier, J. H. (2002). EEG signature and phenomenology of alpha/thetaneurofeedback training versus mock feedback. Appl. Psychophysiol. Biofeedback, 27(4):261–270.
Egner, T., Zech, T. F., and Gruzelier, J. H. (2004). e effects of neurofeedback training on the spectraltopography of the electroencephalogram. Clin. Neurophysiol., 115(11):2452–2460.
Eisenberg, J. and ompson, W. (2003). A matter of taste: evaluating improvised music. CreativityResearch Journal, 15(2):287–296.
300
BIBLIOGRAPHY
Engel, B. and Chism, R. (1967). Operant conditioning of heart rate speeding. Psychophysiology,3(4):418–426.
Fahrion, S. (1999). Human potential and personal transformation. Subtle Energies and EnergyMedicine, 10:234–234.
Fahrion, S., Walters, E., Coyne, L., and Allen, T. (1992). Alterations in EEG amplitude, personalityfactors, and brain electrical mapping after alpha-theta brainwave training: A controlled case studyof an alcoholic in recovery. Alcoholism: Clinical and Experimental Research, 16(3):547–552.
Fan, J., McCandliss, B. D., Sommer, T., Raz, A., and Posner, M. I. (2002). Testing the efficiency andindependence of attentional networks. J. Cogn. Neurosci., 14(3):340–7.
Fine, A., Goldman, L., and Sandford, J. (1994). Innovative techniques in the treatment of adhd: ananalysis of the impact of EEG biofeedback training and a cognitive computer generated training.American Psychological Association, Los Angeles, CA.
Fink, A., Grabner, R., Benedek, M., and Neubauer, A. (2006). Short Communication Divergentthinking training is related to frontal electroencephalogram alpha synchronization. Eur. J. Neurosci.,23:2241–2246.
Fink, A., Graif, B., and Neubauer, A. C. (2009). Brain correlates underlying creative thinking: EEGalpha activity in professional vs. novice dancers. Neuroimage, 46(3):854–62.
Finkelberg, A., Sokhadze, E., Lopatin, A., Shubina, O., Kokorina, N., Skok, A., and Shtark, M.(1996). e application of alpha-theta EEG biofeedback training for psychological improvementin the process of rehabilitation of the patients with pathological addictions. Biofeedback and Self-Regulation, 21:364.
Fishbein, D., atcher, R., and Cantor, D. (1990). Ingestion of carbohydrates varying in complexityproduce differential brain responses. Clinical EEG electroencephalography, 21(1):5–11.
Fitzsimons, G. M., Chartrand, T. L., and Fitzsimons, G. J. (2008). Automatic effects of brand exposureon motivated behavior: how apple makes you “think different”. Journal of Consumer Research,35(1):21–35.
Fox, S. and Rudell, A. (1968). Operant controlled neural event: Formal and systematic approach toelectrical coding of behavior in brain. Science, 162(3859):1299.
Friedman, P. (1994). Friedman Well-Being Scale and Professional Manual: Manual, Questionnaire,Scoring Sheets. Sampler Set. Mind Garden, Redwood City, Calif.
Fuchs, T., Birbaumer, N., Lutzenberger, W., Gruzelier, J., and Kaiser, J. (2003). Neurofeedback treat-ment for attention-deficit/hyperactivity disorder in children: a comparison with methylphenidate.Appl. Psychophysiol. Biofeedback, 28(1):1–12.
301
BIBLIOGRAPHY
Funderburk, W. (1949). Electroencephalographic studies in chronic alcoholics. Electroencephalogr.Clin. Neurophysiol., 1:369–370.
Funkhouser, J., Nagler, B., and Walke, N. (1953). e electro-encephalogram of chronic alcoholism.South. Med. J., 46(5):423.
Gevensleben, H., Holl, B., Albrecht, B., Schlamp, D., Kratz, O., Studer, P., Rothenberger, A., Moll,G. H., and Heinrich, H. (2010). Neurofeedback training in children with adhd: 6-month follow-upof a randomised controlled trial. Eur. Child Adolesc. Psychiatry, 19(9):715–24.
Gevensleben, H., Holl, B., Albrecht, B., Schlamp, D., Kratz, O., Studer, P., Wangler, S., Rothenberger,A., Moll, G. H., and Heinrich, H. (2009a). Distinct EEG effects related to neurofeedback trainingin children with adhd: a randomized controlled trial. Int. J. Psychophysiol., 74(2):149–57.
Gevensleben, H., Holl, B., Albrecht, B., Vogel, C., Schlamp, D., Kratz, O., Studer, P., Rothenberger,A., Moll, G. H., and Heinrich, H. (2009b). Is neurofeedback an efficacious treatment for adhd? arandomised controlled clinical trial. J. Child Psychol. Psychiatry, 50(7):780–9.
Gevins, A., Smith, M. E., McEvoy, L., and Yu, D. (1997). High-resolution EEG mapping of corticalactivation related to working memory: effects of task difficulty, type of processing, and practice.Cereb. Cortex, 7(4):374–85.
Goldman, R. I., Stern, J. M., Engel, Jr, J., and Cohen, M. S. (2002). Simultaneous EEG and fmri ofthe alpha rhythm. Neuroreport, 13(18):2487–92.
González-Hernández, J. A., Pita-Alcorta, C., Cedeño, I., Bosch-Bayard, J., Galán-Garcia, L.,Scherbaum, W. A., and Figueredo-Rodriguez, P. (2002). Wisconsin card sorting test synchro-nizes the prefrontal, temporal and posterior association cortex in different frequency ranges andextensions. Hum. Brain Mapp., 17(1):37–47.
Gorder, W. (1980). Divergent production abilities as constructs of musical creativity. Journal of Researchin Music Education, Vol. 28(1):34–42.
Goslinga, J. (1975). Biofeedback for chemical problem patients: A developmental process. Journal ofBiofeedback, 2:17–27.
Graap, K. and Freides, D. (1998). Regarding the database for the peniston alpha-theta EEG biofeed-back protocol. Appl. Psychophysiol. Biofeedback, 23(4):265–272.
Gray, C. M. and McCormick, D. A. (1996). Chattering cells: superficial pyramidal neurons contribut-ing to the generation of synchronous oscillations in the visual cortex. Science, 274(5284):109–13.
Green, D. and Swets, J. (1966). Signal detection theory and psychophysics. Wiley, New York, NY.
302
BIBLIOGRAPHY
Green, E. and Green, A. (1977). Beyond biofeedback. Delacorte, New York, NY.
Green, E., Green, A., and Walters, D. (1972). Biofeedback for mind-body self-regulation: Healingand creativity. Biofeedback and self-control, pages 152–166.
Green, E., Green, A., and Walters, E. (1970). Voluntary control of internal states: Psychological andphysiological. Journal of Transpersonal Psychology, 2:1–26.
Green, E., Green, A., and Walters, E. (1974). Alpha-theta biofeedback training. Journal of Biofeedback,2:7–13.
Greenberg, L. M. (1987). An objective measure of methylphenidate response: clinical use of the MCa.Psychopharmacol. Bull., 23(2):279–82.
Grego, F., Vallier, J.-M., Collardeau, M., Bermon, S., Ferrari, P., Candito, M., Bayer, P., Magnié,M.-N., and Brisswalter, J. (2004). Effects of long duration exercise on cognitive function, bloodglucose, and counterregulatory hormones in male cyclists. Neurosci. Lett., 364(2):76–80.
Gruzelier, J. (2009). A theory of alpha/theta neurofeedback, creative performance enhancement, longdistance functional connectivity and psychological integration. Cogn Process, 10 Suppl 1:S101–9.
Gruzelier, J. and Egner, T. (2005). Critical validation studies of neurofeedback. Child Adolesc. Psychiatr.Clin. N. Am., 14(1):83–104, vi.
Gruzelier, J., Egner, T., and Vernon, D. (2006). Validating the efficacy of neurofeedback for optimisingperformance. Prog. Brain Res., 159:421–31.
Gruzelier, J., Inoue, A., Smart, R., Steed, A., and Steffert, T. (2010). Acting performance and flowstate enhanced with sensory-motor rhythm neurofeedback comparing ecologically valid immersivevr and training screen scenarios. Neurosci. Lett., 480(2):112–6.
Guilford, J. (1950). Creativity. Am. Psychol., 5(9):444–54.
Guilford, J. P. (1978). Alternate uses: form B, form C : manual of instructions and interpretations. SheridanPsychological Services, Orange, Calif.
Haarmann, H. J. and Cameron, K. A. (2005). Active maintenance of sentence meaning in workingmemory: evidence from EEG coherences. Int. J. Psychophysiol., 57(2):115–28.
Haimov, I. and Shatil, E. (2013). Cognitive training improves sleep quality and cognitive functionamong older adults with insomnia. PloS one, 8(4):e61390.
Hall, M. (1977). eta training: Imagery and creativity. Beyond Biofeedback (EE Green & AM Green,eds.). Delacorte, San Francisco.
303
BIBLIOGRAPHY
Hammond, D. (2008). Comprehensive neurofeedback bibliography: 2007 update. Journal of Neu-rotherapy, 11(3):45–60.
Hanslmayr, S., Sauseng, P., Doppelmayr, M., Schabus, M., and Klimesch, W. (2005). Increasingindividual upper alpha power by neurofeedback improves cognitive performance in human subjects.Appl. Psychophysiol. Biofeedback, 30(1):1–10.
Hardt, J. V. and Kamiya, J. (1978). Anxiety change through electroencephalographic alpha feedbackseen only in high anxiety subjects. Science, 201(4350):79–81.
Harvey, J. (1994). ese Music Exams. Associated Board of the Royal Schools of Music Publications.,London.
Hasson, U., Nir, Y., Levy, I., Fuhrmann, G., and Malach, R. (2004). Intersubject synchronization ofcortical activity during natural vision. Science, 303(5664):1634–40.
Hathaway, S. and McKinley, J. (1940). A multiphasic personality schedule (minnesota): I. constructionof the schedule. e Journal of Psychology, 10(2):249–254.
Haueisen, J. and Knösche, T. (2001). Involuntary motor activity in pianists evoked by music percep-tion. J. Cogn. Neurosci., 13(6):786–792.
Hayashi, M., Ito, S., and Hori, T. (1999a). e effects of a 20-min nap at noon on sleepiness, perfor-mance and EEG activity. Int. J. Psychophysiol., 32(2):173–80.
Hayashi, M., Watanabe, M., and Hori, T. (1999b). e effects of a 20 min nap in the mid-afternoonon mood, performance and EEG activity. Clin. Neurophysiol., 110(2):272–279.
Heilman, K. M., Nadeau, S. E., and Beversdorf, D. O. (2003). Creative innovation: possible brainmechanisms. Neurocase, 9(5):369–79.
Heinrich, H., Gevensleben, H., Freisleder, F. J., Moll, G. H., and Rothenberger, A. (2004). Training ofslow cortical potentials in attention-deficit/hyperactivity disorder: evidence for positive behavioraland neurophysiological effects. Biol. Psychiatry, 55(7):772–5.
Hinds, O., Ghosh, S., ompson, T. W., Yoo, J. J., Whitfield-Gabrieli, S., Triantafyllou, C., andGabrieli, J. D. E. (2010). Computing moment-to-moment bold activation for real-time neuro-feedback. Neuroimage.
Hingley, V. D. (1985). Performance anxiety in music: a review of the literature. PhD thesis, Universityof Washington.
Hoedlmoser, K., Pecherstorfer, T., Gruber, G., Anderer, P., Doppelmayr, M., Klimesch, W., and Sch-abus, M. (2008). Instrumental conditioning of human sensorimotor rhythm (12-15 Hz) and itsimpact on sleep as well as declarative learning. Sleep, 31(10):1401–8.
304
BIBLIOGRAPHY
Hofer-Tinguely, G., Achermann, P., Landolt, H.-P., Regel, S. J., Rétey, J. V., Dürr, R., Borbély, A. A.,and Gottselig, J. M. (2005). Sleep inertia: performance changes after sleep, rest and active waking.Brain Res. Cogn. Brain Res., 22(3):323–31.
Holtmann, M., Grasmann, D., Cionek-Szpak, E., Hager, V., Panzner, N., Beyer, A., Poustka, F., andStadler, C. (2009). Spezifische wirksamkeit von neurofeedback auf die impulsivit”at bei adhs. Kindheit und Entwicklung, 18(2):95–104.
Hommel, B. (1998). Event files: Evidence for automatic integration of stimulus-response episodes.Visual Cognition, 5(1):183–216.
Howe, R. C. and Sterman, M. (1972). Cortical-subcortical EEG correlates of suppressed motor be-havior during sleep and waking in the cat. Electroencephalogr. Clin. Neurophysiol., 32(6):681–695.
Huang, Y.-Z., Edwards, M. J., Rounis, E., Bhatia, K. P., and Rothwell, J. C. (2005). eta burststimulation of the human motor cortex. Neuron, 45(2):201–6.
Jasper, H. (1936). Cortical excitatory state and synchronism in the control of bioelectric autonomousrhythms. In Cold Spring Harbor Symposia on Quantitative Biology, volume 4, page 320. Cold SpringHarbor Laboratory Press.
Jausovec, N. (2004). Intelligence-related differences in induced gamma band activity. Int. J. Psy-chophysiol, 54:37–37.
Kaiser, D. and Othmer, S. (2000). Effect of neurofeedback on variables of attention in a large multi-center trial. Journal of Neurotherapy, 4(1):5–15.
Kalin, N. and Loevinger, B. (1983). e central and peripheral opioid peptides: eir relationshipsand functions. Psychiatr. Clin. North Am.
Kamiya, J. (1962). Conditioned discrimination of the EEG alpha rhythm in humans. Western Psycho-logical Association.
Kamiya, J. (1969). Operant control of the EEG alpha rhythm and some of its reported effects onconsciousness. Altered states of consciousness. New York: Wiley, pages 489–501.
Kasamatsu, A. and Hirai, T. (1966). An electroencephalographic study on the zen meditation (zazen).Folia Psychiatr. Neurol. Jpn., 20(4):315–36.
Kaufman, A. (1990). K-BIT: Kaufman brief intelligence test. American Guidance Service, Circle Pines,MN.
Kay, L. M. (2005). eta oscillations and sensorimotor performance. Proc. Natl. Acad. Sci. U. S. A.,102(10):3863–8.
305
BIBLIOGRAPHY
Keizer, A. W., Verment, R. S., and Hommel, B. (2010a). Enhancing cognitive control through neuro-feedback: a role of gamma-band activity in managing episodic retrieval. Neuroimage, 49(4):3404–13.
Keizer, A. W., Verschoor, M., Verment, R. S., and Hommel, B. (2010b). e effect of gamma enhanc-ing neurofeedback on the control of feature bindings and intelligence measures. Int. J. Psychophysiol.,75(1):25–32.
Kelley, M. (1997). Native americans, neurofeedback, and substance abuse theory. three year outcomeof alpha/theta neurofeedback training in the treatment of problem drinking among dine’(navajo)people. Journal of Neurotherapy, 2(3):24–60.
Kishiyama, M. M., Yonelinas, A. P., and Knight, R. T. (2009). Novelty enhancements in memory aredependent on lateral prefrontal cortex. e Journal of Neuroscience, 29(25):8114–8118.
Klein, S. and orne, B. (2006). Biological psychology. Worth Pub, New York, NY.
Klem, G. H., Lüders, H. O., Jasper, H. H., and Elger, C. (1999). e ten-twenty electrode system of theinternational federation. the international federation of clinical neurophysiology. Electroencephalogr.Clin. Neurophysiol. Suppl., 52:3–6.
Klimesch, W. (1996). Memory processes, brain oscillations and EEG synchronization. Int. J. Psy-chophysiol., 24(1-2):61–100.
Klimesch, W. (1999). EEG alpha and theta oscillations reflect cognitive and memory performance: areview and analysis. Brain Research Reviews, 29(2-3):169–195.
Klimesch, W., Doppelmayr, M., Schimke, H., and Ripper, B. (1997). eta synchronization and alphadesynchronization in a memory task. Psychophysiology, 34(2):169–76.
Klimesch, W., Sauseng, P., and Gerloff, C. (2003). Enhancing cognitive performance with repet-itive transcranial magnetic stimulation at human individual alpha frequency. Eur. J. Neurosci.,17(5):1129–33.
Klimesch, W., Sauseng, P., and Hanslmayr, S. (2007). EEG alpha oscillations: the inhibition-timinghypothesis. Brain Res Rev, 53(1):63–88.
Koestler, A. (1964). e Act of Creation. Macmillan, New York, danube edition.
Kokotsaki, D. and Davidson, J. W. (2003). Investigating musical performance anxiety among musiccollege singing students: a quantitative analysis. Music Education Research, 5(1):45–59.
Kotchoubey, B., Strehl, U., Uhlmann, C., Holzapfel, S., König, M., Fröscher, W., Blankenhorn, V.,and Birbaumer, N. (2001). Modification of slow cortical potentials in patients with refractoryepilepsy: a controlled outcome study. Epilepsia, 42(3):406–416.
306
BIBLIOGRAPHY
Kurtzberg, T. R. and Amabile, T. M. (2001). From guilford to creative synergy: Opening the blackbox of team-level creativity. Creativity Research Journal, 13(3-4):285–294.
La Vaque, T., Hammond, D., Trudeau, D., Monastra, V., Perry, J., Lehrer, P., Matheson, D., andSherman, R. (2002). Template for developing guidelines for the evaluation of the clinical efficacyof psychophysiological interventions. Appl. Psychophysiol. Biofeedback, 27(4):273–281.
Lantz, D. L. and Sterman, M. B. (1988). Neuropsychological assessment of subjects with uncontrolledepilepsy: effects of EEG feedback training. Epilepsia, 29(2):163–71.
Laufs, H., Krakow, K., Sterzer, P., Eger, E., Beyerle, A., Salek-Haddadi, A., and Kleinschmidt, A.(2003). Electroencephalographic signatures of attentional and cognitive default modes in sponta-neous brain activity fluctuations at rest. Proc. Natl. Acad. Sci. U. S. A., 100(19):11053–8.
Lévesque, J., Beauregard, M., and Mensour, B. (2006). Effect of neurofeedback training on the neuralsubstrates of selective attention in children with attention-deficit/hyperactivity disorder: a func-tional magnetic resonance imaging study. Neurosci. Lett., 394(3):216–21.
Limb, C. and Braun, A. (2008). Neural Substrates of Spontaneous Musical Performance: An fMRIStudy of Jazz Improvisation. PLoS ONE, 3(2).
Linden, M., Habib, T., and Radojevic, V. (1996). A controlled study of the effects of EEG biofeed-back on cognition and behavior of children with attention deficit disorder and learning disabilities.Biofeedback Self Regul., 21(1):35–49.
Lindsley, D. B. (1952). Psychological phenomena and the electroencephalogram. Electroencephalogr.Clin. Neurophysiol., 4(4):443–56.
Logothetis, N. K., Pauls, J., Augath, M., Trinath, T., and Oeltermann, A. (2001). Neurophysiologicalinvestigation of the basis of the fmri signal. Nature, 412(6843):150–7.
Loo, S. K. and Barkley, R. A. (2005). Clinical utility of EEG in attention deficit hyperactivity disorder.Appl Neuropsychol, 12(2):64–76.
Loomis, A., Harvey, E., and Hobart III, G. (1938). Distribution of disturbance-patterns in the humanelectroencephalogram, with special reference to sleep. J. Neurophysiol., 1(5):413.
Lorr, M., McNair, D., Heuchert, J., and Droppleman, L. (1971). Profile of mood states. J. Clin.Psychiatry, 60:89–95.
Lovato, N. and Lack, L. (2010). e effects of napping on cognitive functioning. Prog. Brain Res.,185:155–66.
Lovato, N., Lack, L., Ferguson, S., and Tremaine, R. (2009). e effects of a 30-min nap during nightshift following a prophylactic sleep in the afternoon. Sleep and Biological Rhythms, 7(1):34–42.
307
BIBLIOGRAPHY
Lowe, F. (1999). How essential is the EEG component of the peniston and kulkosky protocol. Appl.Psychophysiol. Biofeedback, 24(2):117–118.
Lubar, J. and Shouse, M. (1976). EEG and behavioral changes in a hyperkinetic child concurrent withtraining of the sensorimotor rhythm (smr). Appl. Psychophysiol. Biofeedback, 1(3):293–306.
Lubar, J. F. (1991). Discourse on the development of EEG diagnostics and biofeedback for attention-deficit/hyperactivity disorders. Biofeedback Self Regul., 16(3):201–25.
Lubar, J. F., Swartwood, M. O., Swartwood, J. N., and O’Donnell, P. H. (1995). Evaluation of theeffectiveness of EEG neurofeedback training for adhd in a clinical setting as measured by changesin t.o.v.a. scores, behavioral ratings, and wisc-r performance. Biofeedback Self Regul., 20(1):83–99.
Lubar, J. O. and Lubar, J. F. (1984). Electroencephalographic biofeedback of smr and beta for treatmentof attention deficit disorders in a clinical setting. Biofeedback Self Regul., 9(1):1–23.
MacCallum, R. C., Widaman, K. F., Zhang, S., and Hong, S. (1999). Sample size in factor analysis.Psychol. Methods, 4:84–99.
Makeig, S. and Jung, T. P. (1996). Tonic, phasic, and transient EEG correlates of auditory awarenessin drowsiness. Brain Res. Cogn. Brain Res., 4(1):15–25.
Makeig, S., Jung, T. P., and Sejnowski, T. J. (2000). Awareness during drowsiness: dynamics andelectrophysiological correlates. Can. J. Exp. Psychol., 54(4):266–73.
Mann, C., Lubar, J., Zimmerman, A., Miller, C., and Muenchen, R. (1992). Quantitative analysis ofEEG in boys with attention-deficit-hyperactivity disorder: Controlled study with clinical implica-tions. Pediatr. Neurol., 8(1):30–36.
Martindale, C. (1977). Creativity, consciousness, and cortical arousal. Journal of Altered States ofConsciousness.
Martindale, C. (1999). Handbook of creativity, chapter Biological Bases of Creativity, pages 137–152.Cambridge Univ Pr, Cambridge, U.K. ; New York.
Martindale, C. and Armstrong, J. (1974). e Relationship of Creativity to Cortical Activation andIts Operant Control. J. Genet. Psychol., 124:311–320.
Maslow, A., Assagioli, R., Crampton, M., Van der Horst, L., Taylor, G., Vargin, J., Haronian, F., Parks,J., and Alberti, A. (1963). e creative attitude. Psychosynthesis Research Foundation, Greenville,Del.
Mavromatis, A. (1987). Hypnagogia: e unique state of consciousness between wakefulness and sleep.Routledge Kegan & Paul, London; New York.
308
BIBLIOGRAPHY
McCarney, S. and Services, H. E. (1989). Attention deficit disorders evaluation scale. Hawthorne Edu-cational Services, Columbia, Mo.
McCormick, D. A. and Huguenard, J. R. (1992). A model of the electrophysiological properties ofthalamocortical relay neurons. J. Neurophysiol., 68(4):1384–400.
McCormick, D. A., Wang, Z., and Huguenard, J. (1993). Neurotransmitter control of neocorticalneuronal activity and excitability. Cereb. Cortex, 3(5):387–98.
Mccrae, R. (1987). Creativity, divergent thinking, and openess to experience. J. Pers. Soc. Psychol.,52(6):1258–1265.
McGraw, K. and Wong, S. (1996). Forming inferences about some intraclass correlation coefficients.Psychol. Methods, 1(1):30–46.
McMahon, R. C., Flynn, P. M., and Davidson, R. S. (1985). e personality and symptoms scalesof the millon clinical multiaxial inventory: sensitivity to posttreatment outcomes. J. Clin. Psychol.,41(6):862–6.
McNair, D., Lorr, M., and Droppleman, L. (1992). Revised manual for the profile of mood states.San Diego, CA: Educational and Industrial Testing Services, 731:732–733.
McPherson, G. E. and ompson, W. F. (1998). Assessing music performance: Issues and influences.Research Studies in Music Education, 10(1):12–24.
Mednick, S. and Mednick, M. (1967a). Remote Associates Test. Houghton Mifflin, Boston.
Mednick, S., Mednick, M., and of Michigan, U. (1965). e Associative Basis of the Creative Process.University of Michigan, Ann Arbor.
Mednick, S. A. (1962). e associative basis of the creative process. Psychol. Rev., 69(3):220–232.
Mednick, S. A. and Mednick, M. T. (1967b). Examiner’s Manual, Remote Associates Test: College andAdult Forms 1 and 2. Houghton Mifflin, Boston.
Miller, E. K. and Cohen, J. D. (2001). An integrative theory of prefrontal cortex function. Annu. Rev.Neurosci., 24:167–202.
Millon, T. (1983). Millon clinical multiaxial inventory. minneapolis. MN: Interpretive Scoring Systems.
Milner, C. E., Fogel, S. M., and Cote, K. A. (2006). Habitual napping moderates motor performanceimprovements following a short daytime nap. Biol. Psychol., 73(2):141–56.
309
BIBLIOGRAPHY
Monastra, V. J., Lynn, S., Linden, M., Lubar, J. F., Gruzelier, J., and LaVaque, T. J. (2005). Elec-troencephalographic biofeedback in the treatment of attention-deficit/hyperactivity disorder. Appl.Psychophysiol. Biofeedback, 30(2):95–114.
Moore, J. and Trudeau, D. (1998). Alpha theta brainwave biofeedback is not specific to the productionof theta/alpha crossover and visualizations. Journal of Neurotherapy, 3(1):63.
Moore, J. P., Trudeau, D. L., uras, P. D., Rubin, Y., Stockley, H., and Dimond, T. (2000). Com-parison of alpha-theta, alpha and emg neurofeedback in the production of alpha-theta crossoverand the occurrence of visualizations. Journal of Neurotherapy, 4(1):29–42.
Morikawa, T., Hayashi, M., and Hori, T. (1997). Auto power and coherence analysis of delta-thetaband EEG during the waking-sleeping transition period. Electroencephalogr. Clin. Neurophysiol.,103(6):633–41.
Morton, V. and Torgerson, D. J. (2005). Regression to the mean: treatment effect without the inter-vention. J. Eval. Clin. Pract., 11(1):59–65.
Mueller, S. (2010). A partial implementation of the bica cognitive decathlon using the psychologyexperiment building LANguage (pebl). Int. J. Mach. Conscious., 2(02):273–288.
Mullholland, T. (1968). Feedback electroencephalography. Act. Nerv. Super. (Praha), 10(4):410.
Muzur, A., Pace-Schott, E., and Hobson, J. (2002). e prefrontal cortex in sleep. Trends in CognitiveSciences, 6(11):475–481.
Naber, D., Bullinger, M., Zahn, T., et al. (1981). Stress effects of beta-endorphin in human plasma:Relationships to psychophysiological and psychological variables. Psychopharmacol. Bull., 17:187–189.
Niedermeyer, E. (2005). 9. the normal EEG of the waking adult. Electroencephalography: Basic prin-ciples, clinical applications, and related fields, page 167.
Nishida, M. and Walker, M. P. (2007). Daytime naps, motor memory consolidation and regionallyspecific sleep spindles. PLoS One, 2(4):e341.
Nybo, L. and Nielsen, B. (2001). Perceived exertion is associated with an altered brain activity duringexercise with progressive hyperthermia. J. Appl. Physiol., 91(5):2017–23.
O’Keefe, J. (1990). A computational theory of the hippocampal cognitive map. Prog. Brain Res.,83:301–12.
Orlandi, M. and Greco, D. (2005). A randomized, double-blind clinical trial of EEG neurofeedbacktreatment for attention deficit/hyperactivity disorder (adhd). In ISNR conference.
310
BIBLIOGRAPHY
Orne, M. and Wilson, S. (1978). On the nature of alpha feedback training. Consciousness & self-regulation, 2.
Orne, M. T. and Paskewitz, D. A. (1974). Aversive situational effects on alpha feedback training.Science, 186(4162):458–60.
Overall, J., Gorham, D., et al. (1962). e brief psychiatric rating scale. Psychol. Rep., 10(3):799–812.
Papadopoulos, G. and Wiggins, G. (1999). AI methods for algorithmic composition: A survey, acritical view and future prospects. In AISB Symposium on Musical Creativity, pages 110–117.
Pascual-Marqui, R. D. (2002). Standardized low-resolution brain electromagnetic tomography(sloreta): technical details. Methods Find. Exp. Clin. Pharmacol., 24 Suppl D:5–12.
Paskewitz, D. A. and Orne, M. T. (1973). Visual effects on alpha feedback training. Science,181(97):360–3.
Passini, F. T., Watson, C. G., Dehnel, L., Herder, J., and Watkins, B. (1977). Alpha wave biofeedbacktraining therapy in alcoholics. J. Clin. Psychol., 33(1):292–9.
Pavlides, C., Greenstein, Y. J., Grudman, M., and Winson, J. (1988). Long-term potentiation in thedentate gyrus is induced preferentially on the positive phase of theta-rhythm. Brain Res., 439(1-2):383–7.
Pearce, M. and Wiggins, G. A. (2002). Aspects of a cognitive theory of creativity in musical composi-tion. In Proceedings of the ECAI02 Workshop on Creative Systems.
Peniston, E. (1998). Comments by peniston. Appl. Psychophysiol. Biofeedback, 23(4):273–275.
Peniston, E. and Kulkosky, P. (1990). Alcoholic personality and alpha-theta brainwave training. Med-ical Psychotherapy, 3:37–55.
Peniston, E. and Kulkosky, P. (1991). Alpha-theta brainwave neuro-feedback therapy for vietnamveterans with combat-related post-traumatic stress disorder. Medical Psychotherapy, 4:47–60.
Peniston, E. and Kulkosky, P. (1999). Neurofeedback in the treatment of addictive disorders. Intro-duction to quantitative EEG and neurofeedback, page 346.
Peniston, E., Marrinan, D., Deming, W., and Kulkosky, P. (1993). EEG alpha-theta brainwave syn-chronization in vietnam theater veterans with combat-related post-traumatic stress disorder andalcohol abuse. Advances in Medical Psychotherapy, 6:37–50.
Peniston, E. G. and Kulkosky, P. J. (1989). Alpha-theta brainwave training and beta-endorphin levelsin alcoholics. Alcohol. Clin. Exp. Res., 13(2):271–9.
311
BIBLIOGRAPHY
Petsche, H., Kaplan, S., von Stein, A., and Filz, O. (1997). e possible meaning of the upper andlower alpha frequency ranges for cognitive and creative tasks. Int. J. Psychophysiol., 26(1-3):77–97.
Pfurtscheller, G. and Lopes da Silva, F. H. (1999). Event-related EEG/meg synchronization and desyn-chronization: basic principles. Clin. Neurophysiol., 110(11):1842–57.
Phelan, S. and Young, A. M. (2003). Understanding creativity in the workplace: An examinationof individual styles and training in relation to creative confidence and creative self-leadership. eJournal of Creative Behavior, 37(4):266–281.
Picard, B. (2006). Double blind sham study of neurofeedback treatment for children with adhd. InISNR conference, Atlanta, GA, USA, pages 7–10.
Pinker, S. (1999). How the mind works. Ann. N. Y. Acad. Sci., 882(1):119–127.
Plihal, W. and Born, J. (1997). Effects of early and late nocturnal sleep on declarative and proceduralmemory. J. Cogn. Neurosci., 9(4):534–547.
Plotkin, W. P. and Rice, K. M. (1981). Biofeedback as a placebo: anxiety reduction facilitated by train-ing in either suppression or enhancement of alpha brainwaves. J. Consult. Clin. Psychol., 49(4):590–6.
Poincaré, H. and Halsted, G. B. (1913). e foundations of science: Science and hypothesis, the value ofscience, science and method, volume 1. Science Press, New York.
Pollock, V., Volavka, J., Goodwin, D., Mednick, S., Gabrielli, W., Knop, J., and Schulsinger, F.(1983). e EEG after alcohol administration in men at risk for alcoholism. Arch. Gen. Psychiatry,40(8):857.
Pontifex, M. B. and Hillman, C. H. (2007). Neuroelectric and behavioral indices of interferencecontrol during acute cycling. Clin. Neurophysiol., 118(3):570–80.
Pressing, J. (1988). Improvisation: Methods and Models, pages 129–178. Oxford University Press,Oxford.
Pucel, J. (1972). Alcohol rehabilitation follow-up questionnaire. Technical report, St. Cloud, MN:Veterans Administration Hospital.
Raichle, M. E. (2009). A brief history of human brain mapping. Trends Neurosci., 32(2):118–26.
Raven, J. (1938). Progressive matrices: A perceptual test of intelligence, 1938, individual form. London:Lewis.
Raymond, J., Sajid, I., Parkinson, L. A., and Gruzelier, J. H. (2005a). Biofeedback and dance perfor-mance: a preliminary investigation. Appl. Psychophysiol. Biofeedback, 30(1):64–73.
312
BIBLIOGRAPHY
Raymond, J., Varney, C., Parkinson, L. A., and Gruzelier, J. H. (2005b). e effects of alpha/thetaneurofeedback on personality and mood. Brain Res. Cogn. Brain Res., 23(2-3):287–92.
Rechtschaffen, A. and Kales, A. (1968). A manual of standardized terminology, techniques and scoringsystem for sleep stages of human subjects. U.S. Dept. of Health, Education, and Welfare, Bethesda,Md.
Robbins, J. (2008). A symphony in the brain: e evolution of the new brain wave biofeedback. GrovePr, New York.
Roelofs, S. (1985). Hyperventilation, anxiety, craving for alcohol: a subacute alcohol withdrawalsyndrome. Alcohol, 2(3):501–505.
Rogers, C. (1954). Toward a theory of creativity. Etc.
Ros, T., Moseley, M. J., Bloom, P. A., Benjamin, L., Parkinson, L. A., and Gruzelier, J. H. (2009).Optimizing microsurgical skills with EEG neurofeedback. BMC Neurosci, 10:87.
Ros, T., Munneke, M. A. M., Ruge, D., Gruzelier, J. H., and Rothwell, J. C. (2010). Endogenouscontrol of waking brain rhythms induces neuroplasticity in humans. Eur. J. Neurosci., 31(4):770–8.
Ross, L., Lepper, M., Strack, F., and Steinmetz, J. (1977). Social explanation and social expecta-tion: Effects of real and hypothetical explanations on subjective likelihood. J. Pers. Soc. Psychol.,35(11):817–829.
Rossiter, T. (2004). e effectiveness of neurofeedback and stimulant drugs in treating ad/HD: partii. replication. Appl. Psychophysiol. Biofeedback, 29(4):233–43.
Rossiter, T. and La Vaque, T. (1995). A comparison of EEG biofeedback and psychostimulants intreating attention deficit/hyperactivity disorders. Journal of Neurotherapy, 1(1):48–59.
Roth, S., Sterman, M., and Clemente, C. (1967). Comparison of EEG correlates of reinforcement,internal inhibition and sleep. Electroencephalogr. Clin. Neurophysiol., 23(6):509–520.
Ruiz, M. H., Jabusch, H.-C., and Altenmüller, E. (2009a). Detecting wrong notes in advance: neu-ronal correlates of error monitoring in pianists. Cereb. Cortex, 19(11):2625–39.
Ruiz, M. H., Senghaas, P., Grossbach, M., Jabusch, H.-C., Bangert, M., Hummel, F., Gerloff, C., andAltenmüller, E. (2009b). Defective inhibition and inter-regional phase synchronization in pianistswith musician’s dystonia: an EEG study. Hum. Brain Mapp., 30(8):2689–700.
Sauseng, P., Hoppe, J., Klimesch, W., Gerloff, C., and Hummel, F. C. (2007). Dissociation of sustainedattention from central executive functions: local activity and interregional connectivity in the thetarange. Eur. J. Neurosci., 25(2):587–93.
313
BIBLIOGRAPHY
Sauseng, P., Klimesch, W., Doppelmayr, M., Pecherstorfer, T., Freunberger, R., and Hanslmayr, S.(2005a). EEG alpha synchronization and functional coupling during top-down processing in aworking memory task. Hum. Brain Mapp., 26(2):148–55.
Sauseng, P., Klimesch, W., Stadler, W., Schabus, M., Doppelmayr, M., Hanslmayr, S., Gruber, W. R.,and Birbaumer, N. (2005b). A shift of visual spatial attention is selectively associated with humanEEG alpha activity. Eur. J. Neurosci., 22(11):2917–26.
Sawyer, R. (2000). Improvisation and the Creative Process: Dewey, Collingwood, and the Aestheticsof Spontaneity. e Journal of Aesthetics and Art Criticism, 58(2):149–161.
Sawyer, R. K. (2012). Explaining creativity: e science of human innovation. OUP USA, Oxford ;New York.
Saxby, E. and Peniston, E. G. (1995). Alpha-theta brainwave neurofeedback training: an effectivetreatment for male and female alcoholics with depressive symptoms. J. Clin. Psychol., 51(5):685–93.
Schabus, M., Gruber, G., Parapatics, S., Sauter, C., Klösch, G., Anderer, P., Klimesch, W., Saletu, B.,and Zeitlhofer, J. (2004). Sleep spindles and their significance for declarative memory consolidation.Sleep, 27(8):1479–85.
Schacter, D. (1976). e hypnagogic state: A critical review of the literature. Psychol. Bull., 83(3):452–481.
Scheeringa, R., Bastiaansen, M. C. M., Petersson, K. M., Oostenveld, R., Norris, D. G., and Hagoort,P. (2008). Frontal theta EEG activity correlates negatively with the default mode network in restingstate. Int. J. Psychophysiol., 67(3):242–51.
Schreckenberger, M., Lange-Asschenfeld, C., Lochmann, M., Mann, K., Siessmeier, T., Buchholz, H.,Bartenstein, P., and Grunder, G. (2004). e thalamus as the generator and modulator of EEGalpha rhythm: a combined PET/EEG study with lorazepam challenge in humans. Neuroimage,22(2):637–644.
Scott, W., Brod, T., Sideroff, S., Kaiser, D., and Sagan, M. (2002). Type-specific EEG biofeedbackimproves residential substance abuse treatment. In American Psychiatric Association Annual Meeting.
Scott, W. and Kaiser, D. (1998). Augmenting chemical dependency treatment with neurofeedbacktraining. Journal of Neurotherapy, 3(1):66.
Scott, W. C., Kaiser, D., Othmer, S., and Sideroff, S. I. (2005). Effects of an EEG biofeedback protocolon a mixed substance abusing population. Am. J. Drug Alcohol Abuse, 31(3):455–69.
314
BIBLIOGRAPHY
Shapiro, D., Tursky, B., Gershon, E., and Stern, M. (1969). Effects of feedback and reinforcement onthe control of human systolic blood pressure. Science (New York, NY), 163(867):588.
Shouse, M. N. and Lubar, J. F. (1979). Operant conditioning of EEG rhythms and ritalin in thetreatment of hyperkinesis. Biofeedback Self Regul., 4(4):299–312.
Simonton, D. (1997). Creative productivity: A predictive and explanatory model of career trajectoriesand landmarks. Psychol. Rev., 104(1):66–89.
Simonton, D. (1999). Origins of Genius: Darwinian Perspectives on Creativity. Oxford University Press,USA, New York.
Simonton, D. (2003). Scientific creativity as constrained stochastic behavior: the integration of prod-uct, person, and process perspectives. Psychol. Bull., 129(4):475–494.
Singer, W. and Gray, C. M. (1995). Visual feature integration and the temporal correlation hypothesis.Annu. Rev. Neurosci., 18:555–86.
Skinner, B. F. (1937). Two types of conditioned reflex: A reply to konorski and Miller. e Journal ofGeneral Psychology, 16(1):272–279.
Skok, A., Shubina, O., Finkelberg, A., Shtark, M., and Jafarova, O. (1997). EEG training in thetreatment of addictive disorders. Applied Psychophysiology & Biofeedback, 22:130.
Smith, M. and Gevins, A. (2004). Attention and brain activity while watching television: Componentsof viewer engagement. Media Psychology, 6(3):285–305.
Speckmann, E. and Elger, C. (1991). e neurophysiological basis of epileptic activity: a condensedoverview. Epilepsy Res. Suppl., 2:1.
Spielberger, C., Gorsuch, R., Lushene, R., Vagg, P., and Jacobs, G. (1983). Manual for the State-TraitAnxiety Inventory (Form Y). 1983, Palo Alto.
Stanley, M., Brooker, R., and Gilbert, R. (2002). Examiner perceptions of using criteria in musicperformance assessment. Research Studies in Music Education, 18(1):46.
Stennett, R. G. (1957). e relationship of performance level to level of arousal. J. Exp. Psychol.,54(1):54–61.
Steptoe, A. (1982). Performance anxiety: recent developments in its analysis and management. MusicalTimes, 123(1674):537–541.
Steriade, M., Amzica, F., and Nuñez, A. (1993a). Cholinergic and noradrenergic modulation of theslow (approximately 0.3 Hz) oscillation in neocortical cells. J. Neurophysiol., 70(4):1385–400.
315
BIBLIOGRAPHY
Steriade, M., Domich, L., Oakson, G., and Deschênes, M. (1987). e deafferented reticular thalamicnucleus generates spindle rhythmicity. J. Neurophysiol., 57(1):260–73.
Steriade, M., Dossi, R. C., and Nuñez, A. (1991). Network modulation of a slow intrinsic oscillationof cat thalamocortical neurons implicated in sleep delta waves: cortically induced synchronizationand brainstem cholinergic suppression. J. Neurosci., 11(10):3200–17.
Steriade, M., Gloor, P., Llinás, R. R., Lopes de Silva, F. H., and Mesulam, M. M. (1990). Report ofIFcn committee on basic mechanisms. basic mechanisms of cerebral rhythmic activities. Electroen-cephalogr. Clin. Neurophysiol., 76(6):481–508.
Steriade, M., McCormick, D., and Sejnowski, T. (1993b). alamocortical oscillations in the sleepingand aroused brain. Science, 262(5134):679.
Sterman, M. and Wyrwicka, W. (1967). EEG correlates of sleep: evidence for separate forebrainsubstrates. Brain Res., 6(1):143.
Sterman, M., Wyrwicka, W., and Roth, S. (1969). Electrophysiological correlates and neural substratesof alimentary behavior in the cat. Ann. N. Y. Acad. Sci., 157(Neural Regulation of Food and WaterIntake):723–739.
Sterman, M. B. (1996). Physiological origins and functional correlates of EEG rhythmic activities:implications for self-regulation. Biofeedback Self Regul., 21(1):3–33.
Sterman, M. B. and Egner, T. (2006). Foundation and practice of neurofeedback for the treatment ofepilepsy. Appl. Psychophysiol. Biofeedback, 31(1):21–35.
Sterman, M. B. and Friar, L. (1972). Suppression of seizures in an epileptic following sensorimotorEEG feedback training. Electroencephalogr. Clin. Neurophysiol., 33(1):89–95.
Sterman, M. B., Howe, R. C., and Macdonald, L. R. (1970). Facilitation of spindle-burst sleep byconditioning of electroencephalographic activity while awake. Science, 167(921):1146–8.
Sterman, M. B. and Macdonald, L. R. (1978). Effects of central cortical EEG feedback training onincidence of poorly controlled seizures. Epilepsia, 19(3):207–22.
Sterman, M. B., Macdonald, L. R., and Stone, R. K. (1974). Biofeedback training of the sensorimotorelectroencephalogram rhythm in man: effects on epilepsy. Epilepsia, 15(3):395–416.
Stevens, J. (1985). Search & Reflect. Community Music, London.
Stoyva, J. and Kamiya, J. (1968). Electrophysiological studies of dreaming as the prototype of a newstrategy in the study of consciousness. Psychol. Rev., 75(3):192–205.
316
BIBLIOGRAPHY
Strehl, U., Trevorrow, T., Veit, R., Hinterberger, T., Kotchoubey, B., Erb, M., and Birbaumer, N.(2006). Deactivation of brain areas during self-regulation of slow cortical potentials in seizurepatients. Appl. Psychophysiol. Biofeedback, 31(1):85–94.
Swanson, J., Nolan, W., and Pelham, W. (1981). e snap rating scale. Resources in Education.
Takahashi, M. and Arito, H. (2000). Maintenance of alertness and performance by a brief nap afterlunch under prior sleep deficit. Sleep, 23(6):813–9.
Tanaka, H., Hayashi, M., and Hori, T. (1996). Statistical features of hypnagogic EEG measured by anew scoring system. Sleep, 19(9):731–8.
Tanaka, H., Hayashi, M., and Hori, T. (2000). Topographical characteristics of slow wave activitiesduring the transition from wakefulness to sleep. Clin. Neurophysiol., 111(3):417–427.
Tansey, M. A. (1984). EEG sensorimotor rhythm biofeedback training: some effects on the neurologicprecursors of learning disabilities. Int. J. Psychophysiol., 1(2):163–77.
Tansey, M. A. (1985). Brainwave signatures–an index reflective of the brain’s functional neuroanatomy:further findings on the effect of EEG sensorimotor rhythm biofeedback training on the neurologicprecursors of learning disabilities. Int. J. Psychophysiol., 3(2):85–99.
Tansey, M. A. and Bruner, R. L. (1983). EMG and EEG biofeedback training in the treatment of a 10-year-old hyperactive boy with a developmental reading disorder. Biofeedback Self Regul., 8(1):25–37.
Taub, E. and Rosenfeld, J. (1994). Is alpha/theta training the effective component of the alpha/thetatherapy package for the treatment of alcoholism. Biofeedback, 22(3):12–14.
Taylor, C. (2005). ese music exams. Associated Board of the Royal Schools of Music, London.
ayer, R. E. (1967). Measurement of activation through self-report. Psychol. Rep., 20(2):663–78.
esen, S., Heid, O., Mueller, E., and Schad, L. R. (2000). Prospective acquisition correction for headmotion with image-based tracking for real-time fmri. Magn. Reson. Med., 44(3):457–65.
ompson, S. and Williamon, A. (2003). Evaluating evaluation: Musical performance assessment asa research tool. Music Perception, 21(1):21–41.
ompson, W., Diamond, C., and Balkwill, L. (1998). e adjudication of six performances of aChopin Etude: A study of expert knowledge. Psychology of Music, 26(2):154.
Tierney, P. and Farmer, S. M. (2002). Creative self-efficacy: Its potential antecedents and relationshipto creative performance. Acad. Manage. J., 45(6):1137–1148.
317
BIBLIOGRAPHY
Timofeev, I. and Steriade, M. (1997). Fast (mainly 30-100 Hz) oscillations in the cat cerebellothalamicpathway and their synchronization with cortical potentials. J Physiol, 504 ( Pt 1):153–68.
Tornek, A., Field, T., Hernandez-Reif, M., Diego, M., and Jones, N. (2003). Music effects on EEGin intrusive and withdrawn mothers with depressive symptoms. Psychiatry, 66(3):234–43.
Torrance, E. (1974). Torrance Tests of Creative inking. Scholastic Testing Service Bensenville, Ill,Princeton, N.J.
Traut, E. F. and Passarelli, E. W. (1957). Placebos in the treatment of rheumatoid arthritis and otherrheumatic conditions. Ann. Rheum. Dis., 16(1):18–22.
Twemlow, S. and Bowen, W. (1976). EEG biofeedback induced self actualization in alcoholics. Journalof Biofeedback, 3:20–25.
Twemlow, S., Sizemore, D., and Bowen, W. (1977). Biofeedback induced energy redistribution in thealcoholic EEG. Journal of Biofeedback, 3:14–19.
Twemlow, S. W. and Bowen, W. T. (1977). Sociocultural predictors of self-actualization in EEG-biofeedback-treated alcoholics. Psychol. Rep., 40(2):591–8.
van den Pol, A., Wuarin, J., and Dudek, F. (1990). Glutamate, the dominant excitatory transmitter inneuroendocrine regulation. Science, 250(4985):1276.
Vernon, D., Egner, T., Cooper, N., Compton, T., Neilands, C., Sheri, A., and Gruzelier, J. (2003).e effect of training distinct neurofeedback protocols on aspects of cognitive performance. Int. J.Psychophysiol., 47(1):75–85.
Vernon, D. J. (2005). Can neurofeedback training enhance performance? an evaluation of the evidencewith implications for future research. Appl. Psychophysiol. Biofeedback, 30(4):347–64.
Vuust, P., Gebauer, L., Hansen, N. C., Jørgensen, S. R., Møller, A., and Linnet, J. (2010). Personalityinfluences career choice: Sensation seeking in professional musicians. Music Education Research,12(2):219–230.
Wahler, R., House, A., and Starbaugh, E. (1975). Ecological assessment of child problem behaviour.In Lubar and Shouse (1976), pages 293–306.
Wang, C. (1985). Measures of creativity in sound and music. Unpublished manuscript. Lexington, KY:School of Music, University of Kentucky.
Wangler, S., Gevensleben, H., Albrecht, B., Studer, P., Rothenberger, A., Moll, G. H., and Heinrich,H. (2010). Neurofeedback in children with adhd: Specific event-related potential findings of arandomized controlled trial. Clin. Neurophysiol.
318
BIBLIOGRAPHY
Wapnick, J., Ryan, C., Campbell, L., Deek, P., Lemire, R., and Darrow, A. (2005). Effects of excerpttempo and duration on musicians’ ratings of high-level piano performances. Journal of Research inMusic Education, 53(2):162.
Wapnick, J., Ryan, C., Lacaille, N., and Darrow, A. (2004). Effects of selected variables on musiciansratings of high level piano performances. International Journal of Music Education, 22(1):7.
Watabe, T., Tanaka, K., Kumagae, M., Itoh, S., Hasegawa, M., Horiuchi, T., Miyabe, S., Ohno, H.,and Shimizu, N. (1987). Diurnal rhythm of plasma immunoreactive corticotropin-releasing factorin normal subjects. Life Sci., 40(17):1651–1655.
Watson, C. (1972). Relationships of anhedonia to learning under various contingencies. J. Abnorm.Psychol., 80(1):43–48.
Watson, C., Herder, J., and Passini, F. (1978). Alpha biofeedback therapy in alcoholics: an 18-monthfollow-up. J. Clin. Psychol., 34(3):765–9.
Wechsler, D. (1974). Wechsler intelligence scale for children-revised. Psychological Corporation, NewYork, NY.
Weems, S. A. and Zaidel, E. (2004). e relationship between reading ability and lateralized lexicaldecision. Brain Cogn., 55(3):507–15.
Wehinger, R. (1970). Ligeti artikulation: elektronische musik.
Weiskopf, N., Scharnowski, F., Veit, R., Goebel, R., Birbaumer, N., and Mathiak, K. (2004). Self-regulation of local brain activity using real-time functional magnetic resonance imaging (fmri). J.Physiol. Paris, 98(4-6):357–73.
Wenger, M. A. and Bagchi, B. K. (1961). Studies of autonomic functions in practitioners of yoga inindia. Behav. Sci., 6:312–23.
Whishaw, I. Q. and Vanderwolf, C. H. (1973). Hippocampal EEG and behavior: changes in amplitudeand frequency of RSA (theta rhythm) associated with spontaneous and learned movement patternsin rats and cats. Behav. Biol., 8(4):461–84.
Whittingstall, K. and Logothetis, N. (2009). Frequency-band coupling in surface EEG reflects spikingactivity in monkey visual cortex. Neuron, 64(2):281–289.
Williamon, A. (2004). Musical excellence: Strategies and techniques to enhance performance. OxfordUniversity Press, USA, Oxford.
Wong, M. (1981). Effects of meditation on anxiety and chemical dependency. J. Drug Educ., 11(2):91–105.
319
BIBLIOGRAPHY
Wyrwicka, W. and Sterman, M. (1968). Instrumental conditioning of sensorimotor cortex EEG spin-dles in the waking cat. Physiology & Behavior, 3(5):703–707.
Yerkes, R. and Dodson, J. (1908). e relation of strength of stimulus to rapidity of habit formation.J. Comp. Neurol., 18:459–482.
Yoo, S.-S. and Jolesz, F. A. (2002). Functional MRI for neurofeedback: feasibility study on a handmotor task. Neuroreport, 13(11):1377–81.
Zoefel, B., Huster, R. J., and Herrmann, C. S. (2011). Neurofeedback training of the upper alphafrequency band in EEG improves cognitive performance. Neuroimage, 54(2):1427–31.
Zuckerman, M. (1971). Dimensions of sensation seeking. J. Consult. Clin. Psychol., 36(1):45–52.
Zuckerman, M., Lubin, B., and Robins, S. (1965). Validation of the multiple affect adjective checklist in clinical situations. J. Consult. Psychol., 29(6):594.
320