educational measurement and school accountability directorate better informed, better positioned,...
TRANSCRIPT

Educational Measurement and School Accountability Directorate
Better informed, better positioned, better outcomes
National Assessment Program – Literacy and Numeracy(NAPLAN)
Understanding the Student Report

Educational Measurement and School Accountability Directorate
Better informed, better positioned, better outcomes
Reporting to parents
The Student Report is provided for all students who undertook the NAPLAN tests. The basic template for this report is the same for all students in Australia.
The Additional Student Report is provided for students in NSW and ACT schools. This report gives you extra information on your child’s performance in the tests.

Educational Measurement and School Accountability Directorate
Better informed, better positioned, better outcomes
Reporting to parents
An important feature of the reports is that they show achievement against a single assessment scale that covers 10 achievement bands from Year 3 to Year 9.
This means that as your child does the NAPLAN tests every two years you will be able to compare the results with those from the previous test, and see his or her progress on the scale.
Band 10
Band 1
Band 2
Band 3
Band 4
Band 5
Band 6
Band 7
Band 8
Band 9

Educational Measurement and School Accountability Directorate
Better informed, better positioned, better outcomes
Reporting to parentsEach Year level Student Report will show 6 of the bands.
• Year 9 reports will show bands 5 to 10
• Year 7 reports will show bands 4 to 9
• Year 5 reports will show bands 3 to 8
• Year 3 reports will show bands 1 to 6
Band 10
Band 9
Band 8
Band 7
Band 1
Band 6
Band 5
Band 4
Band 3
Band 2
Year 3
Year 5
Year 7
Year 9
Band 3
Band 4
Band 5
Band 6
Band 4
Band 5
Band 6
Band 7
Band 8
Band 5
Band 6
Band 7
Band 8
Band 9

Educational Measurement and School Accountability Directorate
Better informed, better positioned, better outcomes
Achievement Bands
Students are below the national minimum standard
Year 3
Band 1
Band 2
Band 3
Band 4
Band 5
Band 6
Band 3
Band 4
Band 5
Band 6
Band 7
Band 8
Year 5 Year 7 Year 9
Band 4
Band 5
Band 6
Band 7
Band 8
Band 9
Band 5
Band 6
Band 7
Band 8
Band 9
Band 10
Students are at the national minimum standard
Students are above national minimum standard

Educational Measurement and School Accountability Directorate
Better informed, better positioned, better outcomes
sample student result
range of achievement of
middle 60% of this Year group
range of bottom 20% for this Year group
above expected range of achievement for this Year
group
below expected range of achievement for this Year group
Bands
national average marker (triangle) for this Year group
range of top 20% for this Year group
This is the front cover of the Student Report.
Your child’s results are on the inside pages of
the report
school average marker (clear triangle) for this Year group

Educational Measurement and School Accountability Directorate
Better informed, better positioned, better outcomes
These are names of the test aspects
These circles show the student’s results for each test
These comments describe some of the skills and understandings which
students were asked to demonstrate in the tests.
The Language Conventions test has 2 parts:
• Spelling
• Grammar and Punctuation.

Educational Measurement and School Accountability Directorate
Better informed, better positioned, better outcomes
If a student was absent from one of the tests, there will not be a student result marker
shown for that test.
There will be a comment that says ‘Your child was absent
from this test’.
In this example of a student report, the student
was absent from the Numeracy test but present
for the Language Conventions test.
Comments are also included here for students
who were exempt or withdrawn from a
particular test or tests.
Reports for parents are not issued for students who were absent, exempt or
withdrawn from all tests.
Educational Measurement and School Accountability Directorate
Better informed, better positioned, better outcomes
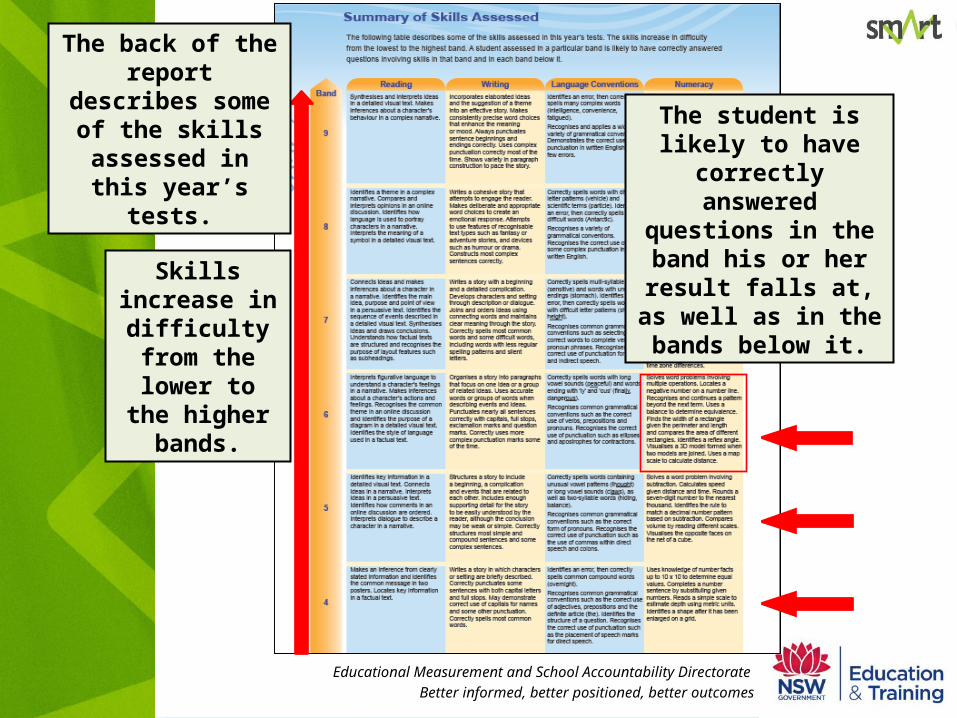
The back of the report describes some of the skills assessed in this
year’s tests.
Skills increase in difficulty from
the lower to the higher bands.
The student is likely to have correctly answered questions in the band his or her result falls at, as
well as in the bands below it.

Educational Measurement and School Accountability Directorate
Better informed, better positioned, better outcomes
Additional Student Report
The Additional Student Report is provided for students in schools in NSW and ACT schools.
It includes a school average marker for schools where 5 or more students participated in the tests.
It also tells you which questions the student answered correctly and which were incorrect.

Educational Measurement and School Accountability Directorate
Better informed, better positioned, better outcomes
The front of the Additional Student Report shows the
same test results as the inside of the Student Report.
The student’s result
The national average for this test and Year (black
triangle)
The school average for this test and Year
(clear triangle)

Educational Measurement and School Accountability Directorate
Better informed, better positioned, better outcomes
The inside and back of the Additional report lists the questions in each of
the test aspects.
Questions and criteria increase in difficulty from the bottom of the list
to the top.
The numbers in the centre columns tell you the percentage of students
in your state/territory who answered each question correctly.

Educational Measurement and School Accountability Directorate
Better informed, better positioned, better outcomes
The questions that the student answered correctly
are listed on the left.
The questions that the student answered incorrectly or did not attempt are listed on the right.

Educational Measurement and School Accountability Directorate
Better informed, better positioned, better outcomes
Codes for multiple choice questions
(a), (b), (c) or (d) indicates which of the incorrect answers was chosen
(*) indicates more than one answer was chosen
(-) indicates the question was not attempted
Codes are used to show the response to questions which a student had incorrect or did not attempt.
The code is shown in brackets at the end of the question descriptor.
The descriptor briefly outlines the skills and understandings being assessed in the question.
Written response questions
Where the answer has to be written for non-multiple choice questions, codes are also used to indicate the most common incorrect responses.

Educational Measurement and School Accountability Directorate
Better informed, better positioned, better outcomes
Codes for written response questions
(b) indicates the most common incorrect response(c) indicates the next most common incorrect response (*) indicates another incorrect response. (-) indicates the question was not attempted
Example of scoring written responses
In Year 5, the students had to write the correct spelling of ‘author’. The codes and incorrect responses were:(b) auther(c) orther(*) any other incorrect spelling.