educational administration...
TRANSCRIPT

http://eaq.sagepub.com/Quarterly
Educational Administration
http://eaq.sagepub.com/content/46/5/671The online version of this article can be found at:
DOI: 10.1177/0013161X10377347
2010 46: 671Educational Administration QuarterlyKenneth Leithwood, Sarah Patten and Doris Jantzi
LearningTesting a Conception of How School Leadership Influences Student
Published by:
http://www.sagepublications.com
On behalf of:
University Council for Educational Administration
at: can be foundEducational Administration QuarterlyAdditional services and information for
http://eaq.sagepub.com/cgi/alertsEmail Alerts:
http://eaq.sagepub.com/subscriptionsSubscriptions:
http://www.sagepub.com/journalsReprints.navReprints:
http://www.sagepub.com/journalsPermissions.navPermissions:
http://eaq.sagepub.com/content/46/5/671.refs.htmlCitations:
at Ebsco Electronic Journals Service (EJS) on June 20, 2012eaq.sagepub.comDownloaded from

What is This?
- Nov 5, 2010Version of Record >>
at Ebsco Electronic Journals Service (EJS) on June 20, 2012eaq.sagepub.comDownloaded from

Educational Administration Quarterly46(5) 671 -706
© The University Council forEducational Administration 2010
Reprints and permission: http://www.sagepub.com/journalsPermissions.nav
DOI: 10.1177/0013161X10377347http://eaq.sagepub.com
377347 EAQ
1University of Toronto, Ontario, Canada
Corresponding Author:Kenneth Leithwood, Ontario Institute for Studies in Education, University of Toronto, 252 Bloor St. West, Toronto ON M5S 1V6, Canada Email: [email protected]
Testing a Conception of How School Leadership Influences Student Learning
Kenneth Leithwood,1 Sarah Patten1, and Doris Jantzi1
Abstract
Purpose: This article describes and reports the results of testing a new con-ception of how leadership influences student learning (“The Four Paths”). Framework: Leadership influence is conceptualized as flowing along four paths (Rational, Emotions, Organizational, and Family) toward student learn-ing. Each path is populated by multiple variables with more or less powerful effects on student learning. Leaders increase student learning by improving the condition or status of selected variables on the Paths. Research Methods: Evidence includes teacher responses to an online survey (1,445 responses) measuring distributed leadership practices in their schools (N = 199) and variables mediating leaders’ effects on students. Grade 3 and 6 math and literacy achievement data were provided by the province’s annual testing program. The 2006 Canadian Census data provided a composite measure of school socioeconomic status. Path modeling techniques were used to test six hypotheses. Results: The Four Paths model as a whole explains 43% of the variation in student achievement. Variables on the Rational, Emotions, and Family Paths explain similarly significant amounts of that variation. Variables on the Organizational Path were unrelated to student achievement. Leader-ship had its greatest influence on the Organizational Path and least influence
Article
at Ebsco Electronic Journals Service (EJS) on June 20, 2012eaq.sagepub.comDownloaded from

672 Educational Administration Quarterly 46(5)
on the Family Path. Implications: School leaders and leadership research-ers should be guided much more directly by existing evidence about school, classroom, and family variables with powerful effects on student learning as they make their school improvement and research design decisions.
Keywords
leadership, mediating variables, academic press, collective teacher efficacy, professional learning communities
School leaders are capable of having significant positive effects on student learning and other important outcomes (Robinson, Hohepa, & Lloyd, 2009; Silins & Mulford, 2002; Waters, Marzano, & McNulty, 2003). Estimates of the size of these effects vary by type of study: modest in the case of large-scale empirical evidence, quite large in the case of qualitative studies of out-lier schools—schools in need of being turned around (e.g., Murphy, 2009) or schools that perform significantly beyond expectation (e.g., Mulford, Johns, & Edmunds, 2009). Indeed, enough evidence is now at hand to justify claims about significant leadership effects on students that the focus of attention for many leadership researchers has moved on to include questions about how those effects occur.
Because it is widely understood that the effects of school leadership on students are largely indirect (Hallinger & Heck, 1996; Leithwood & Jantzi, 1999; Witziers, Bosker, & Kruger, 2003), answering these “how” questions means searching for the most powerful mediators of leadership influence on students. In a summary of mediators used in leadership research up to about 15 years ago, for example, Hallinger and Heck (1996) identified school goal-setting processes and goal consensus, school culture and climate, decision-making processes, programs and instruction, resources, teachers’ expectations, commitment and attitudes toward change, instructional organization, sense of community, and an orderly environment.
Most individual empirical studies aimed at identifying significant leader-ship mediators since that review have examined only a single or very small number of mediators (Bryk & Schneider, 2002; Hoy, Tarter, & Hoy, 2006), whereas the few more comprehensive accounts of potential mediators (Leithwood et al., 2004; Silins & Mulford, 2002) are likely too complex to act as ready guides to practice. Furthermore, the basis on which mediators are selected for attention by researchers often remains unclear; there seems little consensus about which ones hold the greatest potential.
at Ebsco Electronic Journals Service (EJS) on June 20, 2012eaq.sagepub.comDownloaded from

Leithwood et al. 673
Such approaches to the identification of powerful leadership mediators pro-vide little guidance to practicing leaders who, just like researchers, are in the business of deciding where best to focus their efforts. As a response to these limitations, this article first describes and then provides an initial and partial test of a new conception, metaphorical in nature, of how leadership influ-ences student learning; the term new refers not to the details of the conception but to its overall structure. This conception of how leadership influences stu-dent learning is intended to be relatively comprehensive in its account of variables mediating leader effects yet simple and compelling enough to pro-vide practical guidance.
A New Conception of How Leadership Influences Student Learning1
The new conception is premised on assumptions about leadership as the exer-cise of influence and the indirect nature of its effects on students. Drawing on recent empirical evidence, this conception includes four distinct “Paths” along which leadership influence flows to improve student learning: Rational, Emotions, Organizational, and Family Paths. Each Path is populated by dis-tinctly different sets of variables (potential mediators of leadership influence) with widely varying levels of impact on students’ experiences. Selecting the most promising of these variables (a task requiring knowledge of relevant research as well as local context) and improving their status or condition are among the central challenges facing leaders intending to improve learning in their schools, according to this conception. As the status of variables on each Path improves through influences from leaders and other sources, the quality of students’ school and classroom experiences is enriched, resulting in greater learning. Over an extended period of time, leaders should attend to variables in need of strengthening on all Paths.
The Rational PathVariables on the Rational Path are rooted in the knowledge and skills of school staff members about curriculum, teaching, and learning. In general, exercising a positive influence on these variables calls on leaders’ knowl-edge about what some refer to as the “technical core” of schooling (Murphy & Hallinger, 1988), their problem-solving capacities (Robinson, 2010), and their knowledge of relevant leadership practices.
The Rational Path includes both classroom- and school-level variables. Since there is now a considerable amount of evidence available about the
at Ebsco Electronic Journals Service (EJS) on June 20, 2012eaq.sagepub.comDownloaded from

674 Educational Administration Quarterly 46(5)
effects on student learning of many such variables, school leaders are able to prioritize those known to have the greatest chance of improving their students’ learning. In the classroom, Hattie’s (2009) synthesis of evidence, reported as effect sizes (d), implies that school leaders carefully consider the value of focusing their efforts on improving, for example, the extent to which teachers are providing students with immediate and informative feedback (0.73), teachers’ use of reciprocal teaching strategies (0.74), teacher-student relations (0.72), the management of classrooms (0.52), and the general quality of teach-ing in the school. Effect sizes for these variables are among the highest reported for all classroom-level variables, whereas at least some variables currently the focus of considerable effort by school leaders have much smaller effect sizes; individualized instruction, as one example, has an effect size of 0.23.
Many school-level variables on the Rational Path have reported effects on student learning as large as all but a few classroom-level variables. Both aca-demic press2 and disciplinary climate3 stand out among these especially con-sequential variables and were selected to represent the Rational Path in this initial test of the new conception of how leaders influence student learning.
Academic press. Of the more than 20 empirical studies that have been pub-lished since about 1989, by far the majority have reported significant, posi-tive, and at least moderate relationships between academic press and student achievement, most often in the area of math but extending to other subjects such as writing, science, reading, and language as well (e.g., Goddard, Hoy, & Hoy, 2000). Some recent work positions academic press as an element of organizational health (Hoy & Tarter, 1997). These and related studies (Ma & Klinger, 2000; McGuigan & Hoy, 2006; Hoy et al., 2006; Smith & Hoy, 2007) concluded that increases in a school’s academic press are positively related to increased math and reading achievement, the size of the relation-ship competing with socioeconomic status (SES) in its explanatory power (Smith & Hoy, 2007). So there is relatively strong evidence that increasing academic press, either alone or in combination with other variables, results in increased student achievement.
A small number of studies have identified some of the leadership practices likely to increase a school’s academic press (e.g., Alig-Mielcarek, 2003; Jacob, 2004; Jurewicz, 2004). Included among those practices are, for example, pro-moting school-wide professional development; monitoring and providing feedback on the teaching and learning processes; developing and communi-cating shared goals; and being open, supportive, and friendly. Other examples of how leaders nurture academic press in their schools include establishing high expectations, helping to clarify shared goals about academic achievement, and monitoring student performance in relation to academic goals.
at Ebsco Electronic Journals Service (EJS) on June 20, 2012eaq.sagepub.comDownloaded from
Leithwood et al. 675
Disciplinary climate. Consistently positive evidence has also been reported about the contributions to student achievement of disciplinary climate. A large proportion of the research on this mediator has used very large data sets and sophisticated statistical methods (Ma, 2003; Ma & Crocker, 2007; Ma & Klinger, 2000; Ma & Willms, 2004), features that add to the confidence one can have in these findings. A recent study using data from teachers, students, and parents not only found positive effects of disciplinary climate but found that disciplinary climate predicted math achievement scores in high-SES schools (Dumay, 2009). Ma and Crocker’s (2007) study reports that schools with better disciplinary climates outperformed schools with poorer disciplin-ary climates. Hattie’s (2009) synthesis of evidence estimates that “decreasing disruptive behaviour” (p. 103) has a moderate effect size (d = 0.53) on stu-dent learning. Several studies suggest that academic press and disciplinary climate working together in schools explains more of the variation between schools than do these two variables working alone (Lee, Smith, Perry, & Smylie, 1999; McGuigan & Hoy, 2006).
Existing research offers very limited guidance about what leaders might do to develop the disciplinary climate in their schools, however. What evi-dence there is (e.g., Leithwood et al., 2004; Benda, 2000) recommends flex-ible rather than rigid responses by leaders to disciplinary events and the engagement of staff and other stakeholders in developing school-wide behav-ior plans. A broader body of evidence indicates that “the principal is the most potent factor in determining school climate” and that “a direct relationship between visionary leadership and school climate and culture is imperative to support teacher efforts that lead to the success of the instructional [and disci-plinary] program” (Benda, 2002, p. 5).
Evidence reviewed in this section justifies the first hypothesis tested in our study:
Hypothesis 1: Academic press and disciplinary climate will contribute equally to the amount of variation in student achievement explained by the Rational Path.
The Emotions PathThe Emotions Path includes the feelings, dispositions, or affective states of staff members, both individually and collectively, about school-related mat-ters: It touches directly on what L. Bolman and Deal (1991) included as part of their human resource frame. The Rational and Emotions Paths are highly interdependent. Considerable evidence indicates, for example, that emotions
at Ebsco Electronic Journals Service (EJS) on June 20, 2012eaq.sagepub.comDownloaded from
676 Educational Administration Quarterly 46(5)
direct cognition: They structure perception, direct attention, give preferential access to certain memories, and bias judgment in ways that help individuals respond productively to their environments (Oatley, Keltner, & Jenkins, 2006). Exercising influence on variables located on the Emotions Path depends fun-damentally on leaders’ social appraisal skills (Zaccaro, Kemp, & Bader, 2004) or emotional intelligence (Goleman, 1995).
A recent review of more than 90 empirical studies of teacher emotions and their consequences for classroom practice and student learning (Leithwood, 2006; Leithwood & Beatty, 2007) recommends leaders’ attention to variables on the Emotions Path. This review points to a large handful of teacher emo-tions with significant effects on teaching and learning, including both indi-vidual and collective teacher efficacy, job satisfaction, organizational commitment, morale, stress/burnout, engagement in the school or profession, and teacher trust in colleagues, parents, and students. Two of these emotions represent the Emotions Path in this study of our new conception.
Collective teacher efficacy (CTE). This emotion is conceptualized as the level of confidence a group of teachers feels about its ability to organize and imple-ment whatever educational initiatives are required for students to reach high standards of achievement. The effect of efficacy (or collective confidence) on teacher performance is indirect through the persistence it engenders in the face of initial failure and the opportunities it creates for a confident group to learn its way forward rather than giving up (Bandura, 1997).
In highly efficacious schools, evidence suggests that teachers accept res-ponsibility for their students’ learning. Learning difficulties are not assumed to be an inevitable byproduct of low SES, lack of ability, or family back-ground. CTE creates high expectations for students and encourages teachers to set challenging benchmarks for themselves, engage in high levels of plan-ning and organization, and devote more classroom time to academic learning. High-CTE teachers are more likely to engage in activity-based learning, student-centered learning, and interactive instruction. High CTE is associated with teachers’ adopting a humanistic approach to student management, testing new instructional methods to meet the learning needs of their students, and providing extra help to students who have difficulty. These teachers typically display persistence and resiliency in such cases. They reward students for their achievements, believe their students can reach high academic goals, and display more enthusiasm for teaching. Commitment to community partnerships and a strong sense of ownership in school decisions is also typical of high-CTE teacher groups (Goddard & Goddard, 2001; Goddard, Hoy, et al., 2000).
Whereas the total number of well-designed studies inquiring about CTE effects on students is still modest (about eight), their results are both consistent
at Ebsco Electronic Journals Service (EJS) on June 20, 2012eaq.sagepub.comDownloaded from

Leithwood et al. 677
and impressive. This relatively recent evidence demonstrates a significant positive relationship between CTE and student achievement. Indeed, several of these studies have found that the effects on achievement of CTE exceed the effects of students’ SES (e.g., Goddard, Hoy, et al., 2000), a variable that typically explains by far the bulk of achievement variation across schools. High-CTE schools also are associated with lower suspension and dropout rates as well as greater school orderliness (Tschannen-Moran & Barr, 2004).
There are two sources of insight about how leaders might improve the col-lective efficacy of their teaching colleagues. One source is Bandura (e.g., 1997), clearly the major figure in thinking about CTE. His theoretical work, by now widely supported empirically, identifies conditions that influence the collective efficacy of a group, including opportunities to master the skills needed to do whatever the job entails, vicarious experiences of others per-forming the job well, and beliefs about how supportive the setting is in which one is working. Leaders have the potential to influence all of these conditions, for example, by sponsoring meaningful professional development, encourag-ing their staff to network with others facing similar challenges to learn from their experiences, and structuring their schools to allow for collaborative work among staff.
A second source of insight about how leaders might improve the collec-tive efficacy of their teaching colleagues is the small number of studies that have inquired about the leadership practices that improve CTE (e.g., Leithwood & Jantzi, 2008). For the most part, these have been studies of transformational leadership practices on the part of principals. Evidence from these studies demonstrates significant positive effects on CTE when princi-pals clarify goals by, for example, identifying new opportunities for the school; developing (often collaboratively), articulating, and inspiring others with a vision of the future; and promoting cooperation and collaboration among staff toward common goals. Positive effects on CTE are also associ-ated with school leaders’ offering individualized support by showing respect for individual staff members, demonstrating concern about their personal feelings, maintaining an open door policy, and valuing staff opinions. Principals also contribute to CTE by providing appropriate models of both desired prac-tices and appropriate values (walking the talk).
Trust in colleagues, students and parents. This form of trust includes a belief or expectation on the part of most teachers that their colleagues, students, and parents support the schools’ goals for student learning and will reliably work toward achieving those goals. Transparency, competence, benevolence, and reliability are among the qualities persuading others that a person is trustwor-thy. Evidence suggests that teacher trust is critical to the success of schools,
at Ebsco Electronic Journals Service (EJS) on June 20, 2012eaq.sagepub.comDownloaded from

678 Educational Administration Quarterly 46(5)
and nurturing trusting relationships with students and parents is a key element in improving student learning (e.g., Bryk & Schneider, 2003; Lee & Croninger, 1994).
Trust remains a strong predictor of student achievement even after the effects of student background, prior achievement, race, and gender have been taken into account in some recent studies of trust in schools (Goddard, Salloum, & Berebitsky, 2009; Goddard, Tschannen-Moran, & Hoy, 2001). McGuigan and Hoy (2006) found positive correlations between teacher trust and student achievement in reading (0.55) and mathematics (0.68). Goddard (2003) argued that when teacher–parent, and teacher–student relationships are characterized by trust, academically supportive norms and social relations have the poten-tial to move students toward academic success.
Recent evidence points to principal leadership as a critical contributor to trust among teachers, parents, and students (e.g., Bryk & Schneider, 2003; Tschannen-Moran, 2001). Principals engender trust with and among staff and with both parents and students when they recognize and acknowledge the vulnerabilities of their staff and when they listen to the personal needs of staff members, assisting as much as possible to reconcile those needs with a clear vision for the school. Trust is also engendered when school leaders create a space for parents in the school and demonstrate to parents that they (the prin-cipal) are reliable, open, and scrupulously honest in their interactions. Buffering teachers from unreasonable demands from the policy environment or from the parents and the wider community has been shown to be trust building, as has behaving toward teachers in a friendly, supportive, and open manner and setting high standards for students and then following through with support for teachers.
Evidence reviewed in this section provides no reason to expect differences in the contributions to student achievement of the two variables representing the Emotions Path.
Hypothesis 2: CTE and teacher trust will contribute equally to the amount of variation in student achievement explained by the Emotions Path.
The Organizational PathVariables on the Organizational Path include features of schools that frame the relationships and interactions among organizational members including, for example, structures, cultures, policies, and standard operating procedures.4 Collectively, these variables encompass teachers’ working conditions, which in turn have a powerful influence on teachers’ emotions (Leithwood & Beatty,
at Ebsco Electronic Journals Service (EJS) on June 20, 2012eaq.sagepub.comDownloaded from

Leithwood et al. 679
2007). These variables constitute both the school’s infrastructure and a large proportion of its collective memory and are a composite of L. Bolman and Deal’s (1991) structural and symbolic frames.
Hattie’s (2009) synthesis of evidence identifies more than a dozen vari-ables located on the Organizational Path. Some are at the classroom level (e.g., class size, ability groupings) and some are school-wide (e.g., school size, multi-grade or -age classes, retention policies). Many variables on this path are typically controlled by agencies outside the school (e.g., school funding, summer school). Instructional time and professional learning communities were chosen to represent the Organizational Path for this study.
Instructional time. Early research on time for learning introduced four distinct ways in which it could be conceptualized and measured. Research about the extent to which these different ways of conceptualizing and mea-suring instructional time influence student learning can be summed up as follows:
• The total amount of time potentially available for instruction, typi-cally measured as student attendance rates, has reported effects on student learning varying from weakly significant to quite strong (Marburger, 2006; Roby, 2004; Wang, 1998).
• The total amount of time actually devoted to instruction has moder-ate effects on student learning (Bellei, 2009; Harn, Linan-Thompson, & Roberts, 2008; Kyriakides & Creemers, 2008).
• The content of the curriculum in which students spend time study-ing, opportunity to learn, has quite strong effects on learning (Torn-roos, 2005; Wang, 1998).
• Students’ total amount of academically engaged time is strongly associated with student learning (Bellei, 2009; Harn et al., 2008; Marburger, 2006).
There has been little direct evidence reported about leadership practices for optimizing instructional time in schools, with the major exception of res-earch on leadership buffering. A venerable leadership practice, the value of buffering as a contribution to organizational goals is justified by evidence col-lected in schools (e.g., Crow & Weindling, 2010; DiPaola & Tschannen-Moran, 2005). In schools, buffering aims to protect the efforts of teachers from the many distractions they face from both inside and outside their organizations often referred to as initiative overload. Such protection allows teachers to spend their time on key instructional priorities.
at Ebsco Electronic Journals Service (EJS) on June 20, 2012eaq.sagepub.comDownloaded from

680 Educational Administration Quarterly 46(5)
Professional learning community (PLC). An important aspect of the Organiza-tional Path is to disseminate and reinforce the learning of individual members to create the potential for that learning to be passed on to many others. The professional development of teachers is a concern for school leaders, espe-cially when teachers are being asked to change their practice. Hattie (2009) identified an effect size of 0.62 for professional development on student achievement.
One of the necessary conditions for such a large effect was teachers’ inter-acting with one another in a professional community. A great deal of research has focused on the role and potential provided through PLCs (DuFour, Eaker, & DuFour, 2005), how to build and sustain PLCs (e.g., Stoll & Louis, 2007), and how a principal can initiate and support their work (Mitchell & Sackney, 2006; Olivier & Hipp, 2006). A recent review of PLC research (Vescio, Ross, & Adams, 2008), however, found only eight studies reporting an association between PLCs and student learning. These studies all found that student learning improved when teachers participated in PLCs. One of these studies (Louis & Marks, 1998), conducted in exemplary schools, found a strong association between PLCs and student achievement because the school cul-ture focused on student learning and teachers’ pedagogy. The presence of a well-functioning PLC accounted for 85% of the variance in student achieve-ment across schools in this study.
Another large-scale study in England also found an association between teacher PLC participation and student achievement. The more staff were involved in PLCs in their schools, the higher students performed in class and on a national test (R. Bolman, McMahon, Stoll, Thomas, & Wallace, 2005). Qualitative studies examining how teachers talk with other teachers about data, pedagogy, and classroom strategies also report improvements for stu-dents (Berry, Johnson, & Montgomery, 2005; Hollins, McIntyre, DeBose, Hollins, & Towner, 2004; Strahan, 2003).
Leadership behaviors that support the work of PLCs are presented in the research as “quiet support, rather than bold, visibly transformational action” (Wahlstrom & Louis, 2008, p. 483). Principals are encouraged to be support-ive rather than directive, taking a professional orientation rather than a bureau-cratic one (Tschannen-Moran, 2009). Several studies highlight the importance of the principal’s role in providing, scheduling, and then protecting the time allocated for teachers to meet as PLCs, guiding the goals and vision for pro-fessional development, and providing other resources to allow PLCs to operate smoothly (Louis, Marks, & Kruse, 1996; Mullen & Hutinger, 2008; Tschannen-Moran, 2009). Other studies focus on how principals strengthen the work of PLCs by distributing leadership (McLaughlin & Talbert, 2007; Olivier &
at Ebsco Electronic Journals Service (EJS) on June 20, 2012eaq.sagepub.comDownloaded from

Leithwood et al. 681
Hipp, 2006). Schools can benefit from the effect of PLCs when principals support the work of teachers.
Evidence reviewed in this section provides no justification for expecting different effects on achievement of the two variables selected to represent the Organizational Path in this test.
Hypothesis 3: Instructional time and teachers’ professional community will contribute equally to the amount of variation in student achieve-ment explained by the Organizational Path.
The Family PathIt is often claimed that improving student learning is all about improving instruction (Nelson & Sassi, 2005; Stein & Nelson, 2003). While improving instruction is both important and necessary work in many schools, this claim, by itself, ignores all of the powerful variables found on both the Emotional and Organizational Paths described in two of the earlier sections of this article. Even more critically, this claim seems to dismiss the family-related factors accounting for as much as 50% of the variation in student achieve-ment across schools (e.g., Kyriakides & Creemers, 2008): Such factors are part of what is often labeled the external environment in organizational theory (Daft, 1989). Since best estimates suggest that everything schools do within their walls accounts for about 20% of the variation in students’ achievement (e.g., Creemers & Reezigt, 1996), influencing variables on the Family Path is likely to be a high-leverage option for school leaders.
Family-related factors are of two types, from the school’s perspective: unalterable and alterable. Unalterable family-related variables are those over which the school has no influence (e.g., parental education, parental income). In this study, such variables are considered indicators of a school communi-ty’s SES and treated as moderators of leadership influence on student learn-ing. Alterable family variables, sometimes referred to as family educational culture (Walberg, 1981), are potentially open to influence from the school and its leadership. Our conception of the Family Path includes only variables that are potentially alterable by the school and its leadership. These variables are more directly related to the learning of students as compared with vari-ables usually included as SES.
Treating as many family-related variables as possible as alterable rather than unalterable was considered to be the new work of leaders more than 15 years ago (Goldring & Rallis, 1993). Among such variables, Hattie (2009) identified, for example, home environment (0.57), time spent watching television
at Ebsco Electronic Journals Service (EJS) on June 20, 2012eaq.sagepub.comDownloaded from
682 Educational Administration Quarterly 46(5)
(0.18), and visits to the home by school personnel (0.29). Emerging as most important in Hattie’s review and other research (see Hong & Ho, 2005) are the academic and occupational aspirations and expectations for children of parents, guardians, and other significant members of their immediate com-munity. Hattie reported an effect size of 0.58 for parent expectations, which as he noted, “was far greater than parental involvement at the school (d = 0.21)” (p. 69).
The two variables used to represent the Family Path in this initial test included “access to adult support in the home for school work” and “access to a computer in the home for school work.” Whereas previous evidence can be used to justify these choices (Dumay, 2009; Ma & Klinger, 2000), our selection was determined by the evidence available to us about Family Path variables.
There is not much research on how principals go about influencing alter-able Family Path variables. The five studies we were able to locate reported evidence about principals’ skills, attitudes, beliefs, and behaviors. Two of these studies identified principal skills: the ability to make parents feel wel-come in the school (Baker, 1997) and strong structural leadership (Belenardo, 2001). In the Belenardo (2001) study, structural leadership meant being ana-lytic; having technical expertise; attending to detail; making good decisions; and being a clear, logical thinker. This form of leadership was associated with a sense of community shared by staff and parents. Results of Chrispeels’s (1996) study could be interpreted as recommending the appointment of a community liaison person as a link between school and home to help build both teacher and parent capacity to communicate with one another, some-thing a principal would likely need to initiate. But Chrispeels’s evidence is only suggestive. Finally, two studies reported evidence about principal beliefs: Norris (1999) reported that principals and parents held differing esti-mates of the extent of parent involvement in their schools, with parent esti-mates being higher than the estimates of principals; Osborne and deOnis (2000) found higher levels of importance attached to parent engagement among elementary and middle school principals as compared with secondary school principals.
Evidence reviewed in this section justifies a fourth hypothesis, although this hypothesis does not adequately reflect our reservations about the choice of variables to be included as part of the Family Path.
Hypothesis 4: Alterable family variables included as part of the Family Path will explain significantly more variation in student achieve-ment across schools than will SES.
at Ebsco Electronic Journals Service (EJS) on June 20, 2012eaq.sagepub.comDownloaded from

Leithwood et al. 683
A fifth hypothesis also tested in this study was about the relative size of the effects on student achievement of the Four Paths.
The Relative Effects of the Four PathsAs the first three hypotheses made clear, evidence about variables within each of the first three paths does not justify predictions of differences in their effects on student learning. However, the relative amount and quality of evi-dence about variables on each of the paths does warrant considerable confi-dence in predicting the relative effects of the Four Paths as a whole. Quite clearly, evidence about the effects of family variables is greater in amount, is more consistent, and indicates larger effects than evidence about variables on the other three paths. This leads to our fifth and final hypothesis:
Hypothesis 5: Of the total amount of variation in student achievement explained by the Four Paths in aggregate, the Family Path will explain the largest proportion, followed in order by the Rational, Emotions, and Organizational Paths.
LeadershipIn this study, leadership was conceptualized and measured as a set of prac-tices distributed among staff rather than enacted only by those in formal leadership roles. Our review of evidence about the effects on students of the variables selected to represent each of the Four Paths included summaries of evidence about specific leadership practices that have been demonstrated to improve the condition of each variable considered separately. Ideally, a test of the Four Paths model would include a measure of leadership reflecting most or all of these practices. However, the measure of leadership used in this test (described more fully in the methods section) has a narrower focus due to the purposes of the larger project providing data for this study.
Several recent syntheses of evidence (Leithwood & Riehl, 2005; Leithwood et al., 2006) have identified four broad categories of successful school leader-ship practices including setting directions, developing people, redesigning the organization, and managing the instructional program. The specific leadership practices associated with each variable in the review (above) are fully encom-passed within these categories. But the measure of leadership used for this test was dominated by one—managing and leading the instructional program. This explains the reason for the sixth and final hypothesis tested in this study:
at Ebsco Electronic Journals Service (EJS) on June 20, 2012eaq.sagepub.comDownloaded from

684 Educational Administration Quarterly 46(5)
Hypothesis 6: The strongest direct effects of leadership, as it was mea-sured in this study, will be on variables representing the Rational Path.
MethodSample
This study used data collected as part of a larger, 5-year, still-ongoing evalu-ation of a provincially sponsored project in a Canadian province aimed at improving elementary school student achievement in language and math by improving the quality of leadership in schools.5 Over the most recent 3 years of the project, approximately comparable survey data have been collected from project principals and a sample of their teachers in both the fall and spring of each year; phone interviews have been conducted with a sample of principals during the winter of each year as well. Increasing numbers of principals have joined the project as it has unfolded.
Part of the data for this study was provided by a teacher survey adminis-tered in the spring of 2009, at which time approximately 1,200 principals from the majority of the province’s 72 school districts were official project participants. Online surveys were available to all teachers in each principal participant’s school. However, because we do not know how many teachers in total had the opportunity to respond to those surveys, the overall response rate is unknown. Evidence used in this study to measure seven variables (described above) representing the Rational, Emotions, and Organizational Paths as well as Leadership was provided by 1,445 teachers in the 199 schools in which responses were provided by at least 3 teachers (M = 6; SD = 4.08).6
Sources of EvidenceThe online teacher survey was used to collect evidence about variables used to represent the Rational, Emotions, and Organizational Paths as well as Leadership. Several of the multi-item scales used for this purpose were adopted or adapted from earlier research, whereas others were developed specifically for the study. In all cases, teachers responded to a 5-point Likert-type scale about the extent to which they agreed that the item statements were true for them.7
Academic press. This 6-item scale was adapted from a scale used by Hoy and Tarter (1997) with an alpha coefficient of .94. Example items from this scale include “My school sets high standards for academic success” and “Stu-dents respect others who get good grades.”
at Ebsco Electronic Journals Service (EJS) on June 20, 2012eaq.sagepub.comDownloaded from

Leithwood et al. 685
Disciplinary climate. Typically measured using student surveys, the 5 items in this scale were adapted from this earlier research (e.g., Ma & Willms, 2004) to form a scale to use with teachers, including, for example, “Students do not start working for a long time after my lessons begin” (scale reversed) and “Students in my class rarely disrupt the learning of other students.”
Collective teacher efficacy. Based largely on a scale (Cronbach’s alpha = .96) reported by McGuigan and Hoy (2006), examples from this 8-item scale include “Teachers in this school are confident they will be able to motivate their students” and “If a student doesn’t learn something the first time teach-ers in this school will try another way.”
Teacher trust in parents, students, and colleagues. Adapted from several dif-ferent scales used by Tschannen-Moran (2001), this 6-item scale included, for example, “Teachers can count on support from most students’ families” and “Almost all students can be counted on to do their work.”
Uses of instructional time. Specifically developed for this study, example items in this 10-item scale include “My classroom timetable includes large uninterrupted blocks of learning time” and “I am able to minimize time lost as a result of lateness and time out of class on the part of students”.
PLCs. A 9-item scale was developed specifically for this study, including, for example, “I almost always learn something useful during PLC meetings.”
Leadership. The 17 items included in this scale were derived from several sources, all of which can be found in the best-evidence synthesis reported by Robinson et al. (2009). The first item in the scale assessed the extent of lead-ership distribution in the school (“Leadership in this school is provided by many teachers and administrators”). One item was about direction-setting practices (“Leaders clearly communicate expected standards for literacy and math”), two items were about practices aimed at developing people (e.g., “Leaders provide quality staff development opportunities . . .”), and one item concerned organizational design (“Leaders provide us with opportunities to collective discuss student work”). All remaining items (12) were practices aimed at managing the instructional program (e.g., “Leaders provide me with useful feedback about my instruction”; “Leaders provide me with informa-tion about instruction that is useful to me in the classroom”).
Evidence about the two variables used to represent the Family Path (stu-dents’ access to adult support in the home for school work and access to a computer in the home for school work) was provided by questionnaire res-ponses of students collected as part of the province’s administration of annual tests of reading, writing, and mathematics in Grades 3 and 6. Concerning adult help, the public report of results for each school indicates the percent-ages of students who respond yes, sometimes, or no to three statements: “I read
at Ebsco Electronic Journals Service (EJS) on June 20, 2012eaq.sagepub.comDownloaded from

686 Educational Administration Quarterly 46(5)
with someone older than me at home”; “Someone older than me helps me with my writing at home”; and “Someone older than me helps me with my math-ematics at home.” The mean percentage of students who answered yes to each prompt was calculated for each school. Evidence used to measure avail-ability of computers was the mean percentage of students who answered yes to the prompt “At home, there is a computer for me to use for school work.” These two variables mirror features of family education culture considered important in several previous studies (Dumay, 2009; Leithwood & Jantzi, 2006; Ma & Klinger, 2000).
A combination of three measures provided by the 2006 Canadian Census was used to estimate school SES:
• percentage of two-parent families, calculated as number of two-parent families divided by total number of census families in the census tract (married and common law families were both consid-ered two-parent households);
• median income of all census families (gross, before tax, combined income all members of the household); and
• percentage of parents’ highest educational attainment, calculated as the number of people in the census tract of each school, in the age range of 25 to 34, who had obtained any postsecondary education including college, diploma, or university degrees.
Other researchers (Hoy, Hannum, & Tschannen-Moran, 1998; Ma & Crocker, 2007) have adopted similar measures of SES because they are better estimates of family background than the more typical use of family income alone.
Evidence about school-level8 student achievement was derived from the results of the province’s criterion-referenced tests in reading, writing, and mathematics administered each year to students in Grades 3 and 6. School results are reported as the percentage of students achieving at each of four levels on the tests, Level 3 having been set as the acceptable standard. So our measure of achievement for each school was the percentage of students achiev-ing at Level 3 or greater.
Data AnalysisAfter calculating means, standard deviations, and scale reliabilities, we con-ducted confirmatory factor analyses on all measures of variables represent-ing each the Four Paths and correlations between all variables. The LISREL path analysis program was used to test relationships between leadership, the Four Paths, and student achievement. This path analytic technique allows for
at Ebsco Electronic Journals Service (EJS) on June 20, 2012eaq.sagepub.comDownloaded from

Leithwood et al. 687
testing the validity of causal inferences for pairs of variables while control-ling for the effects of other variables. Data were analyzed using the LISREL 8.80 analysis of covariance structure approach to path analysis and maxi-mum likelihood estimates (Jöreskog & Sörbom,1993). We used four goodness-of-fit statistics to assess the fit of our path model with the data: the Root Mean Square Error of Approximation test (RMSEA), the Norm-Fit Index (NFI), the Adjusted Goodness of Fit Index (AGFI), and the mean Root Mean Square Residual (RMR).
We analyzed student achievement effects separately for each of the math, reading, and writing scores as well as most combinations of these scores. Because the pattern of results did not change much depending on which of these scores was used, results reported below are limited to the average of Grade 3 and 6 math scores (Figure 1) and the average of math, language, and reading scores at both Grades 3 and 6 combined (Figure 2).
Standardized Total Effects on Student Achievement(Total explained variation = 36%)
SES .43*Leadership Practices .11*Rational Path .26*Emotional Path .21Organizational Path –.08Family Path .26*
.26
.20
.33
.75
.32
.26
.57
.15
.56
Rational Path
Emotional Path
Organizational Path
SES
LeadershipPractices
Family Path
MathematicsAchievement
–.07
Figure 1. Effects of leadership and the Four Paths on students’ math achievement (N = 199)
at Ebsco Electronic Journals Service (EJS) on June 20, 2012eaq.sagepub.comDownloaded from

688 Educational Administration Quarterly 46(5)
Results and Discussion
Table 1 reports descriptive statistics for each of the variables measured in the study. The mean responses to variables on the three Paths for which teachers provided data falls within the fairly narrow range of 3.51 for disciplinary
Standardized Total Effects on Student Achievement(Total explained variation = 43%)
SES .47*Leadership Practices .15*Rational Path .26*
Academic Press .23*Disciplinary Climate .22*
Emotions Path .21Collective Teacher Efficacy .34*Teacher Trust in Others .20
Organizational Path –.08Instructional Time –.12Professional Learning Community .06
Family Path .26*Computer at Home .34*Adult Help at Home –.16*
Academic Press (RP)
SES
LeadershipPractices
StudentAchievement
Disciplinary Climate (RP)
Collective TeacherEfficacy (EP)
Teacher Trust (EP)
Instructional Time (OP)
Professional LearningCommunity (OP)
Computer atHome (FP)
Adult Help (FP)
.34
–.23
–.16
.33
.69
.10
.28
.30
.47
Figure 2. Effects of leadership and eight specific variables on combined math and language achievement
at Ebsco Electronic Journals Service (EJS) on June 20, 2012eaq.sagepub.comDownloaded from

Leithwood et al. 689
climate to 3.90 for teacher trust. Standard deviations of those scales are rela-tively small, also falling within a narrow range, which suggests a reasonably high level of agreement among teachers about the status of each of these variables. Although the reliability (Cronbach’s alpha) of scales measuring instructional time and PLCs meet conventional standards (.86 and .89), the aggregate Organizational Path scale falls just below what is normally consid-ered the acceptable minimum (.59). The two variables on the Family Path behave very differently as we report later, accounting for this scale’s lack of reliability.9
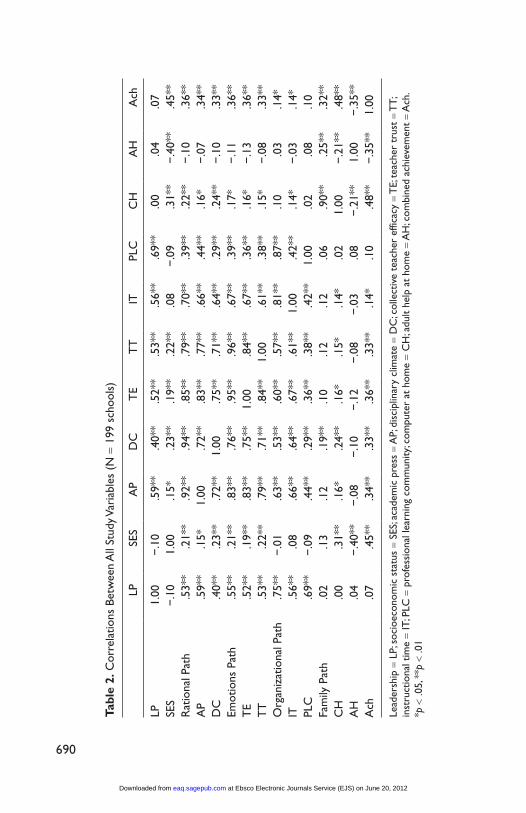
Table 2 reports correlations between all variables. In addition to our theoretical assumptions, these correlations were used to determine the rela-tionships to be tested between specific variables mediating the influence of leadership on student achievement in the two-path models summarized in Figures 1 and 2.
Table 1. Summary of Responses to Variable Measures (N = 199 schools)
M SD Reliability
Socioeconomic status 58.92a 7.21 .61Leadership practices 3.64b 0.43 .97Rational Path 3.60 0.42 .83 Academic press 3.70 0.41 .89 Disciplinary climate 3.51 0.48 .82Emotions Path 3.86 0.35 .91 Collective teacher efficacy 3.83 0.35 .86 Teacher trust in others 3.90 0.38 .85Organizational Path 3.66 0.29 .59 Instructional time 3.88 0.31 .86 Professional learning community 3.43 0.38 .89Family Path 38.62c 4.89 −.37 Computer at home 61.62 9.69 NA Adult help at home 15.61 4.43 NAMean achievement 66.21d 12.45 NAMathematics achievement 65.53 14.06 NA
a.Mean percentage in school with two-parent families, higher incomes, and higher parental expectations.b.Leadership and the next three path means are based on a 5-point scale, 1 = disagree strongly to 5 = agree strongly.c.Family Path means are based on percentage of families in school with computers and adult help at home.d.Percentage achieving at or above provincial standards on 2009 provincial tests for Grades 3 and 6.
at Ebsco Electronic Journals Service (EJS) on June 20, 2012eaq.sagepub.comDownloaded from
Tabl
e 2.
Cor
rela
tions
Bet
wee
n A
ll St
udy V
aria
bles
(N
= 1
99 s
choo
ls)
LPSE
SA
PD
CT
ET
TIT
PLC
CH
AH
Ach
LP1.
00−
.10
.59*
*.4
0**
.52*
*.5
3**
.56*
*.6
9**
.00
.04
.07
SES
−.1
01.
00.1
5*.2
3**
.19*
*.2
2**
.08
−.0
9.3
1**
−.4
0**
.45*
*R
atio
nal P
ath
.53*
*.2
1**
.92*
*.9
4**
.85*
*.7
9**
.70*
*.3
9**
.22*
*−
.10
.36*
*A
P.5
9**
.15*
1.00
.72*
*.8
3**
.77*
*.6
6**
.44*
*.1
6*−
.07
.34*
*D
C.4
0**
.23*
*.7
2**
1.00
.75*
*.7
1**
.64*
*.2
9**
.24*
*−
.10
.33*
*Em
otio
ns P
ath
.55*
*.2
1**
.83*
*.7
6**
.95*
*.9
6**
.67*
*.3
9**
.17*
−.1
1.3
6**
TE
.52*
*.1
9**
.83*
*.7
5**
1.00
.84*
*.6
7**
.36*
*.1
6*−
.13
.36*
*T
T.5
3**
.22*
*.7
9**
.71*
*.8
4**
1.00
.61*
*.3
8**
.15*
−.0
8.3
3**
Org
aniz
atio
nal P
ath
.75*
*−
.01
.63*
*.5
3**
.60*
*.5
7**
.81*
*.8
7**
.10
.03
.14*
IT.5
6**
.08
.66*
*.6
4**
.67*
*.6
1**
1.00
.42*
*.1
4*−
.03
.14*
PLC
.69*
*−
.09
.44*
*.2
9**
.36*
*.3
8**
.42*
*1.
00.0
2.0
8.1
0Fa
mily
Pat
h.0
2.1
3.1
2.1
9**
.10
.12
.12
.06
.90*
*.2
5**
.32*
*C
H.0
0.3
1**
.16*
.24*
*.1
6*.1
5*.1
4*.0
21.
00−
.21*
*.4
8**
AH
.04
−.4
0**
−.0
8−
.10
−.1
2−
.08
−.0
3.0
8−
.21*
*1.
00−
.35*
*A
ch.0
7.4
5**
.34*
*.3
3**
.36*
*.3
3**
.14*
.10
.48*
*−
.35*
*1.
00
Lead
ersh
ip =
LP;
soc
ioec
onom
ic s
tatu
s =
SES;
acad
emic
pre
ss =
AP;
dis
cipl
inar
y cl
imat
e =
DC
; col
lect
ive
teac
her
effic
acy
= T
E; t
each
er t
rust
= T
T;
inst
ruct
iona
l tim
e =
IT; P
LC =
pro
fess
iona
l lea
rnin
g co
mm
unity
; com
pute
r at
hom
e =
CH
; adu
lt he
lp a
t ho
me
= A
H; c
ombi
ned
achi
evem
ent
= A
ch.
*p <
.05,
**p
< .0
1
690
at Ebsco Electronic Journals Service (EJS) on June 20, 2012eaq.sagepub.comDownloaded from

Leithwood et al. 691
Path models similar to those reported in Figures 1 and 2 were calculated separately for five different measures of student achievement (combined math and language, math only and language only, Grade 3 combined achieve-ment, and Grade 6 combined achievement). These path models examined the effects of the Four Paths, along which leadership influence flows, as well as the effects of each of the eight separate variables included as variables on the Four Paths: All models included the measure of SES as a moderator. Whereas only two models are reported in the interests of space, results are very similar for models not reported; for example, total explained variation in achieve-ment ranged from 36% to 46% and SES explained approximately 45% of this variation in achievement in all models.
Figure 1 reports the effects of leadership and an aggregate measure of each of the Four Paths on average math achievement in Grades 3 and 6. This model, a good fit with the data (RMSEA = .00; RMR = .01; AGFI = .97; NFI = 1.00; χ2 = 2.69 with 4 degrees of freedom and a p value of .63), explains 36% of the variation in combined Grade 3 and 6 student math achievement across schools.
All paths tested are shown in this figure: significant paths with solid lines, insignificant paths with dotted lines. There are medium-sized coefficients between Leadership and both the Rational and Organizational Paths (.56 and .57), weak but still significant relationships between Leadership and the Emotions Path (.15), and nonsignificant relationships between Leadership and the Family Path (–.07).
Figure 2 reports the effects of Leadership and each of the eight specific variables representing the Four Paths on achievement (the path to which each variable belongs is indicated by letters: e.g., rational path = RP) calculated as a composite of Grades 3 and 6 math, reading, and writing scores. Also a good fit with the data (RMSEA = .00; RMR = .02; AGFI = .96; NFI = .99; χ2 = 13.23 with 21 degrees of freedom and a p value of .90), this model accounts for 43% of variation in achievement across schools. Figure 2 includes signifi-cant paths only. In order of strength, leadership is significantly related to PLCs (.69), academic press (.33), instructional time (.30), and teacher trust (.28). It is only weakly but significantly related to CTE (.10). Three variables on two Paths directly and significantly contribute to student achievement. One of these relationships is positive (computers at home = .34) and two are negative (instructional time = –.23; adult help = –.16)
Results summarized in Figures 1 and 2 also indicate considerable interac-tion among the Paths. Restricting attention to Figure 1 for a sense of these interactions, there are large path coefficients between the Rational and Emotions
at Ebsco Electronic Journals Service (EJS) on June 20, 2012eaq.sagepub.comDownloaded from

692 Educational Administration Quarterly 46(5)
Paths (.75) and smaller but still significant relationships between the Rational Path and both the Organizational (.33) and Family (.20) Paths.
The largest amount of variation in student achievement is explained by the Rational and Family Paths (26% in each case). The Family Path’s impact is largely accounted for by the availability of a computer in the home for doing homework (.34). Adult help at home for school work, part of the Family Path, demonstrates modest but significant negative effects on achievement (–.16).
Of the two remaining Paths, the Emotions Path accounts for 21% of the total explained variation in student achievement, and the Organizational Path has weak, negative effects on achievement (–8%). The combined direct and indirect effects of leadership on achievement are modest but significant (11% and 15% in Figures 1 and 2, respectively).
The remainder of this section uses the evidence summarized above to test the study’s six hypotheses.
Hypothesis 1: Academic press and disciplinary climate will contribute equally to the amount of variation in student achievement explained by the Rational Path.
Our evidence supports this hypothesis. Table 2 indicates approximately the same correlation (in the .33 range) with the combined measure of achievement for academic press and disciplinary climate. The path model reported in Figure 2 indicates that academic press accounts for 23% of the variation in the com-bined achievement measure, as compared with 22% for disciplinary climate.
Hypothesis 2: CTE and teacher trust will contribute equally to the amount of variation in student achievement explained by the Emo-tions Path.
Results do not support this hypothesis. Although Table 2 indicates small differences in correlations favoring CTE over trust, the path model reported in Figure 2 indicates that CTE explains a significant 34% of the variation in achievement, as compared with a nonsignificant 20% for teacher trust.
Hypothesis 3: Instructional time and teachers’ professional community will contribute equally to the amount of variation in student achieve-ment explained by the Organizational Path.
Results support this hypothesis, although neither variable is a significant predictor of achievement. Table 2 reports weak, nonsignificant correlations
at Ebsco Electronic Journals Service (EJS) on June 20, 2012eaq.sagepub.comDownloaded from

Leithwood et al. 693
with achievement for both variables on the Organizational Path, only slightly larger for uses of instructional time (.14) than for PLC (.10). The path model summarized in Figure 2 indicates that instructional time explains –.12 of the explained variation in achievement, whereas PLC explains .06 of such variation.
Hypothesis 4: Alterable family variables included as part of the Family Path will explain significantly more variation in student achieve-ment across schools than will SES.
Our evidence does not support this hypothesis. Table 2 reports a correla-tion with achievement of .48 for computer at home, –.35 for adult help at home, and .45 for SES. More directly, the path models described in Figures 1 and 2 indicates that SES explains 47% of the variation in each of the achieve-ment measures,10 whereas the Family Path (in aggregate) explains 26%. Furthermore, the two variables on the Family Path behave very differently. Adult help at home may appear to have a negative effect because students who struggle most may be those who receive the most help.
Hypothesis 5: Of the total amount of variation in student achievement explained by the Four Paths in aggregate, the Family Path will explain the largest proportion, followed in order by the Rational, Emotional, and Organizational Paths.
Results provide partial support for this hypothesis. Table 2 reports corre-lations with achievement of .29 for the Family Path, weaker than correlations for the Rational (.37) and Emotions Paths (.36). However, the more powerful analysis described in Figure 1 indicates that the Rational and Family Paths explain identical amounts of variation in achievement (26%), followed by the Emotions (.21) and Organizational (–.08) Paths.
As Figure 2 indicates, CTE and computers in the home make the largest and equivalent contributions to achievement (34%), followed in order by aca-demic press (23%), disciplinary climate (22%), and teacher trust (20%).
Hypothesis 6: The strongest direct effects of leadership, as it was mea-sured in this study, will be on variables representing the Rational Path.
Our evidence does not support this hypothesis, but it is not far off. Table 2 reports a correlation of .75 between leadership and variables representing the Organizational Path, as compared with correlations of .55, .53, and .02 with
at Ebsco Electronic Journals Service (EJS) on June 20, 2012eaq.sagepub.comDownloaded from

694 Educational Administration Quarterly 46(5)
variables on the Emotions, Rational, and Family Paths, respectively. Nonetheless, path coefficients reported in Figure 1 (essentially the same as for Figure 2) point to very similar relationships between leadership and the Rational Path (.56) and leadership and the Organizational Path (.57), results closer to our hypo-thesis. Relationships between leadership and the Emotions Path, although significant, are much weaker (.15 in both models). Leadership is not related to the Family Path (–.07).
Beyond directly testing the six hypotheses, three results deserve to be highlighted. First, some variables had larger effects on student learning than others did. Most recent studies of leadership effects on students have included a restricted number of mediating variables (e.g., McGuigan & Hoy, 2006), sometimes just one. Although these studies undoubtedly add to growing understandings about how leadership influences student learning, the effects they report are likely exaggerated, for methodological reasons, and their value for leaders’ decision making is quite limited.
Exaggerated effects arise when there is little or no competition in a regres-sion equation for explanations of variation in achievement. The limited value for leaders’ decision making arises because such decision making entails (or should entail) weighing alternatives. So studies of trust, for example, often provide compelling evidence about its effects on teaching and learning (Tschannen-Moran, 2001). But if, according to the results of this study, the effects of teacher trust are actually a bit weaker (or at least no stronger) than the effects of academic press, disciplinary climate, and CTE, why would a leader devote their scarce improvement resources to further developing teacher trust in their school? The answer would not be informed very much by res-earch evidence; more likely, it would be informed by some feature of the school’s context. For leaders to act in the manner suggested by this article, they need access to comparative evidence about potentially powerful mediating variables along the lines provided by the effect sizes Hattie (2009) reported.
A second key finding of this study is that the Path influenced most by leaders (Organizational) had the least influence on student learning. In the context of the larger project providing data for this study, principals had been strongly encouraged to work together in principal learning teams in their own districts and to develop PLCs in their own schools to help with school improvement. The attention awarded to these network structures and rela-tionships by principals in this study is not unusual. In fact, PLCs are clearly the dominant innovation in schools across North America, with the consider-able challenges they present to implement well often glossed over.
This choice of focus is also not at all consistent with the minimal amounts of evidence about their contribution to student achievement. As we noted
at Ebsco Electronic Journals Service (EJS) on June 20, 2012eaq.sagepub.comDownloaded from

Leithwood et al. 695
earlier, only a small handful of studies have actually reported data about PLC effects on achievement. Furthermore, Vescio et al.’s (2008) review of those studies draws conclusions that we consider to be excessively optimistic. Our results point to a problem that arises when leaders neglect using relevant evidence, limit their use of evidence to student achievement, or are naïve data users. The conception of leader’s work embedded in our Four Paths model encourages leaders to select, as a focus for their attention, variables for which there is robust evidence of effects on student. This conception also encour-ages researchers to select mediating variables for their studies using much the same type of evidence.
A third key result of this study was that the Path with arguably the most untapped potential for leadership impact on student achievement (Family) was the recipient of essentially no leadership influence.11 But as we noted earlier, assuming responsibility for alterable variables on the Family Path was considered the new work of leaders more than 15 years ago (Goldring & Rallis, 1993). At that time, reviews of research by Henderson (1981, 1987), for example, had concluded that the family provides the child’s primary edu-cational environment and that involving parents in their children’s formal education improves student achievement. Furthermore, the benefits of parent involvement, this evidence indicated, are not confined to early childhood or the elementary level. Children from low-income and minority families have the most to gain when schools involve parents, and parents do not have to be well educated to help. Considerably more research corroborating these claims is now available. Results from research over the past four decades are unam-biguous about the significant contribution that parent involvement in the home and in school makes to students’ academic achievement and other impor-tant outcomes (Hattie, 2009). Furthermore, there is now a significant body of evidence useful in guiding leaders’ work with families (e.g., Leithwood, 2010). It would be difficult to identify a more important focus for school leaders aiming to improve the achievement of students in challenging family circumstances.
ConclusionThe purposes for this article arose from an important challenge faced by leadership practitioners and researchers. Given a relatively confusing body of empirical evidence, how does one arrive at a coherent understanding of how leadership influences student learning? This article has described and tested a novel response to this important challenge. Metaphorical in nature, this response claims that leadership influence flows toward students’ experiences
at Ebsco Electronic Journals Service (EJS) on June 20, 2012eaq.sagepub.comDownloaded from

696 Educational Administration Quarterly 46(5)
and learning along Four Paths that are labeled Rational, Emotions, Organizational, and Family Paths. Each Path is both conceptually unique and populated by variables that have widely different, but more or less direct, effects on stu-dents. The task for leaders is to identify, in both a contextually sensitive and research-informed way, the variables on each Path most likely to improve their students’ learning if the status or condition of those variables is improved and then to engage in that improvement work over time.
Our empirical study of this conception or model tested six hypotheses. Results indicate that both variables representing the Rational Path (academic press and disciplinary climate) had significant and very similar effects on student achievement. Two variables representing the Emotions Path had quite different effects, however. The impact of CTE outweighed teacher trust by a substantial margin. Neither variable representing the Organizational Path (uses of instructional time, PLCs) made significant contributions to student learning. However, we might speculate from our results that the variables on the organizational path create preconditions for gaining the value out of vari-ables located on other paths. Longitudinal data would likely be necessary to test his possibility. With such evidence, the interaction of the paths with one another over time could be sorted out.12 On the Family Path, computers in the home made important positive contributions to student achievement but adult help had negative effects. Evidence points to considerable interaction among Paths.
The aggregate effects on student achievement of each of the Four Paths indicates similarly sized, significant, and positive contributions by three of the Paths; only the Organizational Path had no significant effects. Whereas prior evidence suggests that variables selected to represent the Family Path have the potential to influence students’ learning more directly and substan-tially than the background family variables making up our measure of SES (e.g., family income and education), SES explained more variation in student achievement across schools than did any other single variable or individual Path.
This initial test of the Four Paths model had significant limitations. One of these limitations is the restricted measure of leadership practices; a broader measure might demonstrate larger or different effects on some of the Paths. A second limitation is the choice of variables to represent each of the Four Paths; the potential number of variables on each Path is quite large and this test was limited to a sample of only two on each Path. So results pointing to differences among the Four Paths in their contributions to student learning cannot be confirmed without considerably more research incorporating other
at Ebsco Electronic Journals Service (EJS) on June 20, 2012eaq.sagepub.comDownloaded from
Leithwood et al. 697
Path variables. Third, an important assumption underlying the study is that the categories of variables matters (the Path), not just the individual vari-ables. For example, evidence from this first test leads us to suspect that lead-ers’ efforts to improve the status of the whole class of variables associated with the Organizational Path might not be nearly as productive as leaders’ efforts to improve variables on any of the other three Paths. But a series of studies systematically introducing different variables to represent each Path will be necessary to determine whether this suspicion has any merit.
Acknowledging these limitations, this study has several important impli-cations for both practice and research. One implication for practicing leaders is the extension of what it means to make evidence-informed decisions. Guided by the Four Paths model, such decisions would need to include con-siderations of research evidence about variables with demonstrable effects on student learning and how leaders influence the condition or status of those variables. Successful school improvement decisions cannot simply rest on evidence about student achievement, no matter the quality of such evidence and the care with which it is interpreted.
A second closely related implication for practicing leaders arises from identification, by the Four Paths, of largely neglected bodies of knowledge and skills that should be part of leadership preparation experiences. Among variables associated with each of the Four Paths, some have been a common focus of attention by school leaders and those providing leadership develop-ment experiences for many years (primarily those on the Rational and Org-anizational Paths). Many variables on both the Emotions and Family Paths, however, have been largely neglected, even though results of this study sug-gest that such variables are likely to have at least comparable effects on stu-dent achievement. Although we did not draw attention to it earlier, our evidence does indicate considerable interaction across Paths. It is likely counterpro-ductive for leaders to focus on one Path unaware of the effects this focus would have on other Paths.
This article also suggests several implications for theory and research. In particular, it challenges the dominant narrative about ideal forms of school leadership and gives rise to a distinctive agenda for future leadership research. The dominant narrative in much contemporary leadership literature, as well as in policy, is saturated with the language of instruction. Evidence high-lighted by the Four Paths, however, suggests that even on the Rational Path some school-level variables—academic press and disciplinary climate, for example—have impacts on student learning that actually rival the effects of those classroom-level instructional variables that principal leaders are now
at Ebsco Electronic Journals Service (EJS) on June 20, 2012eaq.sagepub.comDownloaded from

698 Educational Administration Quarterly 46(5)
admonished to focus on but typically feel only moderately able to improve (e.g., specific instruction strategies, teachers’ questioning techniques).
There is no doubt that teachers and students would benefit from the type of instructional leadership encompassed by this “neoheroic” ideal of school leadership. But it is fraught with difficulties. One such difficulty arises in the claim that this should be the primary focus of the leadership delivered by most principals. Such a claim takes no account of the wide range of chal-lenges the vast majority of principals face in their administrative lives and points to the principal as the only person capable of helping teachers improve instruction.
This claim also ignores the extremely important and largely overlooked leadership that schools need and that, in most schools, only principals are able to deliver. Successful leaders improve learning in their schools in many ways. Improving instruction will always be important but it is by no means the only influence on student achievement. Indeed, engaging the school pro-ductively with parents, if this has not been a focus, may well produce larger effects on student learning in the short run than marginal improvements to already at least satisfactory levels of instruction.
A closely related implication for future research challenges the current preoccupation with studying leadership effects on student learning, a preoc-cupation that is unproductively broad. In our view, a considerable proportion of future educational leadership research should adopt a more limited, “laser-like” focus on discovering the leadership practices most likely to improve the condition or status of variables in schools for which there is already consider-able evidence of impact on student learning. The conceptual and method-ological hurdles facing researchers who attempt to unpack the full set of variables linking leadership influence to student learning are daunting. This full set of variables encompasses most of the responsibilities and interests of researchers in such diverse fields as curriculum and instruction, social psy-chology, sociology, and political science. Not surprisingly, such efforts rarely provide sufficiently robust results to warrant their costs. Why should educa-tional leadership researchers not stand on the shoulders of the evidence pro-vided by researchers in these other disciplines?
Authors’ Note
The first description of this conception appeared in Leithwood et al. (2010).
Declaration of Conflicting Interests
The author(s) declared no potential conflicts of interests with respect to the author-ship and/or publication of this article.
at Ebsco Electronic Journals Service (EJS) on June 20, 2012eaq.sagepub.comDownloaded from

Leithwood et al. 699
Funding
The author(s) received no financial support for the research and/or authorship of this article.
Notes
1. An earlier version of this conception has been reported in Leithwood et al. (2010).
2. In schools with strong academic press, administrators and teachers set high but achievable school goals and classroom academic standards. They believe in the capacity of their students to achieve and encourage their students to respect and pursue academic success. School administrators supply resources, provide struc-tures, and exert leadership influence. Teachers make appropriately challenging academic demands and provide quality instruction to attain these goals. Students value these goals, respond positively, and work hard to meet the challenge.
3. In the past couple of decades, there has been a shift in the focus of research on discipline from individual students to the school. Ma and Willms (2004) argued that the traditional way of dealing with discipline, mainly at the classroom level, seems insufficient and that the disciplinary climate of the classroom and school has important effects on students. This climate is shaped by features of schools and the larger community. For example, classroom disruption can be a direct reflection of the conflict or tension between teachers and students across the school as a whole.
4. Daft (1989) offered a formal definition of organizations as “social entities that are goal directed, deliberately structured activity systems with an identifiable bound-ary” (pp. 10-11).
5. This project, entitled the Leading Student Achievement: Our Principal Purpose, is funded by the Ontario Ministry of Education (the Literacy and Numeracy Sec-retariat) and is both guided and managed by a steering team representing each of the province’s three principal associations (Ontario Principals’ Council [OPC], Catholic Principals’ Council of Ontario [CPCO], and Association des directions et directions adjointes des ecoles franco-ontariennes [ADFO]). The first author is the external evaluator of the project.
6. Three teachers seems a small number to represent a school, but significantly increasing that number significantly reduces the number of schools included in the analysis. To determine whether our decision to include schools with as few as three teachers influenced results we carried out two analyses. First, we computed a variable that created two groups: schools with 6 or more teacher respondents (n = 87) and schools with 5 or fewer (n = 112). We ran an independent sample t test on all variables used in the models. There were no significant differences
at Ebsco Electronic Journals Service (EJS) on June 20, 2012eaq.sagepub.comDownloaded from

700 Educational Administration Quarterly 46(5)
in survey ratings by the two groups. We also ran a one-way ANOVA using the number of respondents as the factor for determining comparison groups. Again, there were no significant differences between the ratings based on the number of respondents in the school. We refined the ANOVA further by removing groups with fewer than 4 members (this took out schools with respondents to allow for post hoc analyses) and got the same result.
7. The full set of items on the survey is available on request. 8. Only school-level data are publically available in Ontario. 9. A confirmatory factor analysis was conducted on items measuring leadership
and variables on each of the Four Paths. Results indicate a single-factor solution for each of socioeconomic stats (SES), leadership, and both measures used to represent the Family Path and the Rational Path and a two-factor solution for the remainder. Subsequent analyses are based on aggregate scores for all variables, however.
10. A standardized total effect of 0.43 suggests that an increase of 1 standard devia-tion in SES would result in an increase in math achievement of 0.43 standard deviation. This is a moderate effect. The other effects reported in Figure 1, mostly in the 0.1 to 0.3 range, should be considered small.
11. Admittedly, this result might have been a function of our leadership measure with its dominant focus on Rational Path variables.
12. We are indebted to one of our anonymous reviewers for this insight.
References
Alig-Mielcarek, J. M. (2003). A model of school success: Instructional leadership, academic press, and student achievement. Dissertation Abstracts International, 64(6A), 1913.
Baker, A. J. L. (1997). Improving parent involvement programs and practice: A qualitative study of parent perceptions. School Community Journal, 7(1), 9-35.
Bandura, A. (1997). Self-efficacy: The exercise of control. New York, NY: W. H. Freeman.Belenardo, S. J. (2001). Practices and conditions that lead to a sense of community in
middle schools. NASSP Bulletin, 85(2), 33-45.Bellei, C. (2009). Does lengthening the school day increase students’ academic
achievement? Results from a natural experiment in Chile. Economics of Educa-tion Review, 28, 629-640.
Benda, S. M. (2000). The effect of leadership styles on the disciplinary climate and culture of elementary schools. Unpublished doctoral dissertation, Widener Uni-versity, Chester, PA.
Berry, B., Johnson, D., & Montgomery, D. (2005). The power of teacher leadership. Educational Leadership, 62(5), 56-60.
at Ebsco Electronic Journals Service (EJS) on June 20, 2012eaq.sagepub.comDownloaded from

Leithwood et al. 701
Bolman, L., & Deal, T. (1991). Reframing organizations. San Francisco, CA: Jossey-Bass.
Bolman, R., McMahon, A., Stoll, L., Thomas, S., & Wallace, M. (2005). Creating and sustaining professional learning communities (Research Report 637). London, UK: General Teaching Council for England, Department for Education and Skills.
Bryk, A. S., & Schneider, B. (2002). Trust in schools: A core resource for improve-ment. New York, NY: Russell Sage Foundation.
Bryk, A. S., & Schneider, B. (2003). Trust in schools: A core resource for school reform. Educational Leadership, 60(6), 40-44.
Chrispeels, J. H. (1996). Evaluating teachers’ relationship with families: A case study of one district. Elementary School Journal, 97(2), 179-200.
Creemers, B. P .M., & Reezigt, G .J. (1996). School level conditions affecting the effec-tiveness of instruction. School Effectiveness and School Improvement, 7, 197-228.
Crow, G., & Weindling, D. (2010). Learning to be political: New English headteach-ers’ roles. Educational Policy, 24, 137-158.
Daft, R. (1989). Organizational theory and design (3rd ed.). New York, NY: West.DiPaola, M. F., & Tschannen-Moran, M. (2005). Bridging or buffering? The impact
of schools’ adaptive strategies on student achievement. Journal of Educational Administration, 43, 60-71.
DuFour, R., Eaker, R., & DuFour, R. (2005). On common ground. Bloomington, IN: National Education Service.
Dumay, X. (2009). Origins and consequences of schools’ organizational culture for student achievement. Educational Administration Quarterly, 45, 523-555.
Goddard, R. D. (2003). Relational networks, social trust, and norms: A social capital perspective on students’ chance of academic success. Educational Evaluation and Policy Analysis, 25(1), 59-74.
Goddard, R. D., & Goddard. Y. (2001), A multi-level analysis of the relationship between teacher and collective efficacy in urban schools. Teaching and Teacher Education, 17, 807-818.
Goddard, R. D., Hoy, W. K., & Hoy, A. W. (2000). Collective teacher efficacy: Its meaning, measure, and impact on student achievement. American Educational Research Journal, 37, 479-507.
Goddard, R. D., Salloum, S. J., & Berebitsky, D. (2009). Trust as a mediator of the relationships between poverty, racial composition, and academic achievement: Evidence from Michigan’s public elementary schools. Educational Administra-tion Quarterly, 45, 292-311.
Goddard, R. D., Tschannen-Moran, M., & Hoy, W. K. (2001). A multilevel examina-tion of the distribution and effects of teacher trust in students and parents in urban elementary schools. Elementary School Journal, 102(1), 3-17.
at Ebsco Electronic Journals Service (EJS) on June 20, 2012eaq.sagepub.comDownloaded from

702 Educational Administration Quarterly 46(5)
Goldring, E. B., & Rallis, S. F. (1993). Principals of dynamic schools: Taking charge of change. Newbury Park, CA: Corwin.
Goleman, D. (1995). Emotional intelligence. New York, NY: Bantam.Hallinger, P., & Heck, R. H. (1996). The principal’s role in school effectiveness: An
assessment of methodological progress, 1980-1995. In K. A. Leithwood (Ed.), Inter-national handbook of educational leadership and administration (pp. 723-783). Bos-ton, MA: Kluwer Academic.
Harn, B. A., Linan-Thompson, S., & Roberts, G. (2008). Intensifying instruction: Does additional instructional time make a difference for the most at-risk first graders? Journal of Learning Disabilities, 41(2), 115-125.
Hattie, J. (2009). Visible learning: A synthesis of meta-analyses relating to achieve-ment. New York, NY: Routledge.
Henderson, A. T. (Ed.). (1981). Parent participation-student achievement: The evi-dence grows (Occasional Paper ED209754). Columbia, MD: National Committee for Citizens in Education.
Henderson, A. T. (Ed.). (1987). The evidence continues to grow: Parent involve-ment improves student achievement. An annotated bibliography (Special Report ED315199). Columbia, MD: National Committee for Citizens in Education.
Hollins, E. R., McIntyre, L. R., DeBose, C., Hollins, K. S., & Towner, A. (2004). Promoting a self-sustaining learning community: Investigating an internal model for teacher development. International Journal of Qualitative Studies in Educa-tion, 17, 247-269.
Hong, S., & Ho, H. (2005). Direct and indirect longitudinal effects of parental involve-ment on student achievement: Second order latent growth modeling across ethnic groups. Journal of Education Psychology, 97(1), 32-42.
Hoy, W. K., Hannum, J., & Tschannen-Moran, M. (1998). Organizational climate and student achievement: A parsimonious and longitudinal view. Journal of School Leadership, 8, 336-359.
Hoy, W. K., & Tarter, C. J. (1997). The road to open and healthy schools: A handbook for change (2nd ed.) Thousand Oaks, CA: Corwin.
Hoy, W. K., Tarter, J. C., & Hoy, A. W. (2006). Academic optimism of schools: A force for student achievement. American Educational Research Journal, 43, 425-446.
Jacob, J. A. (2004). A study of school climate and enabling bureaucracy in select New York City public elementary schools. Dissertation Abstracts International, 66(2A), 428.
Jöreskog, K. G., & Sörbom, D. (1993). LISREL 8: Structural equation modeling with the SIMPLIS command language. Chicago, IL: Scientific Software International.
Jurewicz, M. M. (2004). Organizational citizenship behaviors of middle school teach-ers: A study of their relationship to school climate and student achievement. Dis-sertation Abstracts International, 65(2A), 366.
at Ebsco Electronic Journals Service (EJS) on June 20, 2012eaq.sagepub.comDownloaded from

Leithwood et al. 703
Kyriakides, L., & Creemers, B. P. (2008). Using a multidimensional approach to measure the impact of classroom-level factors upon student achievement: A study testing the validity of the dynamic model. School Effectiveness and School Improvement, 19, 183-205.
Lee, V. E., & Croninger, R. G. (1994). The relative importance of home and school in the development of literacy skills for middle grade students. American Journal of Education, 102, 286-329.
Lee, V. E., Smith, J. B., Perry, T. E., & Smylie, M. A. (1999). Social support, aca-demic press, and student achievement: A view from the middle grades in Chicago. Improving Chicago’s schools. A report of the Chicago Annenberg research proj-ect. Chicago, IL: Consortium on Chicago School Research.
Leithwood, K. (2006). Teacher working conditions that matter: Evidence for change. Toronto, ON: Elementary Teachers’ Federation of Ontario.
Leithwood, K. (2010). Four key policy questions about parent engagement: Recommen-dations from the evidence, In R. Deslandes (Ed.). International perspectives on con-texts, communities and evaluated innovative practice (pp. 8-20). London: Routledge.
Leithwood, K., Anderson, S., Mascall, B., & Straus, T. (2010). School leaders’ influ-ences on student learning: The four paths. In T. Bush, L. Bell & D. Middlewood (Eds.), The principles of educational leadership and management. London: Sage.
Leithwood, K., & Beatty, B. (2007). Leading with teacher emotions in mind. Thousand Oaks, CA: Corwin.
Leithwood, K., Day, C., Sammons, P., Hopkins, D. & Harris, A. (2006). Success-ful school leadership. What it is and how it influences pupil learning. London: Department of Education and Skills.
Leithwood, K., & Jantzi, D. (1999) The relative effects of principal and teacher sources of leadership on student engagement with school. Educational Adminis-tration Quarterly, 35 (Supplemental), 679-706.
Leithwood, K., & Jantzi, D. (2006). A critical review of the parent engagement litera-ture. Toronto, ON: Ministry of Education.
Leithwood, K., & Jantzi, D. (2008). Linking leadership to student learning: The con-tributions of leader efficacy. Educational Administration Quarterly, 44 (4), 496.
Leithwood, K., Louis, K. S., Anderson, S., & Wahlstrom, K. (2004). How leadership influ-ences student learning: Review of research. New York: The Wallace Foundation.
Leithwood, K., & Riehl, C. (2005). What we know about successful leadership. In W. Firestone & C. Riehl (Eds.), A new agenda: Directions for research on educa-tional leadership (pp. 22-47). New York: Teachers College Press.
Louis, K. S., & Marks, H. M. (1998). Does professional community affect the class-room? Teachers’ work and student experiences in restructuring schools. American Journal of Education, 106, 532-575.
at Ebsco Electronic Journals Service (EJS) on June 20, 2012eaq.sagepub.comDownloaded from

704 Educational Administration Quarterly 46(5)
Louis, K. S., Marks, H. M., & Kruse, S. (1996). Teachers’ professional community in restructuring schools. American Educational Research Journal, 33, 757-798.
Ma, X. (2003). Sense of belonging to school: Can schools make a difference? Journal of Educational Research, 96, 340-349.
Ma, X., & Crocker, R. (2007). Provincial effects on reading achievement. Alberta Journal of Educational Research, 53, 87-108.
Ma, X., & Klinger, D. A. (2000). Hierarchical linear modeling of student and school effects on academic achievement. Canadian Journal of Education, 25(1), 41-55.
Ma, X., & Willms, J. D. (2004). School disciplinary climate: Characteristics and effects on eighth grade achievement. Alberta Journal of Educational Research, 50, 169-188.
Marburger, D. M. (2006). Does mandatory attendance improve student performance? Journal of Economic Education, 37, 148-155.
McGuigan, L., & Hoy, W. K. (2006). Principal leadership: Creating a culture of aca-demic optimism to improve achievement for all students. Leadership and Policy in Schools, 5, 203-229.
McLaughlin, M. W., & Talbert, J. E. (2007). Building professional learning com-munities in high schools: Challenges and promising practices. In L. Stoll & K. S. Louis (Eds.), Professional learning communities: Divergence, depth and dilemmas (pp. 151-165). Berkshire, UK: Open University Press.
Mitchell, C., & Sackney, L. (2006). Building schools, building people: The school principal’s role in leading a learning community. Journal of School Leadership, 16, 627-640.
Mulford, B., Johns, S., Edmunds, B. (2009) Successful school principalship in Tas-mania: Case studies. Hobart, Australia: University of Tasmania.
Mullen, C.A., & Hutinger, J. L. (2008). The principal’s role in fostering collabora-tive learning communities through faculty study group development. Theory Into Practice, 47, 276-285.
Murphy, J. (2009). Closing achievement gaps: Lessons from the last 15 years. Phi Delta Kappan, 91(3), 8-12.
Murphy, J., & Hallinger, P. (1988). Characteristics of instructionally effective school districts. Journal of Educational Research, 81, 175-181.
Nelson, B., & Sassi, A. (2005). The effective principal: Instructional leadership for high quality learning. New York, NY: Teachers College Press.
Norris, C. M. (1999). Parents and schools: The involvement, participation and expec-tations of parents in the education of their children. Education Quarterly Review, 5(4), 61.
Oatley, K., Keltner, D., & Jenkins, J. M. (2006). Understanding emotions (2nd ed.). Malden, MA: Blackwell.
at Ebsco Electronic Journals Service (EJS) on June 20, 2012eaq.sagepub.comDownloaded from

Leithwood et al. 705
Olivier, D. F., & Hipp, K. K. (2006). Leadership capacity and collective efficacy: Interacting to sustain student learning in a professional learning community. Jour-nal of School Leadership, 16, 505-519.
Osborne, S. & deOnis, A. (1997). Parent involvement in rural schools: Implications for educators. Rural Educator, 19(2), 20-29.
Robinson, V. (2010). From instructional leadership to leadership capabilities: Empiri-cal findings and methodological challenges. Leadership and Policy in Schools, 9, 1-26.
Robinson, V., Hohepa, M., & Lloyd, C. (2009). School leadership and student outcomes: Identifying what works and why. Auckland, New Zealand: University of Auckland.
Roby, D. E. (2004). Research on school attendance and student achievement: A study of Ohio schools. Educational Research Quarterly, 28, 3-14.
Silins, H., & Mulford, B. (2002). Leadership and school results. In K. Leithwood & P. Hallinger, (Eds.), Second international handbook of educational leadership (pp. 561-612). Dordrecht, the Netherlands: Kluwer.
Smith, P. A., & Hoy, W. K. (2007). Academic optimism and student achievement in urban elementary schools. Journal of Educational Administration, 45, 556-568.
Stein, M. K., & Nelson, B. S. (2003). Leadership content knowledge. Educational Evaluation and Policy Analysis, 25, 423-448.
Stoll, L., & Louis, K. S. (2007). Professional learning communities: Divergence, depth and dilemmas. Berkshire, UK: Open University Press.
Strahan, D. (2003). Promoting a collaborative professional culture in three elementary schools that have beaten the odds. Elementary School Journal, 104, 127-146.
Tornroos, J. (2005). Mathematics textbooks, opportunity to learn and student achieve-ment. Studies in Educational Evaluation, 31, 315-327.
Tschannen-Moran, M. (2001). Collaboration and the need for trust. Journal of Educa-tional Administration. 39, 308-331.
Tschannen-Moran, M. (2009). Fostering teacher professionalism in schools: The role of leadership orientation and trust. Educational Administration Quarterly, 45, 217-247.
Tschannen-Moran, M., & Barr, M. (2004). Fostering student learning: The relation-ship of collective teacher efficacy and student achievement. Leadership and Pol-icy in Schools, 3, 189-209.
Vescio, V., Ross, D., & Adams, A. (2008). A review of research on the impact of pro-fessional learning communities on teaching practice and student learning. Teach-ing and Teacher Education, 24(1), 80-91.
Wahlstrom, K., & Louis, K. S. (2008). How teachers experience principal leadership: The roles of professional community, trust, efficacy and shared responsibility. Educational Administration Quarterly, 44, 458-495.
at Ebsco Electronic Journals Service (EJS) on June 20, 2012eaq.sagepub.comDownloaded from

706 Educational Administration Quarterly 46(5)
Walberg, H. J. (1981). Childhood traits and environmental conditions of highly emi-nent adults. Gifted Child Quarterly, 25(3), 103-107.
Wang, J. (1998). Opportunity to learn: The impacts and policy implications. Educa-tional Evaluation and Policy Analysis, 20(3), 137-156.
Waters, T., Marzano, R. J., & McNulty, B. (2003). Balanced leadership: What 30 years of research tells us about the effect of leadership on student achievement. Aurora, CO: Mid-Continent Research for Education and Learning.
Witziers, B., Bosker, R. J., & Kruger, M. L. (2003). Educational leadership and stu-dent achievement: The elusive search for an association. Educational Administra-tion Quarterly, 39, 398-425.
Zaccaro, S. J., Kemp, C., & Bader, P. (2004). Leader traits and attributes. In J. Antonakis, A. T. Cianciolo, & R. J. Sternberg (Eds.), The nature of leadership I (pp. 101-124). Thousand Oaks, CA: Sage.
Bios
Kenneth Leithwood is a professor of educational leadership and policy at the Ontario Institute for Studies in Education, University of Toronto. His research and writing concerns school leadership, educational policy, and organizational change.
Sarah Patten is a doctoral student at the Ontario Institute for Studies in Education, University of Toronto. Her research focus is on change that affects student achieve-ment. She is also a secondary school teacher, resource teacher, and facilitator.
Doris Jantzi is a former senior research associate at the Ontario Institute for Studies in Education, University of Toronto. She has a substantive focus on leadership effects and specializes in quantitative analysis of large data sets.
at Ebsco Electronic Journals Service (EJS) on June 20, 2012eaq.sagepub.comDownloaded from