education, training and labor market outcomes for youth in indonesia
DESCRIPTION
This report analyzes job market trends in Indonesia, provides an overview of the transition to work for Indonesian youth and explores the potential reasons for the observed difficulty and the consequences for the education sector, especially as it relates to senior secondary education and the training system.TRANSCRIPT
Education, Training and Labor Market Outcomes for Youth in Indonesia
Human Development Department East Asia and Pacifi c Region

THE WORLD BANK OFFICE JAKARTA
Indonesia Stock Exchange Building, Tower II/12-13th Fl.
Jl. Jend. Sudirman Kav. 52-53
Jakarta 12910
Tel: (6221) 5299-3000
Fax: (6221) 5299-3111
Printed in August 2010
Education, Training and Labor Market Outcomes for Youth in Indonesia is a product of staff of the World Bank. The fi ndings, interpretations and
conclusions expressed herein do not necessarily refl ect the views of the Board of Executive Directors of the World Bank or the government
they represent.
The World Bank does not guarantee the accuracy of the data included in this work. The boundaries, colors, denomination and other
information shown on any map in this work do not imply any judgment on the part of the World Bank concerning the legal status of any
territory or the endorsement of acceptance of such boundaries.
Cover photo credit: University of Indonesia Photo Archive.
Report No. 54170-ID
Education, Training and Labor Market Outcomes for Youth in Indonesia
Human Development Department East Asia and Pacifi c Region
ii Education, Training and Labor Market Outcomes for Youth in Indonesia
Table of Contents
Acknowledgments iv
List of Abbreviations and Acronyms v
1. Introduction 6
2. Economic Context: Growth, Transformation and the Demand for Skills 8
3. A Diffi cult Transition to the Labor Market 12
3.1 Unemployment 13
3.2 Job Quality 14
4. Senior Secondary Education, Skills and Labor Market Entrance 19
4.1 Vocational versus General Secondary Education 23
5. Meeting the Demand for Skills 28
5.1 Cognitive Skills 29
5.2 Generic (Noncognitive Skills) 29
5.3 Vocational Skills 31
5.4 Implications for the Education Sector 31
6. Conclusions and Recommendations 40
References 43
iii
Table of Contents
List of Boxes
Box 5-1: Curriculum Trends and Skills Demand in the US 33
Box 5-2: The Role of Entrepreneurship Programs: The International Evidence 39
List of Figures
Figure 2-1: GDP per Capita and Share of Agriculture in GDP (1990-2006) 8
Figure 2-2: Agriculture as a Share of Employment and GDP (1990-2006) 9
Figure 2-3: Share of Salaried Employees with Senior Secondary Education or Higher Qualifi cation
by Sector (1994-2007) 10
Figure 2-4: Returns to Levels of Education (Relative to Primary Education)(1994-2007) 10
Figure 2-5: Transition Rates Between Levels of Education by Generation (2008) 11
Figure 3-1: Share of Skilled, Unskilled and Skilled Production Jobs (1994-2007) 12
Figure 3-2: Unemployment Rate by Age Groups 15-29 (2007) 13
Figure 3-3: Unemployment Rate by Age Group and Urban/Rural Divide (2007) 14
Figure 3-4: Unemployment Rate by Age Group and Education Level (2007) 14
Figure 3-5: Salary Profi le of Youth by Type of Employment and Education (in Rupiah) 15
Figure 3-6: Number of New Employees by Age Group, Salaried Jobs and Total Employment (2007) 15
Figure 3-7: Probability of Transitioning Between Salaried Jobs for Those Who Changed Jobs
(By Age Group), 2007 16
Figure 3-8: Share of Labor Force in Salaried Jobs by Age Group and Urban/Rural 16
Figure 3-9: Share of Labor Force in Salaried Jobs by Age Group and Education Level 17
Figure 3-10: Salary Profi les by Education Achievement (2007) 17
Figure 4-1: Skill Premiums and Skilled Workforce in Indonesia 20
Figure 4-2: Average Hourly Salary by Worker and Parental Education (2007) 20
Figure 4-3: Average PISA Score by Socio-economic Decile (2000-2006) 21
Figure 4-4: Employers Opinion of Quality of Employees with Senior Secondary Education (%) 22
Figure 4-5: Entry Scores and Ratio of Applicants to Entrants (By Type of Senior Secondary School) 23
Figure 4-6: Share of SMA and SMK Students by Consumption Quintiles 23
Figure 4-7: Unemployment Rate for SMA and SMK Graduates, Age 20-24 (1991-2007) 24
Figure 4-8: Unemployment Rate for SMA and SMK Graduates, Total Labor Force (1991-2007) 24
Figure 4-9: Relative Wage SMK to SMA Graduates, Age 20-24 (2002-2007) 25
Figure 4-10: Out-of-Pocket Costs of Attending Senior Secondary Education
(By Stream (SMA/SMK) and Public/Private Facility (2006)) 26
Figure 5-1: Adjusted Salaries According to Public SMA/SMK Enrollment 29
Figure 5-2: Skill Importance and Skill Gaps Identifi ed by Employers 30
Figure 5-3: Share of Firms Rating Diff erent Types of Skills as “Very Important
(By Type of Position and by Sector) (2008)” 30
Figure 5-4: Share of Workers Who Have Completed Training by Education Level (2003) 35
Figure 5-5: Respondents Who Report Attending a Training Course
(By Consumption Quintile and Labor Force Status (2006) 36
iv Education, Training and Labor Market Outcomes for Youth in Indonesia
Acknowledgments
This report is part of the Analytical and Advisory Activities (AAA) program focusing on the engagement area of
“Skills development, competitiveness, and knowledge economy” and is based on several background papers
and technical notes written on the characteristics of youth employment and the role of education and skills in
the school-to-work transition in Indonesia.
The team of authors who produced this report is grateful to the offi cials and staff of the Ministry of National
Education (MoNE) for their overall support. Special thanks are in order to Dr. Hamid Muhammad, the Director
General for Non Formal and Informal Education, Ministry of National Education, who provided overall guidance
to this report. The report also benefi ted greatly from the inputs of Dr. Nina Sardjunani (Deputy Minister for Human
Resources and Cultural Aff airs, BAPPENAS), Dr. Taufi k Hanafi (Director for Religion and Education, BAPPENAS) and
Rahma Iryanti (Director of Employment, BAPPENAS).
The production of this report was generously supported by the Basic Education Capacity Trust Fund (BEC-TF)
which is jointly funded by the Government of the Netherlands and the European Union. The report also benefi ted
greatly from the inputs which were received during the Education Sector Assessment consultation meetings
and discussions. It should be noted that while inputs of various offi cials have been incorporated into the report,
the policy recommendations in this document do not necessarily refl ect the policies of the Government of
Indonesia, the Government of the Netherlands or the European Union.
The fi nal report was prepared by Pedro Cerdan-Infantes (Task Team Leader, Human Development Sector, East Asia
and Pacifi c Region, World Bank), based on key inputs from Javier Luque (Senior Education Economist, Education
Department, Latin America and the Caribbean Region, World Bank and previous co-TTL), Pawan Patil (Senior
Economist, Indonesia Sustainable Development Department, World Bank and previous co-TTL), Dandan Chen
(Senior Economist, Education Department, East Asia and Pacifi c Region, World Bank), Emmanuella Di Gropello
(Senior Human Development Economist, Education Department, East Asia and Pacifi c Region, World Bank) and
the Poverty Reduction and Economic Management (PREM) team at the World Bank Offi ce, Jakarta.
The report was prepared under the supervision of Mae Chu Chang (Lead Educator and Indonesia Human
Development Sector Coordinator, World Bank) and with the overall guidance and support of Eduardo Velez
Bustillo (Education Sector Manager, East Asia Human Development, World Bank). The peer reviewers were
Wendy Cunningham (Lead Specialist, Human Development Network Children and Youth Department, World
Bank), Arvil Van Adams (Consultant, Africa Social Protection Unit, World Bank ), and Vivi Alatas (Senior Economist,
PREM Sector Department, World Bank).
Indonesia Country Director: Stefan G. Koeberle
East Asia Human Development Sector Director: Emmanuel Jimenez
East Asia Education Sector Manager: Eduardo Velez Bustillo
Indonesia Human Development Sector Coordinator: Mae Chu Chang
Task Team Leader: Pedro Cerdán-Infantes
v
List of Abbreviations and Acronyms
AAA Analytic and Advisory Activities
BEC-TF Basic Education Capacity Trust Fund
BLK Work Training Center - public nonformal vocational training provider
DG-NFIE Director General of Non Formal and Informal Education
EASHD East Asia and Pacifi c Human Development Sector
EBTANAS Former term for National End-of-level Examination
EYE Education for Youth Employment
GDP Gross Domestic Product
GER Gross Enrollment Rate
HDN Human Development Network
JSS Junior Secondary School
KKNI National Qualifi cation Framework
KPP Para-professional Course
MoMT Ministry of Manpower and Transmigration
MoNE Ministry of National Education
PISA Programme for International Student Assessment
SMA Senior High School
SMK Vocational High School
SMU General High School
SSS Senior Secondary School
TIMSS Trends in International Mathematics and Science Study
TVET Technical and Vocational Education and Training
6
Section 1
Introduction
Over the last 15 years, Indonesia has experienced one of the largest expansions in education expenditure
and enrollment. The net enrollment rate at senior secondary level has doubled, and tertiary education
enrollment has increased threefold, resulting in the most educated generation in the country’s history. At the
same time, the increases in educational attainment have been accompanied by an economic transformation
away from agriculture and into the manufacturing and service sectors, which account for 75 percent of GDP and
56 percent of total employment.1 Yet employment in these sectors has not kept up with the increased numbers
of educated workers, resulting in high youth unemployment and diffi culty in accessing good quality jobs for
educated youth. This report, which is part of a series of World Bank reports analyzing job market trends, provides
an overview of the transition to work for Indonesian youth, exploring the potential reasons for the observed
diffi culty and the consequences for the education sector, especially as it relates to senior secondary education
and the training system.
With a growing number of educated workers entering the labor force every year, it is important to
evaluate whether the education system is providing graduates with the skills demanded in the labor
market, and devise policies that ease entry into the formal labor market for skilled workers. The education
sector clearly plays a big role in the successful school-to-work transition but these mismatches can also arise
later in life if economic conditions and market demand change, so a proper training system needs to be in
place to meet changing demands in the labor market. Devising policies that minimize labor market mismatches
through changes in both the formal education system and the nonformal training system, and the facilitation of
entrepreneurship are key priorities for the future.
What are the reasons for slow job creation in the nonagriculture sectors and the signs of lower education
intensity and lower return to education and how will the increases in the educational attainment of the
population aff ect these trends? To answer these questions, the report starts with an overview of the economic
changes and trends in the demand for skills in the Indonesian economy during the last two decades, pointing
to a sustained demand for skills in light of the increased importance of the service sector and its skill intensity
(Section 2).2 More importantly, however, there are also signs that, despite these trends in the economy, the
1 Agriculture is the most labor intensive sector.
2 In this context, “skill intensity” refers to the percentage of educated workers.

7
Introduction
service sector is becoming less skill intensive and returns to education are not increasing,3 pointing to potential
problems with productivity or the capacity of the labor market to absorb educated workers.
The slow transition of graduates is explored in detail in Section 2, which pays special attention to
diff erences by education levels. It highlights the diffi culties of senior secondary school graduates in accessing
good quality jobs and the high unemployment rate that they face upon graduation. Given these worrisome
signs of young senior secondary school graduates (considered the lower tier of “skilled” workers) and expected
increases in the transition to senior secondary education (which are already rising rapidly), Section 3 focuses
on the senior secondary school level. Seeking to shed some light on the question of whether senior secondary
education is providing the right skills for its students, the section explores the employment profi le of vocational
(SMK) vs. general (SMA) graduates and, drawing on a recent survey of employers, argues against a drastic
increase in the proportion of vocational students, highlighting instead the need to adjust the skill base of senior
secondary school graduates. Based on the fi ndings, Section 4 explores ways to meet the demand for skills
through changes in senior secondary school, strengthening of the nonformal training system and providing
targeted entrepreneurship programs. Finally, Section 5 provides some overall recommendations going forward.
3 In fact, they show a small decrease over the last decade, but it is not statistically signifi cant.
8
Section 2
Economic Context: Growth, Transformation and the Demand for Skills
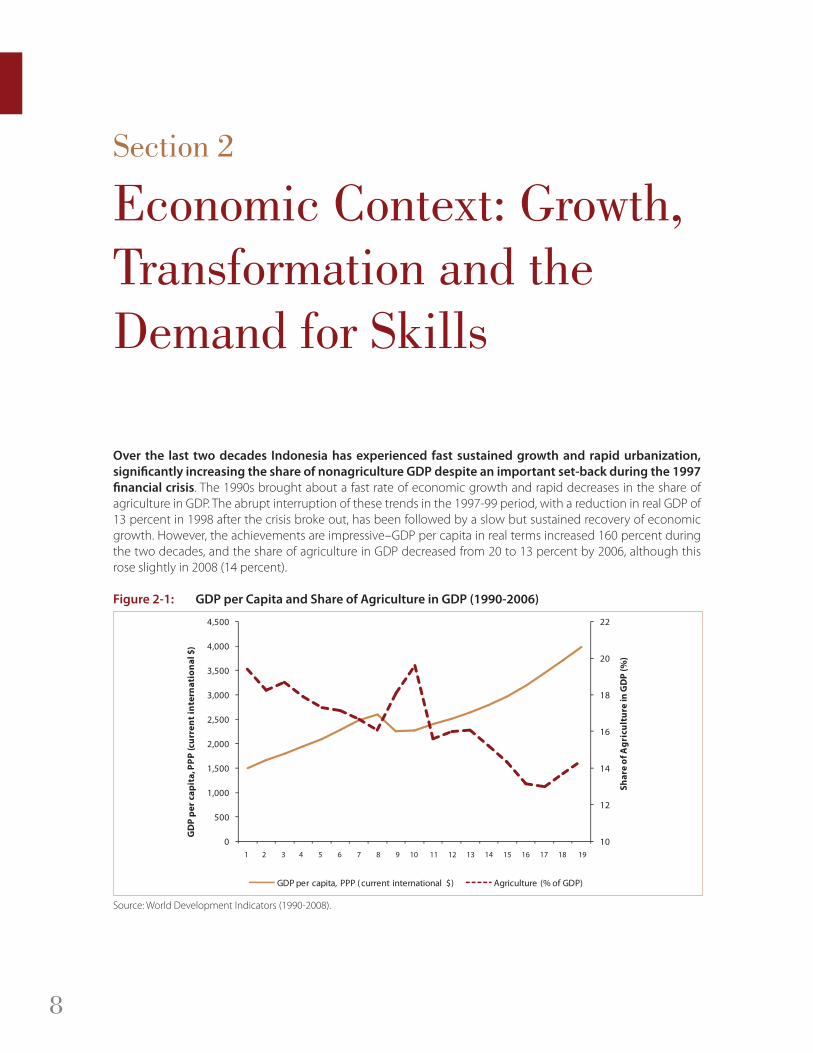
Over the last two decades Indonesia has experienced fast sustained growth and rapid urbanization,
signifi cantly increasing the share of nonagriculture GDP despite an important set-back during the 1997
fi nancial crisis. The 1990s brought about a fast rate of economic growth and rapid decreases in the share of
agriculture in GDP. The abrupt interruption of these trends in the 1997-99 period, with a reduction in real GDP of
13 percent in 1998 after the crisis broke out, has been followed by a slow but sustained recovery of economic
growth. However, the achievements are impressive–GDP per capita in real terms increased 160 percent during
the two decades, and the share of agriculture in GDP decreased from 20 to 13 percent by 2006, although this
rose slightly in 2008 (14 percent).
Figure 2-1: GDP per Capita and Share of Agriculture in GDP (1990-2006)
10
12
14
16
18
20
22
0
500
1,000
1,500
2,000
2,500
3,000
3,500
4,000
4,500
1 2 3 4 5 6 7 8 9 10 11 12 13 14 15 16 17 18 19
Sh
are
of
Ag
ric
ult
ure
in
GD
P (
%)
GD
P p
er
ca
pit
a, P
PP
(c
urr
en
t in
tern
ati
on
al
$)
GDP per capita, PPP ( current international $) Agriculture (% of GDP)
Source: World Development Indicators (1990-2008).
9
Economic Context: Growth, Transformation and the Demand for Skills
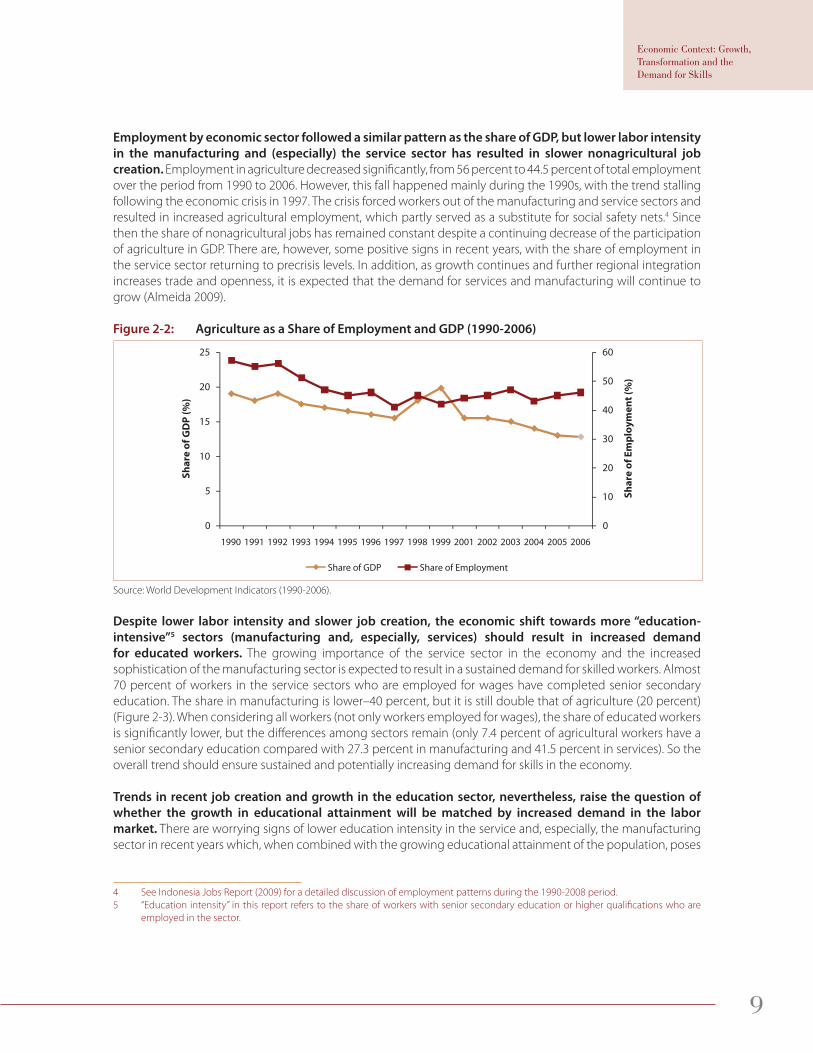
Employment by economic sector followed a similar pattern as the share of GDP, but lower labor intensity
in the manufacturing and (especially) the service sector has resulted in slower nonagricultural job
creation. Employment in agriculture decreased signifi cantly, from 56 percent to 44.5 percent of total employment
over the period from 1990 to 2006. However, this fall happened mainly during the 1990s, with the trend stalling
following the economic crisis in 1997. The crisis forced workers out of the manufacturing and service sectors and
resulted in increased agricultural employment, which partly served as a substitute for social safety nets.4 Since
then the share of nonagricultural jobs has remained constant despite a continuing decrease of the participation
of agriculture in GDP. There are, however, some positive signs in recent years, with the share of employment in
the service sector returning to precrisis levels. In addition, as growth continues and further regional integration
increases trade and openness, it is expected that the demand for services and manufacturing will continue to
grow (Almeida 2009).
Figure 2-2: Agriculture as a Share of Employment and GDP (1990-2006)
0
10
20
30
40
50
60
0
5
10
15
20
25
1990 1991 1992 1993 1994 1995 1996 1997 1998 1999 2001 2002 2003 2004 2005 2006
Sh
are
of
Em
plo
ym
en
t (%
)
Sh
are
of
GD
P (
%)
Share of GDP Share of Employment
Source: World Development Indicators (1990-2006).
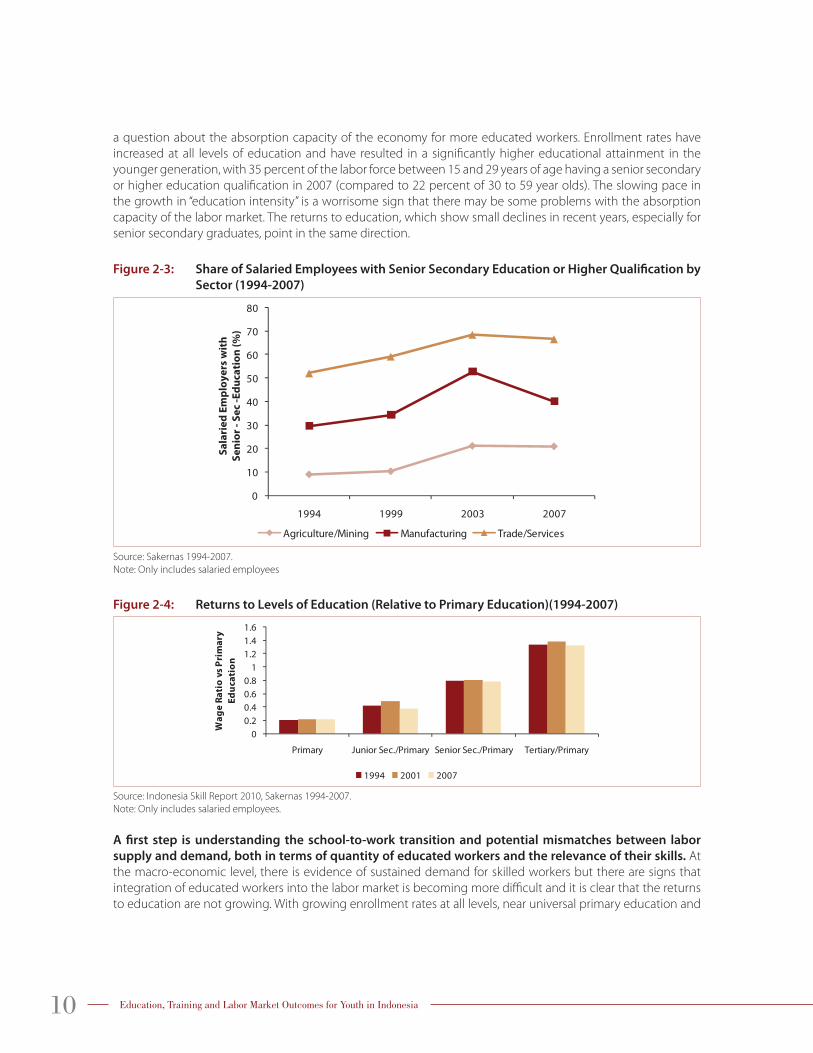
Despite lower labor intensity and slower job creation, the economic shift towards more “education-
intensive”5 sectors (manufacturing and, especially, services) should result in increased demand
for educated workers. The growing importance of the service sector in the economy and the increased
sophistication of the manufacturing sector is expected to result in a sustained demand for skilled workers. Almost
70 percent of workers in the service sectors who are employed for wages have completed senior secondary
education. The share in manufacturing is lower–40 percent, but it is still double that of agriculture (20 percent)
(Figure 2-3). When considering all workers (not only workers employed for wages), the share of educated workers
is signifi cantly lower, but the diff erences among sectors remain (only 7.4 percent of agricultural workers have a
senior secondary education compared with 27.3 percent in manufacturing and 41.5 percent in services). So the
overall trend should ensure sustained and potentially increasing demand for skills in the economy.
Trends in recent job creation and growth in the education sector, nevertheless, raise the question of
whether the growth in educational attainment will be matched by increased demand in the labor
market. There are worrying signs of lower education intensity in the service and, especially, the manufacturing
sector in recent years which, when combined with the growing educational attainment of the population, poses
4 See Indonesia Jobs Report (2009) for a detailed discussion of employment patterns during the 1990-2008 period.
5 “Education intensity” in this report refers to the share of workers with senior secondary education or higher qualifi cations who are
employed in the sector.
10 Education, Training and Labor Market Outcomes for Youth in Indonesia
a question about the absorption capacity of the economy for more educated workers. Enrollment rates have
increased at all levels of education and have resulted in a signifi cantly higher educational attainment in the
younger generation, with 35 percent of the labor force between 15 and 29 years of age having a senior secondary
or higher education qualifi cation in 2007 (compared to 22 percent of 30 to 59 year olds). The slowing pace in
the growth in “education intensity” is a worrisome sign that there may be some problems with the absorption
capacity of the labor market. The returns to education, which show small declines in recent years, especially for
senior secondary graduates, point in the same direction.
Figure 2-3: Share of Salaried Employees with Senior Secondary Education or Higher Qualifi cation by
Sector (1994-2007)
0
10
20
30
40
50
60
70
80
1994 1999 2003 2007
Sa
lari
ed
Em
plo
ye
rs w
ith
Se
nio
r -
Se
c -
Ed
uc
ati
on
(%
)
Agriculture/Mining Manufacturing Trade/Services
Source: Sakernas 1994-2007.
Note: Only includes salaried employees
Figure 2-4: Returns to Levels of Education (Relative to Primary Education)(1994-2007)
00.20.40.60.8
11.21.41.6
Primary Junior Sec./Primary Senior Sec./Primary Tertiary/Primary
Wa
ge
Ra
tio
vs
Pri
ma
ry
Ed
uc
ati
on
1994 2001 2007
Source: Indonesia Skill Report 2010, Sakernas 1994-2007.
Note: Only includes salaried employees.
A fi rst step is understanding the school-to-work transition and potential mismatches between labor
supply and demand, both in terms of quantity of educated workers and the relevance of their skills. At
the macro-economic level, there is evidence of sustained demand for skilled workers but there are signs that
integration of educated workers into the labor market is becoming more diffi cult and it is clear that the returns
to education are not growing. With growing enrollment rates at all levels, near universal primary education and
11
Economic Context: Growth, Transformation and the Demand for Skills
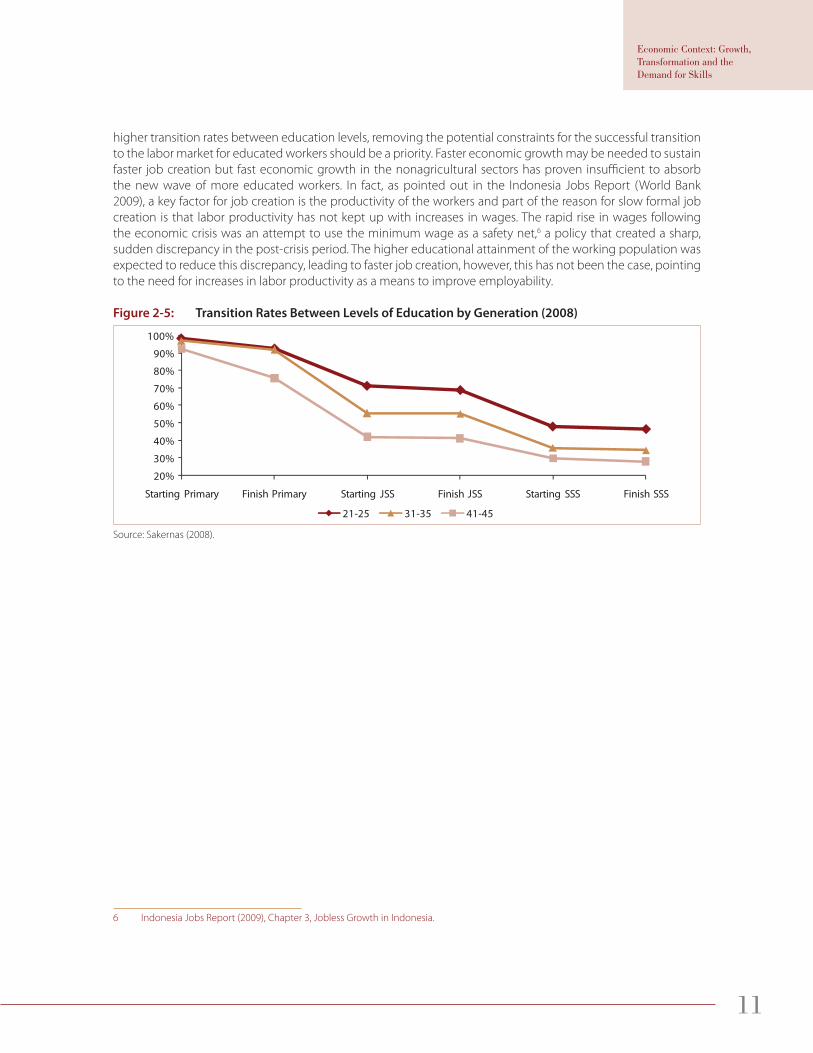
higher transition rates between education levels, removing the potential constraints for the successful transition
to the labor market for educated workers should be a priority. Faster economic growth may be needed to sustain
faster job creation but fast economic growth in the nonagricultural sectors has proven insuffi cient to absorb
the new wave of more educated workers. In fact, as pointed out in the Indonesia Jobs Report (World Bank
2009), a key factor for job creation is the productivity of the workers and part of the reason for slow formal job
creation is that labor productivity has not kept up with increases in wages. The rapid rise in wages following
the economic crisis was an attempt to use the minimum wage as a safety net,6 a policy that created a sharp,
sudden discrepancy in the post-crisis period. The higher educational attainment of the working population was
expected to reduce this discrepancy, leading to faster job creation, however, this has not been the case, pointing
to the need for increases in labor productivity as a means to improve employability.
Figure 2-5: Transition Rates Between Levels of Education by Generation (2008)
Source: Sakernas (2008).
6 Indonesia Jobs Report (2009), Chapter 3, Jobless Growth in Indonesia.
12
Section 3
A Diffi cult Transition to the Labor Market
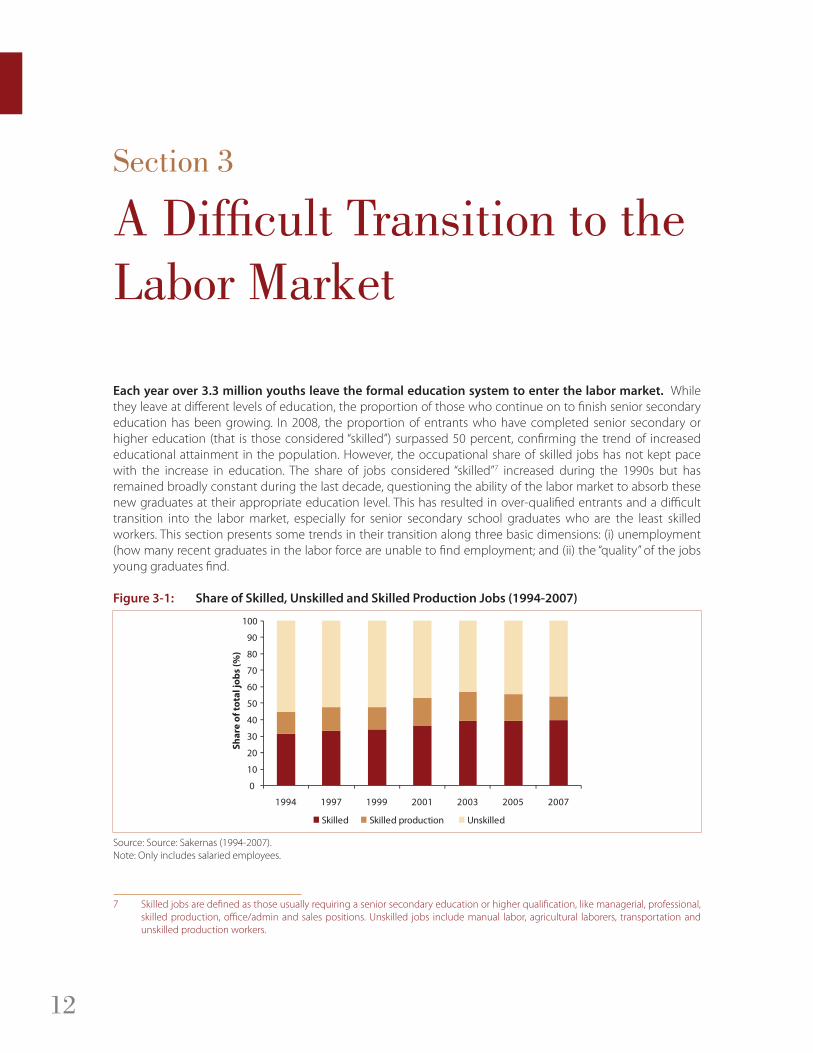
Each year over 3.3 million youths leave the formal education system to enter the labor market. While
they leave at diff erent levels of education, the proportion of those who continue on to fi nish senior secondary
education has been growing. In 2008, the proportion of entrants who have completed senior secondary or
higher education (that is those considered “skilled”) surpassed 50 percent, confi rming the trend of increased
educational attainment in the population. However, the occupational share of skilled jobs has not kept pace
with the increase in education. The share of jobs considered “skilled”7 increased during the 1990s but has
remained broadly constant during the last decade, questioning the ability of the labor market to absorb these
new graduates at their appropriate education level. This has resulted in over-qualifi ed entrants and a diffi cult
transition into the labor market, especially for senior secondary school graduates who are the least skilled
workers. This section presents some trends in their transition along three basic dimensions: (i) unemployment
(how many recent graduates in the labor force are unable to fi nd employment; and (ii) the “quality” of the jobs
young graduates fi nd.
Figure 3-1: Share of Skilled, Unskilled and Skilled Production Jobs (1994-2007)
0
10
20
30
40
50
60
70
80
90
100
1994 1997 1999 2001 2003 2005 2007
Skilled
Sh
are
of
tota
l jo
bs
(%)
Skilled production Unskilled
Source: Source: Sakernas (1994-2007).
Note: Only includes salaried employees.
7 Skilled jobs are defi ned as those usually requiring a senior secondary education or higher qualifi cation, like managerial, professional,
skilled production, offi ce/admin and sales positions. Unskilled jobs include manual labor, agricultural laborers, transportation and
unskilled production workers.

13
A Diffi cult Transition to the Labor Market
3.1 UnemploymentIn Indonesia, the unemployment rate of youth in the 20 to 24 age group is about two and a half times
that of the overall population. It is a common international trend that youth unemployment is higher than
unemployment for older generations, with possible reasons including low overall job creation or labor market
ineffi ciencies. These may be related to institutional factors that aff ect the demand for new employees, like the
minimum wage, cost of hiring/fi ring and other factors leading to insider/outsider segmentation. But beyond
these institutional factors, issues related to the supply of workers may also limit their employability. For example,
insuffi cient or inappropriate skills may also result in a low level of productivity until work experience has been
acquired or workers have been retrained, both of which add to the costs of hiring young inexperienced workers.
Information asymmetries about the skills of graduates due to large diff erences in the quality of education, or
insuffi cient methods for assessing the quality of graduates (that is heterogeneity in skills) can also add a cost to
the process. High reservation wages may also play a role but that is more likely to be a factor for higher educated
youth in search of high quality employment.
Figure 3-2: Unemployment Rate by Age Groups 15-29 (2007)
0
10
20
30
40
50
60
70
80
15-19 20-24 25-29 Overall Population 1 5-59
Pe
rce
nt
LF Participation Unemployment R ate
Source: Sakernas (2007).
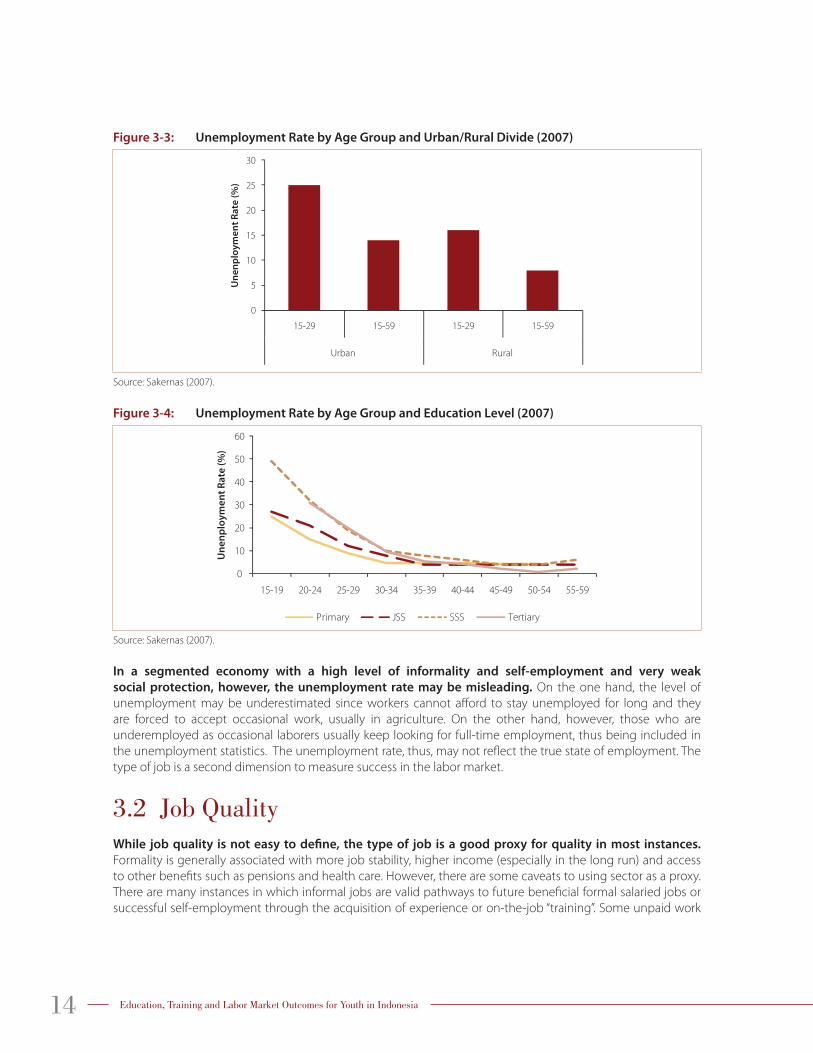
Youth unemployment is an urban phenomenon which mainly aff ects educated workers. Rural areas, with
fewer educated workers and greater availability of unskilled jobs have lower unemployment rates; reinforcing the
current dichotomy in the types of jobs in urban and rural areas in the country (Figure 3-3). A particularly striking
feature of youth unemployment is the high and relatively persistent unemployment rate for more educated
youth, especially senior secondary school graduates. Over 40 percent of 15-24 year old who have completed
senior secondary school in the labor market are unemployed, and although the rate decreases for older age
groups, it does not converge to the country average until the 35-39 year age group.
14 Education, Training and Labor Market Outcomes for Youth in Indonesia
Figure 3-3: Unemployment Rate by Age Group and Urban/Rural Divide (2007)
0
5
10
15
20
25
30
15-29 15-59 15-29 15-59
Urban Rural
Un
en
plo
ym
en
t R
ate
(%
)
Source: Sakernas (2007).
Figure 3-4: Unemployment Rate by Age Group and Education Level (2007)
Un
en
plo
ym
en
t R
ate
(%
)
0
10
20
30
40
50
60
15-19 20-24 25-29 30-34 35-39 40-44 45-49 50-54 55-59
Primary JSS SSS Tertiary
Source: Sakernas (2007).
In a segmented economy with a high level of informality and self-employment and very weak
social protection, however, the unemployment rate may be misleading. On the one hand, the level of
unemployment may be underestimated since workers cannot aff ord to stay unemployed for long and they
are forced to accept occasional work, usually in agriculture. On the other hand, however, those who are
underemployed as occasional laborers usually keep looking for full-time employment, thus being included in
the unemployment statistics. The unemployment rate, thus, may not refl ect the true state of employment. The
type of job is a second dimension to measure success in the labor market.
3.2 Job QualityWhile job quality is not easy to defi ne, the type of job is a good proxy for quality in most instances.
Formality is generally associated with more job stability, higher income (especially in the long run) and access
to other benefi ts such as pensions and health care. However, there are some caveats to using sector as a proxy.
There are many instances in which informal jobs are valid pathways to future benefi cial formal salaried jobs or
successful self-employment through the acquisition of experience or on-the-job “training”. Some unpaid work
15
A Diffi cult Transition to the Labor Market
and self-employment may be the result of rational decisions and not lack of alternatives, especially when it leads
to a reasonable standard of living and more freedom and other intangible benefi ts.8
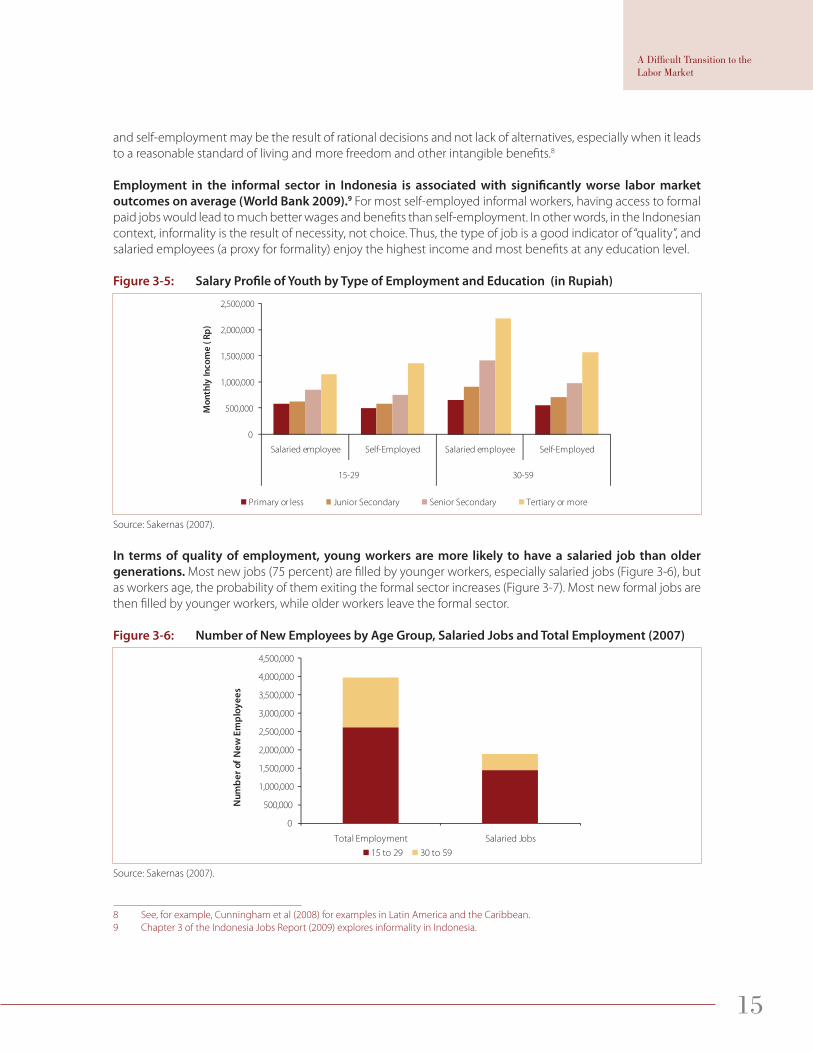
Employment in the informal sector in Indonesia is associated with signifi cantly worse labor market
outcomes on average (World Bank 2009).9 For most self-employed informal workers, having access to formal
paid jobs would lead to much better wages and benefi ts than self-employment. In other words, in the Indonesian
context, informality is the result of necessity, not choice. Thus, the type of job is a good indicator of “quality”, and
salaried employees (a proxy for formality) enjoy the highest income and most benefi ts at any education level.
Figure 3-5: Salary Profi le of Youth by Type of Employment and Education (in Rupiah)
0
500,000
1,000,000
1,500,000
2,000,000
2,500,000
Salaried employee Self-Employed Salaried employee Self-Employed
15-29 30-59
Mo
nth
ly I
nc
om
e (
Rp
)
Primary or less Junior Secondary Senior Secondary Tertiary or more
Source: Sakernas (2007).
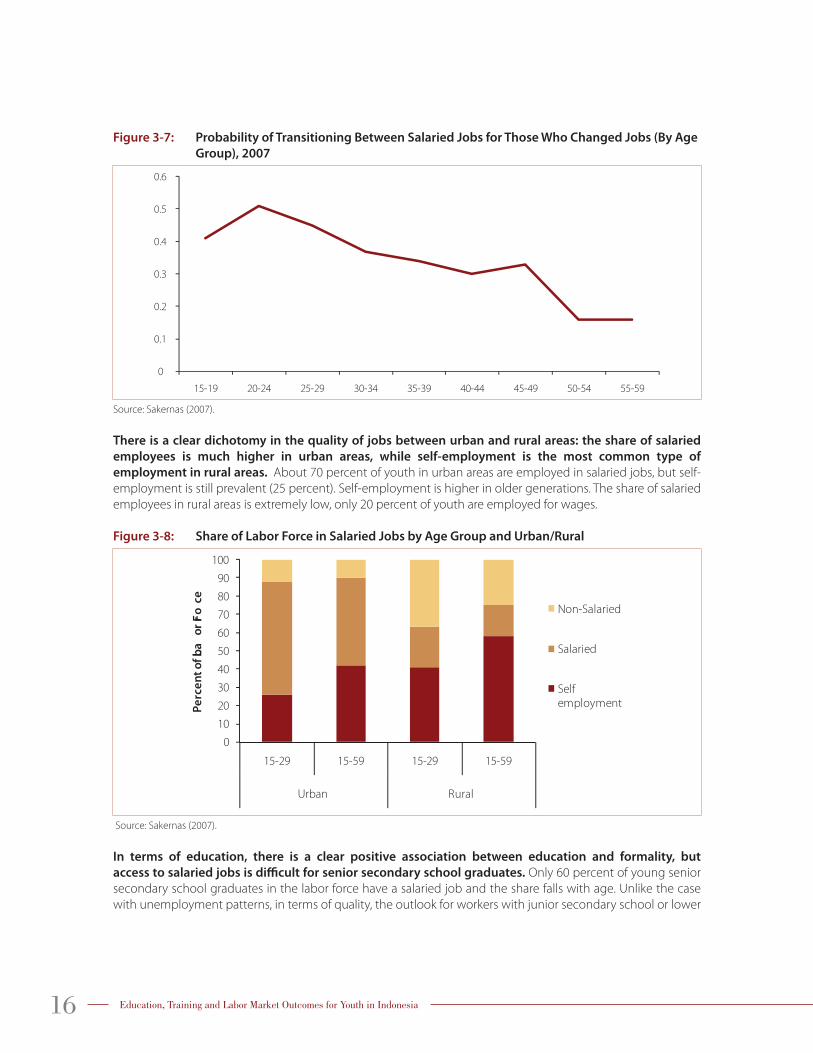
In terms of quality of employment, young workers are more likely to have a salaried job than older
generations. Most new jobs (75 percent) are fi lled by younger workers, especially salaried jobs (Figure 3-6), but
as workers age, the probability of them exiting the formal sector increases (Figure 3-7). Most new formal jobs are
then fi lled by younger workers, while older workers leave the formal sector.
Figure 3-6: Number of New Employees by Age Group, Salaried Jobs and Total Employment (2007)
0
500,000
1,000,000
1,500,000
2,000,000
2,500,000
3,000,000
3,500,000
4,000,000
4,500,000
Total Employment Salaried Jobs
Nu
mb
er
of
Ne
w E
mp
loy
ee
s
15 to 29 30 to 59
Source: Sakernas (2007).
8 See, for example, Cunningham et al (2008) for examples in Latin America and the Caribbean.
9 Chapter 3 of the Indonesia Jobs Report (2009) explores informality in Indonesia.
16 Education, Training and Labor Market Outcomes for Youth in Indonesia
Figure 3-7: Probability of Transitioning Between Salaried Jobs for Those Who Changed Jobs (By Age
Group), 2007
0
0.1
0.2
0.3
0.4
0.5
0.6
15-19 20-24 25-29 30-34 35-39 40-44 45-49 50-54 55-59
Source: Sakernas (2007).
There is a clear dichotomy in the quality of jobs between urban and rural areas: the share of salaried
employees is much higher in urban areas, while self-employment is the most common type of
employment in rural areas. About 70 percent of youth in urban areas are employed in salaried jobs, but self-
employment is still prevalent (25 percent). Self-employment is higher in older generations. The share of salaried
employees in rural areas is extremely low, only 20 percent of youth are employed for wages.
Figure 3-8: Share of Labor Force in Salaried Jobs by Age Group and Urban/Rural
0
10
20
30
40
50
60
70
80
90
100
15-29 15-59 15-29 15-59
Urban Rural
eP
c rn
et
fo
L ba
ro
F ro
ec
Non-Salaried
Salaried
Self
employment
Source: Sakernas (2007).
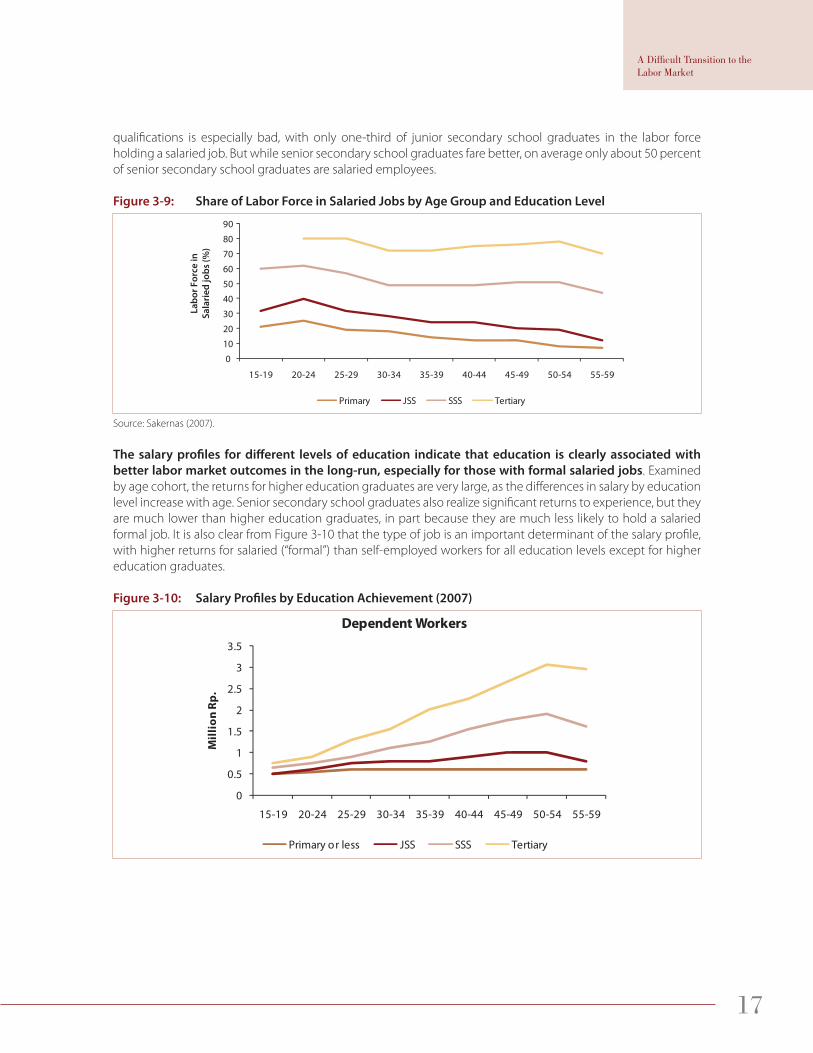
In terms of education, there is a clear positive association between education and formality, but
access to salaried jobs is diffi cult for senior secondary school graduates. Only 60 percent of young senior
secondary school graduates in the labor force have a salaried job and the share falls with age. Unlike the case
with unemployment patterns, in terms of quality, the outlook for workers with junior secondary school or lower
17
A Diffi cult Transition to the Labor Market
qualifi cations is especially bad, with only one-third of junior secondary school graduates in the labor force
holding a salaried job. But while senior secondary school graduates fare better, on average only about 50 percent
of senior secondary school graduates are salaried employees.
Figure 3-9: Share of Labor Force in Salaried Jobs by Age Group and Education Levelni
ecro
F ro
ba
L
)%( s
boj
deir
ala
S
0
10
20
30
40
50
60
70
80
90
15-19 20-24 25-29 30-34 35-39 40-44 45-49 50-54 55-59
Primary JSS SSS Tertiary
Source: Sakernas (2007).
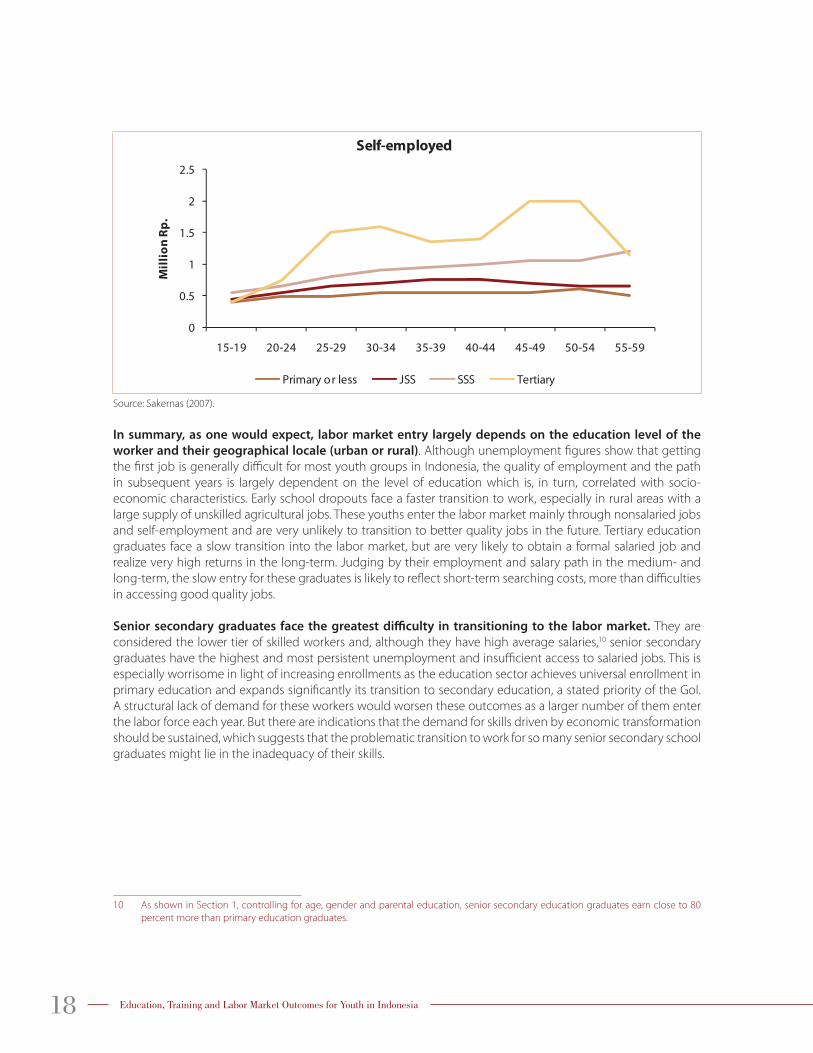
The salary profi les for diff erent levels of education indicate that education is clearly associated with
better labor market outcomes in the long-run, especially for those with formal salaried jobs. Examined
by age cohort, the returns for higher education graduates are very large, as the diff erences in salary by education
level increase with age. Senior secondary school graduates also realize signifi cant returns to experience, but they
are much lower than higher education graduates, in part because they are much less likely to hold a salaried
formal job. It is also clear from Figure 3-10 that the type of job is an important determinant of the salary profi le,
with higher returns for salaried (“formal”) than self-employed workers for all education levels except for higher
education graduates.
Figure 3-10: Salary Profi les by Education Achievement (2007)
0
0.5
1
1.5
2
2.5
3
3.5
15-19 20-24 25-29 30-34 35-39 40-44 45-49 50-54 55-59
Mil
lio
n R
p.
Dependent Workers
Primary or less JSS SSS Tertiary
18 Education, Training and Labor Market Outcomes for Youth in Indonesia
0
0.5
1
1.5
2
2.5
15-19 20-24 25-29 30-34 35-39 40-44 45-49 50-54 55-59
Mil
lio
n R
p.
Self-employed
Primary or less JSS SSS Tertiary
Source: Sakernas (2007).
In summary, as one would expect, labor market entry largely depends on the education level of the
worker and their geographical locale (urban or rural). Although unemployment fi gures show that getting
the fi rst job is generally diffi cult for most youth groups in Indonesia, the quality of employment and the path
in subsequent years is largely dependent on the level of education which is, in turn, correlated with socio-
economic characteristics. Early school dropouts face a faster transition to work, especially in rural areas with a
large supply of unskilled agricultural jobs. These youths enter the labor market mainly through nonsalaried jobs
and self-employment and are very unlikely to transition to better quality jobs in the future. Tertiary education
graduates face a slow transition into the labor market, but are very likely to obtain a formal salaried job and
realize very high returns in the long-term. Judging by their employment and salary path in the medium- and
long-term, the slow entry for these graduates is likely to refl ect short-term searching costs, more than diffi culties
in accessing good quality jobs.
Senior secondary graduates face the greatest diffi culty in transitioning to the labor market. They are
considered the lower tier of skilled workers and, although they have high average salaries,10 senior secondary
graduates have the highest and most persistent unemployment and insuffi cient access to salaried jobs. This is
especially worrisome in light of increasing enrollments as the education sector achieves universal enrollment in
primary education and expands signifi cantly its transition to secondary education, a stated priority of the GoI.
A structural lack of demand for these workers would worsen these outcomes as a larger number of them enter
the labor force each year. But there are indications that the demand for skills driven by economic transformation
should be sustained, which suggests that the problematic transition to work for so many senior secondary school
graduates might lie in the inadequacy of their skills.
10 As shown in Section 1, controlling for age, gender and parental education, senior secondary education graduates earn close to 80
percent more than primary education graduates.
19
Section 4
Senior Secondary Education, Skills and Labor Market Entrance
One of the main functions of the education system, especially in secondary education and beyond, is to
provide graduates with adequate skills to enter the job market. This should translate into better employment
prospects and higher wages, provided the labor market can absorb employees with their skills. The underlying
assumptions of this argument, which is used to justify expansion of education systems worldwide, are: (i) sound
macro-economic performance; (ii) increases in the level of sophistication of the economy that match expansions
in educational attainment; and (iii) labor market conditions that are conducive to the transition by not imposing
high barriers to entry of new employees (that is ineffi ciently high minimum wages or very high cost of hiring and
fi ring). In addition, “more educated” should translate into “more skilled”; that is education should actually provide
graduates with skills, especially those demanded in the labor market. Failure in any of these assumptions can
result in a mismatch between the supply and demand of educated workers, resulting in high unemployment,
high job search times, leading to over qualifi cation or informality as an alternative to the lack of jobs.
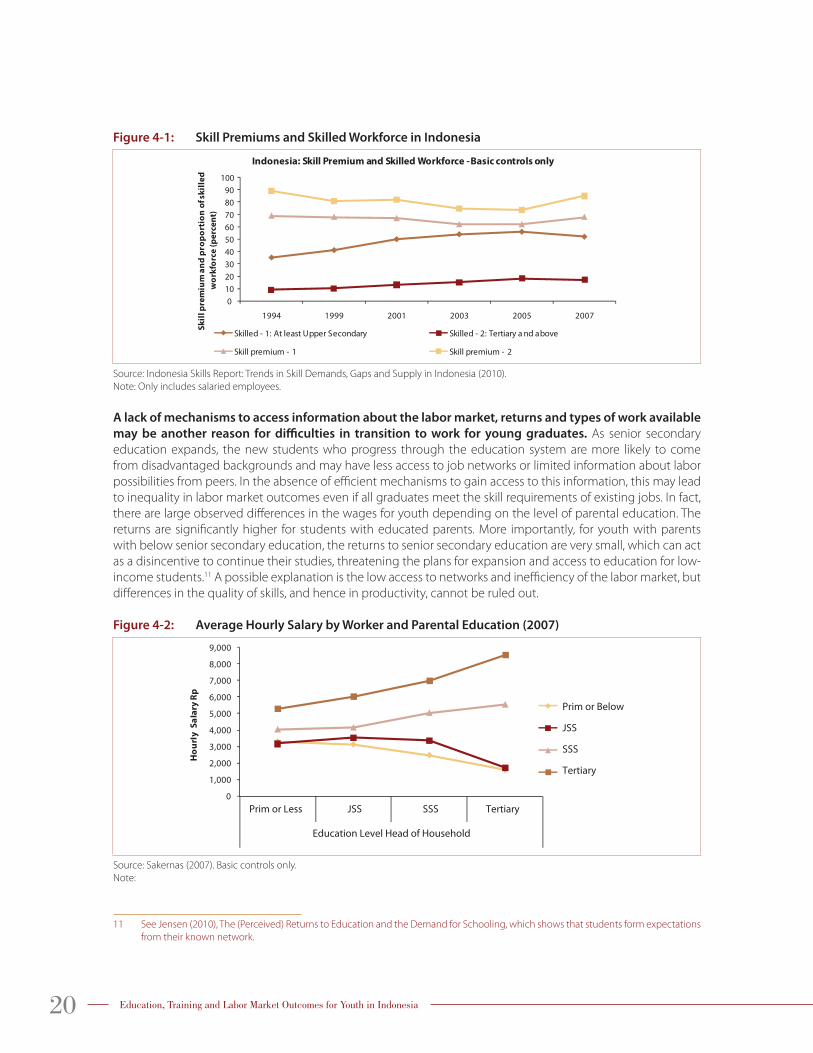
The share of workers employed for wages who have a senior secondary education or higher qualifi cation
has increased signifi cantly during the last 15 years (from 35 percent to over 50 percent), but the growth
mainly occurred during the 1990s and has remained constant in the last decade. During this time, the
skill premium (salary associated to completing senior secondary education or tertiary and above) has remained
relatively constant, indicating that the demand for skilled jobs has kept up with the growth in the supply. The
trends are opposite, with small decreases in the returns associated with the increases in the educated workforce,
but the small size of the changes in the education premium suggests that the demand for educated workers
is largely sustained. In fact, the return seems to have resumed growth in recent years, while this has not been
accompanied with a higher share of educated workers in salaried jobs.
20 Education, Training and Labor Market Outcomes for Youth in Indonesia
Figure 4-1: Skill Premiums and Skilled Workforce in Indonesia
0102030405060708090
100
1994 1999 2001 2003 2005 2007
Sk
ill
pre
miu
m a
nd
pro
po
rtio
n o
f s
kil
led
wo
rkfo
rce
(p
erc
en
t)
Indonesia: Skill Premium and Skilled Workforce -Basic controls only
Skilled - 1: At least Upper Secondary Skilled - 2: Tertiary a nd above
Skill premium - 1 Skill premium - 2
Source: Indonesia Skills Report: Trends in Skill Demands, Gaps and Supply in Indonesia (2010).
Note: Only includes salaried employees.
A lack of mechanisms to access information about the labor market, returns and types of work available
may be another reason for diffi culties in transition to work for young graduates. As senior secondary
education expands, the new students who progress through the education system are more likely to come
from disadvantaged backgrounds and may have less access to job networks or limited information about labor
possibilities from peers. In the absence of effi cient mechanisms to gain access to this information, this may lead
to inequality in labor market outcomes even if all graduates meet the skill requirements of existing jobs. In fact,
there are large observed diff erences in the wages for youth depending on the level of parental education. The
returns are signifi cantly higher for students with educated parents. More importantly, for youth with parents
with below senior secondary education, the returns to senior secondary education are very small, which can act
as a disincentive to continue their studies, threatening the plans for expansion and access to education for low-
income students.11 A possible explanation is the low access to networks and ineffi ciency of the labor market, but
diff erences in the quality of skills, and hence in productivity, cannot be ruled out.
Figure 4-2: Average Hourly Salary by Worker and Parental Education (2007)
Prim or Less JSS SSS Tertiary
Prim or Below
JSS
SSS
Tertiary
Education Level Head of Household
Source: Sakernas (2007). Basic controls only.
Note:
11 See Jensen (2010), The (Perceived) Returns to Education and the Demand for Schooling, which shows that students form expectations
from their known network.
21
Senior Secondary Educa-tion, Skills and Labor Mar-ket Entrance
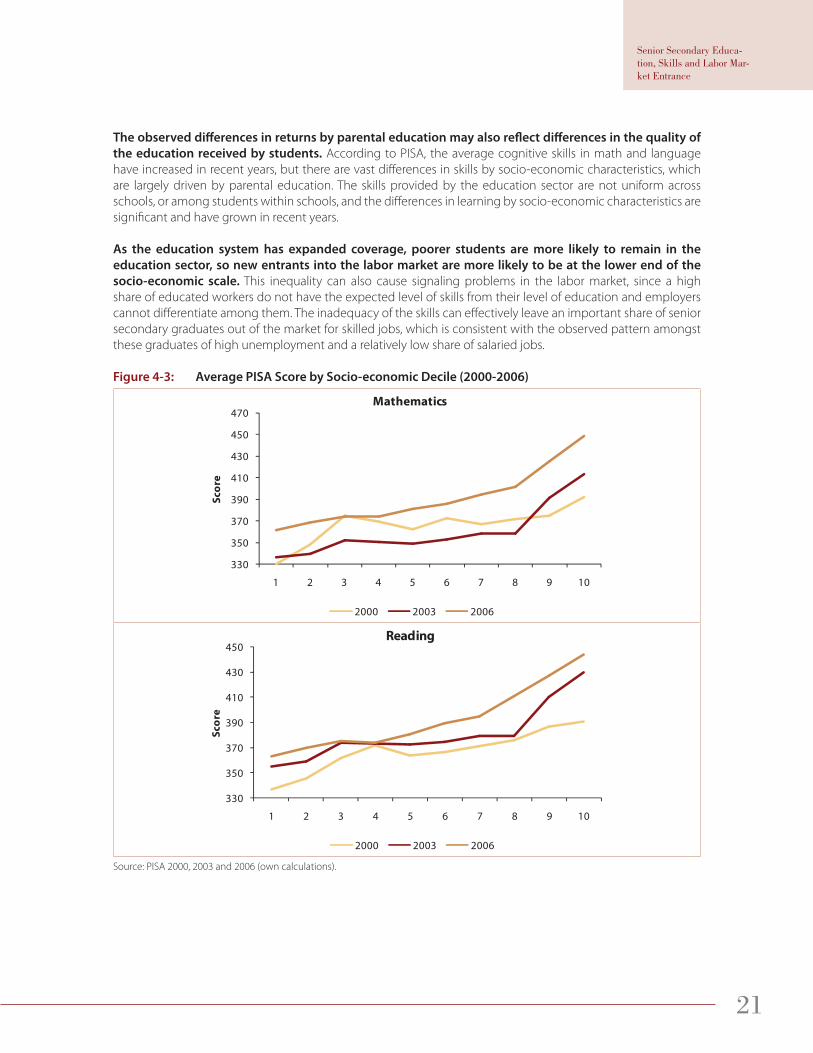
The observed diff erences in returns by parental education may also refl ect diff erences in the quality of
the education received by students. According to PISA, the average cognitive skills in math and language
have increased in recent years, but there are vast diff erences in skills by socio-economic characteristics, which
are largely driven by parental education. The skills provided by the education sector are not uniform across
schools, or among students within schools, and the diff erences in learning by socio-economic characteristics are
signifi cant and have grown in recent years.
As the education system has expanded coverage, poorer students are more likely to remain in the
education sector, so new entrants into the labor market are more likely to be at the lower end of the
socio-economic scale. This inequality can also cause signaling problems in the labor market, since a high
share of educated workers do not have the expected level of skills from their level of education and employers
cannot diff erentiate among them. The inadequacy of the skills can eff ectively leave an important share of senior
secondary graduates out of the market for skilled jobs, which is consistent with the observed pattern amongst
these graduates of high unemployment and a relatively low share of salaried jobs.
Figure 4-3: Average PISA Score by Socio-economic Decile (2000-2006)
330
350
370
390
410
430
450
470
1 2 3 4 5 6 7 8 9 10
Sc
ore
Mathematics
2000 2003 2006
330
350
370
390
410
430
450
1 2 3 4 5 6 7 8 9 10
Sc
ore
Reading
2000 2003 2006
Source: PISA 2000, 2003 and 2006 (own calculations).
22 Education, Training and Labor Market Outcomes for Youth in Indonesia
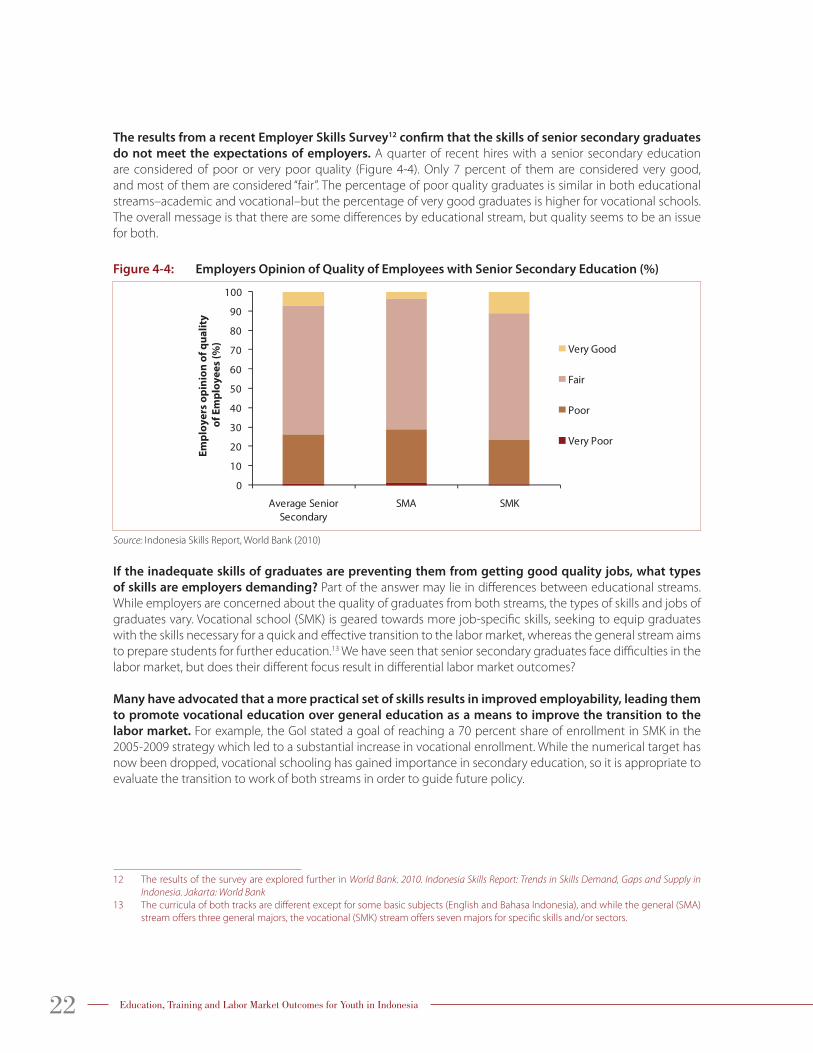
The results from a recent Employer Skills Survey12 confi rm that the skills of senior secondary graduates
do not meet the expectations of employers. A quarter of recent hires with a senior secondary education
are considered of poor or very poor quality (Figure 4-4). Only 7 percent of them are considered very good,
and most of them are considered “fair”. The percentage of poor quality graduates is similar in both educational
streams–academic and vocational–but the percentage of very good graduates is higher for vocational schools.
The overall message is that there are some diff erences by educational stream, but quality seems to be an issue
for both.
Figure 4-4: Employers Opinion of Quality of Employees with Senior Secondary Education (%)
Em
plo
ye
rs o
pin
ion
of
qu
ali
ty
of
Em
plo
ye
es
(%)
0
10
20
30
40
50
60
70
80
90
100
Average Senior Secondary
SMA SMK
Very Good
Fair
Poor
Very Poor
Source: Indonesia Skills Report, World Bank (2010)
If the inadequate skills of graduates are preventing them from getting good quality jobs, what types
of skills are employers demanding? Part of the answer may lie in diff erences between educational streams.
While employers are concerned about the quality of graduates from both streams, the types of skills and jobs of
graduates vary. Vocational school (SMK) is geared towards more job-specifi c skills, seeking to equip graduates
with the skills necessary for a quick and eff ective transition to the labor market, whereas the general stream aims
to prepare students for further education.13 We have seen that senior secondary graduates face diffi culties in the
labor market, but does their diff erent focus result in diff erential labor market outcomes?
Many have advocated that a more practical set of skills results in improved employability, leading them
to promote vocational education over general education as a means to improve the transition to the
labor market. For example, the GoI stated a goal of reaching a 70 percent share of enrollment in SMK in the
2005-2009 strategy which led to a substantial increase in vocational enrollment. While the numerical target has
now been dropped, vocational schooling has gained importance in secondary education, so it is appropriate to
evaluate the transition to work of both streams in order to guide future policy.
12 The results of the survey are explored further in World Bank. 2010. Indonesia Skills Report: Trends in Skills Demand, Gaps and Supply in
Indonesia. Jakarta: World Bank
13 The curricula of both tracks are diff erent except for some basic subjects (English and Bahasa Indonesia), and while the general (SMA)
stream off ers three general majors, the vocational (SMK) stream off ers seven majors for specifi c skills and/or sectors.
23
Senior Secondary Educa-tion, Skills and Labor Mar-ket Entrance
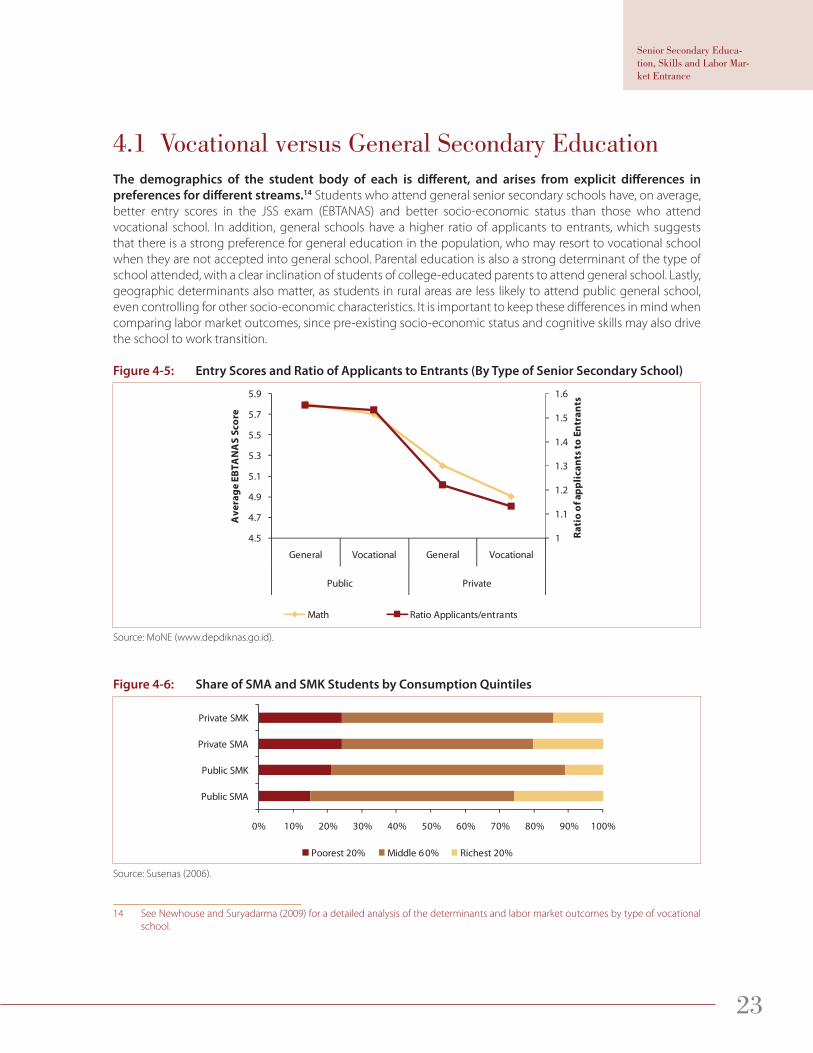
4.1 Vocational versus General Secondary Education The demographics of the student body of each is diff erent, and arises from explicit diff erences in
preferences for diff erent streams.14 Students who attend general senior secondary schools have, on average,
better entry scores in the JSS exam (EBTANAS) and better socio-economic status than those who attend
vocational school. In addition, general schools have a higher ratio of applicants to entrants, which suggests
that there is a strong preference for general education in the population, who may resort to vocational school
when they are not accepted into general school. Parental education is also a strong determinant of the type of
school attended, with a clear inclination of students of college-educated parents to attend general school. Lastly,
geographic determinants also matter, as students in rural areas are less likely to attend public general school,
even controlling for other socio-economic characteristics. It is important to keep these diff erences in mind when
comparing labor market outcomes, since pre-existing socio-economic status and cognitive skills may also drive
the school to work transition.
Figure 4-5: Entry Scores and Ratio of Applicants to Entrants (By Type of Senior Secondary School)
1
1.1
1.2
1.3
1.4
1.5
1.6
4.5
4.7
4.9
5.1
5.3
5.5
5.7
5.9
General Vocational General Vocational
Public PrivateR
ati
o o
f a
pp
lic
an
ts t
o E
ntr
an
ts
Av
era
ge
EB
TA
NA
S S
co
r e
Math Ratio Applicants/entrants
Source: MoNE (www.depdiknas.go.id).
Figure 4-6: Share of SMA and SMK Students by Consumption Quintiles
0% 10% 20% 30% 40% 50% 60% 70% 80% 90% 100%
Public SMA
Public SMK
Private SMA
Private SMK
Poorest 20% Middle 6 0% Richest 20%
Source: Susenas (2006).
14 See Newhouse and Suryadarma (2009) for a detailed analysis of the determinants and labor market outcomes by type of vocational
school.
24 Education, Training and Labor Market Outcomes for Youth in Indonesia
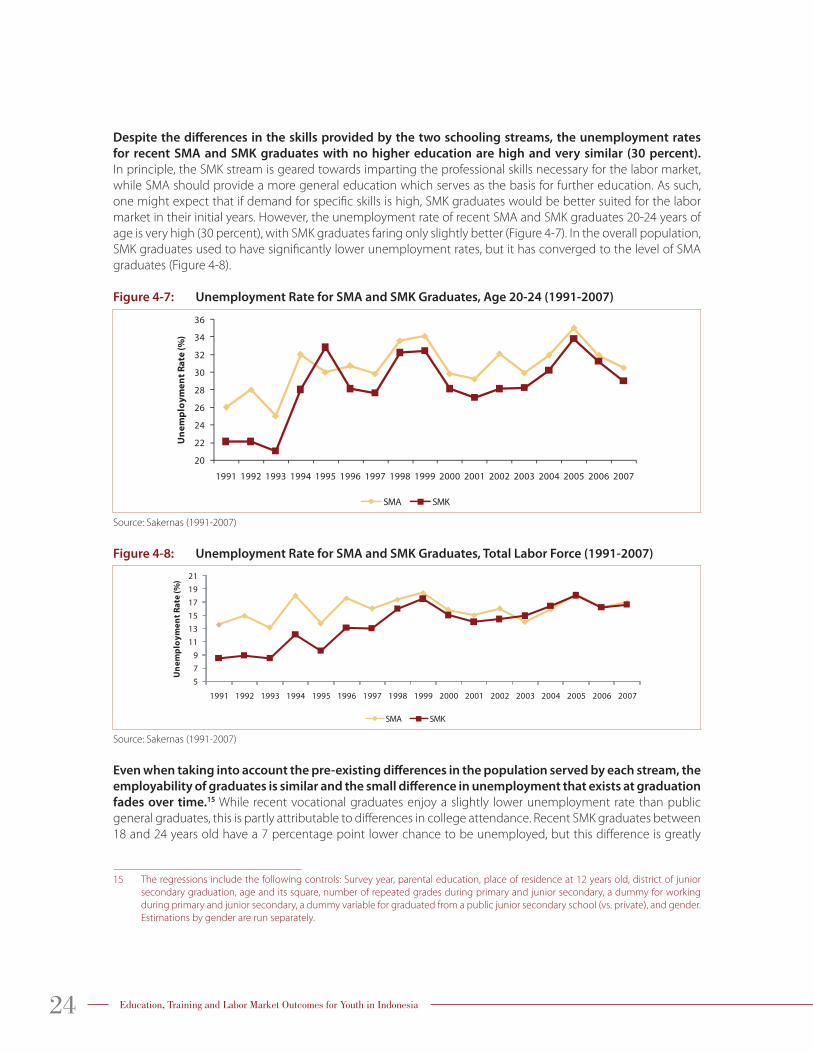
Despite the diff erences in the skills provided by the two schooling streams, the unemployment rates
for recent SMA and SMK graduates with no higher education are high and very similar (30 percent).
In principle, the SMK stream is geared towards imparting the professional skills necessary for the labor market,
while SMA should provide a more general education which serves as the basis for further education. As such,
one might expect that if demand for specifi c skills is high, SMK graduates would be better suited for the labor
market in their initial years. However, the unemployment rate of recent SMA and SMK graduates 20-24 years of
age is very high (30 percent), with SMK graduates faring only slightly better (Figure 4-7). In the overall population,
SMK graduates used to have signifi cantly lower unemployment rates, but it has converged to the level of SMA
graduates (Figure 4-8).
Figure 4-7: Unemployment Rate for SMA and SMK Graduates, Age 20-24 (1991-2007)
20
22
24
26
28
30
32
34
36
1991 1992 1993 1994 1995 1996 1997 1998 1999 2000 2001 2002 2003 2004 2005 2006 2007
Un
em
plo
ym
en
t R
ate
(%
)
SMA SMK
Source: Sakernas (1991-2007)
Figure 4-8: Unemployment Rate for SMA and SMK Graduates, Total Labor Force (1991-2007)
579
111315171921
1991 1992 1993 1994 1995 1996 1997 1998 1999 2000 2001 2002 2003 2004 2005 2006 2007
Un
em
plo
ym
en
t R
ate
(%
)
SMA SMK
Source: Sakernas (1991-2007)
Even when taking into account the pre-existing diff erences in the population served by each stream, the
employability of graduates is similar and the small diff erence in unemployment that exists at graduation
fades over time.15 While recent vocational graduates enjoy a slightly lower unemployment rate than public
general graduates, this is partly attributable to diff erences in college attendance. Recent SMK graduates between
18 and 24 years old have a 7 percentage point lower chance to be unemployed, but this diff erence is greatly
15 The regressions include the following controls: Survey year, parental education, place of residence at 12 years old, district of junior
secondary graduation, age and its square, number of repeated grades during primary and junior secondary, a dummy for working
during primary and junior secondary, a dummy variable for graduated from a public junior secondary school (vs. private), and gender.
Estimations by gender are run separately.
25
Senior Secondary Educa-tion, Skills and Labor Mar-ket Entrance
reduced at 25 and disappears at 35. An SMK education also seems to benefi t females in the short-run, but the
diff erence also disappears over time. It is clear that SMK is no better than SMA at improving the unemployment
rate of its graduates, despite explicitly targeting their transition to employment.
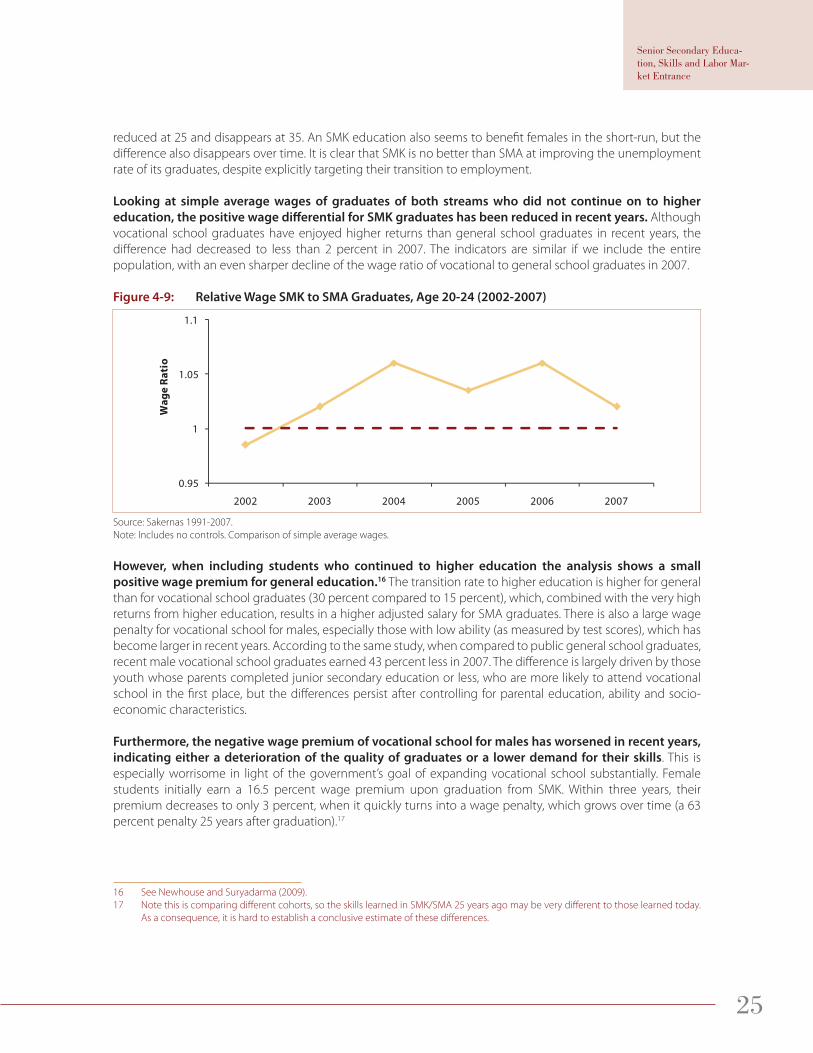
Looking at simple average wages of graduates of both streams who did not continue on to higher
education, the positive wage diff erential for SMK graduates has been reduced in recent years. Although
vocational school graduates have enjoyed higher returns than general school graduates in recent years, the
diff erence had decreased to less than 2 percent in 2007. The indicators are similar if we include the entire
population, with an even sharper decline of the wage ratio of vocational to general school graduates in 2007.
Figure 4-9: Relative Wage SMK to SMA Graduates, Age 20-24 (2002-2007)
0.95
1
1.05
1.1
2002 2003 2004 2005 2006 2007
Wa
ge
Ra
tio
Source: Sakernas 1991-2007.
Note: Includes no controls. Comparison of simple average wages.
However, when including students who continued to higher education the analysis shows a small
positive wage premium for general education.16 The transition rate to higher education is higher for general
than for vocational school graduates (30 percent compared to 15 percent), which, combined with the very high
returns from higher education, results in a higher adjusted salary for SMA graduates. There is also a large wage
penalty for vocational school for males, especially those with low ability (as measured by test scores), which has
become larger in recent years. According to the same study, when compared to public general school graduates,
recent male vocational school graduates earned 43 percent less in 2007. The diff erence is largely driven by those
youth whose parents completed junior secondary education or less, who are more likely to attend vocational
school in the fi rst place, but the diff erences persist after controlling for parental education, ability and socio-
economic characteristics.
Furthermore, the negative wage premium of vocational school for males has worsened in recent years,
indicating either a deterioration of the quality of graduates or a lower demand for their skills. This is
especially worrisome in light of the government’s goal of expanding vocational school substantially. Female
students initially earn a 16.5 percent wage premium upon graduation from SMK. Within three years, their
premium decreases to only 3 percent, when it quickly turns into a wage penalty, which grows over time (a 63
percent penalty 25 years after graduation).17
16 See Newhouse and Suryadarma (2009).
17 Note this is comparing diff erent cohorts, so the skills learned in SMK/SMA 25 years ago may be very diff erent to those learned today.
As a consequence, it is hard to establish a conclusive estimate of these diff erences.
26 Education, Training and Labor Market Outcomes for Youth in Indonesia
When comparing public and private schools, there is a clear positive wage premium for public school
graduates for both men and women. Controlling for selection and socio-economic characteristics, men who
graduated from private vocational school earn between 17 and 20 percent less18 than those who graduated
from public vocational school. Public general school graduates also earn substantially more than private general
school graduates (between 17 and 28 percent more). The results are similar for women. Since this is true both
in SMA and SMK, and most of the expansion in SMK enrollment has happened through private institutions, it is
important to evaluate the policy of rapid expansion of vocational schools.
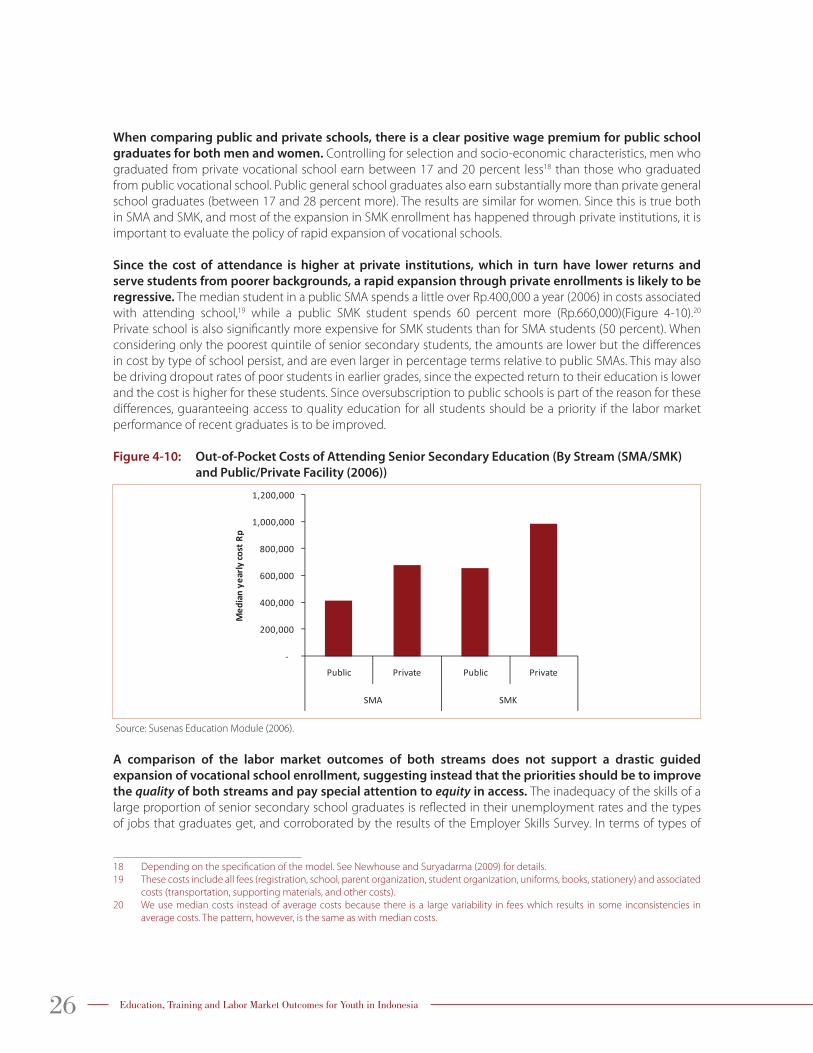
Since the cost of attendance is higher at private institutions, which in turn have lower returns and
serve students from poorer backgrounds, a rapid expansion through private enrollments is likely to be
regressive. The median student in a public SMA spends a little over Rp.400,000 a year (2006) in costs associated
with attending school,19 while a public SMK student spends 60 percent more (Rp.660,000)(Figure 4-10).20
Private school is also signifi cantly more expensive for SMK students than for SMA students (50 percent). When
considering only the poorest quintile of senior secondary students, the amounts are lower but the diff erences
in cost by type of school persist, and are even larger in percentage terms relative to public SMAs. This may also
be driving dropout rates of poor students in earlier grades, since the expected return to their education is lower
and the cost is higher for these students. Since oversubscription to public schools is part of the reason for these
diff erences, guaranteeing access to quality education for all students should be a priority if the labor market
performance of recent graduates is to be improved.
Figure 4-10: Out-of-Pocket Costs of Attending Senior Secondary Education (By Stream (SMA/SMK)
and Public/Private Facility (2006))
-
200,000
400,000
600,000
800,000
1,000,000
1,200,000
Public Private Public Private
SMA SMK
Med
ian
year
l y c
o st
Rp
Source: Susenas Education Module (2006).
A comparison of the labor market outcomes of both streams does not support a drastic guided
expansion of vocational school enrollment, suggesting instead that the priorities should be to improve
the quality of both streams and pay special attention to equity in access. The inadequacy of the skills of a
large proportion of senior secondary school graduates is refl ected in their unemployment rates and the types
of jobs that graduates get, and corroborated by the results of the Employer Skills Survey. In terms of types of
18 Depending on the specifi cation of the model. See Newhouse and Suryadarma (2009) for details.
19 These costs include all fees (registration, school, parent organization, student organization, uniforms, books, stationery) and associated
costs (transportation, supporting materials, and other costs).
20 We use median costs instead of average costs because there is a large variability in fees which results in some inconsistencies in
average costs. The pattern, however, is the same as with median costs.

27
Senior Secondary Educa-tion, Skills and Labor Mar-ket Entrance
skills, the vocational stream of secondary school does not seem to be better at providing practical skills than the
general track. But what is then the shortage of skills that employers face when hiring senior secondary school
graduates? And how can the education sector, both through formal education and through informal training
provide these skills? The next section explores these issues in more detail.
28
Section 5
Meeting the Demand for Skills
Senior secondary education plays a fundamental role in the formation of skills for success in the labor
market. Skill formation is a dynamic process that takes diff erent forms at diff erent stages in life (family interaction,
schools, peers, training and work experience), and the types and characteristics of skills in each stage are not
always interchangeable.21 As a consequence, senior secondary education cannot be expected to compensate
for earlier grade defi cits in certain skills, nor provide skills that are better acquired during the course of the
professional life of the person through job-specifi c training.
The education sector as a whole, including higher education, however, cannot be solely responsible for
providing all the skills necessary for a successful transition to the labor market. Many jobs require very
specifi c skills that should be the responsibility of fi rms. Thus, mapping the types of skills that the education sector
is supposed to provide and devising a system for the acquisition of complementary skills should be the fi rst step
in creating a system for lifelong learning that provides opportunities for skill upgrading for persons of diff erent
backgrounds at diff erent stages in life and that is adaptable to changing demands in the labor market.
Categorizing skills, however, is a diffi cult task–and measuring them is an even more diffi cult one.
The literature describing diff erent types of skills is abundant, but there is no consensus on the appropriate
categorization of skills.22 Broad classifi cation as cognitive and noncognitive skills is insuffi cient for the education
sector, as curricula generally cover subsets of these categories that are insuffi ciently defi ned through these
concepts.
An appropriate division of skills for the purposes of this paper is to categorize skills according to the
appropriate timing of skill acquisition, their breadth, and their transferability. The resulting categories
are: (i) “academic” (cognitive), which are better acquired early in life, provide a broad base of knowledge that is
directly related to subject matters (mathematics, language, science) and is completely transferable between jobs;
21 Heckman and Jacobs (2010), which build up on models outlined in earlier Heckman publications (see bibliography in Heckman and
Jacobs).
22 See Stasz (2001) for a discussion on “Assessing skills for work: two perspectives”.
29
Meeting the Demand for Skills
(ii) “generic” or “life” skills,23 such as problem solving, eff ective communication or ability to work in teams. These
also start early in life, are completely transferable between jobs but are not directly related to subject matter and
depend partly on factors sometimes external to the school system; and (iii) technical skills, which are job specifi c,
narrowly defi ned and could be associated with a subject matter, and could be transferable (computer skills,
management) or nontransferable (use of a specifi c machine or a specifi c process).
It is clear that academic skills are, and should be, one of the main objectives of the education sector,
however, generic/life skills are in increasing demand in the labor market. As economies become more
sophisticated, the demand for these types of skills grows (including the demand for complex thinking/problem
solving and eff ective communication skills). This has resulted in an adaptation of the curriculum in many countries
to refl ect these demands, in order to broaden the skill base of education graduates.
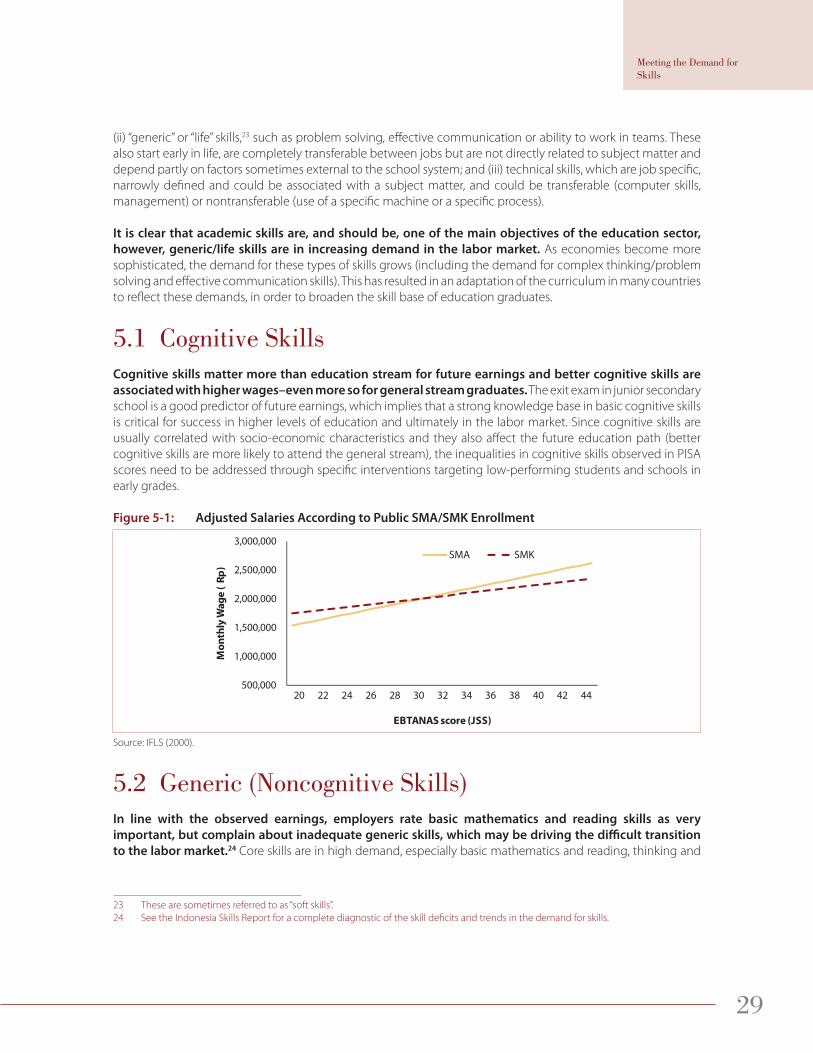
5.1 Cognitive SkillsCognitive skills matter more than education stream for future earnings and better cognitive skills are
associated with higher wages–even more so for general stream graduates. The exit exam in junior secondary
school is a good predictor of future earnings, which implies that a strong knowledge base in basic cognitive skills
is critical for success in higher levels of education and ultimately in the labor market. Since cognitive skills are
usually correlated with socio-economic characteristics and they also aff ect the future education path (better
cognitive skills are more likely to attend the general stream), the inequalities in cognitive skills observed in PISA
scores need to be addressed through specifi c interventions targeting low-performing students and schools in
early grades.
Figure 5-1: Adjusted Salaries According to Public SMA/SMK Enrollment
500,000
1,000,000
1,500,000
2,000,000
2,500,000
3,000,000
20 22 24 26 28 30 32 34 36 38 40 42 44
Mo
nth
ly W
ag
e (
Rp
)
EBTANAS score (JSS)
SMA SMK
Source: IFLS (2000).
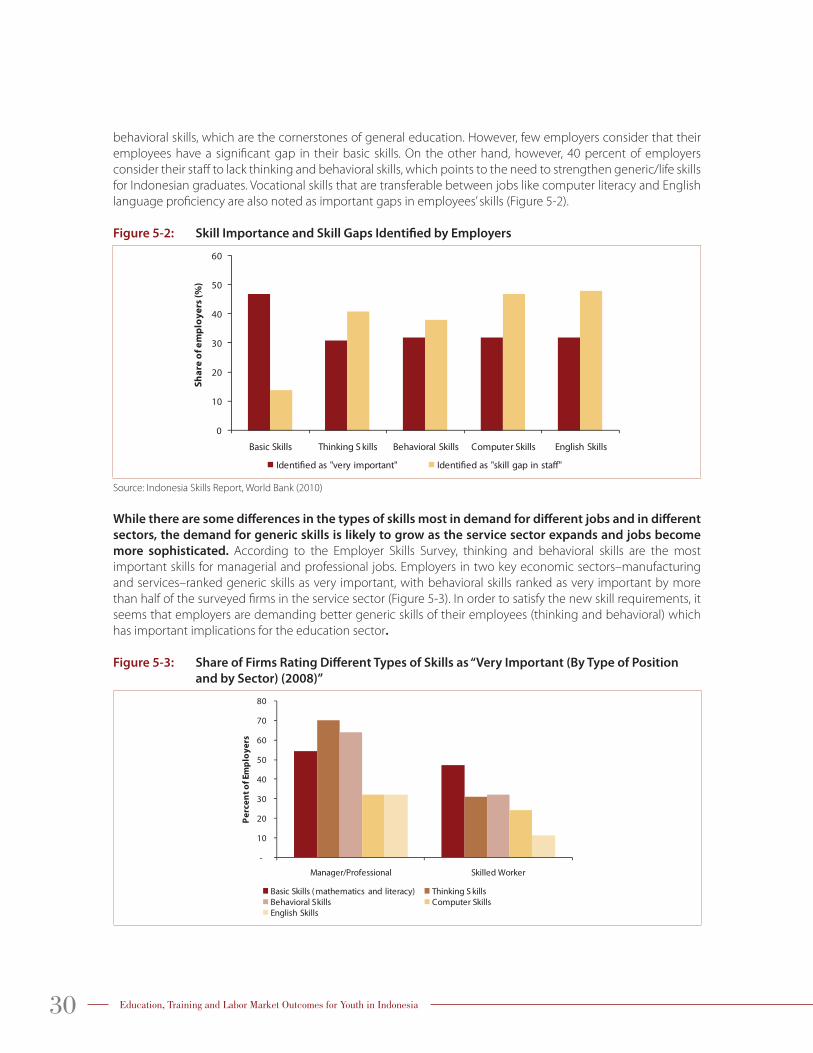
5.2 Generic (Noncognitive Skills)In line with the observed earnings, employers rate basic mathematics and reading skills as very
important, but complain about inadequate generic skills, which may be driving the diffi cult transition
to the labor market.24 Core skills are in high demand, especially basic mathematics and reading, thinking and
23 These are sometimes referred to as “soft skills”.
24 See the Indonesia Skills Report for a complete diagnostic of the skill defi cits and trends in the demand for skills.
30 Education, Training and Labor Market Outcomes for Youth in Indonesia
behavioral skills, which are the cornerstones of general education. However, few employers consider that their
employees have a signifi cant gap in their basic skills. On the other hand, however, 40 percent of employers
consider their staff to lack thinking and behavioral skills, which points to the need to strengthen generic/life skills
for Indonesian graduates. Vocational skills that are transferable between jobs like computer literacy and English
language profi ciency are also noted as important gaps in employees’ skills (Figure 5-2).
Figure 5-2: Skill Importance and Skill Gaps Identifi ed by Employers
0
10
20
30
40
50
60
Basic Skills Thinking S kills Behavioral Skills Computer Skills English Skills
Sh
are
of
em
plo
ye
rs (
%)
Source: Indonesia Skills Report, World Bank (2010)
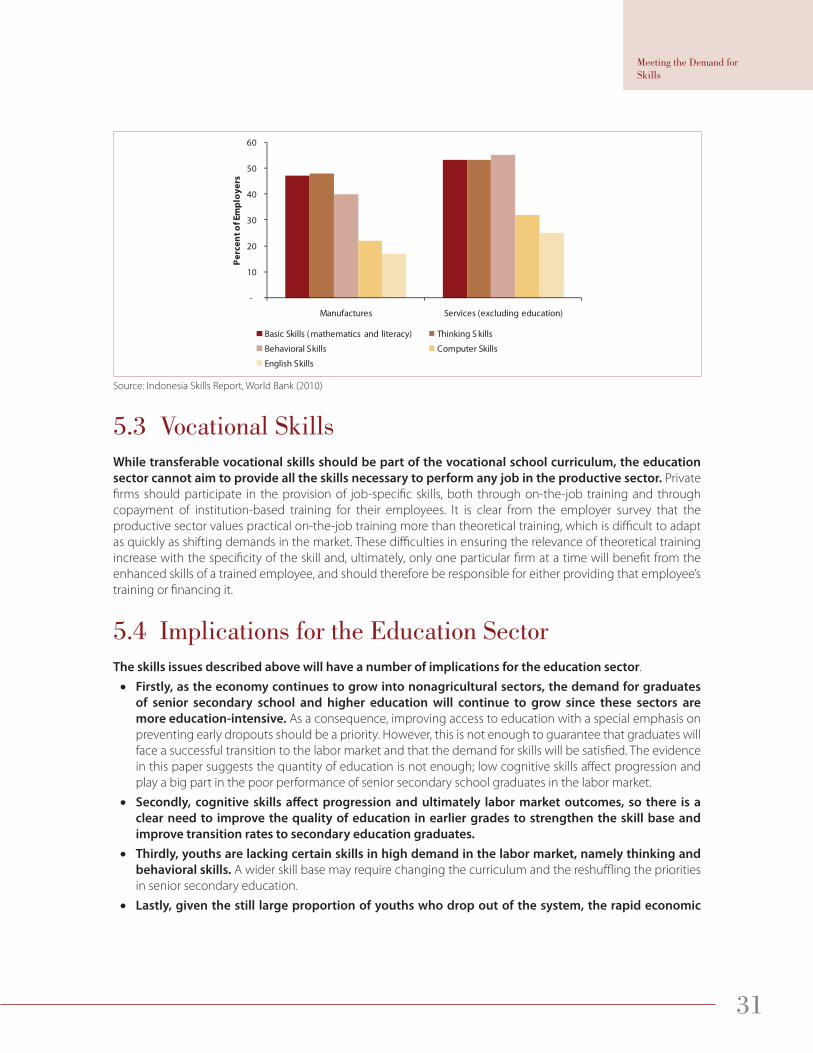
While there are some diff erences in the types of skills most in demand for diff erent jobs and in diff erent
sectors, the demand for generic skills is likely to grow as the service sector expands and jobs become
more sophisticated. According to the Employer Skills Survey, thinking and behavioral skills are the most
important skills for managerial and professional jobs. Employers in two key economic sectors–manufacturing
and services–ranked generic skills as very important, with behavioral skills ranked as very important by more
than half of the surveyed fi rms in the service sector (Figure 5-3). In order to satisfy the new skill requirements, it
seems that employers are demanding better generic skills of their employees (thinking and behavioral) which
has important implications for the education sector.
Figure 5-3: Share of Firms Rating Diff erent Types of Skills as “Very Important (By Type of Position
and by Sector) (2008)”
-
10
20
30
40
50
60
70
80
Manager/Professional Skilled Worker
Pe
rce
nt
of
Em
plo
ye
rs
Basic Skills ( mathematics and literacy) Thinking S killsBehavioral Skills Computer SkillsEnglish Skills
31
Meeting the Demand for Skills
-
10
20
30
40
50
60
Manufactures Services (excluding education)
Pe
rce
nt
of
Em
plo
ye
rs
Basic Skills ( mathematics and literacy) Thinking S kills
Behavioral Skills Computer Skills
English Skills
Source: Indonesia Skills Report, World Bank (2010)
5.3 Vocational SkillsWhile transferable vocational skills should be part of the vocational school curriculum, the education
sector cannot aim to provide all the skills necessary to perform any job in the productive sector. Private
fi rms should participate in the provision of job-specifi c skills, both through on-the-job training and through
copayment of institution-based training for their employees. It is clear from the employer survey that the
productive sector values practical on-the-job training more than theoretical training, which is diffi cult to adapt
as quickly as shifting demands in the market. These diffi culties in ensuring the relevance of theoretical training
increase with the specifi city of the skill and, ultimately, only one particular fi rm at a time will benefi t from the
enhanced skills of a trained employee, and should therefore be responsible for either providing that employee’s
training or fi nancing it.
5.4 Implications for the Education SectorThe skills issues described above will have a number of implications for the education sector.
• Firstly, as the economy continues to grow into nonagricultural sectors, the demand for graduates
of senior secondary school and higher education will continue to grow since these sectors are
more education-intensive. As a consequence, improving access to education with a special emphasis on
preventing early dropouts should be a priority. However, this is not enough to guarantee that graduates will
face a successful transition to the labor market and that the demand for skills will be satisfi ed. The evidence
in this paper suggests the quantity of education is not enough; low cognitive skills aff ect progression and
play a big part in the poor performance of senior secondary school graduates in the labor market.
• Secondly, cognitive skills aff ect progression and ultimately labor market outcomes, so there is a
clear need to improve the quality of education in earlier grades to strengthen the skill base and
improve transition rates to secondary education graduates.
• Thirdly, youths are lacking certain skills in high demand in the labor market, namely thinking and
behavioral skills. A wider skill base may require changing the curriculum and the reshuffl ing the priorities
in senior secondary education.
• Lastly, given the still large proportion of youths who drop out of the system, the rapid economic
32 Education, Training and Labor Market Outcomes for Youth in Indonesia
transformation of the country, and the stock of workers without the proper skills for the demands
of the labor market, there is a clear need for an eff ective training system. The training system should
provide a second chance for dropouts to acquire skills for the job (and help satisfy the demand for skills) and
opportunities for all workers to upgrade their skills, with strong participation by the productive sector in the
defi nition and fi nancing of these training courses to ensure relevance and sustainability.
5.4.1 Providing the Right Mix of Skills in Secondary Education
The evidence in this paper points to the need to broaden the base of both academic and generic skills
for graduates, rather than targeting a large expansion in the number of vocational schools. Labor market
outcomes for both streams are similar and practical on-the-job experience is preferred over theoretical vocational
skills. While it is not possible to determine the right mix of skills empirically, evidence from labor market outcomes
and employer surveys suggest that a stronger base of generic skills is needed. Employers rate basic mathematics,
thinking and behavioral skills as the most sought-after skills when looking for new employees. Technical skills
are also in high demand, but employers value on-the-job experience (in similar jobs, for example) more than
technical training.
In terms of educational stream, a stronger base of generic skills implies increasing these skills in the
curriculum of both the general and the vocational school stream, and potentially shifting vocational
training to later stages. Shifting vocational curricula to later stages of schooling allows students to learn more
general content as a foundation for vocational specialization, and to make informed choices of their career
pathways with more fl exibility. Rapid changes of technologies have led to corresponding changes in demands
for skills, which require workers to have more general, and multiple skills to adapt themselves and the ability to
update their skills through continuous learning. As a result, the main focus of pre-employment vocational training
has shifted from lower secondary level to upper secondary and post-secondary level and many countries have
redesigned their vocational school curriculum and programs to provide sector-wide skills, basic competencies
for vocational preparation and more academic content in general education (Adams 2007).
33
Meeting the Demand for Skills
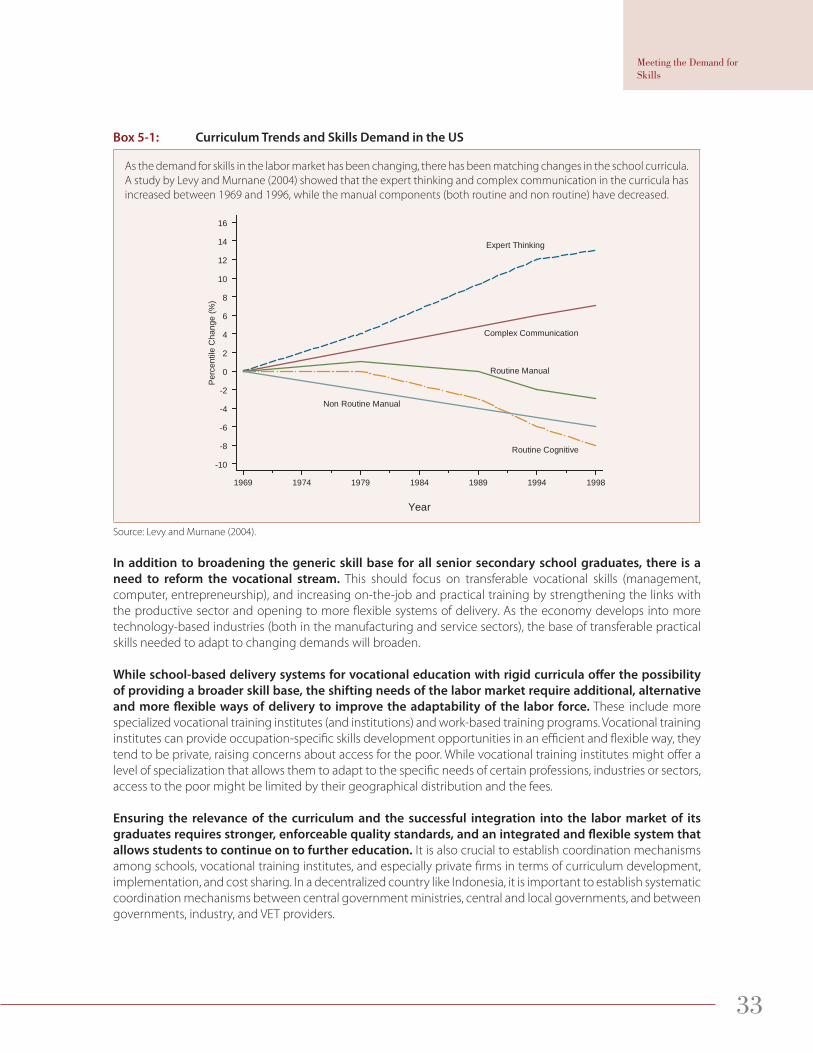
Box 5-1: Curriculum Trends and Skills Demand in the US
As the demand for skills in the labor market has been changing, there has been matching changes in the school curricula.
A study by Levy and Murnane (2004) showed that the expert thinking and complex communication in the curricula has
increased between 1969 and 1996, while the manual components (both routine and non routine) have decreased.
Expert Thinking
Complex Communication
Routine Manual
Non Routine Manual
Routine Cognitive
-10
-8
-6
-4
-2
0
2
4
6
8
10
12
14
16)
%( egnahC elitnec reP
1969 1974 1979 1984 1989 1994 1998
Year
Source: Levy and Murnane (2004).
In addition to broadening the generic skill base for all senior secondary school graduates, there is a
need to reform the vocational stream. This should focus on transferable vocational skills (management,
computer, entrepreneurship), and increasing on-the-job and practical training by strengthening the links with
the productive sector and opening to more fl exible systems of delivery. As the economy develops into more
technology-based industries (both in the manufacturing and service sectors), the base of transferable practical
skills needed to adapt to changing demands will broaden.
While school-based delivery systems for vocational education with rigid curricula off er the possibility
of providing a broader skill base, the shifting needs of the labor market require additional, alternative
and more fl exible ways of delivery to improve the adaptability of the labor force. These include more
specialized vocational training institutes (and institutions) and work-based training programs. Vocational training
institutes can provide occupation-specifi c skills development opportunities in an effi cient and fl exible way, they
tend to be private, raising concerns about access for the poor. While vocational training institutes might off er a
level of specialization that allows them to adapt to the specifi c needs of certain professions, industries or sectors,
access to the poor might be limited by their geographical distribution and the fees.
Ensuring the relevance of the curriculum and the successful integration into the labor market of its
graduates requires stronger, enforceable quality standards, and an integrated and fl exible system that
allows students to continue on to further education. It is also crucial to establish coordination mechanisms
among schools, vocational training institutes, and especially private fi rms in terms of curriculum development,
implementation, and cost sharing. In a decentralized country like Indonesia, it is important to establish systematic
coordination mechanisms between central government ministries, central and local governments, and between
governments, industry, and VET providers.
34 Education, Training and Labor Market Outcomes for Youth in Indonesia
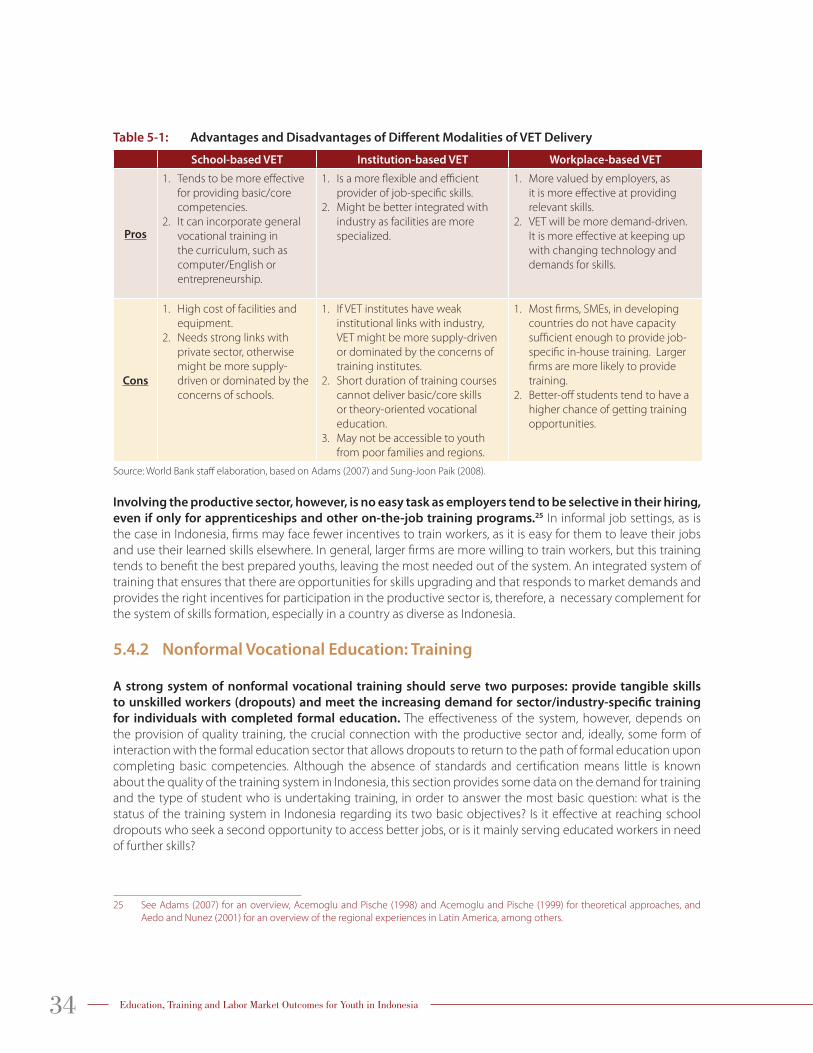
Table 5-1: Advantages and Disadvantages of Diff erent Modalities of VET Delivery
School-based VET Institution-based VET Workplace-based VET
Pros
1. Tends to be more eff ective
for providing basic/core
competencies.
2. It can incorporate general
vocational training in
the curriculum, such as
computer/English or
entrepreneurship.
1. Is a more fl exible and effi cient
provider of job-specifi c skills.
2. Might be better integrated with
industry as facilities are more
specialized.
1. More valued by employers, as
it is more eff ective at providing
relevant skills.
2. VET will be more demand-driven.
It is more eff ective at keeping up
with changing technology and
demands for skills.
Cons
1. High cost of facilities and
equipment.
2. Needs strong links with
private sector, otherwise
might be more supply-
driven or dominated by the
concerns of schools.
1. If VET institutes have weak
institutional links with industry,
VET might be more supply-driven
or dominated by the concerns of
training institutes.
2. Short duration of training courses
cannot deliver basic/core skills
or theory-oriented vocational
education.
3. May not be accessible to youth
from poor families and regions.
1. Most fi rms, SMEs, in developing
countries do not have capacity
suffi cient enough to provide job-
specifi c in-house training. Larger
fi rms are more likely to provide
training.
2. Better-off students tend to have a
higher chance of getting training
opportunities.
Source: World Bank staff elaboration, based on Adams (2007) and Sung-Joon Paik (2008).
Involving the productive sector, however, is no easy task as employers tend to be selective in their hiring,
even if only for apprenticeships and other on-the-job training programs.25 In informal job settings, as is
the case in Indonesia, fi rms may face fewer incentives to train workers, as it is easy for them to leave their jobs
and use their learned skills elsewhere. In general, larger fi rms are more willing to train workers, but this training
tends to benefi t the best prepared youths, leaving the most needed out of the system. An integrated system of
training that ensures that there are opportunities for skills upgrading and that responds to market demands and
provides the right incentives for participation in the productive sector is, therefore, a necessary complement for
the system of skills formation, especially in a country as diverse as Indonesia.
5.4.2 Nonformal Vocational Education: Training
A strong system of nonformal vocational training should serve two purposes: provide tangible skills
to unskilled workers (dropouts) and meet the increasing demand for sector/industry-specifi c training
for individuals with completed formal education. The eff ectiveness of the system, however, depends on
the provision of quality training, the crucial connection with the productive sector and, ideally, some form of
interaction with the formal education sector that allows dropouts to return to the path of formal education upon
completing basic competencies. Although the absence of standards and certifi cation means little is known
about the quality of the training system in Indonesia, this section provides some data on the demand for training
and the type of student who is undertaking training, in order to answer the most basic question: what is the
status of the training system in Indonesia regarding its two basic objectives? Is it eff ective at reaching school
dropouts who seek a second opportunity to access better jobs, or is it mainly serving educated workers in need
of further skills?
25 See Adams (2007) for an overview, Acemoglu and Pische (1998) and Acemoglu and Pische (1999) for theoretical approaches, and
Aedo and Nunez (2001) for an overview of the regional experiences in Latin America, among others.
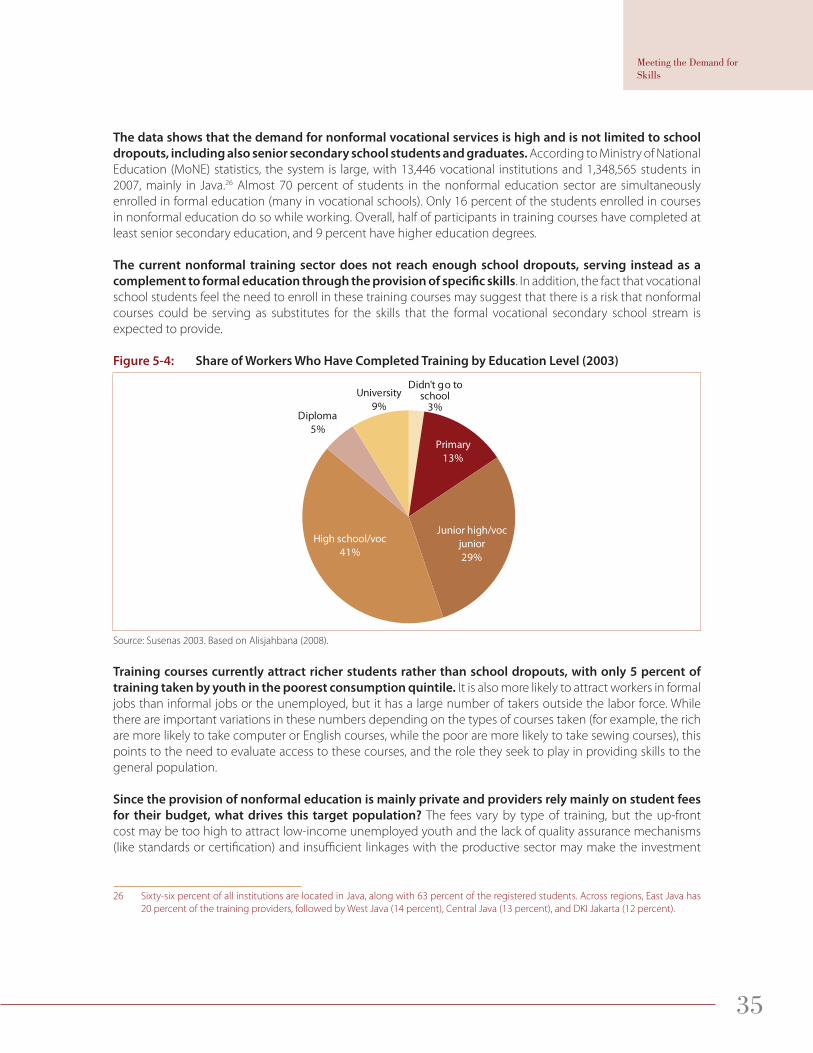
35
Meeting the Demand for Skills
The data shows that the demand for nonformal vocational services is high and is not limited to school
dropouts, including also senior secondary school students and graduates. According to Ministry of National
Education (MoNE) statistics, the system is large, with 13,446 vocational institutions and 1,348,565 students in
2007, mainly in Java.26 Almost 70 percent of students in the nonformal education sector are simultaneously
enrolled in formal education (many in vocational schools). Only 16 percent of the students enrolled in courses
in nonformal education do so while working. Overall, half of participants in training courses have completed at
least senior secondary education, and 9 percent have higher education degrees.
The current nonformal training sector does not reach enough school dropouts, serving instead as a
complement to formal education through the provision of specifi c skills. In addition, the fact that vocational
school students feel the need to enroll in these training courses may suggest that there is a risk that nonformal
courses could be serving as substitutes for the skills that the formal vocational secondary school stream is
expected to provide.
Figure 5-4: Share of Workers Who Have Completed Training by Education Level (2003)
Didn't go toschool
3%
Primary13%
Junior high/voc junior29%
High school/voc41%
Diploma5%
University9%
Source: Susenas 2003. Based on Alisjahbana (2008).
Training courses currently attract richer students rather than school dropouts, with only 5 percent of
training taken by youth in the poorest consumption quintile. It is also more likely to attract workers in formal
jobs than informal jobs or the unemployed, but it has a large number of takers outside the labor force. While
there are important variations in these numbers depending on the types of courses taken (for example, the rich
are more likely to take computer or English courses, while the poor are more likely to take sewing courses), this
points to the need to evaluate access to these courses, and the role they seek to play in providing skills to the
general population.
Since the provision of nonformal education is mainly private and providers rely mainly on student fees
for their budget, what drives this target population? The fees vary by type of training, but the up-front
cost may be too high to attract low-income unemployed youth and the lack of quality assurance mechanisms
(like standards or certifi cation) and insuffi cient linkages with the productive sector may make the investment
26 Sixty-six percent of all institutions are located in Java, along with 63 percent of the registered students. Across regions, East Java has
20 percent of the training providers, followed by West Java (14 percent), Central Java (13 percent), and DKI Jakarta (12 percent).
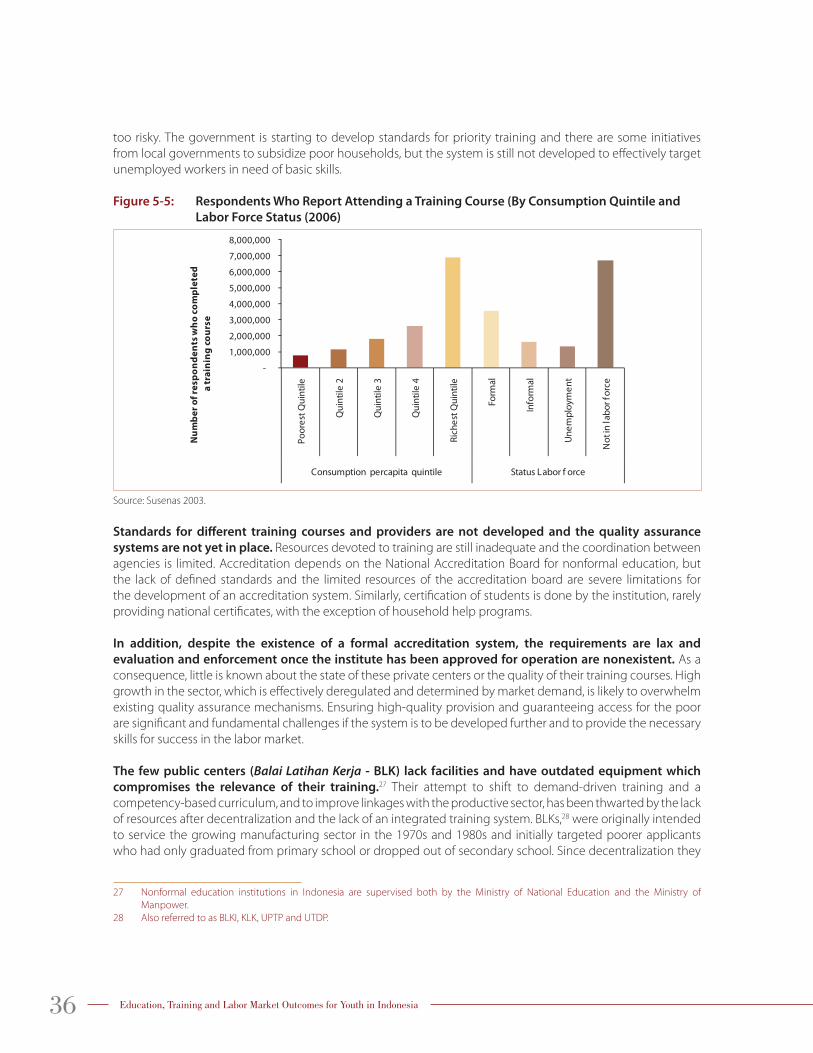
36 Education, Training and Labor Market Outcomes for Youth in Indonesia
too risky. The government is starting to develop standards for priority training and there are some initiatives
from local governments to subsidize poor households, but the system is still not developed to eff ectively target
unemployed workers in need of basic skills.
Figure 5-5: Respondents Who Report Attending a Training Course (By Consumption Quintile and
Labor Force Status (2006)
-
1,000,000
2,000,000
3,000,000
4,000,000
5,000,000
6,000,000
7,000,000
8,000,000
Poor
est Q
uint
ile
Qui
ntile
2
Qui
ntile
3
Qui
ntile
4
Rich
est Q
uint
ile
Form
al
Info
rmal
Une
mpl
oym
ent
Not
in la
bor f
orce
Consumption percapita quintile Status Labor f orce
Nu
mb
er
of
res
po
nd
en
ts w
ho
co
mp
lete
d
a t
rain
ing
co
urs
e
Source: Susenas 2003.
Standards for diff erent training courses and providers are not developed and the quality assurance
systems are not yet in place. Resources devoted to training are still inadequate and the coordination between
agencies is limited. Accreditation depends on the National Accreditation Board for nonformal education, but
the lack of defi ned standards and the limited resources of the accreditation board are severe limitations for
the development of an accreditation system. Similarly, certifi cation of students is done by the institution, rarely
providing national certifi cates, with the exception of household help programs.
In addition, despite the existence of a formal accreditation system, the requirements are lax and
evaluation and enforcement once the institute has been approved for operation are nonexistent. As a
consequence, little is known about the state of these private centers or the quality of their training courses. High
growth in the sector, which is eff ectively deregulated and determined by market demand, is likely to overwhelm
existing quality assurance mechanisms. Ensuring high-quality provision and guaranteeing access for the poor
are signifi cant and fundamental challenges if the system is to be developed further and to provide the necessary
skills for success in the labor market.
The few public centers (Balai Latihan Kerja - BLK) lack facilities and have outdated equipment which
compromises the relevance of their training.27 Their attempt to shift to demand-driven training and a
competency-based curriculum, and to improve linkages with the productive sector, has been thwarted by the lack
of resources after decentralization and the lack of an integrated training system. BLKs,28 were originally intended
to service the growing manufacturing sector in the 1970s and 1980s and initially targeted poorer applicants
who had only graduated from primary school or dropped out of secondary school. Since decentralization they
27 Nonformal education institutions in Indonesia are supervised both by the Ministry of National Education and the Ministry of
Manpower.
28 Also referred to as BLKI, KLK, UPTP and UTDP.
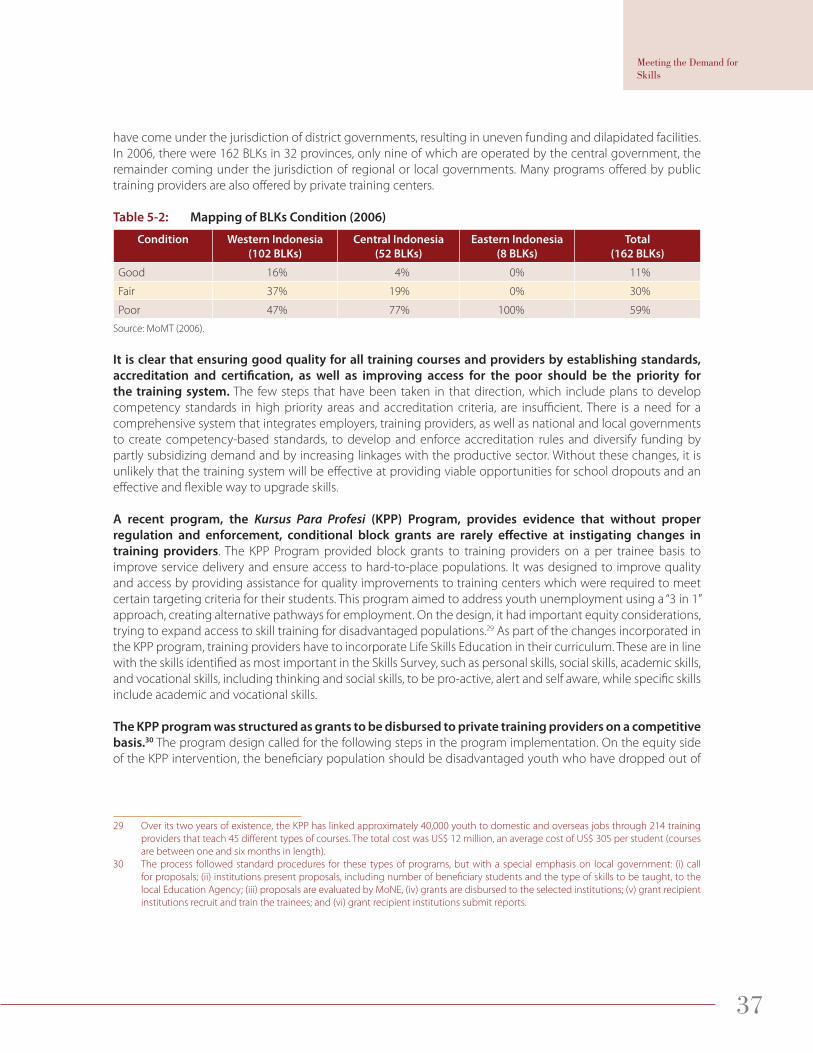
37
Meeting the Demand for Skills
have come under the jurisdiction of district governments, resulting in uneven funding and dilapidated facilities.
In 2006, there were 162 BLKs in 32 provinces, only nine of which are operated by the central government, the
remainder coming under the jurisdiction of regional or local governments. Many programs off ered by public
training providers are also off ered by private training centers.
Table 5-2: Mapping of BLKs Condition (2006)
Condition Western Indonesia
(102 BLKs)
Central Indonesia
(52 BLKs)
Eastern Indonesia
(8 BLKs)
Total
(162 BLKs)
Good 16% 4% 0% 11%
Fair 37% 19% 0% 30%
Poor 47% 77% 100% 59%
Source: MoMT (2006).
It is clear that ensuring good quality for all training courses and providers by establishing standards,
accreditation and certifi cation, as well as improving access for the poor should be the priority for
the training system. The few steps that have been taken in that direction, which include plans to develop
competency standards in high priority areas and accreditation criteria, are insuffi cient. There is a need for a
comprehensive system that integrates employers, training providers, as well as national and local governments
to create competency-based standards, to develop and enforce accreditation rules and diversify funding by
partly subsidizing demand and by increasing linkages with the productive sector. Without these changes, it is
unlikely that the training system will be eff ective at providing viable opportunities for school dropouts and an
eff ective and fl exible way to upgrade skills.
A recent program, the Kursus Para Profesi (KPP) Program, provides evidence that without proper
regulation and enforcement, conditional block grants are rarely eff ective at instigating changes in
training providers. The KPP Program provided block grants to training providers on a per trainee basis to
improve service delivery and ensure access to hard-to-place populations. It was designed to improve quality
and access by providing assistance for quality improvements to training centers which were required to meet
certain targeting criteria for their students. This program aimed to address youth unemployment using a “3 in 1”
approach, creating alternative pathways for employment. On the design, it had important equity considerations,
trying to expand access to skill training for disadvantaged populations.29 As part of the changes incorporated in
the KPP program, training providers have to incorporate Life Skills Education in their curriculum. These are in line
with the skills identifi ed as most important in the Skills Survey, such as personal skills, social skills, academic skills,
and vocational skills, including thinking and social skills, to be pro-active, alert and self aware, while specifi c skills
include academic and vocational skills.
The KPP program was structured as grants to be disbursed to private training providers on a competitive
basis.30 The program design called for the following steps in the program implementation. On the equity side
of the KPP intervention, the benefi ciary population should be disadvantaged youth who have dropped out of
29 Over its two years of existence, the KPP has linked approximately 40,000 youth to domestic and overseas jobs through 214 training
providers that teach 45 diff erent types of courses. The total cost was US$ 12 million, an average cost of US$ 305 per student (courses
are between one and six months in length).
30 The process followed standard procedures for these types of programs, but with a special emphasis on local government: (i) call
for proposals; (ii) institutions present proposals, including number of benefi ciary students and the type of skills to be taught, to the
local Education Agency; (iii) proposals are evaluated by MoNE, (iv) grants are disbursed to the selected institutions; (v) grant recipient
institutions recruit and train the trainees; and (vi) grant recipient institutions submit reports.
38 Education, Training and Labor Market Outcomes for Youth in Indonesia
school, but the rules were hard to verify,31 including the applicant’s employment situation. Once selected, the
training institutions received a block grant ranging from US$ 21,000 to US$ 42,000 (diff erences came for diff erent
costs per student based on the type and length of training they are getting), which despite some guidelines on
how to spend it, was up to the institution to manage.
The experience shows that while there is some evidence of positive outcomes for participants, changing
the behavior of training centers through block grants is very diffi cult. Since participation was not random,
nor did it follow any quantifi able rules, controlling for selection bias in the assessment was impossible. As a
consequence, the evidence of the benefi ts for participants relies on simple comparisons of wages, which
show some positive signs among participants, especially those who moved to foreign countries. In terms of
employment, most fi nd jobs after three or four months, but since most had previous work experience, it is
diffi cult to disentangle the eff ect of participating in the training from the probability of employment.
The block grant was an insuffi cient incentive to change targeting mechanisms of the training providers,
as the population served by KPP was similar to the overall population who previously received training.
Despite rules for selecting school dropouts, 77 percent of training in nonhousehold help programs was done by
youths who completed senior secondary school. The proportion is lower for household help programs, with 80
percent of trainees having completed less than senior secondary school. The gender composition looks similar,
with more women participating in training than men (100 percent when looking at household help training).
The eff ect on the quality of the training is also unclear, as there is no evidence of major changes in the
spending patterns of institutions. Institutions state that they used most of the grant amount to cover personnel
and operational costs, reporting some increases in the number of teachers. The quality of services appears to
increase only slightly according to surveys, but this information did not include any quantitative measures, only
perceptions. The program’s required targeting rules were not followed by a majority of institutions, and there is
no evidence of major changes in their operations. Some students were charged even though the block grant
was intended to cover the student’s tuition costs. There is only limited information about how institutions spent
the block grant, with some indication that they spent it evenly across the same expenditure categories they had
previously.
It is evident from the KPP experience that block grants by themselves are unlikely to incentivize training
providers to improve quality or change targeting mechanisms. The goal of increasing access for the poor,
therefore, needs to be accompanied by demand-side interventions or stronger enforcement of targeting rules
linked to block grants, which are more easily enforced if accreditation systems are in place. Similarly, block grants
are unlikely to produce big quality improvements if they are not linked to competency-based standards and
incentives for accreditation. A comprehensive quality control system is, therefore, essential to improve the equity
and the relevance of the current training system in Indonesia.
31 The selection of participants had to meet the following criteria: (i) 18-35 years old; (ii) school dropout, but with a minimum education
level of a junior secondary graduate (including Paket B); (iii) unemployed; (iv) enthusiasm to learn to work demonstrated by a letter
of intent; (v) residency in the area in which the program is administered; and (vi) active students are not eligible to participate in the
program.
39
Meeting the Demand for Skills
Box 5-2: The Role of Entrepreneurship Programs: The International Evidence
Entrepreneurship programs have been promoted in diff erent countries to improve the employment prospects of youth.
However, despite the importance of self-employment in reducing youth unemployment in the developing world, there
is little evidence on what type of policies may improve the productivity of such endeavors. In a recent study, Betcherman
(2007) has compiled a world-wide inventory of the interventions that are designed to integrate young people into the
labor market, including interventions that support youth entrepreneurships. This Youth Employment Inventory (YEI) is
based on available documentation of current and past youth employment programs and includes evidence from 289
studies of interventions from 84 countries in all regions of the world. The YEI includes programs designed to facilitate the
transition of young people into the labor market, with a focus on disadvantaged young people.
The overall fi nding from a wide range of countries is that these programs lead to positive outcomes although, due to
the small sample size, it is hard to draw universal conclusions from this fi nding. In addition, once cost-eff ectiveness is
taken into account along with labor market impacts, fewer than half of the programs in the inventory could be judged
as successful. As the interventions to support youth employment tend to be diff erent, the YEI classifi es them into nine
categories, one of which, “improving chances for young entrepreneurs” (which represents 11 percent of the sample)
deals with self entrepreneurship. The young entrepreneurship interventions provided assistance, either fi nancial,
technical, and/or training, to youth who are starting their own business.
Some key elements for the success of these programs appear to be:
• Market-oriented training: Skills training needs to be aligned with the demands of clients and of the market
place.
• Business Development Services: Providing Business Development Services, including mentorship, to support
the entire business planning, execution, management and growth cycle.
• Market linkages: Young people are linked to business opportunities through diff erent mechanisms including a
youth portal, and youth connect phone line.
• Access to fi nance: Young entrepreneurs are provided access to startup and growth capital to launch and grow
their businesses.
40
Section 6
Conclusions and Recommendations
This report has explored the transition of youth into the labor market, and the implications for the
formal education and the training sector, highlighting the generally slow transition to the labor market
and the diffi culty for educated workers to access good quality jobs, especially senior secondary school
graduates. Even though macro-economic trends would suggest that the demand for skills in Indonesia is
sustained, the employment trends for educated workers are lagging economic growth in nonagricultural sectors
which tend to be more education intensive. The evidence points to the role of skills in this slow transition, with
a poor base of cognitive skills, especially for low-income students, and the poor quality of a high proportion of
senior secondary school graduates as reported by employers. In short, despite the higher schooling achievement
of younger generations, it is not clear that senior secondary school graduates are entering the labor market with
the skills necessary to fi nd good quality jobs.
Judging by the trends towards more technology-based industries and a service-oriented economy,
there is a need to meet the demand by employers for skilled workers with a stronger base of soft skills. In
addition, employers underscore the importance of practical skills, especially those learned on the job, so a more
fl exible approach that combines a stronger adaptable skill base with more practical and on-the-job training is
likely to be more eff ective at improving the employability of young graduates. The conclusions from this report
provide some guidance for the direction of future reforms, as well as pointing out areas where further work is
crucial at this stage of Indonesia’s economic and institutional development.
The following recommendations are made as a means of improving the future direction of Indonesia’s general
and vocational education system:
• Focus on preventing early dropouts and improve the quality of basic education: School dropouts only
have access to poor quality jobs, initially as unpaid workers and eventually as self-employed workers.
Their salary profi le is fl at throughout their working lives, remaining near the minimum wage. They are
much more likely to be employed in the agricultural sector and unlikely to have access to formal jobs
in the future. In addition, the existing training system is of limited eff ectiveness in providing a second
chance for these students, so preventing them from dropping out is likely to have long-lasting eff ects.
41
Conclusions and Recom-mendations
• Improve cognitive skills of students before they reach senior secondary education and ensure an adequate supply of senior secondary schools in the desired stream: Although further work is needed
to adequately assess the reasons for early dropouts, there is some evidence that returns to education
are falling and that they are largely dependent on parental education, which may drive early dropouts
by poor students who regard senior secondary education as having uncertain returns given their socio-
economic situation. An additional constraint seems to be that cognitive skills and socio-economic
characteristics are highly correlated with the senior secondary school stream attended, which also has
important eff ects on future earnings.
• There is a need to take a closer look at the supply and demand for senior secondary education, with a special emphasis on the availability of public senior secondary schools: Poor students, who also tend
to have lower cognitive skills for various reasons, are more likely to attend private vocational schools,
partly because public general schools are selective about their students as a result of oversubscription.
In turn, these schools are shown to have smaller returns and higher costs, so the expected return of
senior secondary education for poor students is likely to be signifi cantly smaller than the average returns
observed in the data. Consequently, there is a need to ensure that the system does not eff ectively result
in a sorting of poorer students into private vocational schools of uncertain quality and economic return
and richer students into the public general stream.
• Do not plan supply-driven expansions of vocational school, but focus on broadening the skill base and improving quality: While the correct mix of general and vocational education is hard to determine
empirically, there is signifi cant evidence to argue against a large supply-driven expansion of vocational
schools. The evidence points instead to the need to provide a broader set of skills for secondary education
students, either through postponing vocational education or by including more generic skills in the
vocational stream, as well as ensuring a better quality of education in both streams. There is evidence of
the need to strengthen basic skills and competencies for secondary school graduates, mostly through
improvements in education quality and partly through shifting vocational education to a later stage.
• Explore alternative modes of delivering vocational education, increasing practical training and linkages with the private sector: Convincing the productive sector to participate in these programs
might prove a diffi cult task, but the eff ectiveness of this type of education increases dramatically when
it is linked eff ectively with the productive sector. On equity grounds, particular attention should be paid
to compensating for the tendency of fi rms to choose the best students to participate in these programs.
The observed inequalities in learning outcomes by socioeconomic characteristics suggest that active
targeting mechanisms (in the form of explicit rules or subsidies, for example) are needed to guarantee
access to these programs for poorer students.
• Improve the capacity of the nonformal training system to compensate the lack of skills, as well as provide a viable way to train unskilled workers and retrain and upgrade skills for educated workers: The current system is not reaching enough dropouts, focusing disproportionately on richer youth and
senior secondary graduates. There is a need to improve access to training for the poor. Defi ning the
public role in regulation, provision and/or fi nancing and improving the coordination of institutions
involved in training (Ministry of National Education, Ministry of Manpower) and accreditation agency
certifi cation is a fi rst step, but diff erent modalities of fi nancing and subsidies through providers, trainees
or fi rms can be explored to increase the participation rates of lower-income unemployed youth in
training programs.
• Strengthen quality assurance mechanisms through the establishment of competency-based standards and a clear and enforceable accreditation mechanism. As the KPP experience shows,
42 Education, Training and Labor Market Outcomes for Youth in Indonesia
in the absence of quality assurance mechanisms and eff ective supervision tools, block grants have
some limitations as a means to elicit changes in the training providers that lead to improved quality
of instruction. The GoI is initiating the establishment of competency-based curricula and national
certifi cation, but more resources and stronger coordination are needed to accelerate these reforms.
• Entrepreneurship programs may be a viable way to assist youth to improve earnings prospects, but they are not substitutes for providing adequate and relevant skills for the labor market: Furthermore,
the constraints to successful entrepreneurship are many and interventions need to be carefully
designed to address binding constraints in the country context. The existing international evidence
on the eff ectiveness of entrepreneurship programs emphasizes the importance of determining the
exact constraints that entrepreneurs face in order to design policies that are appropriate to the country
context, so more analysis should be carried out to understand the characteristics of entrepreneurs and
their particular needs in Indonesia. Entrepreneurship training, however, is only a step, and it is not a
substitute for the provision of eff ective skills for the labor market, which entrepreneurs also need for
success. Thus, entrepreneurship training is not a substitute, but a complement to a strong cognitive
and generic base of skills for success in the labor market, and in itself it is unlikely to create successful
enterprises and have a signifi cant impact on the quality of jobs for youth.
43
References
Acemoglu, D., and J-S. Pischke. 1998. Why Don’t Firms Train: Theory and Evidence. Quarterly Journal of Economics,
108(1): 79–120.
––– 1999. Beyond Becker: Training in Imperfect Labour Markets. Economic Journal, 109(453): F112–142.
Adams, A.V. 2007. The Role of Youth Skills Development in the Transition to Work: A Global Review. Washington, DC:
The World Bank.
Aedo, C., and S. Nunez. 2001. The Impact of Training Policies in Latin America and the Caribbean: The Case of Programa
Joven. Adelaide: National Center for Vocational Education Research.
Almeida, R.K. 2009. Openness and Technological Innovation in East Asia: Have They Increased the Demand for
Skills? Social Protection Discussion Paper No 0919. Washington DC: The World Bank.
Betcherman, G., M. Godfrey, S. Puerto, F. Rother, and A. Stavreska 2007. Global Inventory of Interventions to Support
Young Workers: Synthesis Report. Washington DC: The World Bank.
Chen, D. 2009. Vocational Schooling, Labor Market Outcomes, and College Entry. Policy Research Working Paper
4814. Washington DC: The World Bank.
Central Bureau of Statistics (BPS). Various editions. Susenas (National Labor Force Survey). Jakarta: BPS.
––– various editions. Sakernas. Jakarta: BPS.
Garcia-Verdú, R., W. Cunningham, L. McGinnis, C. Tesliuc, and D. Verner. 2008. Youth at Risk in Latin America and the
Caribbean. Understanding the Causes, Realizing the Potential. Washington DC: The World Bank.
Heckman, J.J., and B. Jacobs. 2010. Policies to Create and Destroy Human Capital in Europe. IZA Discussion Paper
No. 4680. Bonn: Institute for the Study of Labor.
Islam, N.. 2009. Creating Alternative Pathways to Employment: An Assessment of the KPP Program. Unpublished
background paper. Jakarta: World Bank.
44 Education, Training and Labor Market Outcomes for Youth in Indonesia
Jensen, R. 2010. The Perceived Returns to Education and the Demand for Schooling. Brown University Working
papers, viewed <http://www.humanterrainthefi lm.org/pub/Jensen_Perceived_Returns_Schooling.pdf
Luque, J. 2008. In search of the right mix of secondary education, Unpublished background report for World
Bank. Jakarta, Indonesia.
Levy and Murnane (2004), The New Division of Labor: How Computers are Creating the Next Job Market (Princeton
University Press, 2004).
Malamud, O., and C. Pop-Eleches. 2008. General Education vs. Vocational Training: Evidence from an Economy in
Transition. NBER Working Paper No. 14155. Cambridge MA: National Bureau of Economic Research.
Ministry of National Education (MoNE). Various editions. Indonesia’s Education in Brief. Jakarta: Ministry of National
Education.
–––.2008. Getting Acquainted with Technical and Vocational Education in Indonesia. Jakarta: Ministry of National
Education.
––– 2008. Rencana Strategis Departemen Pendidikan Nasional Tahun 2005-2009 (Strategic Plan of the Ministry of
National Education 2005-2009). Jakarta, Ministry of National Education.
Newhouse, D., and D. Suryadarma. 2009. The Value of Vocational Education: High School Type and Labor Market
Outcomes in Indonesia. Policy Research Working Paper 5035. Washington DC: The World Bank.
Paik, S-J. 2008. Skills Development Strategy: Pre-employment VET investment – the Korean Case. Unpublished
background report for the World Bank.
Patil, P. 2008. Bekerja/Life Skills for Education Employment and Entrepreneurship (LSE3) PAD, Annex. Jakarta:
World Bank.
Stasz, C.. 2001. Assessing Skills for Work: Two Perspectives. Oxford Economic Papers, 53(3); 385-405.
World Bank. 2009. Labor Market Trends in Indonesia, Indonesia Jobs Report. Jakarta: The World Bank.
World Bank. 2010. Indonesia Skills Report: Trends in Skills Demand, Gaps and Supply in Indonesia. Jakarta: World
Bank.
World Development Indicators

