ed 272 763 cz 044 902
TRANSCRIPT

ED 272 763 CZ 044 902
TITLEINSTITUTIONVOB DATENOTEPUB TYPE
EDRS PRICEDESCRIPTORS
IDENTIFIERS
Income Tax Reform and Agriculture: A Symposium.Economic Research Service (DOA), Washington, D.C.Aug 8661p.; Colored ink may affect reproducibility.Collected Works - Conference Proceedings (021) --Reports - Descriptive (141)
MF01/PC03 Plus Postage.Adults; Agricultural Education; *Agriculture;Farmers; *Finance Reform; *Public Policy; *ResourceAllocation; *Taxes; Vocational Education*Income Taxes
ABSTRACTFive papers are provided from a symposium organized
to present several economic studies relating to income tax structureand reform in agriculture. "Toward an Optimal Income Tax Policy forSouthern and U.S. Agriculture" (Harold F. Breimyer) is a structuredargument for comprehensive tax reform that increases the equity ofthe income tax system among farmers. "A Comparison of Effects of theCurrent Tax Law through the Tax Reform Act of 1984 and the 1985Proposed Tax Act on Commercial Farms in Texas, Mississippi, andIllinois" (Clair J. Nixon, James W. Richardson) presents amathematical programming model of farms representing southern andmidwestern agriculture. "Tax and Agricultural Policy: Interlinkagesand Reform" (Kenneth Baum, et al.) provides a comprehensiveexamination of tax policy and commodity policy interrelationships."Farmer Preferences for Tax Reform Issues Using Multi-Chotomous LogitAnalysis" (Daniel M. Otto, Gregory D. Hanson) presents a large surveyof farmer attitudes toward tax reform and tax policy effects inagriculture. "Effects of Income Tax Reform on Agriculture: Review andNew Evidence" (Sermin D. Hardesty, Hoy F. Carman) evaluates symposiumfindings within the context of research regarding agriculturalresponse to changing income tax law. (YLB)
*****************Reproduction
*****************
****************************************
s supplied by EDRS are the best that canfrom the original document.
****************************************
*********
be made
*********
United StatesDepartment ofAgriculture
r4N EconomicResearch
,,C1 Service
Nationaltv EconomicsDivision
CZ1
Income Tax Reformand Agriculture:A Symposium
U.S. DEPARTMENT OP EDUCATION0f14 of Educational Research and Improvement
ED ATIONAL RESOURCES INFORMATIONCENTER (ERIC)
his document has been reproduced as
roostisad from Ina person Or Organizationoriginating it,
0 Minor changes have been made to improvereproduction quality
Points of view or Opinions stated in this documint do not neCallarity represent officialOERI Position or policy
2

INCOME TAX REFORM AND AGRICULTURE: A SYMPOSIUM. lqational Economics Division,Economic Research Service, U.S. Department of Agriculture, Wasnington, D.C.2W05-4788. August 1986. ERF Statf Report No. aGES8b0203.
ABSTRACT
Income tax reform became a key issue in agriculture in tne 1970's and 196U's.Empirical evidence based upon economic modeling at representative farms andstatistical analysis of farmer responses to a tax policy survey, suggests thatbroad tax reform such as proposed by the U.S. Department ot Treasury would lowerfarm taxes and would also receive substantial support among farmers. Tne inter-linkages among tax policy and commodity program policies were found to be pervasive,and the implications of this for tax reform are developed. a broad, politicaleconomy approach to tax misallocation effects in agriculture and the benefits oftax reform is presented. Discussion of the symposium papers and presentztion otan alternative economic approach to analyzing tax reform effects are presentedin the final two papers.
Keywords: Income tax, tax reform, tax equity, logit, mathematical programming,resource allocation, dynamic modeling.
********************************************************************************* This report was reproduced tor limited distribution to the research communicy** outside the U.S. Department of Agriculture.
********************************************************************************
3iii

PREFACE
This symposium was organized by Leon Geyer and Gregory Hanson for the 1984 annualmeeting of the Southern Agricultural Economics Association, in Jackson,Mississippi. Agricultural tax issues had become a subject of increasing debatein agriculture. Tax management became an important component of farm businessmanagement during the 1970's-80's as nominal farm incomes rose substantially.Tax saving deductions and credits of the Federal Income Tax Code were expandedand State income and Social Security taxes tended to become larger for manyfarmers. Large incentives existed to lower effective tax rates through income,expense, and invest.ment management.
Active tax management appears to have resulted In reduced tax burdens and alsoin resource misallocation in the farm sector. Decisions were often made basedprimarily upon tax reduction rather than economic incentives. Many agricultural
economists became concerned that the income tax system was exerting a profoundstructural effect that encouraged farm expansion with financial leverage. Tax
reform was analyzed as an option to lower tax system price and to increase taxsystem equity among farmers.
This symposium was organized to present several economic studies relating toincome tax structure and reform in agriculture. The first four papers presentedtwo empirical studies and two broad treatments of tax and interrelated commoditypolicies, providing a balance of economic modeling and general economic insights.
Specific subject areas of papers in the session include, first, a strong, structuredargument for comprehensive tax reform that increases the equity of the income taxsystem among farmers. The second paper presents a mathematical programming modelof farms representing southern and midwestern agriculture. The third paperprovides a particularly comprehensive examination of tax policy and commoditypolicy interrelationships. The fourth paper presents perhaps the first largesurvey of farmer attitudes toward tax reform and tax policy effects in agriculture.
The symposium papers were critiqued at the session and revisions were suggestedby the discussant, B.R. Eddleman. In addition, Sermin Hardesty and Hoy Carmanwere requested to edit and review the session papers, and to prepare an additionalreview of tax reform issues. Gregory Hanson provided project coordination and
editing with the assistance o" Diane Bertelsen.
4
iv
CONTENTSPage
TOWARD AN OPTIMAL INCOME TAX POLICY FOR SOUTHERN AND U.S. AGRICULTURE. 1
Harold F. Breimyer
References 4
A COMPARISON OF EFFECTS OF THE CURRENT TAX LAW THROUGH THE TAX REFORMACT OF 1984 AND THE 1985 PROPOSED TAX ACT ON COMMERCIAL FARMS IN TEXAS,MISSISSIPPI, AND ILLINOIS
Clair J. Nixon and James W. Richardson6
Tax Reforms 6Simulation Model 10Representative Farms 12Simulation Results 14Summary and Conclusion 16References 16
TAX AND AGRICULTURAL POLICY: INTERLINKAGES AND REFORM 18Kenneth Baum, L. Leon Geyer, Jim Johnson, and Ron Durst
Introduction 18Economic Methodology 18The Farm Sector Today 21Federal Farm Programs Today 21Federal Tax Policy and the Farm Sector: An Overview 22Monitoring the Effect of Tax and Financial Stress in CommodityPolicy and the Cattle Sector 25
Summary and Conclusions 30References 31
FARMER PREFERENCES FOR TAX REFORM ISSUES USING MULTI-CHOTOMOUS LOGITANALYSIS 33
Daniel M. Otto and Gregory D. Hanson
Introduction 33Theory and Related Literature 33The Data 34The Empirical Model 34Study Results 35Summary and Conclusions 40References 41Appendix: The Logit Model 41
INCOME TAX REFORM AND AGRICULTURE: DISCUSSION 43B.R. Eddleman
Optimal Income Tax Policy for Agriculture 43Income Tax, Farm Commodity Policy, and Economic Change 44Farmers' Attitudes Toward Income Tax Reform 46

Page
Summary 47
Reference 48
EFFECTS OF INCOME TAX REFORM ON AGRICULTURE: REVIEW AND NEW EVIDENCE. 49
Sermin D. Hardesty and Hoy F. Carman
Introduction 49
Special Agricultural Tax Rules 49
Economic Recovery Tax Act of 1981 50
Treasury's Tax Reform Proposal 51
Summary and Concluding Comments 52
References 54
6
vi
Income Tax Reform and Agriculture:
A Symposium
TOWARD AN OPTIMAL INCOME TAX POLICY FORSOUTHERN AND U.S. AGRICULTURE
Harold F. iirelmyer*
"Taxation is . . . a demonstration of ideological belief. Tnus in timesof intellectual change the tax /aws become exceptionally important."
--Joseph Logos
Of all the instruments of Government, other than its autnority to declare war,none bears so incisively on the welfare of citizens--privately and in theireconomic enterprise--as does the power to tax.
Years ago the principles of taxation were as much a part of the teacning ofeconomic theory as was "eventually declining marginal physical returns." Bysharp contrast, most textbooks of recent years have given only passing attentionto theory of taxation. In works on agricultural policy, Tweeten allocates threepages to the subject, Paarlberg one page, Halcrow (1977) perhaps five pages,Halcrow (1984) about 10 pages, and Knutson, Penn, and Boenm four pages. Amonggeneral policy texts, Samuelson and McConnell in successive editions touch ontaxes only here and there. However. McConnell in 1984, apparently inspired byReaganism and supply-side economics, does appreciably better.
Farmers as individuals, farm business units, and agriculture as a sector arehighly sensitive to tax policy. Agriculture can be influenced as mucn by taxpolicy in all its ramifications as by commodity price-support policy. Thefarm policy texts referred to devote inch-thick sections to tne latter topic.
This paper addresses income tax policy. It manifestly is only a subportion ofthe economics of taxation in general. Income taxes nave crowded property taxesout of the tax-policy limelignt. More significant, thougn, is that the incometax policy bearing on agriculture is not singular to the sector. A favoriteFaarlberg phrase trumpets how agriculture is losing its uniqueness (pp. J-13).Income tax policy bearing on agriculture is not uniquely agricultural; moreover,it focuses not so mucn on the equity or incentive effects of the incom% tax as onhow tax shelters bear on investment.
To draw on Paarlberg phraseology once again, in the mid-198O's income taxes areon the farm policy agenda kp. 14). They were put there not by agriculturaleconomists nor by the agricultural establisnmeut. We could almost say tney gotthere by force of circumstance, but in 198j the luminosity surrounding income tax
* Harold F. Breimyer is a professor emeritus of tne University of Missouri-Columbia.
1

policy Is attributed in large measure to proposals advanced earlier by threeSenators (Kemp, Kasten, and Bradley), one Congressman (Gephardt), and uonaldRegan as Secretary of the Treasury. The proposals were variously ca6ged as tax
reform or simplification.
For teaching the principles of taxation, the time-honored trilogy is still
appropriatethat taxes serve to raise revenue, influence distribution of wealthand income, and encourage or discourage particuiar forms of economic activity.Invariably a stock response comes back: why can't a tax do one but not theothers? To be sure, it is conceivably possible to manipulate one feature oftaxation while trying to minimize the effect on the other two. But multipleconsequences are implicit in any taxation policy.
Attributes of a tax system add at least one further consideration, namely,efficiency of collection. This is often expressvd in the opposite language,ease of evasion.1/
Any review of objectives runs into economists' tendency to oversimplify. Yet
few, if any, economic policies have a single goal. Host have numerous goals tnatare partially conflicting. If we deal with them responsibly, we find ourselvesuncomfortable in an indeterminate situation. But so it is in a democracy.Democracy must be the messiest system of government ever devised.
With regard to choosing an optimal income tax policy for agriculture, the keyword is the adjective, optimal. Worth noting, though, is that limiting tne scopeto income taxes invites too thin an examination of taxation in agriculture. Abasic issue that will not go away is now much to rely on real property taxationversus income taxation. This has important jurisdictional aspects as well aseconomic ones. Cratrary to what is now a popular viewpoint, a weii-designed realproperty tax ha, merit. However, it falls under a shadow fur twu reasons, namely,that income from property is variable, and that so much property nowadays is notreal and readily escapes comparable taxiation.
Whatever else about taxation may be mired in some degree of dubiosity, one eventin the economic history of our Nation is of unquestioned significance. It is tnelandmark action of 1913 to adopt an income tax of progressive rate structure. To
be sure, we had an income tax briefly during the Civil War, and a similar tax wadlegislated in 1894. But conservative Supreme Courts took a negative stand untlla constitutional amendment finally made it clear that the American tradition wasnot violated by taxing in accordance with ability to pay--tnat ability teingmeasured by flow of income, not static possession of property.
Only the most egregious cynic or rightist ideologue would reject tne ability-to-pay ethic summarily. But like all abstractions, when examined it revealscomplications. Offered here is only the comment that implicitly we treat abilityto pay not just in terms of income derived from native talent and effort, butequally as much (or perhaps even mOre) as that arising from rent, luck, andimperfections in the economy. Implicitly we customarily make a distinction betweennormal and economic profits. The American ethic carries a preference tor taxing
1/ Yet another piece in the puzzle is the user charge principle. is a usercharge a tax? Not, presumably, when it pays for services rendered. BLit what
about the social security "tax"? Is it only a user charge tor buyihg an annuity?A warning against too facile a response is in order. It our Federal revenues nowfinance primarily an armed camp and a welfare state, maybe most Federal taxationis user charge. This is an interesting conundrum.
2

economic profit--rent, unearned income, and similarly designated Kinds of casnflow. Manifestly, it is easier to apply the principle in taxing business incomethan wages and salaries ot individuals. For the latter, we nave essentialiydepended on progressivity alone.
But the policy that has dominated income taxation of recent years has departedfar from that principle. Moreover, the present code is characterized mainly notby the nominal levying of a tax, but by the diabolical maze of deductions. TheEconomic Recovery Tax Act of 1981 (ERTA) added to the retinue ot deductionspreviously in place. With its more than 120 individual deductions the total lossot revenue now attributed to shelters or deductions is estimated at $37U pilliona year.
Agriculture is a favorite sector for tax snelters. In a recent year, the loss otrevenue from shelters in agriculture exceeded the income tax paid by almost twoto one.
The shelters that have proliterated in tne last decade nave tive major featuresthat enter into any normative juugment about the tax code now in torce--a judgmentbased to some degree on :.ts ettect on income distribution but mucn more accordingto how it influences economic activity.
(1) Tne shelters erode the progressive feature of income taxes. Indeed,they have attained a scale where, on the average, all progressivity nasbeen ended.
(2) They invite both legal manipulation and illegal evasion.(3) By their nature they are selectively preterential, rewarding tne
ingenuity ot interest groups that can write, and win acceptance ot,subtly tailored provisions.
(4) They distort signals tor allocation and distribution that tue marKetsystem normally generates.
(5) Elaborating on number 4, in agriculture they:a. enlarge investment and tnereby stimulate overproduction and reduce
prices, andb. set in motion a transfer of asset ownership to sheltered investors.
A further note on tax deduction or shelter schemes builds on point (5)a above.Most, if not all, tax deductions constitute a subsidy to economic activity. Tneyare just as clearly a subsidy as are direct payments from tne Federal Treasury.Yet by some quirk of human cognition, a peculiar sophistry, tax deductions arenot generally regarded in that light. Indeed, time and again a deduction naeibeen voted by Congress on grounds that it will accomplish a desired end withoutinvolving a cost to Government. It hardly exaggerates to suggest that not fewerthan a hundred kinds of economic activity that are subsidized by the tax devicewould not be endowed equally via appropriation.
The probability is nigh that the current tax system, so incomprehensible a morassand so subject to evasion, will fall of its own weight. Former Secretary Reganapparently holds to such a view. The irony is taat the searen tor an efticient,collectible tax system is inducing many people, including political liberals, toadvocate a consumption tax. That recourse would reverse all the normativeconsiderations that underlay the original adoption of a progressive income tax.
What is recommended for agriculture? Tne crucial part ot tne tax question as itbears on agriculture rests in an understanding of how the present system functionsand what might be expected from each of various alternatives. a personalrecommendation is exactly the same as a number of critics have proposed for many
3

years. It is to end all opportunities to cleasify depreciable investment ascurrent operating expense: require farmers to use accrual accounting for taxpurposes; tax capital gains in the same manner as earned income; and, in fact,abolish all sheltered deductions. Examples of the first of these are some orcharddevelopment costs and various expenditures in livestock production that aregenuinely depreciable investment but are now classed as expenses in tax accounting.
The preference to tax capital gains at the same rate as earned income is notexclusively agricultural but has a lot of meaning to agriculture. Taxing them ata lower rate blantantly violates the American ethic.
The proposals named above are rationalized largely on the basis of points (5)aand (5)b. A major consequence of the existing tax code for agriculture is thatit has the net effect over time of wresting asset-holding out of the hands ofoperating farmers. It is not a case, to be sure, that the code has a built-inoccupational preference. But it has a clear preference for high-income taxpayers.The majority of shelters are attractive in proportion to the level of tax bracket.Generally, operating farmers are in a lower bracket than their nonfarm competitorsfor asset-holding. Furthermore, the squeezing-out process can snowball: as moreof the total returns from farming go to outside holders of assets, a smaller partwill be received by operators, lowering their tax braCket.
It is highly likely that if the tax code is not changed, eventually all realassets in agriculture will be held in shelters.
There is a reason to believe that, with the exception of a few kinds of enterprise,owner-operated farms of moderate size can compete with larger units if they aregiven protection from tax-subsidized competition. But in any case--call it aphilosophical bias if one wishes--if we want to use resources of Government toenhance a particular structure of agriculture, we ought to do it openly and above-board.
The furtiveness and the clandestine scheming of the tax subsidy route should beoutlawed simply on the grounds of its interference with responsible conduct ofGovernment. In agriculture its empirical consequences offer a further reasonfor radical change.
But a final note is to urge more attention to the topic of income taxation inagriculture. It deserves more than it received until very recently.
References
1. Halcrow, Harold G. Agricultural Policy Analysis. New York: McGraw-Hill, 1984.
2. Halcrow, Harold G. Food Policy for America. New York: McGraw-Hill, 1977.
3. Knutson, Ronald D., J. B. Penn, and William T. Boehm. Agricultural and FoodPolicy. Englewood Cliffs, N.J.,: Prentice-Hall, 1983.
4. Losso, Joseph. "Counting the Whys of Taxation." Review of The Limits ofSymbolic Reform: The New Deal and Taxation 1933-1939. St. Louis Post-Dispatch, Jan. 13, 1985.
104

5. McConnell, Campbell K. Sconomics: Principles, Problems, and Policies. 9tned., New York: McGraw-Hill, 1984.
6. Paarlberg, Don. farm and Food Policy: Issues of tne 198u's. Lincoln:University of Nebraska Press, 198U.
7. Tweeten, Luther. Foundations of Farm Policy. Lincoln: University of NebraskaPress, 1979.

A COMPARISON OF EFFECTS OF THE CURRENT TAX LAW THROUGH THE TAX REFORM ACT OF 1984 ANDTHE 1985 PROPOSED TAX ACT ON COMMERCTAL FARMS IN TEXAS, MISSISSIPPI, AND ILLINOIS
Clair J. Nixon and James W. Richardson
Tax law reform nas shifted into nign gear during the past few years. The myriadof changes in the Federal tax law nave in many ways directly affected farmoperators. Typically, however, analysis in the literature of tne impact of a
change in the tax law on farm operator tax liabilities has been limited to enactedprovisions ot tax bills. A departure from this convention will ne utilized inthis study. The purpose of this article is to compare the economic impact ofproposed tax law reform on farm operator tax liabilities and financial yell-being.The provisions of the current tax law and the U.S. Department of Treasury proposedTax Reform for Fairness, Simplicity, and Economic Growtn Act (Treasury .1) will necompared by simulating their effect on representative farms in Mississippi, Texas,and Illinois.
Tax Reforms
The literature contains numerous descriptive articles on the provisions of tnerecent changes in tne tax law (Harl; Richardson and Nixon; Prentice-Hall). Yet,analysis comparing the relative impact of proposed tax reform on farm operatortax liabilities has not been addressed. Ut course, with the rapid changesoccurring in tax policy, there is tremendous uncertainty as to the continuingdirection of Federal tax policy, especially with regard to farm operator families.
The key distinctions between the current tax law and proposed tax reform measureshaving a significant impact on farm operator families are summarized in Table 1.While a change in the tax law generally affects all types of farm operator businessenterprises, the focus of this analysis is limited to sole proprietorships. Utnerforms of business organization (regular corporation, Subchapter S corporation,limited partnerships, trusts, etc.) will be affected differently by tne proposedtax legislation.
Current Tax Law
Tax reform in the United States has generally taken an abrupt cnange since 1981.The Economic Recovery Tax Act of 1981 (EKTA) provided tne largest overall taxreduction in history. Tnis tax bill has widesweeping business investment stimuliand personal income tax reductions.
Only a year after ERTA, Congress passed the Tax Equity and Fiscal ResponsibilityAct of 1982 (TEFRA) which was the largest revenue generating biii in history.The regular minimum tax was eliminated and farm operators were now required topay the greater of the regular income tax liability after tax credits and a newversion of the alternative minimum tax. Cnanges were also made in the investmenttax credit area. Here, the trend of decreasing the benefit derived from theinvestment tax credit was initiated.
*The authors are associate professors in the Department of Accounting andAgricultural Economics, respectively, at Texas MA University.
1 26

Table 1414jur differences in the current law, Treasury I, and Treesury 11 tanlews tor !era operators
Endow tax rates, per-Seed& xemption, endSeto braceel amount
pepreciation
txpensing
investment tax credit
6urrent LewProvides tor 50 pere6ntmestmum rate on ail income.Marginal tax retell raduceothrough 1964. indexing oftax Sreceete, exemptions
and seri, bracket eleOunt,based on Oot tor di& -uromin
ConaUdera beginning in1965.
Providee tor lour classesat depreClabie personalproperty tSection 1245)mein the 150-percent
declining balance metnod.seal property has oneClaes and Say oe depre-ciated in as little as 6years. Salvage value istomcod in depreciationcomputation.
first-idler expensing on
personal property.65,UUU ih 1965, £980,and 1067; 41,Suu in 1988and 1969; and KlU,UUU in1990 and thereafter.Expensing reduces thebasis tor the investmenttax credit.
Provides tor too rategroups based on class liteof personal property; !-year class - -0 parent, 5-,
10-, 15-year class - -10
percent. investment taxcredit has no eftect onbaste for depreciation.Used property limitationincreased to $125,000 tor1961.417 and to 6150,000for 1966 and thereatter."At risk" limitations ex-tended to investment tuxcredit. individuals navethe option of reducingbasis for depreciation byhalt of investment taxcredit claimed or taking
Treasury 1beginning in 1160, threeindividual tax bracxets11, 25, and 35 percent.VerSunal exemptions in-crease trum 01,UUU tu01,000 and 'hero dracketAmount to oe set tor alter-native tiling groups3,81A) tor married tilingjointly).
Climinate Accelerated OstdeCovery System and re-piece with Keel CustXeCovery System kIWKS).Seven classes ut propertywith timed recovery rates.Tax basis adjusted annual-ly tur intlatlun.
Expensing to stay at$),UUU per year.
investment tax crediteliminated tor propertypurcnased on ur atterJanuary 1, 198b.
13
Treasury liSIMI SO Treasury
New t:apitai k:uat
Xecuvery system.Same as Treasuryexcept six classesot property.
Same as Treasury L.
Same as Treasury I.

Table 1--MAjor differences in tne current law, Treasury 1, and Treasury LI tax laws tor termoperators (continued)
Item
Investment tax creditrecapture
Income averaging
Alternative minimumtax
Current law2 percent less investmenttax credit tnan allowpowith no ettect on depre-ciable :maim beginningJanuary 1, 198J.
Treasury I Treasury ll
Provides tnat 2 percent ut
the credit is earned toreach tull year tnat theasset is Kept in serviceexcept to coincide withinvestment tax creditrules. The adjusted basisfor computing gain or lossis increased by halt otthe investment tax creditrecapture upon disposition.When the maximum investmentcredit is claimed originally.
Average of previous 3 taxyears as base-period income.Qualify it current year'sincome exceeds base period
average by 140 percent.
Combines regular minimumtax and the alternativeminimum tax. Eliminatedthe adjusted itemized de-duction as a preferenceitem. New preference itemsare added. The exclusionis increased to $40,000witn a flat 20 percent taxrate on the excess.
Capital gain treatment Holding period for long-term capital gains is 6months tor assets acquiredatter June 11, 1984. Une-year holding period rein-stituted atter 1987.
Interest expense All business interestfully deductible.
To be pnased uut witnelimination ot invest-ment tax credit.
Same as Tax Reform Actexcept it full-timestudent in any baseperiod year disqualitiesuse of income averaging.
Alternative minimum taxeliminated atter 1989.
Long-term capital gainsrate would be repealed.All gains and lossestreated as ordinary.Intlation adjustmentfor realized gains ondisposition of property.Effective for assetspurchased after 1985.
Interest deduction re-stricted oy tractionalexclusion rate based oninflation.
Same as Treasury L.
Income averagingeliminated in 198b.
Revised alternativeminimum tax withLower exemption andreduced tax preter-ence incowe.
Gapital gain deduc-tion reduced trom b.to 5U percent witntewer capital assetsqualifying. Utnergains and losseswill be ordinaryatter inflationadjustment.
All business inter-
est tully deductibleInterest on no:1r
uusinesses limitedto personal resi-dence, net invest-ment income and4J0A0O (.3,5W itmarried tilingseperately).
1 4
8

The last piece of major tax legislation affecting tne current tax law is tLe TaxReform Act of 1984 (TRA). The TRA was the most comprehensive and complex revisionof the Federal tax system that had ever been attempted. many or the provisionsin the TRA were aimed at postponing scheduled tax breaks tor 1984 and later years(expensing and used investment tax credit property) as well as reducing taxpayerbenefits in other areas (income averaging).
Tax Reform for Fairness, Simplicity, and Economic Growth Act of 1985 (Treasury l)
In an attempt to create a more fair and simple tax system that would not inhibiteconomic growth, Treasury I has been proposed by the U.S. Department of Treasury.This reform measure is intended to be revenue neutral and yet simpler incomprehension and administration. Tnere are, ot course, several other tax billsproposing variations of Treasury I (for example, Bradley-Gephardt, Kemp-Kasten, andTreasury II). Treasury IL was proposed by President Reagan on May 28, 1985. Thedifferences between Treasury I and Treasury II are shown in table 1. While thesetwo bills are very similar there are a few important differences. Yor example,the interest expense deduction changes under Treasury I were changed under TreasuryII to the benefit of most farm operators. Under Treasury LI. all interest expensewould be deductible and not adjusted for inflation. The focus of this sectionwill, however, be specifically on the potential impact of tne Treasury I proposal.
Treasury I would reduce individual tax liabilities an average of 8.5 percentusing marginal tax rates on economic income that would be 2U percent lower thancurrent rates. The personal exemption would not be indexed, but ratner beincreased to $2,000 per individual. In addition, tne zero bracket amount wouldbe increased for each of the tour filing groups, (married, filing jointly, etc.).The alternative minimum tax would also be repealed.
On the business side, a new capital cost recovery system would replace theaccelerated cost recovery system (ACAO. Tnis new system, the Keal Cost RecoverySystem, or RCRS, would allow cost recovery of the real or inflation-adjusted costof business assets. All property would be assigned to one of seven classes withfixed rates of depreciation. There would no longer be the option to use straight-line or accelerated depreciation. The RCRS inflatime-adjusted basis of an assetwould also be used to compute gain or loss on the disposition of the asset. Allgains and losses under the proposed law would be treated as ordinary income orloss since the favorable capital gains rules would be phased out. There wouldalso be no provision for recapture of depreciation because intlationadjustedvalues will be used in the depreciation calculation. Furthermore, there wouldbe no need to adjust the basis for investment tax credit allowances because ofthe proposed elimination of this and other credits. Most farm machinery wouldfall into a class which would recover the cost of equipment over a 12-year period.The fixed rate would be 18 percent annually. The basis for depreciation wouldchange each year based on the previous year's depreciation deduction and thepercentage change in the all-urban consumers price index kCPI). In addition, thefirst year's depreciation would be based on the month that the asset was placedin service. For example, a tractor costing $50,U00 purchased in December wouldhave a depreciation deduction in tne year of purchase of $750 k$50,UUU x .015).If inflation were 10 percent the following year, the depreciation deduction torthat year would be $9,751.50 (1$5U,000 - $7501 x 1.1 x .18). Therefore, underthis proposal, more than 100 percent of the original cost of the asset may bedepreciated.
As mentioned above, the investment tax credit would be repealed. This credit naslong been an important means of reducing farm income tax liabilities. The
9 15

preferential tax rate for long-term capital gains would also be repealed. Aligains and losses on property transactions would be treated as ordinary income orloss. The repeal of the favorable long-term capital gains treatment is coupledwith an inflation adjustment for realized gains on property dispositions.
A number of other changes in the proposed tax laws are shown in table 1. In most
cases, the proposed effective dace for implementation of tne changes is January1, 1986. This allows farm operators to plan for these changes during 1985. TneFirm Level I Policy Simulator Model (FLIPS1M V) was used to evaluate the impactof the current law (1984) and proposed Treasury I provisions on selectedrepresentative farms.
Simulation Model
FLIPSIM V is a firm level, recursive, simulation model whicn simulates tue annualproduction, farm policy, marketing, financial management, growtn, and income taxaspects of a farm over a multiple-year planning horizon. Tne computer program iscapable of simulating a case farm situation for 1 to 10 years. Tne modelrecursively simulates a typical farm by using tne ending financial position foryear 1 as the beginning position for the second year, and so on. An option touse a programming algorithm (LP or QP) to select the optimal (profit or utilitymaximizing) crop mix for years 2 to 1U is included in the model. The model,however, is a simulation model rather twin a programming model. Tnis comes fromthe fact that FLIPSIM V does not include an overall objective function to beoptimized but rather analyzes the outcome of a given set of input data andassumptions for a typical farm. Accounting equations and identities constitutemost all of the computational components of the model. Virtually no econometricrelationships with fixed parameters are included in tne model. A brief overviewof how the model operates is presented below.
As indicated in figure 1, tne model simulates a given farm situation tor 1 to 10 years(inner loop YEARS), and repeats this multiple-year planning horizon tor SUiterations (middle loop ITER) during a stochastic analysis. At tne end of eachiteration, the model records the results for future analysis. Prior to simulatingiterations 2 tnrough 50, the model reinitializes the farm co the beginningsituation used for the first iteration. Tne model is capable of simulating up to300 iterations. Upon completion of cne last iteration, tne model performs astatistical analysis of from 39 to 489 output variables, develops cumulativeprobability distributions tor theae output vatiables, and estimates tne probabilityof the farm operator remaining solvent for the duration of the planning noriZon.An outer loop (NUFARM) allows the model to analyze additional farm situations ifthey have been provided.
Annual prices and yields for up to 10 crops are determined by the analyst in tnedeterministic mode. When the model is run using stochastic prices and yields,annual crop prices and yields are drawn at random from probaoility distributionsspecified by the analyst. The analyst can select from independent or muitivariatedistributions for annual crop prices and yields. Variable cost of production foreach crop enterprise is summed to obtain total input costs. Labor cost is thesum of updated, full-time employee salaries and benefits plus wages paid topart-time employees.
Annual values for exogenous fixed costs are calculated by inflating tueir initialvalues by the appropriate annual percentage changes provided by the analyst.Property taxes are calculated as the product of the appropriate property tax rateand the market value of owned land in the previous year.
10 16

Existing and new long- and intermediate-term loans are amortized based on tneirrespective loan lite, initial amount borrowed, and annual interest rate. Tnese
values are provided at the outset by tne analyst.
The market value ot land and farm machinery is updated annually. Tne marketvalue for used equipment is adjusted using tne percentage changes in useu equipmentprices supplied by tne analyst.
Next, the model calculates depreciation for each item in tne macninery compiement.For depreciable items purchased prior to 1981, tne model calculates depreciationusing the analyst's specitied metnod, eiLner tile double declining balance or tnestraight line metnod. Depreciable items placed into service after 1980 and priorto 1986, are cost recovered using eitner an accelerated or straignt line method.Machinery placed into service after 1985 can either be Class IL or Class Iliequipment. The recovery life for equipment and livestock can be set by the analystat 3, 5, or 12 years. Farm equipment that has reached the end of its economiclife is traded-in or sold and a replacement purcnased. The farm operator ispermitted to replace an obsolete piece of equipment if sufficient casn is available(including the market value of tne old piece of equipment) to meet, for example,a 30-percent down payment, and the additional debt does not cause the intermediate-term equity ratio to fall below the minimum.1/ Additional first year expensingcan be taken for all purchases of equipment, as well as investment tax credit.If equipment is sold rather than traded-in, the capital gains or losses realizedfrom the sale are calculated and used in computing personal income taxes.Additionally, depreciation recapture is calculated when applicable.
An option in the model permits the farm operator to lease some or all ot the farmequipment. Equipment is leased on a multiyear basis and can be re-ieased orpurchased at tne end of the lease. When leased equipment is purchased, tne modeldepreciates (cost recovers) the equipment base on options selected by tne analyst.
At this point in tne simulated crop year, tne operator has sufficient informationto plan the marketing strategy for crops and tnus reduce personal income taxesfor the current year. By marketing a crop in tne next tax year, a cash-basisfarm operator may reduce tne income tax burden in the current year. Tnis is donein the model by calculating the operator's expected income tax deductions anacash receipts from all sources to determine the proportion of all crops to marketin the current year. A seasonal price index tor each crop allows tne operator toalso take advantage of seasonal price differentials available to producers wnonormally store their crops to take advantage of seasonal price differences.Annual cash receipts are calculated for that portion of the crop marketed in tnecurrent tax year, plus the receipts for selling crops stored from the previousyear. Crop cash receipts are adjusted to reflect the share of the crop paid tothe landowner for share-rented cropland.
1/ The model presently does not keep track of tne number of hours each machineis used. Machinery operating expenses and replacement are therefore not a functionof actual hours used. AS a result, annual machinery operating expenses ao notincrease if the farm operator is unable to replace a particular macnine wnen itis scheduled for replacement. To mintnize the effects of tnis limitation theoperator may put off replacement of machinery tor a maximum of 1 year. Aefinementsin this section of the model are being planned.
1 7

Tne farm programs in the model are activated separately by options speciried bythe analyst. For example, when the net loan rate (price support) for a crop isgreater than its market price, the operator's share of the crop is placed in cheCommodity Credit Corporation loan or farmer-held reserve (FUR), if available.Stocks are withdrawn from the loan the next year if their market price exceedsthe loan rate plus interest costs. Low-yield disaster payments, or Federal crop-insurance indemnity payments, are made if a crop experiences a yield lower thanits guaranteed yield. Premiums for Federal crop insurance are calculated annuallybased on the acres of each crop insured and their respective per-acre premiumrates. As the loss ratio for Federal crop insurance increases (or decreases) theper-acre premium rate is increased (or decreased), based on schedules publishedby the Federal Crop Insurance Corporation.
Personal-income taxes and selr-employment taxes are calculated annually tor thefarm operator, assuming the operator is married, filing a joint income tax return,and itemizing personal deauctions. The regular income tax liability is computedusing two methods: (a) income averaging (if qualified) and (b) standard taxtables. The model selects the tax strategy which results in the lower income taxliability. All investment tax-credit allowances are deducted from the regularincome tax liability with the result being compared with the income tax liabilityunder the alternative minimum tax. The operator pays the excess ot the alternativeminimum tax over the sum of the regular income tax liability and the regularminimum tax. It the operator purchases additional machinery in conjunction withgrowth, the income tax liability is recomputed based on the additional costrecovery allowances and investment tax credits. When additional machinery ispurchased, it is assumed the property qualities under the accelerated cost recoverysystem (ACRS). This allows the operator to utilize first-year expensing andinvestment tax credit for the purpose of reducing the current year's income taxliability. Income tax rate schedules for 1981, 19821 1983, and 1984 are includedin the model, as well as an optional procedure to develop tax rate schedules tor1985-90 based on changes in the CPI.
Growth in terms of purchasing or leasing additional cropland is considered at theend of each tax year it the analyst has selected this option. The availabilityof cropland for lease and/or purchase can be predetermined each year, or can beviewed to be random with the probability distributions for land availabilitybeing provided by the analyst.
After simulating the growth aspects of the term, the model computes the tarm'send-of-year financial statements. The model then updates the farm size andprepares to simulate the next year of the planning horizon. The annual processdescribed above is repeated until the entire planning horizon has been simulated.For a deterministic analysis, the model prints various output tables at thispoint.
Representative Farms
Six representative farms trom three States were simulated with the model underthe two income tax scenarios. Eacn scenario was simulated for b years beginningin 1985 and the planning horizon was replicated 50 times using crop'prices andyields drawn randomly from multivariate empirical probability distributions. Theshort simulation period (6 years) is used due to the short-lived nature or recenttax reforms.
The six representative terms used tor the study are: 1,08d- and 5,57U-acre TexasHigh Plains cotton farms; 1,433- and b1184-acre Mississippi Delta cottoa, rice,
1812

soybean, and wneat farms; 640- and 1,630-acre Illinois corn and soybean farms.The six representative farms were developed from primary and secondary data byRichardson, Eddleman, and Sundquist for the Office of Tecnnology Assessment(UTA). The salient cnaracteristics ot tne six representative farms are summarizedin table 2.
Table 2--Characteristics of two representative farms in tne Texas high Vialns,Mississippi Delta, and South-Central Illinois
Item Texas cottonfarms
: Mississippi cropfarms
: Iiiinois grainfarms
:
Total acres : 1,088 5,570 1,443 b,1d4 b40 1,o3U:
Acres owned : 707 2,117 910 3,120 380 1,172:
Value of owned '
cropland ($1,00U) : 222 2,015 799 4,5% 900 1038:
Value of machinery :
(S1,000) . : 144 714 379 1,210 92 129:
Total assets 1/ :
($1,000) : 443 3,029 1,339 6,3Ub 1,037 1,7b9:
Initial net worth :
($1,000) : 275 2,033 749 4,048 855 1,10b:
Initial equity :
ratio : o2 .67 .5b .64 .82 .02:
Total cash receipts :
(41,000) : 20b 7d3 591 1,962 2b5 555:
1/ Total assets exceeds the sum of macninery and cropland because it inciudescash on hand and off-farm assets.
Tne 1,088-acre Texas cotton.farm has the smallest annual casn receipts (20(3,00U)while the 6,184-acre Mississippi Delta farm produces the greatest annual casnreceipts ($1,962,000). The initial equity positions for tne Mississippi andTexas farms were obtained from producer and banker surveys, while the initialequity positions for the Illinois farms were provided by USDA from the 1979Agricultural Finance Survey. Machinery complements tor the Mississippi and Texasfarms were developed from producer surveys and tne equipment items were assumedto initially be.of varying.ages. The machinery complements for the Illinoisfarms were developed from.the USDA Cost of Production Survey. Production costsfor the individual crops produced on these farms were inflated to reflect 1984costs of production.
1 913

Due to the importance of inflation rates in tne proposed 1985 depreciationprocedure, particular care was taken in specitying the macroeconomic input valuesfor the model. To ensure that the races ot inflation in input costs were consistentwith the percentage change in the CPI and with the interest rates tor variousloans, a published projection ot these variaoles was used. Hughes and Fensonprovide several 6-year projections of annual percentage changes im input pricesand annual interest rates under alternative monetary and tiscal policies usingthe CONGEM model. Tneir projections for a restrictive fiscal policy and a moderatemonetary policy were selected. Under an economic scenario ot restrictive fiscaland moderate monetary policy, COMM projects declines in long-term interestrates from 11.5 percent in 1985 to 8.8 percent in 1990 and similar declines inintermediate-term interest rates. The percentage change in prices paid tor inputsis projected to be about 2.9 percent in 1985 and decline steadily to about -1.5percent in 1990. The CPI is projected to increase trom 317.b in 1985 to 323.7 by1990.
The aix representative farms were assumed to participate in the term programprovisions and to comply Witn a $50,O00-payment limitation. The announcedprovisions of the 1985 term program were used fur 1985. These policy values werealso used for 1986-90 for all crops except rice and wheat. Tne 1985 acreage-reduction levels for rice and wheat were reduced to 20 and 25 percent, respectively,for 1986-90. Mean prices received for crops were neld constant in 1985-90 attheir 1984 season average levels. Tnis assumption is reasonable considering thegeneral economic scenario used to develop interest rates and percentage cnangesin input prices.
All values used:to describe the six representative farms, the farm policy variaoles,and the macroeconomy were held constant across the three income tax scenariosevaluated. This ensured tnat the results observed trom the simulation model weredue to the different income-tax scenarios and not to difterences in assumptionsabout the terms or the policy variables.
Simulation Results
The results ot simulating the six representative crop farms under the current andproposed tax law scenarios are summarized in table 3. All terms had a 1UU-percentchance of remaining solvent for 6 years under the two tax scenarios analyzed.
Given that the purpose of Treasury I was to tighten loopholes and keep Federalrevenue neutral, it appears to be a failure as tar as these six representativefarms are concerned. None of the six representative farms experienced an increasein average annual income taxes compared to tax payments under the current law.Over the 6-year planning horizon, the Treasury I provisions would nave saved thethree larger farms a combined total of $207,000 in income taxes, compared withthe current tax law.
The reduction in marginal Federal income tax rates under Treasury 1 nad a greaterimpact on the representative farm's income tax payments than tne change indepreciation allowances. The increase in average annual net term income rangeufrom 3.8 to 8.8 percent for the six farms due to reductions in average annualdepreciation allowances under Treasury I. Similar percentage increases in averageannual taxable income were also experienced by these farms. Despite this increasein net farm income, average annual income tax payments for all six terms Leclined.The marginal income tax rates for the smaller farms decreased to 25 and 35 percentunder Treasury I. The 6,184-acre Mississippi farm experienced the greatestreduction in marginal income tax rates, declining from 50 to 35 percent. These
14 20

reductions in the marginal tax rate account for declining average annual incometax payments even though the farms experienced rising net farm incomes and taxableincomes.
Table 3--Results of simulating six representative farms undertax laws and a proposed Federal income tax policy
1984 Federal income
Mississippi cottonItem :Texas cotton farms and grain farms
Illinois grainfarms
:
:
:
1984 1985tax tax
act proposal
1984tax
act
1985tax
proposal
1984
taxact
1985tax
proposal
: 1,088-acre farm 1,443-acre farm 640-acre farm
Average ending networth ($1,000) : 625.8 689.3 1,444.0 1,463./ 1,007.3 1,033.4
Average annual netfarm income ($1,000) : 52.5 53.7 62.6 66.9 57.1 60.1
Average annual incometax payment (1,000) : 15.1 10.4 18.1) 14.9 11.1 8.9
: 5,570-acre farm 6,184-acre farm 1,630-acre farm
Average ending networth (1,000) :3,082.1 3,199.2 5,952.8 6,023.9 1,175.o 1,197.2
Average annual netfarm income ($1,000) ; 141.4 146.7 151.0 163.5 68.7 72.2
Average annual income :
tax payment ($1,000) : 62.0 44.5 75.2 03.0 18.3 13.5
Average annual income taxes for the six representative farms differ only sligntlywithin each State, if they are expressed as a ratio of total cash receipts.Income tax as a fraction of receipts is 0.073 for tne 1,0db-acre Texas cotton and0.079 for the larger Texas farm. Similarly, these fractions are 0.033 and 0.038for the 1,443-acre and 6,184-acre Mississippi farms, respectively. Tne 040-acreIllinois farm pays only sligntly more income taxes per dollar of receipts (0.042)than the 1,630-acre Illinois farm 0.033). Tnese results suggest tnat witnin agiven farm type, the Federal income tax provisions are relatively neutral withrespect to structure. This same conclusion is drawn whether the current law orTreasury I is used.
The proposed change in the interest expense deduction has little impact on tnefarmer's income tax liability. The annual average percentage change in tne CPIwas less than 1 percent under the restrictive fiscal and moderate monetary policyprojections by Hughes and Fenson. Larger changes in the CPI could alter theresults in this study as interest is botn a significant expense and income taxdeduction for farm operators.
b2.1

Summary and Conclusion
Major changes in the Federal income tax Law have been enacted during the past tewyears. In addition, widesweeping changes have been proposed tor 1985 and beyund.The impact of alternative tax laws, one enacted and one propocied, on selectedrepresentative medium- and large-sized farms in Texas, Miss., Lppi, and Illinoiswas analyzed. The tax provisions in this study included the curient tax lawthrough the Tax Reform Act of 1984 (TRA) and the proposed Tax Reform tor Fairness,Simplicity, and Economic Growth Act of 1985 (Treasury I).
The results of the analysis indicate the net effect of changing investment taxcredit, the depreciation ,Jrocedure, and the marginal income tax rates underTreasury I was to substantially reduce income taxes for all six representative farms.These reductions in income taxes were observed although Treasury I eliminatedinvestment tax credit and extended the depreciation life of machinery. Theprimary reason for the decrease in taxes under Treasury I was the reduction inthe marginal income tax rates. Again these results are based on profitable cropfarming operations. Livestock operations would Likely be affected differently.
Under all three tax provisions analyzed, tne income tax burden (dollar tax/dolLarreceipts) for the larger farms appeared to be about the same as for the smaller(moderate-size) farms.
The above results are based on proposed changes in the tax law. The prooabilityof the entire Treasury I or even a revised Treasury II being enacted is slim.Nevertheless, several major changes, sucn as repeal of the investment tax credit,are included in each of the tax reform bills being seriously considered byCongress. Whether tne entire Treasury proposal or just a portion ot it becomeslaw, farm operator's tax liabilities will be atfected as well as tneir futureprofitability.
References
1. Government Printing Office. Bradley-Gephardt, Fair Tax Act of 1985. Senatebill 1421, House bill 3271, Jan. 30, 1985.
2. Government Printing Office. Kem -Kasten The Fair and Sim le Tax Act of 1985.Senate bill 2600, House bill 5533, Jan. 30, 1985.
3. Government Printing Office. The Tax Equity and Fiscal Remponsibility Act of1982. H.R. 4961. Aug. 19, 1982.
4. Harl, N. "TEFRA, The Tax Equity and Fiscal Responsibility Act ot 1982,"Agricultural Finance. Oct. 1982, pp. 20-22.
5. Hughes, D. W., and J. S. Penson, Jr. "Impact of Alternative MacroeconomicPolicies on the Future of Agriculture," Agricultural Finance Review, Vol. 45,pp. 81-91.
6. Prentice-Hall, Inc. Prentice-Hall's Ex lanation of tne Tax Rerorm ACt ot1984. Englewood Cliffs, N.J., Nov. 1984.
7. Prentice-Hall, Inc. "Tax Reform tor Fairness, Simplicity, and EconomicGrowth," The Treasury Department Report to the President. VoL. 2, EnglewoodCliffs, N.J., Nov. 1984.
1,22

8. Richardson, J. W., and C. J. Nixon. "The Etfects of the 198U, 1981, and 1982Tax Laws on Texas Rice Farmers," Southern Journal Agricultural Economics,July (1984), pp. 137-44.
9. Richardson, J. W., and C. J. Nixon. Description of FLUSIM V: A GeneralFirm Level Policy Simulation Model. Texas Agr. Exp. Sta. dull., 8-1528,1986.
10. Government Printing Office. "Technology, Punlic Poiicy, and the ChangingStructure of American Agriculture: A Special Report for the 1985 Farm dill."U.S. Congress, Office of Technology Assessment, UTA-F-272, marcn 1985.

TAX AND AGRICULTURAL POLICY: INTER:AN:CAGES AND REPORM
Kenneth Baum, L. Leon Geyer, Jim Johnson, and Ron Durst*
Introduction
The Federal tax system and commodity policies of me last halt century naveaffected tne quality and mix of resource use in the farm sector kDavenport, uurst,Rasmussen). As a consequence, tne economic performance ot the farm sector hasalso been affected in ways botn intended and unintended by tnose citizens concernedwith nurturing the ability of farmers to produce a steady and assured supply otfood and fiber for the Nation.
Most sectors of the economy have provisions in the Federal tax code exemptingsome income or redefining some expense within the normal tax structure. Taximpacts may be compounded by State taxation policies which generally tollowFederal law. Almost every year, additional exceptions attecting a particularbusiness activity or class of taxpayer are voted by Congress or State legislaturesto influence economic growth, consumption, savings, investment, or incentives towork in one or more of these subsectors. These actions are a prerogative otGovernment and reflect, in theory, efforts within the social contract to increasethe national welfare. In this context, the agricultural sector, or more speciticallythe farm sector, should be viewed as a primary economic activity tundamentallyaffected by both tax provisions and price and income support programs.
How will the process of structural or organizational adjustment in the tam sectorbe changed or maintained? What are the special problems concerning agriculture
that the public should be aware ot tor informed policymaking? wno will or snouldcontrol the resources used in tne farm sector and maxe the decisions attectingthe supply ot food and fiber? How will tax policy impact upon resource allocationdecisions in agriculture. These complex questions roise issues of how to measure,quantify, monitor, and forecast the farm sectot's productive capacity, etticiency,resource use, financial stability, and economic well-being.
The remainder ot this paper will review the current economic status ot the tarmsector, briefly discuss the last 50 years ot farm programs and current administrationproposals, review current tax policy and current proposals for tax retorms, andthen conclude with a discussion of ettorts to provide data and analysis to monitorand analyze the eftects of tax and commodity policies on the farm sector throughthe national Farm Cost and Returns Survey conducted by USDA.
Economic Methodology
The farm sector and operators must simultaneously allocate inputs or resourcesamong crop, livestock, and off-farm (income producing) activities based on pricesof inputs and outputs and various resource or tinancial constraints. Baal ofthese values may be partially determined by commodity price or income supportprograms, or various tax code provisions or both. These inputs may ne ditterentiatedby quality, type, and quantity and include land, labor, capital, and management.
* Kenneth Baum is Animal Products Branch Cnief, National Economics Division,Economic Research Service (ERS). L. Leon Geyer is assistant professor in AgriculturalEconomics at Virginia Polytechnic Institute. Jim Johnson is Econolnio indicatorsBranch Chief, National Economics Division, EKS. Ron Durst is in the Finance andAggregate Analysis Branch, Agriculture and Rural Economics Division, ERS.
18 24

The specification and identitication of the constraint structure characterizingan individual farm or the farm sector are critical. However, it is almost impossibleto explicitly determine. The decision process aftecting behavior is partiallyderived trom the constraint system and is dependent upon the incorporation otdynamic feedback interactions trom financial resources and other variables. Theexpected, relative, before- and atter-tax returns on assets and production activitiesare in turn dependent upon proper specification of price (value) and (atter tax)cost information from both output and input markets.
Simultaneous and sequential optimizing decision and planning processes byindividual producers have been characterized by Kausser and others in terms of aputty-clay model. Day characterizes this process as myopic optimizing oradaptive programming. These conceptual approaches describe a situation whereassets are fixed in the short run, limiting the choice of input mix and output.Over time, the quality, cost, and quantity of inputs are more variable, tauschanging input and output flexibility. Myopic optimizing in adaptive economicmodels further describes a situation where decisionmaKing is costly anddecisionmakers have imperfect information.
The constraint structure is developed from assumptions about the proaucer's accessto and control over durable and nondurable inputs. The nondurable inputs, sucn asfertilizer and water, are assumed to be available at a given price for tne tam.However, the availability of the durable inputs, such as land, macninery, tinancialand human capital, and information, is more price inelastic from the point orview of the producer. The supplies ot durable inputs accessible by the termeract as the effective constraints within the system. For example, assume theamount and type of land acreages owned or leased by the ith farmer, Aci, can berepresented by vectors Li (Lil,...,Lij) and Zi (Zii ,...,Zii). Tne farmer maybuy or sell parcels of land, Lij, or lease additional land, 2i trom or to otherlandowners. In each production period, tne acreage utilized by the ith farmerfrom crop or livestock production must satisfy the following constraint:
(1) 0 < ACi < Li + Zi+ Li+ AZi.
The acreage diversion programs often limit the aggregate production ot crops bycontrolling specific crop acreage. The diversion requirement (1 - w) is thepercentage of cropland acreage controlled by the farmer which is set aside andnot used for production. An incentive or diversion payment, P, to partly recompensefarmers for nonuse of this cropland may also be available. If so, this payment,(1 w) ACi * P, would be included in expected net returns for each aftectedcommodity. Thus, with commodity-price changes, price-support levels, and utnerrelated Government program payments, the expected profit is also altered. Tnefarmer's decision problem of choosing an optimal mix of production activitiesthen becomes extremely complex and uncertain.
Other durable input and resource constraints may also be important. For example,consider the distribution of various types of capital stock, wnere S = _,...,sare technologies available to the farmer. Given the methodological assumptionsof the putty-clay model, the farmer may either continue operating witn existingtechnology embodied in the owned machinery complement, Ki = or buynew equipment, AKi. This investment cost may be amortized in eacn productionperiod (given associated tax code or economic depreciation, and otner factorssuch as investment credits) into a fixed number of production periods, YAN.+ Y°0Ki. Machinery may also be rented to and from farmers or rented trom theservice sector at a cost of (SKi.
19
25BEST COPY AVAILABLE
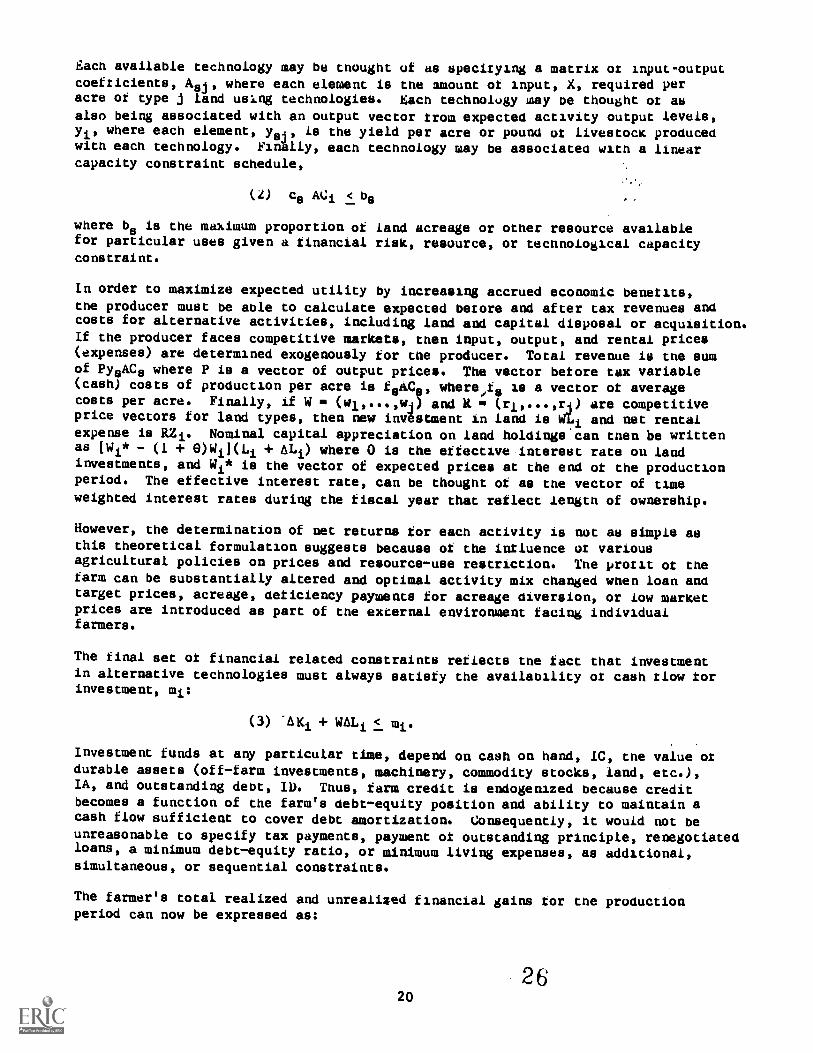
Each available technology may be thought of as specitying a matrix or input-outputcoefricients, Asj, where each element is the amount of input, X, required peracre of type j land usIng technologies. gawk technolugy may De thou6ht ot asalso being associated with an output vector rrom expected activity output levels,
where each element, ysj, Is the yield per acre or pound ot livestock producenwitn each technology. Finally, eacn technology may be associaten with a linearcapacity constraint schedule,
(2) cs ACi < bs
where bs is the maximum proportion of land acreage or other resource availablefor particular uses given a tinancial risk, resource, or tecnnoiogical capacityconstraint.
In order to maximize expected utility by increasing accrued economic benerits,tne producer must be able to calculate expected berore and after tax revenues andcosts for alternative activities, including land and capital disposal or acquisition.If the producer faces competitive markets, then input, output, and rental prices(expenses) are determined exogenously for tne producer. Total revenue is the sumof PysACs where P is a vector of output prices. The vector betore tax variable(cash) costs of production per acre is fsACs, whereife is a vector ot averagecosts per acre. Finally, if W (wi, ...04j) and It (ri,... ,ri) are competitiveprice vectors for land types, then new investment in land is WLi and net rentalexpense is RZi. Nominal capital appreciation on land holdings.can tnen be writtenas [Wi* - (1 + 0)Wij(Li + ALi) where 0 is the effective interest rate on landinvestments, and Wi* is the vector of expected prices at the end ot the productionperiod. The effective interest rate, can be thought of as the vector of timeweighted interest rates during the fiscal year that reflect length of ownership.
However, the determination of net returns for each activity is not au simple asthis theoretical formulation suggests because of the intluence or variousagricultural policies on prices and resource-use restriction. The prorit or thefarm can be substantially altered and optimal activity mix changed wnen loan anatarget prices, acreage, deticiency payments for acreage diversion, or low marketprices are introduced as part of the external environment facing individualfarmers.
The final set or financial related constraints reflects tne fact that investmentin alternative technologies must always satisry the availability or cash tlow torinvestment, mi:
(3) .AKi + WALi < mi.
Investment funds at any particular time, depend on Cash on hand, IC, tne value otdurable assets (off-farm investments, machinery, commodity stocks, land, etc.),IA, and outstanding debt, ID. Thus, farm credit is endogenazed because creditbecomes a function of the farm's debt-equity position and ability to maintain acash flow sufficient to cover debt amortization. Consequently, it would not beunreasonable to specify tax payments, payment ot outstanding principle, renegotiatedloans, a minimum debt-equity ratio, or minimum living expenses, as additional,simultaneous, or sequential constraints.
The farmer's total realized and unrealized financial gains tor the productionperiod can now be expressed as:
2620

(4) (2y5-18)ACOUr(YAKei0Ki)6(eiwill"..(1+WWI) kLi+ALi)+GF1
where GPi is Government program payments. Thus, the farmer's production decisionseecomss a static prob/em of maximizing Rquation 4 Subject to the constraints inequations (1), (2), and (3), and a dynamic problem if production occurs overseveral periods. The producer must choose among production technologies, makeland and other capital portfo/io adjustments, consider financial constraints, andchoose the quantity of various inputs simultaneously witn expected output Levelsgiven a set ot expected betore- and after-tax net returns tor eacn activity andthe current or expected set of commodity-price and income-support programs.
The Farm Sector Today
The fare sector today can be characterized as (1) large commercial farms dependingon farming tor income, (2) midsize farms (family terms), and (3) smaller termsoperated for a variety of reasons including to protect nonfarm income (tax-lossfarming), retirement terming (pension farming), and part-time farming (weexendfarming). All these terms are integrated with the domestic and internationaleconomy because of ow increased use ot purchased inputs, changes in bankinglaws, and trade relationships with tna international agricultural. economy.
The large number ot technological changes atter World War LI greatly increasedfare productivity. The tax code which otten allowea tull depreciation before tneend of the economic life encouraged such investments. Larger macnines neededlarger tracts ot land to be used efticiently, farmers leased or purchased additionalland, and the number ot farms and tarmers aeclined. but tnis increased efficiencyled to supplies of agricultural products increasing at a taster rate tnandomestic and international demand. Tne prices ot farm products declined relativeto the prices farmers paid for production inputs over the last 30 years.Increased efficiency and output were tben needed by producers to maintain termincome. This circumstance nas led tarmers in turn to purcnase more machinery andland to increase efficiency and preserve farm income, contributing to a continuousresource adjustment pattern in the farm sector.
Most farms, nearly 90 percent, are operated by families as sole proprietorships.Corporations account for about 2 percent of all farms, but almost al/ nave salesof over $100,000 and produce over one-titth ot farm output. Note tnat 90 percentot corporate farms are family neld and specialize in cattle, poulcry, fruits,and vegetables. Obviously for mese operations and for partnersnips (the other dpercent of farms), the tax-code and estate-planning considerations nave influencedthe choice of business organization and tne degree ot taxation ot term income.The vast majority of crop production attected oy Government commodity policy arefamily operated farms.
Federal Farm Programs Today
Commodity policy has been directed toward output price-support programs andoutput-supply restrictions tor selected agricultural products - -balancing supply
and demand to achieve commodity-price goals (Rasmussen).
Current farm programa are driven by the Government's attempt to increase domesticand uncertain international demand while managing excess supplies. Four majortools are used in these programs to stabilize market prices and support farmincomes: farmer- and Government-owned grain reserves, deticiency payments,acreage reduction, and nonrecourse loans. The nonrecourse loan and grain reserveprograms are intended to stabilize market prices by building stocks when prices
21

are low and the reverse when prices are higher Chan normal. The deticiencypayments and acreage reduction programs have been intended to increase tam incowee.The deficiency payment, based un the ditterence between a target price and tnemarket price, acts to increase an operator's income directly during low-priceperiods.
From World War II to the early 1970's, commodity programs raised and stabilizedfarm prices and incomes over what free-market levels would likely have-been.This was a period of excess supply, and the U.S. price was above tne world marketclearing price, even though on the average over 50 million acres a year wereidled. Increases in farm size, productivity, and investment in larger termmachinery resulted.
The internationalization of the farm sector's markets in the early 197U's actedto greatly reduce the influence ot farm programs on farm incomes. During thisperiod, world prices were higner than domestic-support prices and exports grewrapidly. The primary Government problem was price stabilization, uecause domesticprices were increasingly dependent on weather and crop production in othercountries, as well as changes in foreign countries' food-import policies and aflexible exchange rate. This additional export-market volatility added to incomeinstability.
Farm program legislation nas not addressed tax code cnanges directly or indirectly.Taxation policy may have further aggravated farm surpluses by the creation otsurplus productive capacity through lower cost inputs and resource fixity.
Federal Tax Policy and the Farm Sector: An Overview
Unlike commodity programs designed to restrict the quantity ot inputs available,such as land, or to change output price levels, tax policies affect the farmsector througn investment and production decisions. These decisions are based onthe relative prices of various inputs. The decision system is simultaneousbecause output decisions aftect input mix decisions and the relative cost ofinputs and input mix may change the level ot output. Nevertheless, tax policyshould be viewed in terms of changing the input mix, tne economic etriciency ofthese resources, and the output capacity ot the term tirm. It so, the analytical
problem for tax-related research is to quantity the ditterential tax treatment otinputs used in the farm sector to test the hypothesis that some inputs maybe overutilized in agriculture without economical justification based on aprevailing market price. It is the distinction between prevailing market price(the theoretical cost) and tne atter-tax (cashflow) cost that is the criticaldeterminant ot the real etfects of tax policy in tne farm sector. Hari nassuggested that:
Even though the tax system in the United States has undergone dramaticand unprecedented change in the past decade, it is entirely possible tooverstate the direct effects of taxation upon tne structure of the agri--culture sector, the nature of firms within that sector and the economicfortunes of those involved in farming and agribusiness. If the indirecteffects of taxation were considered as well, the combined impacts would,however, rank among the most significant variables affecting agricultureeven in these economically troubled times (p. 199).
Harl in his concluding statement postulates that "tax policy snouid not (I)decrease the cost of production for larger over smaller farms, (2) induce investmentin agriculture from nontarm investors to a greater degree than other sectors, and(3) encourage concentration of land ownership in tne hands of a 'land gentry'."
22 28

In effect, tax policy is increasingly cited as an important rector atfecting theorganization and economic well-being ot tne sector.
It the premise is accepted tnat the term sector is now a business ratner than a"way of life" populated by small family farms, then it should oe no surprise thatthe term sector benefits from a variety ot special tax provisions. The role ot
research is to quantify whether agriculture has benefited more or less than otherindustries and then establish the relative importance of tax policy among othercommodity, credit, and Government programs that have affected the organization,allocation, and control of farm resources.
The tax research literature relating to the farm sector is substantial and anumber of quasi-subjective conclusions have been reached concerning the tax cudeand the farm sector. Much of this research has toucused on micro- or farm-level types of quantitative analysis because national sector level models nave notyet been able to simultaneously incorporate an input demand and supply schedule,a financial sector, and the Federal tax code (Penson and others, Saum andHarrington). Durst has summarized these findings as the following:
Tax-induced distortions in the capital stock may nave caused greateramounts of capital to tlow into agriculture than would otherwise be war-ranted.
Nonneutral tax depreciation and tax credit policies may nave reduced theproductive efficiency of the farm-capital stock.
Tax incentives for capital investment combined with increased taxes on laborhave altered the mix of capital and labor employed in agriculture.
The estate and income tax Laws may nave encouraged a large number of tamilyfarms to incorporate.
The tax Laws have encouraged the growth and expansion ot existing termbusiness.
Favorable tax provisions have stimulated tax motivated investments in thesector, thus distorting relative input and commodity prices.
Federal tax laws have altered the patterns and timing of input purcnases andcrop and livestock sales.
Various tax provisions may nave encouraged tamers to alter managementpractices.
During times of inflation, various tax provisions may nave encouraged tarmers
to increase their use ot debt capital to expand.
Several income tax provisions are postulated to be responsible for tnese nypotneses:cash accounting, deducting certain "capital expenditures" against current income,capital-gains tax treatment, capital-cost recovery system kincluding single-purpose agricultural structures), tax treatment of land, and the corporate incometax.
Cash Accounting. Most tarmers with sole-proprietor operations use a cashaccounting rather than the more complicated accrual method ot bookkeeping torexpenses and income. He a consequence, it is possible to mismatch income and
2329

associated expenses by building inventories in early years to be taxed in a lateryear. The Tax Reform Act ot 1976 and 1984 pronibited tax deductions tor prepaidexpense by cash-basis "tax shelters" until economic performance actually occursand by corporations with gross receipts in excess of $1 million (excepting closelyheld family corporations). Livestock production is primarily affected by tnisprovision.
Some of tne effects of income tax rules can be seen by comparing individuals wnoreported farm profits with those who reported farm losses to the Internal RevenueService in 1976 (tne most recent publisned data). It seems nigniy Likely tnatmost of the 12,000 persons who reported farm losses of $50,000 or more, averaging$104,000, were primarily interested in farming to offset tnose losses Againstoff-farm incomes that averaged $122,00U (Carlin and Woods).
Expenses. Capital expenditures are made to acquire or develop assets that willbe used over a long period of time and generally are written otf over the periodof time used (depreciation). Sowever, in agriculture, pre-production costs torselected fruit products prior to production maturity, land-clearing costs, soiland water conservation expenses, and otner input purcnases prior to year ofactual use may be deducted in the tax year of purchase against ordinary income.These provisions permit expenses (losses) to be written off.Lgainst otner farmincome and has led to tax motivated rather than economic investment in citrus andalmond groves and vineyards. Special tax legislation and tne 1976 Tax Reform Acthave restricted certain of these tax motivated investments. Livestock and dairybreeding stock and noncitrus orchards still receive such benefits.
Capital gains. Most agricultural land, machinery, equipment, and Livestock neld tordraft, dairy, breeding, or sporting purposes are eligible tor capital-gainst..eatment. Sixty percent of the gain from the sale is excluded from incometaxation. The most beneficial results of capita/ gains occur with tne cash metnodof accounting and tne deductibility ot capital expenditures. An excellent exampleiS the capital treatment of the sale of Livestock neld for breeding purposes.The cost of raising a cow is deductible from current income as ordinary andnecessary expenses and receipts from her sale made after she is placed intoproduction are eligible tor capital-gains treatment. Current tax liability isreduced, ordinary income is converted into capital-gain income, and the taxationof such gains are deterred ()urst and Jeremias, 1984).
Capital Cost Recovery. The farm sector requires a large annual investment indepreciable assets. The tax code now includes.accelerated depreciation methods(to partially account tor inflation whicft nas since disappeared), investment taxcredits, and the shortening of tax lives to 5 years for most machinery, equipment,and single-purpose agricultural buildings. Sucn fast write-offs have encouragedexcess capacity in some farm sectors sucn as the swine industry.
Business Organization and Estate Planning. Income tax considerations and deductionsfor various fringe benefits all played various.roles in doubling the number ofcorporate farms (lioehlje and Krause). The estate tax and the gift tax haveseveral provisions which can influence the ownership ot farms and the maintenanceand accumulation of wealth across generations, primarily special valuation offarm assets and deferred payment of estate taxes (Boehlje). Special-use valuationwithin certain limits allows farm assets. to be valued on the basis of the prevailingrental rates for these assets capitalized at the Federal land Bank interest rate.This method of valuing agricultural assets ignores several components thatcontribute to the fair-market value of farmland as an inflation hedge, growthstock, and tax shelter. These components have Peen estimated to contribute up to
24 30

50 percent of the fair-market value of farmland (Harrington). The deferredpayments of estate taxes are financiaLly vaLuable to heirs. Access to these
provisions is focused toward farmers by requiring materiaL participation and
qualified-use tests tor eligibility.
Future Tax Policy Issues. Tax policy issues are being debated with increasingfrequency (Doye and Boehjle). The Reagan administration's proposal was publishedby the U.S. Department of the Treasury (Mole 1). This proposal wouLd Lower taxrates without'lowering or changing the Government's total receipts. The proposalwouLd reduce.the overall tax burden on individuals while substantiaLly raisingthe share paid,by corporations. Of particular interest to the tarm sector aredetails of a,depreciation scheme that would replace the 4-year-old Accelerated CostRecovery System and the treatment of capital gains as ordinary income.
The debate over proper, fair, or correct taxation of the tarm sector in terms oftax reform will have to confront the possible inconsistencies ot farm-commoditypolicies acting to decrease the supply of crops and milk and tax poLicies actingto increase investment and add resources to the farm sector, thereby increasingits productive capacity and efficiency. The existence of tax sheltered investmentsin the farm sector developed over many, years and sudden changes in the aLLowabilityof cash accounting methods, capital expenditures, and capital gain income couLdseverely affect livestock production, shortrun investment patterns, and assetprices. Nevertneiess, the number ot farms reporting losses tor tax purposes nasincreased trom ons-third to two-thirds of all farms since 1970. This is due bothto Lower commodity prices and tax loss farming. Federal tax revenues have sufferedbecause these losses are often used to shelter nonfarm income. Addressing farmpoLicy without addressing tax issues would onLy address ons portion of tne profitfunction.
Monitoring the Effect of Tax and Financial Stress inCommodity Policy and the Cattle Sector
Whole farm surveys such as the USDA Farm Costs and Returns Survey (Johnson and
Baum) can be used for a detailed analysis and future research relating to theeffects of tax policy and commodity programs on the livestock sector and otnercommodity subsectors. Use of this survey for tax research depends upon the furtherdevelopment of an applied and empirical tax research program in agriculture eitherin ERS or in conjunction with interested universities (for example, Harrison andWoods). Such research necessarily includes farmers' actual use ot tax-codeprovisions, investment decisions, cash flow requirements, effective tax rates, andother issues by size and type of farm in different regions. information separatingor demonstrating the interlinkages of tax policy with commodity policy could beprovided.
For example, the Cattle and Feed Report reLeased October 18, 1984, showed adramatic increase in the number of heifers placed on feed. The usual explanationsfor this type of pLacement occurrence, such as poor range conditions and Lowfuture-price relationships, were not strong enough by themselves to justify tnisapparent major change in producer benavior. The additional placement of heiferson feed appeared to be due partially to financial stress of terms witn cow-calfoperations and their decision to sell part or all of their beet nerd to improvetheir short-term financial.position. Were these financial difficulties exacerbatedby tax policy affecting initial iivestock'investment decisions?
25

Table 1Treasury's tax retorm proposal: major provisioas attecting farmers
Individual Tax Rates and ueductions
Current law:
Tne current tax system contains 14 brackets with rates ranging from 11 to
percent. Sy 1986, tne current proposal exemption would be 41,119U and tnezero bracket amount would be $3,710 (joint returns). Kate brackets, personal
exemptions, and tne zero bracket amount are indexea tor imtlation.
Proposed change:
The proposed modified flat tax system would contain only three rates: IS,
and 35 percent. The personal exemption would be increased to 42,UU0 ana tnestandard deduction to $3,dUU (joint returns). Kate brackets, personalexemptions, and the zero bracket amount would continue to be indexed torinflation. The income tax base would be broaden by restricting e number otpersonal deductions and taxing some fringe benefits.
Potential impact:
Treasury estimates that 7d percent of all individuals WOLLIA experience nochange or a decrease in taxes while individual marginal tax rates wouid bereduced by an average of 20 percent. Most individuals with farm income would
pay a 15-percent rate. These reduced tax rates in combination with otheraspects of Treasury's proposal will reduce tne attractiveness ot tax shelters.Individuals with farm earnings should be affected to a lesser extent than thegeneral population by the base broadening provisions due to tne emphasis ontaxing fringe benefits and restricting itemized deductions.
Corporate Tax Rates
Current law:
Corporate tax rates are graduated and range from 15 to 46 percent.
Proposed change:
A flat rate of 33 percent.
Potential impact:
This change would increase the tax burden tor many small tamily farm corporationswhich have incorporated over the last decade. These corporations currentlypay an average tax rate of 25.75 percent on the first S100,000 ot taxableincome. This proposal would eliminate the incentive to incorporate the termbusiness tor income tax purposes.
Investment Tax Credit
Current law:
A 6- or 10-percent tax credit is al/owed for qualitying capital investments.
Most farm machinery, equipment, certain livestock, and many farm structuresquality for the full 100-percent tax credit.
26 32

Table 1--Treasury's tax retorm proposal: major provisions attecting tamers(coned)
Proposed change:
Tne investment tax credit would be repealed.
Potential impact:
(See Depreciation)
Depreciation
Current law:
The Accelerated Cost Kecovery System permits depreciable assets to be writtenoff at an accelerated rate over 3, 5, 10, 15, or 18 years. Most depreciablefarm assets can be written oft over a 5-year period. Mese deductions arebased on historical cost. Up to $5,0OU per year may be expensed. This isscheduled to increase to $1U,000 by 1989.
Proposed change:
The Treasury proposal for depreciation would approximate tne actual declinein the value of depreciable capital (economic depreciation). Deductionswould be indexed for inflation. Write-off periods could resemble those ineffect prior to 1981. Thus, most farm machinery and equipment would bewritten off over a 20- to 25-year period. The expensing options would bepermanently restricted to $5,000 per year.
Potential impact:
At current levels of inflation eftective tax rates tor investment on mosttypes ot depreciable farm capital are well oelow statutory rates and in somecases actually negative. Tne elimination ot tne investment tax credit and thelengthening of write-off periods would increase these rates and thus theafter-tax cost of capital. This could reduce investment. The impact wouldbe the greatest for field crop, dairy, and general beef cattle farms. As theinflation rate increases tne gap between tax rates under the current systemand under the proposed system would narrow. The equating of tax and economicdepreciation through indexing eliminates the tluctuations in the tax ratesthat occur as a result of inflation. It would also reduce the distortions inresource allocation that occur as a result of nonneutral tax depreciationand credit policies both within agriculture and various industries within theeconomy.
Capital Gains
Current law:
Sixty percent of nominal long-term capital gains are excluded trom income.In addition, tax on the appreciation in asset values is postponed untilrealized (normally through the sale of tne asset).
33
27

Table 1--Treasury's tax reform proposal: major provisions attecting farmers(coned)
Proposed change:
Tne proposed law would continue to defer taxation of gains until realizedthrough a sale or other disposition. However, the 60-percent exclusionwould be eliminated in favor of an inflation adjustment. The cost. (basis)of capital assets would be adjusted for inflation which occurred atter thepurchase of the asset or January 1, 1965, whichever is later. Tnus, mostcapital assets would be completely adjusted for inflation.
Potential impact:
The current 60-percent exclusion does a poor job of taxing real capital gains.It overcompensates when inflation is low, holding periods are long and realappreciation is high. It undercompensates when inflation is high, noldingperiods are snort, and real gains are low. Treasury's proposal would moreaccurately tax real capital gains. The implementation of tne system wouldreduce the "lock-in effect" whuch occurs with respect to farmland and otnercapital assets during periods of nigh inflation.
Interest Income and Expenses
Current law:
Nominal interest income is fully taxed and nominai interest expenses arefully deductible.
Proposed change:
both interest income and expenses would be adjusted tor inflation. Thus, thatportion of interest income attributed to inflation would not be taxed whilethat portion of the interest expenses attributable to inflation would not bedeductible as a business expense.
Potential impact:
Adjusting interest expenses tor inflation would increase the after-tax costof borrowing, particularly for high-bracket investors. Tnis would reduce tneincentive to debt-finance investments, particularly speculative investmentduring high inflation periods. This reduced incentive to borrow combinedwith the increased incentive to save arising from the adjustment to interestincome should result in lower interest rates. The end result tor low bracketfarmers could be a reduction in the after-tax cost of borrowing.
Cash Accounting
Current law:
Most farmers are eligible for tne cash method of accounting. Some corporationswith gross receipts in excess of $1 million are prohibited from using thecash method of accounting. In addition, farm syndicates and casn-basis taxshelters are pronibited from prepaying expenses for feed, seed, fertilizer,and other supplies.
2 8 34

Table 1--Treasury's tax retorm proposal: major provisions attecting tamers(coned)
Proposed change:
The use 44 the cash metnod ot accounting would be restricted to thosebusinesses that do not use the accrual method tor tinancial accountingpurposes,.carry no inventories, and nave gross reciepts of less than 0million.-
Potential impact:
Although the proposal is not entirely ciear, a substantial number ot termscould be required to use the accrual method of accounting as a result of thecarrying of inventories. This would impose additional accounting burdens ona number of small farms. However, it would also reduce the potential tomismatch income and expenses which is the toundation for many tax shelters inagriculture.
Deducting Development and Other Expenditures
Current law:
Farmers are permitted to deduct the cost of developing certain capital assets.For example, the cost of raising dairy, drafting, breeding, or sportinglivestock to maturity; the cost associated with caring for orchards andvineyards prior to their producing crops; the cost of clearing land, soil,and water conservation expenditures; and expenditures for lime, tertilizer,and otner materials may be deducted in the tax year in which tney are paid.
Proposed change:
Treasury's proposal would require these expenditures to De capitaiized (addedto the basis of the asset) and recovered when the asset is sold or depreciated.
Potential impact:
Requiring expenditures to be capitalized would increase the atter-tax cost ofthese expenditures and thus could reduce soil and water conservation andrelated expenditures. However, it would also reduce tne tax-motivatedinvestment which has been attracted into agriculture due to the deterralpotential associated with the deductibility of development expenditures.
Tax-Exempt Bonds
Current law:
Interest on bonds issued by State and local governments are tax exempt.
Proposed change:
Treasury proposed to eliminate the exemption for interest on bonds issues fornongovernmental purposes. This would include industrial development bonds wnicnare growing in importance as a source of term credit.
3529

Table 1Treasury's tax retorm proposal: major provisions atrecting tamers(cont'd)
Potential impact:
In recent years, several States have issued tax-exempt industrial developmentbonds to provide low-interest Loans for the purchase of farmland. Eliminationof the tax-exempt status of such bonds would eliminate this source ot low-cost financing. However, other provisions contained within the proposalcould lower interest rates and reduce tne need tor alternative sources offinancing.
Retirement contributions
Current law:
Farmers may contribute S2,UUU per year to any individual Retirement Account(IRA). A farmer and a nonworking spouse may contribute 42,25U to a spousalIRA.
Proposed change:
The contribution limit to an IRA would be increased tu SZ,JUU. A tamer andspouse could contribute S5,UUU per year to a spousal IRA.
Potential impact:
This should stimulate additional savings and permit tarmers (especially Mosewith nonworking spouses) to increase retirement savings to supplement socialsecurity benefits.
Summary and Conclusions
Farm commodity programs have been enacted to support family-owned and operateafarms. The programs have directly supported commodity prices and indirectlysupported farm income. Research strongly suggests that such benefits aredistributed in direct proportion to the volume of output and have discourageasmall farms and encouraged greater expansion and concentration in taming.
Coupled with farm programs, Federal and, analogously, State income tax policieshave also encouraged greater expansion and concentration in farming. Federalincome tax policy has encouraged investment in capital over laoor in concentratedanimal production units and in tax sheltered livestock and dairy oreedingoperations. Further, income distortion results from current expensing ot certaincapital improvements and cash-basis accounting. Tax-loss taming may encourageunneeded production by part-time farmers.
One of the challenges tacing policymakers is to secure adequate data to determinehow the farm sector "farms" the tax code and how tax changes would attect tarmproduction, organization, and concentration.
3036

As this paper has suggested, there are a number of questions yet to be answered.
For example: Are the positive goals of cummodity-price and income-support programscounteracted by after-tax decisions made by farmers? Can and should tam capital
cost recovery be more closely related to an asset's economic life? Can the
effects of tax decisions be more readily identitied to provide more neutral. taxpolicy decisions tor the farm economy?
One ot our challenges is to create the correct information base tu begIn answeringthese and other questions. Another challenge for the profession is to then woreadequately provide the quantitative research and analysis about commodity policyalternatives and the effects of tax policy on the farm sector.
Reterences
Baum, K., and D. Harrington. "Effects of Alternative Economic, Tax, and Commodity
Policies on Regional Representative Farms," ERS Staff Report No. AGES8112.44.U.S. Dept. Agr., Econ. Res. Serv., Jan. 1983.
Boehlje, M. "Analysis of the Implications of Selected income and Estate TaxProvisions on the Structure of Agriculture." CARD Report 105, Iowa StateUniv., Ames, 1981.
Boehlje, M. and K. Krause. "Economic and Federal Tax Factors Affecting the Cnoiceof a Legal Farm Business Organization." AER-468. U.S. Dept. Agr., Econ.Res. Serv., June 1981.
Carlin, To, and F. Woods. "Tax-loss Farming." ERS-J46. U.S. Dept. Agr., Econ.
Res. Serv., April 1974.
Davenport, D., M. Boehlje, and D. Martin. "The Effects of Tax Policy on American
Agriculture." AER-480. U.S. Dept. Agr., Econ. Res. Serv., Feb. 1982.
Doye, D., and M, Boehlje. "A Flat Rate Tax: What it Means tor Farmers and
Agriculture." Unpublished manuscript. Dept. Agr. Econ., Iowa State Univ.,March 1984.
Day, 4. "Micro-Macro Dynamics and Completed Economic Behavior." Risk Analysisfor Agricultural Production Firms, Concepts, Information Requirements, andPolicy Issues. Proceedings of 6-18U meetings, Dept. Agr. Econ., Univ. of
AE-4574. July 1984.
Durst, R. "Federal Tax Folicy and Agriculture." Unpublisned manuscript.
Dept. Agr., Econ. Res. Serv., Dec. 1984.
U.S.
Durst, R., and R. Jeremias. "An Analysis of Tax Incentives for Dairy Investments."
Unpublished manuscript. U.S. Dept. Agr., Econ. Res. Serv., Feb. 1984.
Durst, R., and R. Jeremias. "The Impact of Recent Tax Legislation and Inflation Ln
the Taxat:'-n of Farm Capital." Agricultural Finance Review, Vol. 44(1984),pp. 46-42.
Durst, R., W. Rome, and J. HrubovcR. "Tne Economic Xecovery Tax ACt of 1981:
Provisions of Significance to Agriculture." ERS Staff Report No. AGES81U9O8.U.S. Dept. Agr., Econ. Res. Serv., Sept. 1981.
31 37

Eidman, V. "Casn Flow, Price Risk, and Production Uncertainty Consideration,"Modeling Farm Decisions for Policy Analysis. Ed. K. Baum and L. Scnertz.Boulder: Westview Press, 1983.
Harl, N. "impact of Tax Policy on American Agriculture," United State AgriculturalPolicy: 1985 and Beyond. Ed. Jimmye Hillman. Dept. Agr. Econ., Univ. ofArizona and Resources for the Future, 1964.
Harrington, D. "Costs and Returns: Economic and Accounting Concepts." AgriculturalEconomic Research. Vol. 35(1983), pp. 1-8.
Harrison, V., and F. Woods. "Farm and Non-tarm Investment in Commerical BeetBreding Herds: Incentives and Consequences ot tne Tax Law." FAS-497. U.S.Dept. Agr., Econ. Res. Serv., 1972.
Heady, E. O., T. Reynolds, and K. Baum. "Tax Policies to increase Farm Pricesand Income: A Quantitative Simulation." Canadian Journal of AgriculturalEconomics, Vol. 24, No. 3(1970, pp. 1-14.
Johnson, J., and K. Baum. "Whole Farm Survey Data for Economic Indicators andPerformance Measures." Agricultural Economic Research, Voi. 38(1966),fortheOming.
Johnson, J., K. Baum. and A. Clauson. "Income and Asset Valuation Effects of Foodand Agricultural Policy," Increasing Understanding ot Public Problems andPolicies-1984. Farm Foundation, Oak Brook, IL, 1965, pp. 98-1O8.
Johnson, J., and S. Gabriel. "Aggregate Indicators of Financial Conditions inthe Farm Sector: Some New Approaches and Insignts." Proceedings ot tne NC-1o1Meetings. St. Louis, MO, Oct. 1984.
Penson, J., D. Hughes, and K. Romain. "An Uverview ot Comgem: A MacroeconomicModel Empnasizing Agriculture." Unpublished manuscript. Financial ModelingWorkshop, Dallas, TX, Dec. 1984.
Rasmussen, W. "History of Agricultural Price-Support and Adjustment Programs,1933-84: Background tor 1985 Legislation." AIB-465. U.S. Dept. Agr., Econ.Res. Serv., Dec. 1984.
Rausser, G., R. Just, and D. Ziiberman. "Prospects and Limitations ot OperationResearch Application in Agriculture and Agricultural Policy," OperationsResearch in Agriculture and Water Resources. Ed. D. Yaron and C. Tapiero.North Hoiland, Amsterdam: 198U.
Sinclair, W. "Farm Failures Threaten to Reshape Us," Wasnington Post. Jan.27, 1985.
U.S. Department of Commerce, Bureau of the Census, "Census of Agriculture 1974,1978, 1982." Washington, D.C.
Vertrees, J., and A. Morton. "Crop Price Support Programs: Policy uptions torContemporary Agriculture." Congressional Budget Uffice, Washington, D.C.,Feb. 1984.
38

FARMER PREFERENCES FOR TAX REFORM ISSUES USINGMULTI-CHOTOMOUS LOGIT ANALYSIS
Daniel M. Utto and Gregory D. Hanson
Introduction
Since the views and interests of tarmers are often used as justitication tordeveloping special tax provisions aftecting agriculture, a survey to explore tarwerviews of various tax issues and problems was conducted in lowa and Alabama.Among the issues explored were farmers' preferences tor: (a) a tlat-rate taxstructure in place of the present progressive system, (b) lower tax rates witnfewer special farm tax provisions, and (c) "tairness" in the tax system.
Farmer attitudes toward these tax reform issues are expected to be influenced byvarious personal characteristics such as age and education as well as economicfactors. A better understanding of how tamers' socioeconomic characteristicsrelate to their attitude on tax issues can give policymaKers information on thefeasibility or acceptabil''w of various tax reform proposals. lf significantrelationships exist betweea certain classes of farmers and their attitude towardtax reform, this analysis could help identity special tam interest groups torwhom further educational efforts may be useful. A multi-chotomous logit mode/is used to examine how various demographic and tarm characteristics influencefarmers' level of acceptance of several tax reform issues.
yheory and Related Literature
Statistical analysis of models with qualitative dependent variables can be viewedas the problem of predicting probabilities for the various possible responses ofthe dependent variables. In the agricultural economics literature, probit andlogit analysis are two well-Known techniques for analysis in cases where thereare only two possible outcomes, usually the occurrence or nonoccurrence of someevent (Hill and Kau, 1973; Epperson and others, 19d0). More recently the logitand probit techniques have been extended to cases of tnree or more categoricalresponses in the dependent variable (Schmidt and Strauss, 1975). The logit andprobit formulations have very similar characteristics. Both the standard normaland the logistic distributions are symmetric about U, the mean or tneirdistribution. The distribution functions are also very similar in mid-range witnthe logistic distribution having slightly tatter tails tnan the standard normaldistribution. Although logit or probit should give similar results. The multi-chotomous logit model was chosen for use in tnis study because ot sottware avail-ability. The derivation of the multi-chotowous logit model is presented in theapr-Indix. The reader is reterred to Amemiya (19d1) tor a recent comprehensivereview of literature on "se of qualitative response variables, which includes tnemulti-chotomous 1ogit
*Daniel M. Otto is a& c -4, , professor of economics at Iowa State University andGregory D. Hanson is in the Economic Indicators Branch, U.S. Department of Agri-culture. B.R. Eddleman also contributed to the revision ot this report.
33 39

The Data
A multi-chotomous logit model was used to predict a farmer's degree of acceptanceof several tax reform proposals based on personal and economic characteristics.Personal characteristics include education level and age of the operator andyears in farming, which were measured continuously in terms of years. Economicvariables include value of machinery and building assets, 1982 operating expenses,and usual level of farm sales (all measured as dummy variables over three intervals$0139099, $40,000-$99,999, and $100,000 or more) and size of farm (measured inacres).,.A dummy variable for State was used with Iowa = 0 and Alabama = I.
Previous information from tax simulation studies has suggested that higher incomefarmers would have a reduction in their tax bill under a flat-rate tax plan (Doye andBoehlje, 1984) so that farmers with larger operations were expected to be moreagreeable to flat-rate tax reforms. However, the larger farmers with larger andmore'diverse holdings were expected to be better able to take advantage of specialtax provisions to shelter their income so that a hypothesized relationship forthese variables was not made. Education and years in farming were expected toincrease farmer awareness and experience with tax systems so that these variableswere hypothesized to be inversely related to agreement with tax changes; that is,farmers would be reluctant to drop a tax system with which they are familiar (oralternatively, to discontinue a system providing flexibility to legally manipulatethe tax system to lower tax bills).
Using these explanatory variables individual farmers were predicted to have oneof a range of five responses to each tax reform proposal. These responses rangingfrom strongly disagree to strongly agree are listed in table 1. The observationsused to estimate the model in this study were based on a pooled sample of Alabamaand Iowa farmers in the Alabama-Iowa Farm Tax Issues and Problems Survey (Ottoand Hanson, 1983) conducted in the spring of 1983. Complete data on all variableswere collected for a sample of 252 farmers in Iowa and 260 in Alabama.
The Empirical Model
The individual equations to be estimated in the multi-chotomous response modelare designed to be contrasted with a particular category of response. In thisparticular study, the second through the fifth categories are contrasted with thefirst, the strongly disagree category. These four contrasts mean that fourequations need to be estimated for each response variable. These individualequations are in the form:
log (P /P ) BjXjj--2.-I- BIO B11Xlilog (P3/P1) B20 B2IXli + B2j3Cjilog (p4/P1) = B30 + B31Xli + B3DCjilog (P5/P1) = B40 + B31Xli + B4PCji
In the logit specification, the sum of the individual probabilities equal 1 sothat the remaining equations can be derived from these four equations. Forexample, since
log(P3/P2) = log (P3/P1) - log (P2/P1),
the subsequent model can be derived as
log (P3/P ) + (B2j-B1j)Xji,I (B20-B10) (B21-B11)Xli,
344 0

Table 1--Kesponse of Alabama and Iowa tamers to tax reform issues
Item2
: Units:
: Attitude scale:Strongly:disagree
:
: Disagree.: No
: opinion : Agree: Strongly: agree
:
Flat-rate tax :
preferred to :
progressive tax :
structures :Alabama N lb 21 9b bo b3 252:Percent 25.0 22.2 38.1 8.3 6.4 100:Iowa N 51 68 70 40 31 200:Percent 19.6 26.1 26.9 15.4 11.9 1UU:Total N b/ 89 ibo 90 94 312:Percent 13.1 17.4 32.4 18.7 18.4 100
Lower tax rates :
with fewerspecial provis-ions preterred :Alabama N 4 15 bU 91 d2 232
:Percent 1.6 6.0 23.5 30.2 32.7 1UU:Iowa N 6 20 54 llb b2 200:Percent 2.3 7.7 20.8 44.b 23.6 1UU:Total S lii 35 llb 207 144 512:Percent 2.0 0.9 22.3 40.b 28.2 100
Lower tax rate with:fewer specialprovisions would
.
:
be fairer :Alabama N 5 15 02 09 101 252:Percent 2.0 6.0 24.3 27.5 40.2 100:Iowa N 1 25 50 99 do 2b0:Percent .4 9.b 1b.b 38.1 33.0 100:Total N 6 40 112 It'd 187 512:Percent 1.2 7.8 21.9 32.8 30.3 IOU
N is the number of observations
where (P3/P2) is the probability of choosing the third Level of response insteadof the second.
,Stuay Results
rats estimated coefficients and their estimated asymptotic standard errors torthese functions are presented in tables 2 to 4 for tue three tax reform proposals.Tne parameter estimates for the multi-chotomous logit model are the incrementalprobability of being la a higher (or lower) response catesory trom a unit changein the independent variable. As an example, the generally negative coefficientsfor the education variables imply tuat higher education levels decrease theprobability that farmers will agree with tne tax retorm assertions. Specifically,the value of -.075 for the education variable in the log (1'4/P3) equation ot table2 can be interpreted as a decrease in the probability of choosing an agreeresponse (P4) relative to a no-opinion response (P3).
35 41

The statistical results presented in tables 2 to 4 indicate tne hign level otsupport among all classes of farmers tor a flat-rate tax and lower rates witnfewer provisions. Tne lack ot a large number of significant coefficients amongthe variables measuring levels of current expense, farm sales, and acres suggeststhere is no systematic pattern in the nature of tne support tor these tax reformissues. The broad intervals used for these independent variables may have contributedto the nonsignificance of these results. Tne age-of-farmer variable was mostconsistently significant witn predominately negative coetticients suggesting tnatolder farmers were less supportive of these tax reforms than were younger farmers.Other characteristics of these older farmers such as farm size and income couldalso have contributed to the negative relationsnip between farmers* age and theirsupport for tax reform. Level of education also appears to have a number ofsignificant coefficients with negative values suggesting that tarmers with moreeducation were less supportive of these tax reform issues. The coefficientsassociated with the State variables provide an estimate of the differences in the
probability of agreeing with a tax reform proposal by State of residence. SinceAlabama was coded with value 1, the largely negative coefficients for the Statevariable in tables 2 and 4 indicate a lower level of agreement witn these taxreform proposals for Alabama farmers than among Iowa farmers.
There was an almost even distribution of positive and negative coetficients in thevarious farm-size variables (acres, current expense level, and farm sales) whichwas consistent with tne lack of a statistically significant relationship betweenthese size variables and the tax issues variables. This lack ot a relationshipwas counter to our original expectation that larger farmers would favor the taxreform proposals since they would be expected to benefit most from the changes.Iowa farmers appeared to be less in favor of the flat-rate tax proposal, but moresupportive of the progressive tax rate with fewer special provisions compared toAlabama farmers as indicated by the negative coefficients tor the State variables.Since the farm sales variable was a volume measure closely related to the currentexpense-level variable and was not significant, it was not included in the modelspresented in table 4.
It is also possible to use these multi-chotomous logit results to evaluate the -
probability of a farmer choosing a particular response to tax issues given farmand personal characteristics. Table 5 contains examples of these probabilitiesfor the three tax issues evaluated at the sample mean for termer education level,years in farming, farm size, and modal value tor the categorical farm sales andcurrent expense variable for Alabama and Iowa. These probabilities are anotherway of evaluating the level of support for these tax reform issues. individualprobabilities were obtained using the following expression tor the first category:
P lt 1
XtBiand Pit e
N XtBj N XtBj1 + E e 1 + E e
J2 J2
for (i 2 N) for the N equations.
The pattern of probability of response for these various categories of supportfor tax reforms is similar to the pattern of response presented in table 1. Theusefulness of the procedure is in being able to estimate the level of response totax issues based upon individual characteristics of farmers. Tables of probabilities
4236

Table 2. Estimated coefficients and standard errors of Alabama and Iowa farmer preferences for flattax rate over present tax system.
Con- Educa-stant tion Acres Age
Years Currentin Expense Farm Sales
farming CI C2 SI S2 State
log (P2/P1) -2.67 .106* .00007 -.208** .005 .339 1.78* .699 -.438 .982*(1.59) (.066) (.0008) (.023) (.020) (.607) (.902) (.525) (.890) (.423)
log(P3/P1) -.271 .026 -.0007 -.026 .009 .623 1.32 .967* .180 .709*(1.46) (.064) (.0008) (.021) (.019) (.588) (.872) (.507) (.837) (.399)
log(P4/P1) 2.18 -.049 .0007 -.0202 .004 .297 .753 .393 -.224 -.148(1.20) (.053) (.0007) (.018) (.015) (.547) (.840) (.444) (.782) (.334)
log(P5/P1) .767 .0017 -.0004 -.0109 .007 -.112 .670 1.166* .467 -.157(1.31) (.058) (.0008) (.019) (.016) (.571) (.900) (.465) (.849) (.364)
log(P3/P2) 2.94 -.08* -.00077 -.0052 .004 .284 -.46 .268 .621 -.273(1.01) (.047) (.00063) (.015) (.012) (.463) (.719) (.359) (.653) (.270)
log (P4/P2) 4.85 -.155 .00063 -.0005 -.0001 -.042 -1.027 -.306 .214 -1.13*(.961) (.042) (.00063) (.014) (.011) (.457) (.716) (.356) (.648) (.272)
log (P5/P2) 3.43 -.104* -.00047 .0099 .002 -.451 -1.11 .467 .905 -1.139*(.967) (.042) (.00063) (.014) (.011) (.458) (.71) (.352) (.644) (.266)
log (P4/P3) 2.45 -.075* .0014 .0058 -.005 -.326 -.567 -.574 -1.191* -.857*(.963) (.042) (.0006) (.014) (.011) (.457) (.707) (.345) (.643) (.268)
log (P5/1,3) 1.04 -.024 .0003 .015 -.002 -.616 -.65 .199 -.5 -.866**(.970) (.043) (.0006) (.014) (.011) (.459) (.710) (.354) (.645) (.264)
log (P5/P4) -1.41 .051 -.0611 .0093 .003 -.29 -.083 773* .691 -.009(.957) (.042) (.0006) (.014) (.011) (.458) (.704) (.353) (.641) (.266)
*Significant at the 10 percent level.**Significant at the 5 percent level.
43

Table 3. Estimated coefficients and standard errors for Alabama and Iowa farmer's preferences forlower tax rates with fewer special provisions.
Con-stant
Educa-tion Acres Age
Yearsin
farming
CurrentExpense Farm Sales
StateCI C2 SI S2
log (P2/P1) 6.45 -.143 .0014 -.094 -.086 -2.30 -13.01 1.132 5.75 -2.80*(4.86) (.264) (.0001) (.074) (.102) (3.32) (40.4) (1.69) (3.71) (1.374)
log(P3/P1) -3.39 .064 .00001 .007 -.022 -.264 .763 -.457 .389 .702(1.74) (.055) (.0006) (.026) (.022) (.755) (.931) (.624) (.952) (.435)
log(P4/P1) .386 .009 .0001 -.033* .016 .146 .375 -.343 -.411 .202(1.08) (.038) (.0005) (.016) (.013) (.438) (.696) (.392) (.680) (.302)
log(P5/P1) 1.13 -.028 .00008 -.027 -.012 -.321 -.062 .439 .841 .262(.980) (.039) (.0004) (.015) (.013) (.365) (.583) (.332) (.569) (.264)
log (P3/P2) -9.84 .207* -.0013 .101* .064* 2.036 13.77 -1.59 -5.36 3.50*(.662) (.025) (.00031) (.01) (.026) (2.81) (43.80) (2.68) (4.21) (.187)
log (P4/P2) -6.06 .152* -.0013 .061* .102* 2.446 13.38 -1.47 -6.16 3.002*(.71) (.025) (.00031) (.021) (.029) (2.62) (43.7) (2.41) (4.20) (.189)
log (P5/P2) -5.32 .115* -.0013 .067* .085* 1.98 12.94 -.693 -4.91 3.062*(.757) (.029) (.003) (.011) (.026) (2.81) (43.7) (.798) (4.44) (.20)
log (P4/133) 3.77 -.055 .00009 -.04* .038 .410 -.388 .114 -.80* -.50*(.692) (.029) (.0003) (.011) (.0296) (.260) (.44) (.241) (.432) (.194)
log (P5/P3) 4.52 -.092* .0007 -.034* .021 -.057 -.825* .896* .452 -.44*(.693) (.0268) (.0003) (.01) (.027) (.262) (.439) (.251) (.428) (.195)
log (P5/P4) .744 -.037 -.00002 .006 -.017 .467* -.437 .782* 1.25* .06(.692) (.026) (.00031) (.01) (.027) (.260) (.44) (.246) (.425) (.189)
*Significant at the 10 percent level.
4 4

Table 4. Estimated coefficients and standard error of Alabama and Iowa farmer attitudecm lower tax rates with fewer provisions being fairer.
Con-stant
Educa-tion Acres Age
Yearsin
farming
CurrentExpense Levels
StateCl C2
log ("2/P1) -4.391 .191* -.0007 .0005 -.0118 .978 1.29 1.41*(2.43) (.099) (.0008) (.04) (.035) (.795) (.957) (.594)
log(P3/P1) -2.27 .120 -.0014 -.001 -.04 1.59 .971* 1.30*(2.28) (.098) (.001) (.038) (.034) (.758) (.982) (.577)
log(P4/P1) -.692 .036 0.0002 .003 -.014 .611 .407 .728
(1.93) (.084) (.0007) (.034) (.029) (.731) (.915) (.501)
log(P5/P1 -.284 .060 -.0006 0.008 .005 .965 .270 .359
(1.95) (.084) (.0008) (.035) (.029) (.732) (.966) (.515)
log (P3/P2) -2.12 -.071 -.0007 -.0015 -.028 .612 -.319 -.11(1.71) (.077) (.0007) (.030) (.026) (.660) (.822) (.440)
log (P4/P2) 3.699* -.155* -.0005 .0025 -.002 0.367 0.883 -.682
(1.64) (.070) (.00063) (.03) (.025) (.657 (.821) (.438)
log (P5/P2) 4.107* -.131* .0001 -.0085 .0168 -.013 -1.02 -1.051*(1.62) (.071) (.0006) (.029) (.0248) (.651) (.810) (.428)1.578 -.084 .0005 .004 .026 -.979 -.564 -.243
log (P4P3)(1.64) (.071) (.00061) (.030) (.0256) (.661) (.825) (.440)
1.986 -.06 .0008 0.007 .045* -.0625 -.701 -.612log (P5/P3)
(1.62) (.07) (.0007) (.029) (.024) (.654) (.814) (.433)
.408 .024 .0004 -.011 .019 .345 -.137 -.369log (P5/P4)
(1.6) (.069) (.0006) (.029) (.024) (.652) (.811) (.430)
*Significant at the 10 percent level.
45

Table 5--Probabilities of farmer response to farm tax issues based on average levelsof education, acres, farmer age, years in farming, current expenses, and farmsales
Item Units:Strongly : No : : Strongly:disa ree : Disa ree : o inion : A ree : a ree
Flat-rate tax preferred : Alabama .085 .061 .239 .329 .284to progressive : Iowa .068 .13 .381 .226 .193
Prefer lower tax rates : Alabama .098 .094 .024 .232 .549with fewer provisions : Iowa .02 .018 .073 .324 .567
Attitudes on fairnessof lower tax rates : Alabama .105 .086 .175 .233 .398and fewer provisions : Iowa .049 .163 .298 .224 .265
Mean of variable Alabama Iowa Average
Education 1/ (years) 12.06 12.07 12.07Acres (per farm) 185.7 315.7 253.7Age (years)
: 55.48 51.4 53.4Years in farming(years) : 30.8 26.9 28.7Current expense(dollars): 40,000-100,000 MOINE
Farm sales (dollars) . 40,000-100,000
--Not applicable.1/ Although the overall education level of farmers in Alabama was lower than inIowa, this analysis was conducted for the subset of farmers who filled out allthree tax policy questions which resulted.in a similar mean education level inboth States.
could be generated for farms of different sizes, sales, and demographiccharacteristics of operator.
Summary and Conclusions
Farmer attitudes toward three tax reform proposals were investigated using amulti-chotomous logit model. Years in farming was found to be inversely relatedto agreement with these tax changes and value of farm sales was found to begenerally insignificant. Education and size of farm measured in acres andexpense levels were found not to be significant. While these were not particularlystrong results, they do suggest that the high level of support observed for thesethree tax reform proposals (table 1) is broadly based among farmers of differentsizes and educational backgrounds. The multi-chotomous logit model provided auseful framework for analyzing survey data involving categorical attitude variablesand for testing the hypothesized relationship among the various tax and demographicvariables. These procedures provide a method of predicting level of supportbased upon the characteristics of individual or groups of farmers.
4640

Further research efforts testing whetner other demograpnic or farm characteristrcvariables influence farmer preterences toward tax change proposals may be useful.Additional ranges of values of farm and personal characLeristrcs can ue evaluatedto estimate the probability of response levels tor different tam groups.
References
Amemiya, T. "Qualitative Reponse Models: A Survey," Journal of EconomicLiterature Vol. 19(1981), pp. 1483-153b.
Doye, Demons, and Michael doehlje. "A Flat Rate Tax: What it Means tor Farmersand Agriculture." Staff paper, Dept. of Economics, lowa State Unrverarty, la,1983.
Epperson, J.F., C.L. Huang, S.M. Fletcher. and W.K. Scearce. "Tne Determinantsof Food Stamp Program Participation," Southern Journal of AgriculturalEconomics, Vol. 12(1980), pp. 93-97.
Hill, L., and P. Kau. "Application of Multivariate Probit to a Tnreshold Model otGrain Dryer Purchasing Decisions," American Journal of Agricultural Economrcs,Vol. 55(1973), pp. 19-27.
Otto, Daniel M., and Gregory D. Hanson. "Farmer Vrews Issues and Problems:Survey Results from Iowa and Alabama," P-1131, Department of Economics,Iowa State University, Ames, LA, 1983.
Schmidt, P., and R.P. Strauss. "The Prediction of Uccupation Using MultipleLogit Models," International Economic Review, Vol. 1b(1975), pp. 471-8b.
Appendix: The Logit Model
The multi-chotomous logit model is an extention of the binary logit moaer tocases of three or more alternatives. This alternative approach is neeaed sincethe use of ULS for parameter estrmition tor the dichotomous or N-cnotomous caseviolates the desirable assumptions of constant variance and zero mean of theerror team.
The probit and logit models were de -eloped to circumvent these statistical problemsof the linear probability model. Ir the logit model, the probability that adecisionmaker chooses a nonzero versus a zero or no response is translated from anindex value (Zi) which is estimated as a linear function of regressions:
(Zi) Xi'd
The classification of y as U 1, I can be represented as follows:
1 if Zi > Zi*Yi
0 if Zi < Zi*
where Yi is the dichotomous choice of the ith decisionmaker and Z* is a criticalor threshold value of the index Z. In this process, each yi is thus a functionof the individual characteristics (Xs) by way Zi and Zi*. The index Zi, whichcan have values ranging from minus to plus infinity is translated to a unitinterval range by use of the cumulative distribution function (F(Z)).
4 741

The logit probability model is associated witn tne logistic cumulative distributionZi Zi
function F(Zi) e /(1+e ).
In the binary logit model, the analysis estimates the probability (Pi) that tne itndecisionmaker selects the first decision is given by:
Pi = F(Z) eZi/(1+eZi),<
where F(Zi) is the logistic cumulative distribution function.In the zero-one-case, this expression can also be written as:
Zi log (Fi/(1-Pi)) XIS.
The ratio Pi/(1-Fi) represents the odds in favor ot selecting the tirst alternativeby the ith decisionmaker.
The multiresponse logit model is similar to the binary choice case:
Kn. j) FIJ(XS),
Where i 1,2,3,...t for the ith individual, j = N tor the jtn alternative,and where X represents the vector of independent variables and b represents thevector of unknown parameters. In tnis model, tile explanatory lectors include tneattributes of the tax preference alternatives as well as tne cnaracteristics ofthe decisionmakers.
For estimation purposes, tne N-cnotomous model can be written as:
Pij
log XB.Pij
The log-likelihood function tor this model is:
log L E E fij log (PO,iI j1
where Pij is the expression for the multinominal logic model:
XijIB
Pij =N xijSE e
Consequently, the log-likelihood ruction tor tnis model is:
T Nij
log L E E fij log (e ).i1 j1 N XIiib
E e
Maximum-likelinood techniques are used to rind estimates ot the parameters kb)
from this expression.
42 48

INCOME TAX REFORM AND AGRICULTUKE: DISCUSSION
B.R. Eddleman*
In line with the plan of the symposium on Income Tax Reform and Agriculture, thepapers were at hand before we met and fel/ into three groups: the interrelationsamong Federal income tax provisions, farm commodity policy, and economic changein agriculture; farmers' attitudes toward income tax reform; and a set of economicconsiderations that may prove useful in choosing an optimal income tax policy toragriculture. Judging from the discussion the papers generated, we should give ahigh mark to the plan for the symposium. I shall comment on some parts of thepapers presentea at the symposium, raising questions about the analyses and theimplications for tax and farm price/income-support policy.
Optimal Income Tax Policy tor Agriculture
Breimyees'paper reflects hie usual incisiveness into the economic issues andeloquence in expressing his insights. My assessment of Breimyer's optimal incometax policy for agriculture would be a set of tax provisions that:
(1) do not provide for tax sheltered investments (deductions) in agriculture,(2) do not allow depreciable investments to be used as current operating
expense to reduce taxable income,(3) do not allow capital gains to be taxed at rates different than earned
income, and(4) require use of accrual accounting by farmers tor tax purposes.
My personal biases are in line with Breimyer's and to attempt to expand on hisrecommendations would be futile. I also believe that tax shelters erode theprogressive feature of the income tax; set into motion a whole set of legalmaneuverings and countervailing powers to tailor provisions to certain interestgroups; interfere with prices and the market system in determining resourceallocations and product distributions; and generally contribute to over-valuationof resources, enlarged investment, and over-capacity in agriculture. Current taxdeduction or shelter schemes that abound in our Federal income tax laws appear tohave modified the longstanding credence of American democracy, "From each accordingto his ability and to each according to his need" to more or less one of "to eachaccording to his ability (to manipulate or evade) and from each according to our(the Federal Government's) need." There is probably no American institution ingreater need of reform than the Federal income tax policy.
Some have proposed levying an ad valorem tax or a user tee on all farm commoditiespaid by the first-purchaser as an alternative for or a supplement to currentincome tax policy. Uthers have proposed a value-added tax scheme at all levelsin the economic production, fabrication, and distribution process. Such taxprovisions would generally result in the tax burden being passed on to the ultimateconsumer through increased retail prices. As such their impacts in agriculturewould not be unlike the State or local sales tax on food purchases in that theyplace the heaviest relative tax burden on those with the least ability to pay.
*B.R. Eddleman is professor of economics, Dept. of Agr. Econ., Mississippi StateUniversity. Several of the concerns of Dr. Eddleman regarding the papers presentedin the symposium have been addressed in full or in part during the revision process.
4 943

Income Tax, Farm Commodity Poiicy, and Economic Change
The two papers devoted to this topic give a rich account of past, current, andproposed tax laws. The paper by Nixon and Richardson provides a succinct reviewof the important provisions impacting on agriculture of the Tax Reform Act of1984 (TRA), the Department of Treasury's proposed Tax Retorm tor Fairness,Simplicity, and Economic Growth Act (Treasury I), and President Reagan's proposedtax reforms (Treasury II). The authors tnen proceed with a rather extensivediscussion of their Firm Level Income Tax and Farm Policy Simulation Model (FLIPSIMV).
The simulation model was used to estimate the impacts ot current 'ERA and proposeaTreasury I tax provisions on moderate-size and very large crop farms in Texas,Mississippi, and Illinois. The simulation model provides options tor allowing urnot allowing growth of the farm firm over time through purcnases and/or leasingof additional cropland and acquisition of additional machinery and equipmentrequired for expanded operation, The authors do not indicate wnether the tarmswere allowed to grow and, if so, whether they actually grew in total acresoperated in comparing the impacts of the two sets ot tax provisions. It thefarms do not grow, then differewes ill average ending net worth, annual net termincome, and annual income tax payments are direct effects of differences betweenthe two tax policies. However, if one or more ot the farms increased its acreageoperated then a portion of the differences in these economic measures resultsfrom second-order structural changes in the firm in response to differences inthe tax incentives. Since all tarmers are not motivated to increase tne size oftheir farming operations, it would have been insightful if the authors naddifferentiated these types of impacts. As a side note, tne data presented intable 2 of the Nixon and Richardson paper reports "acres leased" as "acres owned"and this gives some widely divergent per-acre values tor owned cropland. Tnecorrect entries should be as follows:
Acres owned
Texas cotton farms Misaissippi crop farms Illinois grain terms
381 3,453 533 3,064 260 458
As a second general comment, comparison of the tax provision impacts resulted insubstantial differences in tax payment per dollar of annual net farm income tor theIllinois grain farms relative to the Texas cotton and Mississippi crop farms.
Tax payments per dollar of annual net farm income were 34 percent less tor themoderate-size Illinois farm than for the moderate-size Texas and Mississippifarms under TRA, and 22 to 32 percent less under Treasury I, even though averageannual net farm income was of the same general magnitude on each type ot farm.Similar tax payment differences per dollar of net farm income of 39 to 4o percentless under TRA and 37 to 51 percent less under Treasury I resulted for the verylarge Illinois farm compared with the very large Texas and Mississippi farms.
However, the very large Illinois farm had an annual net term income considerablyless than the net farm income on the very large Texas and Mississippi farms.Personal exemptions, standard deductions, tamily withdrawals claimed as personalexemptions, and net-farm-operating losses carried forward from previous years wereunlikely to account for these differences. Thus, ditterences in the age structureof the machinery complement, the timing of replacement machinery, and tne investmenttax credits applicable to the farms probably accounted for these difterences amongIllinois farms versus Texas and Mississippi farms.
4450

A final. comment on the Nixon and Richardson paper concerns tneir conclusion thatthe Federal income tax provisions of TRA and Treasury I are relatively neutralwith respect to structure witnin a given farm type. This conclusion stems tromtheir observation that the tax burden (dollar taxes/doiiar receipts) was aboutthe same for moderate-size and very large farms of a given type. it is incomeafter taxes that reaiiy matters with regard to internal capital accumulation onfarms and, hence, the ability to invest in additional farm assets. Treasury 1provisions would result in substantial net gains in after-tax income relative toTRA provisions, and tor very large farms relative to moderate-size farms. For
exampie, after-tax income would be $13b,SUU higher over the 6-year period un thevery large Texas farm under Treasury I compared with Tha. On the moderate-sizeTexas farm the after-tax income advantage of Treasury I is $35,40U. Similarly,for the very large and moderate-size Mississippi farms, the atter-tax incomeadvantage of Treasury 1 relative to TRA is $144,bUU and $4,400, respectively,over the 6-year period. The estimates of the advantages of Treasury I for tneIllinois farms are $61,8UU and S31,20U tor the very large and moderate-size farms,respectively. Thus, the net gains in atter-tax income under Treasury I provisionsrelative to TRA provisions are two to four times greater tor the very Large farmsthan for the moderate-size farms.
The paper by Baum and others is ditficuit to assess, partly because the varioussections deal with seemingly unrelated material. The paper reads as it each ofthe four authors wrote a section and then loosely hung them together. Theintroductory section of the paper raises a number of important questions concerningthe distribution of tax policy benefits: prescription of tax and commoditypolicies for the farm sector; control of farm resources and decisionmaking; andmonitoring and forecasting productive capacity, etficiency, resource use, financialstability, etc., of the farm sector. Yet, one does not find a meaningful treatmentof these questions in the paper.
The section on economic methodology appears most unreiated to the otner sectionsof the paper. The farm decision framework is posed as an optimizing processwhereby total realized and unrealized financial gain is a function of total betoretax net revenue above variable costs, plus government payments and nominai capitalgains on land holdings, less payments tor leased land and capital items and lessinvestment costs on current and new capita/ items (including investment taxcredits). Tnis function would be maximized tor an individual farm firm subjectto constraints on total acreage operated, resources or technology capacity, andavailable investment capital. The model is presented with no empirical analysisto show that it may be useful. I take a critical view of such a paper. I holdthe view that no paper should be published unless the authors have used theirmodel in empirical analysis. Our agricultural economics literature is plaguedwith an abundance of unused models.
The remaining sections of the paper include a nistory of agricultural. pricesupport and adjustment programs and a discussion of current and proposed Federalincome tax provisions as they aftect the farm sector. I find tnis latter sectionto be the most informative with respect to the authors' interpretations of thepotential impacts on agriculture. In their summary of tne tax research literatureregarding impacts of tax policy and price/income-support policies on the farmsector, it might be well to add that in recent years tne $50,U0U payment limitationon deficiency and diversion payments may have encouraged family farms toincorporate to as large extent as the estate and income tax laws. Reports aboundof schemes by tax avoidance limited partnerships whereby farmers cleverly dividetheir operations into several "payee units."
45 51

I also find interesting the notion tnat tax depreciation and tax credit policiesmay have reduced the productive efficiency ot tne farm capital stock. Some otthe real cost3 to society of high real interest rates over the past tew years waynot have been realized yet because accelerated tax depreciation methods mask themagnitude of real declines in the farm capital stock. dugnes and Fenson in arecent paper have estimated that continued low investment could result in adecline in the stock of total depreciable assets in farming by one-fifth tnrougn1995. They translate this decline in 'assets into a 4-percent decline in aggregatefarm output, a subsequent 12- to 27-percent increase in farm level prices, and asmuch as a 7-percent increase in consumer food prices by 1995.
The authors' review of current tax law and proposed tax retorms under Treasury 1is good. It would have been desirable had the Nixon and Richardson paper discussedand contrasted the actual outcomes of their simulations of the representativecrop farms with the potential impacts identified by Baum and others. For example,what were the direction and dollar magnitudes of changes in investment tax credits,depreciation allowances, capital gains, and interest income and expenses underTreasury I versus TRA for each representative farm. The output of FL1FSIM V iscapable of providing this type ot information.
Farmers' Attitudes Toward Income Tax Reform
The paper by Otto and Hanson caused me considerably more difficulty in attemptingto decipher what was learned from the research tnan any ot the other papers inthe symposium. This was partly due to my own shortcomings in not having masteredmulti-chotomous logit analysis techniques, and also due to my bias tnat anestimated coefficient for an independent variable requires an explanation ot itsmeaning. Throughout the paper reference is made to "estimated coefticients andtheir estimated asymptotic standard errors" without specific interpretation otany of the coefficients. For example, I am not sure whether tne coefficient,-.143, for the education variable in the first equation of table 3 is an elasticitycoefficient or whether it is to be interpreted as tne change in the probabilityof choosing the second-level response (disagree) instead of the first-levelresponse (strongly disagree) associated with a 1-year change in farmers' educationleve1.1/ Having expressed my general lacK ot understanding about.these estimatedfunctions, it would probably be wise to end this discussion; but fools do oftenrush inl There are a number of points where clarification is needed.
The authors refer to sample sizes of 251 tarmers in Iowa and 255 farmers inAlabama as comprising the pooled sample. Yet, the results in table 1 are basedon 252 Alabama and 260 Iowa farmers in each sample. Similarly, I rind it surprisingin table 5 that the mean value of the education variable is 12.07 for both Alabamafarmers and Iowa farmers! I find no explanation as to why the farm sales variableswere dropped from their equations shown in table 4 estimating farmers' attitudesabout the fairness of lower tax rates with fewer special provisions. Also, I donot find any coefficients xeported in tables 2 to 4 for the value of currentassets variables even though the authors indicate that these variables were includedin the analysis.
1/ This and several otner claritication and presentation issues nave now beenaddressed by the authors.
46 52

The authors conclude tnat years of farming was inversely related to agreementwith the three tax retorm proposals. My examination of tables 2 to 4 did notreveal the basis for tneir conclusion. Witn regard to the first proposal of aflat-rate tax being preferred to progressive tax structures, none ot the coefficientswere statistically significant and, in general, the absolute value of tne asymptoticstandard errors were double (or more) their estimated coetficient. With this
kind of statistical results, I am not sure one can say anytning about therelationship. Three of the estimated coefficients for the years-in-farmingvariable were statistically signiticant in the equations for the second proposalof lower tax rates with fewer special provisions being preterred. The signs ot
the coefficients were positive and pertained to the probability of choosing a no-opinion, agree, or strongly agree response relative to a disagree response. I
would interpret this result to mean that tor this second tax retorm proposal, thenumber of yeats in farming was positively related to agreement with the retorm.I would place a similar interpretation on the statistically significant positivecoefficient for log (P5/P3) in table 4 dealing witn farmers' attitudes aboutfairness of lower tax rates with fewer provisions.
I would have to agree with the authors that a good deal more testing will have tobe carried out before mucn can be said about tne personal cnaracteristics otfarmers and the economic characteristics of farms that influence farmers'preferences toward specific proposals tor tax retorm.
Summary
This symposium considered a number ot interrelated tax reform and farm commoditypolicy issues. These included the relationship between tax policy and farmprice/income-support program incentives on term tirm decisionmaking, farmers'perspectives on tax reform, and elements of an optimal income tax for agriculture.The farm firm growth model used to analyze current (TRA) and proposed (TreasuryI) tax provisions explored a number of production and financial implications ofkey tax provisions at the firm level. But there is more to be said on theintetactions between farm price/income-support policy and income tax policy. We
still have little understanding of the linkages between farm commodity policy andincome tax policy as it affects structural changes in farming. The farm firmagricultural modeling research being conducted by MS, USDA, and the Stateexperiment stations should add to our general store ot knowledge about tneserelationships in the coming years.
Logit analysis revealed that farmers' perspectives on tax reform issues are indeedcomplex and difficult to explain. Further analysis will be required betore muchcan be said about individual personal and term tirm economic characteristicsinfluencing farmers' attitudes and preferences toward tax retorm.
Optimal income tax reform would have the characteristics of maintainingprogressiveness in taxation according to ability to pay; reducing the maldistributionot economic power generated by tax shelters, depreciation, capital gains taxingrates, etc.; and minimizing interterence with prices and the market system inaffecting resource allocation and product distribution.
With the many off-setting provisions and the wide variability in net income amongfarm producing units, the net effect of proposed tax retorm on the agriculturalsector is ditticult to assess. Individual farmers with high net farm incomesmight pay less as reduced tax rates would oftset the loss of tax incentives sucnas the investment credit. Similarly, farmers with low net farm income wouldprobably pay less tax or no tax at all. But for a vast number of farmers between
47 53

tnese two extremes, the net eftect of proposed tax reform would depend on theamount of net income, the type ot enterprises produced, the make-up ot deductionsand exemptions, the amount of investment in capital assets, and many otaer factors.
The proposed tax reform should, if enacted, reduce the incentive for investors touse farming as a tax shelter for otner income and hence, reduce the amount ot"tax-loss" farming that plagues agriculture. But, underlying all proposed taxreforms is the need to examine carefully the beliets and value systems thatinfluence the political adjustments necessary to change current tax policy.
Reference
Hughes, Dean W., and John B. Penson, Jr. Capital Deterioration: ,:kri Overlooked_Cost of Farm Financial Distress. Mimeo papers, Department of agriculturalEconomics, Texas A.&M. University, College Station, 1985.
5 4
48

EFFECTS OF INCOME TAX REFORM ON AGRICULTURE:REVIEW AND NEW EVIDENCE
Semin U. Hardesty and Huy F. Carman*
Introduction
The papers presented in this symposium examine various aspects of income taxreform in the agricultural sector. Nixon and Richardson compare the simulatedffects of the Treasury's original proposal and current tax law on the financialperformance of six commercial farms in Texas, Mississippi, and Illinois. Otto
and Hanson examine the attitudes of Iowa and Alabama farmers regarding income tax
reform. Sreimyer discusses the need for tax reform, arguing that the popularity
ot tax-sheitered investments in agriculture has produced harmful effects on the
agricultural economy. In this review, we evaluate tne findings presented in thesymposium within the context ot our research regarding agricultural investmentresponse to changing income tax laws.
It is generally acknowledged that income tax laws play an important role in U.S.agriculture. Host research has focused on the effects of special income taxrules applicable to agriculture, such as tne use of casn accounting, tnedeductibility of some expenses ot a capital nature, and capital gains treatmel.Lfor income from assets whose costs may nave been deducted as a current expense.However, there is evidence that the longrun impacts of other income tax provisionsapplicable to all enterprises also nave important implications tor agriculturalinvestments and the longrun structure of agriculture. Income tax provisions may
be as important to the growth and survival of many farm firms as are agricultural
commodity programs.
Special Agricultural Tax Rules
Income tax rules influence investment activity through their erfect on after-taxrates of return. Breimyer notes that, because of special tax provisions,"tajgriculture is a favorite sector for tax shelters...Nnien] reduce prices andset in motion a transfer of asset ownersnip to sheltered investors." Tax snelters
involving livestock and citrus and almond groves proliferated during tne late19601s. The Tax Reform Act of 1969 increased tne nolding period for livestock toqualify for capital gains treatment and required the recapture of depreciation.These changes removed most of the opportunities to convert ordinary income tocapital gains through development of breeding livestock or dairy herds purely asa tax-shelter investment (Carman, 1972). Tne current tax rules, however, continueto provide significant incentives for investment in livestock production. The
Tax Reform Act of 1969 also required the capitalization of citrus grove plantlp8and development expenses during the first 4 tax years atter planting; this
provision was extended to almonds 1 year later. Tnese changes terminated most of
the tax advantages of developing citrus and almond groves.
Carman (1981) used a supply response model to examine tne long-term impacts on
other perennial crops of cost capitalization provisions whicn are applicable only
*Sermin D. Hardesty is an assistant professor in the Dept. or Agr. Econ., Micnigan
State Univ., and Hoy F. Carman is a protessor la the Vein. of Agr. Eco:;., Univ. of
California, Davis.
49 55

to citrus and almonds. Model results indicate that by 1978 Calitornia citrusand almond acreage decreased an estimated 46,241 acres due to cost capitalizationprovisions first effective in 1970 and 1971. At tne same time, Calitornia walnutand grape acreage increased an estimated 99,163 acres in response to tnese samecapitalization provisions. Similar projections tor 1985 nave citrus and almondsdecreasing by 54,254 acres with grapes and walnuts increasing Dy 91,552 acres.This estimated increase was due only to the tax law change and did not incluaethe already increased level of investment due to favorable tax rules tordevelopment of these perennial crops. Acreage ot crops not included in tneanalysis, such as pistachios and kiwi truit, also expanded as investors tookadvantage of the favorable tax treatment available tor tnese crops.
The estimated percentage impact of cost capitalization provisions on individualcrops is shown in table 1. The projected 1985 grape acreage increased by some14 percent over what it would have been without the citrus and almond capitalizationprovisions. Tne California grape industry currently races severe economic problemsas a result of high production and prices wnich are low relative to costs otproduction. In addition, tne switch of developer and investor interest to walnutsand grapes appears to have added to the cyclical instability ot production andprices for these two crops. These findings indicate that allowing tne immediatededuction of capital asset develovment expenses combined witn capital gainstreatment upon sale of the asset distorts resource allocation in agriculture.
Economic Recovery Tax Act of 1981
The income tax system has a progressive rate structure; however, the degree otprogressivity has been eroded by the ability of high-income taxpayers to utilizetax shelters to generate deductions which reduce taxaDle income. Sreimyer assertsthat the Economic Recovery Tax Act of 191 (ERTA) turtner Jeopardized theprogressivity of the rate structure Dy adding to tne retinue of deductionspreviously in place. However, Hardesty's findings indicate that Dy lowering taxrates ERTA reduced the incentive for row-crop terms to seek tax-reducingdeductions.
Hardesty used a dynamic optimization model to examine the ettects ot tax Lawchanges on representative small, medium, and large Calitornia row-crop terms.These three farms made annual decisions on investment in land and machinery,savings, debt, land leasing, total acreage planted, and crop mix over an d-yearperiod with the objective of maximizing tne tirm's net worth. Tnree income taxalternatives (no income taxes, pre-ERTA rules, and post-ERTA rules) were consideredfor each model farm. The farms nad the same beginning position for eacn set ottax rules; each faced the same input and output prices and were subject to thesame constraints. Only the income tax rules dittered in tne three tax scenariosfor each farm size.
The present value of machinery purchases tor eacn farm size and scenario is snownin table 2. Purchases were highest tor the pre-ETRA scenario and lowest for thesituation with no taxes. while changes in investment tax credit and depreciationrules in ERTA encourage increased machinery investment, this positive impact wasoffset by reduced tax rates. The reduced tax rates decrease tne present value oftax savings from interest and depreciation deductions and increase the desirabilityof repairing machinery relative to replacing it. For each term size, tne macninestock was smallest in the no-tax scenario and highest in the pre-ERTA scenario.Machinery requirements varied minimally because cropping patterns were identicalunder pre- and post-ERTA rules and these patterns differed only slightly from theno-tax scenario. By reducing tax rates, ERIA decreased tne level ot excess macninerycapacity which the firms maintained to generate deductions.
50 56

Table 1--Projected 1985 total acreage response to thetax reform act of 1969
Crop Percentage responsePercent
Navel oranges -7.5
Valencia oranges -19.0
Lemons -21.0
Almonds -2.1
Walnuts +2.0
Avocados +0.1
Grapes +14.3
Source: Carman (1981).
Table 2--The present value of machinery purchases by farm size and income taxscenario
Farm sizePresent value of machinery purchases by tax rule
No tax Pre-ERTA Post-ERTA
Small
Medium
Large
54,123
108,738
209,785
Dollars
81,864
199,742
575,471
1U1,932
254,999
744,513
Source: Hardesty.
Land purchases were found to be highly sensitive to tax provisions. In the no-
tax scenario the farms expanded their acreage solely through leasing. Total
acreage purchased in the post-ERTA scenarios was 15 to 40 percent less than thatpurchased in the pre-ERTA scenarios. ERTA reduced the tax savings genercted frominterest deductions. Nevertheless, tne progressive rate structure continues to
provide an incentive for high-income farm firms to seek greater taxable incomereducing deductions than low-income farm firms. Unly a flat-tax rate structurewould eliminate this distortion.
Treasury's Tax Reform Proposal
Numerous tax reform proposals have been introduced recently which promote movementtoward a flat-tax rate and the elimination or modification of special farm tax
k't 51 57

provisions. In Otto and Hanson's study 69 percent ot the surveyed farmersfavored lower tax rates with fewer special provisions. This support for taxreform appears to be broadly based among farmers of different size operations andeducational backgrounds.
Lowering tax rat.lq and eliminariN special term tax provisions co'lld nave Asubstantial impact on tarm tirms. Nixon and Richardson examined the impact ofthe Treasury's original proposal (Treasury 1) on commercial farms in Texas,Mississippi, and Illinois. They found that "the reduction in marginal Yederalincome tax rates under Treasury I had a greater impact on tne representativefarm's income tax payments than the change in depreciation allowances [and theelimination of the investment tax credit]." Tne increase in average annual netfarm income for their six farms ranged from 2.3 to d.2 percent.
A study by Hardesty and Carman of Treasury I utilizing a dynamic optiminationmodel indicated that Treasury I would also have a positive financial impact onCalifornia row-crop farms. They examined the individual and combined ettects ofTreasury I's major provisions: elimination of the investment credit, extendeddepreciation schedule, and collapsed rate structure. In tne model the firmmakes production, investment, and financing decisions and controls its income taxliability as part of its overall optimization problem. The tax changes affectedboth the firm's ability and incentive to invest in land and machinery. Theresults for the five scenarios are summarized in table 3.
Under the Treasury I tax rules the firm's net worth was 3.1 percent higher andits total tax liabilities were 7.4 percent lower tnan under the current tax rules.There were substantial differences in machinery investment decisions caused bychanges in the major provisions individually. In each case machinery purchaseswere lower than under the current tax rules. When all the changes were consideredcollectively, the interactions between provisions caused optimal machinerypurchases to decrease by 68 percent from those under the current tax rules. Landpurchases decreased when the changes were examined individually. When tne TreasuryI revisions were considered collectively, land purchases were 47 percent higherthan under the current tax rules. Treasury I causes tne attractiveness of landinvestment relative to machinery investment to increase significantly.
Summary and Concluding Comments
Numerous studies concerning tne effects of income taxation on agriculture suggestthat tax policy may be working against agricultural policy goals relatea to farmstructure and rates of return to agricultural enterprises. Special farm taxrules have encouraged tax shelter investment activity in various commodities.The progressive rate structure has provided farmers with incentives to expand byseeking deductiorrgeneracing investment. because of inelastic product demand,the tax incentives which provide a short-term benefit to individual operators mayproduce a deterioration of longrun returns resulting from increased totalproduction.
Research regarding income taxation and agriculture has evolved substantiallysince initial studies utilizing budgeting examples. However, efforts have beenhampered by the lack of data ana analytical limitations. It is virtually impossibleto obtain information concerning farm firm tax liabilities ana tne utilization ofspecific tax provisions. Income tax laws affect tne relative prices of inputfactors, including capital assets. Analysis of the long-term effects of suchchanges requires an intertemporal framework with theoretical Justification.
52 58

3--Financial conditions and decisions ot representative tarm by tax rule
Measure*: Initial : Scenarios**: period : 1 : 2 3
. Dollars4
net worth : 2,559,33(3 1,994,192 1,974,24b 1,978,9U5 2,084,19b 2,
value : 2,688,000 2,313,878 2,28b,5bb 2,254,385 2,047,WO 2,
land purchases 28(3,492 257,404 223,410 U
nery value 217,667 121,423 9(3,382 72,258 100,139
machinery purchases 255,438 209,897 17b,94b 215,99U
gs 19,000 81,81b 73,8Uo 95,437 Lbo,b18
debt 3845,331 385,13b 34b,35b 308,913 201,u7b
asset (ratio) .12 .1b .14 .13 .09
e tax liabilities -- 273,352 321,328 291,910 242,bbu
acreage planted during planning:iod (acres) 8,000 8,000 8,000 d,uUU
e: Hardesty and Carman.dollar values for Scenarios 1 through 5 pertain to the terminal period or the entire planning norizonssed in present value terms. Net worth is measured by the market value ot assets less liabilities. Ut
ry is valued according to resale price relationships published in the Agricultural Engineer's Yearbook,nario 1 is based on tne Federal income tax rules in effect as of Januray 1, 1985.nario 2 is based on the same Federal income tax rules as in Scenario 1, except that the investment taxlimited.nario 3 is based on the same Federal income tax rules as in Scenario 1, except that ACRS is replaced u:ended depreciation schedule as proposed by the Treasury.nario 4 is based on the same Federal income tax rules as in Scenario 1, except that tne tax rates are 4
ed into three brackets as proposed by the Treasury.nario 5 is based on the same Federal income tax rules as in Scenario 1, except mat all ot tue changesnarios 2, 3, and 4 are incorporated.
60

Substantial additional research on the impacts of income tax laws on agricultureis warrantedegiven its significant policy implications. Studies of both firmlevel and aggregate responses are valuable. The application of recently developeddynamic analysis methods to examine long-range impacts merits special attention.
References
Carman, Hoy F. "Tax Loss Agricultural Investments After Tax Reform." AmericanJournal Agricultural Economics, Vol. 54(1972), pp. 627-34.
Carman, Hoy F. "Income Tax Reform and California Orchard Development." WesternJournal Agricultural Economics, Vol. 6(1981), pp. 165-80.
Hardesty, Sermin D. "The Impact of the 1981 Tax Act: A Dynamic Analysis of FarmFirm Production, Investment, and Financing Decisions." Unpublished Ph.D.dissertation, Department of Agricultural Economics, University of California,Davis, 1984.
Hardesty, Sermin D., and Hoy F. Carman. "Income Tax Simplification Effects onCrop Farm Decisionmaking." Agricultural Finance Review, Vol. 45(1985), PP11-20.
54 . S.MIERNMENT PRINTING OrrICE31986-490-917140012/ERS