ecosystems chapter 30. bye-bye bayou louisiana’s coastal wetlands are disappearing global warming...
TRANSCRIPT

Ecosystems
Chapter 30
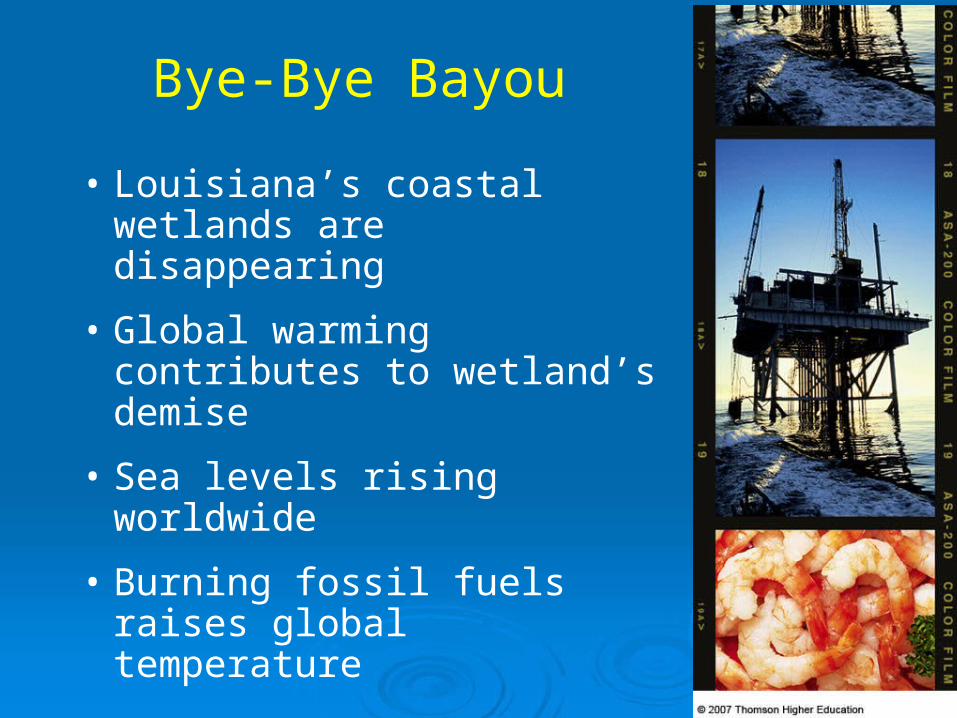
Bye-Bye Bayou
• Louisiana’s coastal wetlands are disappearing
• Global warming contributes to wetland’s demise
• Sea levels rising worldwide
• Burning fossil fuels raises global temperature
Impacts, Issues Video
Bye-Bye, Blue Bayou

Ecosystem
An array of organisms and their physical environment, interconnected through a one-way flow of energy and cycling of raw materials
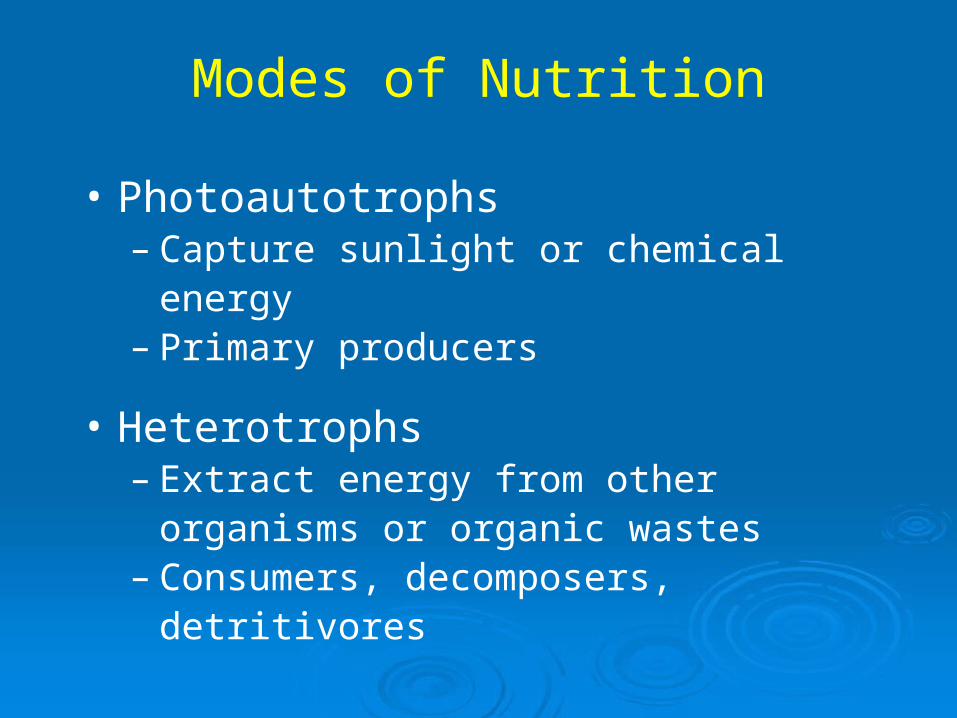
Modes of Nutrition
• Photoautotrophs– Capture sunlight or chemical energy– Primary producers
• Heterotrophs– Extract energy from other organisms or
organic wastes– Consumers, decomposers, detritivores
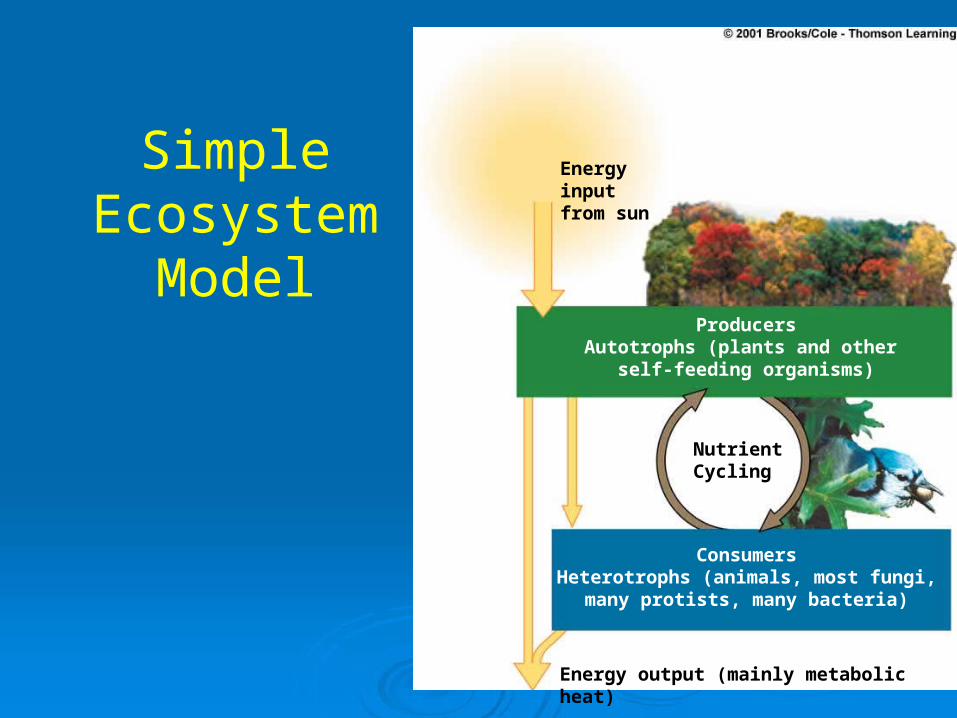
Simple Ecosystem
Model
Energy input from sun
NutrientCycling
ProducersAutotrophs (plants and other
self-feeding organisms)
ConsumersHeterotrophs (animals, most fungi,
many protists, many bacteria)
Energy output (mainly metabolic heat)
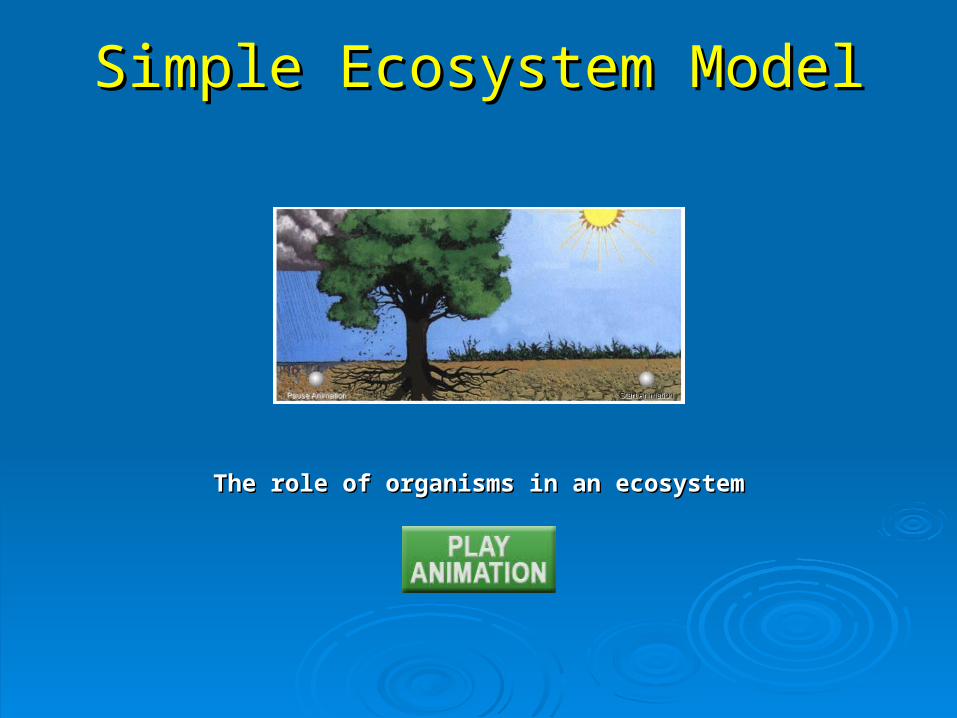
The role of organisms in an ecosystemThe role of organisms in an ecosystem
Simple Ecosystem ModelSimple Ecosystem Model
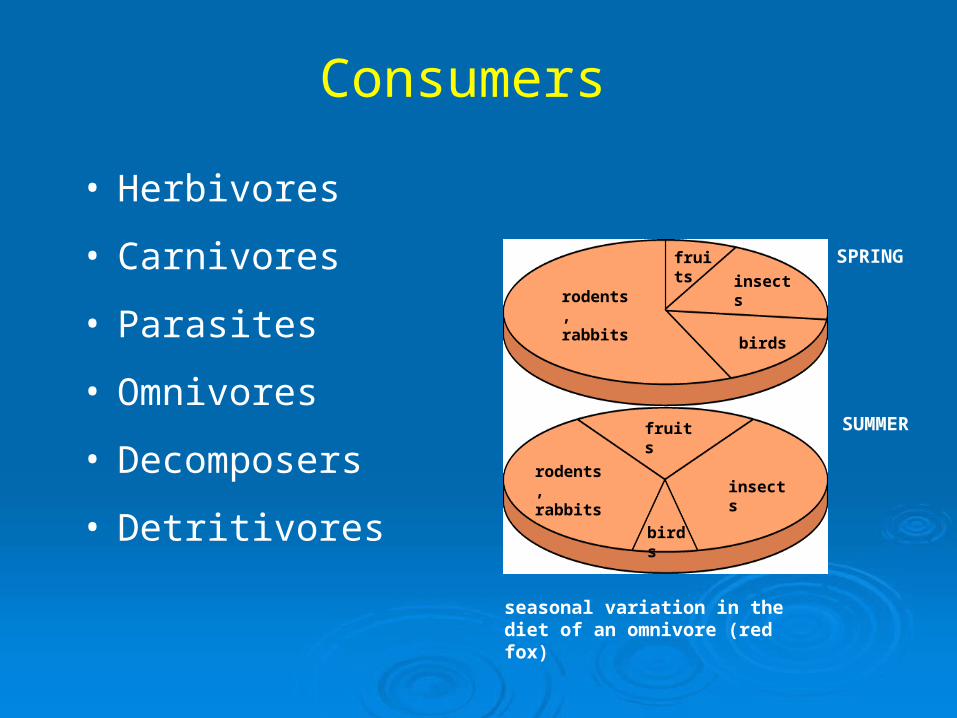
Consumers
• Herbivores
• Carnivores
• Parasites
• Omnivores
• Decomposers
• Detritivores
SPRING
rodents, rabbits
fruits
insects
birds
SUMMER
rodents, rabbits
fruits
insects
birds
seasonal variation in the diet of an omnivore (red fox)
Trophic Levels
• Feeding relationships– All organisms at a trophic level are the
same number of steps away from the energy input into the system
• Autotrophs are producers– closest to energy input– first trophic level
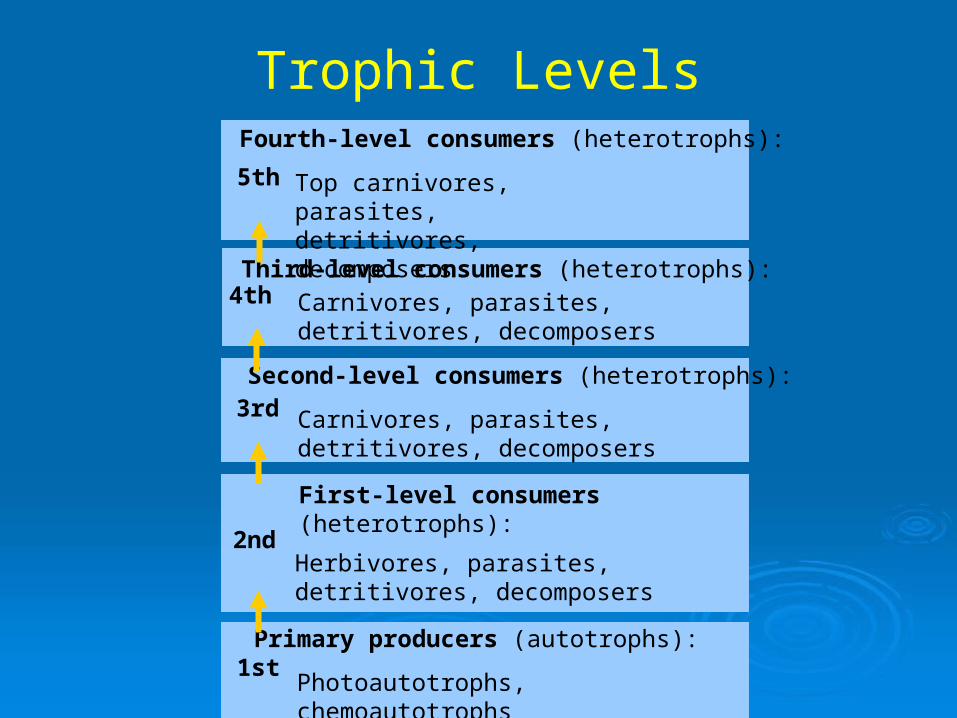
Trophic Levels
5th
4th
3rd
2nd
1st
Fourth-level consumers (heterotrophs):
Top carnivores, parasites, detritivores, decomposers
Third-level consumers (heterotrophs):
Carnivores, parasites, detritivores, decomposers
Second-level consumers (heterotrophs):
Carnivores, parasites, detritivores, decomposers
First-level consumers (heterotrophs):
Herbivores, parasites, detritivores, decomposers
Primary producers (autotrophs):
Photoautotrophs, chemoautotrophs
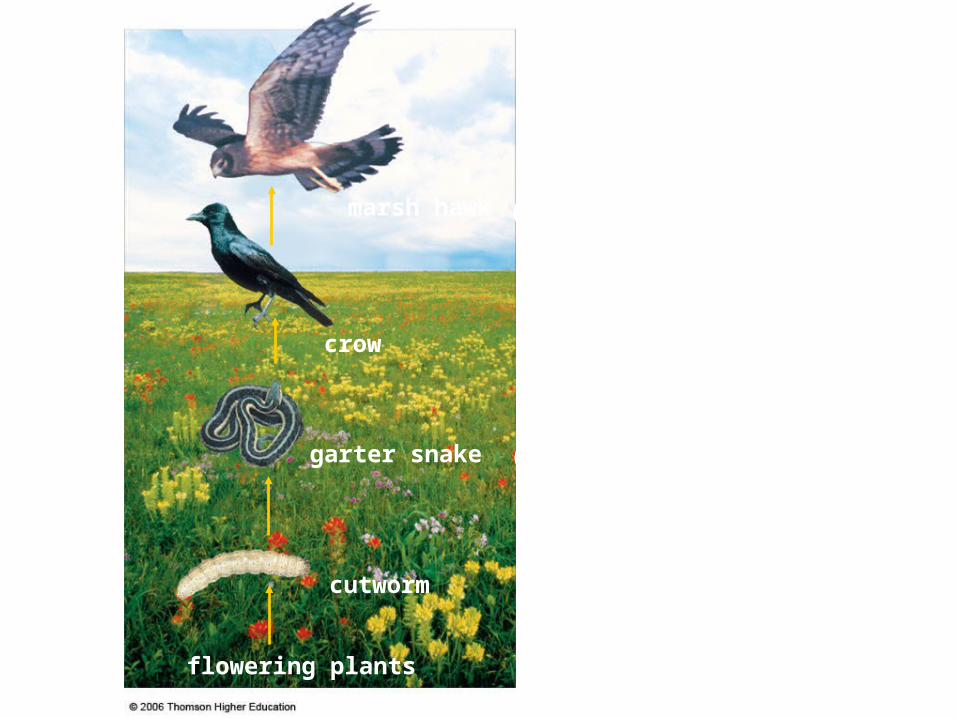
marsh hawk
crow
garter snake
cutworm
flowering plants
fifth trophic leveltop carnivore
(fourth-level consumer)
fourth trophic levelcarnivore
(third-level consumer)
third trophic levelcarnivore
(second-level consumer)
second trophic levelherbivore
(primary consumer)
first trophic levelautotroph
(primary producer)Fig. 30-3, p.528
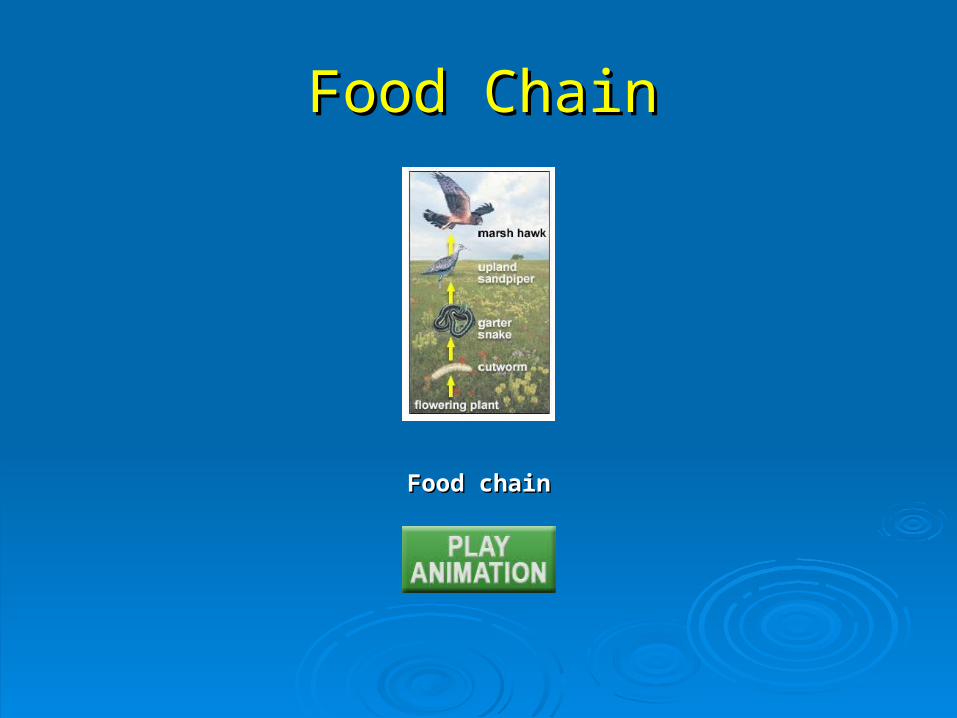
Food chainFood chain
Food ChainFood Chain
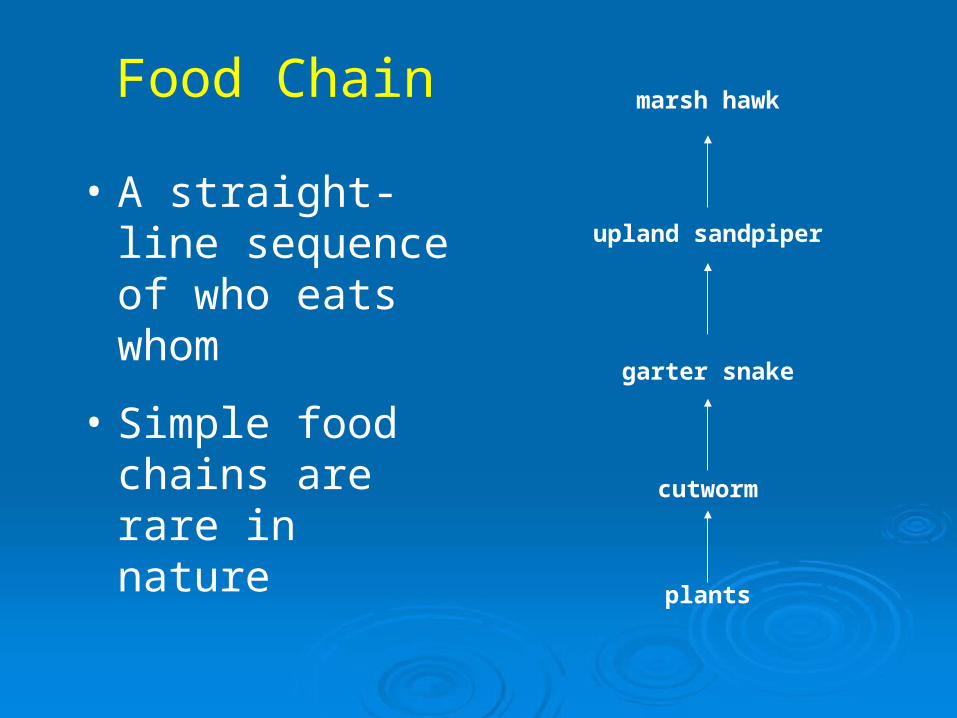
Food Chain
• A straight-line sequence of who eats whom
• Simple food chains are rare in nature
marsh hawk
upland sandpiper
garter snake
cutworm
plants
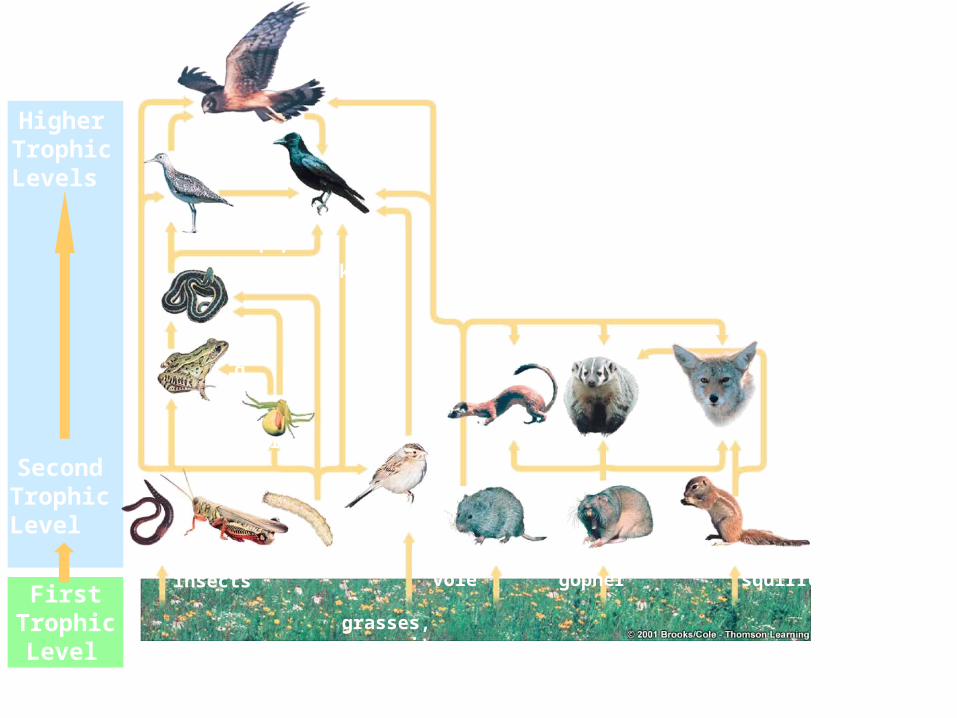
marsh hawk
crow
upland sandpiper
garter snake
frog
spiderweasel badger coyote
ground squirrelpocket gopherprairie vole
sparrow
earthworms, insects
First Trophic Level
Second Trophic Level
Higher Trophic Levels
Connections in a tallgrass prairie food web
grasses, composites
Fig. 30-4, p.529
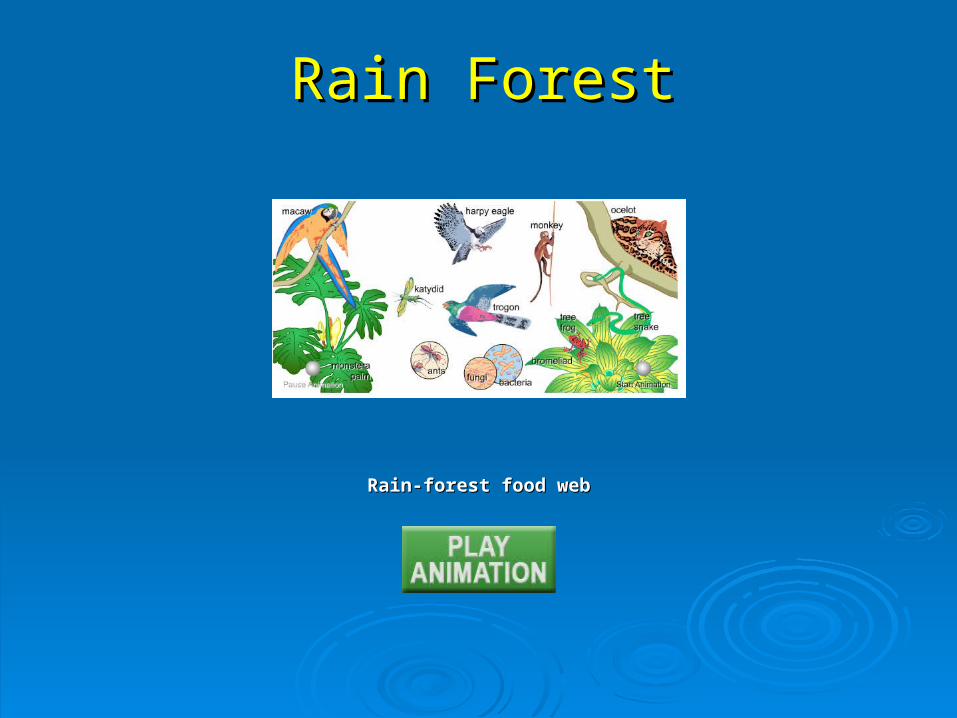
Rain-forest food webRain-forest food web
Rain ForestRain Forest
Energy Losses
• Energy transfers are never 100% efficient
• Some energy is lost at each step
• Limits number of trophic levels in an ecosystem
Biological Magnification
Nondegradable or slowly degradable substances become more and more concentrated in tissues of organisms at higher trophic levels of a food web
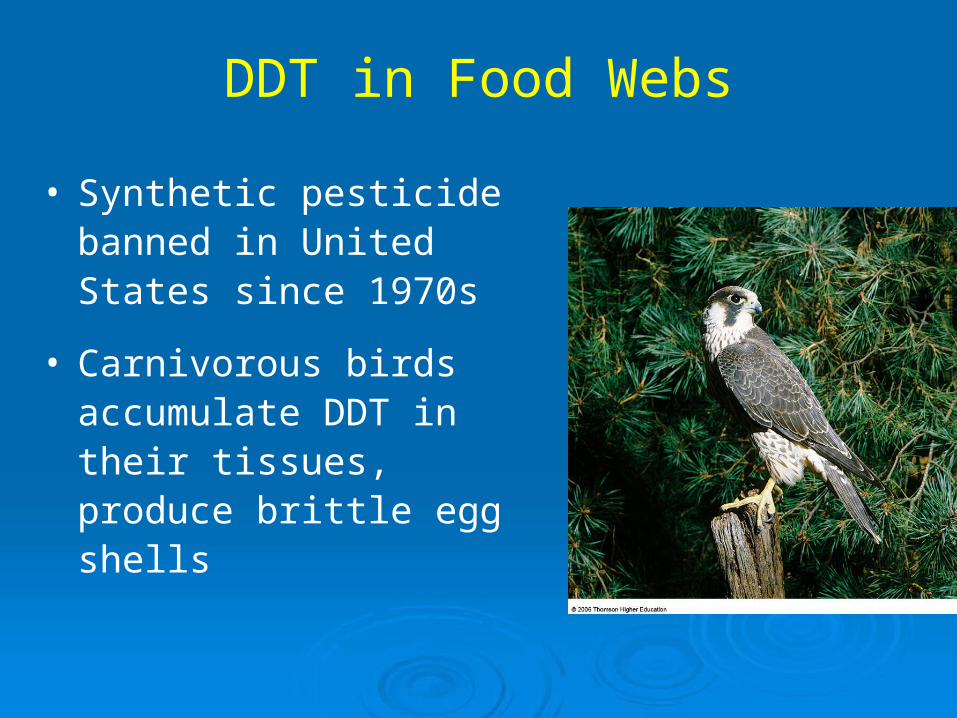
DDT in Food Webs
• Synthetic pesticide banned in United States since 1970s
• Carnivorous birds accumulate DDT in their tissues, produce brittle egg shells

Fig. 30-5, p.530
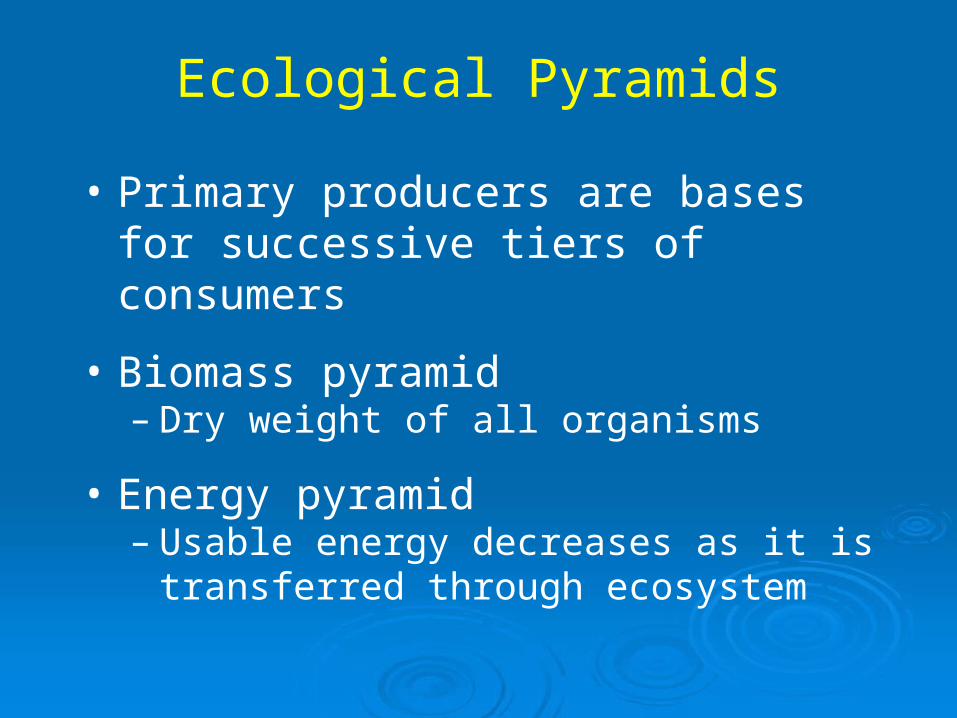
Ecological Pyramids
• Primary producers are bases for successive tiers of consumers
• Biomass pyramid– Dry weight of all organisms
• Energy pyramid– Usable energy decreases as it is
transferred through ecosystem

Biomass Pyramid
• Aquatic ecosystem, Silver Springs, Florida
• Long-term study of a grazing food web
5
decomposers, detritivores(bacteria, crayfish)
1.5
1.1
37
third-level carnivores(gar, large-mouth bass)
second-level consumers(fishes, invertebrates)
first-level consumers(herbivorous fishes,turtles, invertebrates)
primary producers (algae,eelgrass, rooted plants)
809
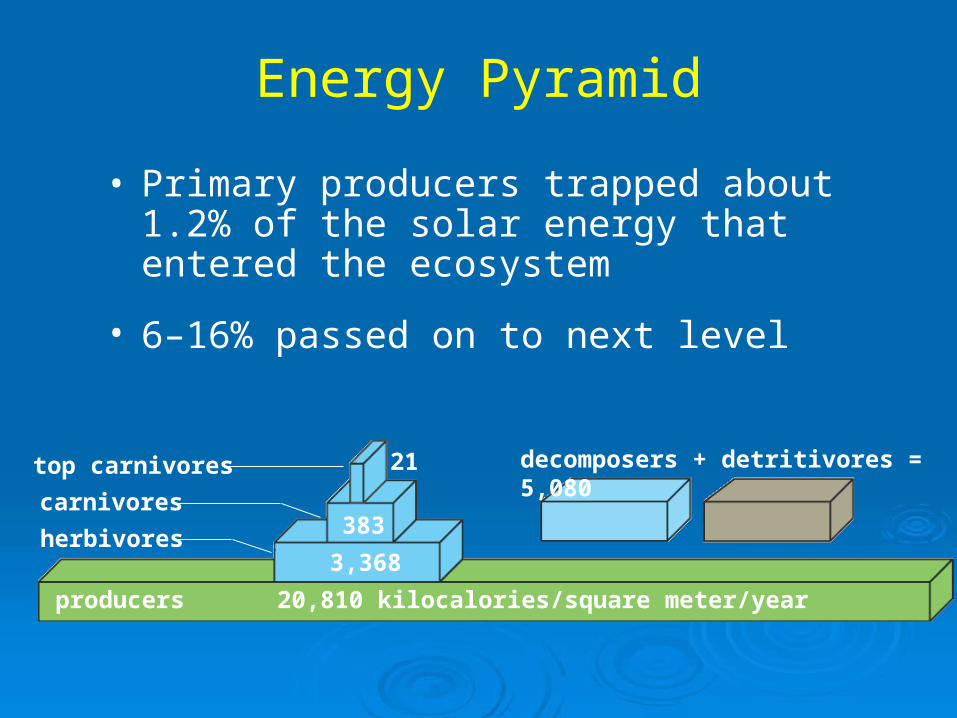
Energy Pyramid
• Primary producers trapped about 1.2% of the solar energy that entered the ecosystem
• 6–16% passed on to next level
21
383
3,368
20,810 kilocalories/square meter/year
top carnivores
carnivores
herbivores
producers
decomposers + detritivores = 5,080
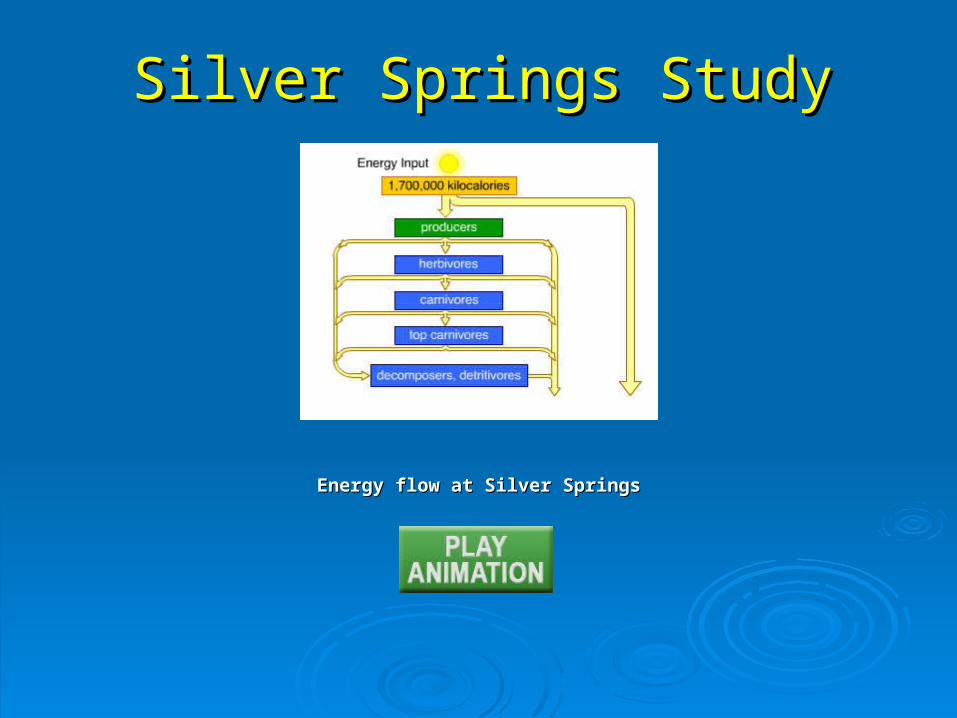
Energy flow at Silver SpringsEnergy flow at Silver Springs
Silver Springs StudySilver Springs Study
Biogeochemical Cycle
• Flow of an essential substance from the environment to living organisms and back to the environment
• Main reservoir is in the environment
• Geologic processes, decomposers aid cycles
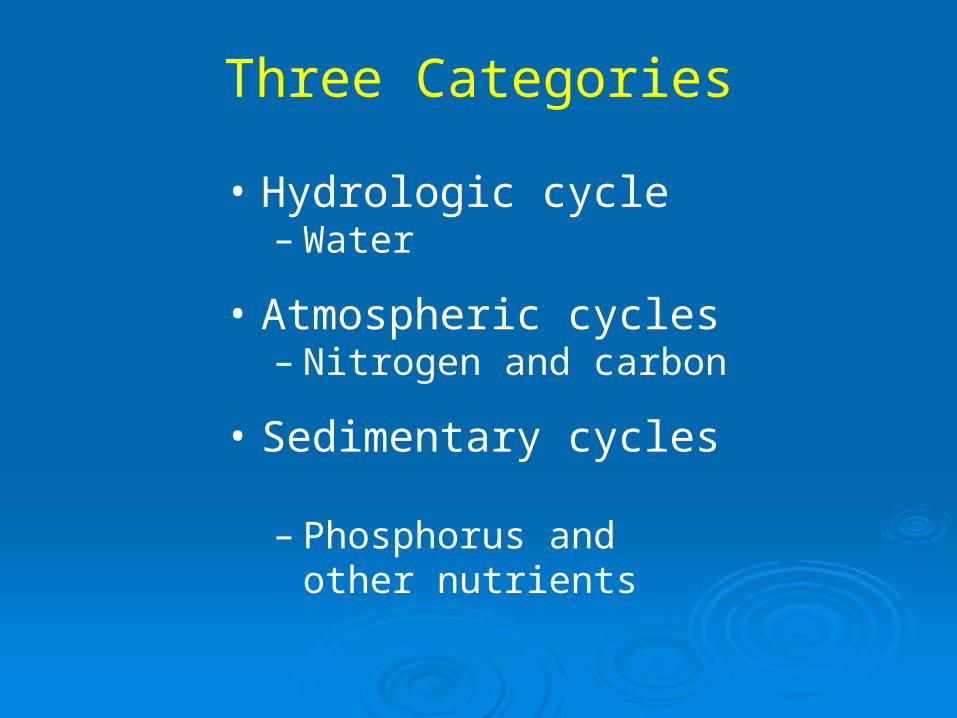
Three Categories
• Hydrologic cycle– Water
• Atmospheric cycles – Nitrogen and carbon
• Sedimentary cycles – Phosphorus and other
nutrients

Hydrologic Cycle
atmosphere
ocean land
evaporation from ocean
425,000
precipitation into ocean 385,000
evaporation from land plants (evapotranspiration)
71,000
precipitation onto land 111,000
wind-driven water vapor40,000
surface and groundwater flow 40,000
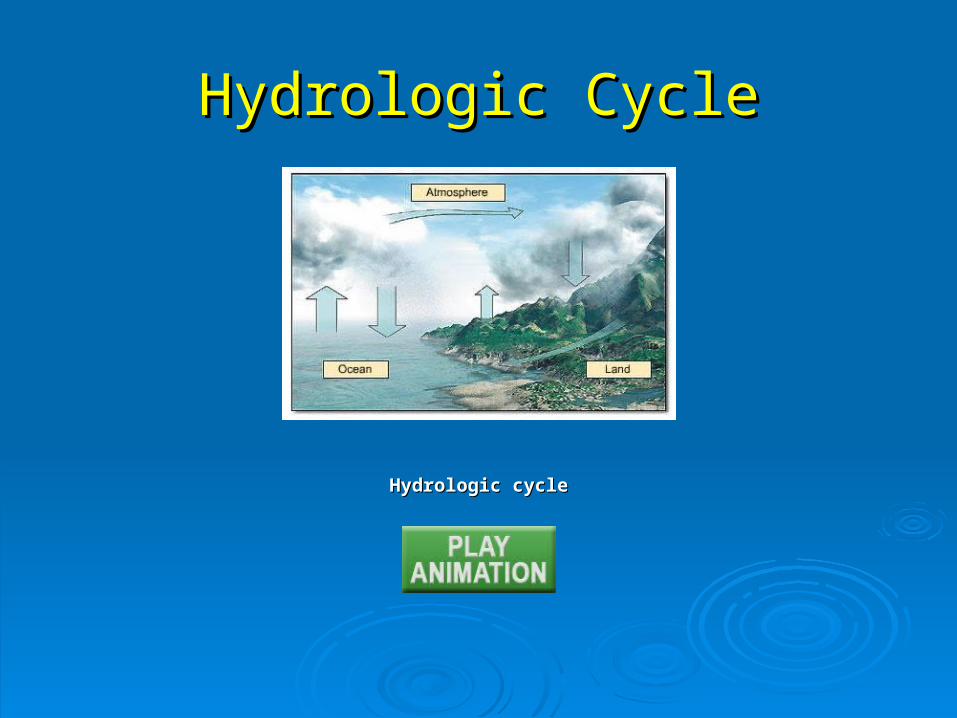
Hydrologic cycleHydrologic cycle
Hydrologic CycleHydrologic Cycle
Global Water Crisis
• Limited amount of fresh water
• Desalinization is expensive and requires large amounts of energy
• Aquifers are being depleted
• Groundwater is contaminated
• Sewage, agricultural runoff, and industrial chemicals pollute rivers
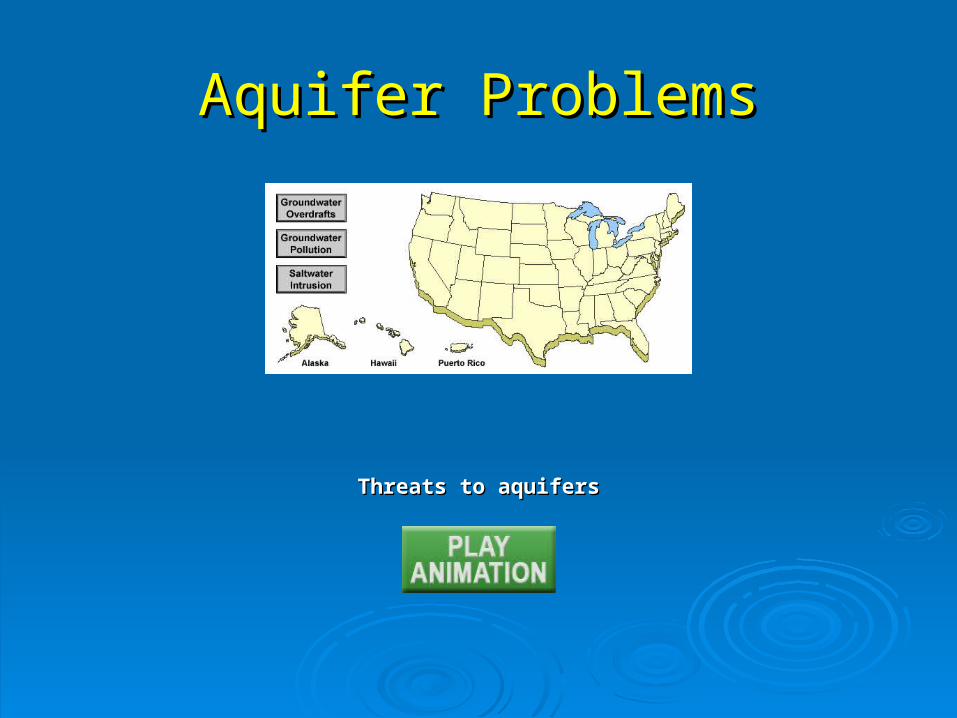
Threats to aquifersThreats to aquifers
Aquifer ProblemsAquifer Problems
Carbon Cycle
• Carbon moves through atmosphere, food webs, ocean, sediments, and rocks
• Sediments and rocks are the main reservoir
• Combustion of fossil fuels changes natural balance
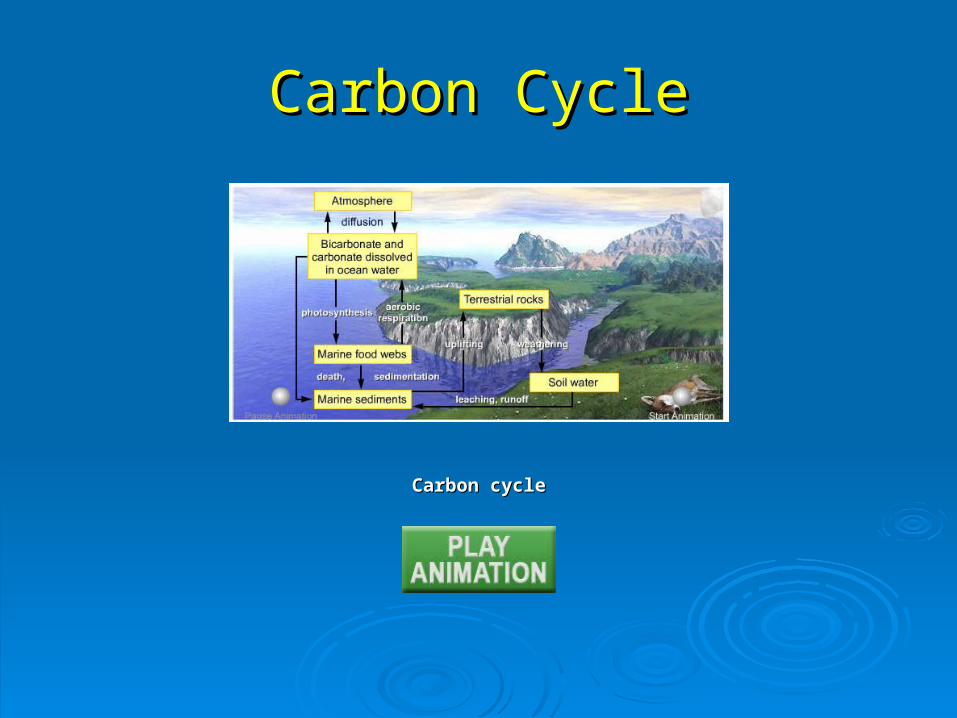
Carbon cycleCarbon cycle
Carbon CycleCarbon Cycle

Greenhouse Effect
• Greenhouse gases impede escape of heat from Earth’s surface
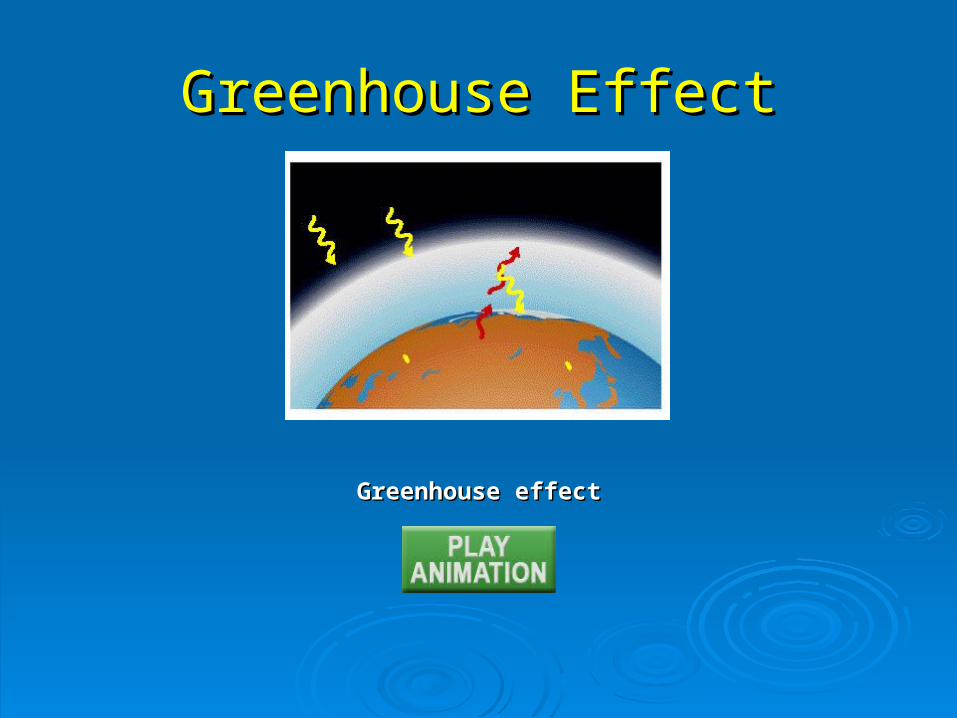
Greenhouse effectGreenhouse effect
Greenhouse EffectGreenhouse Effect
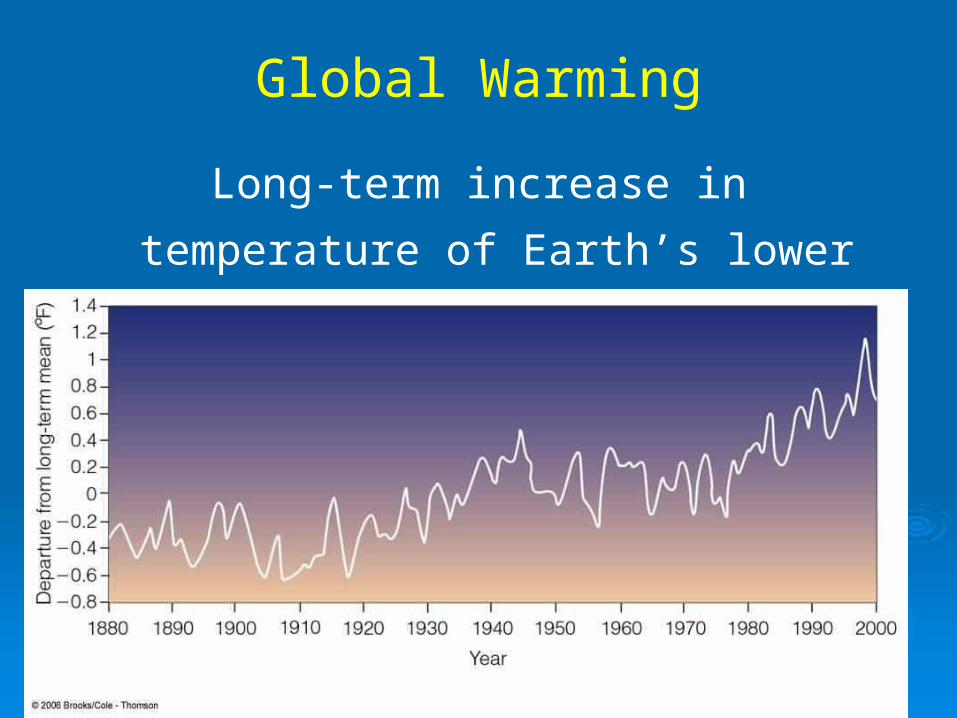
Global Warming
Long-term increase in temperature of
Earth’s lower atmosphere

Carbon dioxide and temperatureCarbon dioxide and temperature
Greenhouse GasesGreenhouse Gases
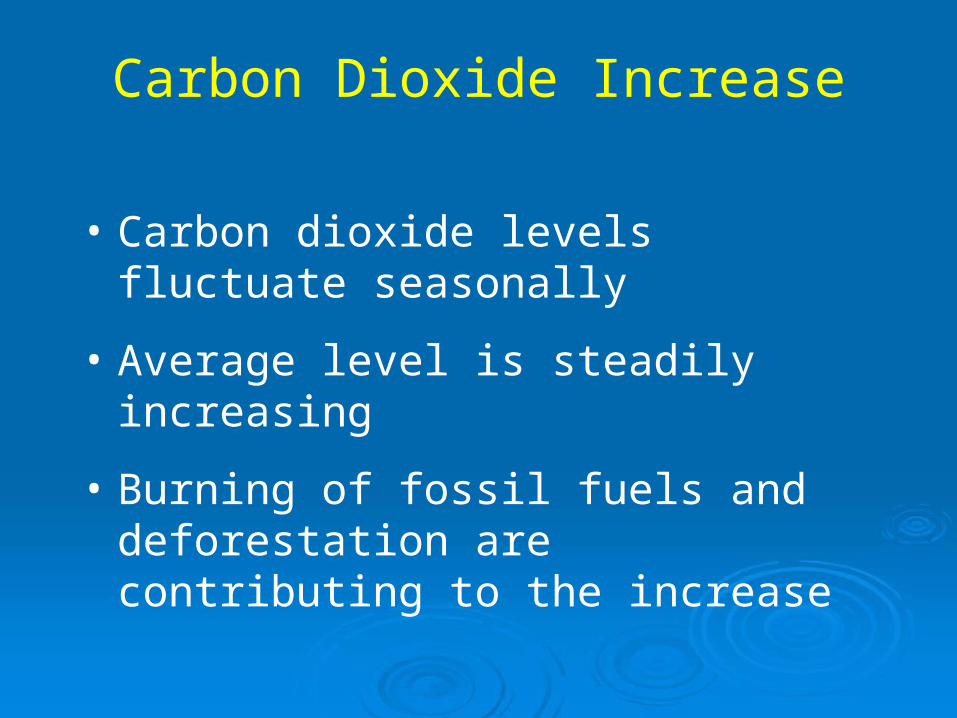
Carbon Dioxide Increase
• Carbon dioxide levels fluctuate seasonally
• Average level is steadily increasing
• Burning of fossil fuels and deforestation are contributing to the increase
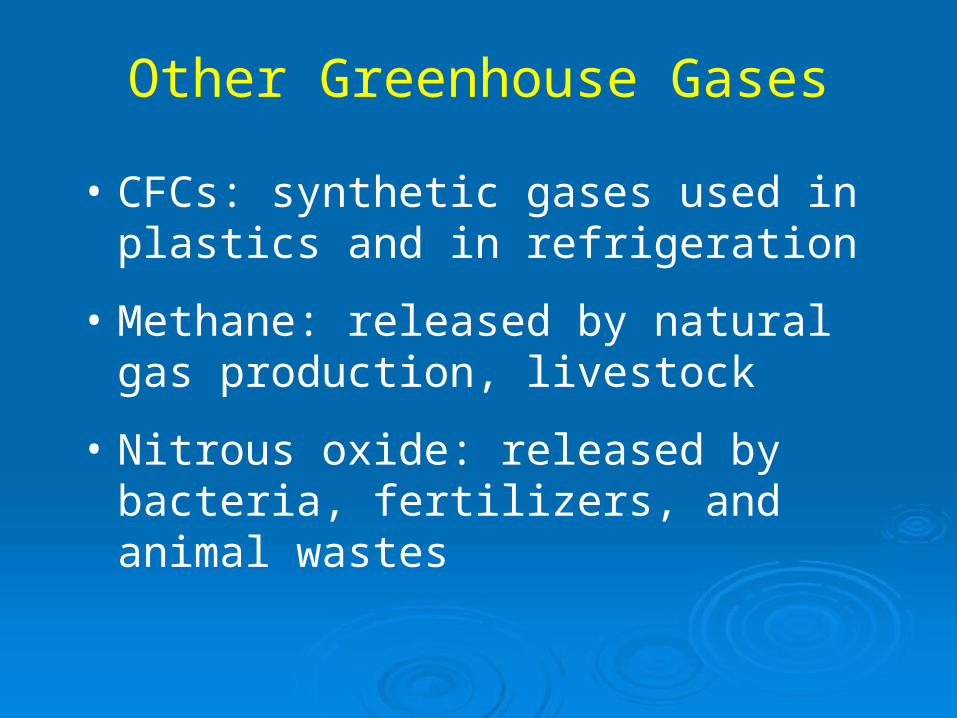
Other Greenhouse Gases
• CFCs: synthetic gases used in plastics and in refrigeration
• Methane: released by natural gas production, livestock
• Nitrous oxide: released by bacteria, fertilizers, and animal wastes
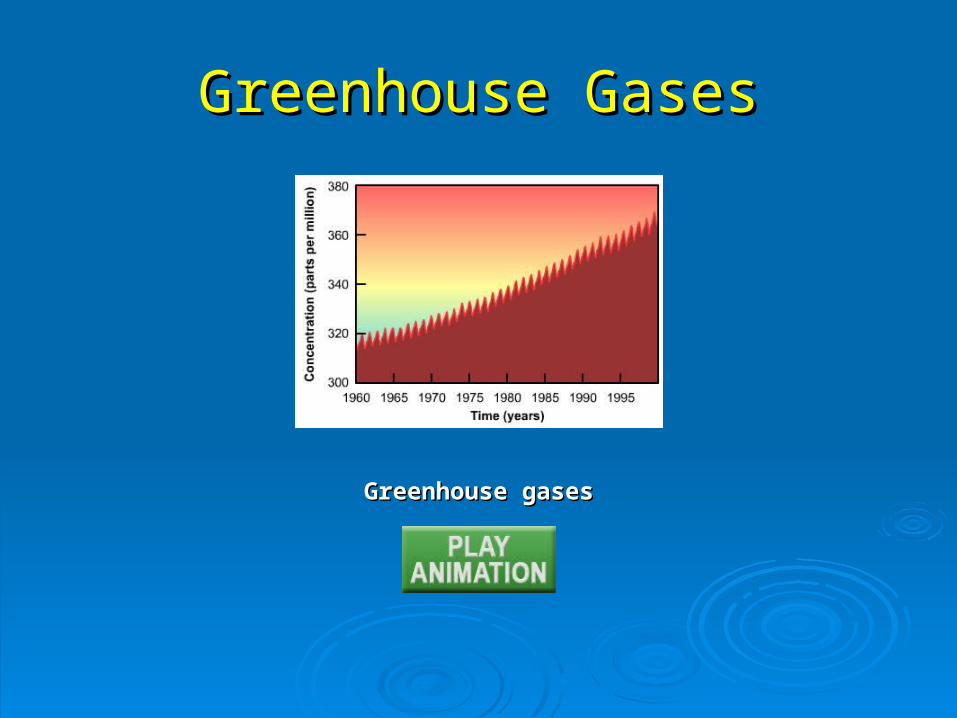
Greenhouse gasesGreenhouse gases
Greenhouse GasesGreenhouse Gases
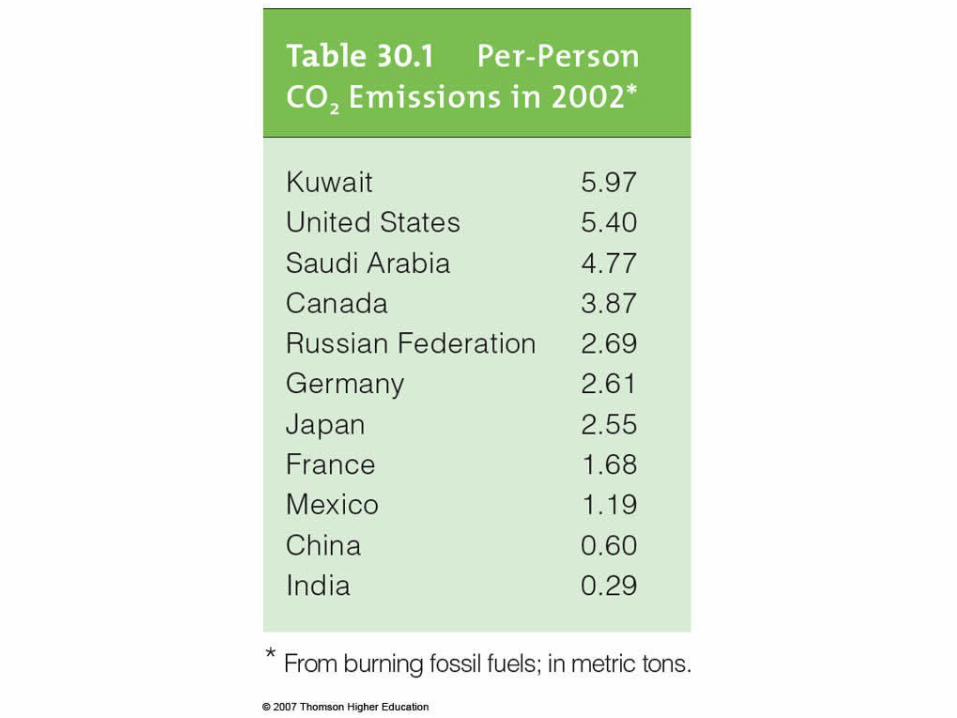
Table 30-1, p.537

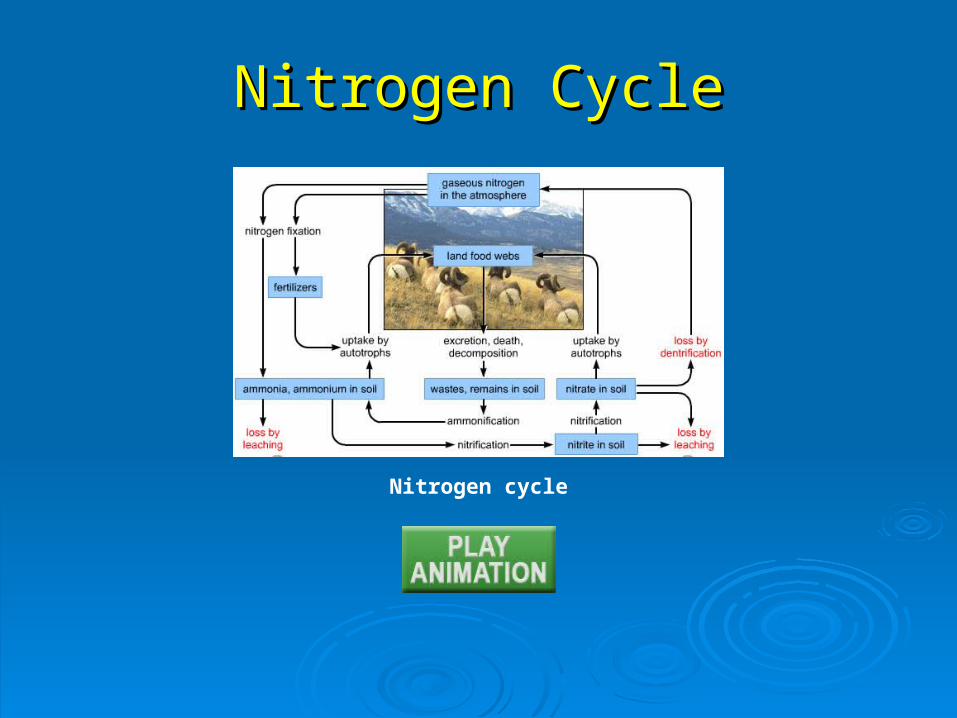
Nitrogen Cycle
• Nitrogen is used in amino acids and nucleic acids
• Main reservoir is nitrogen gas in the atmosphere
• Nitrogen gas can’t enter food web
Nitrogen CycleNitrogen Cycle
Nitrogen cycle
Human Effects
• Humans increase rate of nitrogen loss by clearing forests and grasslands
• Humans increase nitrogen in water and air by using fertilizers and by burning fossil fuels
• Too much or too little nitrogen can compromise plant health
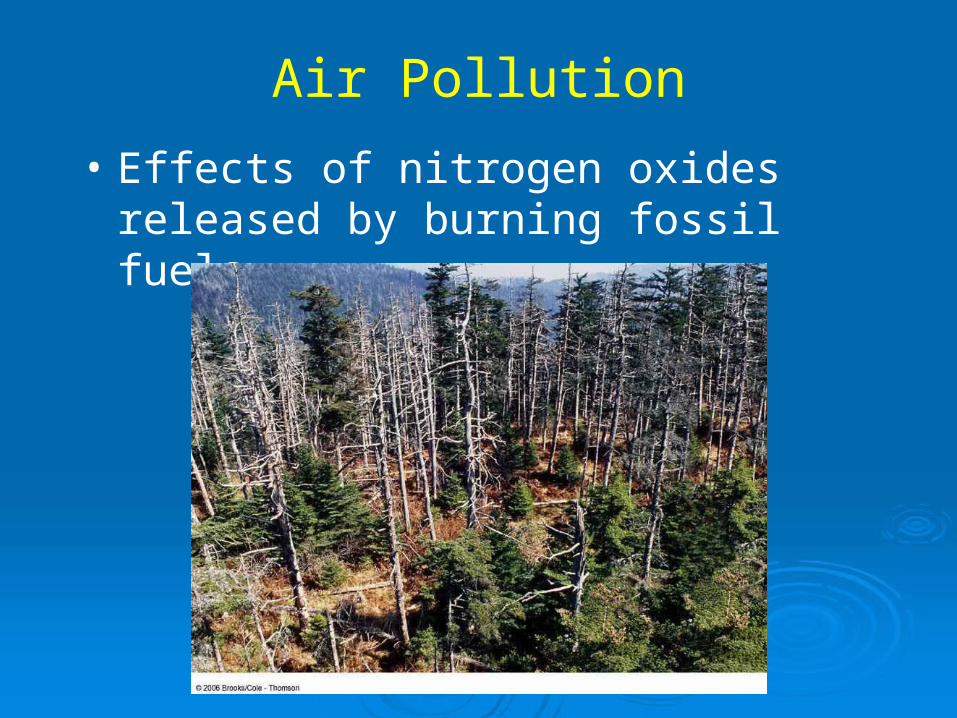
Air Pollution
• Effects of nitrogen oxides released by burning fossil fuels
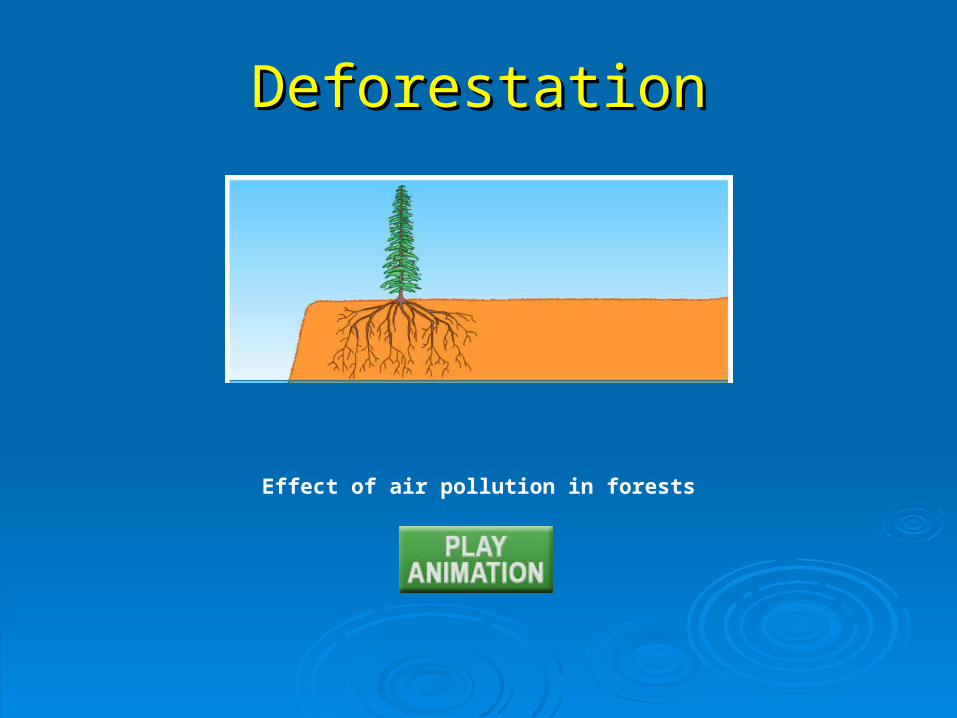
DeforestationDeforestation
Effect of air pollution in forests
Phosphorus Cycle
• Phosphorus is part of phospholipids, nucleotides, NADH, ATP
• Main limiting factor in ecosystems
• Reservoir is Earth’s crust; no gaseous phase
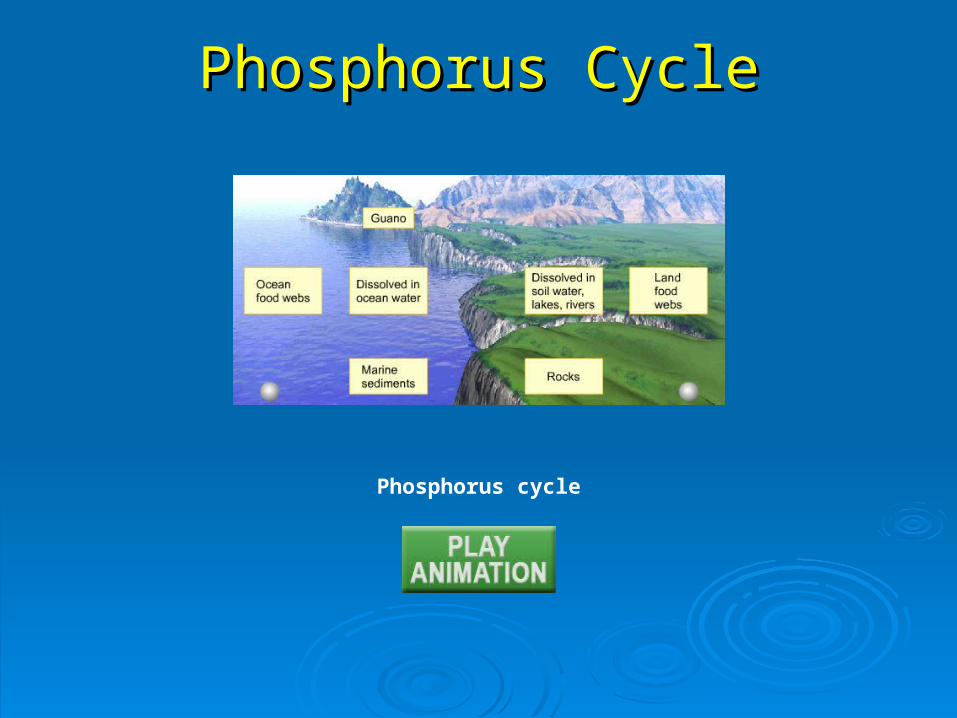
Phosphorus CyclePhosphorus Cycle
Phosphorus cycle
Human Effects
• In tropical countries, clearing lands for agriculture may deplete phosphorus-poor soils
• In developed countries, fertilizer causes phosphorus overloads in soil
Eutrophication
• Phosphorus is limiting factor in many freshwater ecosystems
• Runoff from phosphate fertilizers accelerates algal growth in waterways
• Resulting dense algal blooms cause system overload and death
Clouds MoveClouds Move
StreamStream