ecosystem monitoring: details of this element of … · i ecosystem monitoring: details of this...
TRANSCRIPT
i
Ecosystem Monitoring: Details of this Element of the Build-out Plan
Foreword
The purpose of including an Ecosystem Monitoring element in the Build-‐out Plan is to begin to greatly broaden inclusion of biotic and habitat parameters in a regional observing and monitoring system for the Gulf of Mexico ecosystem. To the greatest extent practicable, this section draws upon existing work and plans on ecosystem monitoring and management in the Gulf. It is neither possible to reference all relevant programs and activities in this iteration of the plan nor feasible to organize this section by monitoring platform as is the case for other elements of the plan. Unlike the physical oceanographic and meteorological parameters with a relatively long history of coordinated acquisition in the Gulf, sustained and integrated measurements of ecosystem parameters have a less extensive history. Much work remains to be done to reach consensus on priority monitoring requirements. A first attempt at conceptualizing a regional ecosystem observing and monitoring plan that explicitly incorporates a broader set of ecosystem parameters, identified in numerous documents by experts from federal, state, NGOs, private industry, and academic institutions throughout the Gulf is presented here.
This element naturally overlaps some with other elements of the plan, including the Ecosystem Modeling Section 4.3, Harmful Algal Blooms Section 3.12, Water Quality Section 3.13, and Hypoxia Section 3.14.
ii
Table of Contents 1 Introduction to Ecosystem Monitoring ................................................................................................... 1 2 Organization of GCOOS BOP Ecosystem Observing and Monitoring Section .......................... 8 3 Living Marine Resources ................................................................................................................................ 8 3.1 Fisheries .................................................................................................................................................... 8 3.1.1 Context and Existing Capabilities: ................................................................................. 8 3.1.2 Example plans and reports on Gulf Fisheries ........................................................... 11 3.1.3 Needs .......................................................................................................................................... 11 3.2 Marine Mammals ................................................................................................................................... 13 3.2.1 Context and Existing Capabilities: ................................................................................. 13 3.2.2 Example plans and reports on Gulf Marine Mammals .......................................... 14 3.2.3 Needs .......................................................................................................................................... 14 3.3 Sea Turtles ................................................................................................................................................ 15 3.3.1 Context and Existing Capabilities ................................................................................... 15 3.3.2 Example plans and reports for Gulf Sea Turtles ...................................................... 16 3.3.3 Needs .......................................................................................................................................... 17 3.4 Plankton .................................................................................................................................................... 17 3.4.1 Context and Existing Capabilities ................................................................................... 17 3.4.2 Example plans related to Gulf plankton ...................................................................... 18 3.4.3 Needs .......................................................................................................................................... 19 3.5 Coastal Birds and Seabirds ................................................................................................................ 19 3.5.1 Context and Existing Capabilities ................................................................................... 19 3.5.2 Example plans related to Gulf Coastal Birds and Seabirds ................................. 20 3.5.3 Needs .......................................................................................................................................... 20 4 Habitats ....................................................................................................................................................... 20 4.1 Context and Existing Capabilities ................................................................................................... 20 4.2 Example plans on Gulf Habitats ...................................................................................................... 22 4.3 Needs ....................................................................................................................................................... 23 5 Monitoring for Restoration Projects ......................................................................................................... 23 5.1 Context and Existing Capabilities ................................................................................................... 23 5.2 Example Gulf restoration plans and reports ............................................................................. 25 5.3 Needs ....................................................................................................................................................... 25 6 Priority Observing Needs Across Topics ................................................................................................ 27 7 Recommendations ............................................................................................................................................ 29 7.1 Initial Enhancements to Existing System Elements ............................................................... 29 7.2 Collaborative Forum ............................................................................................................................ 29 7.2.1 Living Marine Resources .................................................................................................... 32 7.2.2 Habitats ..................................................................................................................................... 42 7.2.3 Monitoring for Restoration Projects ............................................................................. 43 8 References ....................................................................................................................................................... 48
1
1 Introduction to Ecosystem Monitoring
Regular multi-‐disciplinary ecosystem monitoring facilitates understanding of how the ecosystem and its components change over time. Results from monitoring efforts yield baseline data that can provide early warning of potential environmental concerns. The information is used to prioritize issues for adaptive policy and management, assess damage due to natural and man-‐made disasters, inform restoration projects and evaluate long-‐term trends. Furthermore, ecosystem monitoring is linked to the economy via its use in understanding and valuating Gulf ecosystem services. Monitoring to assess, preserve and/or restore ecosystem services that are significant to the Gulf economy, and population of 20 million people, is critical (National Research Council, 2013 and 2011;Yoskowitz et al., 2013)
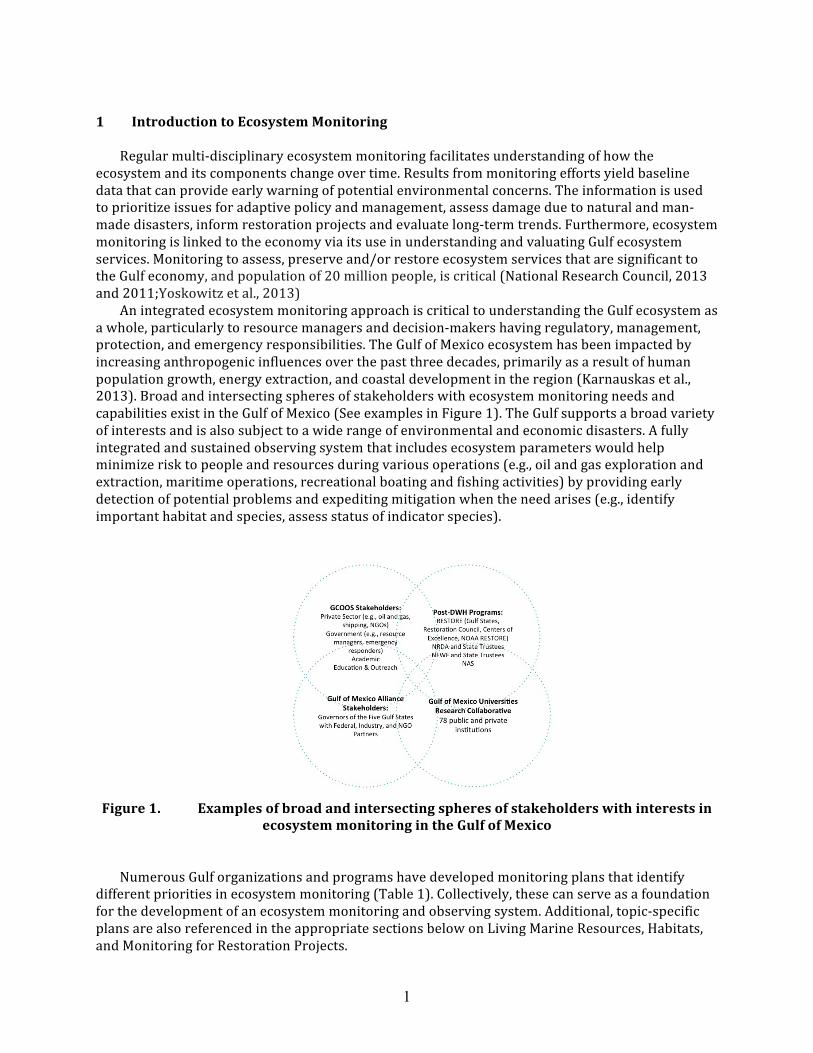
An integrated ecosystem monitoring approach is critical to understanding the Gulf ecosystem as a whole, particularly to resource managers and decision-‐makers having regulatory, management, protection, and emergency responsibilities. The Gulf of Mexico ecosystem has been impacted by increasing anthropogenic influences over the past three decades, primarily as a result of human population growth, energy extraction, and coastal development in the region (Karnauskas et al., 2013). Broad and intersecting spheres of stakeholders with ecosystem monitoring needs and capabilities exist in the Gulf of Mexico (See examples in Figure 1). The Gulf supports a broad variety of interests and is also subject to a wide range of environmental and economic disasters. A fully integrated and sustained observing system that includes ecosystem parameters would help minimize risk to people and resources during various operations (e.g., oil and gas exploration and extraction, maritime operations, recreational boating and fishing activities) by providing early detection of potential problems and expediting mitigation when the need arises (e.g., identify important habitat and species, assess status of indicator species).
Figure 1. Examples of broad and intersecting spheres of stakeholders with interests in
ecosystem monitoring in the Gulf of Mexico
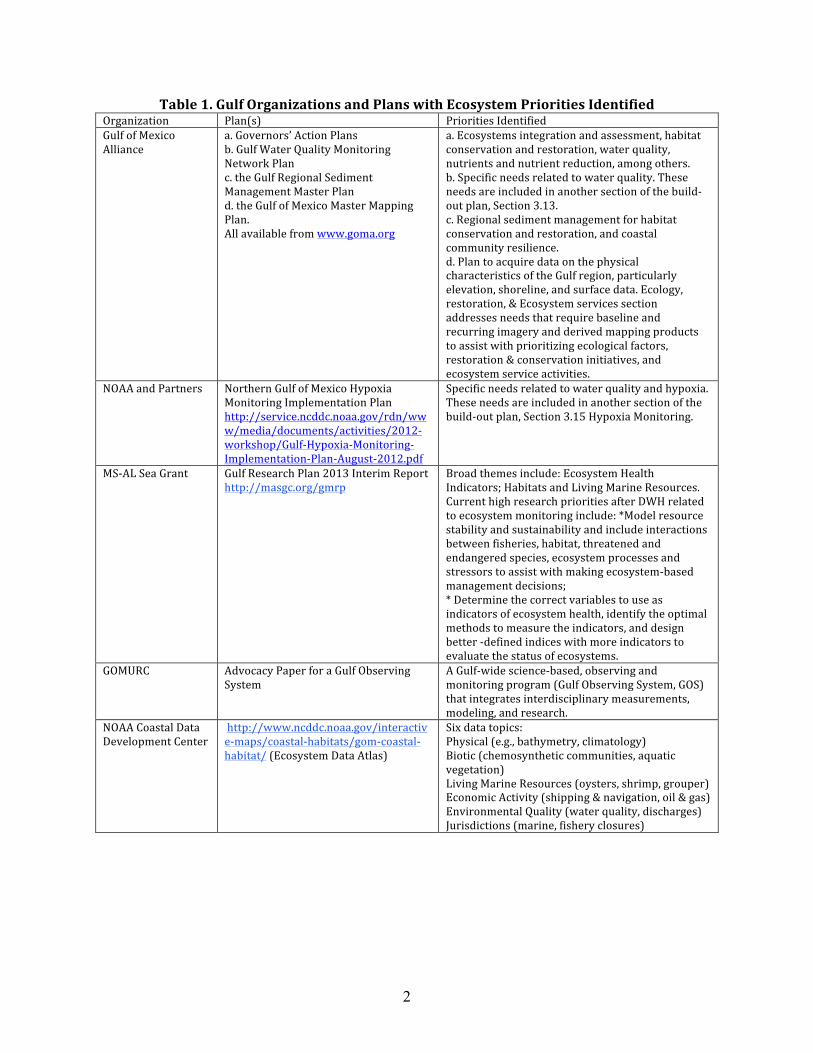
Numerous Gulf organizations and programs have developed monitoring plans that identify different priorities in ecosystem monitoring (Table 1). Collectively, these can serve as a foundation for the development of an ecosystem monitoring and observing system. Additional, topic-‐specific plans are also referenced in the appropriate sections below on Living Marine Resources, Habitats, and Monitoring for Restoration Projects.
2
Table 1. Gulf Organizations and Plans with Ecosystem Priorities Identified Organization Plan(s) Priorities Identified Gulf of Mexico Alliance
a. Governors’ Action Plans b. Gulf Water Quality Monitoring Network Plan c. the Gulf Regional Sediment Management Master Plan d. the Gulf of Mexico Master Mapping Plan. All available from www.goma.org
a. Ecosystems integration and assessment, habitat conservation and restoration, water quality, nutrients and nutrient reduction, among others. b. Specific needs related to water quality. These needs are included in another section of the build-‐out plan, Section 3.13. c. Regional sediment management for habitat conservation and restoration, and coastal community resilience. d. Plan to acquire data on the physical characteristics of the Gulf region, particularly elevation, shoreline, and surface data. Ecology, restoration, & Ecosystem services section addresses needs that require baseline and recurring imagery and derived mapping products to assist with prioritizing ecological factors, restoration & conservation initiatives, and ecosystem service activities.
NOAA and Partners
Northern Gulf of Mexico Hypoxia Monitoring Implementation Plan http://service.ncddc.noaa.gov/rdn/www/media/documents/activities/2012-‐workshop/Gulf-‐Hypoxia-‐Monitoring-‐Implementation-‐Plan-‐August-‐2012.pdf
Specific needs related to water quality and hypoxia. These needs are included in another section of the build-‐out plan, Section 3.15 Hypoxia Monitoring.
MS-‐AL Sea Grant Gulf Research Plan 2013 Interim Report http://masgc.org/gmrp
Broad themes include: Ecosystem Health Indicators; Habitats and Living Marine Resources. Current high research priorities after DWH related to ecosystem monitoring include: *Model resource stability and sustainability and include interactions between fisheries, habitat, threatened and endangered species, ecosystem processes and stressors to assist with making ecosystem-‐based management decisions; * Determine the correct variables to use as indicators of ecosystem health, identify the optimal methods to measure the indicators, and design better -‐defined indices with more indicators to evaluate the status of ecosystems.
GOMURC Advocacy Paper for a Gulf Observing System
A Gulf-‐wide science-‐based, observing and monitoring program (Gulf Observing System, GOS) that integrates interdisciplinary measurements, modeling, and research.
NOAA Coastal Data Development Center
http://www.ncddc.noaa.gov/interactive-‐maps/coastal-‐habitats/gom-‐coastal-‐habitat/ (Ecosystem Data Atlas)
Six data topics: Physical (e.g., bathymetry, climatology) Biotic (chemosynthetic communities, aquatic vegetation) Living Marine Resources (oysters, shrimp, grouper) Economic Activity (shipping & navigation, oil & gas) Environmental Quality (water quality, discharges) Jurisdictions (marine, fishery closures)
3
Ocean Conservancy Restoring the Gulf of Mexico: A Framework for Ecosystem Restoration in the Gulf of Mexico http://www.oceanconservancy.org/places/gulf-‐of-‐mexico/restoring-‐the-‐gulf-‐of-‐mexico.pdf
Restore, protect and maintain the coast, with emphasis on wetlands; restore, protect and maintain coastal and marine habitats of significance; Gulf of Mexico Ecosystem Research and Monitoring (GEM) Program for adaptive management; reduce the northern Gulf Hypoxic Zone; protect, restore, and maintain wildlife populations; sustain globally competitive Gulf fisheries; promote community recovery and resiliency
Gulf States Marine Fisheries Commission
2011 Annual Report (most recent available online) http://www.gsmfc.org/publications/annual%20reports/annual%20report%20of%20the%20gsmfc%2062.pdf
This report covers oil spill recovery, stock enhancement, restoration programs and breakdowns for each Gulf state’s Department managing fisheries with costs
Gulf of Mexico Fishery Management Council
http://www.gulfcouncil.org/fishery_management_plans/index.php
Plans are not ecosystem-based but include Essential Fish Habitat Amendments, as an initial step toward ecosystem-based management of fisheries
Gulf Coast Ecosystem Restoration Task Force and Council
http://www.gulfofmexicoalliance.org/pdfs/GulfCoastReport_Full_12-04_508-1_final.pdf#view=Fit&toolbar=1 and http://www.restorethegulf.gov/sites/default/files/The%20Path%20Forward%20to%20Restoring%20the%20Gulf%20Coast%20-%20Gulf%20Restoration%20Council%20FINAL.pdf
Goals from the Task Force Strategy: Restore & conserve habitat Restore water quality Replenish & protect living coastal marine resources Enhance community resilience From the Council Initial Plan: Adopted the four goals from the Task Force strategy and added a fifth: Restore and revitalize the Gulf economy
Gulf States and Counties
Some plans available, such as: Louisiana 2012 Coastal Master Plan http://www.coastalmasterplan.louisiana.gov/ and the Mississippi GoCoast 2020 Report http://www.gocoast2020.com/
The Louisiana 2012 Coastal Master Plan includes protection of ecosystem services. The Mississippi GoCoast2020 plan includes eco-restoration. The plan outlines the criteria for projects funded through the RESTORE Act, as well as additional criteria, such as, “ Each project is “designed to restore and protect the natural resources, ecosystems, fisheries, marine and wildlife habitats, beaches, coastal wetlands, or economy of the Gulf Coast”.
Centers of Excellence Plans will be available as the Centers come online. RESTORE ACT Summary from GOMURC: http://www.marine.usf.edu/gomurc/docs/GOMURC-restore%20act-8-8-12.pdf
From the RESTORE Act (s. 1605.) focus on Gulf science, technology, and monitoring in at least one of the following: Coastal and deltaic sustainability, restoration and protection, including solutions and technology that allow citizens to live in a safe and sustainable manner in a coastal delta in the Gulf Coast region; Coastal fisheries and wildlife ecosystem research and monitoring in the Gulf Coast Region; Offshore energy development, including research and technology to improve the sustainable and safe development of energy resources in the GoM; Sustainable and resilient growth, economic and commercial development in the Gulf Coast Region; Comprehensive observation, monitoring, and mapping of the GoM
4
NOAA RESTORE Science Program
Science Plan Framework: http://restoreactscienceprogram.noaa.gov/wp-content/uploads/2013/12/RESTOREScienceProgramFramework_Final_2013_12.pdf Science Plan soon to follow.
From the RESTORE ACT (S.1605): Research, observation, and monitoring to support, to the maximum extent practicable, the long-term sustainability of the ecosystem, fish stocks, fish habitat, and the recreational, commercial, and charter fishing industry in the Gulf of Mexico. The Science Plan framework includes the focus areas: Ecosystem structure, functioning and connectivity; holistic approaches to observing and monitoring; integrated analysis and synthesis of new and existing data; and periodic state of health assessments
Natural Resources Damage Assessment
http://www.gulfspillrestoration.noaa.gov/wp-content/uploads/FINAL_NRDA_StatusUpdate_April2012.pdf In addition to the damage assessment process, there are plans per restoration project funded through NRDA. Some early restoration projects have been identified. See http://www.gulfspillrestoration.noaa.gov/restoration/early-restoration/
NRDA Technical working groups assess damage to habitats, living marine resources, other biological communities, and human use. Additional needs/priorities for baselines and damage assessments seem not to be identified.
NOAA Ecosystem Status Report for the Gulf of Mexico, 2013
Karnauskas et al., 2013. To be online soon.
Specific needs related to priorities identified. Priorities identified include commercial fishing, energy, population, recreation & tourism, shipping, and stressors. Environmental stressors include coastal wetland erosion, harmful algal blooms, hypoxic zone, non-indigenous aquatic species, hurricanes & tropical storms, and oil spills & hazardous releases. Integrated existing resources (GoM Data Atlas, IOOS CAGES, Hypoxia Watch). Example priority indicators: Spatial and temporal data on benthic habitats, river inputs of nutrients, long-term time series data on Living Marine Resources indicator and protected species, sediment transport processes, improved understanding of LOOP current.
Integrated Assessment and Management of the Gulf of Mexico Large Marine Ecosystem
http://gomlme.iwlearn.org/en/activities/sap Strategic Action Program
Improve water quality, avoid depletion and recover depleted living marine resources, conserve coastal and marine ecosystems, mitigate and adapt to climate change and sea level rise, improve science education and outreach, and cross-cutting issues
5
National Academy of Sciences (NAS) and NAS Gulf Program
http://nationalacademies.org/gulf/faq/index.html -strategic plan to be released in Spring 2014; and Lubchencho et al. 2012: http://www.pnas.org/content/109/50/20212.full#sec-7
From Lubchencho et al., 2012: • Gather adequate environmental baselines for all regions at risk.
• Build coupled ecosystem-‐scale routine monitoring/research/communications for every large marine ecosystem (LME) in US waters, including the coastal zone, to provide integrated interdisciplinary understanding of how the ecosystem works and is changing, ideally as a partnership with academic institutions in the region.
• Basic understanding of the dynamics of the ecosystem and consequences of changes to people requires a comprehensive, integrated monitoring/research/communication effort focused on an LME, ideally through the development of regional scientific collaboration networks. This understanding must be more than spatially explicit descriptions of the species present. It should include an integrated understanding of the physical and ecosystem dynamics sufficient to know where oil is likely to flow (along the shallow and deep inner shelf and not just open surface waters), which species and life stages would be affected at different times of the year, and how impacts to those species would affect other species, the functioning of the ecosystem, the provision of ecosystem services, and other impacts on people. This knowledge is needed for every LME in the US Exclusive Economic Zone (and adjacent waters, where relevant), and it would vastly enhance effective response and understanding of impacts. Moreover, it has the added benefit of significantly enhancing a variety of other management efforts—water quality, invasive species, fisheries, shipping, recreation, and conservation. Achieving this integrated knowledge and sharing it publicly require stable funding and mechanisms to integrate monitoring, research, and communication activities across a region and the nation.
6
National Fish and Wildlife Foundation’s Gulf Environmental Benefit Fund
http://www.nfwf.org/gulf/Pages/home.aspx Each state Trustee identifies priorities for NFWF funds in their state.
Overall priorities: 1) habitats and 2) living coastal resources. State Trustee priorities: AL: focus on the overall health of coastal bays and estuaries and their associate tributaries, marine and coastal habitat improvements, coastal shoreline protection and targeted species-specific habitat restoration. FL: focus natural resource restoration efforts on these marine and coastal environments by improving water quality and other critical habitat elements, strengthening management of important fish and wildlife populations, and enhancing the resiliency of coastal resources and communities by implementing outcomes-based projects that maximize environmental benefits. LA: funds will be allocated solely to barrier island restoration projects and river diversion projects along the Mississippi and Atchafalaya Rivers. MS: a holistic approach to restoration efforts that maximizes the benefit of current and future funding with the overall goal of achieving long-lasting and sustainable environmental benefit for the state and region. TX: no official statement of priorities, but initial projects include restoration of dunes, marshes, barrier island, oyster reef, and waterfowl habitats.
Ecosystem Approach to Management for the Northern Gulf of Mexico
http://www.northerngulfinstitute.org/publications/docs/2012/09/10367McAnally_EAM_Report2_2012.09.14reduced.pdf
Document consolidates efforts toward implementing an Integrated Ecosystem Assessment of selected Gulf of Mexico ecosystems in NOAA Ecosystem Approach to Management (i.e. the assessment of ecosystems in Gulf including modeling). Priorities include developing indicators to define ecosystems ‘states’ for 5 Gulf locations and create a prototype system, with model framework, to identify indicators to drivers and pressures for Gulf ecosystem. 3 drivers categories and 13 pressures are identified, including habitat modification or loss and primary ecosystem services.
The Gulf of Mexico Ecosystem: A Coastal and Marine Atlas (Ocean Conservancy)
http://www.oceanconservancy.org/places/gulf-of-mexico/gulf-atlas.html
Atlas developed to 1. Provide big-picture view of GOM and its resources, 2. Support multi-layered understanding of how Gulf ecosystem functions, 3. Highlight overlapping distributions and ecological linkages, and 4. Serve as a tool for identifying knowledge gaps Atlas include maps and companion descriptions of 54 physical and geographic features, animals, habitats, environmental stressors, and human uses in the Gulf1.
EPA National Coastal Condition Report (2012)
http://water.epa.gov/type/oceb/assessmonitor/nccr/index.cfm
Priorities include habitats, benthic indices, and living marine resources. Note: data is from 2003-2006.
1 Ocean Conservancy Gulf of Mexico Geospatial Atlas Contents: Oceanography & Benthos (bathymetry, bottom sediments, temperature, salinity, river flow, surface currents, net primary productivity), Habitats (salt marshes & mangroves, oyster reefs, seagrasses, barrier islands, corals, sargassum, hydrocarbon seeps), Invertebrates (brown, white, and red shrimp, oysters), Fish (whale shark, bull shark, gulf menhaden, red snapper, red drum, tuna), Birds (common loon, northern gannet, brown pelican, clapper rail, least tern, royal tern, black skimmer), Sea Turtles & Marine Mammals (kemp’s ridley sea turtle, sperm whale, dolphins, manatee), etc.
7
GCOOS Stakeholder Workshops (see rows below)
Instead of plans, the listing below includes reports from selected GCOOS stakeholder workshops with priorities identified. Nearly 800 individuals from industries, academia, government, and non-profit corporations, who have participated in 20 GCOOS workshops to identify needs. Workshops’ reports: http://gcoos.tamu.edu/?page_id=391
Priorities: http://gcoos.tamu.edu/?page_id=51
Oil and Gas Industry Workshop
http://gcoos.org/?page_id=754 a) Maps of water quality, including dissolved oxygen, pH, nutrients, chemical oxygen demand, hydrocarbons, salinity, temperature, river inputs, models, currents, winds, hyperspectral imagery; b) maps of hydrocarbon seeps; c) maps of chemosynthetic and archaeological sites; maps of SSH, ocean color imagery; d) bathymetry, topography, and soil maps; e) probability maps of bottom hazards; f) marine mammal and turtle maps (physical sightings, tagging, currents as a proxy).
Harmful Algal Bloom Workshop Reports
http://gcoos.tamu.edu/documents/HAB_GCOOS_report.pdf , http://gcoos.org/?page_id=1452 and http://gcoos.org/?page_id=881 . Report from 2012 workshop soon to be posted.
Specific needs related to HABS. HABS have their own section of the build-out plan, Section 3.12 Harmful Algal Bloom Integrated Observing System.
Recreational Boaters Workshops
http://gcoos.org/?page_id=1026 and http://gcoos.org/?page_id=1551
Salinity, turbidity, chlorophyll, dissolved oxygen, bacteriological water quality products.
Water Quality workshops
http://gcoos.org/?page_id=3316 and http://gcoos.tamu.edu/?page_id=4013
Specific needs related to water quality. Water Quality is a separate section of the build-out plan, Section 3.13 Integrated Water Quality Network and Beach Monitoring
Many Gulf organizations share common ecosystem priorities, such as living marine resources (fisheries, marine mammals, sea turtles, sea birds, plankton), habitats, and restoration project monitoring (Table 1.). As such, these priorities are addressed in more detail in this section. (It should be noted that these priorities also reflect ecosystem priorities identified through the Global Ocean Observing System (GOOS), as well as those identified by the U.S. IOOS2). Similar to physical oceanographic and meteorological parameters, measurement of a core set of ecosystem parameters in the Gulf will likely fulfill multiple objectives for various stakeholder groups. Leveraging existing programs and capacities in the Gulf of Mexico to monitor for these priorities is an effective, efficient approach.
Coordinated, aggregated, integrated, and sustained ecosystem monitoring data in the Gulf of Mexico are limited. Existing monitoring capabilities focus mainly on physical oceanographic and meteorological measurements. Coupling these data to existing, albeit limited, baseline ecosystem data can provide a strong foundation from which the build a comprehensive regional ecosystem observing and monitoring system.
2 GOOS priorities include: a) Describe and forecast the state of the ocean, including living resources, and b) Improve management of marine and coastal ecosystems and resources. IOOS themes include: Ecosystems, Fisheries and Water Quality.
8
2 Organization of this Document
The following sections on ecosystem monitoring in the Gulf specifically address the common priority areas of living marine resources, habitats, and monitoring for restoration projects. Included are summaries of context and existing capabilities, plans and reports, and needs identified in plans, reports, and from experts.
Some of the key programs currently providing ecosystem information are mentioned in the specific sections below on living marine resources, habitats, and restoration project monitoring. In addition to these and GCOOS’ observing system partners, coastal monitoring data also are also obtained from programs such as EPA’s Environmental Monitoring and Assessment Program and National Coastal Assessment, NOAA’s National Status & Trends Program, the Bureau of Ocean Energy Management (BOEM)’s Environmental Studies Program in the Gulf, and several other state and federal regulatory agencies, and satellite data laboratories. Additional ecosystem data are being collected through The Outer Continental Shelf Lands Act [OCSLA, 43 U.S.C. 1331 et seq., sec 20(b)], which requires studies of OCS exploratory and producing oil and gas lease sites include monitoring of “the human, marine, and coastal environments to identify any significant changes in the quality and productivity of such environments.” Currently, the Ocean Conservancy and the Gulf of Mexico Alliance are working together to identify a comprehensive list of long-‐term monitoring programs in the Gulf. 3 Living Marine Resources
NOAA categorizes Living Marine Resources (LMR) to include: fish (with several sub-‐categories), marine mammals, sea turtles, seabirds, and plankton. The following sub-‐sections address these NOAA categories of LMR. 3.1 Fisheries 3.1.1 Context and Existing Capabilities:
In the Gulf of Mexico, fishing is a valuable industry. In 2012, the value of the U.S. commercial catch from the Gulf was approximately $754 million and 3.1 million recreational fishers caught over 161 million fish (NOAA, 2012a). However, some Gulf fisheries are subject to overfishing, including the Gag, Gray Triggerfish, and Greater Amberjack (NOAA, 2012b). Some species of primary commercial importance have increased in abundance over recent decades, while commercial species of secondary importance have generally decreased in abundance. The average trophic level of both Mexican and U.S. landings has increased over time (Karnauskas et al., 2013). In addition to threats of overfishing, many Gulf fisheries were impacted by the DWH oil spill, with commercial production reduced by 20% simply due to closures to protect seafood safety (National Research Council, 2013). After the DWH oil spill, fish toxicity concerns was a major concern. Throughout the Gulf, fishing areas were closed to protect the public and ensure seafood safety. One example of ensuring safety was the initiation of seafood safety stations, in which fish were monitored by NMFS until sensory and chemical tests were passed. Post-‐DWH research on Gulf killifish, as an indicator fish species, showed killifish embryos exposed to sediments from oiled locations developed abnormalities, including heart defects, delayed hatching and reduced hatching success (Whitehead et al.,2012).
Beyond the economic value of fisheries, the health of fisheries directly impacts higher trophic levels including birds, marine mammals, sea turtles, and terrestrial wildlife. Healthy Gulf fisheries are threatened by a variety of factors, including overfishing, pollution, bycatch, and habitat loss. An ecosystem-‐based observational and monitoring approach, in addition to assimilating species
9
behavioral, physiological and population data, would help support effective protection and management of Gulf fisheries.
Ecosystem-‐based management approaches to fisheries are widely recommended, but are difficult to implement. The Gulf of Mexico Fishery Management Council’s Fisheries Management Plans for federal waters all include an appendix identifying Essential Fish Habitat (EFH) as a start to ecosystem-‐based management. (This appendix will be reviewed again in 2015.) The Gulf States Marine Fisheries Commission (GSMFC) includes important habitats in all management plans. However, more complete information, beyond habitat identification, for implementing an ecosystem-‐based approach to fisheries is not widely available.
States and the Gulf of Mexico Fishery Management Council regulate the Gulf fisheries. Alabama, Mississippi, and Louisiana currently regulate fisheries out to three nautical miles, while Florida and Texas regulate fisheries out to nine nautical miles. The five Gulf States are also joined through the Gulf States Marine Fisheries Commission ( http://www.gsmfc.org/) , which is composed of three members from each of the five Gulf States: the head of the marine resource agency of each state, a member of the legislature, and a citizen with knowledge of marine fisheries appointed by the governor. The Commission is empowered to make recommendations to the governors and legislatures of the five Gulf States regarding the management of the fisheries. Beyond these state water boundaries, and out to the 200 nautical mile limit of the Exclusive Economic Zone, federal fisheries regulations through the Gulf of Mexico Fishery Management Council are in effect. If federal regulations are more stringent than state regulations, then federal fishing permit holders must comply with federal regulations, regardless of where the fish are harvested. The Interjurisdictional Fishery Program (IJF), administered by the Gulf States Marine Fisheries Commission, was designed to develop management plans for transboundary stocks that migrate freely through state and federal jurisdictions.
The states conduct their own assessments in their waters and may integrate SouthEast Area Monitoring and Assessment Program (SEAMAP) data. There has been limited use of the SouthEast Data, Assessment, and Review (SEDAR—http://www.sefsc.noaa.gov/sedar/) process to conduct state stock assessments (menhaden) but recently the GSMFC itself has conducted assessments with the state agencies (assisted on Gulf menhaden SEDAR 32A and completed a blue crab assessment GDAR01). SEAMAP is a state-‐federal-‐university program designed to collect (generally beyond state boundaries), manage and disseminate fishery-‐independent data in the southeastern U.S., using standard protocols for surveys and holding a database with more than 31 years of fishery-‐independent data.
Fisheries stock assessments for federal waters are conducted through the SEDAR process. SEDAR consists of a Data Workshop to compile available data, a stock assessment workshop to prepare the actual assessment, and an Assessment Review Workshop to provide an independent review of the assessment, conduct additional analyses if required, and make recommendations regarding the status of stock and acceptable biological catch levels. In most cases the stock assessment will be prepared by NOAA Fisheries assessment biologists, but the assessment can also be prepared by a state agency or by a university or independent assessment biologist under contract to NOAA Fisheries or a state agency.
In addition to the stock assessments, the NOAA Estuarine Living Marine Resources (ELMR) Program (http://ccma.nos.noaa.gov/ecosystems/estuaries/elmr.aspx ) has a consistent database on the distribution, relative abundance, and life history characteristics of ecologically and economically important fishes and invertebrates in the Nation's estuaries. This database is organized regionally, with one region being the Gulf of Mexico. However, the data in this system have not been updated recently.
Fisheries are monitored by state, federal, regional, and university entities using a number of different methods, including: monthly trawl surveys (total number and weight by species, individual lengths and weight by species, and associated environmental data), monthly gill net
10
surveys for finfish, seines and beam plankton trawls (BPL), semi-‐monthly commercial trap surveys for blue crabs (including environmental data), seasonal plankton tows, seasonal shrimp and groundfish surveys, and seasonal bottom longline surveys, vertical line surveys, reef fish surveys, and bottom water dissolved oxygen. NMFS conducts camera surveys of redfish and uses sidescan sonar for surveying the inshore seafloor bottom. Acoustical monitoring techniques are used for fisheries and are used in several different ways. Active acoustic monitoring has been used to identify the presence of fish and for querying acoustic tags, and passive acoustic monitoring has been used for identifying fish based on species-‐specific identifiable sounds (or acoustical signatures).
In addition, to the Southeast Area Monitoring and Assessment Program (SEAMAP), which includes many of the monitoring efforts listed above, the GSMFC programs, including: a) Fisheries Information Network (commercial trip tickets, recreational data collection, head boat at sea and at port sampling, menhaden port sampling, and biological data sampling) with a database, and b) Fisheries Economics Program (inshore shrimp fleet economic survey, fishing related businesses economic survey, marine angler recreational fishery economic survey, marine recreational use economic survey, stated preference choice experimental survey of anglers in the Gulf) with analyses and education/outreach.
When considering shellfish, Gulf oyster harvests account for 60% of all US oyster harvests. Oyster habitats are common foci of numerous Gulf restoration projects. Most states monitor shellfish harvesting areas per the National Shellfish Sanitation Program requirements to ensure safe harvest and consumption, as shellfish are threatened and/or impacted by, among others, salinity changes, contaminants, harmful algal blooms, and disease, for examples. Data required to properly monitor shellfish fisheries include pH, alkalinity, salinity, the carbon cycle, mercury, phytoplankton, benthic habitats, lipids and proteins, contaminants, and chromophoric dissolved organic matter-‐sediment budgets work, environmental conditions, and harmful algal blooms.
Additional monitoring efforts focus on the two Gulf threatened and endangered fish species, sturgeon and smalltooth sawfish. NMFS Protected Resources Division manages both species under the guidance of the Endangered Species Act. Under the ESA, NMFS identifies critical habitats for both species. Sturgeon have complex anadromous life histories and use nearshore, island, deltaic, and riverine habitats depending on the season and their lifecycle stage. For Sturgeon, many coastal waters between the mouth of the Mississippi and Suwannee River in Florida are designated critical habitats (NOAA, 2008). Smalltooth sawfish are nearly always in marine waters—mainly nearshore, with larger individuals sometimes in offshore waters. For both species of fish, data on habitats, sediment contamination, movements, distribution, and abundance are important.
Monitoring the distribution and abundance of non-‐native species, such as lionfish, that threaten the survival of native species due to habitat encroachment and preying on small native fish, is also critically important. Lionfish are now found in coastal waters from Texas to Florida. NMFS, USGS, and the Nature Conservancy have been monitoring lionfish distribution in the Gulf. GCOOS, working with the Nature Conservancy, has developed an interactive map to show the lionfish expansion over time in the Gulf (http://gcoos.org/products/maps/lionfish/#.Ua0DFmQ4Vlr ).
The DWH impact prompted renewed efforts to assess fisheries abundance and health in the Gulf. The NRDA process is assimilating baseline data, such as historical information on density, diversity and distribution of ichthyoplankton and fisheries stocks in the northern Gulf of Mexico (NRDA, 2012). Deepwater trawls of fish, fish eggs, fish larvae and plankton are also being conducted, along with monitoring of Sargassum, nearshore cetacean and sea turtle prey, and toxicity testing to better understand Gulf fisheries dynamics. Separate study plans are in place for Sturgeon and Blue Crab. Additional studies related to fisheries also are being conducted through the NRDA process (NRDA, 2012).
11
3.1.2 Example plans and reports on Gulf Fisheries The following are in addition to those in Table 1: Gulf of Mexico Fishery Management Council Fishery Management Plans (7 in the Gulf: Aquaculture,
Reef Fish, Shrimp, Spiny Lobster, Corals, Red Drum, Migratory Pelagics with generic amendments and the Essential Fish Habitat Amendment) (not ecosystem based) http://www.gulfcouncil.org/fishery_management_plans
Essential Fish Habitat Amendments to all Fishery Management Plans in the Gulf http://www.gulfcouncil.org/fishery_management_plans/essential_fish_habitat.php
Gulf States Marine Fisheries Commission Plans (especially for SEAMAP) – http://www.gsmfc.org/#:content@10:links@4
NMFS Recovery Plans for Threatened and Endangered Species – http://www.nmfs.noaa.gov/pr/recovery/plans.htm#fishes
Regional Management Plan for Gulf Menhaden -‐ http://www.gsmfc.org/publications/GSMFC%20Number%20099.pdf
NMFS Status of US Living Marine Resources -‐ http://www.st.nmfs.noaa.gov/LivingOceans.html BOEM Environmental Studies Program Information System (for information on Gulf studies funded
through the ESP) -‐ http://www.data.boem.gov/homepg/data_center/other/espis/espismaster.asp?appid=1
Post-‐DWH reports – NAS Ecosystem Services Report http://dels.nas.edu/resources/static-‐assets/materials-‐based-‐on-‐reports/reports-‐in-‐brief/Ecosystem-‐Services-‐Report-‐Brief-‐Final.pdf and NRDA 2012 Update http://www.gulfspillrestoration.noaa.gov/wp-‐content/uploads/FINAL_NRDA_StatusUpdate_April2012.pdf
Toward a National Animal Telemetry Observing Network for Our Oceans, Coasts, and Great Lakes, Workshop Report 2011 (Moustahfid et al., 2012) http://www.ioos.noaa.gov/observing/animal_telemetry/workshop/mar2011/atn_synth_wrkshp_rprt_jul2011.pdf
Meeting our Nation’s Needs for Biological and Environmental Monitoring: Strategic Plan and Recommendations for a National Animal Telemetry Network (ATN) Through U.S. IOOS. (Alexander et al., 2014)
GCOOS Stakeholder Workshop Reports – http://gcoos.tamu.edu/?page_id=391 3.1.3 Needs
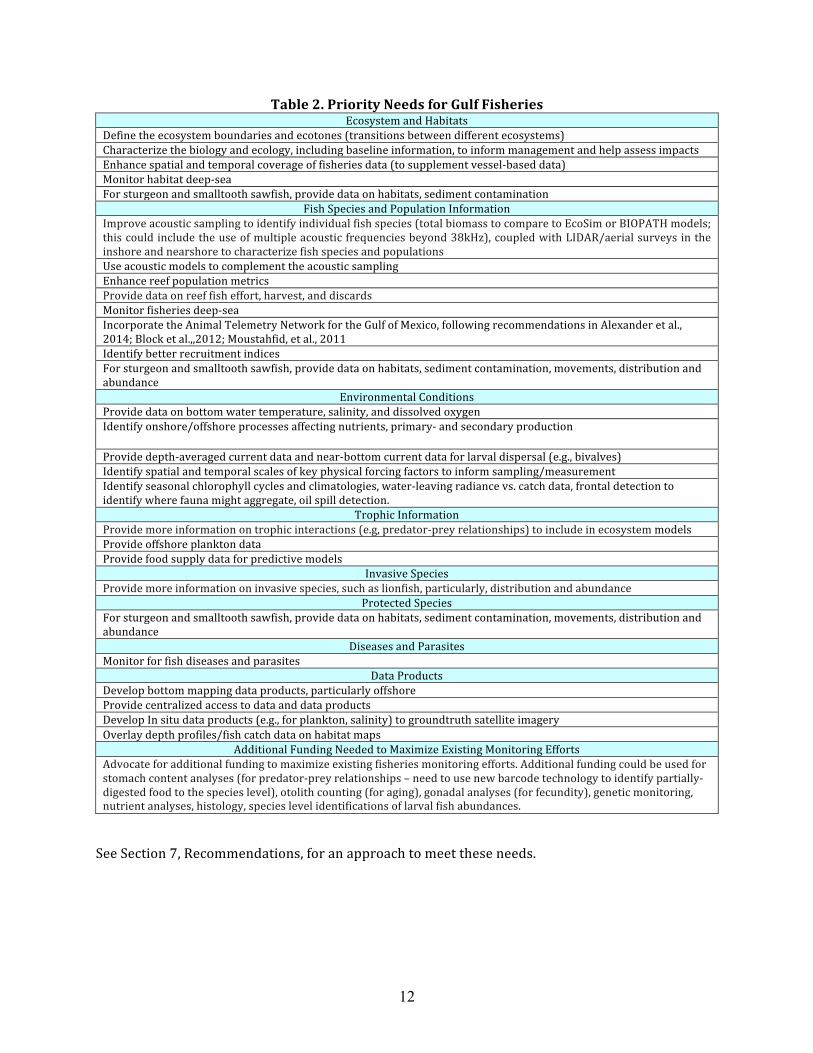
GCOOS analyzed a number of Gulf fisheries plans and reports and interviewed subject matter experts to develop a categorized list of fisheries-‐related data and information needs for the design and implementation of an ecosystem-‐based monitoring and observing system (Table 2.).
12
Table 2. Priority Needs for Gulf Fisheries Ecosystem and Habitats
Define the ecosystem boundaries and ecotones (transitions between different ecosystems) Characterize the biology and ecology, including baseline information, to inform management and help assess impacts Enhance spatial and temporal coverage of fisheries data (to supplement vessel-‐based data) Monitor habitat deep-‐sea For sturgeon and smalltooth sawfish, provide data on habitats, sediment contamination
Fish Species and Population Information Improve acoustic sampling to identify individual fish species (total biomass to compare to EcoSim or BIOPATH models; this could include the use of multiple acoustic frequencies beyond 38kHz), coupled with LIDAR/aerial surveys in the inshore and nearshore to characterize fish species and populations Use acoustic models to complement the acoustic sampling Enhance reef population metrics Provide data on reef fish effort, harvest, and discards Monitor fisheries deep-‐sea Incorporate the Animal Telemetry Network for the Gulf of Mexico, following recommendations in Alexander et al., 2014; Block et al.,,2012; Moustahfid, et al., 2011 Identify better recruitment indices For sturgeon and smalltooth sawfish, provide data on habitats, sediment contamination, movements, distribution and abundance
Environmental Conditions Provide data on bottom water temperature, salinity, and dissolved oxygen Identify onshore/offshore processes affecting nutrients, primary-‐ and secondary production
Provide depth-‐averaged current data and near-‐bottom current data for larval dispersal (e.g., bivalves) Identify spatial and temporal scales of key physical forcing factors to inform sampling/measurement Identify seasonal chlorophyll cycles and climatologies, water-‐leaving radiance vs. catch data, frontal detection to identify where fauna might aggregate, oil spill detection.
Trophic Information Provide more information on trophic interactions (e.g, predator-‐prey relationships) to include in ecosystem models Provide offshore plankton data Provide food supply data for predictive models
Invasive Species Provide more information on invasive species, such as lionfish, particularly, distribution and abundance
Protected Species For sturgeon and smalltooth sawfish, provide data on habitats, sediment contamination, movements, distribution and abundance
Diseases and Parasites Monitor for fish diseases and parasites
Data Products Develop bottom mapping data products, particularly offshore Provide centralized access to data and data products Develop In situ data products (e.g., for plankton, salinity) to groundtruth satellite imagery Overlay depth profiles/fish catch data on habitat maps
Additional Funding Needed to Maximize Existing Monitoring Efforts Advocate for additional funding to maximize existing fisheries monitoring efforts. Additional funding could be used for stomach content analyses (for predator-‐prey relationships – need to use new barcode technology to identify partially-‐digested food to the species level), otolith counting (for aging), gonadal analyses (for fecundity), genetic monitoring, nutrient analyses, histology, species level identifications of larval fish abundances.
See Section 7, Recommendations, for an approach to meet these needs.
13
3.2 Marine Mammals 3.2.1 Context and Existing Capabilities:
The Gulf of Mexico is home to 29 known species of marine mammals with some of the largest populations of dolphins in the U.S. occurring in Mississippi and Louisiana waters. These Gulf marine mammals primarily reside offshore (e.g., Sperm whale), with the exception of three species of dolphin that commonly occur in nearshore waters: Bottlenose dolphin, Atlantic spotted dolphin, and Risso’s dolphin. Research suggests that some certain marine mammal species are important sentinel species indicating ecosystem health (e.g., Ross, 2000, Wells et al., 2004, Moore, 2008). NOAA NMFS’ Protected Resources Division has the responsibility to assess and protect all these species under the Marine Mammal Protection Act and/or the Endangered Species Act. This Division includes the Marine Mammal Stranding Network (which also includes other partners, such as the Institute for Marine Mammal Studies). The Stranding Network keeps data on strandings and analyzes individual mortality (pathology, contaminants, genetic stock analyses) (http://www.sefsc.noaa.gov/species/mammals/strandings.htm ). States have stranding networks as well.
Oceanic features and conditions affect the distribution and abundance of marine mammals. A few important features include seafloor relief (e.g., shelf edges and canyons), water temperature gradients, ocean currents (e.g., the Loop Current), and cyclonic and anti-‐cyclonic eddies. Marine mammals often forage or hunt for specific prey in association with these oceanographic features (NOAA, 2008).
The health of marine mammal populations is threatened by many factors, including marine noise, habitat loss, vessels strikes, fisheries bycatch, prey limitations, marine debris, over-‐fishing, and human interaction. In this context, human interaction refers to feeding of marine mammals by people on fisheries or tourism vessels. BOEM has funded many studies on Gulf of Mexico marine mammals in the Gulf of Mexico, and such studies help provide information regarding the effects of anthropogenic noise on marine mammals, the use of acoustic backscatter to identify the taxonomic composition of prey, and sperm whale population baseline data.
Recent studies and monitoring efforts have focused on assessing Gulf marine mammal health before and after the DWH oil spill. Prior to DWH, in February 2010 through December 2012, 817 bottlenose dolphin deaths were documented, compared to approximately 100 per year between 2002 and 2009 (NRDA, 2012). NOAA declared this an official Unusual Mortality Event for cetaceans in the northern Gulf of Mexico. Uncertainty regarding the abundance and range of dolphins, as well as their environmental stressors, complicate assessing the degree of assessment of the true impact from DWH on population abundance estimates and the ecosystem services provided by dolphin populations (National Research Council, 2013).
The NRDA Trustees divided the northern Gulf of Mexico assessment area into four different study groups:
(1) the open ocean (oceanic zone) targeting primarily sperm whale, Bryde’s whale, striped dolphin and Risso’s dolphin;
(2) coastal bottlenose dolphins; (3) estuarine bottlenose dolphins; and (4) manatees (which live in rivers, estuaries and canals). Post-‐DWH, NRDA used existing marine mammal surveys from the NOAA Southeast Fisheries
Science Center as baseline data. For potential exposure and impacts to oceanic marine mammals, the Trustees conduct research cruises and aerial surveys to document distribution, exposure, population demographics, habitat and presence of deep oceanic prey such as squid. Aerial surveys have been performed since DWH to document changes in distribution and abundance of coastal bottlenose dolphins and manatees. Additional monitoring efforts include passive acoustic monitoring over time, satellite tagging, tissue sampling, prey trawling and echosounder surveys.
14
Tissue samples may eventually be analyzed to measure oil-‐related contaminants in marine mammal tissues and to perform species-‐dependent genetic analyses. Habitat information is being collected for characterizing water column productivity. For estuarine dolphins, the Trustees are conducting studies to detect changes in fecundity, survival, distribution and abundance. Vessel-‐based surveys collect photo documentation data for comparison to baseline abundance and site fidelity, prevalence of calves and identification of individuals to track for survival analysis. Comparative studies are also being done between DWH affected vs. non-‐affected bays.
Information from the U.S. Geological Survey (USGS) Southeast Ecological Research Center will contribute to establishing and evaluating baseline for manatees. Aerial surveys were conducted for manatees (NRDA, 2012). 3.2.2 Example plans and reports on Gulf Marine Mammals The following are in addition to those in Table 1: NMFS’ Recovery Plans for Threatened and Endangered Species (for marine mammals):
http://www.nmfs.noaa.gov/pr/recovery/plans.htm#mammals Our Living Oceans (2009) – section on Gulf of Mexico marine mammals
http://spo.nmfs.noaa.gov/olo6thedition/34-‐-‐Unit%2023.pdf The National Academy of Sciences’ National Research Council. 2003. Ocean Noise and Marine
Mammals http://www.nap.edu/openbook.php?record_id=10564&page=1 BOEM Environmental Studies Program Information System (for information on Gulf studies funded
through the ESP): http://www.data.boem.gov/homepg/data_center/other/espis/espismaster.asp?appid=1
Post DWH: National Academy of Sciences (2013) http://dels.nas.edu/resources/static-‐assets/materials-‐based-‐
on-‐reports/reports-‐in-‐brief/Ecosystem-‐Services-‐Report-‐Brief-‐Final.pdf NRDA Status Update http://www.gulfspillrestoration.noaa.gov/wp-‐
content/uploads/FINAL_NRDA_StatusUpdate_April2012.pdf Toward a National Animal Telemetry Observing Network for Our Oceans, Coasts, and Great Lakes,
Workshop Report 2011 (Moustahfid et al., 2012) http://www.ioos.noaa.gov/observing/animal_telemetry/workshop/mar2011/atn_synth_wrkshp_rprt_jul2011.pdf
Meeting our Nation’s Needs for Biological and Environmental Monitoring: Strategic Plan and Recommendations for a National Animal Telemetry Network (ATN) Through U.S. IOOS. (Alexander et al., 2014)
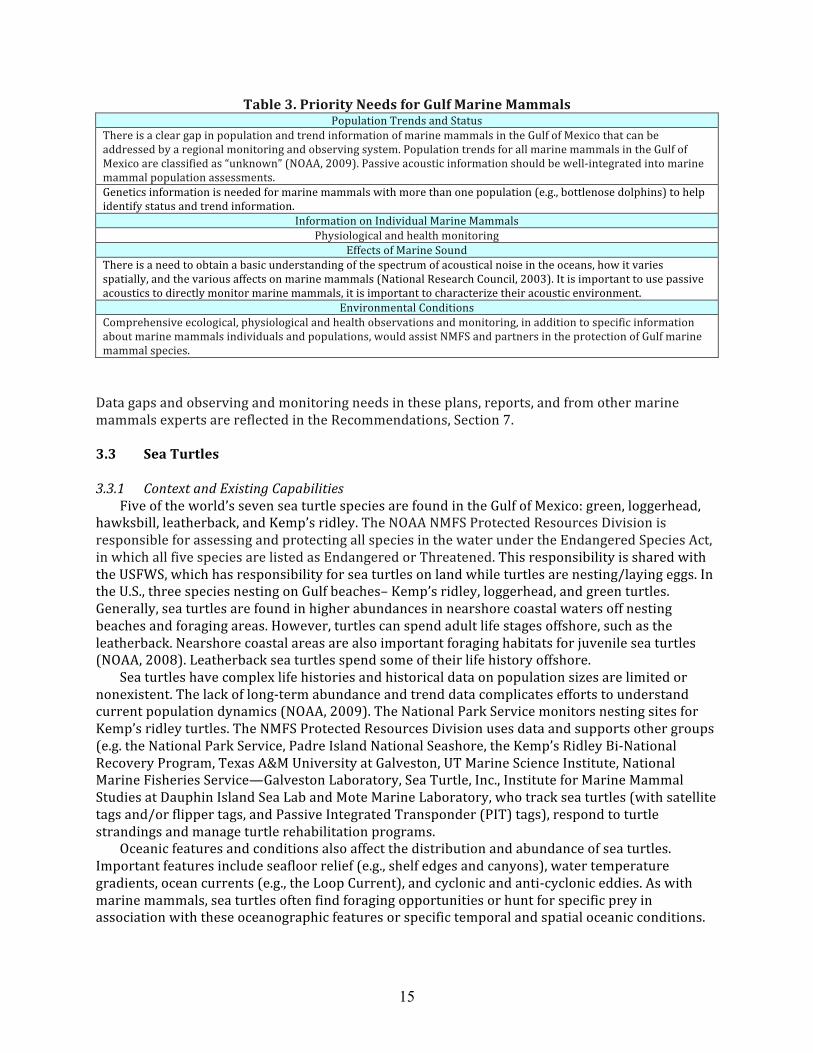
GCOOS Stakeholder Workshop Reports -‐ http://gcoos.tamu.edu/?page_id=391 3.2.3 Needs GCOOS analyzed a number of Gulf marine mammal plans and reports and interviewed subject matter experts to develop a categorized list of marine mammal-‐related data and information needs for the design and implementation of an ecosystem-‐based monitoring and observing system (Table 3).
15
Table 3. Priority Needs for Gulf Marine Mammals Population Trends and Status
There is a clear gap in population and trend information of marine mammals in the Gulf of Mexico that can be addressed by a regional monitoring and observing system. Population trends for all marine mammals in the Gulf of Mexico are classified as “unknown” (NOAA, 2009). Passive acoustic information should be well-‐integrated into marine mammal population assessments. Genetics information is needed for marine mammals with more than one population (e.g., bottlenose dolphins) to help identify status and trend information.
Information on Individual Marine Mammals Physiological and health monitoring
Effects of Marine Sound There is a need to obtain a basic understanding of the spectrum of acoustical noise in the oceans, how it varies spatially, and the various affects on marine mammals (National Research Council, 2003). It is important to use passive acoustics to directly monitor marine mammals, it is important to characterize their acoustic environment.
Environmental Conditions Comprehensive ecological, physiological and health observations and monitoring, in addition to specific information about marine mammals individuals and populations, would assist NMFS and partners in the protection of Gulf marine mammal species. Data gaps and observing and monitoring needs in these plans, reports, and from other marine mammals experts are reflected in the Recommendations, Section 7. 3.3 Sea Turtles 3.3.1 Context and Existing Capabilities
Five of the world’s seven sea turtle species are found in the Gulf of Mexico: green, loggerhead, hawksbill, leatherback, and Kemp’s ridley. The NOAA NMFS Protected Resources Division is responsible for assessing and protecting all species in the water under the Endangered Species Act, in which all five species are listed as Endangered or Threatened. This responsibility is shared with the USFWS, which has responsibility for sea turtles on land while turtles are nesting/laying eggs. In the U.S., three species nesting on Gulf beaches– Kemp’s ridley, loggerhead, and green turtles. Generally, sea turtles are found in higher abundances in nearshore coastal waters off nesting beaches and foraging areas. However, turtles can spend adult life stages offshore, such as the leatherback. Nearshore coastal areas are also important foraging habitats for juvenile sea turtles (NOAA, 2008). Leatherback sea turtles spend some of their life history offshore.
Sea turtles have complex life histories and historical data on population sizes are limited or nonexistent. The lack of long-‐term abundance and trend data complicates efforts to understand current population dynamics (NOAA, 2009). The National Park Service monitors nesting sites for Kemp’s ridley turtles. The NMFS Protected Resources Division uses data and supports other groups (e.g. the National Park Service, Padre Island National Seashore, the Kemp’s Ridley Bi-‐National Recovery Program, Texas A&M University at Galveston, UT Marine Science Institute, National Marine Fisheries Service—Galveston Laboratory, Sea Turtle, Inc., Institute for Marine Mammal Studies at Dauphin Island Sea Lab and Mote Marine Laboratory, who track sea turtles (with satellite tags and/or flipper tags, and Passive Integrated Transponder (PIT) tags), respond to turtle strandings and manage turtle rehabilitation programs.
Oceanic features and conditions also affect the distribution and abundance of sea turtles. Important features include seafloor relief (e.g., shelf edges and canyons), water temperature gradients, ocean currents (e.g., the Loop Current), and cyclonic and anti-‐cyclonic eddies. As with marine mammals, sea turtles often find foraging opportunities or hunt for specific prey in association with these oceanographic features or specific temporal and spatial oceanic conditions.
16
Sea turtles are threatened by many factors, including, but not limited to, habitat loss, marine debris ingestion and entanglement, prey limitations, vessel strikes, entrainment in dredging operations, seismic activities, and recreational and commercial fisheries bycatch.
Post-‐DWH, NRDA has identified baseline data on Gulf sea turtles. Baseline determinations have included information on Kemp’s ridley nesting success and habitat utilization collected by National Park Service Padre Island National Seashore, to restore a successful nesting colony of Kemp’s ridley. NRDA has also incorporated routine sea turtle nesting surveys conducted on ~368 km of Florida Panhandle beaches (Escambia County through Franklin County) since 1989 and on 75 km of Alabama beaches (Mobile and Baldwin counties) since 2003 into their efforts to assess population baselines.
As part of the post-‐DWH assessment, the Trustees are focusing primarily on sea turtles most affected by exposure to oil spills turtles – the loggerhead and Kemp’s ridley turtles. The Trustees divided the northern Gulf of Mexico assessment area into three geographic ecological zones: (1) nesting beaches, (2) coastal waters (neritic zone) where juveniles and adults live and feed, and (3) open ocean waters where post-‐hatchlings, juveniles and adults live and feed, especially in and around floating Sargassum.
For nesting turtles, existing and expanded surveys are continuing. To document changes in the abundance, distribution and movement of female sea turtles, the Trustees have collected satellite tag data on 28 sea turtles, which could indicate potential impacts resulting from the oil spill. For the neritic turtles, aerial surveys and satellite telemetry studies have been and are being conducted to document abundance and spatial distributions. Aerial surveys were conducted seasonally from April 2011 through April 2012 to cover broad-‐scale synoptic surveys of the continental shelf and shelf break from Brownsville, Texas,to Dry Tortugas, Florida. The purpose was to collect information on distribution, abundance, species identification and exposure of sea turtles. Dead turtles are being examined for tissue pathology. For oceanic turtles, Sargassum habitat is being examined. Sargassum, like surface oil, tends to aggregate in oceanic convergence zones created by currents and wind. During DWH spill, sea turtle rescue efforts documented 574 turtles in this Sargassum habitat, in which 464 were visibly oiled. Aerial surveys were conducted seasonally from April 2011 through April 2012 to cover broad-‐scale synoptic surveys of the continental shelf and shelf break from Brownsville, Texas, to Dry Tortugas, Florida. The purpose was to collect information on distribution, abundance, species identification and exposure of sea turtles. Sea turtle prey sampling was also conducted, along with netting surveys west of the Mississippi River Delta. Additional studies are also being conducted through the NRDA process (NRDA, 2012). 3.3.2 Example plans and reports for Gulf Sea Turtles The following are in addition to those in Table 1: The National Academy of Sciences (2010) Assessment of Sea-‐Turtle Status and Trends: Integrating
Demography and Abundance, http://www.nap.edu/catalog/12889.html; Gulf of Mexico Fishery Management Council – Reef Fish Management Plan, Amendment 31 on Sea
Turtles USFWS/NMFS’ Recovery Plans for Threatened and Endangered Species (for sea turtles)
http://www.nmfs.noaa.gov/pr/recovery/plans.htm#turtles Sea Turtle Stranding and Salvage Network (NMFS Protected Resources Division) – reports on
strandings and analyses post-‐mortality http://www.sefsc.noaa.gov/species/turtles/strandings.htm
NRDA 2012 Update http://www.gulfspillrestoration.noaa.gov/wp-‐content/uploads/FINAL_NRDA_StatusUpdate_April2012.pdf
Toward a National Animal Telemetry Observing Network for Our Oceans, Coasts, and Great Lakes, Workshop Report 2011 (Moustahfid et al., 2012)
17
http://www.ioos.noaa.gov/observing/animal_telemetry/workshop/mar2011/atn_synth_wrkshp_rprt_jul2011.pdf
Meeting our Nation’s Needs for Biological and Environmental Monitoring: Strategic Plan and Recommendations for a National Animal Telemetry Network (ATN) Through U.S. IOOS. (Alexander et al., 2014)
GCOOS Workshop Reports: http://gcoos.tamu.edu/?page_id=391 3.3.3 Needs
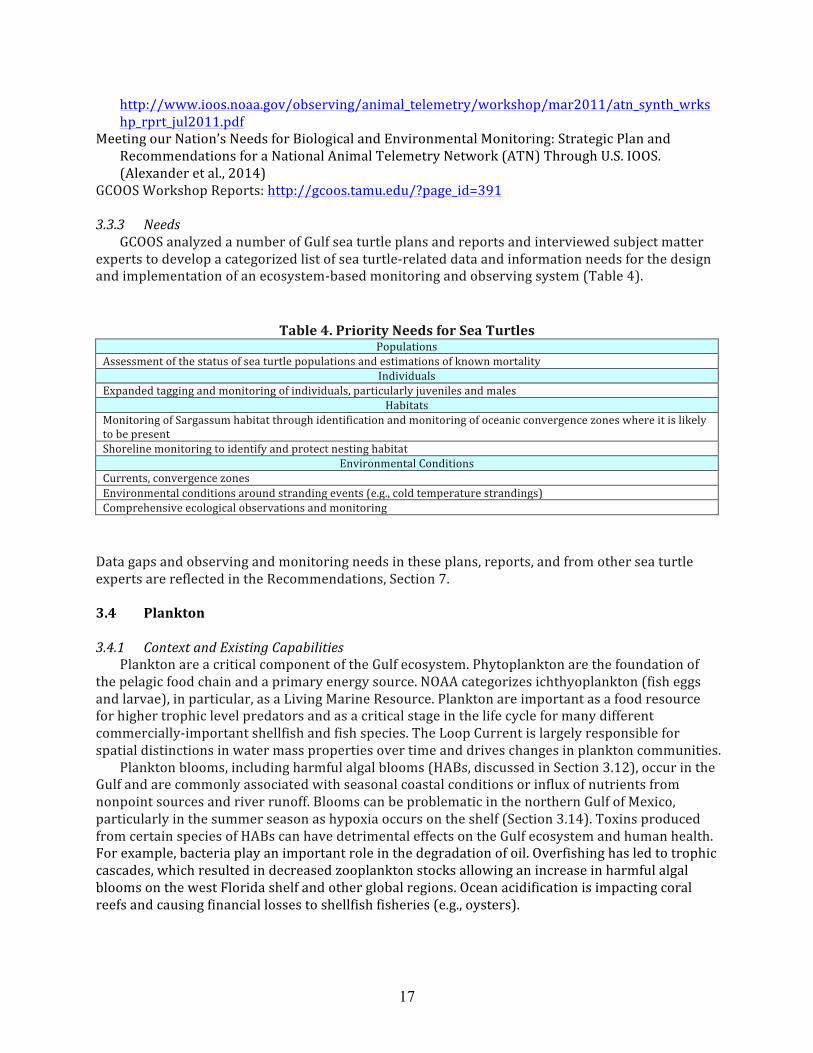
GCOOS analyzed a number of Gulf sea turtle plans and reports and interviewed subject matter experts to develop a categorized list of sea turtle-‐related data and information needs for the design and implementation of an ecosystem-‐based monitoring and observing system (Table 4).
Table 4. Priority Needs for Sea Turtles Populations
Assessment of the status of sea turtle populations and estimations of known mortality Individuals
Expanded tagging and monitoring of individuals, particularly juveniles and males Habitats
Monitoring of Sargassum habitat through identification and monitoring of oceanic convergence zones where it is likely to be present Shoreline monitoring to identify and protect nesting habitat
Environmental Conditions Currents, convergence zones Environmental conditions around stranding events (e.g., cold temperature strandings) Comprehensive ecological observations and monitoring Data gaps and observing and monitoring needs in these plans, reports, and from other sea turtle experts are reflected in the Recommendations, Section 7. 3.4 Plankton 3.4.1 Context and Existing Capabilities
Plankton are a critical component of the Gulf ecosystem. Phytoplankton are the foundation of the pelagic food chain and a primary energy source. NOAA categorizes ichthyoplankton (fish eggs and larvae), in particular, as a Living Marine Resource. Plankton are important as a food resource for higher trophic level predators and as a critical stage in the life cycle for many different commercially-‐important shellfish and fish species. The Loop Current is largely responsible for spatial distinctions in water mass properties over time and drives changes in plankton communities.
Plankton blooms, including harmful algal blooms (HABs, discussed in Section 3.12), occur in the Gulf and are commonly associated with seasonal coastal conditions or influx of nutrients from nonpoint sources and river runoff. Blooms can be problematic in the northern Gulf of Mexico, particularly in the summer season as hypoxia occurs on the shelf (Section 3.14). Toxins produced from certain species of HABs can have detrimental effects on the Gulf ecosystem and human health. For example, bacteria play an important role in the degradation of oil. Overfishing has led to trophic cascades, which resulted in decreased zooplankton stocks allowing an increase in harmful algal blooms on the west Florida shelf and other global regions. Ocean acidification is impacting coral reefs and causing financial losses to shellfish fisheries (e.g., oysters).
18
Although most plankton monitoring in the Gulf of Mexico focuses on icthyoplankton, other types of zooplankton, phytoplankton, and bacteria are also important ecosystem components to monitor.
SEAMAP conducts includes seasonal, vessel-‐based icthyoplankton surveys in the upper 200m of the water column in the Gulf. All 31+ years’ of data are stored in the SEAMAP databases (GSMFC manages the trawl, bottom longline and vertical line databases, while NMFS manages the ichthyoplankton and reef fish databases). These surveys provide abundance and geographic distribution of the early life stages of fishes, as well as, help measure primary productivity and pelagic habitat. The winter surveys focus on grouper and tilefish species from the continental shelf, shelf edge and deep Gulf waters. The spring surveys focus on Bluefin tuna and cover the entire U.S. Gulf of Mexico. Fall surveys focus on fall spawning fishes such as King and Spanish mackerel, red drum and snappers. Water properties (e.g. temperature, salinity, and dissolved oxygen) and chlorophyll a concentrations are measured at each station using a CTD and benchtop fluorometry. Plankton samples are analyzed in laboratories post-‐cruise, but only for icthyoplankton at this time.
Threats to plankton include non-‐point source pollution, invasive species, habitat loss, changing environmental conditions, and more. Given that plankton are reliant upon currents and specific environmental conditions, regional observations are essential to better understand spatial and temporal distributions. Regional observations and monitoring would also help provide the information needed to protect critical Gulf trophic interactions and species life cycles.
Following the DWH oil spill, the NRDA process relied upon the SEAMAP plankton data to establish baselines. To assess the spill impacts, NRDA collected and is collecting data on the occurrence, abundance, biomass, vertical distribution, and daily vertical migration of the early life stages of fall spawning and deepwater icthyo-‐ and other zooplankton species. The NRDA process included additional vessel-‐based plankton sampling to complement SEAMAP data, along with data from holographic cameras and particle profilers. The profilers were used at the well-‐site and beyond the area of spill influence to comparatively study plankton distributions.
The NRDA efforts are also attempting to quantify the role of bacteria pre-‐ and post-‐DWH as scientists also discovered that deep-‐dwelling oil-‐degrading bacteria digested a significant amount of oil from the Macondo well (National Research Council, 2013). Additional sampling of plankton and bacteria during spring and summer seasons will be needed to provide quantitative information showing degree and rate of recovery (NRDA, 2012).
Funded through the Gulf of Mexico Research Initiative, with post-‐DWH funds, University of South Florida, researchers monitor a broader range of zooplankton, assessing monthly abundance and distribution of zooplankton along two transects on the West Florida Shelf as a basis for long term monitoring.
Hypoxia, which occurs seasonally in the Northern Gulf of Mexico due to the development of strong vertical stratification in the spring/summer, coupled with nutrient additions from the Mississippi River and subsequent phytoplankton blooms. Hypoxia also occurs seasonally in many Gulf estuaries, bays and lagoons. That phenomenon is addressed in Section 3.14 of the Build-‐out Plan. Harmful algal blooms, specific species of phytoplankton that produce toxins, are addressed in Section 3.12 of the Build-‐out Plan. 3.4.2 Example plans related to Gulf plankton The following are in addition to plans listed in Table 1: NRDA 2010 plankton sampling plan (following the DWH oil spill) -‐
http://www.doi.gov/deepwaterhorizon/adminrecord/upload/Water_Column_Plankton_Walton_Smith_3_Signed-‐redacted3.pdf
SEAMAP Plankton Survey plans http://www.gsmfc.org/default.php?p=sm_ov.htm Envisioning a Marine Biodiversity Observation Network (Duffy et al., 2013)
http://www.aibs.org/biosciencepress-‐releases/resources/DuffyREV2.pdf
19
GCOOS Stakeholder Workshop Reports http://gcoos.tamu.edu/?page_id=391 3.4.3 Needs
GCOOS analyzed a number of Gulf plankton-‐related plans and reports and interviewed subject matter experts to develop a categorized list of plankton-‐related data and information needs for the design and implementation of an ecosystem-‐based monitoring and observing system (Table 5).
Table 5. Priority Needs for Gulf Plankton Expanded Monitoring
Expand zooplankton monitoring (distribution and abundance), to include more micro-‐, mero-‐, and holo-‐plankton (See Harris et al., 2000) and phytoplankton and bacteria. More information on primary productivity (chlorophyll a) Distribution amongst plankton groups phytoplankton biomass, including distribution and abundance of toxic phytoplankton, and of various Phytoplankton Functional Types (PFT) Information on plankton behavior (predation, reproduction)
Environmental Conditions More comprehensive baseline data More information on the complex interactions of physical, chemical, and biological parameters that impact seasonal and inter-‐annual changes in the abundance and distribution of plankton Data gaps and observing and monitoring needs in these plans, reports, and from plankton experts are reflected in the Recommendations, Section 7. 3.5 Coastal Birds and Seabirds 3.5.1 Context and Existing Capabilities
Birds are a conspicuous, highly diverse, and remarkable natural resource of the Gulf of Mexico. Barrier islands, beaches, marshes, and coastal forests support hundreds of species and millions of individual birds. Marshes in the Gulf of Mexico provide extremely important habitat for feeding and nesting of several species that can be found in offshore waters, such Royal Terns and Gulls (NRDA, 2012). Eastern Brown pelicans and roseate spoonbills can serve as avian indicators of the Gulf of Mexico Ecosystem (Karnauskas et al., 2013). Colonial waterbirds, essential components of coastal ecosystems, feed near the top of the food chain, while overwintering shorebirds forage in the mud and sands closer to the bottom of the coastal food chain. Twice a year, the coastal habitats of the Gulf of Mexico also provide essential stopover sites for literally millions of songbirds migrating between temperate breeding areas in North America and tropical wintering areas in the Caribbean, Central and South America. Collectively, these species provide excellent and unparalleled indicators of ecosystem health.
One of the primary challenges in biology is to better understand the linkages between organisms and environments (Schwenk et al. 2009), especially in the face of natural and anthropogenic disturbances. Coastal areas are impacted by weather and storm events, as well as anthropogenic factors, including alteration of hydrological processes, introduction of toxic substances, increased human population density, increased fishing and other commercial enterprises, and direct human disturbance. Perhaps the most important features of the Gulf of Mexico for avian populations are related to the complex interaction between natural and anthropogenic factors that result in changes in land available, changes in the relative amount of different habitat types, and changes in salinity.
20
Bird species of concern in the Gulf include nearshore and marsh birds: brown pelican, diving ducks, wading birds, piping plover (a threatened species); and open water birds such as shearwaters, northern gannets, and frigates (NRDA, 2012).
Bird observational data are collected through volunteer bird counts and through the USGS Breeding Bird Survey.
Post-‐DWH, the NRDA process included aerial photography surveys of seabird and coastal wader colonies in Louisiana, Mississippi, Alabama, and Florida Panhandle. 3.5.2 Example plans related to Gulf Coastal Birds and Seabirds In addition to those in Table 1: NRDA 2012 Update http://www.gulfspillrestoration.noaa.gov/wp-‐
content/uploads/FINAL_NRDA_StatusUpdate_April2012.pdf GCOOS Stakeholder Workshop Reports: http://gcoos.tamu.edu/?page_id=391 3.5.3 Needs
GCOOS analyzed a number of Gulf coastal-‐ and seabird-‐related plans and reports and interviewed subject matter experts to develop a categorized list of coastal-‐ and seabird-‐related data and information needs for the design and implementation of an ecosystem-‐based monitoring and observing system (Table 6).
Table 6. Priority Needs for Coastal Birds and Seabirds Expanded Monitoring
Spatial and temporal pattern of bird densities a comprehensive sampling program integrated across different spatial scales (see Moore et al. 2005; Buler and Moore 2007; Cohen et al. 2012, 2013)
Habitats and Habitat Change abundance and spatial pattern of habitat types/land cover quantify recent changes in land cover as a result of anthropogenic modification
Health of Individuals and Populations More information on stressors and the health of individuals and populations
4 Habitats 4.1 Context and Existing Capabilities
Marine mammals, fish, sea turtles, seabirds, and plankton depend on clean, healthy habitats for food, shelter, and breeding grounds. Habitats include salt and fresh water marshes, mangroves, mudflats, beaches, coral and shellfish reefs, water column, and bottom sediments. The Gulf of Mexico has experienced wide-‐scale losses of numerous critical habitat types for over three decades (Karnauskas et al., 2013).
Effective spatial and temporal management of important habitats is one of the recognized ways to protect ecosystem health, as demonstrated in a number of existing Gulf programs and plans documented in the Table 1. Specific NOAA examples are discussed here, such as NOAA’s National Marine Fisheries Service’s emphasis Essential Fish Habitat as the critical component of ecosystem management for fisheries. In addition, NOAA is beginning to coordinate many of its programs and partner activities in the Gulf under a Habitat Blueprint Program (http://www.habitat.noaa.gov/habitatblueprint/), which will be an effort to prevent coastal and marine habitat loss and degradation.
21
For any species listed under the ESA, identification of critical habitats for that species is required. The U.S. Fish and Wildlife Service’s Landscape Conservation Cooperatives, of which there are four in the Gulf, also use a Strategic Habitat Planning approach as the cornerstone of their Gulf ecosystem conservation activities ( http://www.fws.gov/landscape-‐conservation/shc.html and http://gulfcoastprairielcc.org/media/4709/gcp_lcc_2012_for_web_only.pdf). The U.S. Fish and Wildlife Service also has National Wetland Inventory maps, which identify important wetland habitats. NOAA’s Office of Response and Restoration (OR&R), along with other responders, use Area Contingency Plans (ACP), which identify and prioritize different Gulf habitats for oil spill response (see http://myfwc.com/research/gis/projects/oil-‐spill/acp/). A component of these plans is the Environmental Sensitivity Index (ESI), which is the indicator used to prioritize habitats during an oil spill response http://myfwc.com/research/gis/projects/oil-‐spill/environmental-‐sensitivity/). The ESI and ACP information is incorporated into the OR&R’s Emergency Response and Management Application products. Gaps remain in forecasting trajectories/circulation around some identified important habitats.
GOMA partners have also developed habitat-‐based plans, including the Gulf Regional Sediment Management Master Plan and the Gulf of Mexico Master Mapping Plan. According to the MS Department of Marine Resources, sediment restoration data gaps exist, including the need for more information on inshore sediment transport, current information (at micro-‐level), finer-‐scale subsidence data, and thin-‐layer sediment deposition.
Some habitats, such as Elkhorn and Staghorn corals and Johnson’s seagrass, are listed as threatened or endangered under ESA, and are under the protection of the NMFS Protected Resources Division ( http://sero.nmfs.noaa.gov/protected_resources/coral/index.html and http://sero.nmfs.noaa.gov/protected_resources/johnsons_seagrass/index.html ). Johnson’s seagrass is the first and only marine plant to be listed under the ESA. In the Gulf, pelagic sargassum provides habitat to more than 150 species of finfish larvae and early life stages of many sea turtle species.
Sea turtle habitats are also priorities for ESA protection in the Gulf of Mexico, including nesting beach habitats, coastal foraging habitats, and coral reef habitats (for fish prey) (NOAA, 2009).
BOEM, through its ESP, funds long-‐term studies of important species of corals (e.g., Lophelia pertusa) and their habitats in the Gulf of Mexico, particularly at Flower Garden Banks National Marine Sanctuary (e.g., Minerals Management Service, 2007). EPA monitors corals and invasive species at Flower Garden Banks. BOEM and the National Institute for Undersea Science and Technology (NIUST) also monitor chemosynthetic communities and seafloor hydrate habitats throughout the Gulf. The DWH oil has had toxic effects on deepwater corals (National Research Council, 2013).
Artificial reefs, decommissioned oil rigs, and shipwrecks are also considered important habitats in the Gulf of Mexico (e.g., Stunz et al. 2013 unpublished, https://tamucc.edu/news/2013/11/111113%20Artificial%20Reefs.html#.UqZBFxZz2XI ), but they can pose regulatory concerns for agencies, such as the Bureau of Safety and Environmental Enforcement (BSEE), the U.S. Army Corps of Engineers, and some States. Some artificial reefs cause environmental concerns for NGOs (e.g., National Wildlife Federation, 2013). BSEE has funded many studies to help understand the impacts of decommissioned rigs on the Gulf ecosystem (see http://www.bsee.gov/Exploration-‐and-‐Production/Decomissioning/TAR-‐Decommissioning-‐Projects/ ).
Dauphin Island Sea Lab monitors submerged aquatic vegetation habitats from Chandeleur Islands to St. Joe’s Bay.
Certain habitats, such as coastal wetlands and dunes, have critical roles in protecting coastal communities from storm surges and flooding. Approximately 1,100 linear miles of coastal wetlands were affected by the DWH oil spill (National Research Council, 2013). In areas where roots survived the impact, little to no long-‐term impairment is expected. However, where the oil destroyed
22
vegetation and root systems, sediment erosion converted the marshland to open water. Since storm mitigation is directly related to the total area of wetlands, the change in area is the most practical measurement of change in ecosystem services. The service can be valued in monetary terms by estimating the cost of storm damage that would be incurred in the absence of the wetlands.
As part of the NRDA process, baselines were identified and extensive assessment plans were developed for nearshore sediments, submerged aquatic vegetation, and shorelines (NRDA, 2012).
NOAA has helped develop a Coastal and Marine Ecological Classification Standard (CMECS). Despite these ongoing efforts to characterize habitats, gaps still remain in characterization and
monitoring habitat changes over time and space. 4.2 Example plans on Gulf Habitats The following are in addition to those plans listed in Table 1. Gulf of Mexico Fishery Management Council’s Essential Fish Habitat Amendment to the Fishery
Management Plans http://www.gulfcouncil.org/fishery_management_plans/essential_fish_habitat.php
Gulf Regional Sediment Management Master Plan http://www.gulfofmexicoalliance.org/projects/files/25HCRT_H-‐4_1pager.pdf
Gulf of Mexico Master Mapping Plan http://goma.sam.usace.army.mil Landscape Conservation Cooperative Plans – example for the Gulf Coast Prairie
http://gulfcoastprairielcc.org/media/4709/gcp_lcc_2012_for_web_only.pdf). Area Contingency Plans http://myfwc.com/research/gis/projects/oil-‐spill/acp/ NMFS Final Recovery Plan for Johnson’s Seagrass
http://www.nmfs.noaa.gov/pr/pdfs/recovery/johnsonsseagrass.pdf Gulf of Mexico Fishery Management Council’s Fishery Management Plan for Corals http://www.gulfcouncil.org/fishery_management_plans/coral_management.php BOEM Environmental Studies Program Information System (for information on Gulf studies funded
through the ESP): http://www.data.boem.gov/homepg/data_center/other/espis/espismaster.asp?appid=1
Flower Garden Banks National Marine Sanctuary (FGBNMS) Monitoring and Habitat http://flowergarden.noaa.gov/science/monitor.html http://flowergarden.noaa.gov/science/habitat.html FGBNMS data-‐display tool in collaboration with NCDDC http://www.ncddc.noaa.gov/website/google_maps/FGB/mapsFGB.htm Florida Keys National Marine Sanctuary http://floridakeys.noaa.gov/research_monitoring/welcome.html ONMS system-‐wide efforts and condition reports http://sanctuaries.noaa.gov/science/monitoring/welcome.html http://sanctuaries.noaa.gov/science/condition/welcome.html Envisioning a Marine Biodiversity Observation Network (Duffy et al., 2013)
http://www.aibs.org/biosciencepress-‐releases/resources/DuffyREV2.pdf Ecosystem Status Report for the Gulf of Mexico, NOAA Technical Memorandum NMFS-‐SEFSC-‐653,
52 p. NRDA 2012 Update http://www.gulfspillrestoration.noaa.gov/wp-‐
content/uploads/FINAL_NRDA_StatusUpdate_April2012.pdf GCOOS Stakeholder Workshop Reports http://gcoos.tamu.edu/?page_id=391
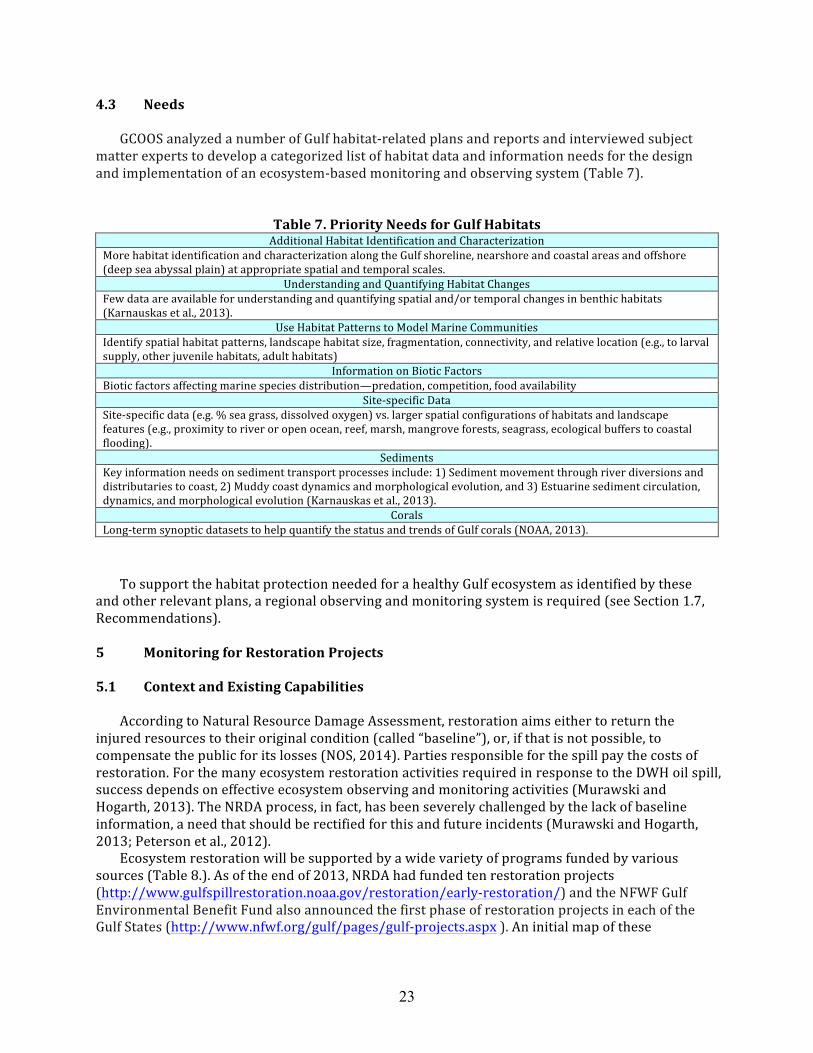
23
4.3 Needs
GCOOS analyzed a number of Gulf habitat-‐related plans and reports and interviewed subject matter experts to develop a categorized list of habitat data and information needs for the design and implementation of an ecosystem-‐based monitoring and observing system (Table 7).
Table 7. Priority Needs for Gulf Habitats Additional Habitat Identification and Characterization
More habitat identification and characterization along the Gulf shoreline, nearshore and coastal areas and offshore (deep sea abyssal plain) at appropriate spatial and temporal scales.
Understanding and Quantifying Habitat Changes Few data are available for understanding and quantifying spatial and/or temporal changes in benthic habitats (Karnauskas et al., 2013).
Use Habitat Patterns to Model Marine Communities Identify spatial habitat patterns, landscape habitat size, fragmentation, connectivity, and relative location (e.g., to larval supply, other juvenile habitats, adult habitats)
Information on Biotic Factors Biotic factors affecting marine species distribution—predation, competition, food availability
Site-‐specific Data Site-‐specific data (e.g. % sea grass, dissolved oxygen) vs. larger spatial configurations of habitats and landscape features (e.g., proximity to river or open ocean, reef, marsh, mangrove forests, seagrass, ecological buffers to coastal flooding).
Sediments Key information needs on sediment transport processes include: 1) Sediment movement through river diversions and distributaries to coast, 2) Muddy coast dynamics and morphological evolution, and 3) Estuarine sediment circulation, dynamics, and morphological evolution (Karnauskas et al., 2013).
Corals Long-‐term synoptic datasets to help quantify the status and trends of Gulf corals (NOAA, 2013).
To support the habitat protection needed for a healthy Gulf ecosystem as identified by these and other relevant plans, a regional observing and monitoring system is required (see Section 1.7, Recommendations). 5 Monitoring for Restoration Projects 5.1 Context and Existing Capabilities
According to Natural Resource Damage Assessment, restoration aims either to return the injured resources to their original condition (called “baseline”), or, if that is not possible, to compensate the public for its losses (NOS, 2014). Parties responsible for the spill pay the costs of restoration. For the many ecosystem restoration activities required in response to the DWH oil spill, success depends on effective ecosystem observing and monitoring activities (Murawski and Hogarth, 2013). The NRDA process, in fact, has been severely challenged by the lack of baseline information, a need that should be rectified for this and future incidents (Murawski and Hogarth, 2013; Peterson et al., 2012).
Ecosystem restoration will be supported by a wide variety of programs funded by various sources (Table 8.). As of the end of 2013, NRDA had funded ten restoration projects (http://www.gulfspillrestoration.noaa.gov/restoration/early-‐restoration/) and the NFWF Gulf Environmental Benefit Fund also announced the first phase of restoration projects in each of the Gulf States (http://www.nfwf.org/gulf/pages/gulf-‐projects.aspx ). An initial map of these
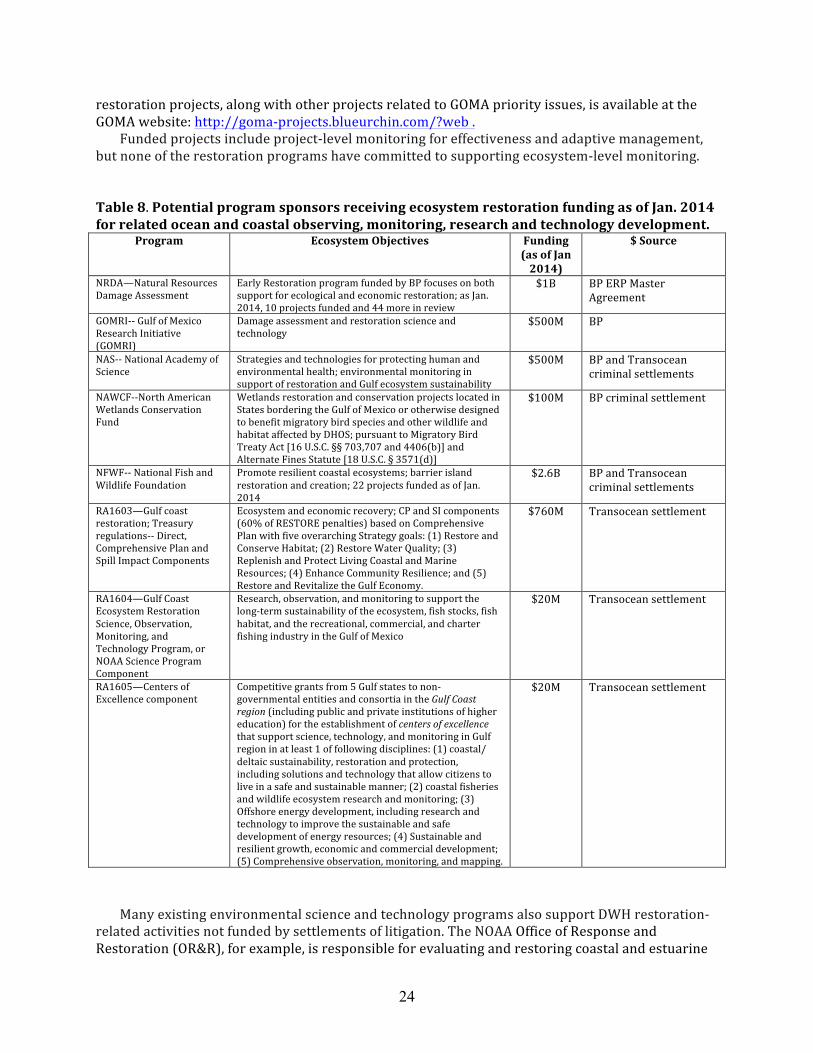
24
restoration projects, along with other projects related to GOMA priority issues, is available at the GOMA website: http://goma-‐projects.blueurchin.com/?web .
Funded projects include project-‐level monitoring for effectiveness and adaptive management, but none of the restoration programs have committed to supporting ecosystem-‐level monitoring. Table 8. Potential program sponsors receiving ecosystem restoration funding as of Jan. 2014 for related ocean and coastal observing, monitoring, research and technology development.
Program Ecosystem Objectives Funding (as of Jan 2014)
$ Source
NRDA—Natural Resources Damage Assessment
Early Restoration program funded by BP focuses on both support for ecological and economic restoration; as Jan. 2014, 10 projects funded and 44 more in review
$1B BP ERP Master Agreement
GOMRI-‐-‐ Gulf of Mexico Research Initiative (GOMRI)
Damage assessment and restoration science and technology
$500M BP
NAS-‐-‐ National Academy of Science
Strategies and technologies for protecting human and environmental health; environmental monitoring in support of restoration and Gulf ecosystem sustainability
$500M BP and Transocean criminal settlements
NAWCF-‐-‐North American Wetlands Conservation Fund
Wetlands restoration and conservation projects located in States bordering the Gulf of Mexico or otherwise designed to benefit migratory bird species and other wildlife and habitat affected by DHOS; pursuant to Migratory Bird Treaty Act [16 U.S.C. §§ 703,707 and 4406(b)] and Alternate Fines Statute [18 U.S.C. § 3571(d)]
$100M BP criminal settlement
NFWF-‐-‐ National Fish and Wildlife Foundation
Promote resilient coastal ecosystems; barrier island restoration and creation; 22 projects funded as of Jan. 2014
$2.6B BP and Transocean criminal settlements
RA1603—Gulf coast restoration; Treasury regulations-‐-‐ Direct, Comprehensive Plan and Spill Impact Components
Ecosystem and economic recovery; CP and SI components (60% of RESTORE penalties) based on Comprehensive Plan with five overarching Strategy goals: (1) Restore and Conserve Habitat; (2) Restore Water Quality; (3) Replenish and Protect Living Coastal and Marine Resources; (4) Enhance Community Resilience; and (5) Restore and Revitalize the Gulf Economy.
$760M Transocean settlement
RA1604—Gulf Coast Ecosystem Restoration Science, Observation, Monitoring, and Technology Program, or NOAA Science Program Component
Research, observation, and monitoring to support the long-‐term sustainability of the ecosystem, fish stocks, fish habitat, and the recreational, commercial, and charter fishing industry in the Gulf of Mexico
$20M Transocean settlement
RA1605—Centers of Excellence component
Competitive grants from 5 Gulf states to non-‐governmental entities and consortia in the Gulf Coast region (including public and private institutions of higher education) for the establishment of centers of excellence that support science, technology, and monitoring in Gulf region in at least 1 of following disciplines: (1) coastal/ deltaic sustainability, restoration and protection, including solutions and technology that allow citizens to live in a safe and sustainable manner; (2) coastal fisheries and wildlife ecosystem research and monitoring; (3) Offshore energy development, including research and technology to improve the sustainable and safe development of energy resources; (4) Sustainable and resilient growth, economic and commercial development; (5) Comprehensive observation, monitoring, and mapping.
$20M Transocean settlement
Many existing environmental science and technology programs also support DWH restoration-‐related activities not funded by settlements of litigation. The NOAA Office of Response and Restoration (OR&R), for example, is responsible for evaluating and restoring coastal and estuarine
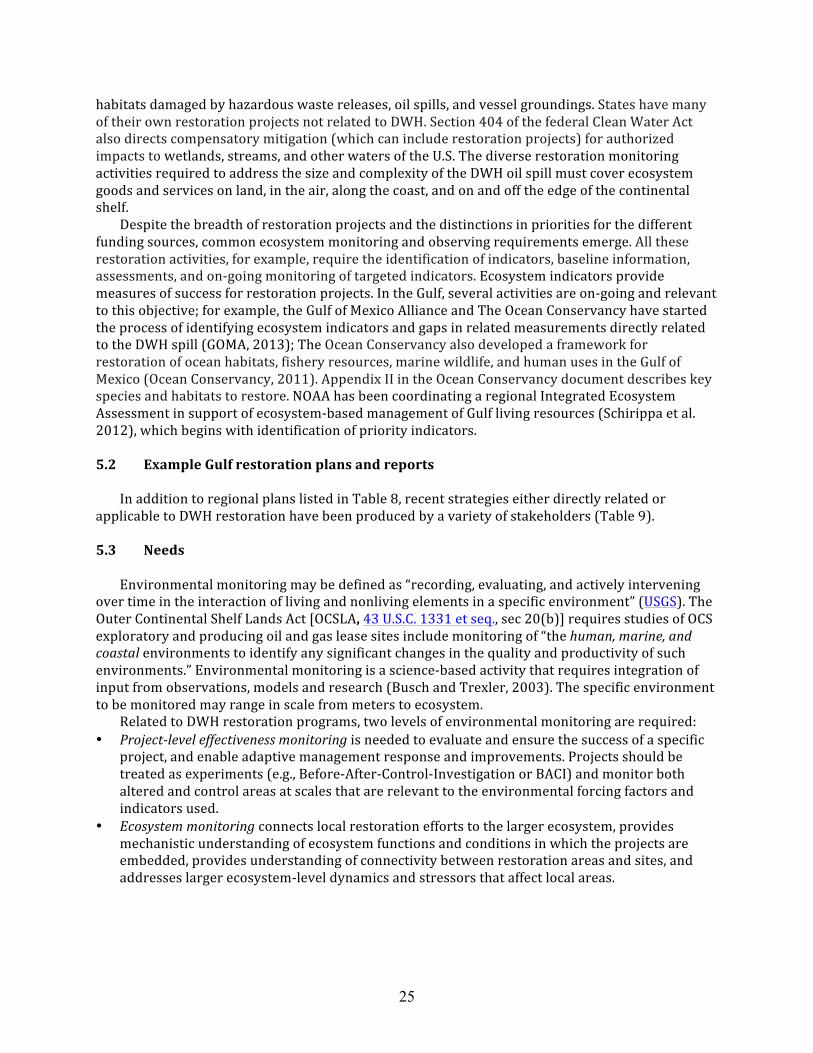
25
habitats damaged by hazardous waste releases, oil spills, and vessel groundings. States have many of their own restoration projects not related to DWH. Section 404 of the federal Clean Water Act also directs compensatory mitigation (which can include restoration projects) for authorized impacts to wetlands, streams, and other waters of the U.S. The diverse restoration monitoring activities required to address the size and complexity of the DWH oil spill must cover ecosystem goods and services on land, in the air, along the coast, and on and off the edge of the continental shelf.
Despite the breadth of restoration projects and the distinctions in priorities for the different funding sources, common ecosystem monitoring and observing requirements emerge. All these restoration activities, for example, require the identification of indicators, baseline information, assessments, and on-‐going monitoring of targeted indicators. Ecosystem indicators provide measures of success for restoration projects. In the Gulf, several activities are on-‐going and relevant to this objective; for example, the Gulf of Mexico Alliance and The Ocean Conservancy have started the process of identifying ecosystem indicators and gaps in related measurements directly related to the DWH spill (GOMA, 2013); The Ocean Conservancy also developed a framework for restoration of ocean habitats, fishery resources, marine wildlife, and human uses in the Gulf of Mexico (Ocean Conservancy, 2011). Appendix II in the Ocean Conservancy document describes key species and habitats to restore. NOAA has been coordinating a regional Integrated Ecosystem Assessment in support of ecosystem-‐based management of Gulf living resources (Schirippa et al. 2012), which begins with identification of priority indicators. 5.2 Example Gulf restoration plans and reports
In addition to regional plans listed in Table 8, recent strategies either directly related or applicable to DWH restoration have been produced by a variety of stakeholders (Table 9). 5.3 Needs
Environmental monitoring may be defined as “recording, evaluating, and actively intervening over time in the interaction of living and nonliving elements in a specific environment” (USGS). The Outer Continental Shelf Lands Act [OCSLA, 43 U.S.C. 1331 et seq., sec 20(b)] requires studies of OCS exploratory and producing oil and gas lease sites include monitoring of “the human, marine, and coastal environments to identify any significant changes in the quality and productivity of such environments.” Environmental monitoring is a science-‐based activity that requires integration of input from observations, models and research (Busch and Trexler, 2003). The specific environment to be monitored may range in scale from meters to ecosystem.
Related to DWH restoration programs, two levels of environmental monitoring are required: • Project-‐level effectiveness monitoring is needed to evaluate and ensure the success of a specific
project, and enable adaptive management response and improvements. Projects should be treated as experiments (e.g., Before-‐After-‐Control-‐Investigation or BACI) and monitor both altered and control areas at scales that are relevant to the environmental forcing factors and indicators used.
• Ecosystem monitoring connects local restoration efforts to the larger ecosystem, provides mechanistic understanding of ecosystem functions and conditions in which the projects are embedded, provides understanding of connectivity between restoration areas and sites, and addresses larger ecosystem-‐level dynamics and stressors that affect local areas.
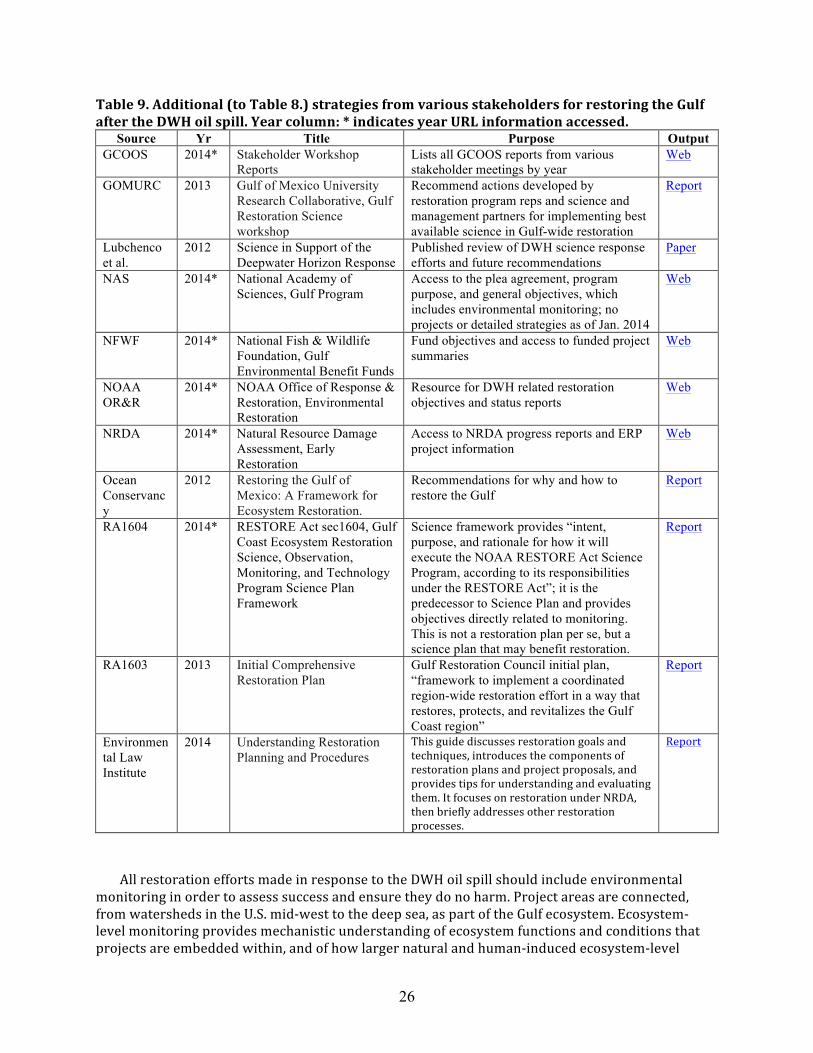
26
Table 9. Additional (to Table 8.) strategies from various stakeholders for restoring the Gulf after the DWH oil spill. Year column: * indicates year URL information accessed.
Source Yr Title Purpose Output GCOOS 2014* Stakeholder Workshop
Reports Lists all GCOOS reports from various stakeholder meetings by year
Web
GOMURC 2013 Gulf of Mexico University Research Collaborative, Gulf Restoration Science workshop
Recommend actions developed by restoration program reps and science and management partners for implementing best available science in Gulf-wide restoration
Report
Lubchenco et al.
2012 Science in Support of the Deepwater Horizon Response
Published review of DWH science response efforts and future recommendations
Paper
NAS 2014* National Academy of Sciences, Gulf Program
Access to the plea agreement, program purpose, and general objectives, which includes environmental monitoring; no projects or detailed strategies as of Jan. 2014
Web
NFWF 2014* National Fish & Wildlife Foundation, Gulf Environmental Benefit Funds
Fund objectives and access to funded project summaries
Web
NOAA OR&R
2014* NOAA Office of Response & Restoration, Environmental Restoration
Resource for DWH related restoration objectives and status reports
Web
NRDA 2014* Natural Resource Damage Assessment, Early Restoration
Access to NRDA progress reports and ERP project information
Web
Ocean Conservancy
2012 Restoring the Gulf of Mexico: A Framework for Ecosystem Restoration.
Recommendations for why and how to restore the Gulf
Report
RA1604 2014* RESTORE Act sec1604, Gulf Coast Ecosystem Restoration Science, Observation, Monitoring, and Technology Program Science Plan Framework
Science framework provides “intent, purpose, and rationale for how it will execute the NOAA RESTORE Act Science Program, according to its responsibilities under the RESTORE Act”; it is the predecessor to Science Plan and provides objectives directly related to monitoring. This is not a restoration plan per se, but a science plan that may benefit restoration.
Report
RA1603 2013 Initial Comprehensive Restoration Plan
Gulf Restoration Council initial plan, “framework to implement a coordinated region-wide restoration effort in a way that restores, protects, and revitalizes the Gulf Coast region”
Report
Environmental Law Institute
2014 Understanding Restoration Planning and Procedures
This guide discusses restoration goals and techniques, introduces the components of restoration plans and project proposals, and provides tips for understanding and evaluating them. It focuses on restoration under NRDA, then briefly addresses other restoration processes.
Report
All restoration efforts made in response to the DWH oil spill should include environmental monitoring in order to assess success and ensure they do no harm. Project areas are connected, from watersheds in the U.S. mid-‐west to the deep sea, as part of the Gulf ecosystem. Ecosystem-‐level monitoring provides mechanistic understanding of ecosystem functions and conditions that projects are embedded within, and of how larger natural and human-‐induced ecosystem-‐level
27
dynamics and stressors (e.g., spills, coastal development, climate, hurricanes) interact to control local ecology, recovery, sustainability, and resilience. Individual projects may impact each other (e.g., river diversions may have widespread impacts on localized restoration efforts such as oyster reef or wetland rehabilitations). Therefore, program management may require a holistic approach that accommodates conflicting desired end-‐points. By documenting ecosystem recovery from the spill, ecosystem monitoring adds the benefit of promoting long-‐term sustainability of ocean and coastal natural capital. While all programs funded to do restoration should require project practitioners to design and carry out science-‐based effectiveness monitoring, the details of how to implement ecosystem-‐level monitoring are unclear.
The National Ocean Policy Implementation Plan (NOC, 2013) specifically requires strengthening national capabilities for acquiring and managing ocean data, including “advance and sustain ocean, coastal, and Great Lakes observing system infrastructure to support a variety of users.” Priority applications include: to support science required for ecosystem sustainability and resiliency in face of chronic global, and Gulf-‐scale, stressors such as climate change and exploitation of natural capital; to protect life, human health and property; and to promote jobs and economic opportunities through managed human uses. A regional coastal and ocean observing system that provides physical, chemical, biological, geological, and marine atmospheric information to support this ecosystem-‐approach to management will also support ecosystem restoration needs. In essence, we cannot fix what we do not know is broken, we cannot restore without adequate baseline information, we cannot predict the consequence of either natural or human-‐induced perturbations if we do not know how a complex system like the Gulf of Mexico works, and we cannot judge success or failure of our efforts without monitoring changes/trends.
Data gaps and observing and monitoring needs in these mandates, plans, reports, and from restoration experts are also reflected in the Recommendations of Section 7. 6 Priority Observing Needs Across Topics
Priority observing needs by topic discussed above are summarized in Table 10. Commonalities are prioritized in the recommendations in Section 7.
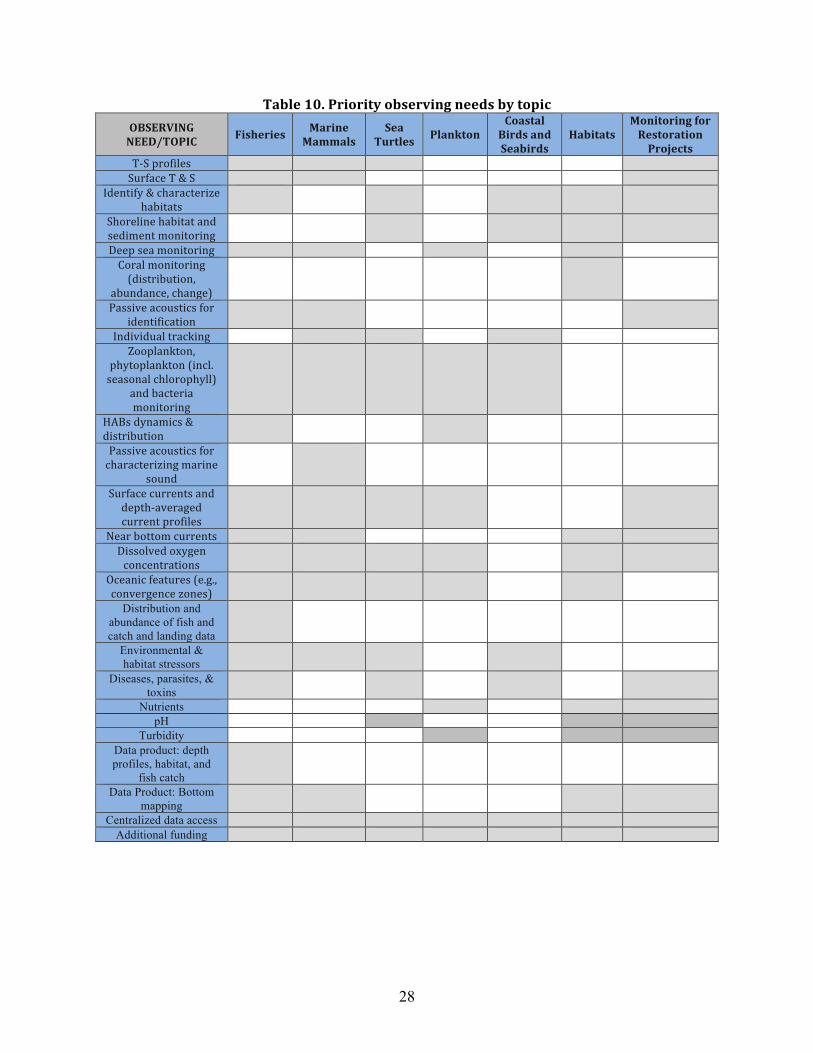
28
Table 10. Priority observing needs by topic OBSERVING NEED/TOPIC Fisheries Marine
Mammals Sea
Turtles Plankton Coastal Birds and Seabirds
Habitats Monitoring for Restoration Projects
T-‐S profiles Surface T & S
Identify & characterize habitats
Shoreline habitat and sediment monitoring
Deep sea monitoring Coral monitoring (distribution,
abundance, change)
Passive acoustics for identification
Individual tracking Zooplankton,
phytoplankton (incl. seasonal chlorophyll)
and bacteria monitoring
HABs dynamics & distribution
Passive acoustics for characterizing marine
sound
Surface currents and depth-‐averaged current profiles
Near bottom currents Dissolved oxygen concentrations
Oceanic features (e.g., convergence zones)
Distribution and abundance of fish and catch and landing data
Environmental & habitat stressors
Diseases, parasites, & toxins
Nutrients pH
Turbidity Data product: depth profiles, habitat, and
fish catch
Data Product: Bottom mapping
Centralized data access Additional funding
29
7 Recommendations Recommendations for Ecosystem Monitoring are organized into two general, but complementary, categories: 1. An initial set of enhancements to the system elements identified in this plan, based on subject
matter expert input and recommendations from existing Gulf plans related to ecosystem monitoring;
2. The continued development of a collaborative Gulf forum to further the development of a comprehensive regional ecosystem observing and monitoring system for the Gulf ecosystem. This forum will further identify common ecosystem monitoring priorities and synergistic opportunities, building on existing programs and capabilities. The forum may also have an additional focus on special, high priority topics that may not be cross-‐cutting across all stakeholder groups, but may have high economic impact for the Gulf. GCOOS will work closely with GOMA, GoMURC, NOAA, The Ocean Conservancy, state resource managers, NRDA and Trustees, NAS Gulf Program, NFWF Gulf Environmental Benefit Fund and Trustees, among others in this collaborative forum.
Additional details on both of these complementary categories of recommendations are included below. 7.1 Initial Enhancements to Existing System Elements
Table 11 summarizes suggested initial enhancements to the existing system elements for ecosystem monitoring. The details on these enhancements for each ecosystem-‐monitoring topic (Living Marine Resources (fisheries, marine mammals, sea turtles, plankton, sea birds and coastal birds), Habitats, and Monitoring for Restoration Projects) are included in Appendix F. The cost estimates for these enhancements are also included in Appendix F. 7.2 Collaborative Forum
This collaborative, broad-‐based stakeholder forum will complement the initial enhancements to the system for ecosystem monitoring. The forum will further the development of a Gulf ecosystem monitoring and observing system will include the following components: • Workshops • Email lists and a collaborative website, such as a Drupal content management system website • Pilot projects as a foundation for expanded observing and monitoring • Expansion of the regional observing and monitoring system in the Gulf
Four ecosystem-‐monitoring workshops will be held in the first 12-‐18 months; one will be held annually thereafter. The purpose of these workshops will be to continue chart the plans for expanded ecosystem monitoring, as required by the broad Gulf and Gulf-‐focused community. The workshops will be focused so as to continue to obtain specific information regarding needs and priorities of users with direct participation of existing or potential data and information providers.
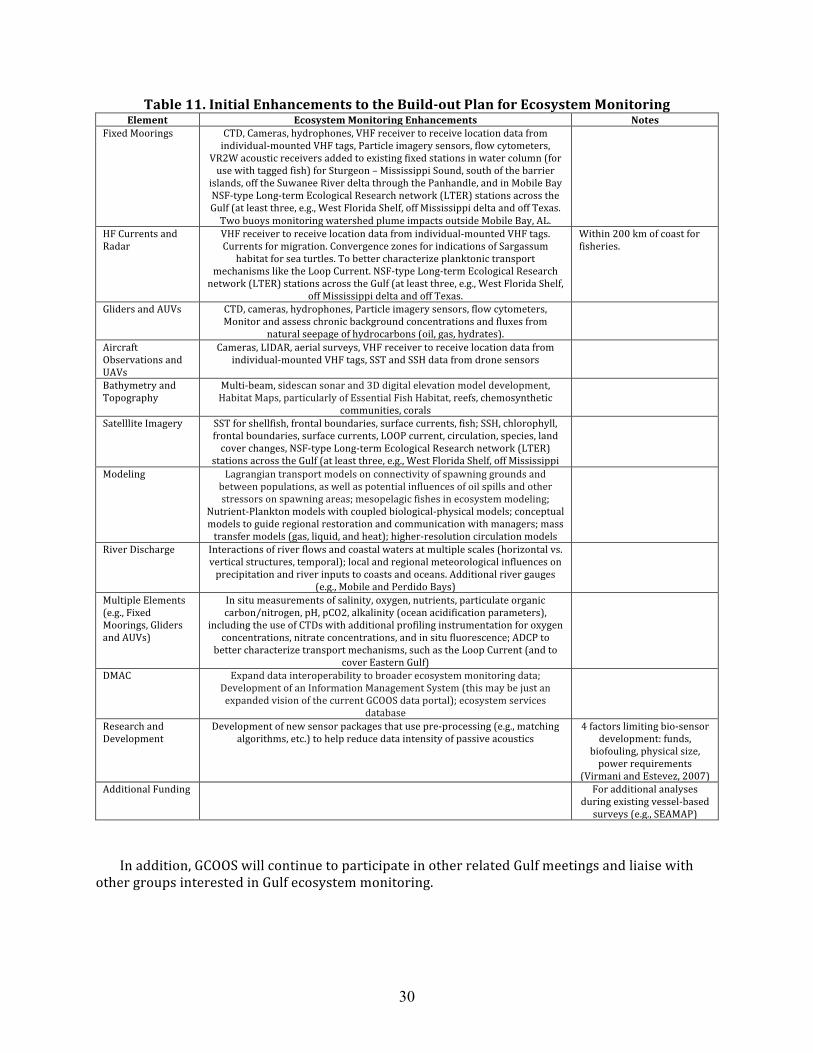
30
Table 11. Initial Enhancements to the Build-‐out Plan for Ecosystem Monitoring Element Ecosystem Monitoring Enhancements Notes
Fixed Moorings CTD, Cameras, hydrophones, VHF receiver to receive location data from individual-‐mounted VHF tags, Particle imagery sensors, flow cytometers,
VR2W acoustic receivers added to existing fixed stations in water column (for use with tagged fish) for Sturgeon – Mississippi Sound, south of the barrier
islands, off the Suwanee River delta through the Panhandle, and in Mobile Bay NSF-‐type Long-‐term Ecological Research network (LTER) stations across the Gulf (at least three, e.g., West Florida Shelf, off Mississippi delta and off Texas. Two buoys monitoring watershed plume impacts outside Mobile Bay, AL.
HF Currents and Radar
VHF receiver to receive location data from individual-‐mounted VHF tags. Currents for migration. Convergence zones for indications of Sargassum habitat for sea turtles. To better characterize planktonic transport
mechanisms like the Loop Current. NSF-‐type Long-‐term Ecological Research network (LTER) stations across the Gulf (at least three, e.g., West Florida Shelf,
off Mississippi delta and off Texas.
Within 200 km of coast for fisheries.
Gliders and AUVs CTD, cameras, hydrophones, Particle imagery sensors, flow cytometers, Monitor and assess chronic background concentrations and fluxes from
natural seepage of hydrocarbons (oil, gas, hydrates).
Aircraft Observations and UAVs
Cameras, LIDAR, aerial surveys, VHF receiver to receive location data from individual-‐mounted VHF tags, SST and SSH data from drone sensors
Bathymetry and Topography
Multi-‐beam, sidescan sonar and 3D digital elevation model development, Habitat Maps, particularly of Essential Fish Habitat, reefs, chemosynthetic
communities, corals
Satelllite Imagery SST for shellfish, frontal boundaries, surface currents, fish; SSH, chlorophyll, frontal boundaries, surface currents, LOOP current, circulation, species, land cover changes, NSF-‐type Long-‐term Ecological Research network (LTER)
stations across the Gulf (at least three, e.g., West Florida Shelf, off Mississippi
Modeling Lagrangian transport models on connectivity of spawning grounds and between populations, as well as potential influences of oil spills and other stressors on spawning areas; mesopelagic fishes in ecosystem modeling;
Nutrient-‐Plankton models with coupled biological-‐physical models; conceptual models to guide regional restoration and communication with managers; mass transfer models (gas, liquid, and heat); higher-‐resolution circulation models
River Discharge Interactions of river flows and coastal waters at multiple scales (horizontal vs. vertical structures, temporal); local and regional meteorological influences on precipitation and river inputs to coasts and oceans. Additional river gauges
(e.g., Mobile and Perdido Bays)
Multiple Elements (e.g., Fixed Moorings, Gliders and AUVs)
In situ measurements of salinity, oxygen, nutrients, particulate organic carbon/nitrogen, pH, pCO2, alkalinity (ocean acidification parameters),
including the use of CTDs with additional profiling instrumentation for oxygen concentrations, nitrate concentrations, and in situ fluorescence; ADCP to
better characterize transport mechanisms, such as the Loop Current (and to cover Eastern Gulf)
DMAC Expand data interoperability to broader ecosystem monitoring data; Development of an Information Management System (this may be just an expanded vision of the current GCOOS data portal); ecosystem services
database
Research and Development
Development of new sensor packages that use pre-‐processing (e.g., matching algorithms, etc.) to help reduce data intensity of passive acoustics
4 factors limiting bio-‐sensor development: funds,
biofouling, physical size, power requirements
(Virmani and Estevez, 2007) Additional Funding For additional analyses
during existing vessel-‐based surveys (e.g., SEAMAP)
In addition, GCOOS will continue to participate in other related Gulf meetings and liaise with other groups interested in Gulf ecosystem monitoring.
31
To complement the workshops, email lists and a Drupal or similar collaborative website will be developed (in year one) and maintained (after year one) for the ecosystem monitoring section of the plan and associated implementation activities to ensure additional progress.
The workshops, email lists, and Drupal site will be used to design and improve pilot projects that will inform further development of the Gulf-‐wide system for ecosystem monitoring. Ideas for pilot projects are included in the specific topical sections to follow. Approximately one pilot project will be implemented per year.
Based on results of this plan, the workshops, email lists, collaborative website, and pilot projects, and as opportunities allow, new assets will be added to the Gulf-‐wide system for ecosystem monitoring.
In priority order, implementation of ecosystem observing and monitoring in the Gulf will include the following steps involving broad stakeholder groups through the collaborative forum: • Identify ecosystem indicators that can be used to measure the health of, and stress on, the
ecosystem. (The Gulf of Mexico Alliance, The Harte Research Institute, and The Ocean Conservancy have initiated this process. NOAA, 2013 also describes a set of ecosystem indicators to capture the current status and trends of the physical, biological, and socio-‐economic elements of the Gulf of Mexico ecosystem.)
• Identify legacy ecosystem data sets from the Gulf of Mexico and acquire and serve via the data interoperability-‐oriented Data Management and Communications (DMAC) element of the regional plan. This legacy data inventory has already begun as part of the GCOOS data management effort to identify and serve legacy ecosystem data sets.
• Identify and help support, or advocate for, extant sustained ecosystem monitoring subsystems in the Gulf of Mexico and serve their data in an integrated way via the DMAC element. (GCOOS is currently serving data from 19 local data nodes, in addition to data nodes from oil and gas industry data, NOS, and NDBC. The Ocean Conservancy and the Gulf of Mexico Alliance are also inventorying existing long-‐term monitoring efforts in the Gulf.) Additionally, add sensors and instrumentation to existing system elements.
• Provide a sound basis for initiating new observing and monitoring. Based on the inventories, stakeholder needs, ecosystem modeling and ecosystem monitoring workshops (GCOOS holds ecosystem modeling workshops), observing system simulation experiments, restoration projects’ monitoring needs, continued liaison with users and producers, and gap analyses, provide a sound basis for initiating new monitoring. Additional system elements have begun to be identified through this plan.
• Initiate pilot projects allowing for potential design changes before proceeding to pre-‐operational sub-‐systems (and following from the pilot project guidelines in the GCOOS Business Model). Currently, reliable, cost-‐effective instrumentation and/or methods for many new sustained measurements do not yet exist. For example, a commercially available, in production sensor for measuring Dissolved Inorganic Carbon in the marine environment does not exist. Considerable technology research and development will be needed for a complete ecosystem monitoring network. A 2007 workshop on biosensing for ocean observations identified barriers to integrating biological sensors in an observing system, such as the need for frequent maintenance due to biofouling, lack of robustness, limited longevity of wet chemistry reagents, large power requirements, low data frequency, the need for automatic identification, and the need for internal checks on effectiveness (Virmani, J.I. and Estevez, E.D., 2008). (A further assessment of these biosensing technologies was also conducted during the same workshop.) Recent consolidation in the marine technology industry is making it challenging to get industries interested in sensor designs that will have a limited market in marine ecosystem monitoring. Additional incentives may need to be identified. Research and Development needs for a Gulf observing and monitoring system are discussed in Section 8 of the build-‐out plan.
32
• Initiate pre-‐operational observational and monitoring subsystems. • Re-‐evaluate new subsystems to ensure stakeholder needs are being met. • Maintain and expand the ecosystem observing and monitoring network in the Gulf of Mexico.
Comprehensive ecosystem monitoring could include a wide variety of potential biotic and abiotic parameters3, such as: physical aspects of water quality; biogeochemical aspects of water quality; light and optical conditions; imaging flow cytometry, optical phytoplankton detection, genetic marker identification of phytoplankton; censuses of birds, fish, marine mammals, and sea turtles; habitat conditions; human population trends along coastlines; pollutants; tracking of selected animals; river discharge and nutrient loads; and meteorological parameters. These ecosystem parameters include some variables for which the ongoing observations will be gathered and served, others for which specific new products will be developed, and parameters for which new measurements will need to be obtained, all building upon existing programs and capacities in the Gulf of Mexico, and using partnership approaches.
To assist the future collaboration in implementing ecosystem monitoring in the Gulf, this document includes include example recommendations for observing and monitoring that are summarized from the plans and reports in Table 1 and/or contributed by subject matter experts. These recommendations are organized by topic: Living Marine Resources (fisheries, marine mammals, sea turtles, plankton, seabirds and coastal birds); Habitats; and Monitoring for Restoration Projects. Recommendations for restoration project monitoring include efforts to enhance funding, collaborations, targeted research and observations, and synthesis and decision support tools. Recommendations for system enhancements and for new system elements are included for all topics.
Complementary ideas are proposed in the platform-‐specific sections of the build-‐out plan. For example, Section 3.5 on Gliders and AUVs includes the need to add sensors for biological and chemical parameters on the ARGO floats, gliders and AUVs. Further ideas are included in Harmful Algal Blooms Section 3.12, Water Quality Section 3.13, and Hypoxia Section 3.14. 7.2.1 Living Marine Resources
“There is great potential for improving our ability to effectively monitor, manage, and forecast changes of our living marine resources by integrating advanced technologies into existing survey operations, utilizing alternative platforms, and developing new data processing and interpretation methods.” (NOAA, 2009 – p. 72). 7.2.1.1 Fisheries
For improving knowledge, management, and restoration of fish populations and fisheries in the Gulf of Mexico, a regional observing and monitoring system should complement existing efforts to address the needs listed in Section 3.1, Fisheries.
As an initial step, existing systems could be augmented or pilot projects could be developed and implemented, using the coordinated resources of the regional observing and monitoring system. Example recommendations are included in Tables 12, 13 and 14.
3 These follow from the list of 26 core variables presented by IOOS and UNESCO (U.S. IOOS, 2010): Acidity (pH)*, Bathymetry, Bottom character, Colored dissolved organic matter*, Contaminant, Dissolved nutrients, Dissolved oxygen, Fish abundance, Fish species, Heat flux, Ice distribution, Ocean color, Optical properties, Partial pressure of carbon dioxide (pCO2)*, Pathogens, Phytoplankton species, Salinity, Sea level, Stream flow*, Surface currents, Surface waves, Temperature, Total suspended matter*, Wind speed and direction*, Zooplankton abundance, and Zooplankton species
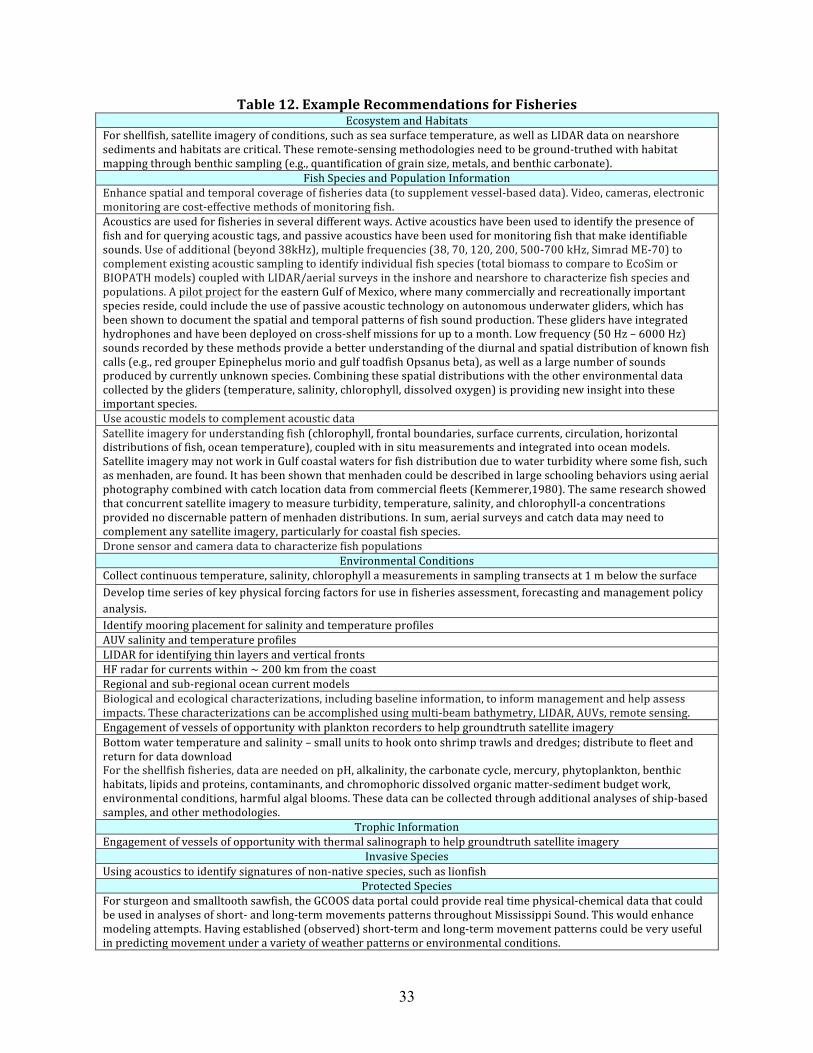
33
Table 12. Example Recommendations for Fisheries Ecosystem and Habitats
For shellfish, satellite imagery of conditions, such as sea surface temperature, as well as LIDAR data on nearshore sediments and habitats are critical. These remote-‐sensing methodologies need to be ground-‐truthed with habitat mapping through benthic sampling (e.g., quantification of grain size, metals, and benthic carbonate).
Fish Species and Population Information Enhance spatial and temporal coverage of fisheries data (to supplement vessel-‐based data). Video, cameras, electronic monitoring are cost-‐effective methods of monitoring fish. Acoustics are used for fisheries in several different ways. Active acoustics have been used to identify the presence of fish and for querying acoustic tags, and passive acoustics have been used for monitoring fish that make identifiable sounds. Use of additional (beyond 38kHz), multiple frequencies (38, 70, 120, 200, 500-‐700 kHz, Simrad ME-‐70) to complement existing acoustic sampling to identify individual fish species (total biomass to compare to EcoSim or BIOPATH models) coupled with LIDAR/aerial surveys in the inshore and nearshore to characterize fish species and populations. A pilot project for the eastern Gulf of Mexico, where many commercially and recreationally important species reside, could include the use of passive acoustic technology on autonomous underwater gliders, which has been shown to document the spatial and temporal patterns of fish sound production. These gliders have integrated hydrophones and have been deployed on cross-‐shelf missions for up to a month. Low frequency (50 Hz – 6000 Hz) sounds recorded by these methods provide a better understanding of the diurnal and spatial distribution of known fish calls (e.g., red grouper Epinephelus morio and gulf toadfish Opsanus beta), as well as a large number of sounds produced by currently unknown species. Combining these spatial distributions with the other environmental data collected by the gliders (temperature, salinity, chlorophyll, dissolved oxygen) is providing new insight into these important species. Use acoustic models to complement acoustic data Satellite imagery for understanding fish (chlorophyll, frontal boundaries, surface currents, circulation, horizontal distributions of fish, ocean temperature), coupled with in situ measurements and integrated into ocean models. Satellite imagery may not work in Gulf coastal waters for fish distribution due to water turbidity where some fish, such as menhaden, are found. It has been shown that menhaden could be described in large schooling behaviors using aerial photography combined with catch location data from commercial fleets (Kemmerer,1980). The same research showed that concurrent satellite imagery to measure turbidity, temperature, salinity, and chlorophyll-‐a concentrations provided no discernable pattern of menhaden distributions. In sum, aerial surveys and catch data may need to complement any satellite imagery, particularly for coastal fish species. Drone sensor and camera data to characterize fish populations
Environmental Conditions Collect continuous temperature, salinity, chlorophyll a measurements in sampling transects at 1 m below the surface Develop time series of key physical forcing factors for use in fisheries assessment, forecasting and management policy analysis. Identify mooring placement for salinity and temperature profiles AUV salinity and temperature profiles LIDAR for identifying thin layers and vertical fronts HF radar for currents within ~ 200 km from the coast Regional and sub-‐regional ocean current models Biological and ecological characterizations, including baseline information, to inform management and help assess impacts. These characterizations can be accomplished using multi-‐beam bathymetry, LIDAR, AUVs, remote sensing. Engagement of vessels of opportunity with plankton recorders to help groundtruth satellite imagery Bottom water temperature and salinity – small units to hook onto shrimp trawls and dredges; distribute to fleet and return for data download For the shellfish fisheries, data are needed on pH, alkalinity, the carbonate cycle, mercury, phytoplankton, benthic habitats, lipids and proteins, contaminants, and chromophoric dissolved organic matter-‐sediment budget work, environmental conditions, harmful algal blooms. These data can be collected through additional analyses of ship-‐based samples, and other methodologies.
Trophic Information Engagement of vessels of opportunity with thermal salinograph to help groundtruth satellite imagery
Invasive Species Using acoustics to identify signatures of non-‐native species, such as lionfish
Protected Species For sturgeon and smalltooth sawfish, the GCOOS data portal could provide real time physical-‐chemical data that could be used in analyses of short-‐ and long-‐term movements patterns throughout Mississippi Sound. This would enhance modeling attempts. Having established (observed) short-‐term and long-‐term movement patterns could be very useful in predicting movement under a variety of weather patterns or environmental conditions.
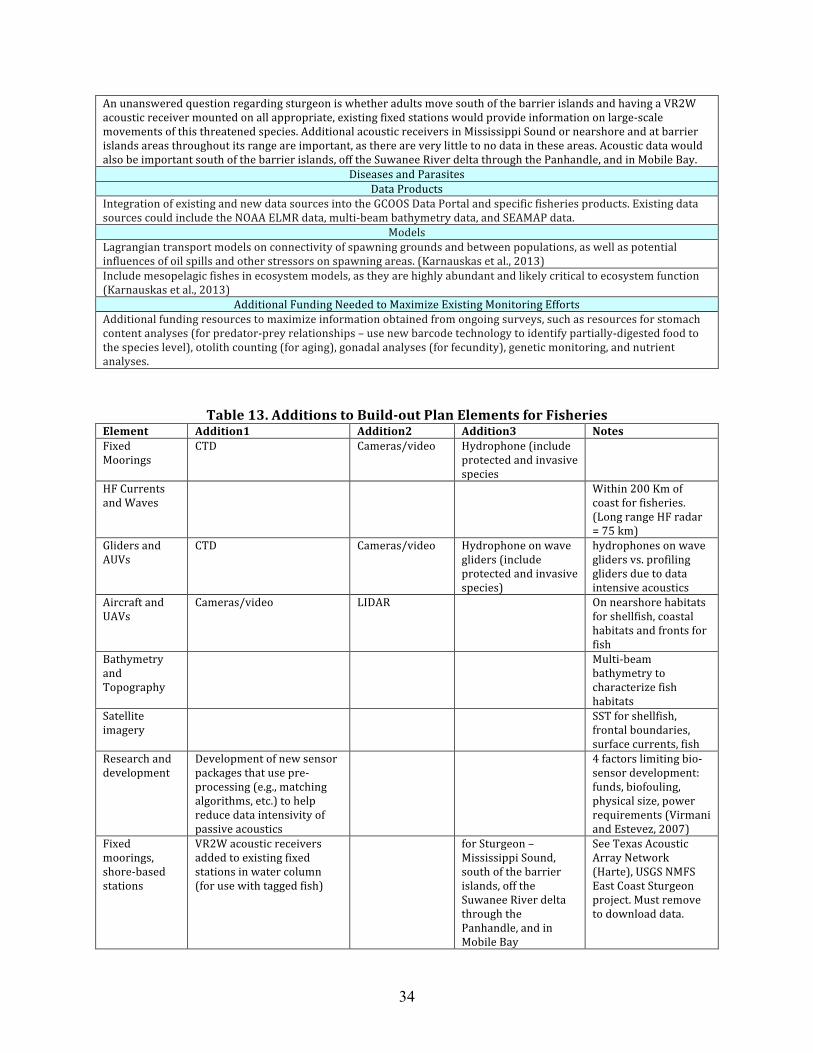
34
An unanswered question regarding sturgeon is whether adults move south of the barrier islands and having a VR2W acoustic receiver mounted on all appropriate, existing fixed stations would provide information on large-‐scale movements of this threatened species. Additional acoustic receivers in Mississippi Sound or nearshore and at barrier islands areas throughout its range are important, as there are very little to no data in these areas. Acoustic data would also be important south of the barrier islands, off the Suwanee River delta through the Panhandle, and in Mobile Bay.
Diseases and Parasites Data Products
Integration of existing and new data sources into the GCOOS Data Portal and specific fisheries products. Existing data sources could include the NOAA ELMR data, multi-‐beam bathymetry data, and SEAMAP data.
Models Lagrangian transport models on connectivity of spawning grounds and between populations, as well as potential influences of oil spills and other stressors on spawning areas. (Karnauskas et al., 2013) Include mesopelagic fishes in ecosystem models, as they are highly abundant and likely critical to ecosystem function (Karnauskas et al., 2013)
Additional Funding Needed to Maximize Existing Monitoring Efforts Additional funding resources to maximize information obtained from ongoing surveys, such as resources for stomach content analyses (for predator-‐prey relationships – use new barcode technology to identify partially-‐digested food to the species level), otolith counting (for aging), gonadal analyses (for fecundity), genetic monitoring, and nutrient analyses.
Table 13. Additions to Build-‐out Plan Elements for Fisheries Element Addition1 Addition2 Addition3 Notes Fixed Moorings
CTD Cameras/video Hydrophone (include protected and invasive species
HF Currents and Waves
Within 200 Km of coast for fisheries. (Long range HF radar = 75 km)
Gliders and AUVs
CTD Cameras/video Hydrophone on wave gliders (include protected and invasive species)
hydrophones on wave gliders vs. profiling gliders due to data intensive acoustics
Aircraft and UAVs
Cameras/video LIDAR On nearshore habitats for shellfish, coastal habitats and fronts for fish
Bathymetry and Topography
Multi-‐beam bathymetry to characterize fish habitats
Satellite imagery
SST for shellfish, frontal boundaries, surface currents, fish
Research and development
Development of new sensor packages that use pre-‐processing (e.g., matching algorithms, etc.) to help reduce data intensivity of passive acoustics
4 factors limiting bio-‐sensor development: funds, biofouling, physical size, power requirements (Virmani and Estevez, 2007)
Fixed moorings, shore-‐based stations
VR2W acoustic receivers added to existing fixed stations in water column (for use with tagged fish)
for Sturgeon – Mississippi Sound, south of the barrier islands, off the Suwanee River delta through the Panhandle, and in Mobile Bay
See Texas Acoustic Array Network (Harte), USGS NMFS East Coast Sturgeon project. Must remove to download data.
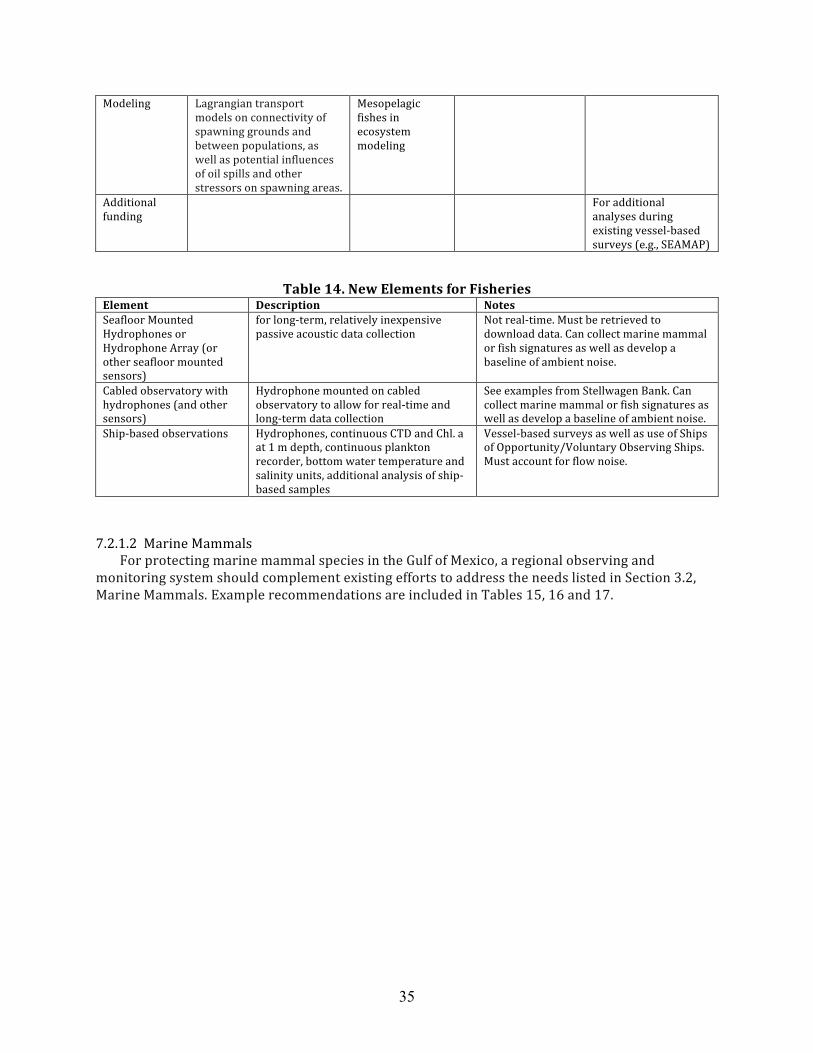
35
Modeling Lagrangian transport models on connectivity of spawning grounds and between populations, as well as potential influences of oil spills and other stressors on spawning areas.
Mesopelagic fishes in ecosystem modeling
Additional funding
For additional analyses during existing vessel-‐based surveys (e.g., SEAMAP)
Table 14. New Elements for Fisheries Element Description Notes Seafloor Mounted Hydrophones or Hydrophone Array (or other seafloor mounted sensors)
for long-‐term, relatively inexpensive passive acoustic data collection
Not real-‐time. Must be retrieved to download data. Can collect marine mammal or fish signatures as well as develop a baseline of ambient noise.
Cabled observatory with hydrophones (and other sensors)
Hydrophone mounted on cabled observatory to allow for real-‐time and long-‐term data collection
See examples from Stellwagen Bank. Can collect marine mammal or fish signatures as well as develop a baseline of ambient noise.
Ship-‐based observations Hydrophones, continuous CTD and Chl. a at 1 m depth, continuous plankton recorder, bottom water temperature and salinity units, additional analysis of ship-‐based samples
Vessel-‐based surveys as well as use of Ships of Opportunity/Voluntary Observing Ships. Must account for flow noise.
7.2.1.2 Marine Mammals
For protecting marine mammal species in the Gulf of Mexico, a regional observing and monitoring system should complement existing efforts to address the needs listed in Section 3.2, Marine Mammals. Example recommendations are included in Tables 15, 16 and 17.
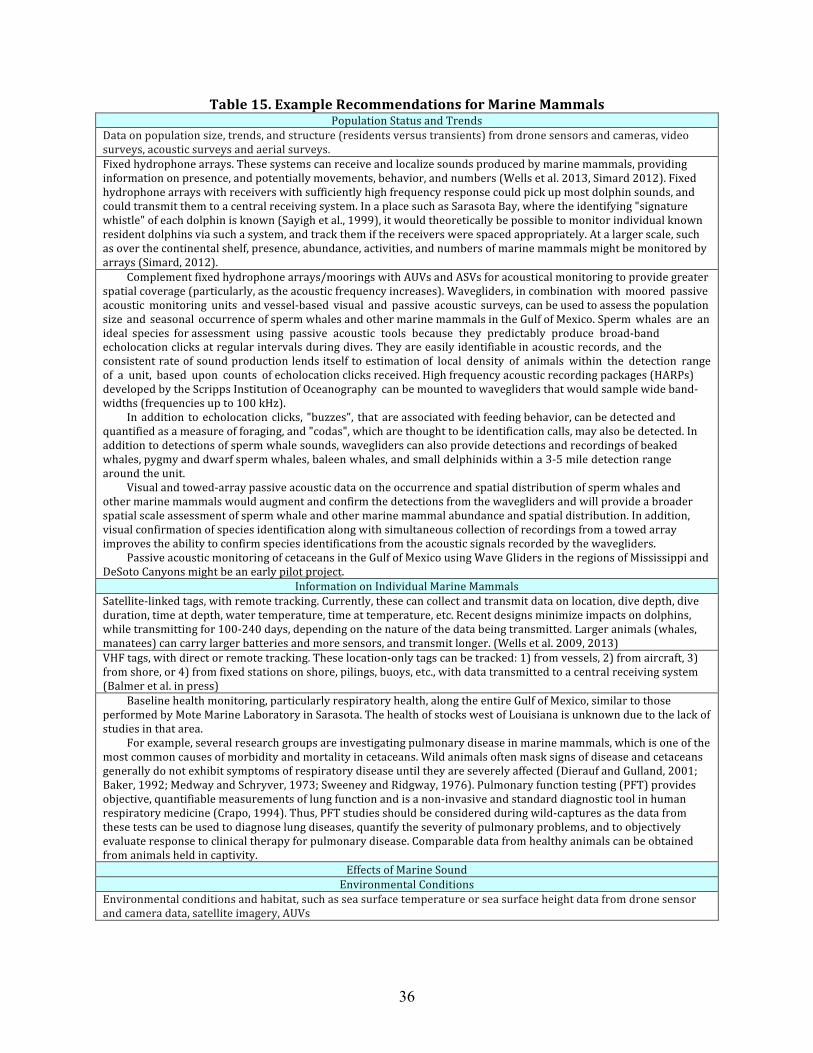
36
Table 15. Example Recommendations for Marine Mammals Population Status and Trends
Data on population size, trends, and structure (residents versus transients) from drone sensors and cameras, video surveys, acoustic surveys and aerial surveys. Fixed hydrophone arrays. These systems can receive and localize sounds produced by marine mammals, providing information on presence, and potentially movements, behavior, and numbers (Wells et al. 2013, Simard 2012). Fixed hydrophone arrays with receivers with sufficiently high frequency response could pick up most dolphin sounds, and could transmit them to a central receiving system. In a place such as Sarasota Bay, where the identifying "signature whistle" of each dolphin is known (Sayigh et al., 1999), it would theoretically be possible to monitor individual known resident dolphins via such a system, and track them if the receivers were spaced appropriately. At a larger scale, such as over the continental shelf, presence, abundance, activities, and numbers of marine mammals might be monitored by arrays (Simard, 2012).
Complement fixed hydrophone arrays/moorings with AUVs and ASVs for acoustical monitoring to provide greater spatial coverage (particularly, as the acoustic frequency increases). Wavegliders, in combination with moored passive acoustic monitoring units and vessel-‐based visual and passive acoustic surveys, can be used to assess the population size and seasonal occurrence of sperm whales and other marine mammals in the Gulf of Mexico. Sperm whales are an ideal species for assessment using passive acoustic tools because they predictably produce broad-‐band echolocation clicks at regular intervals during dives. They are easily identifiable in acoustic records, and the consistent rate of sound production lends itself to estimation of local density of animals within the detection range of a unit, based upon counts of echolocation clicks received. High frequency acoustic recording packages (HARPs) developed by the Scripps Institution of Oceanography can be mounted to wavegliders that would sample wide band-‐widths (frequencies up to 100 kHz).
In addition to echolocation clicks, "buzzes", that are associated with feeding behavior, can be detected and quantified as a measure of foraging, and "codas", which are thought to be identification calls, may also be detected. In addition to detections of sperm whale sounds, wavegliders can also provide detections and recordings of beaked whales, pygmy and dwarf sperm whales, baleen whales, and small delphinids within a 3-‐5 mile detection range around the unit.
Visual and towed-‐array passive acoustic data on the occurrence and spatial distribution of sperm whales and other marine mammals would augment and confirm the detections from the wavegliders and will provide a broader spatial scale assessment of sperm whale and other marine mammal abundance and spatial distribution. In addition, visual confirmation of species identification along with simultaneous collection of recordings from a towed array improves the ability to confirm species identifications from the acoustic signals recorded by the wavegliders.
Passive acoustic monitoring of cetaceans in the Gulf of Mexico using Wave Gliders in the regions of Mississippi and DeSoto Canyons might be an early pilot project.
Information on Individual Marine Mammals Satellite-‐linked tags, with remote tracking. Currently, these can collect and transmit data on location, dive depth, dive duration, time at depth, water temperature, time at temperature, etc. Recent designs minimize impacts on dolphins, while transmitting for 100-‐240 days, depending on the nature of the data being transmitted. Larger animals (whales, manatees) can carry larger batteries and more sensors, and transmit longer. (Wells et al. 2009, 2013) VHF tags, with direct or remote tracking. These location-‐only tags can be tracked: 1) from vessels, 2) from aircraft, 3) from shore, or 4) from fixed stations on shore, pilings, buoys, etc., with data transmitted to a central receiving system (Balmer et al. in press)
Baseline health monitoring, particularly respiratory health, along the entire Gulf of Mexico, similar to those performed by Mote Marine Laboratory in Sarasota. The health of stocks west of Louisiana is unknown due to the lack of studies in that area.
For example, several research groups are investigating pulmonary disease in marine mammals, which is one of the most common causes of morbidity and mortality in cetaceans. Wild animals often mask signs of disease and cetaceans generally do not exhibit symptoms of respiratory disease until they are severely affected (Dierauf and Gulland, 2001; Baker, 1992; Medway and Schryver, 1973; Sweeney and Ridgway, 1976). Pulmonary function testing (PFT) provides objective, quantifiable measurements of lung function and is a non-‐invasive and standard diagnostic tool in human respiratory medicine (Crapo, 1994). Thus, PFT studies should be considered during wild-‐captures as the data from these tests can be used to diagnose lung diseases, quantify the severity of pulmonary problems, and to objectively evaluate response to clinical therapy for pulmonary disease. Comparable data from healthy animals can be obtained from animals held in captivity.
Effects of Marine Sound Environmental Conditions
Environmental conditions and habitat, such as sea surface temperature or sea surface height data from drone sensor and camera data, satellite imagery, AUVs
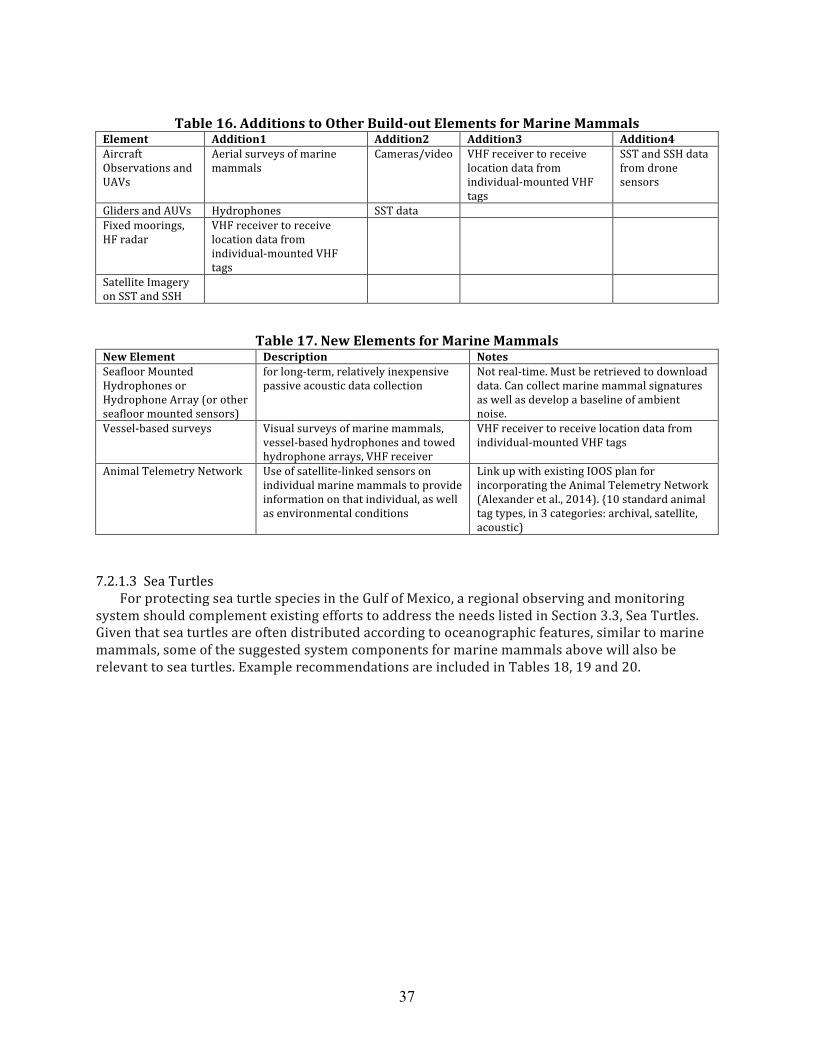
37
Table 16. Additions to Other Build-‐out Elements for Marine Mammals
Element Addition1 Addition2 Addition3 Addition4 Aircraft Observations and UAVs
Aerial surveys of marine mammals
Cameras/video VHF receiver to receive location data from individual-‐mounted VHF tags
SST and SSH data from drone sensors
Gliders and AUVs Hydrophones SST data Fixed moorings, HF radar
VHF receiver to receive location data from individual-‐mounted VHF tags
Satellite Imagery on SST and SSH
Table 17. New Elements for Marine Mammals New Element Description Notes Seafloor Mounted Hydrophones or Hydrophone Array (or other seafloor mounted sensors)
for long-‐term, relatively inexpensive passive acoustic data collection
Not real-‐time. Must be retrieved to download data. Can collect marine mammal signatures as well as develop a baseline of ambient noise.
Vessel-‐based surveys Visual surveys of marine mammals, vessel-‐based hydrophones and towed hydrophone arrays, VHF receiver
VHF receiver to receive location data from individual-‐mounted VHF tags
Animal Telemetry Network Use of satellite-‐linked sensors on individual marine mammals to provide information on that individual, as well as environmental conditions
Link up with existing IOOS plan for incorporating the Animal Telemetry Network (Alexander et al., 2014). {10 standard animal tag types, in 3 categories: archival, satellite, acoustic)
7.2.1.3 Sea Turtles
For protecting sea turtle species in the Gulf of Mexico, a regional observing and monitoring system should complement existing efforts to address the needs listed in Section 3.3, Sea Turtles. Given that sea turtles are often distributed according to oceanographic features, similar to marine mammals, some of the suggested system components for marine mammals above will also be relevant to sea turtles. Example recommendations are included in Tables 18, 19 and 20.
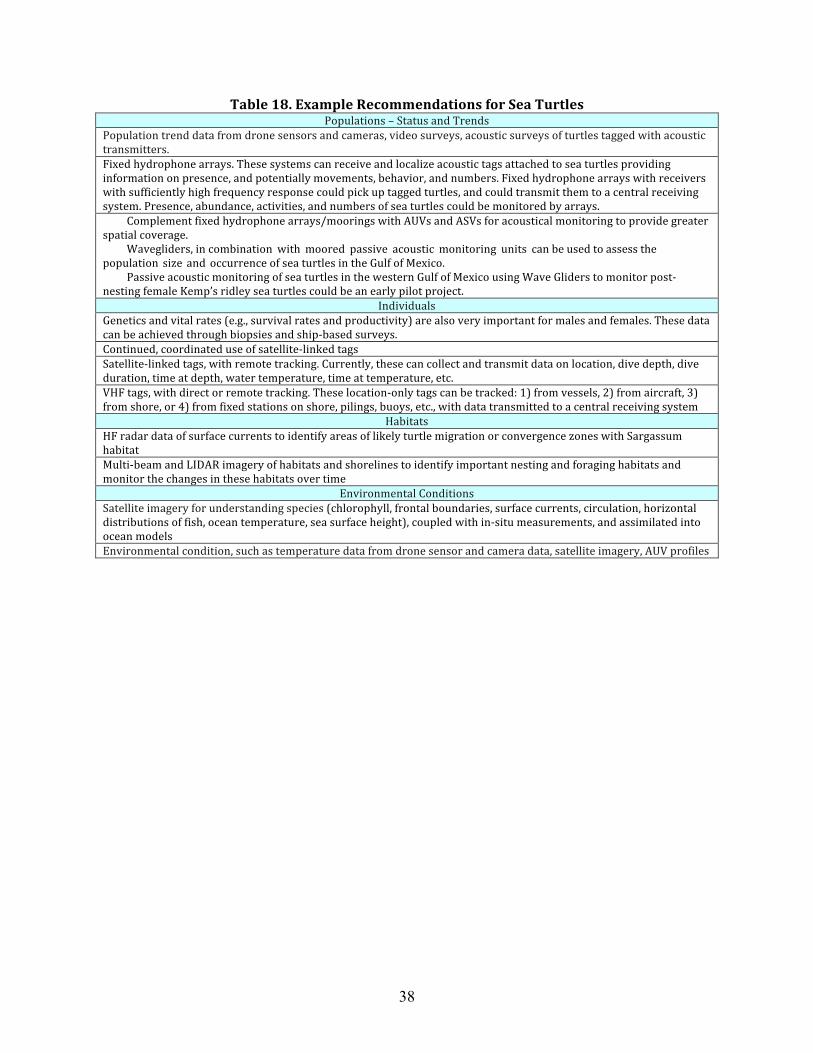
38
Table 18. Example Recommendations for Sea Turtles Populations – Status and Trends
Population trend data from drone sensors and cameras, video surveys, acoustic surveys of turtles tagged with acoustic transmitters. Fixed hydrophone arrays. These systems can receive and localize acoustic tags attached to sea turtles providing information on presence, and potentially movements, behavior, and numbers. Fixed hydrophone arrays with receivers with sufficiently high frequency response could pick up tagged turtles, and could transmit them to a central receiving system. Presence, abundance, activities, and numbers of sea turtles could be monitored by arrays.
Complement fixed hydrophone arrays/moorings with AUVs and ASVs for acoustical monitoring to provide greater spatial coverage.
Wavegliders, in combination with moored passive acoustic monitoring units can be used to assess the population size and occurrence of sea turtles in the Gulf of Mexico.
Passive acoustic monitoring of sea turtles in the western Gulf of Mexico using Wave Gliders to monitor post-‐nesting female Kemp’s ridley sea turtles could be an early pilot project.
Individuals Genetics and vital rates (e.g., survival rates and productivity) are also very important for males and females. These data can be achieved through biopsies and ship-‐based surveys. Continued, coordinated use of satellite-‐linked tags Satellite-‐linked tags, with remote tracking. Currently, these can collect and transmit data on location, dive depth, dive duration, time at depth, water temperature, time at temperature, etc. VHF tags, with direct or remote tracking. These location-‐only tags can be tracked: 1) from vessels, 2) from aircraft, 3) from shore, or 4) from fixed stations on shore, pilings, buoys, etc., with data transmitted to a central receiving system
Habitats HF radar data of surface currents to identify areas of likely turtle migration or convergence zones with Sargassum habitat Multi-‐beam and LIDAR imagery of habitats and shorelines to identify important nesting and foraging habitats and monitor the changes in these habitats over time
Environmental Conditions Satellite imagery for understanding species (chlorophyll, frontal boundaries, surface currents, circulation, horizontal distributions of fish, ocean temperature, sea surface height), coupled with in-‐situ measurements, and assimilated into ocean models Environmental condition, such as temperature data from drone sensor and camera data, satellite imagery, AUV profiles
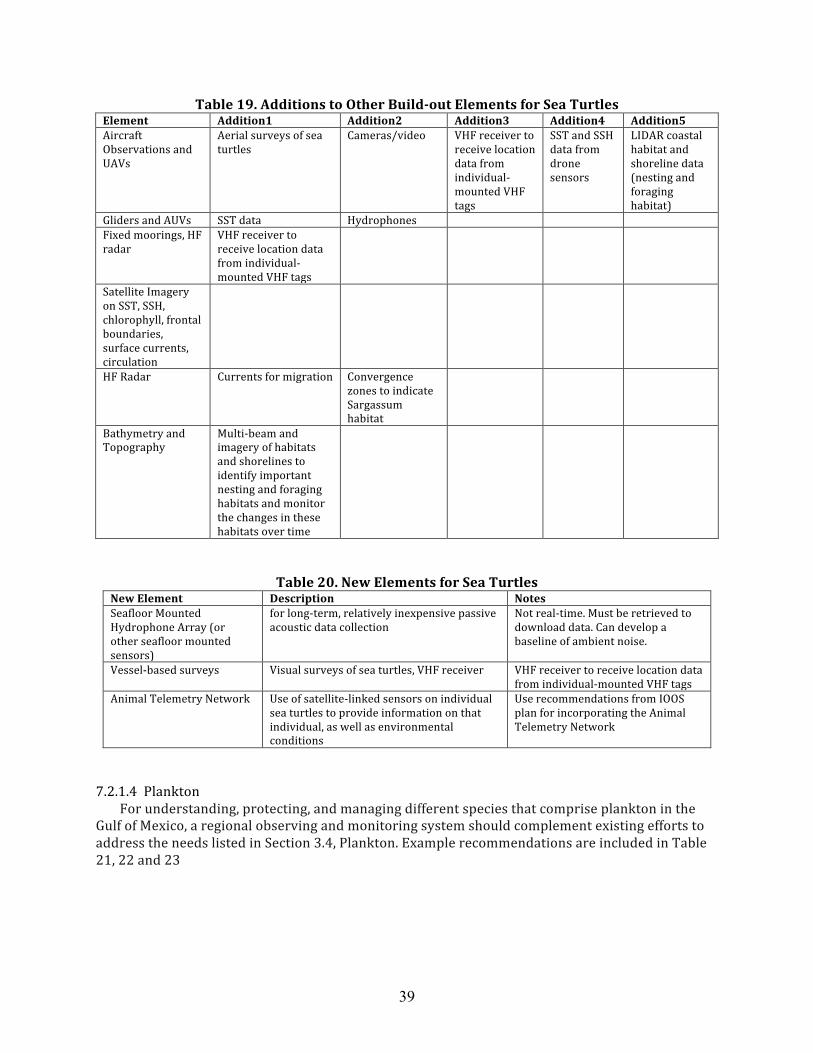
39
Table 19. Additions to Other Build-‐out Elements for Sea Turtles Element Addition1 Addition2 Addition3 Addition4 Addition5 Aircraft Observations and UAVs
Aerial surveys of sea turtles
Cameras/video VHF receiver to receive location data from individual-‐mounted VHF tags
SST and SSH data from drone sensors
LIDAR coastal habitat and shoreline data (nesting and foraging habitat)
Gliders and AUVs SST data Hydrophones Fixed moorings, HF radar
VHF receiver to receive location data from individual-‐mounted VHF tags
Satellite Imagery on SST, SSH, chlorophyll, frontal boundaries, surface currents, circulation
HF Radar Currents for migration Convergence zones to indicate Sargassum habitat
Bathymetry and Topography
Multi-‐beam and imagery of habitats and shorelines to identify important nesting and foraging habitats and monitor the changes in these habitats over time
Table 20. New Elements for Sea Turtles New Element Description Notes Seafloor Mounted Hydrophone Array (or other seafloor mounted sensors)
for long-‐term, relatively inexpensive passive acoustic data collection
Not real-‐time. Must be retrieved to download data. Can develop a baseline of ambient noise.
Vessel-‐based surveys Visual surveys of sea turtles, VHF receiver VHF receiver to receive location data from individual-‐mounted VHF tags
Animal Telemetry Network Use of satellite-‐linked sensors on individual sea turtles to provide information on that individual, as well as environmental conditions
Use recommendations from IOOS plan for incorporating the Animal Telemetry Network
7.2.1.4 Plankton
For understanding, protecting, and managing different species that comprise plankton in the Gulf of Mexico, a regional observing and monitoring system should complement existing efforts to address the needs listed in Section 3.4, Plankton. Example recommendations are included in Table 21, 22 and 23
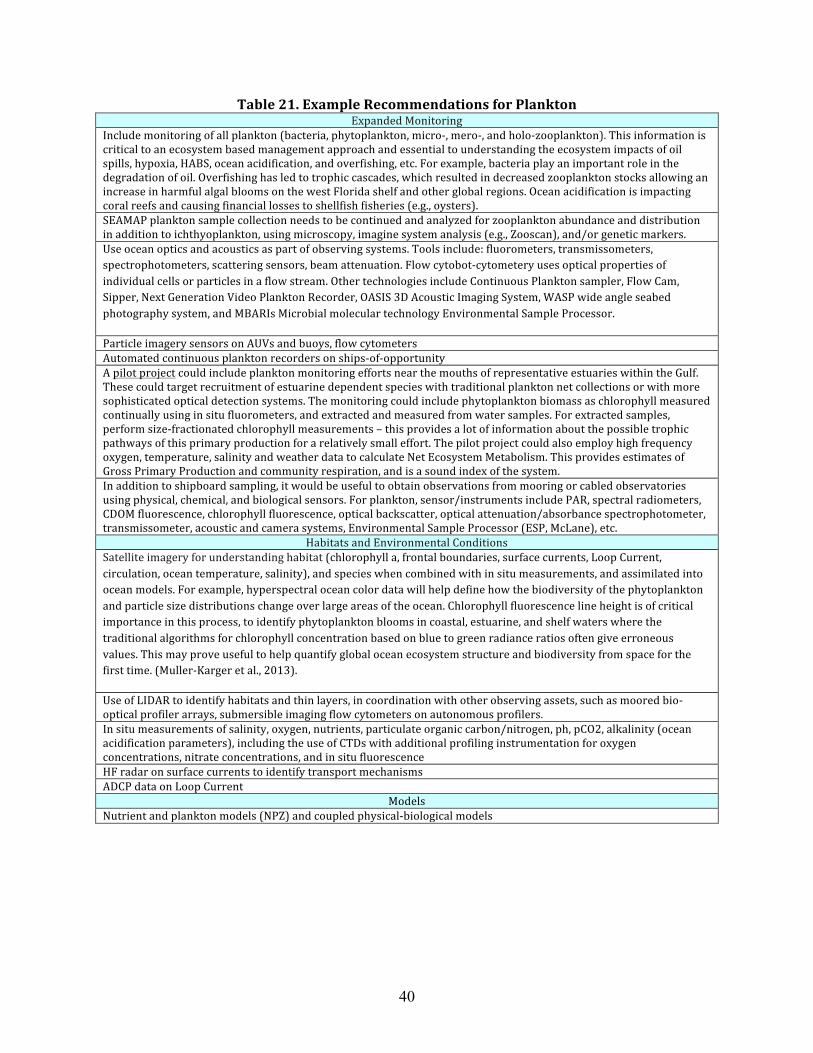
40
Table 21. Example Recommendations for Plankton Expanded Monitoring
Include monitoring of all plankton (bacteria, phytoplankton, micro-‐, mero-‐, and holo-‐zooplankton). This information is critical to an ecosystem based management approach and essential to understanding the ecosystem impacts of oil spills, hypoxia, HABS, ocean acidification, and overfishing, etc. For example, bacteria play an important role in the degradation of oil. Overfishing has led to trophic cascades, which resulted in decreased zooplankton stocks allowing an increase in harmful algal blooms on the west Florida shelf and other global regions. Ocean acidification is impacting coral reefs and causing financial losses to shellfish fisheries (e.g., oysters). SEAMAP plankton sample collection needs to be continued and analyzed for zooplankton abundance and distribution in addition to ichthyoplankton, using microscopy, imagine system analysis (e.g., Zooscan), and/or genetic markers. Use ocean optics and acoustics as part of observing systems. Tools include: fluorometers, transmissometers, spectrophotometers, scattering sensors, beam attenuation. Flow cytobot-‐cytometery uses optical properties of individual cells or particles in a flow stream. Other technologies include Continuous Plankton sampler, Flow Cam, Sipper, Next Generation Video Plankton Recorder, OASIS 3D Acoustic Imaging System, WASP wide angle seabed photography system, and MBARIs Microbial molecular technology Environmental Sample Processor.
Particle imagery sensors on AUVs and buoys, flow cytometers Automated continuous plankton recorders on ships-‐of-‐opportunity A pilot project could include plankton monitoring efforts near the mouths of representative estuaries within the Gulf. These could target recruitment of estuarine dependent species with traditional plankton net collections or with more sophisticated optical detection systems. The monitoring could include phytoplankton biomass as chlorophyll measured continually using in situ fluorometers, and extracted and measured from water samples. For extracted samples, perform size-‐fractionated chlorophyll measurements – this provides a lot of information about the possible trophic pathways of this primary production for a relatively small effort. The pilot project could also employ high frequency oxygen, temperature, salinity and weather data to calculate Net Ecosystem Metabolism. This provides estimates of Gross Primary Production and community respiration, and is a sound index of the system. In addition to shipboard sampling, it would be useful to obtain observations from mooring or cabled observatories using physical, chemical, and biological sensors. For plankton, sensor/instruments include PAR, spectral radiometers, CDOM fluorescence, chlorophyll fluorescence, optical backscatter, optical attenuation/absorbance spectrophotometer, transmissometer, acoustic and camera systems, Environmental Sample Processor (ESP, McLane), etc.
Habitats and Environmental Conditions Satellite imagery for understanding habitat (chlorophyll a, frontal boundaries, surface currents, Loop Current, circulation, ocean temperature, salinity), and species when combined with in situ measurements, and assimilated into ocean models. For example, hyperspectral ocean color data will help define how the biodiversity of the phytoplankton and particle size distributions change over large areas of the ocean. Chlorophyll fluorescence line height is of critical importance in this process, to identify phytoplankton blooms in coastal, estuarine, and shelf waters where the traditional algorithms for chlorophyll concentration based on blue to green radiance ratios often give erroneous values. This may prove useful to help quantify global ocean ecosystem structure and biodiversity from space for the first time. (Muller-‐Karger et al., 2013).
Use of LIDAR to identify habitats and thin layers, in coordination with other observing assets, such as moored bio-‐optical profiler arrays, submersible imaging flow cytometers on autonomous profilers. In situ measurements of salinity, oxygen, nutrients, particulate organic carbon/nitrogen, ph, pCO2, alkalinity (ocean acidification parameters), including the use of CTDs with additional profiling instrumentation for oxygen concentrations, nitrate concentrations, and in situ fluorescence HF radar on surface currents to identify transport mechanisms ADCP data on Loop Current
Models Nutrient and plankton models (NPZ) and coupled physical-‐biological models
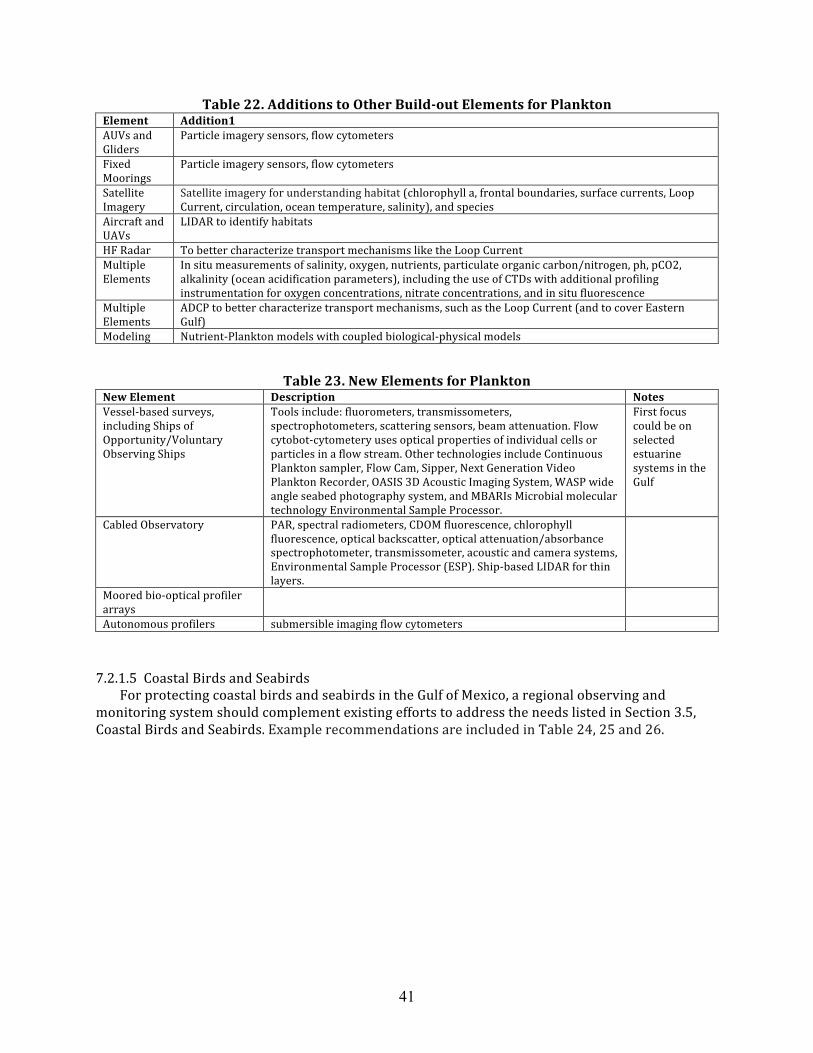
41
Table 22. Additions to Other Build-‐out Elements for Plankton Element Addition1 AUVs and Gliders
Particle imagery sensors, flow cytometers
Fixed Moorings
Particle imagery sensors, flow cytometers
Satellite Imagery
Satellite imagery for understanding habitat (chlorophyll a, frontal boundaries, surface currents, Loop Current, circulation, ocean temperature, salinity), and species
Aircraft and UAVs
LIDAR to identify habitats
HF Radar To better characterize transport mechanisms like the Loop Current Multiple Elements
In situ measurements of salinity, oxygen, nutrients, particulate organic carbon/nitrogen, ph, pCO2, alkalinity (ocean acidification parameters), including the use of CTDs with additional profiling instrumentation for oxygen concentrations, nitrate concentrations, and in situ fluorescence
Multiple Elements
ADCP to better characterize transport mechanisms, such as the Loop Current (and to cover Eastern Gulf)
Modeling Nutrient-‐Plankton models with coupled biological-‐physical models
Table 23. New Elements for Plankton New Element Description Notes Vessel-‐based surveys, including Ships of Opportunity/Voluntary Observing Ships
Tools include: fluorometers, transmissometers, spectrophotometers, scattering sensors, beam attenuation. Flow cytobot-‐cytometery uses optical properties of individual cells or particles in a flow stream. Other technologies include Continuous Plankton sampler, Flow Cam, Sipper, Next Generation Video Plankton Recorder, OASIS 3D Acoustic Imaging System, WASP wide angle seabed photography system, and MBARIs Microbial molecular technology Environmental Sample Processor.
First focus could be on selected estuarine systems in the Gulf
Cabled Observatory PAR, spectral radiometers, CDOM fluorescence, chlorophyll fluorescence, optical backscatter, optical attenuation/absorbance spectrophotometer, transmissometer, acoustic and camera systems, Environmental Sample Processor (ESP). Ship-‐based LIDAR for thin layers.
Moored bio-‐optical profiler arrays
Autonomous profilers submersible imaging flow cytometers 7.2.1.5 Coastal Birds and Seabirds
For protecting coastal birds and seabirds in the Gulf of Mexico, a regional observing and monitoring system should complement existing efforts to address the needs listed in Section 3.5, Coastal Birds and Seabirds. Example recommendations are included in Table 24, 25 and 26.
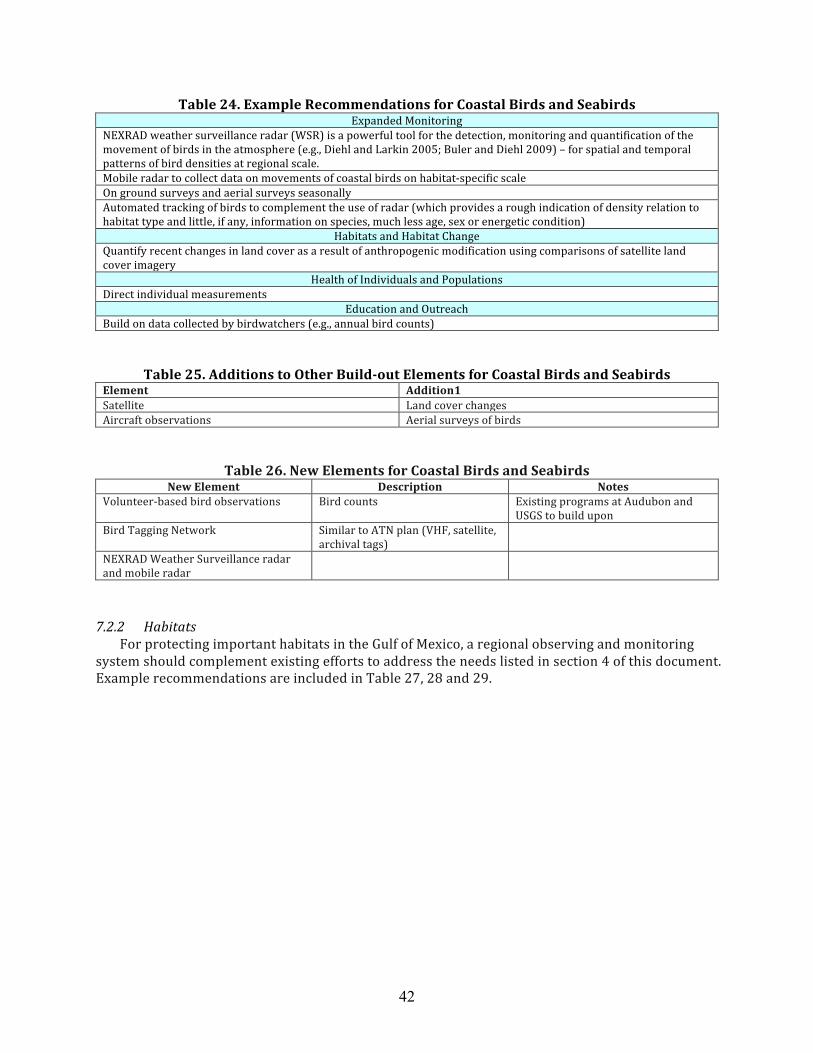
42
Table 24. Example Recommendations for Coastal Birds and Seabirds Expanded Monitoring
NEXRAD weather surveillance radar (WSR) is a powerful tool for the detection, monitoring and quantification of the movement of birds in the atmosphere (e.g., Diehl and Larkin 2005; Buler and Diehl 2009) – for spatial and temporal patterns of bird densities at regional scale. Mobile radar to collect data on movements of coastal birds on habitat-‐specific scale On ground surveys and aerial surveys seasonally Automated tracking of birds to complement the use of radar (which provides a rough indication of density relation to habitat type and little, if any, information on species, much less age, sex or energetic condition)
Habitats and Habitat Change Quantify recent changes in land cover as a result of anthropogenic modification using comparisons of satellite land cover imagery
Health of Individuals and Populations Direct individual measurements
Education and Outreach Build on data collected by birdwatchers (e.g., annual bird counts)
Table 25. Additions to Other Build-‐out Elements for Coastal Birds and Seabirds Element Addition1 Satellite Land cover changes Aircraft observations Aerial surveys of birds
Table 26. New Elements for Coastal Birds and Seabirds New Element Description Notes
Volunteer-‐based bird observations Bird counts Existing programs at Audubon and USGS to build upon
Bird Tagging Network Similar to ATN plan (VHF, satellite, archival tags)
NEXRAD Weather Surveillance radar and mobile radar
7.2.2 Habitats
For protecting important habitats in the Gulf of Mexico, a regional observing and monitoring system should complement existing efforts to address the needs listed in section 4 of this document. Example recommendations are included in Table 27, 28 and 29.
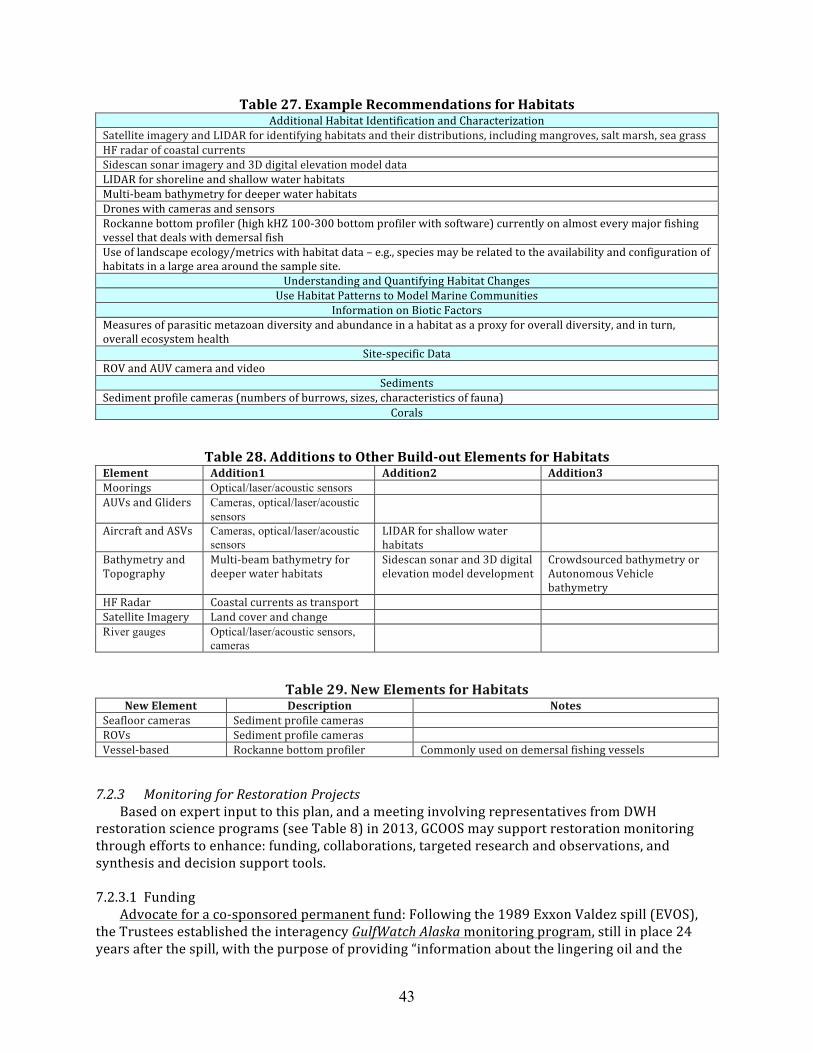
43
Table 27. Example Recommendations for Habitats Additional Habitat Identification and Characterization
Satellite imagery and LIDAR for identifying habitats and their distributions, including mangroves, salt marsh, sea grass HF radar of coastal currents Sidescan sonar imagery and 3D digital elevation model data LIDAR for shoreline and shallow water habitats Multi-‐beam bathymetry for deeper water habitats Drones with cameras and sensors Rockanne bottom profiler (high kHZ 100-‐300 bottom profiler with software) currently on almost every major fishing vessel that deals with demersal fish Use of landscape ecology/metrics with habitat data – e.g., species may be related to the availability and configuration of habitats in a large area around the sample site.
Understanding and Quantifying Habitat Changes Use Habitat Patterns to Model Marine Communities
Information on Biotic Factors Measures of parasitic metazoan diversity and abundance in a habitat as a proxy for overall diversity, and in turn, overall ecosystem health
Site-‐specific Data ROV and AUV camera and video
Sediments Sediment profile cameras (numbers of burrows, sizes, characteristics of fauna)
Corals
Table 28. Additions to Other Build-‐out Elements for Habitats Element Addition1 Addition2 Addition3 Moorings Optical/laser/acoustic sensors AUVs and Gliders Cameras, optical/laser/acoustic
sensors
Aircraft and ASVs Cameras, optical/laser/acoustic sensors
LIDAR for shallow water habitats
Bathymetry and Topography
Multi-‐beam bathymetry for deeper water habitats
Sidescan sonar and 3D digital elevation model development
Crowdsourced bathymetry or Autonomous Vehicle bathymetry
HF Radar Coastal currents as transport Satellite Imagery Land cover and change River gauges Optical/laser/acoustic sensors,
cameras
Table 29. New Elements for Habitats New Element Description Notes
Seafloor cameras Sediment profile cameras ROVs Sediment profile cameras Vessel-‐based Rockanne bottom profiler Commonly used on demersal fishing vessels 7.2.3 Monitoring for Restoration Projects
Based on expert input to this plan, and a meeting involving representatives from DWH restoration science programs (see Table 8) in 2013, GCOOS may support restoration monitoring through efforts to enhance: funding, collaborations, targeted research and observations, and synthesis and decision support tools. 7.2.3.1 Funding
Advocate for a co-‐sponsored permanent fund: Following the 1989 Exxon Valdez spill (EVOS), the Trustees established the interagency GulfWatch Alaska monitoring program, still in place 24 years after the spill, with the purpose of providing “information about the lingering oil and the
44
recovery of species and resources injured by the spill, as well as other factors that may be affecting recovery, such as changing climate, oceanographic and ecosystem conditions.” Program goals include: • Provide sound scientific information on biological resources and environmental conditions to
management agencies, the scientific research community and the general public; • Identify and help understand the impacts of multiple factors on recovery of resources injured
by the oil spill; and • Leverage partnerships with state and federal agencies, universities, non-‐profits and private
entities to integrate and provide access to data from broader monitoring efforts in the region. The GulfWatch program is supported by an endowment using EVOS civil penalties, to help
ensure continued support for related research, observations, mapping, and modeling activities. This business model would also help sustain the Gulf of Mexico restoration monitoring, and enable shared investment from stakeholder sectors and programs. 7.2.3.2 Collaboration/Integration • Successful restoration requires front-‐end monitoring to establish baseline conditions and
inform restoration strategy evaluations before major investments are made. Three years after DWH oil spill, the required monitoring capability is inadequate and most restoration has not commenced. Collaboration by all the restoration partners in the region, including programs like GCOOS, which may or may not receive DWH oil spill penalties, is required for immediate implementation of the required ecosystem monitoring in support of restoration program planning.
• A unified (all restoration programs) science plan for ecosystem monitoring and restoration should be adopted that defines a systematic monitoring approach based on addressing targeted and well-‐defined list of key questions, desired endpoints and appropriate metrics (indicators and outcomes), e.g., targets for environmental parameters, how much habitat to restore, and expected impact on related resources.
• Unified information resources need to be planned, designed and implemented before restoration begins in earnest (when funding arrives). This will enable project planning and effectiveness monitoring efforts and data to serve as a significant component of the ecosystem monitoring effort. Project investigators/practitioners should be required in grant/contract terms and conditions to meet obligations that ensure data is of sufficient quality, processed in a timely manner, and properly documented to enable archival and access. Results may then be integrated for regional applications (e.g., to inform NEPA or ESA Biological Assessment analyses) and contribute to long-‐term scenario planning—used to develop indicators and milestones (e.g., priority species or habitat types) for decades out. More detail follows with synthesis recommendations.
7.2.3.3 Research and Observations • Many existing resources list Gulf ecosystem monitoring needs (e.g., parameters, measurements,
observations, research hypotheses). The restoration monitoring effort needs to begin with a gap analysis to identify current capabilities and resources, and where new monitoring efforts are needed. Wherever possible, new site and project specific monitoring efforts need to build on and leverage existing monitoring capabilities.
• In identifying gaps, a goal should be to support what is needed to improve ecosystem models. Other modeling priorities that deserve support by all programs include: conceptual models to guide regional restoration and communication with managers; mass transfer models (gas, liquid, and heat); higher resolution circulation models; and ecosystem-‐level ecological models.
• Example issues that require enhanced assessment and ecosystem-‐level monitoring support include:
45
§ Interactions of river flows and coastal waters at multiple scales (horizontal vs. vertical structures, temporal); local and regional meteorological influences on precipitation and river inputs to coasts and oceans.
§ Energy extraction activities including information on: oceanographic currents and atmospheric forcing of oil spill trajectories; contaminant impacts on water quality and toxicity to marine resources, including fish, marine mammals, and avian resources; human uses of the marine environment; recovery from disturbed and exploited areas, such as evolution of sand borrow areas; baseline understanding of the marine soundscape; impacts of lit structures on living resource behavior; role of unused infrastructure as reefs and impacts of removal activities.
§ Large-‐scale forcing factors that will impact all scales of restoration effort, e.g., climate (e.g., see US Global Change Research Program Indicators System), productivity, and large-‐scale human impacts (ocean and coastal development and engineering).
§ Essential fish habitat (EFH) designations based on ecology of fishes and dynamic environmental parameters of EFH, e.g., correlating fish species spawning areas with environmental factors, such as productivity and structure; proposed milestone identified—derive level 4 EFH (p. 2377) information for ten key commercially valuable species, and 10 key non-‐commercial species and wildlife. Habitat maps are critically needed, especially for productive benthic communities (reefs, chemosynthetic communities, corals).
§ Monitor and assess chronic background concentrations and fluxes from natural seepage of hydrocarbons (oil, gas, hydrates). This is critical baseline information required to understand abrupt events.
§ Monitor and map human use; oil and gas infrastructure and activities, ship traffic, fishing, coastal community resiliency and vulnerability.
• Support Gulf ecosystem monitoring elements including: § System configuration that matches scale of environmental forcing factors and priority
ecological indicators and span air to sediments/substrate, and watersheds to deep sea. § System includes in situ monitoring of physical, chemical and biological parameters via
combined approach of: 1) sentinel stations with intensive monitoring, e.g., NSF-‐type Long-‐term Ecological Research network (LTER) stations across the Gulf (at least three, e.g., West Florida Shelf, off Mississippi delta and off Texas); and 2) Gulf-‐wide monitoring network, similar to the SEAMAP Gulf-‐wide fisheries monitoring system, with continuous measurements of core parameters to account for daily to inter-‐annual variability; less observations at many more places.
§ Monitoring network includes: adaptive sampling by mobile assets (ships, robots); ability for remote guidance and operations based on real-‐time or near-‐real-‐time information; and integrated data from remote sensing and in situ platforms.
7.2.3.4 Synthesis and Decision-‐support Tools • Ecosystem monitoring requires more than the use of static instruments to produce reams of
data; it must include analysis and synthesis to understand and predict impact of changes in ecosystem function on ecosystem goods and services—things important to people and economy.
• Ecosystem monitoring must produce rapid (time-‐scale of use to managers), visual information (including data derivative products and analyses) to increase access, transparency and improve public trust in science and management.
• Through the GCOOS Data Management and Communications (DMAC) and, in collaboration with NCDDC and GOMA: help implement data interoperability between different data providers in GCOOS and make this data freely available to the public.
46
• Gulf-‐wide information monitoring system (IMS) must span all restoration programs in providing reliable access to validated ecosystem-‐scale monitoring data; front-‐end should include geo-‐spatial mapping portal to support many layers and applications relevant for restoration and sustainability.
• Databases for market and non-‐market ecosystem service values that can be used to inform restoration strategy evaluations.
• Develop products by compiling data relevant to specific restoration projects using a hierarchy of spatial and temporal scales to help assess the cumulative effects of local restoration projects on the whole Gulf system. Pilot products can be developed for a few high-‐priority restoration projects from the Gulf Coast Ecosystem Restoration Council, NFWF, NRDA and other stakeholders (following a recommendation from Murawski and Hogarth, 2013). One priority criteria for defining the pilot products could be the level of ecosystem services provided by the restoration project (e.g., Yoskowitz et al. 2012). Restoration projects are diverse and have different priorities depending upon the funding
program and/or needs of the Trustees (see Section 5, Monitoring for Restoration Projects). Regardless, ecosystem monitoring on topic-‐relevant spatial and temporal scales will be essential to the success of those restoration projects. Since restoration monitoring spans the breadth of the other topics in this Ecosystem Monitoring Section (Living Marine Resources and Habitats), example recommendations in those sections will help with restoration project monitoring.
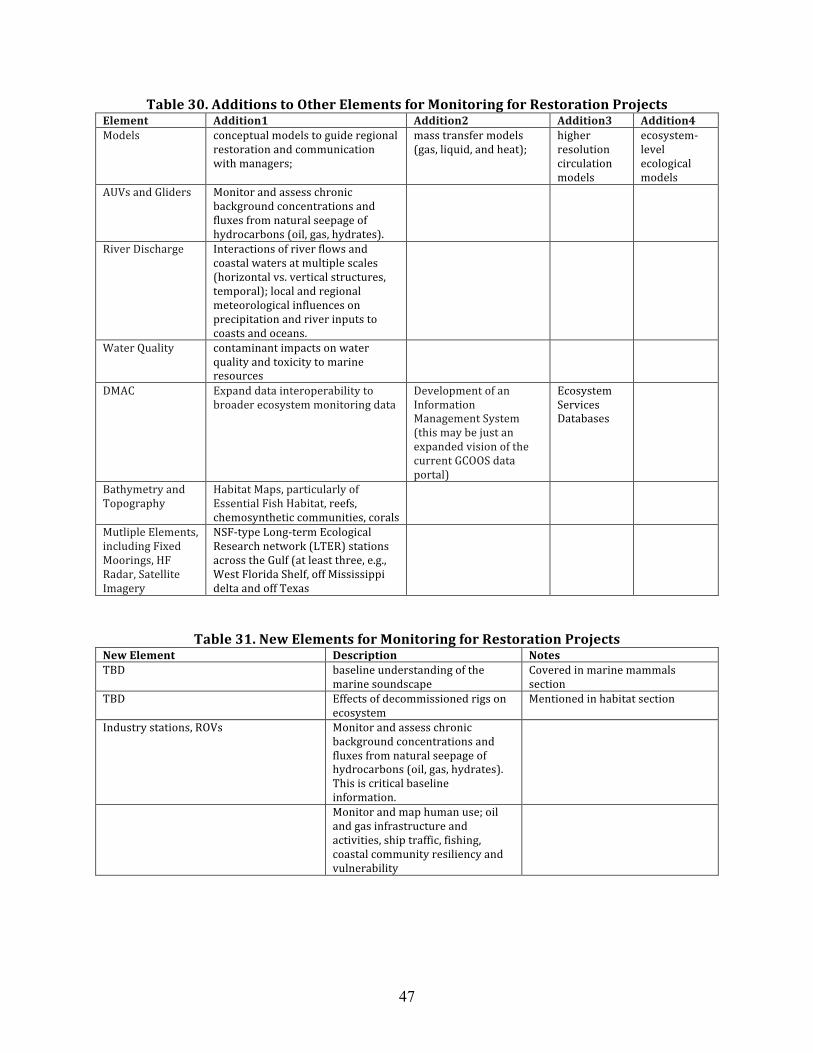
47
Table 30. Additions to Other Elements for Monitoring for Restoration Projects Element Addition1 Addition2 Addition3 Addition4 Models conceptual models to guide regional
restoration and communication with managers;
mass transfer models (gas, liquid, and heat);
higher resolution circulation models
ecosystem-‐level ecological models
AUVs and Gliders Monitor and assess chronic background concentrations and fluxes from natural seepage of hydrocarbons (oil, gas, hydrates).
River Discharge Interactions of river flows and coastal waters at multiple scales (horizontal vs. vertical structures, temporal); local and regional meteorological influences on precipitation and river inputs to coasts and oceans.
Water Quality contaminant impacts on water quality and toxicity to marine resources
DMAC Expand data interoperability to broader ecosystem monitoring data
Development of an Information Management System (this may be just an expanded vision of the current GCOOS data portal)
Ecosystem Services Databases
Bathymetry and Topography
Habitat Maps, particularly of Essential Fish Habitat, reefs, chemosynthetic communities, corals
Mutliple Elements, including Fixed Moorings, HF Radar, Satellite Imagery
NSF-‐type Long-‐term Ecological Research network (LTER) stations across the Gulf (at least three, e.g., West Florida Shelf, off Mississippi delta and off Texas
Table 31. New Elements for Monitoring for Restoration Projects New Element Description Notes TBD baseline understanding of the
marine soundscape Covered in marine mammals section
TBD Effects of decommissioned rigs on ecosystem
Mentioned in habitat section
Industry stations, ROVs Monitor and assess chronic background concentrations and fluxes from natural seepage of hydrocarbons (oil, gas, hydrates). This is critical baseline information.
Monitor and map human use; oil and gas infrastructure and activities, ship traffic, fishing, coastal community resiliency and vulnerability
48
8 References These references are additional to those plans included in tables in this document. Alexander, C., Arendt, M., Ault, J., Block, B., Costa, D., Hayes, S., Holland, K., Holbrook, C.M. Kocik, J.,
Lendley, S., Mahmoudi, B., Mate, B., Moore, P., Moustahfid, H., Payne, J., Price, J., Seitz, A., Simmons, S., Weise, M., and D. Wilson. 2014. Meeting our Nation’s Needs for Biological and Environmental Monitoring: Strategic Plan and Recommendations for a National Animal Telemetry Network (ATN) Through U.S. IOOS.
Baker, J. R. .1992. Causes of Mortality and Parasites and Incidental Lesions in Dolphins and Whales from British Waters. Veterinary Record, 130, 554-‐558.
Balmer, B.C., Wells, R.S., Howle, L.E., Barleycorn, A.A., McClennan, W.A., Pabst, D.A., Rowles, T.K., Schwacke, L.A., Townsend, F.I., Westgate, A.J., and E.S. Zolman (In Press). Advances in cetacean telemetry: A review of single-‐pin transmitter attachment techniques on small cetaceans and development of a new satellite-‐linked transmitter design. Marine Mammal Science. DOI: 10.1111/mms.12072
Block , B.A., Holland, K., Coasta, Kocik, J., Fox, D., Mate, B., Grimes, C., Moustahfid, H., Seitz, A., Behzad, M., Holbrook, C., Lindley, S., Alexander, C., Simmons, S., Payne, J., Weise, M. and R. Kochevar, 2012. Toward a US Animal Telemetry Observing Network (US ATN) for our Oceans, Coasts and Great Lakes. U.S. IOOS Summit, Herndon, VA, USA, November 2012. https://docs.google.com/a/noaa.gov/file/d/0BwW7dLnWT2C0LTRPdjYzeUxPT0U/edit Buler, J. J. and R. H. Diehl. 2009. Quantifying bird density during migratory stopover using weather surveillance radar. IEEE Transactions on Geoscience and Remote Sensing, 47, 2741–2751.
Busch, D.E. and J.C. Trexler. 2003. The importance of monitoring in regional ecosystem initiatives. pp. 1-‐23. In: D.E. Busch and J.C. Trexler (eds.). Monitoring Ecosystems: Interdisciplinary Approaches for Evaluating Ecoregional Initiatives. Island Press, Washington, DC. 447 pp.
Crapo, R.O. 1994. Pulmonary-‐Function Testing. N Engl J Med, 331:25-‐30. Dickoff, W.W., T.K. Colier, and U. Varanasi. 2007. The seafood “dilemma”: A way forward. Fisheries
32(5): 244-‐246, http://www.nwfsc.noaa.gov/seafooddilemma.pdf Diehl, R. H., and R. P. Larkin. 2005. Introduction to the WSR-‐88D (NEXRAD) for ornithological
research. In C. J. Ralph and T. D. Rich (eds.). 2005. Bird Conservation Implementation and Integration in the Americas: Proceedings of the Third International Partners in Flight Conference, 2002. Pacific Southwest Research Station, Forest Service, U.S. Department of Agriculture, Albany, California.
Dierauf, L.A. and F.M.D. Gulland. 2001. CRC Handbook of Marine Mammal Medicine (2nd edition). Boca Raton, CRC Press.
Duffy, J.E., Amaral-‐Zettler, L. A., Fautin, D. G., Paulay, G., Rynearson, T.A., Sosik, H.M. and J. J. Stachowicz. 2013. Envisioning a marine biodiversity observation network. Bioscience. 63(5), 350–361. http://www.aibs.org/biosciencepress releases/resources/DuffyREV2.pdf
GOMA. 2013. Notes from Meeting: Gulf of Mexico Monitoring Coordination Meeting, December 11, 2013. 6 pp.
GOMURC. 2013. A Gulf of Mexico Observing System: A Position Paper by the Gulf of Mexico University Research Collaborative.
Harris, R., Wiebe, P., Lenz, J., Skjoldal, H.R., and M. Huntley. 2000. ICES Zooplankton Methodology Manual. Academic Press.
IOOS. 2012. Independent Cost Estimate of the U.S. Integrated Ocean Observing System, http://www.iooc.us/wp-‐content/uploads/2010/09/IOOS_Report_Volume_I_120503.pdf
49
Jochens, A.E. and S.M. Watson. 2013. The Gulf of Mexico Coastal Ocean Observing System: An Integrated Approach to Building a Regional Ocean Observing System, Marine Technology Society Journal, 47(1): 118-‐133.
Karnauskas, M., Schirripa, M. J., Kelble, C. R., Cook, G. S., Craig, J. K. (eds.). 2013. Ecosystem Status Report for the Gulf of Mexico. NOAA Technical Memorandum NMFS-‐SEFSC-‐653, 52 p.
Kemmerer, A.J. 1980. Environmental Preferences and Behaviour Patterns of Gulf Menhaden Inferred From Fishing and Remotely Sensed Data. ICLARM Conf. Proceedings, 5, 345-‐70.
Lubchenco, J., McNutt, M.K., Dreyfus, G., Murawski, S.A., Kennedy, D.M., Anastas, P.T., Chu, S., and T. Hunter. 2012. Science in Support of the Deepwater Horizon Response, Proceedings of the National Academies of Sciences, 109(50): 20212-‐20221. http://www.pnas.org/content/109/50/20212.full
Medway, W. and F.H. Schryver, 1973. Respiratory problems in captive small cetaceans. Journal of the American Veterinary Medical Association, 163, 571 -‐573.
Minerals Management Service. 2007-‐044. Characterization of Northern Gulf of Mexico Deepwater Hard-‐Bottom Communities with Emphasis on Lophelia Corals. http://invertebrates.si.edu/boem/reports/LOPH_final.pdf
Moore, S. E.. 2008. Marine mammals as ecosystem sentinels. Journal of Mammalogy 89:534-‐540. http://www.mammalsociety.org/uploads/Moore%202008.pdf
Moustahfid, H., Grimes, C., Kocik, J., Block, B., Holland, K., Payne, J., Fox, D., Seitz, A. and C. Alexander. 2011. Toward a national Animal Telemetry Observing Network (ATN) for our oceans, coasts and great lakes: workshop synthesis report (U.S. IOOS workshop, March 2011, Santa Cruz, California). U.S. Department of Commerce, NOAA Technical Memorandum NMFS, NOAA-‐TM-‐NMFS-‐SWFSC-‐482, 51 p.
Muller-‐Karger, F., Roffer, M., Walker, N., Oliver, M., Schofield, O., Abbott, M.,Graber, H., Leben, R., Goni, G., 2013. Satellite Remote Sensing in Support of an Integrated Ocean Observing System, Geoscience and Remote Sensing Magazine, IEEE , 1(4), 8-‐18, doi: 10.1109/MGRS.2013.2289656
Murawski, S.A. and W.T. Hogarth. 2013. Enhancing the ocean observing system to meet restoration challenges in the Gulf of Mexico. Oceanography 26(1): 10-‐16, http://dx.doi.org/10.5670/oceanog.2013.12)
National Research Council. 2013. An Ecosystem Services Approach to Assessing the Impacts of the Deepwater Horizon Oil Spill in the Gulf of Mexico. Washington, DC: The National Academies Press. http://www.nap.edu/catalog.php?record_id=18387
National Research Council. 2011. Approaches for Ecosystem Services Valuation for the Gulf of Mexico After the Deepwater Horizon Oil Spill: Interim Report. Washington, DC: The National Academies Press. http://dels.nas.edu/Report/Approaches-‐Ecosystem-‐Services-‐Valuation/13141
National Research Council. 2010. Assessment of Sea-‐Turtle Status and Trends: Integrating Demography and Abundance. Washington, DC: The National Academies Press, http://www.nap.edu/catalog/12889.html.
National Research Council. 2003. Ocean Noise and Marine Mammals. Washington, DC: The National Academies Press. http://www.nap.edu/catalog.php?record_id=10564
National Wildlife Federation. 2013. Artificial Reefs in the Gulf of Mexico: A Review of Gulf State Programs and Key Considerations. http://www.nwf.org/~/media/PDFs/Water/Review-‐of-‐GoM-‐Artificial-‐Reefs-‐Report.pdf
NOAA. 2013. Ecosystem Status Report for the Gulf of Mexico. NOAA Technical Memorandum NMFS-‐SEFSC-‐653.
NOAA, 2012a. Commercial Fisheries Statistics and Recreational Fisheries Statistics, http://www.st.nmfs.noaa.gov/commercial-‐fisheries/fus/fus12/index
NOAA, 2012b. Status of Stocks 2012: Annual Report to Congress on the Status of U.S. Fisheries. http://www.nmfs.noaa.gov/sfa/statusoffisheries/2012/2012_SOS_RTC.pdf
50
NOAA, Office of Science and Technology, National Marine Fisheries Service. 2011. Commercial Fisheries Statistics and Recreational Fisheries Statistics. http://www.st.nmfs.noaa.gov/
NOAA. 2009. Our Living Oceans. Report on the status of U.S. living marine resources, 6th edition. U.S. Dep. Commer., NOAA Tech. Memo. NMFS-‐F/SPO-‐80, 369 p. http://spo.nmfs.noaa.gov/olo6th-‐edition.htm
NOAA, 2008. Overview of Protected Species Commonly Found in the Gulf of Mexico, http://sero.nmfs.noaa.gov/pr/pdf/Protected%20Species%20In%20GOM-‐web%20version%202-‐7-‐08.pdf
National Ocean Council (NOC). 2013. National Ocean Policy Implementation Plan. National Ocean Council, Washington, DC 20503. 36 pp. http://www.whitehouse.gov//sites/default/files/national_ocean_policy_implementation_plan.pdf
National Ocean Service (NOS). 2014. Ocean Facts: NRDA Process. National Ocean Service, Silver Spring, MD. http://oceanservice.noaa.gov/facts/nrda.html.
NRDA (Natural Resource Damage Assessment). 2012. Status Update for the Deepwater Horizon Oil Spill. http://www.gulfspillrestoration.noaa.gov/wp-‐content/uploads/FINAL_NRDA_StatusUpdate_April2012.pdf
Ocean Conservancy. 2011. Restoring the Gulf of Mexico: A Framework for Ecosystem Restoration. Ocean Conservancy, Gulf Restoration Center, 400 Poydras Street, Suite 1990, New Orleans, LA
Peterson, CH, Anderson, S.S., Cherr, G.N., Ambrose, R.F., Anghera, A., Bay, S., Blum, M., Condon, R., Dean, T.A., Graham, M., Guzy, M., Hampton, S., Joye, S., Lambrinos, J., Mate, B., Meffert, D., Powers, S.P., Somasundaran, P., Spies, R.B., Taylor, C.M., Tjeerdema, R., and E.E. Adams. 2012. A Tale of Two Spills: Novel Science and Policy Implications of an Emerging New Oil Spill Model. Bioscience 62(5): 461-‐469.
Ross, P.S. 2000. Marine Mammals as Sentinels in Ecological Risk Assessment, Human and Ecological Risk Assessment, 6 (1), 29-‐4. http://www.whoi.edu/science/B/people/mhahn/Ross_weight_of_evidence.pdf
Sayigh, L.S., Tyack, P.L., Wells, R.S., Solow, A.R., Scott, M.D., and A.B. Irivine. 1999. Individual recognition in wild bottlenose dolphins: a field test using playback experiments. Anim Behav; 57(1):41-‐50.
Schirripa, M.J., Allee, B.,Cross, S., Kelble, C., A Rost Parsons. 2012. Progress towards an integrated ecosystem assessment. Collect. Vol. Sci. Pap. ICCAT, SCRS/2012/082. 12 pp.
Schwenk, K., Padilla, D.K., Bakken G.S., and R.J. Full. 2009. Grand challenges in organismal biology. Integrative and Comparative Biology, 49: 7–14.
Stunz, G. et al. 2013. Harte Institute. Research Finds That More Than 50 Species of Fish in Gulf Rely on Decommissioned Rigs. https://tamucc.edu/news/2013/11/111113%20Artificial%20Reefs.html#.UqZBFxZz2XI
Sweeney, J. C. and Ridgway, S. H. 1976. Common diseases of small cetaceans. Journal of the American Veterinary Medical Association, 167, 533-‐540.
Van Norden, M.F., P. Cooper, and J. Hersey. 2013. Crowdsourced Bathymetry, One Solution for Addressing Nautical Chart Deficiencies. U.S. Hydro 2013 Technical Papers, March 2013.
Virmani, J.I. and E.D. Estevez. 2008. Bio-‐Sensing in Ocean Observations (Workshop Report): Accomplishments and Ambitions for In-‐Situ, Autonomous, Real Time and Related Measurement, Sampling, and Sensing Systems for Biological, Ecological and Human-‐Health Variables as Part of Coastal Ocean Observing Systems. http://www.marine.usf.edu/flcoos/docs/Biosensing_WorkshopReport_FINAL.pdf
Wells, R.S., Fougeres, E.M., Cooper, A.G., Stevens, R.O., Brodsky, M., Lingenfelser, R., Dold, C., and D.C. Douglas. 2013. Movements and Dive Patterns of Short-‐Finned Pilot Whales (Globicephala macrorhynchus) Released from a Mass Stranding in the Florida Keys. Aquatic Mammals, 39(1), 61-‐72.
51
Wells, R.S., Manire, C.A., Byrd, L., Smith, D.R., Gannon, J.G., Fauouier, D., and K.D. Mullin. 2009. Movements and Dive Patterns of a Rehabilitated Risso’s Dolphin, Grampus griseus, in the Gulf of Mexico and Atlantic Ocean. Marine Mammal Science, 25(2): 420-‐429.
Wells, R.S., Rhinehart, H.L., Hansen, L.J., Sweeney, J.C., Townsend, F.I., Stone, R., Casper, D.R., Scott, M.D., Hohn, A.A., and Rowles, T.K. 2004. Bottlenose Dolphins as Marine Ecosystem Sentinels: Developing a Health Monitoring System. EcoHealth, 1 (3), 246-‐254.
Whitehead, A., Dubansky, B., Bodinier, C., Garcia, T.I., Miles, S., Pilley, C., Raghunathan, V., Roach, J.L., Walker, N., Walter, R.B., Rice, C.D., and F. Galvez. 2012. Genomic and physiological footprint of the Deepwater Horizon oil spill on resident marsh fishes. Proc Natl Acad Sci USA 109:20298–20302.
Yoskowitz, D., Carollo, C., and C. Santos. 2013. Operationalizing Ecosystem Services for Restoration. Harte Research Institute. http://www.harteresearchinstitute.org/images/research/socioeconomics/ESFramework.pdf