economics 349 intermediate micro theory fall 2007 dr. delemeester
Post on 18-Dec-2015
216 views
TRANSCRIPT

Economics 349Intermediate Micro Theory
Fall 2007
Dr. Delemeester

Course Essentials
Course Web Page www.marietta.edu/~delemeeg/econ349
Grade Exams (60%) Problem Sets (25%) Spreadsheet Projects (15%)

Economic Roundtable …to promote an interest in and to enlighten its
members and others in the community on important governmental, economic, and social issues…
Business networking opportunity Student memberships: $5
EconomicRoundtable.org
The most important determinant of my success in Economics 349 will be:
0% 0% 0%0%0%
a) My interest in the material
b) The amount of time I put into the class
c) The instructor’s ability to inspire me
d) My mathematical skills
e) None of the above.
a) My interest in the material
b) The amount of time I put into the class
c) The instructor’s ability to inspire me
d) My mathematical skills
e) None of the above.
1 2 3 4 5 6 7 8 9 10 11 12 13 14 15 16 17 18 19 20
21 22 23 24 25 26 27 28 29 30 31 32 33 34 35 36 37 38 39 40
41 42 43 44 45 46 47 48 49 50

What Do Schoolteachers and Sumo Wrestlers Have in Common?
How Is the Ku Klux Klan Like a Group of Real-Estate Agents?
Why Do Drug Dealers Still Live with Their Moms?
Where Have All the Criminals Gone? What Makes a Perfect Parent? Would a Roshanda by Any Other Name
Smell as Sweet?
Increasing Residual Wage Inequality: Composition Effects, Noisy Data, or Rising Demand for Skill?
Medium-Term Business Cycles Can Information Heterogeneity Explain the
Exchange Rate Determination Puzzle? Media Frenzies in Markets for Financial
Information An Efficient Dynamic Auction for
Heterogeneous Commodities Matching and Price Competition Paying Not to Go to the Gym On the Simple Economics of Advertising,
Marketing, and Product Design

Introduction
What are the key themes of microeconomics?
What is a market?What is the difference between real and
nominal prices?Why study microeconomics?
Themes of Microeconomics
Microeconomics deals with limits Limited budgets Limited time Limited ability to produce
How do we make the most of limits?How do we allocate scarce resources?
Themes of Microeconomics
Workers, firms and consumers must make trade-offs Do I work or go on vacation? Do I purchase a new car or save my money? Do we hire more workers or buy new
machinery?
How are these trade-offs best made?


Themes of Microeconomics
Consumers Limited incomes Consumer theory – describes how
consumers maximize their well-being, using their preferences, to make decisions about trade-offs
How do consumers make decisions about consumption and savings?

Themes of Microeconomics
Workers Individuals decide when and if to enter the
workforceTrade-offs of working now or obtaining more
education/training What choices do individuals make in terms of
jobs or workplaces? How many hours do individuals choose to
work?Trade-off of labor and leisure

Themes of Microeconomics
Firms What types of products do firms produce?
Constraints on production capacity and financial resources create needs for trade-offs
Theory of the Firm – describes how these trade-offs are best made

Themes of Microeconomics
Prices Trade-offs are often based on prices faced
by consumers and producers Workers make decisions based on prices for
labor – wages Firms make decisions based on wages and
prices for inputs and on prices for the goods they produce

Themes of Microeconomics
Prices How are prices determined?
Centrally planned economies – governments control prices
Market economies – prices determined by interaction of market participants
Markets – collection of buyers and sellers whose interaction determines the prices of goods

Theories and Models
Economics is concerned with explanation of observed phenomena Theories are used to explain observed
phenomena in terms of a set of basic rules and assumptions:
The Theory of the Firm The Theory of Consumer Behavior

Theories and Models
Theories are used to make predictions Economic models are created from theories Models are mathematical representations
used to make quantitative predictions
Black-Scholes Option Pricing Model

Theories and Models
Validating a Theory The validity of a theory is determined by the
quality of its prediction, given the assumptions
Theories must be tested and refined Theories are invariably imperfect – but gives
much insight into observed phenomena
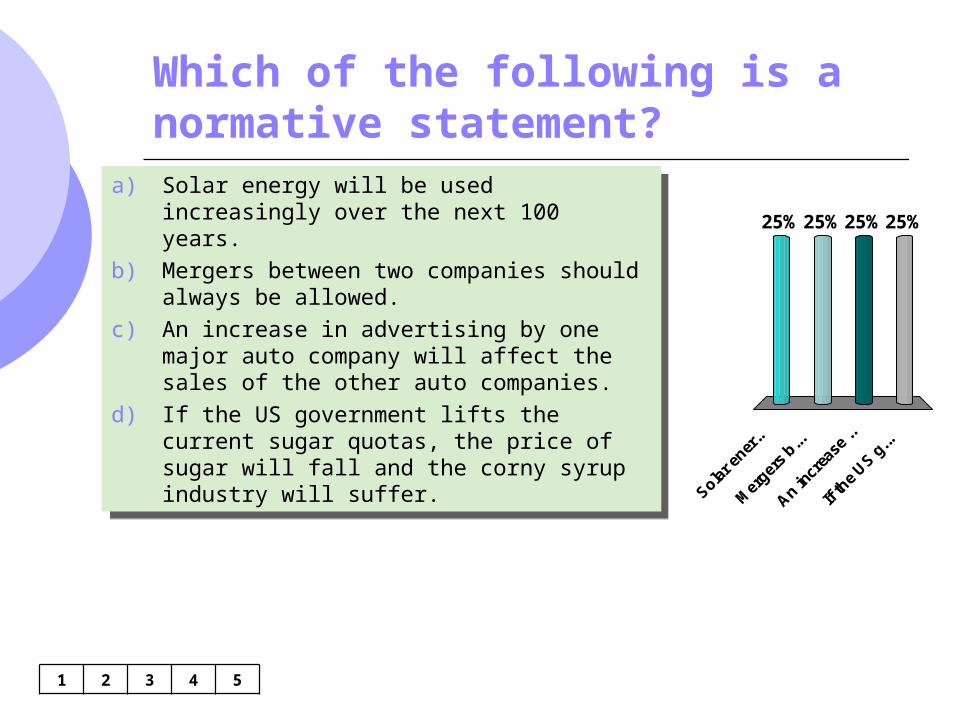
Which of the following is a normative statement?
1 2 3 4 5
Sola
r ener
..
Mer
gers
b...
An in
crea
se ..
If th
e US g
...
25% 25%25%25%a) Solar energy will be used increasingly over
the next 100 years.
b) Mergers between two companies should always be allowed.
c) An increase in advertising by one major auto company will affect the sales of the other auto companies.
d) If the US government lifts the current sugar quotas, the price of sugar will fall and the corny syrup industry will suffer.
a) Solar energy will be used increasingly over the next 100 years.
b) Mergers between two companies should always be allowed.
c) An increase in advertising by one major auto company will affect the sales of the other auto companies.
d) If the US government lifts the current sugar quotas, the price of sugar will fall and the corny syrup industry will suffer.
Positive & Normative Analysis
Positive Analysis – statements that describe the relationship of cause and effect Questions that deal with explanation and
predictionWhat will be the impact of an import quota on
foreign cars?What will be the impact of an increase in the
gasoline excise tax?

Positive & Normative Analysis
Normative Analysis – analysis examining questions of what ought to be Often supplemented by value judgments
Should the government impose a larger gasoline tax?
Should the government decrease the tariffs on imported cars?

What is a Market?
Markets Collection of buyers and sellers, through their
actual or potential interaction, determine the prices of products
Buyers: consumers purchase goods, companies purchase labor and inputs
Sellers: consumers sell labor, resource owners sell inputs, firms sell goods

What is a Market?
Market Definition Determination of the buyers, sellers, and
range of products that should be included in a particular market
Arbitrage The practice of buying a product at a low
price in one location and selling it for more in another location
What is a Market?
Defining the Market Many of the most interesting questions in
economics concern the functioning of markets
Why are there a lot of firms in some markets and not in others?
Are consumers better off with many firms?Should the government intervene in markets?
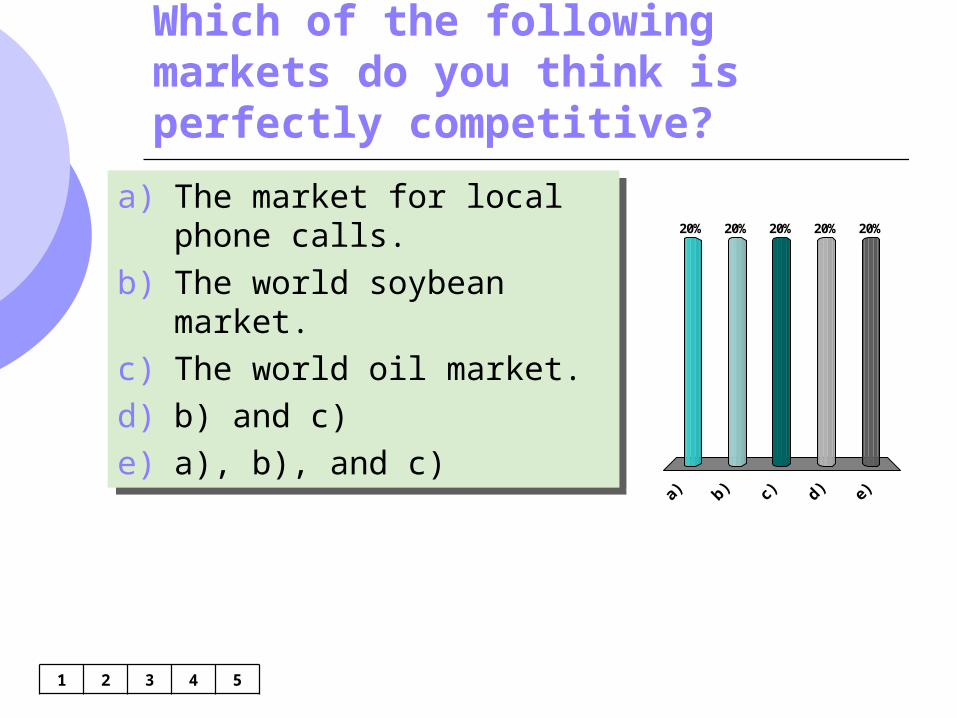
Which of the following markets do you think is perfectly competitive?
1 2 3 4 5
a) b) c) d) e)
20% 20% 20%20%20%a) The market for local phone
calls.
b) The world soybean market.
c) The world oil market.
d) b) and c)
e) a), b), and c)
a) The market for local phone calls.
b) The world soybean market.
c) The world oil market.
d) b) and c)
e) a), b), and c)
Market Model

Consider the demand for beer during the summer months. Let
Qd = 30 – 5P + 0.01I – 2R
Where Q is measured in thousands of 6-packs, P is the price per 6-pack in dollars, I is income, and R is the number of rainy days during the summer.
Supply is given by Qs = -100 + 20P
a) Plot the supply and demand curves if I = $20,000 and
R = 15. What is the equilibrium price and quantity?
b) If I = $20,000 and R = 10, plot the new demand curve and find the new equilibrium. Compare this to the original equilibrium. Does the movement in P and Q make sense with the decline in the number of rainy days?

Real Versus Nominal Prices
Comparing prices across time requires measuring prices relative to some overall price level Nominal price is the absolute or current dollar
price of a good or service when it is sold Real price is the price relative to an
aggregate measure of prices or constant dollar price

Real Versus Nominal Prices
Consumer Price Index (CPI) is often used as a measure of aggregate prices Records the prices of a large market basket
of goods purchased by a “typical” consumer over time
Percent changes in CPI measure the rate of inflation
Real Versus Nominal Prices
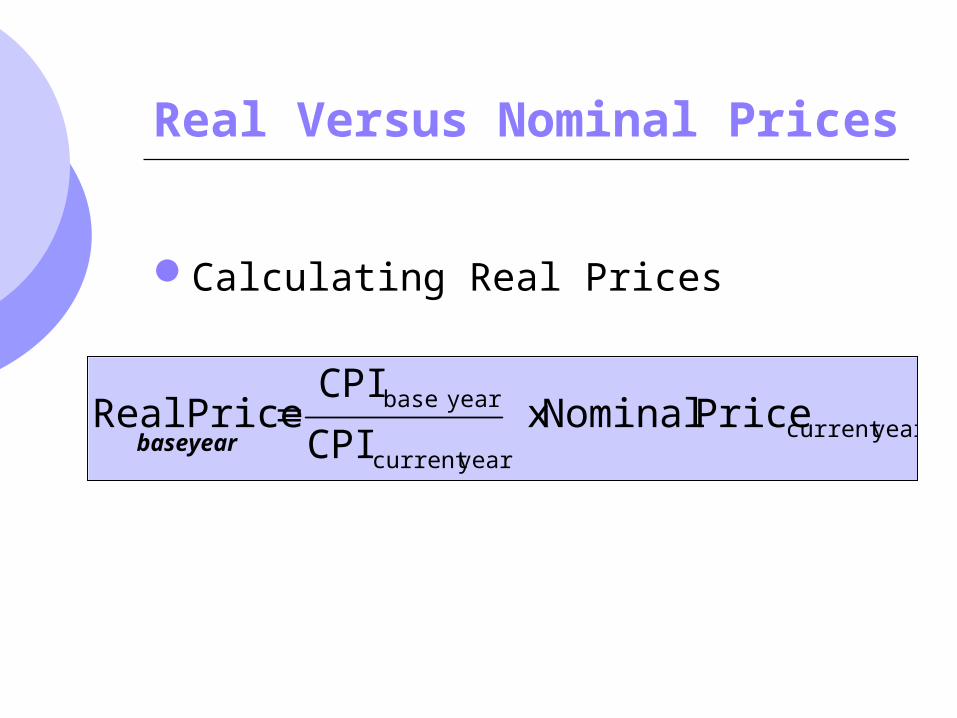
Calculating Real Prices
yearcurrent yearcurrent
yearbase Price Nominal x CPI
CPI RealPrice
baseyear

Real Price of College
Year Nom. Price
CPI Real Price
1970 $2,530 38.8
1990 $12,018 130.7
2006 $22,218 201.6
$3,569$12,018*130.738.8
$4,276$22,218*201.638.8
$2,530$2,530*38.838.8

You have been hired to examine whether consumption of gasoline has been affected by changes in the price of gasoline over time. To complete the analysis, you need to adjust nominal gasoline prices per gallon for changes in the overall price level. Use the data below to calculate the real price of gasoline for 1977 and 1989 using 1970 dollars.
Year Gasoline Price ($/gallon)
CPI (1982-84=100)
Real Price of Gasoline
1970 0.28 38.8
1977 0.58 60.6
1989 1.10 124.0
0.37
0.34

The Price of a College Education
The real price of a college education rose 69 percent from 1970 to 2006 Increases in costs of modern classrooms and
wages increased costs of production – decrease in supply
Due to a larger percentage of high school graduates attending college, demand increased

Market for a College Education
Q (millions enrolled))
P(annual cost
in 1970dollars)
D1970
S1970
S2006
D2006
$4,276
17.3
New equilibriumwas reached at $4,276 and a quantity of 17.3 million students
$2,530
8.6

Price Elasticity of Demand
Measures the sensitivity of quantity demanded to price changes It measures the percentage change in the
quantity demanded of a good that results from a one percent change in price
P
QE DDP
%
%P
Q
Q
P
PP
QQE D
P

Price Elasticity of Demand
Usually a negative number As price increases, quantity decreases As price decreases, quantity increases
When |EP| > 1, the good is price elastic |%Q| > |%P|
When |EP| < 1, the good is price inelastic |%Q| < |% P|
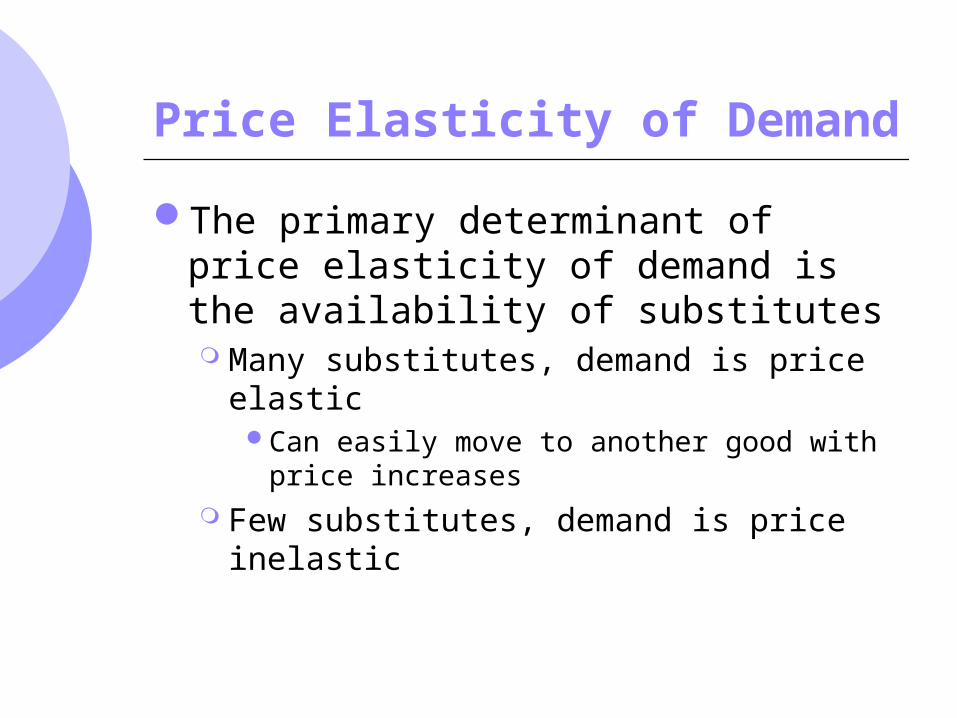
Price Elasticity of Demand
The primary determinant of price elasticity of demand is the availability of substitutes Many substitutes, demand is price elastic
Can easily move to another good with price increases
Few substitutes, demand is price inelastic

Price Elasticity of Demand
Looking at a linear demand curve, as we move along the curve Q/P is constant, but P and Q will change
Price elasticity of demand must therefore be measured at a particular point on the demand curve
Elasticity will change along the demand curve in a particular way

Price Elasticity of Demand
Q
Price
4
8
2
4
Ep = -1
Ep = 0
EP = -
Elastic
Inelastic
Demand Curve
Q = 8 – 2P
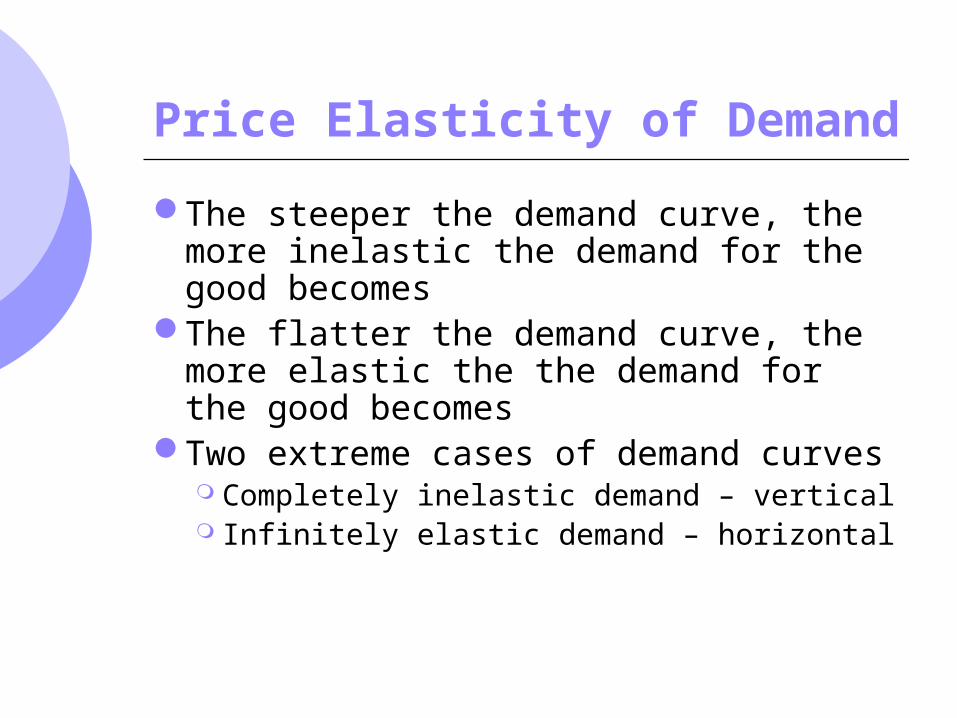
Price Elasticity of Demand
The steeper the demand curve, the more inelastic the demand for the good becomes
The flatter the demand curve, the more elastic the the demand for the good becomes
Two extreme cases of demand curves Completely inelastic demand – vertical Infinitely elastic demand – horizontal
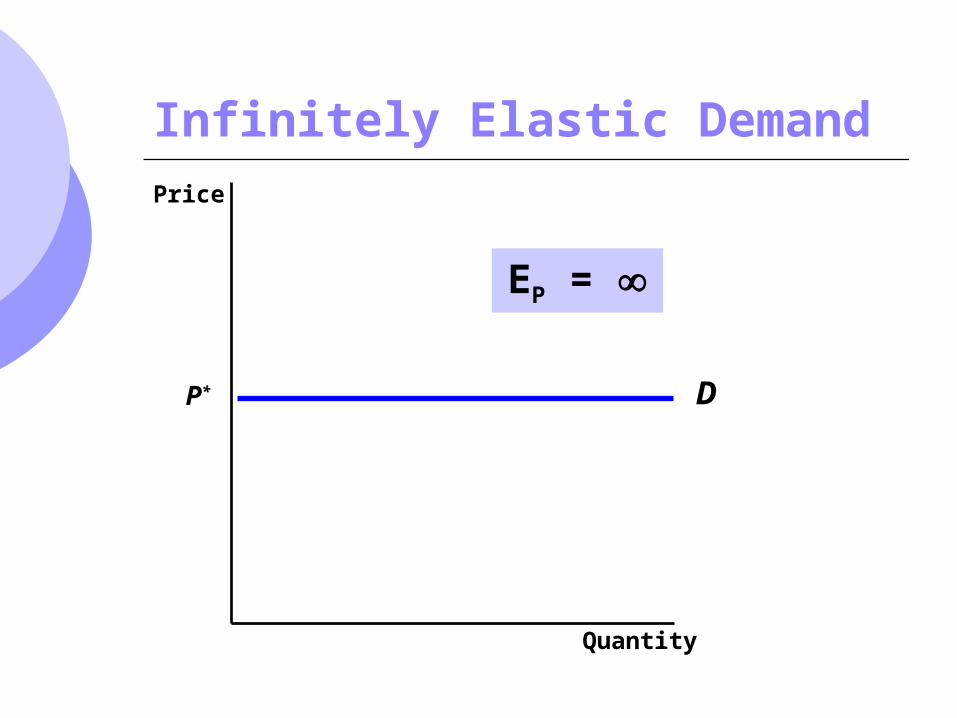
Infinitely Elastic Demand
DP*
Quantity
Price
EP =
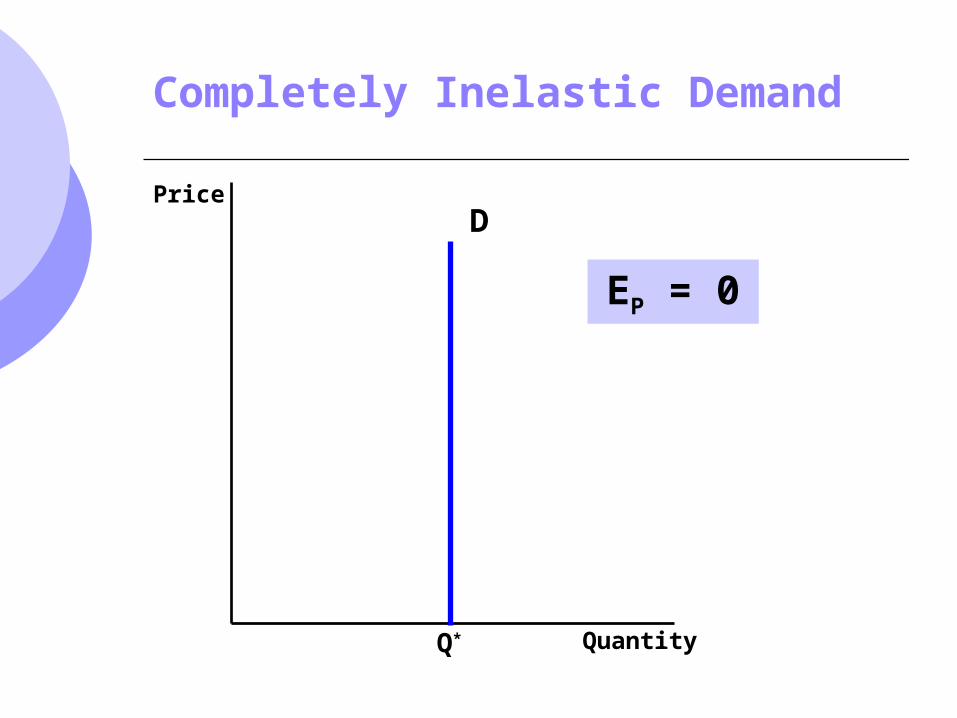
Completely Inelastic Demand
Quantity
Price
Q*
D
EP = 0

Other Demand Elasticities
Income Elasticity of Demand Measures how much quantity demanded
changes with a change in income
I
Q
Q
I
I/I
Q/Q EI

Other Demand Elasticities
Cross-Price Elasticity of Demand Measures the percentage change in the
quantity demanded of one good that results from a one percent change in the price of another good
m
b
b
m
mm
bbPQ P
Q
Q
P
PP
QQE
mb

Price Elasticity of Supply
Measures the sensitivity of quantity supplied given a change in price Measures the percentage change in quantity
supplied resulting from a 1 percent change in price
P
QE SSP
%
%
Elasticity: An Application
During the 1980’s and 1990’s, the market for wheat went through changes that had great implications for American farmers and US agricultural policy
Using the supply and demand curves for wheat, we can analyze what occurred in this market
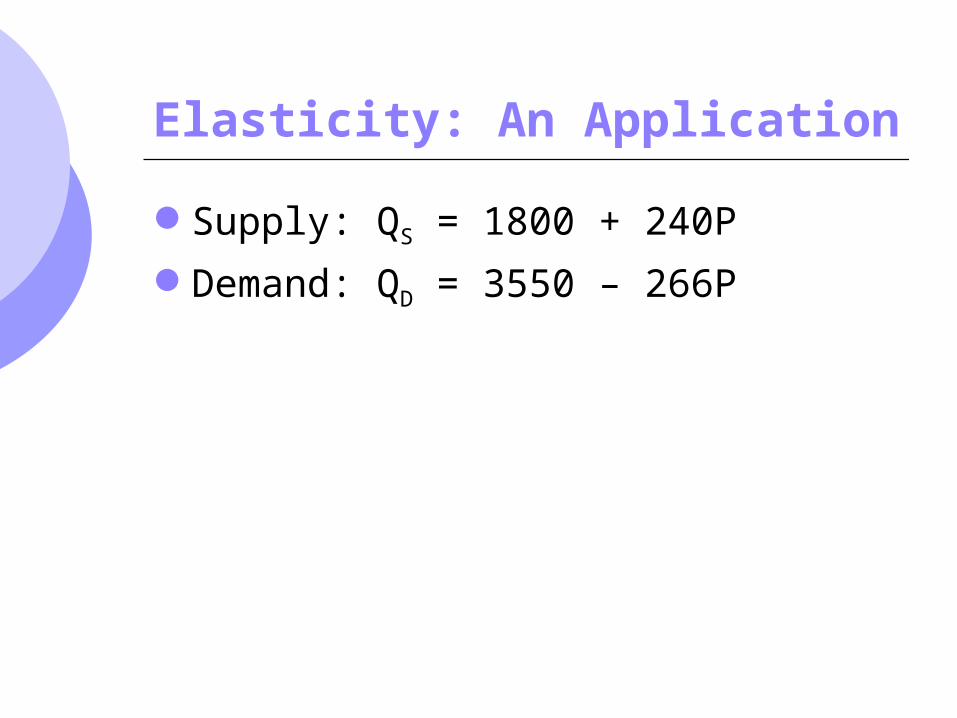
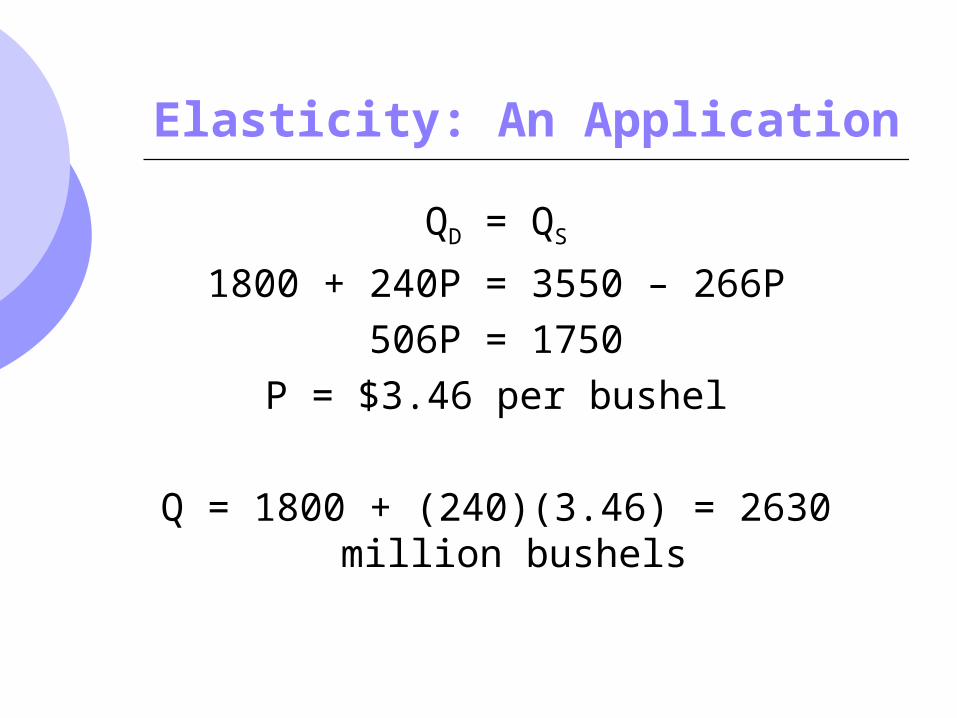
Elasticity: An Application
Supply: QS = 1800 + 240P
Demand: QD = 3550 – 266P
Elasticity: An Application
QD = QS
1800 + 240P = 3550 – 266P
506P = 1750
P = $3.46 per bushel
Q = 1800 + (240)(3.46) = 2630 million bushels
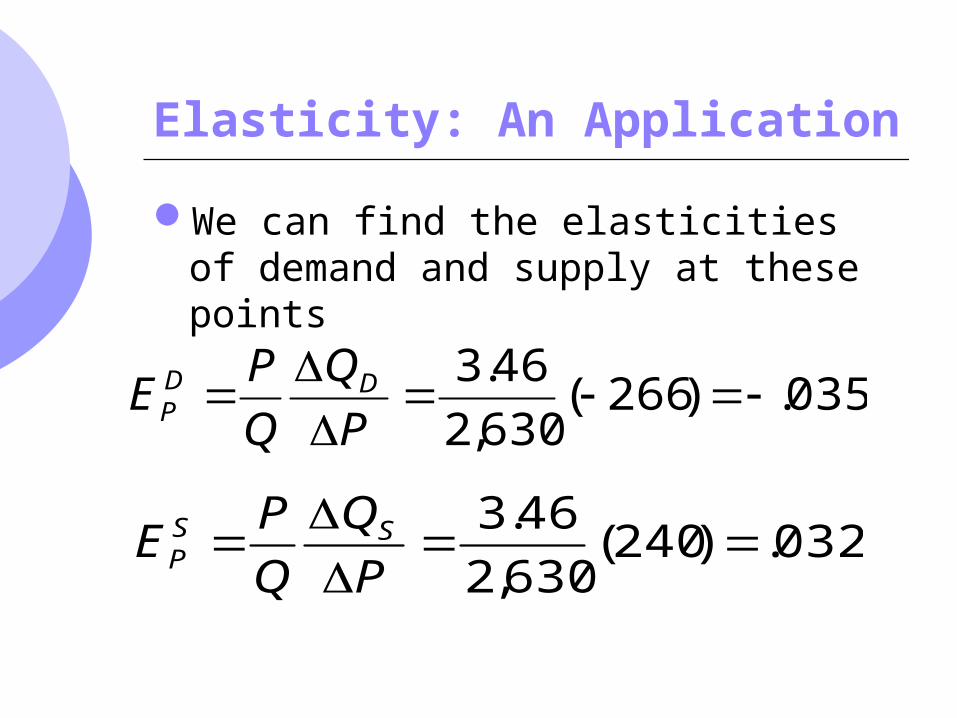
Elasticity: An Application
We can find the elasticities of demand and supply at these points
035.)266(630,2
46.3
P
Q
Q
PE DD
P
032.)240(630,2
46.3
P
Q
Q
PE SS
P
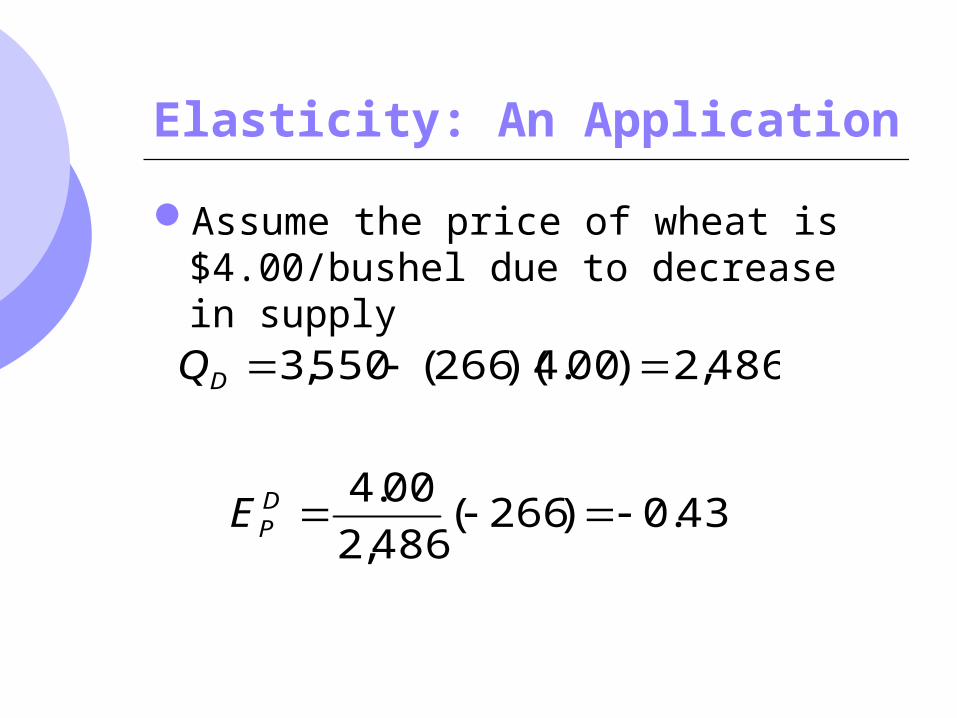
Elasticity: An Application
Assume the price of wheat is $4.00/bushel due to decrease in supply
486,2)00.4)(266(550,3 DQ
43.0)266(486,2
00.4D
PE