economic and environmental evaluations of waste treatment and disposal technologies for municipal...
TRANSCRIPT
Economic and Environmental Evaluations of WasteTreatment and Disposal Technologies for Municipal Solid
Waste
E. Daskalopoulos, O. Badr & S. D. Probert
Department of Applied Energy, School of Mechanical Engineering, Cran®eld University,Bedfordshire MK43 OAL, UK
ABSTRACT
MSW management can be de®ned as the discipline associated with thecontrol of generation, storage, collection, transfer, processing and disposalof MSW, in a way which is governed by the best principles of public health,economics, engineering, aesthetics and other environmental considerations.The disposal of MSW has been the focus of environmental policy for sev-eral industrialised countries since the mid-1970s, when attempts were madeto identify and categorise, in a systematic way, the waste fractions involved.This categorisation provided the policy makers with the necessary infor-mation, to determine the most appropriate option for dealing with the wastein a more economic and environmentally-sustainable way. This paperreviews the main economic costs and the environmental impacts of thewidely-accepted waste treatment and disposal methods. Examples of suc-cessful waste-management schemes are presented and prospective futuretrends are assessed. # 1998 Elsevier Science Ltd. All rights reserved
ABBREVIATIONS
AOX Adsorbable organic halogensBOD Biochemical oxygen-demandCOD Chemical oxygen-demandDoE Department of the Environment (UK)EC European CommissionEDF Environmental Defense Fund (USA)EPA Environmental Protection ActETSU Energy Technology Support Unit (UK)GLC Greater London CouncilHDPE High-density polyethylene
Applied Energy, Vol. 58, No. 4, pp. 209±255, 1997# 1998 Elsevier Science Ltd. All rights reserved
Printed in Great BritainP I I : S 0 3 0 6 - 2 6 1 9 ( 9 7 ) 0 0 0 5 3 - 6 0306-2619/97 $17.00+0.00
209
ILSR Institute of Local Self-Reliance (USA)IPCC Intergovernmental Panel on Climate ChangeLFG Land®ll gasMRF Materials-recovery facilityMSW Municipal solid wastePCDD Polychlorinated dibenzo-p-dioxinsPCDF Polychlorinated dibenzofuransPET Polyethylene terephathalatePVC Polyvinyl chlorideRCEP Royal Commission on Environmental Protection (UK)Nm3 One cubic metre of LFG in atmospheric pressure and 15�C
GLOSSARY
Fly ash Small solid particles of ash and soot generatedand discharged with the ¯ue gases when coal, oil,or solid wastes are burnt. With proper equipment,¯y ash is collected before it enters the atmosphere.
Diversion rate A measure of the amount of material now beingdiverted for reuse or recycling, compared withthe total amount of waste that was thrown awaypreviously.
Compaction The unit operation used to increase the speci®cweight of waste materials so that they can bestored and transported more e�ciently.
Biodegradable material A compound that can be degraded or convertedto simpler compounds by micro-organisms.
Curbside collection The collection of source separated and mixedwastes from the curbside where they have beenplaced by the householders.
Decomposition The breakdown of organic wastes by bacterial,chemical or thermal means. Complete chemicaloxidation leaves only carbon dioxide, water andinorganic solids.
Ferrous metals Metals composed predominantly of iron. In thewaste materials stream, these metals usuallyinclude tin cans, automobiles, refrigerators andother appliances.
Heavy metals Metals such as cadmium, lead, mercury whichcan be found in MSW in discarded items suchas batteries, lighting ®xtures, colorants and inks.
210 E. Daskalopoulos, O. Badr, S. D. Probert
A MAJOR PROBLEM OF OUR AFFLUENT SOCIETY
Solid-waste disposal creates di�culties primarily in highly-populatedregions: usually the more populated the area, the greater the problem (theterms refuse and solid waste are used more or less synonymously). Thecommon constituents of solid waste can be categorised in several di�erentways. The point of origin is important in some cases, so classi®cation ascommercial, domestic, institutional, industrial, street trash, demolition orconstruction may be useful. The nature of the material may be signi®cant, sogrouping can be made into organic, inorganic, combustible, non-combus-tible, putrescible and non-putrescible fractions.1
The huge quantities of solid waste to be disposed of daily, makes dealingwith waste, once it has been collected, among the most di�cult problemsconfronting local-community o�cials. An emergency situation can evolvequickly, for example, if an incinerator or a waste-disposal site was forced toshut down because of a failure to meet newly-passed environmental regula-tions. Alternatively, a crisis can build up gradually over a long period of timeif needed new facilities are not properly planned and put into service. Thereare three basic alternatives for MSW disposal:
. direct dumping of unprocessed waste in a sanitary land®ll;
. processing of the waste before ®nal disposal; and
. processing of the waste to recover resources (materials and/or energy)with subsequent disposal of the residues.
Direct haul to a sanitary land®ll is usually the cheapest disposal alter-native in terms of both operating and capital costs needed. However,land®ll space is becoming scarcer, so causing costs to rise sharply in popu-lated areas. For the second alternative, the primary aim is to reduce thevolume of waste. This reduces both the handling and ultimate-disposalcosts. However, the capital and operating costs to achieve this volumereduction are signi®cant and must be assessed relative to the savingsachieved.The third category of disposal alternatives includes those processes that
recover energy or materials from solid waste and leave only a residue forultimate disposal in a land®ll. There are signi®cant capital and operatingcosts associated with all these energy and/or materials recovery systems.However, selling both the energy and the materials will reduce the net cost ofrecovery. While resource-recovery techniques may be more costly than otherdisposal alternatives, they achieve resource conservation, and the residuals ofthe processes require much less space for land disposal than unprocessedwastes.
Waste treatment and disposal technologies for municipal solid waste 211
During the last 25 years, no dramatic changes have taken place regardingthe technologies used to treat domestic and commercial waste streams whichhave been commonly known as MSW. These methods include:
. Land®lling the waste.
. Incineration with or without energy recovery.
. Recycling or composting the relevant fractions of the waste streams.
LANDFILLING THE WASTE
In whichever form it arises, an irreducible minimum amount of MSW willprobably need to be disposed to land®lls. Land®lling is the controlled depositof waste to land in such a way that no pollution or harm results to theenvironment. The design and construction of land®ll sites therefore needs toinclude the control, in both the short and long terms, of the products ofwaste decomposition such as the liquid leachate and land®ll gas.The biological and biochemical decomposition of wastes takes place over a
number of years and during this time the nature and quantity of the gasevolved will change signi®cantly. Upon waste deposition, ambient airentrapped in the waste is consumed and rapidly (i.e. over a few days)replaced by a gas mixture containing carbon dioxide and hydrogen. With theonset of fully anaerobic conditions, typically after 3 to 12months of deposi-tion, signi®cant quantities of methane will start to be produced (stage ofmethanogenesis). The concentration of methane increases until it reachesapproximately 60±65% of the gas being produced, with a correspondingdecrease in carbon dioxide to about 35±40% of the gas. In a modern site,with a waste depth exceeding 5m and where progressively in®lling andrestoration takes place, the peak of degrative activity is normally reachedwithin ®ve years, with a gradual decline thereafter.
Environmental impacts of land®lling
Land®ll gasThe concern about the potential adverse environmental impacts of LFG isrelatively recent,2 so re¯ecting the developing awareness as a result of:
. changing practices, with the ban on burning of wastes in land®lls;
. the move to larger and deeper sites;
. the changing composition of wastes, in particular the increasing amountof organic materials such as paper and packaging; and
. the resulting need and ability to control and monitor LFG.
212 E. Daskalopoulos, O. Badr, S. D. Probert
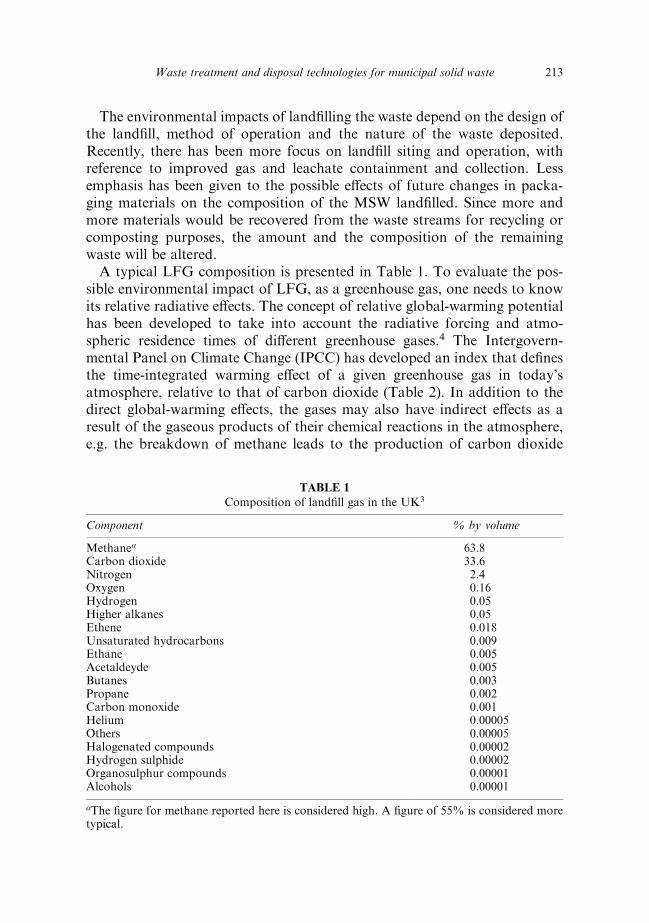
The environmental impacts of land®lling the waste depend on the design ofthe land®ll, method of operation and the nature of the waste deposited.Recently, there has been more focus on land®ll siting and operation, withreference to improved gas and leachate containment and collection. Lessemphasis has been given to the possible e�ects of future changes in packa-ging materials on the composition of the MSW land®lled. Since more andmore materials would be recovered from the waste streams for recycling orcomposting purposes, the amount and the composition of the remainingwaste will be altered.A typical LFG composition is presented in Table 1. To evaluate the pos-
sible environmental impact of LFG, as a greenhouse gas, one needs to knowits relative radiative e�ects. The concept of relative global-warming potentialhas been developed to take into account the radiative forcing and atmo-spheric residence times of di�erent greenhouse gases.4 The Intergovern-mental Panel on Climate Change (IPCC) has developed an index that de®nesthe time-integrated warming e�ect of a given greenhouse gas in today'satmosphere, relative to that of carbon dioxide (Table 2). In addition to thedirect global-warming e�ects, the gases may also have indirect e�ects as aresult of the gaseous products of their chemical reactions in the atmosphere,e.g. the breakdown of methane leads to the production of carbon dioxide
TABLE 1
Composition of land®ll gas in the UK3
Component % by volume
Methanea 63.8Carbon dioxide 33.6Nitrogen 2.4Oxygen 0.16Hydrogen 0.05Higher alkanes 0.05Ethene 0.018Unsaturated hydrocarbons 0.009Ethane 0.005Acetaldeyde 0.005Butanes 0.003Propane 0.002Carbon monoxide 0.001Helium 0.00005Others 0.00005Halogenated compounds 0.00002Hydrogen sulphide 0.00002Organosulphur compounds 0.00001Alcohols 0.00001
aThe ®gure for methane reported here is considered high. A ®gure of 55% is considered moretypical.
Waste treatment and disposal technologies for municipal solid waste 213
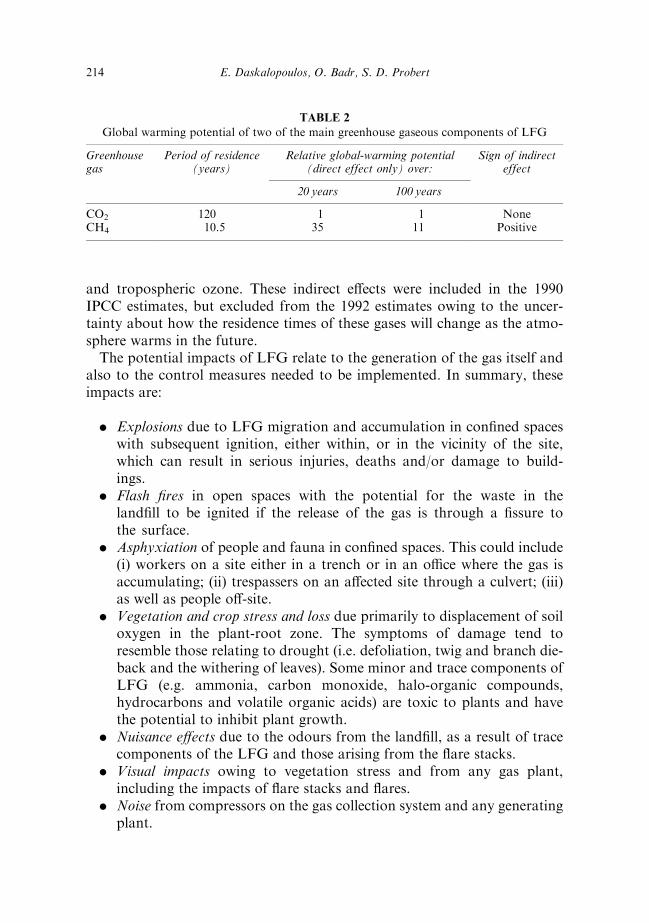
and tropospheric ozone. These indirect e�ects were included in the 1990IPCC estimates, but excluded from the 1992 estimates owing to the uncer-tainty about how the residence times of these gases will change as the atmo-sphere warms in the future.The potential impacts of LFG relate to the generation of the gas itself and
also to the control measures needed to be implemented. In summary, theseimpacts are:
. Explosions due to LFG migration and accumulation in con®ned spaceswith subsequent ignition, either within, or in the vicinity of the site,which can result in serious injuries, deaths and/or damage to build-ings.
. Flash ®res in open spaces with the potential for the waste in theland®ll to be ignited if the release of the gas is through a ®ssure tothe surface.
. Asphyxiation of people and fauna in con®ned spaces. This could include(i) workers on a site either in a trench or in an o�ce where the gas isaccumulating; (ii) trespassers on an a�ected site through a culvert; (iii)as well as people o�-site.
. Vegetation and crop stress and loss due primarily to displacement of soiloxygen in the plant-root zone. The symptoms of damage tend toresemble those relating to drought (i.e. defoliation, twig and branch die-back and the withering of leaves). Some minor and trace components ofLFG (e.g. ammonia, carbon monoxide, halo-organic compounds,hydrocarbons and volatile organic acids) are toxic to plants and havethe potential to inhibit plant growth.
. Nuisance e�ects due to the odours from the land®ll, as a result of tracecomponents of the LFG and those arising from the ¯are stacks.
. Visual impacts owing to vegetation stress and from any gas plant,including the impacts of ¯are stacks and ¯ares.
. Noise from compressors on the gas collection system and any generatingplant.
TABLE 2
Global warming potential of two of the main greenhouse gaseous components of LFG
Greenhousegas
Period of residence(years)
Relative global-warming potential(direct effect only) over:
Sign of indirecteffect
20 years 100 years
CO2 120 1 1 NoneCH4 10.5 35 11 Positive
214 E. Daskalopoulos, O. Badr, S. D. Probert
. Water pollution: carbon dioxide is highly water soluble and increases thewater's hardness, so producing an aggressive solution which acceleratescorrosion. Water pollution can also be caused by the condensate arisingfrom the de-humidi®cation process on the gas plant.
. Corrosion of equipment by minor constituent gases, including acid-forming species such as hydrogen chloride and sulphur dioxide, leadingto failure in gas abstraction and utilisation equipment.
. Health e�ects from the emissions of trace compounds and ¯are com-bustion-products. In relation to gas ¯ares, there has been concern as towhether complete combustion of the trace components takes place and,if not, whether dioxins and furans may be produced.
. Contributions of carbon dioxide and methane to the greenhouse e�ect.
Complaints by local residents about odours from land®lls have often led toquestions about health impacts. Studies suggest that the odour from LFG isassociated with a limited number of trace components which originate as themetabolic products and intermediates of degradation under anaerobic con-ditions. At a site where these processes are more e�cient, odour problemsare more likely to arise. The risk of odour occurrence is higher in the ®rstyear after deposition and it is the organosulphur compounds and esterswhich then contribute particularly to the problem. The presence of certaincompounds, while exerting no odour themselves, may in a mixture heightenresponse to other compounds. Odours can be o�ensive to the extent thatsensitive individuals can feel nauseated and, ambient dilution may be insuf-®cient to achieve signi®cant reduction of odour in the vicinity of land®llingoperations. Odours from land®lls may be experienced several kilometresfrom a site under certain adverse weather condition.5
One way of controlling the impacts of LFG is locating the site so as tominimise the number of sensitive targets in the vicinity. This ®rst miti-gation measure, must be backed by engineering and operational controls.An e�ective mitigation programme should have three main controlactivities:
. Active extraction of the gas from the waste as it is generated so as toprevent the build up of pressure and the of migration potential.
. Installation of a low-permeability barrier to prevent lateral migration.
. Monitoring gas migration by using boreholes located outside of theland®ll area.
A gas-management system should have a built-in considerable margin ofsafety and the additional support of back-up systems. A gas-management planshould be established to identify management responsibilities, monitoring
Waste treatment and disposal technologies for municipal solid waste 215
schedules, procedures in the event of an emergency and data-assessmentprotocols. In the past, there has been a tendency to install gas control meas-ures only when the gas generation rate becomes high enough to extract itactively. Much cheaper passive vent systems, as means of mitigating the on-site explosion hazard increase local hazards and/or odour nuisances. Such apractice is becoming increasingly unacceptable and many licences now con-tain conditions requiring the existence of an adequate gas-managementscheme before waste deposition commences.Odour problems can be mitigated by e�ective and frequent waste covering
during ®lling, as well as by the ®nal cover over the land®ll. Fine-grainedmaterials can be particularly e�ective in attenuating odour. However, thismay not be compatible with other objectives, such as the reduction of rain-water in®ltration. Clay capping may prevent water ingress, but cracking ofthe surface during drying or settlement can lead to gas escape withoutattenuation of the trace components. Flaring of LFG can also provide amitigation of the odour problem. The use of chemicals to mask LFG odourshas been tried, although in some cases the odours from these chemicals maybe equally objectionable. A limited evaluation to determine the level ofodour emissions from a land®ll can be obtained by continuous methanemonitoring of the ambient air. Generally odours are detectable when thedilution of LFG indicated by the ambient methane levels is of the same orderof magnitude as that suggested by comparing the gas analysis with individualodour thresholds.6,7 De-odorisation of collected gas can be achieved by:
. wet gas scrubbing;
. thermal oxidation;
. activated carbon ®ltration; or
. bio®ltration.
The objectives of LFG monitoring are to check that the control measuresadopted remain e�ective and to identify any loss in e�ciency in the controlsystem. Any monitoring programme must be site speci®c, and the location ofmonitoring points are usually determined from the initial site investigationand baseline survey. Guidance is available for the principles of monitoringrelated to various sets of objectives, monitoring frequency, instruments,techniques, recommended spacing of monitoring boreholes and data inter-pretation. The details of the monitoring programme are usually thoserequired by the licence conditions for the site, but still they may prove to beinadequate. It is also important that the monitoring programme is ¯exibleenough to cope with possible changing conditions.The proposed EC land®ll directive8 refers to the need to avoid the accu-
mulation of LFG, the requirement for the gas generated to be collected and
216 E. Daskalopoulos, O. Badr, S. D. Probert
for post-closure monitoring. However, the policy regarding gas controlappears only to be secondary to leachate control and protection of thegroundwater resource. Nevertheless, some engineering containment mea-sures, designed primarily to control leachate migration, do play a major rolein controlling the lateral migration of LFG.The current legislation, in many European countries and in the United
States, requires testing for certain speci®ed hazardous air-contaminants at allactive and some inactive MSW disposal sites,9 in order to determine:
. if there is any underground gas migration through the site's perimeter;
. the composition of gas streams inside the land®ll and the amount anddistribution of hazardous materials in the land®ll; and
. the concentrations of speci®ed air contaminants in the ambient air andthe e�ect of the site on the surrounding air's quality.
LeachateLeachate pollution is the result of a mass-transfer process. Waste enteringthe land®ll reactor undergoes several transformations which are controlledby, among other in¯uencing factors, the water input ¯uxes. In the reactor,three physical phases are present: the solid waste, the liquid leachate and theland®ll gas. The liquid phase is enriched by soluble or suspended organicmatter and inorganic ions from the solid phase. At present, restrictions areimposed upon the discharge of leachate into the environment as a result of:10
. many severe cases of groundwater pollution at land®lls;
. the greater hazard posed by the present trend of using large-size land-®lls;
. the need to comply with the increasingly-restrictive legislation regardingthe quality of waste-water discharges; and
. the implementation of an integrated waste-management strategy resultsin the volume of waste being reduced but then a greater proportion ofthe waste being land®lled will be hazardous.
Important variations in leachate generation which cannot be accounted forby the stated assumptions, may occur. For example, in practice, not all of theabsorptive capacity of waste may be utilised, as water input to the site mayin®ltrate to the base of the site via preferential high-permeability pathways(e.g. if signi®cant quantities of construction wastes are land®lled) and con-sequently, signi®cant quantities of leachate may accumulate locally withinthe site. In addition, during the early stages of ®lling, leachate may be gen-erated during periods of above-average rainfall or possibly owing to thecompaction of wastes near the site's base as ®lling proceeds.
Waste treatment and disposal technologies for municipal solid waste 217
Table 3 presents an example of leachate composition from the degradationof di�erent waste components in a land®ll site. Predicting the quality of lea-chate is almost as di�cult as predicting its quantity, as it varies with the rateof digestion of the waste within the site. Studies have indicated that widevariations in leachate composition occur both spatially across a site, season-ally, and with the age of the site.11 However, an assessment of potential lea-chate quality is important to aid in land®ll design and particularly in thechoice of a leachate-treatment system.The leachate will start to leak if a failure in the leachate-management sys-
tem (e.g. the base liner) occurs. It is generally agreed that all membrane linerswill leak, not through the intact membrane, but through holes or otherdefects. It has been suggested12 that, depending on quality control, there canbe 2 to 50 holes per hectare of which two thirds are associated with seams.Typical causes for these leak paths are:
. poor sealing of joints;
. puncturing during installation;
. settlement;
. chemical attack; and
. uplift from gas beneath the liner.
Clean-up costs are only a crude surrogate for damage costs. Technically,economic damage is measured by willingness to pay to avoid damage orwillingness to accept compensation for the damage su�ered. These need notcoincide with the costs of clean-up or even with the legally-determineddamages. Ground-water contamination is likely to be more expensive tomitigate than surface water contamination. The former will involve large ret-ro®tting costs at the land®ll site in addition to clean up costs relating to theground-water supply (e.g. the introduction of granular activated carbon plantsor other puri®cation measures). Surface water contamination will typicallyinvolve only land®ll retro®t costs and short-run water supply diversion costs.13
If a synthetic liner is holed, leachate leakage may produce a particularlylarge and acute release, which compares unfavourably with the type of slowand gradual leachate leakage which is characteristic of a land®ll site with alow permeability natural barrier. The use of a layer of clay beneath the mem-brane, and bentonite-impregnated mats, can signi®cantly reduce leachateleakage impact. The key components of a leachate-management scheme are:
. Minimisation of leachate generation: by the control of surface andgroundwater inputs; minimisation of amount of precipitation cominginto contact with waste by use of small cells; phased disposal andprogressive restoration; use of a low-permeability cap; shaping of a ®nal
218 E. Daskalopoulos, O. Badr, S. D. Probert
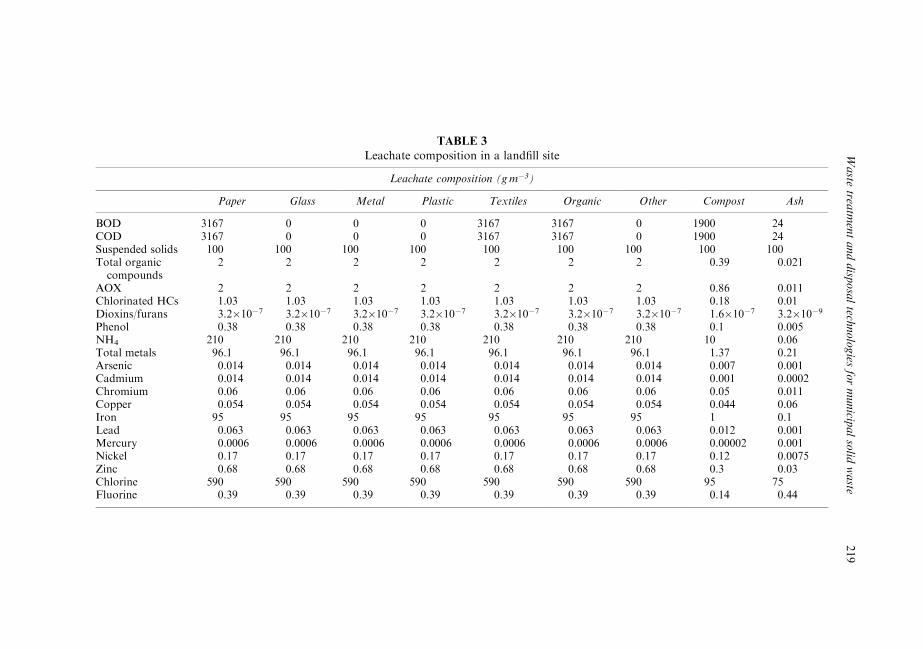
TABLE 3
Leachate composition in a land®ll site
Leachate composition (gmÿ3)
Paper Glass Metal Plastic Textiles Organic Other Compost Ash
BOD 3167 0 0 0 3167 3167 0 1900 24COD 3167 0 0 0 3167 3167 0 1900 24Suspended solids 100 100 100 100 100 100 100 100 100Total organic
compounds2 2 2 2 2 2 2 0.39 0.021
AOX 2 2 2 2 2 2 2 0.86 0.011Chlorinated HCs 1.03 1.03 1.03 1.03 1.03 1.03 1.03 0.18 0.01Dioxins/furans 3.2�10ÿ7 3.2�10ÿ7 3.2�10ÿ7 3.2�10ÿ7 3.2�10ÿ7 3.2�10ÿ7 3.2�10ÿ7 1.6�10ÿ7 3.2�10ÿ9Phenol 0.38 0.38 0.38 0.38 0.38 0.38 0.38 0.1 0.005NH4 210 210 210 210 210 210 210 10 0.06Total metals 96.1 96.1 96.1 96.1 96.1 96.1 96.1 1.37 0.21Arsenic 0.014 0.014 0.014 0.014 0.014 0.014 0.014 0.007 0.001Cadmium 0.014 0.014 0.014 0.014 0.014 0.014 0.014 0.001 0.0002Chromium 0.06 0.06 0.06 0.06 0.06 0.06 0.06 0.05 0.011Copper 0.054 0.054 0.054 0.054 0.054 0.054 0.054 0.044 0.06Iron 95 95 95 95 95 95 95 1 0.1Lead 0.063 0.063 0.063 0.063 0.063 0.063 0.063 0.012 0.001Mercury 0.0006 0.0006 0.0006 0.0006 0.0006 0.0006 0.0006 0.00002 0.001Nickel 0.17 0.17 0.17 0.17 0.17 0.17 0.17 0.12 0.0075Zinc 0.68 0.68 0.68 0.68 0.68 0.68 0.68 0.3 0.03Chlorine 590 590 590 590 590 590 590 95 75Fluorine 0.39 0.39 0.39 0.39 0.39 0.39 0.39 0.14 0.44
Waste
treatm
entanddisp
osaltech
nologies
formunicip
alsolid
waste
219
landform to encourage surface water run-o� away from active phases;control of, or enforcing a ban on, liquid-waste inputs; and the use ofsolidi®cation/encapsulation processes as an alternative to the directland®lling of the waste.
. Containment of leachate within the land®ll: by the use of a double orcomposite liner system incorporating protection of the synthetic liner;construction of the liner above the maximum groundwater recoverylevel; retention of su�cient unsaturated zone to provide for attenuationof leachate; perimeter and cell bunding with low permeability bundwalls; and employment of low permeability caps and quality control ofliner installation.
. Control over leachate quality: by undertaking leaching tests on incomingwastes, refusing to accept speci®c wastes and stopping leachate recircu-lation.
. Collection and disposal of leachate as it is generated: via collection pipe-work system or leachate collection-sumps within each phase, and sui-table pumps for the removal of leachate to be treated prior to dischargeto the sewer system.
. Monitoring: the leachate monitoring is carried out by measuring thehead of leachate.
. Contingency plans in the event of groundwater contamination beingdetected.
Examples of successful land®ll operations in the European Union
Over the past 20 years, the environmental requirements relating to land®llshave been made more stringent. The oil crises of 1970s resulted in signi®cante�orts to save energy, and increased research and development of pro-grammes for the utilisation of alternative energy sources. In this context, theexploitation of LFG began in early 1975. Some representative land®ll sites,5
where LFG is exploited for energy purposes, are:
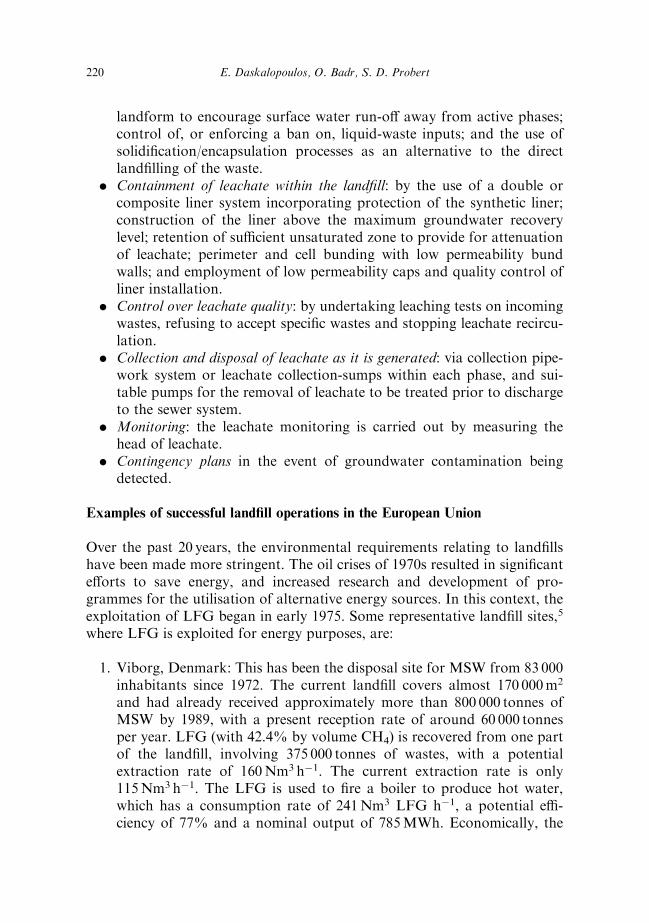
1. Viborg, Denmark: This has been the disposal site for MSW from 83 000inhabitants since 1972. The current land®ll covers almost 170 000m2
and had already received approximately more than 800 000 tonnes ofMSW by 1989, with a present reception rate of around 60 000 tonnesper year. LFG (with 42.4% by volume CH4) is recovered from one partof the land®ll, involving 375 000 tonnes of wastes, with a potentialextraction rate of 160Nm3 hÿ1. The current extraction rate is only115Nm3 hÿ1. The LFG is used to ®re a boiler to produce hot water,which has a consumption rate of 241Nm3 LFG hÿ1, a potential e�-ciency of 77% and a nominal output of 785MWh. Economically, the
220 E. Daskalopoulos, O. Badr, S. D. Probert
site has not proven successful due to its high capital cost and the low¯ow gas achieved.
2. Modena, Italy: This site includes three parts, two of which are alreadycompleted: it received 1 500 000 tonnes of MSW between the years 1973and 1989. Only one of these two parts is presently exploited for LFGrecovery. This site now receives approximately 250 000 tonnes of wasteper year. The current extraction rate is 370Nm3hÿ1 or 9000Nm3 dayÿ1
with a methane content of 52% by volume. The extracted LFG is usedin one gas engine with a nominal output of 217 kW, to produce part ofthe electricity demand for the site.
3. Eberstadt, Germany: This site covers an area of 200 000m2. It receivesapproximately 130 000m3 of MSW annually, with a total estimatedcapacity of 3 200 000m3 of MSW. The present gas abstraction rate isapproximately 700Nm3hÿ1 and the abstracted LFG has a methane con-tent of 54% by volume. The gas is ®red in two engines, each consuming290m3 LFG hÿ1 to generate electricity. Approximately 9000MWh ofelectricity is produced and distributed to the public network each year.Economically, this site has been only marginally cost-e�ective.
4. Pur¯eet Board Mill, UK: This site covers approximately 240 000m2
and has a capacity of 3 000 000m3 of MSW. The site was receivingwaste until 1987 and the produced LFG has a methane content of 48%by volume. The LFG is used in a nearby paper mill to ®re a gas turbineand a water-tubed boiler coupled to a steam turbine. Both turbinesgenerate electricity to meet most of the electricity demands of the plant.The gas turbine consumes 243TJ of LFG and 7TJ distillate fuel oil peryear to produce around 25 500 electric MWh. The boiler consumes211TJ of LFG and 770TJ of fuel oil to generate 445 000 tonnes ofsteam. From the 53 tonnes of steam produced per hour, 36 tonnes areused in the steam turbine to generate around 41 000 electric MWh.Economically, this combined heat and power (CHP) installation is agreat success.
5. Packinghton, UK: This site has an area of 1 550 000m2 and receivesaround 600 000 tonnes of MSW annually. The produced LFG has amethane content of 42.5% by volume and is used to drive a gas turbine.The turbine receives approximately 56 700m3 LFG dayÿ1, while gen-erating 31 200MWh of electricity per year.
Economics of land®lling MSW
The analysis of land®ll costs is considered under six sections which conformto the generally-accepted stages of land®ll development and operation14,15 inthe UK:
Waste treatment and disposal technologies for municipal solid waste 221
. Site acquisition costs: In general prospective operators are concernedwith three main factors in valuing a voidspace:Ð the capacity of the voidspace;Ð the types and quantities of waste to be disposed; andÐ accessibility relative to urban and industrial locations, which gen-
erate the wastes in question.
Although the waste density is typically assumed to be about1 tonnemÿ3, valuations obviously ¯uctuate considerably around this®gure, depending mainly on the types of wastes to be handled. Thescarcity of new land®ll sites leads to an increase in acquisition costs. Asthe waste-management industry develops, the control over disposalcapacity is increasingly recognisable as a valuable asset. However, thealternative to the capital purchase of a site is to lease it: in which case,the payment of royalties on a regular basis throughout the life of the sitewould replace the single up-front commitment. It is di�cult to general-ise about the pros and cons of royalty payments in comparison withpurchase prices. The main di�erence is the pattern of spending, andhence the average annual cash-¯ow.
. Assessment costs: The allowance for site assessment is very modest incomparison with the total costs (i.e. less than 1% of total costs). How-ever, these exercises are vitally important to the overall ®nancial successof the operation. Improperly conducted site investigations, includinggeological and hydrogeological surveys, can result in incompleteunderstanding of the environmental risks of operation and consequentlyinappropriate site design. Planning legislation now requires an environ-mental assessment for developments of this nature.
. Development costs: The major expenses during this stage are for sitelining, leachate-collection and treating systems and land®ll gas-man-agement systems. These three areas account for nearly 90% of the totaldevelopment costs. A composite liner consisting of natural clay and highdensity polyethylene is assumed, which strictly would not be required inevery situation although it is increasingly the standard approach. In thecourse of the technical assessment, the risk to the local environment of aliner failure has to be assessed and a decision made on the liner systemto be employed. The proposed EC land®ll directive3 speci®es criteria forsite containment which make composite liners a recommended choice.
. Operation costs: Expenditure on daily operation is the largest cost incur-red over the lifetime of a land®ll. Operating costs will vary from year toyear depending on ¯uctuations in waste intake rates and other local con-ditions. All major components of plant and equipment are assumed to beleased and usually appear as operating items instead of capital outlays.
222 E. Daskalopoulos, O. Badr, S. D. Probert
. Restoration costs: The cost of restoration is primarily the cost of cap-ping the site, which in our analysis, has an underlayer of clay and a twometer thick top layer of soil. No speci®c land use after restoration isassumed. The requirement for restoration expenditure relative to dis-counted costs is small (i.e. less than 5%).16
. Aftercare costs: Proper site development and operation should minimisethe need for aftercare expenditure, but a certain amount of monitoringwill always be required. For example, in the UK, under conditionsestablished in the EPA 1990, licensing authorities are under no obliga-tion to issue a certi®cate of land®ll completion until they are satis®edthat there are no further threats to the local environment. An aftercareperiod of 30 years has been assumed, but it should be recognised thatthere is no agreement on the precise time that would be required beforeleachate and gas were satisfactorily controlled. The 7th Draft of the ECland®ll directive8 called for a 50 year monitoring period: 30 years underthe care of the operator and the remaining 20 years under the super-vision of the licensing authority. The e�ect of extending the aftercareperiod does little to alter discounted costs, because these are incurredwell into the future. What is most important to the operator and indeedto the licensing authority, is having to ensure that the funds are avail-able when they are required. To guarantee that, the licensing authorityis likely to require that a fund be established and contributed to duringthe operational lifetime of the facility. This additional fund could be inthe form of a ®xed land®ll tax per tonne of input tonne of waste, as thishas been introduced in the UK. However, only a small percentage of theland®ll tax collected goes towards paying for environmental improve-ment projects, while the majority of it is going directly to the UKTreasury.
Modern land®ll husbandry represents a considerable commitment of pro-fessional and ®nancial resources for an operator, if it is to be commerciallysuccessful and environmentally acceptable. Land®lls of this size (i.e. with anannual acceptance of 200 000 tonnes of waste) are operated in phases. Eachphase consists of about 12 months of in®lling, supplemented by severalmonths of development and restoration, giving an appropriate timespan of18months for each phase. There is a distribution of the development andrestoration costs over the operational life of the facility.
Future trends for LFG operations schemes
Finding a suitable site for a land®ll is becoming more and more a problem,due to the local opposition for such operations in their ``backyards''. Thestrict regulation standards imposed in almost all industrialised countries
Waste treatment and disposal technologies for municipal solid waste 223
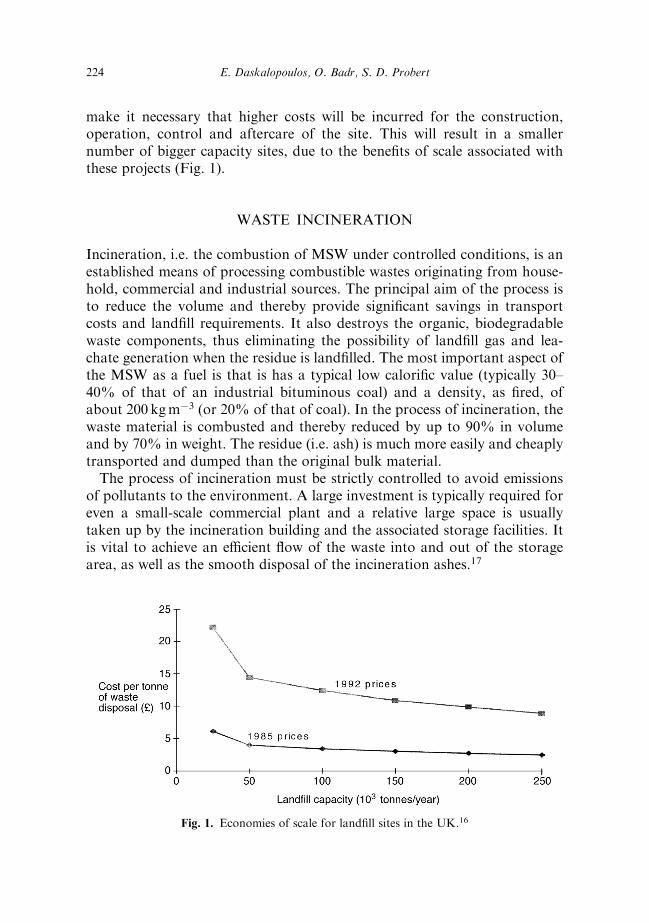
make it necessary that higher costs will be incurred for the construction,operation, control and aftercare of the site. This will result in a smallernumber of bigger capacity sites, due to the bene®ts of scale associated withthese projects (Fig. 1).
WASTE INCINERATION
Incineration, i.e. the combustion of MSW under controlled conditions, is anestablished means of processing combustible wastes originating from house-hold, commercial and industrial sources. The principal aim of the process isto reduce the volume and thereby provide signi®cant savings in transportcosts and land®ll requirements. It also destroys the organic, biodegradablewaste components, thus eliminating the possibility of land®ll gas and lea-chate generation when the residue is land®lled. The most important aspect ofthe MSW as a fuel is that is has a typical low calori®c value (typically 30±40% of that of an industrial bituminous coal) and a density, as ®red, ofabout 200 kgmÿ3 (or 20% of that of coal). In the process of incineration, thewaste material is combusted and thereby reduced by up to 90% in volumeand by 70% in weight. The residue (i.e. ash) is much more easily and cheaplytransported and dumped than the original bulk material.The process of incineration must be strictly controlled to avoid emissions
of pollutants to the environment. A large investment is typically required foreven a small-scale commercial plant and a relative large space is usuallytaken up by the incineration building and the associated storage facilities. Itis vital to achieve an e�cient ¯ow of the waste into and out of the storagearea, as well as the smooth disposal of the incineration ashes.17
Fig. 1. Economies of scale for land®ll sites in the UK.16
224 E. Daskalopoulos, O. Badr, S. D. Probert
Energy recovery from the operation of an incinerator can provide a sig-ni®cant economic bene®t, and thus help in decreasing the di�erence in costbetween incineration and land®lling. The residual ash resulting from theincineration of household waste can be further processed to recover ferrousmetals but otherwise has little value. Nevertheless, it has found limited use asa low-grade aggregate in the construction industry and, generally, is disposedof as a cover material for land®lls. The ¯y ash, captured during ¯ue cleaningoperations, can contain heavy metals at high concentrations. Concern overthe toxicity of the constituents of the ash has led to the introduction ofnational legislation by several countries to control its disposal. Major incin-erator manufacturers are therefore investigating alternative post-treatmenttechnologies for incinerator residues, including solidi®cation and vitri®cationprocesses to form stable by-products suitable for construction use.
Environmental impacts
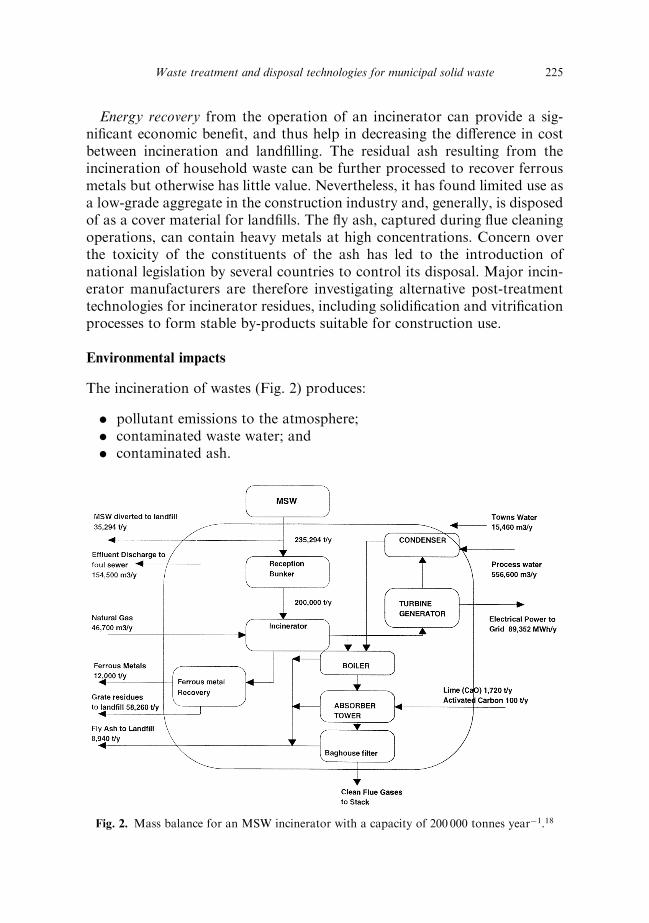
The incineration of wastes (Fig. 2) produces:
. pollutant emissions to the atmosphere;
. contaminated waste water; and
. contaminated ash.
Fig. 2. Mass balance for an MSW incinerator with a capacity of 200 000 tonnes yearÿ1.18
Waste treatment and disposal technologies for municipal solid waste 225
Air pollution during waste incineration may occur in various ways:
. Odour, dust and litter problems may arise during the discharge, storageand handling of the waste.
. The gas stream while passing through the waste may extract ash, dustand char and carry them into the ¯ue gas stream.
. Metals and metal compounds may evaporate in the furnace to condenseeventually in the colder parts of the ¯ues and generate an aerosol ofsub-micron particles.
. Waste may include compounds containing chlorine, ¯uorine, sulphur,nitrogen and other elements which could result in the generation oftoxic or corrosive gases. Nitrogen oxides may form at the temperaturesof the ¯ame.
. The pyrolysis products arising during the thermal decomposition ofwaste may be combusted incompletely, so resulting in the emission ofcarbon monoxide, volatile organic compounds such as polycyclic aro-matic hydrocarbons, dioxins and furans, tar and soot particles.
The hydrocarbons that cause most concern are polychlorinated dibenzo-p-dioxins (PCDD) and polychlorinated dibenzofurans (PCDF), commonlyknown as dioxins and furans respectively. They are formed as a result ofincomplete combustion and both are found in ¯ue gases and the ¯y ash. Thee�ects that these compounds can have on human health vary from causingskin disease and liver disorders to cancer.Of concern are also the emissions of particulates or dust, acidic gases (such
as hydrogen chloride, hydrogen ¯uoride and sulphur dioxide) and heavymetals (such as mercury, cadmium and lead). In addition, the combustione�ciency is limited by the emission of carbon monoxide and organic carbon.The origin of hydrogen chloride (HCl ) in ¯ue gases from incinerators has
been the subject of much research due to its corrosive nature at low tem-perature (e.g. dew-point corrosion) and high temperature when it dissolves inmolten salts.19 The major source of HCl is regarded as PVC plastic, and adirect relationship between HCl in the ¯ue gas and PVC in the waste hasbeen demonstrated.20 It has been shown21 that HCl is important in the high-temperature corrosion of metal surfaces such as heat exchangers. High-tem-perature corrosion involves a series of interactions between metal, scaledeposits, slag deposits and ¯ue gases. The rate of corrosion is in¯uenced bytemperature, the presence of low melting phases such as alkali bisulphate andpyrosulfates, the nature of the metal and the periodic occurrence of reducingconditions. The low-melting phases are eutectic mixtures formed betweenmetal salts and the metal surface, with metal chlorides as the most likelysource of molten salt corrosion because of their low melting points.
226 E. Daskalopoulos, O. Badr, S. D. Probert
Hydrogen ¯uoride (HF ) is even more reactive and corrosive than HCl andarises from the combustion of ¯uorinated hydrocarbons. Emission levels ofbetween 3 and 5mgNmÿ3 of ¯ue gases have been reported as typical averagevalues. HF can be controlled by scrubbing the ¯ue gases.20 Nitrogen oxides(NOx) arise from the nitrogen in the fuel and by the combination of theatmospheric nitrogen and oxygen present at high temperatures (i.e. thermalNOx). In practice, thermal NOx is formed almost exclusively in the ¯ame,particularly under oxidising conditions; in reducing conditions, little NOx isformed. NOx generation is increased with high-nitrogen content of the waste andhigh ¯ame temperatures. Its generation is reduced by using either low-tempera-ture combustion or high temperature combustion under reducing conditions.Chlorine, ¯uorine, sulphur and nitrogen may also occur in the bottom ash,
¯y ash, or as dust in the form of thermally-stable compounds or incorpo-rated by adsorption and reaction of for example HCl, HF and SO2 withmetal oxides and hydroxides present in the ash. The emission of these pol-lutant gases to the atmosphere contributes to the formation of acid-rain withits associated environmental damage. NO, is also responsible for the gen-eration of photochemical smog.Metals and metal compounds are present in the components of raw waste.
For example, municipal refuse may contain lead from lead-based paints;mercury and cadmium from batteries; aluminium in the form of foils, zincsheets and volatile salts. Table 4 shows the range of trace metals found inMSW from various countries. High levels can occur and the concentrationsare very variable. The extent of evaporation in the furnace depends oncomplex interrelated factors, such as operating temperature, oxidative orreductive conditions and the presence of scavengers (mainly halogens).23
The heavy metals released into the environment are associated with theemission of particulates, because volatilisation of metals occurs during the
TABLE 4
The range of trace metals in typical municipal solid waste22
Trace components Concentration (g per tonne of waste)
USA Europe
Ferrous 1000±3500 25000±75000Chromium 20±100 100±450Nickel 9±90 50±200Copper 80±900 450±2500Zinc 200±2500 900±3500Lead 110±1500 750±2500Cadmium 2±22 10±40Mercury 0.7±1.9 2±7
Waste treatment and disposal technologies for municipal solid waste 227
combustion of many wastes and subsequent condensation at lower tempera-tures and adsorption onto the ®ne particulates in the ¯ue gases. There is anincreasing concentration of metals with decreasing particle size for municipalwaste incinerators.24,25 A wide range of heavy metals, such as lead, cadmium,zinc, mercury, copper, antimony, nickel, vanadium and arsenic is present infuels as intrinsic pollutants.The rate of release of heavy metals during combustion is dictated by sev-
eral process variables. In particular, concentration of heavy metals in the fuelfeed; physical and chemical composition of the fuel feed; combustion-zonetemperature; degree of turbulence in the combustion bed; and the perfor-mance characteristic of the air pollution control device employed. In twoincineration plants wastes of similar metal concentrations but with di�erentcalori®c values were burnt. Except for the throughput, the combustionparameters were kept the same. When incinerated, the waste with the highercalori®c value, produced approximately double the concentrations of copper,zinc, cadmium and lead in the ¯ue gases compared with the lower energy-content waste (Table 5).Particulate emissions from incinerators are the most visual to the public
and often lead to complaints. The particulate emission is largely composedof ash. However, pollutants of a more toxic nature are associated withparticulate matter, either adsorbed on the surface of the particles (e.g. suchas heavy metals, dioxins and furans) or emitted as individual particles. Thedust loading of the ¯ue gases has been shown to increase with the followingfactors:27
. the ash content of the waste;
. the load factor of the incinerator;
TABLE 5
Flue-gas trace-metal concentrations for two di�erent wastes26
Concentration of trace metals influe gases particulate (g kgÿ1)
Low calorificvalue waste
High calorificvalue waste
Copper 4 8Zinc 33 76Cadmium 0.8 1.3Lead 18 26Other characteristics of the waste streamsRelative calori®c value 1 1.5Throughput (tonne hÿ1) 5.5 3.6Tfurnace (
�C) 706 726Tstack gas (
�C) 176 174
228 E. Daskalopoulos, O. Badr, S. D. Probert
. the degree of agitation of the waste;
. the degree of heterogeneity of the waste;
. too early or too late ignition;
. excessive velocity of primary air;
. improper balance between primary and secondary air;
. excessive draught or disturbance of the ®re; and
. excessive height of the steps between successive grates in the combustionchamber.
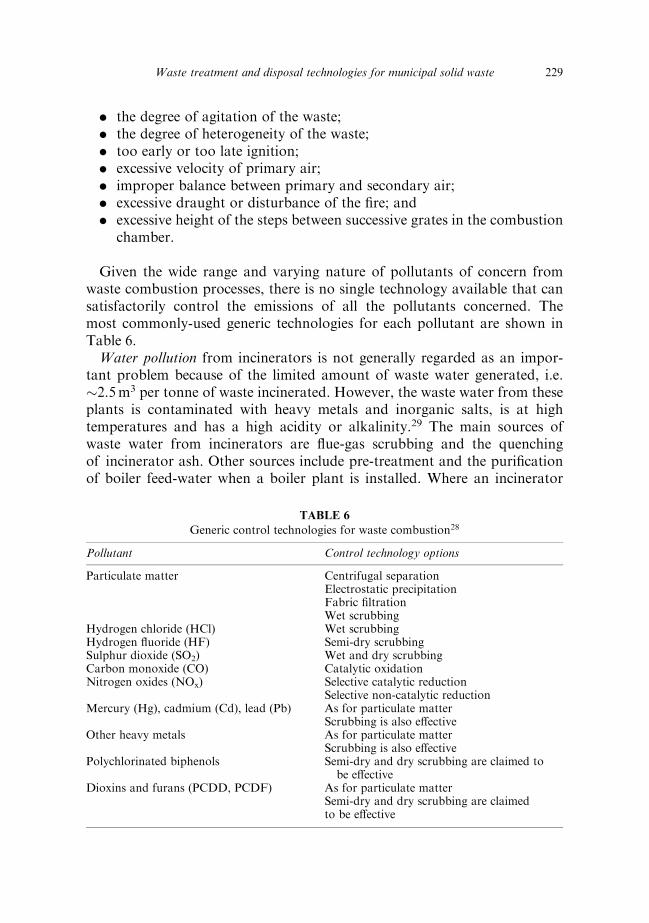
Given the wide range and varying nature of pollutants of concern fromwaste combustion processes, there is no single technology available that cansatisfactorily control the emissions of all the pollutants concerned. Themost commonly-used generic technologies for each pollutant are shown inTable 6.Water pollution from incinerators is not generally regarded as an impor-
tant problem because of the limited amount of waste water generated, i.e.�2.5m3 per tonne of waste incinerated. However, the waste water from theseplants is contaminated with heavy metals and inorganic salts, is at hightemperatures and has a high acidity or alkalinity.29 The main sources ofwaste water from incinerators are ¯ue-gas scrubbing and the quenchingof incinerator ash. Other sources include pre-treatment and the puri®cationof boiler feed-water when a boiler plant is installed. Where an incinerator
TABLE 6
Generic control technologies for waste combustion28
Pollutant Control technology options
Particulate matter Centrifugal separationElectrostatic precipitationFabric ®ltrationWet scrubbing
Hydrogen chloride (HCl) Wet scrubbingHydrogen ¯uoride (HF) Semi-dry scrubbingSulphur dioxide (SO2) Wet and dry scrubbingCarbon monoxide (CO) Catalytic oxidationNitrogen oxides (NOx) Selective catalytic reduction
Selective non-catalytic reductionMercury (Hg), cadmium (Cd), lead (Pb) As for particulate matter
Scrubbing is also e�ectiveOther heavy metals As for particulate matter
Scrubbing is also e�ectivePolychlorinated biphenols Semi-dry and dry scrubbing are claimed to
be e�ectiveDioxins and furans (PCDD, PCDF) As for particulate matter
Semi-dry and dry scrubbing are claimedto be e�ective
Waste treatment and disposal technologies for municipal solid waste 229
incorporates no form of heat recovery, the gases from the furnace are cooledby water injection. The water is evaporated completely and passes to the gasclean-up system.
Examples of successful waste incineration plants
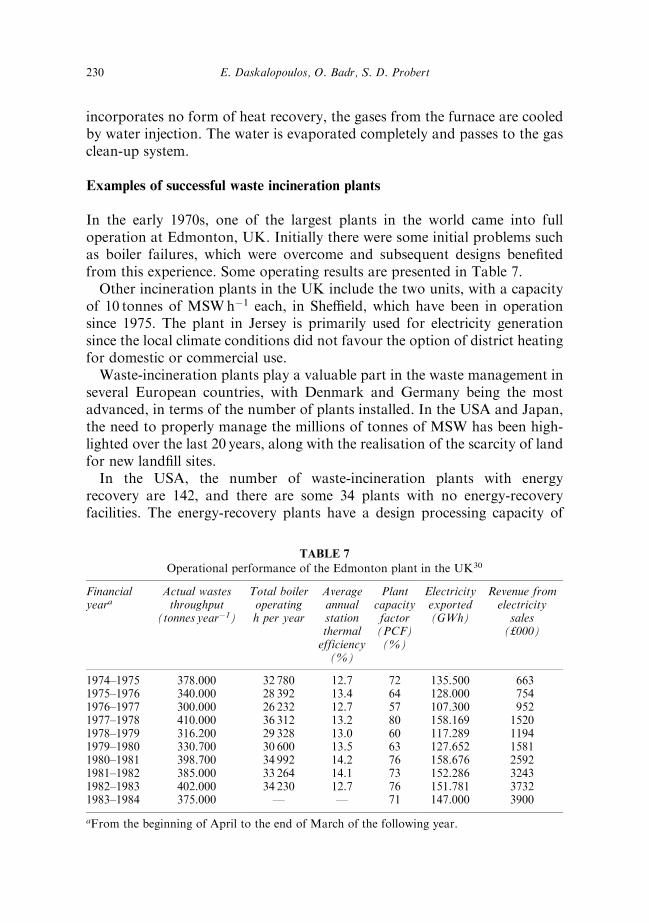
In the early 1970s, one of the largest plants in the world came into fulloperation at Edmonton, UK. Initially there were some initial problems suchas boiler failures, which were overcome and subsequent designs bene®tedfrom this experience. Some operating results are presented in Table 7.Other incineration plants in the UK include the two units, with a capacity
of 10 tonnes of MSWhÿ1 each, in She�eld, which have been in operationsince 1975. The plant in Jersey is primarily used for electricity generationsince the local climate conditions did not favour the option of district heatingfor domestic or commercial use.Waste-incineration plants play a valuable part in the waste management in
several European countries, with Denmark and Germany being the mostadvanced, in terms of the number of plants installed. In the USA and Japan,the need to properly manage the millions of tonnes of MSW has been high-lighted over the last 20 years, along with the realisation of the scarcity of landfor new land®ll sites.In the USA, the number of waste-incineration plants with energy
recovery are 142, and there are some 34 plants with no energy-recoveryfacilities. The energy-recovery plants have a design processing capacity of
TABLE 7
Operational performance of the Edmonton plant in the UK30
Financialyeara
Actual wastesthroughput
(tonnes yearÿ1)
Total boileroperatingh per year
Averageannualstationthermalefficiency(%)
Plantcapacityfactor(PCF)(%)
Electricityexported(GWh)
Revenue fromelectricity
sales(£000)
1974±1975 378.000 32 780 12.7 72 135.500 6631975±1976 340.000 28 392 13.4 64 128.000 7541976±1977 300.000 26 232 12.7 57 107.300 9521977±1978 410.000 36 312 13.2 80 158.169 15201978±1979 316.200 29 328 13.0 60 117.289 11941979±1980 330.700 30 600 13.5 63 127.652 15811980±1981 398.700 34 992 14.2 76 158.676 25921981±1982 385.000 33 264 14.1 73 152.286 32431982±1983 402.000 34 230 12.7 76 151.781 37321983±1984 375.000 Ð Ð 71 147.000 3900
aFrom the beginning of April to the end of March of the following year.
230 E. Daskalopoulos, O. Badr, S. D. Probert
101 277 tonnes of MSW per day; an electricity generation potential of2300MW (which is equivalent to the electricity demand of 1.3millionhouseholds); and an associated energy saving of almost 31million barrels ofcrude oil per year. There are ®ve plants under construction, with an esti-mated design capacity of 2.5million tonnes of MSW per year and, another 44waste incineration plants, with no energy recovery are in the planning stagewith an estimated handling capacity of 11.5million tonnes of MSW per year.Incineration developments have been in¯uenced by:
. concerns over direct land®ll of certain materials (e.g. clinical wastes)and identi®cation of problem wastes for which incineration representsthe only commercially-available method of disposal;
. legislative controls curtailing other disposal routes (e.g. for sewagesludge);
. identi®cation of new environmental problems requiring remediation(e.g. contaminated soils); and
. recognition of the energy generation potential from burning wastes.
The case for constructing new municipal incinerators with heat recoverytherefore turns primarily on ®nancial viability. The sale of the energyrecovered, must generate su�cient income to leave the net cost of wastedisposal lower than the cost of the cheapest feasible alternative. However,an incineration plant might be producing energy for district heating. Theproblems of ¯uctuating demand are absorbed in this case by the electricity-supply system. The cost of doing this, should be re¯ected in the worth ofthe energy generated.29
Waste incineration is a capital investment process and the net costs aresensitive to both the scale of operation and cost of capital. Energy recoverycan signi®cantly reduce the net incineration cost, providing that the wastehas a suitable calori®c value and that the energy generated has a market.Waste combustion can generate energy in the form of heat or electricity, andin this way, displaces the use of fossil fuels. A municipal waste streamofa400 000 tonnes per year, has the potential to supply approximately30MW of electrical energy, and surplus thermal energy in the form of hotwater or steam.31 It is unlikely that the costs of incineration could be eco-nomically or environmentally justi®able without the facility of energyrecovery, which is then dependent on the availability of a market for theenergy generated.
Economics of waste incineration
The following analysis of the incineration costs will be based mainly on
Waste treatment and disposal technologies for municipal solid waste 231
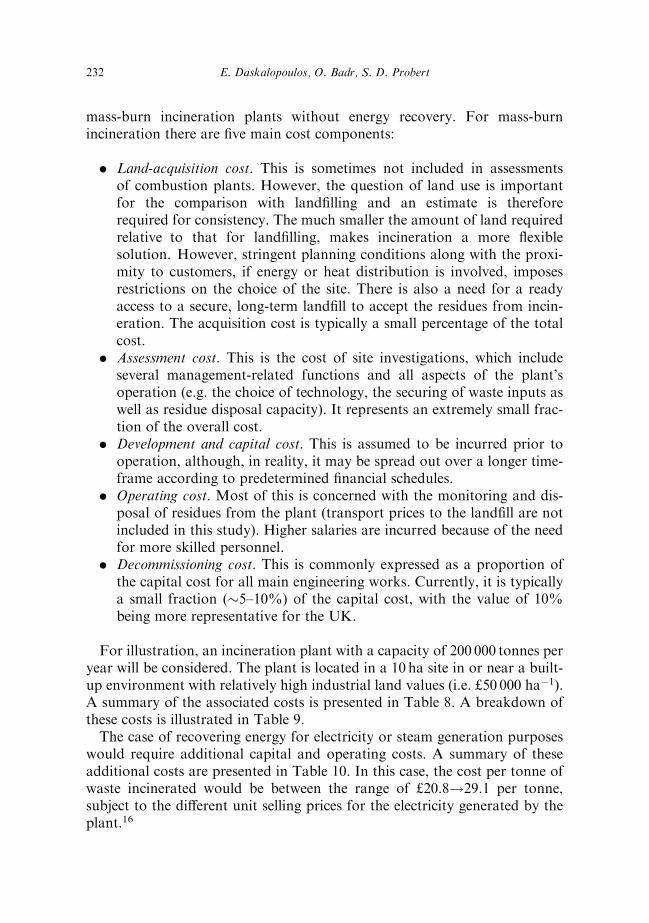
mass-burn incineration plants without energy recovery. For mass-burnincineration there are ®ve main cost components:
. Land-acquisition cost. This is sometimes not included in assessmentsof combustion plants. However, the question of land use is importantfor the comparison with land®lling and an estimate is thereforerequired for consistency. The much smaller the amount of land requiredrelative to that for land®lling, makes incineration a more ¯exiblesolution. However, stringent planning conditions along with the proxi-mity to customers, if energy or heat distribution is involved, imposesrestrictions on the choice of the site. There is also a need for a readyaccess to a secure, long-term land®ll to accept the residues from incin-eration. The acquisition cost is typically a small percentage of the totalcost.
. Assessment cost. This is the cost of site investigations, which includeseveral management-related functions and all aspects of the plant'soperation (e.g. the choice of technology, the securing of waste inputs aswell as residue disposal capacity). It represents an extremely small frac-tion of the overall cost.
. Development and capital cost. This is assumed to be incurred prior tooperation, although, in reality, it may be spread out over a longer time-frame according to predetermined ®nancial schedules.
. Operating cost. Most of this is concerned with the monitoring and dis-posal of residues from the plant (transport prices to the land®ll are notincluded in this study). Higher salaries are incurred because of the needfor more skilled personnel.
. Decommissioning cost. This is commonly expressed as a proportion ofthe capital cost for all main engineering works. Currently, it is typicallya small fraction (�5±10%) of the capital cost, with the value of 10%being more representative for the UK.
For illustration, an incineration plant with a capacity of 200 000 tonnes peryear will be considered. The plant is located in a 10 ha site in or near a built-up environment with relatively high industrial land values (i.e. £50 000 haÿ1).A summary of the associated costs is presented in Table 8. A breakdown ofthese costs is illustrated in Table 9.The case of recovering energy for electricity or steam generation purposes
would require additional capital and operating costs. A summary of theseadditional costs are presented in Table 10. In this case, the cost per tonne ofwaste incinerated would be between the range of £20.8!29.1 per tonne,subject to the di�erent unit selling prices for the electricity generated by theplant.16
232 E. Daskalopoulos, O. Badr, S. D. Probert
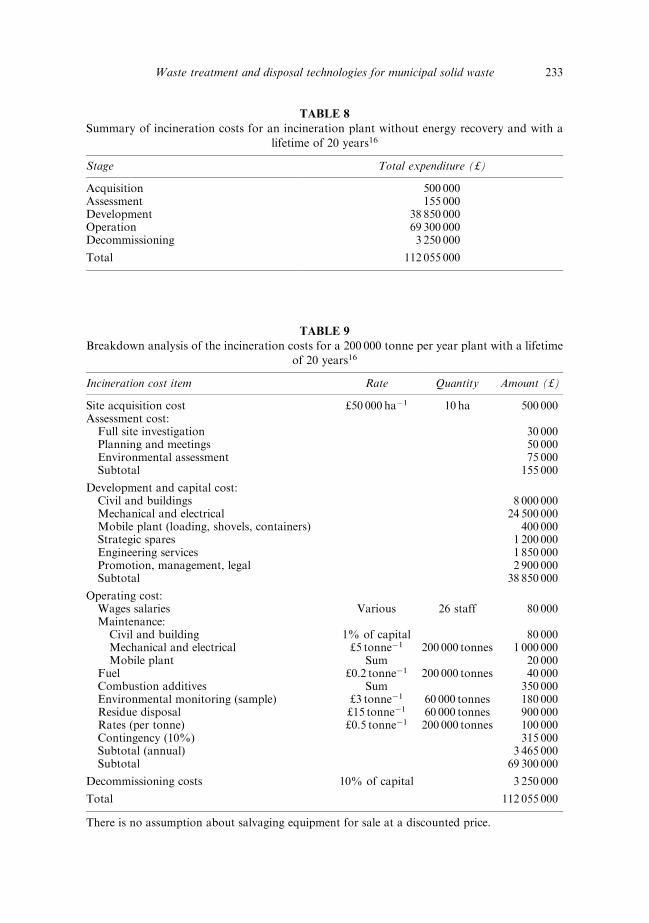
TABLE 9
Breakdown analysis of the incineration costs for a 200 000 tonne per year plant with a lifetimeof 20 years16
Incineration cost item Rate Quantity Amount (£)
Site acquisition cost £50 000 haÿ1 10 ha 500 000Assessment cost:
Full site investigation 30 000Planning and meetings 50 000Environmental assessment 75 000Subtotal 155 000
Development and capital cost:Civil and buildings 8 000 000Mechanical and electrical 24 500 000Mobile plant (loading, shovels, containers) 400 000Strategic spares 1 200 000Engineering services 1 850 000Promotion, management, legal 2 900 000Subtotal 38 850 000
Operating cost:Wages salaries Various 26 staff 80 000Maintenance:
Civil and building 1% of capital 80 000Mechanical and electrical £5 tonneÿ1 200 000 tonnes 1 000 000Mobile plant Sum 20 000
Fuel £0.2 tonneÿ1 200 000 tonnes 40 000Combustion additives Sum 350 000Environmental monitoring (sample) £3 tonneÿ1 60 000 tonnes 180 000Residue disposal £15 tonneÿ1 60 000 tonnes 900 000Rates (per tonne) £0.5 tonneÿ1 200 000 tonnes 100 000Contingency (10%) 315 000Subtotal (annual) 3 465 000Subtotal 69 300 000
Decommissioning costs 10% of capital 3 250 000
Total 112 055 000
There is no assumption about salvaging equipment for sale at a discounted price.
TABLE 8
Summary of incineration costs for an incineration plant without energy recovery and with alifetime of 20 years16
Stage Total expenditure (£)
Acquisition 500 000Assessment 155 000Development 38 850 000Operation 69 300 000Decommissioning 3 250 000
Total 112 055 000
Waste treatment and disposal technologies for municipal solid waste 233
Future trends
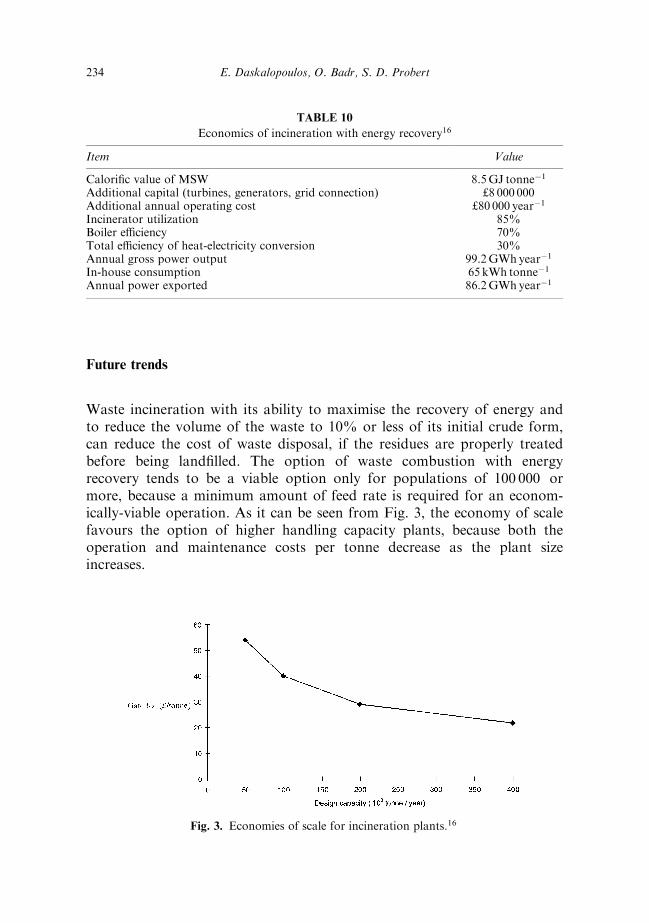
Waste incineration with its ability to maximise the recovery of energy andto reduce the volume of the waste to 10% or less of its initial crude form,can reduce the cost of waste disposal, if the residues are properly treatedbefore being land®lled. The option of waste combustion with energyrecovery tends to be a viable option only for populations of 100 000 ormore, because a minimum amount of feed rate is required for an econom-ically-viable operation. As it can be seen from Fig. 3, the economy of scalefavours the option of higher handling capacity plants, because both theoperation and maintenance costs per tonne decrease as the plant sizeincreases.
TABLE 10
Economics of incineration with energy recovery16
Item Value
Calori®c value of MSW 8.5GJ tonneÿ1
Additional capital (turbines, generators, grid connection) £8 000 000Additional annual operating cost £80 000 yearÿ1
Incinerator utilization 85%Boiler e�ciency 70%Total e�ciency of heat-electricity conversion 30%Annual gross power output 99.2GWhyearÿ1
In-house consumption 65 kWh tonneÿ1
Annual power exported 86.2GWhyearÿ1
Fig. 3. Economies of scale for incineration plants.16
234 E. Daskalopoulos, O. Badr, S. D. Probert
COMPOSTING
Composting is de®ned as the biological decomposition and stabilisation oforganic substrates under conditions which allow the development of ther-mophillic temperatures as a result of biologically-produced heat, with a ®nalproduct su�ciently stable for storage and application to land without caus-ing any adverse environmental e�ects.32
The main objectives of composting have traditionally been to biologicallyconvert putrescible organic material to a stabilised form and to destroyorganisms pathogenic to humans. If the compost product is reused, it canaccomplish several additional purposes including:
. to serve as a source of organic matter for maintaining or building sup-plies of soil humus, necessary for proper soil structure and moistureholding capacity;
. to reclaim and reuse certain valuable nutrients including nitrogen,phosphorous and a wide variety of essential trace elements; and
. to improve the growth and vigour of crops in commercial agriculture orhome-related uses.
Key environmental and operational factors
Because the microbes are the main active agents in composting, it followsthat those factors which a�ect their proliferation and activity will also play amajor role in the composting-process rate and duration. Collectively, theyare environmental in nature. The nature of the substrate is one of the mostimportant factors. Substrate-related parameters are:
. The Carbon-to-nitrogen (C/N) ratio. All nutrients are adequately pres-ent in a typical organic waste. Requirements with respect to the C/Nratio depend on the metabolism of the microbes. A large percentage ofthe carbon is oxidised to carbon dioxide, while the remainder is con-verted into cell wall, membrane or protoplasm. The major consumptionof nitrogen is in the synthesis of protoplasm. Therefore, more carbonthan nitrogen is required. The ratio is in the order of �20±25 parts ofcarbon to one part of nitrogen. Departures from this ratio will lead to aslowing of the decomposition process and hence to the composting rate.
. Particle size. The signi®cance of this lies in the amount of surface areaof the waste particles exposed to microbial attack: the greater the ratioof surface area to volume of the waste, the more rapid is the rate of themicrobial attack. In practice, the minimum permissible particle size is
Waste treatment and disposal technologies for municipal solid waste 235
that at which the porosity required for proper aeration in a compostingmass can be attained and maintained.
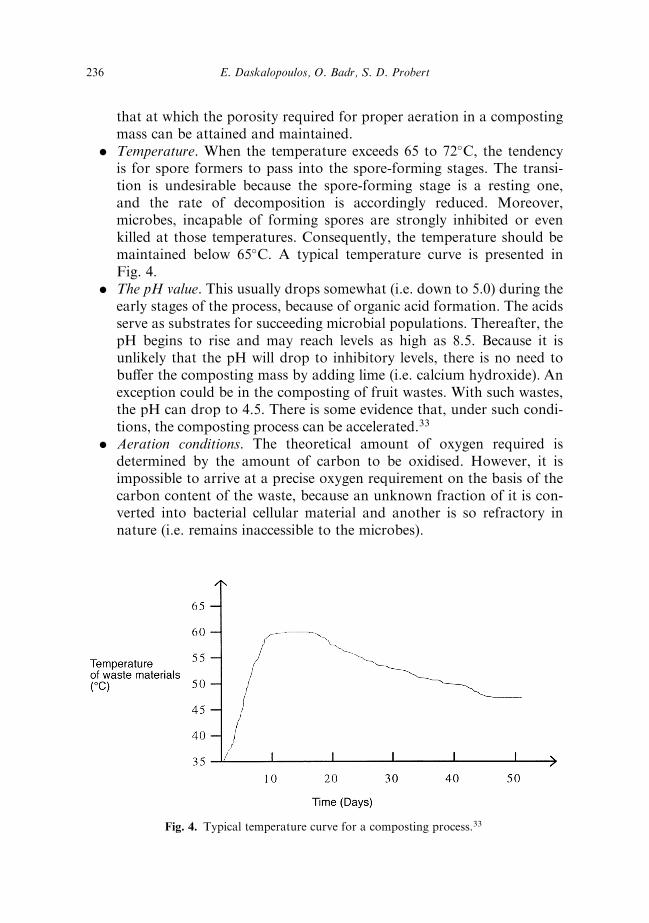
. Temperature. When the temperature exceeds 65 to 72�C, the tendencyis for spore formers to pass into the spore-forming stages. The transi-tion is undesirable because the spore-forming stage is a resting one,and the rate of decomposition is accordingly reduced. Moreover,microbes, incapable of forming spores are strongly inhibited or evenkilled at those temperatures. Consequently, the temperature should bemaintained below 65�C. A typical temperature curve is presented inFig. 4.
. The pH value. This usually drops somewhat (i.e. down to 5.0) during theearly stages of the process, because of organic acid formation. The acidsserve as substrates for succeeding microbial populations. Thereafter, thepH begins to rise and may reach levels as high as 8.5. Because it isunlikely that the pH will drop to inhibitory levels, there is no need tobu�er the composting mass by adding lime (i.e. calcium hydroxide). Anexception could be in the composting of fruit wastes. With such wastes,the pH can drop to 4.5. There is some evidence that, under such condi-tions, the composting process can be accelerated.33
. Aeration conditions. The theoretical amount of oxygen required isdetermined by the amount of carbon to be oxidised. However, it isimpossible to arrive at a precise oxygen requirement on the basis of thecarbon content of the waste, because an unknown fraction of it is con-verted into bacterial cellular material and another is so refractory innature (i.e. remains inaccessible to the microbes).
Fig. 4. Typical temperature curve for a composting process.33
236 E. Daskalopoulos, O. Badr, S. D. Probert
. Moisture content. This is closely related to the oxygen requirements ofthe process. The oxygen supply to the microbes involves both the ambi-ent air and the air trapped within the interstices (i.e. voids between theparticles) of the waste. When the rate of di�usion of ambient air intothe mass is inadequate, the air in the voids is the major source of oxygen.If the moisture content of the mass is so high as to displace most of theair from the voids, anaerobic conditions will develop within the mass.
Environmental impacts of waste composting
Principal potential negative impacts of a compost operation on the environ-ment could be the lowering of the quality of a water resource or local air andthe compromising of public health by attracting vectors and rodents. How-ever, such impacts occur only when an inappropriate technology is used.The quality of a water resource can be a�ected adversely through con-
tamination with run-o� from the compost operation or with leachate fromraw, composting or composted refuse. Leachate is formed only when themoisture content of the material is excessively high (>60 to 65%). Uncon-trolled addition of moisture can be minimised by sheltering the operation. Asa precautionary measure, provision should be made to keep the leachatefrom reaching ground and/or surface waters by conducting all phases of thecomposting operation on a suitably contoured, paved surface.Biological and non-biological agents from various stages of the compost-
ing operation most likely would be discharged into air, as dust particlesand aerosols. Some of the microbes transported in this manner could be ahazard to the health of individuals, who might ingest these dust particle oraerosols.
Examples of successful composting operations
Factors that have in¯uenced the development of new composting facilities inthe USA include the closure of land®lls, strong anti-incineration sentiments,the introduction of higher-technology systems to process mixed-wastestreams, growing con®dence in composting as an option to handle municipalwaste and an economic environment that allows composting to competeagainst incinerators and land®lls. These factors did combine in the late 1980sto spark interest in composting municipal solid waste. By 1990, there wereonly 79USA-based projects in various phases of development and only ninefull-scale facilities in operation. In 1992, there were 61 projects in develop-ment and 21 in operation. The signi®cance di�erence between the data of thetwo surveys conducted in the USA is that in 1990, there were 14 projects
Waste treatment and disposal technologies for municipal solid waste 237
under construction, whereas in 1992, there was only one.34 Similarly therewere 10 projects in design stages in 1990, compared with four in 1992.35 Newtrends that have emerged in the 1990s are the cutbacks in state and municipalbudgets that tightened up available funds for such new projects; closure ofsome of the larger mixed-waste composting plants and perhaps more sig-ni®cantly, declining land®ll tips fees in some countries combined with theopening of mega-land®lls.36
In Canada, the situation is similar to that in the USA. For the last 10years, research has been undertaken to examine the possibility of diverting,to composting programmes, the degradable fraction of the MSW stream.Experience has shown that basic recycling programmes could divert at least a10±20% of the total MSW, while the separation of the organic materialcould divert another 10±15%, depending on the pick-up frequency. Localcommunities that have applied year-round collection of food and yard waste,have appeared to achieve 50±60% diversion rate.37,38
In Germany, several pilot-scale projects have been involved in a pro-gramme aiming at diverting the organic fraction of the MSW from land®lls.The decision of the German government not to permit open-air food com-posting sites to be of a capacity larger than 1000 tonnes per year, resulted inthe development of these local-scale schemes. Each one of these sites isassociated with a village and utilises kitchen and yard waste. The farmerswho are responsible for the operation of the sites are paid an agreed tippingfee. The ®nal product is basically used directly by the farmers or sold as anorganic fertiliser.39
France and Italy are also among the European leaders in terms of theamount of household refuse composted. According to the o�cial data,around 95 composting facilities operate in France, processing 1.5milliontonnes of mixed domestic wastes each year to produce 650 000 tonnes oforganic compost. In Italy, there are several facilities, which process eithermixed domestic wastes or segregated organic wastes (such as those collectedfrom vegetables markets). In Switzerland and in The Netherlands, 2.3 and1.18million people, respectively, are involved in separate organic collectionsystems.40
Economics of composting operations
The economics of running a composting scheme will be examined for thecase of a system employing the windrow process. Three cost elements areconsidered:
. Construction cost, which includes all costs associated with land acquisi-tion, site preparation and equipment purchase
238 E. Daskalopoulos, O. Badr, S. D. Probert
. Fixed cost, which includes depreciation, interest on the un-depreciated'sor remaining value of the facility, repairs or maintenance of ®xed assetsand insurance.
. Operating cost, which includes the costs of labour, materials andequipment operation.
Although the overall windrow process is simple, local solid-waste autho-rities involved in these operations face an array of choices regarding facilitydesign and day-to-day operation. These choices are governed by:
. The facility size. This depends upon the size of the local populationserved, the composition of the housing (e.g. ratio of the number ofapartments versus single family houses) in the area and the dominanttypes of local vegetation.
. The ground cover. Composting facilities may be paved or unpaved: inthe latter case, facilities with a packed-earth ¯oor are cheaper to con-struct. However such facilities experience considerable di�culties duringperiods of heavy rain. Gravel, asphalt or concrete may be used for thepaved facilities.
. The machinery used. A variety of equipment is required for large-scaleoperations. Either a front-end loader or a specialist compost turner maybe employed for the turning of the windows.40±43
The cost analysis is based on the following prototypes:
. Simple passive pile or minimal-technology system that requires minimallabour and mechanical inputs.
. Low-technology system requiring a paved surface and a front end loaderfor turning the windrows.
. Medium-technology system that features a paved surface, screening andshredding equipment to ensure uniform consistency of the ®nishedproduct.
A series of di�erent annual capacities has been examined,40 involving 10,25 and 100 thousand tonnes of waste processing material for each of theabove options. Perhaps the most important feature that di�erentiates theprototype systems is the frequency of turning the windrows. This a�ectsdirectly the quality of the ®nished product, the amount of volume reductionand the total time required to create a stabilised product. All of these factorsa�ect the facility and operating costs. By examining the di�erent cost ele-ment parameters, several conclusions can be drawn:
. The low-technology system is less costly to operate than the medium-technology system when the annual capacity is 10 000 tonnes. However as
Waste treatment and disposal technologies for municipal solid waste 239

the annual throughput increases this cost advantage is reversed. For agiven annual volume, however, minimal-technology facilities are con-siderably less costly than the other facilities.
. Fixed costs account for between 64±84% of the total costs for all proto-types. This is signi®cant because these costs, which are mainly theinterest payments necessary for ®nancing the initial construction of thesites, will accrue regardless of the degree to which the facilities will beutilised.
Conclusions and future trends
The future of composting depends largely on the advantages and dis-advantages o�ered compared with other waste management alternatives.These advantages are many: it can convert putrescible organics to a stabi-lised form, destroy pathogenic microbes and provide signi®cant drying ofwet substrates such as sludge. All of these are obtained with minimum energyinput. Drying reduces the cost of subsequent handling and increases theattractiveness of composted product for reuse. Furthermore, composting iscompatible with a variety of feedstocks, including from raw and digestedsludge, conditioned by heat, organic polymers or inorganic materials such aslime, and can use a variety of amendments as may be locally available. Ageneral diagram relating the nuisance problems associated with compostingwith the degree of control involved in the system is shown in Fig. 5. Nuisanceproblems should be reduced as more control measures are included in thesystem design.
Fig. 5. Generalised diagram relating nuisance problems with the degree of control exercised
over them.32
240 E. Daskalopoulos, O. Badr, S. D. Probert
WASTE RECYCLING
Recycling involves using materials which are at the end of their useful lives asthe feed stocks for the manufacture of new products. Within recycling afurther hierarchy can be de®ned:44
. Primary recycling. This is the use of recycled products to make thesame or similar products. Examples include the recycling of alumi-nium cans and glass bottles. Because this is, at least partially, aclosed-loop process, it can and should be regarded as having a highvalue.
. Secondary recycling. The use of recycled materials to make new pro-ducts with less stringent speci®cations than the original. This allows fordown-grading of the material to suit its possibly-diminished propertiesand hence is of lower value than primary recycling.
All recycling systems must have three major components in order to func-tion, namely:
. there must be a consistent and reliable source of the recycled materials;
. methods for processing the recovered materials into a form suitable forreuse must be in place; and
. markets must exist for the reprocessed materials.It is only when all these components, function in an economically-viablemanner that a successful recycling system exists.
Recycling di�ers from re-use because it includes the processing step. Theterm recycling is often used to describe the collection of materials separatedfrom the waste. This operation is more correctly de®ned as reclamation. Inaddition to the collection and separation of materials from waste, recyclingincludes the subsequent processing to produce marketable products.44 Thesemarketable products can be in the form of:
. materials such as paper and board;
. ®nished products partly or totally consisting of recycled materials;
. solid, liquid or gaseous fuels or
. energy as heat or electricity.
Recycling is also di�erent from resource recovery. In resource recovery,materials are recovered for reuse from a mixed stream of solid waste. Recy-cling programmes rely on the separation of recyclable materials rather thanallowing them to be mixed with the rest of the waste (i.e. source separation).
Waste treatment and disposal technologies for municipal solid waste 241
Waste may be separated at source into a number of di�erent categories, orsimply only into recyclable and non-recyclable components.45
Factors in¯uencing recycling programmes
There are four main parameters that dictate the degree of success of a recy-cling programme:
1. Technical limitations. Estimates on the theoretically achievable recyclingrate for municipal waste vary signi®cantly depending on the assumptionsmade regarding the composition of the waste, the degree of material con-tamination and the technically-obtainable recycling rates for individualwaste fractions. Estimates46 range from about 40% to about 80% byweight.47,48 Recycling rates above 50% have been based on the assumptionthat the recycling programme involves most of the fractions of the wastestream and that expensive curbside collection schemes are employed (i.e.segregated components).
2. Level of public participation. Public support for collection schemes isessential. Most of the sorting of the waste will then be carried out by house-holders instead of the use of centralised sorting plants. The role of the publicin recycling so far has been a direct result of environmental campaigns.However, ``consumer awareness of the e�ects of purchasing decisions onwaste volumes, disposal needs and the environment is only slowly emer-ging''.49
Gandy,50 identi®ed the following three main factors which a�ect the levelof public participation:
. the general psychological aspects encouraging or inhibiting participa-tion in the di�erent types of schemes;
. the e�ect of di�erent socio-economic householders characteristics ontheir likelihood to participate; and
. the general level of environmental concern in society.
The highest rates have been recorded for mandatory curbside schemes ina�uent small towns, where households are required to set out segregatedfractions of their waste for collection.47 In these schemes, the level of parti-cipation has reached 85±95% of the entire population in the area. In the caseof ``bring systems'', an important factor is the density of the waste collectionfacilities. A low-density scheme, is one which involves longer average dis-tances for the residents to reach the collection points. If the facilities areplaced close to shopping centres, then the motivation for taking part in the
242 E. Daskalopoulos, O. Badr, S. D. Probert
scheme is usually closely related to the convenience of simultaneously visitingthe shops and transporting materials for recycling.Several studies have been undertaken to examine the psychological
rewards for participation in a recycling scheme. The e�ect that di�erent typesof rewards might have on participation rates has been the centre of debate.DeYoung51 found that intrinsic satisfaction, associated with environmen-tally-responsible behaviour, contributed to citizens well being and that con-servation behaviour might be carried out without the need of an external®nancial reward. Vining and Ebreo52 suggested that ®nancial inducementsare always necessary to gain the participation of the less environmentally-motivated recyclers.
3. Markets for secondary products. Setting up a recycling scheme and main-taining its viability requires the existence of a market for the by-productsproduced. This is an important element in terms of the ®nancial viability ofthe scheme, because the raised revenues will make the recycling option amore attractive waste-treatment option. However, it has often been founddi�cult to maintain a market for secondary materials due to:
. a miss-match between the supply of recycled materials and the demandfor recycled products;
. the competition with virgin raw materials; and
. the di�culties of ensuring consistent supply of su�ciently uncontami-nated material in economically-handleable quantities.
However, the capacity of secondary-materials market to absorb the col-lected materials could be improved by a variety of policy instruments aimedat the production cycle or in the consumption level of the associated pro-ducts. Initiatives, such as government procurement of recycled products,government support for recycling as an economic-development strategy,export promotion campaigns and the introduction of ®nancial incentives, aresome of the measures that could be adopted.47,53
4. Economic viability of recycling. An important rationale for recycling isclaimed to be its potential to cut waste disposal and collection costs and alsoto generate a net income form the sale of the recovered materials. Severalstudies have examined the economic viability of recycling. Some analysessuggest that the economics of a comprehensive collect system such as acurbside scheme are very favourable. In New York, it has been reported thata 40% recycling rate of MSW is a realistic target and that according to 1985prices, recycling would be less expensive per tonne than incineration andland®lling the residual ash.47 A study for California54 claimed that the
Waste treatment and disposal technologies for municipal solid waste 243
average cost of collection and disposal was approximately $60 per tonne,where the curbside recycling cost was less than $40 per tonne. However,these ®gures are very site speci®c and should not be used as a clear indica-tion of the recycling economics. A detailed assessment of each proposedapplication should be undertaken.
Environmental impacts of recycling
The bene®ts derived from recycling include avoiding operational and exter-nal costs associated with waste disposal (i.e. costs of environmental damageby, for example, leachate leakage and emissions to air) and the possible rev-enue from the sale of the recycled materials. These should be balancedagainst the costs associated with recycling, such as: extra costs incurred dueto the separation of used materials from mixed waste, the costs associatedwith any process involved (e.g. cleaning, de-inking and remelting) and anyexternal costs (e.g. costs of environmental pollution from de-inking processesand health risks from the sorting and recycling processes).There are a variety of environmental justi®cations for recycling:
. the conservation of the ®nite resources as a move towards the achieve-ment of sustainable economies;55±59
. the reduction of energy consumption in production;60±62
. the limiting of pollutant emissions during production processes and thedisposal of the wastes generated; and
. ®nally, the environmental-education bene®ts of participation in recy-cling.60,63
The relative importance of these di�erent environmental objectives varies.The saving of energy is usually considered more important than the recoveryof materials, if there is to be a trade-o� between the two goals (Table 11).Furthermore, the environmental bene®ts of recycling of di�erent compo-nents of a waste stream depend on which material forms the focus for therecycling policy (Table 12).
Economics of recycling operations
Recycling is economically viable if the value of the resources used in theprocess do not exceed the value of the resources saved. In some cases, how-ever, more resources are used in collecting, separating, transporting, cleaningand reprocessing used materials than can be justi®ed by the value and qualityof the recycled products, and more environmental damage results from the
244 E. Daskalopoulos, O. Badr, S. D. Probert
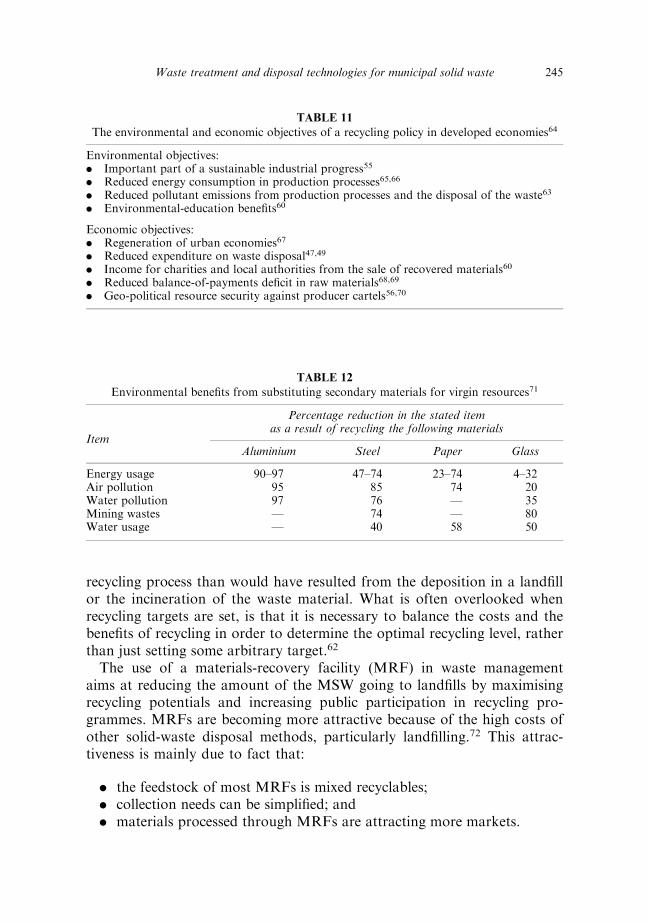
recycling process than would have resulted from the deposition in a land®llor the incineration of the waste material. What is often overlooked whenrecycling targets are set, is that it is necessary to balance the costs and thebene®ts of recycling in order to determine the optimal recycling level, ratherthan just setting some arbitrary target.62
The use of a materials-recovery facility (MRF) in waste managementaims at reducing the amount of the MSW going to land®lls by maximisingrecycling potentials and increasing public participation in recycling pro-grammes. MRFs are becoming more attractive because of the high costs ofother solid-waste disposal methods, particularly land®lling.72 This attrac-tiveness is mainly due to fact that:
. the feedstock of most MRFs is mixed recyclables;
. collection needs can be simpli®ed; and
. materials processed through MRFs are attracting more markets.
TABLE 11
The environmental and economic objectives of a recycling policy in developed economies64
Environmental objectives:. Important part of a sustainable industrial progress55
. Reduced energy consumption in production processes65,66
. Reduced pollutant emissions from production processes and the disposal of the waste63
. Environmental-education bene®ts60
Economic objectives:. Regeneration of urban economies67
. Reduced expenditure on waste disposal47,49
. Income for charities and local authorities from the sale of recovered materials60
. Reduced balance-of-payments de®cit in raw materials68,69
. Geo-political resource security against producer cartels56,70
TABLE 12
Environmental bene®ts from substituting secondary materials for virgin resources71
Item
Percentage reduction in the stated itemas a result of recycling the following materials
Aluminium Steel Paper Glass
Energy usage 90±97 47±74 23±74 4±32Air pollution 95 85 74 20Water pollution 97 76 Ð 35Mining wastes Ð 74 Ð 80Water usage Ð 40 58 50
Waste treatment and disposal technologies for municipal solid waste 245
Even though many of the operations of an MRF are highly mechanised,there are still many jobs on the site that need manual labour (e.g. glasssorting by colour, which is still the more reliable approach to ensure qualityof the end product). In any case, the trade-o� between the manual and thefully-mechanised operation of an MRF is a function of capital versusoperating costs. The highly-mechanised systems have capital costs thatrange from 75 to 100% higher than those for the manually-operated sys-tems.54
Several approaches have been proposed for the design of MRFs. Theyrange from low-technology plants, which are relatively simple in design,labour intensive, involve minimum hardware and typically are of low hand-ling capacities, to high-technology plants, which can handle higher tonnage ofwaste, are relatively complex in design, mechanically intensive and involvehigher capital, operation and maintenance costs.The total cost of running an MRF site has been considered for
throughput capacities between 10 and 500 tonnes per day. A range ofcosts is also presented in order to account for variations in engineeringwell as design and capital and operating costs, and to accommodate thewide variety of speci®c conditions that apply to MRF projects. Capitalcosts include the facility-construction costs and the equipment-purchasingcosts. Construction costs vary depending upon the technology employed,site's speci®c conditions (e.g. subsurface conditions and local topo-graphy), structural materials used for building construction and localbuilding-code requirements. Typical ¯oor area requirements for majorsettings of the site are given in Table 13, as a function of the throughputcapacity. The primary variables are the tipping ¯oor and storage capa-cities desired. A general rule for that is to maintain su�cient tipping¯oor capacity to accommodate a reasonable worst-case scenario (e.g.unscheduled maintenance) and enough storage capacity for each materialprocessed. The unit cost of equipment decreases as the capacityincreases.The costs presented in Table 14 are at the upper range of the cost scale for
existing facilities. This is because, for many of the existing facilities:
. there is not an adequate ¯oor area for unprocessed and processedmaterial storage;
. they have been developed within existing structures, thereby avoidingstringent building codes; and
. the inclusion of mixed recycled materials in the facility design, increasesthe capital costs for both the sorting area and the associated equipment;usually most old facilities do not possess this capability.
246 E. Daskalopoulos, O. Badr, S. D. Probert
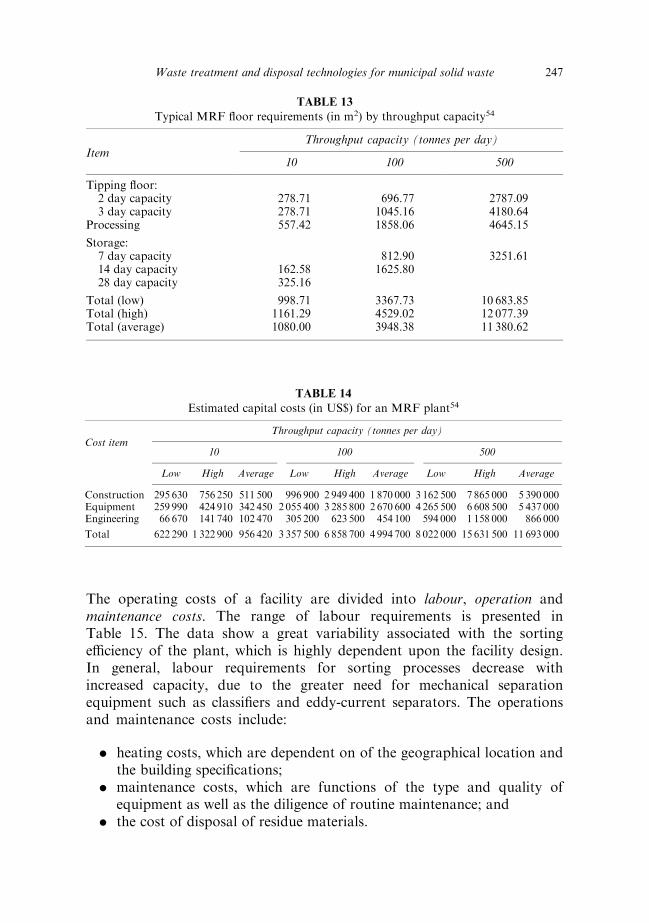
The operating costs of a facility are divided into labour, operation andmaintenance costs. The range of labour requirements is presented inTable 15. The data show a great variability associated with the sortinge�ciency of the plant, which is highly dependent upon the facility design.In general, labour requirements for sorting processes decrease withincreased capacity, due to the greater need for mechanical separationequipment such as classi®ers and eddy-current separators. The operationsand maintenance costs include:
. heating costs, which are dependent on of the geographical location andthe building speci®cations;
. maintenance costs, which are functions of the type and quality ofequipment as well as the diligence of routine maintenance; and
. the cost of disposal of residue materials.
TABLE 13
Typical MRF ¯oor requirements (in m2) by throughput capacity54
Throughput capacity (tonnes per day)Item
10 100 500
Tipping ¯oor:2 day capacity 278.71 696.77 2787.093 day capacity 278.71 1045.16 4180.64
Processing 557.42 1858.06 4645.15
Storage:7 day capacity 812.90 3251.6114 day capacity 162.58 1625.8028 day capacity 325.16
Total (low) 998.71 3367.73 10 683.85Total (high) 1161.29 4529.02 12 077.39Total (average) 1080.00 3948.38 11 380.62
TABLE 14
Estimated capital costs (in US$) for an MRF plant54
Throughput capacity (tonnes per day)Cost item
10 100 500
Low High Average Low High Average Low High Average
Construction 295 630 756 250 511 500 996 900 2 949 400 1 870 000 3 162 500 7 865 000 5 390 000Equipment 259 990 424 910 342 450 2 055 400 3 285 800 2 670 600 4 265 500 6 608 500 5 437 000Engineering 66 670 141 740 102 470 305 200 623 500 454 100 594 000 1 158 000 866 000
Total 622 290 1 322 900 956 420 3 357 500 6 858 700 4 994 700 8 022 000 15 631 500 11 693 000
Waste treatment and disposal technologies for municipal solid waste 247
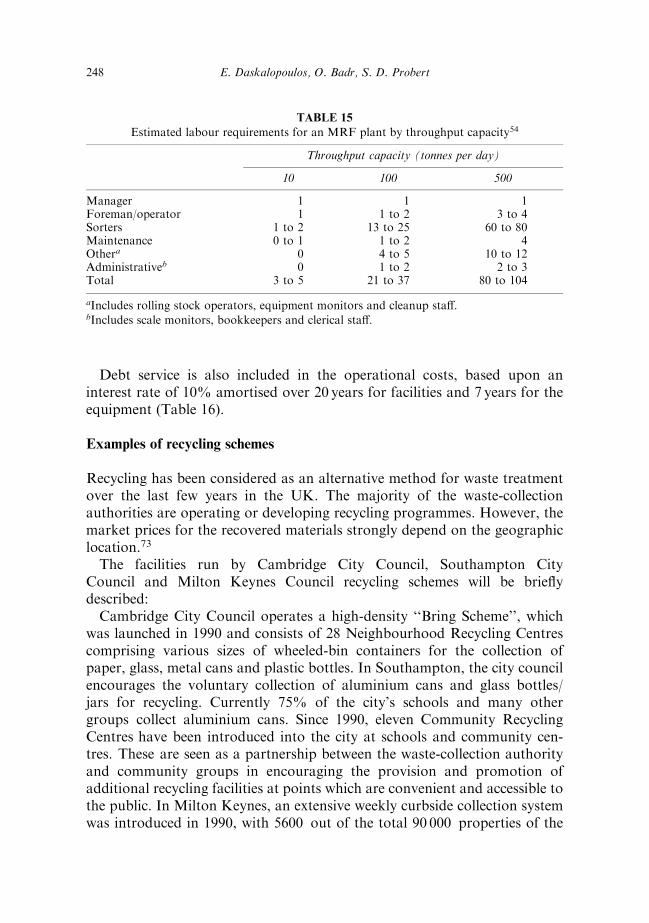
Debt service is also included in the operational costs, based upon aninterest rate of 10% amortised over 20 years for facilities and 7 years for theequipment (Table 16).
Examples of recycling schemes
Recycling has been considered as an alternative method for waste treatmentover the last few years in the UK. The majority of the waste-collectionauthorities are operating or developing recycling programmes. However, themarket prices for the recovered materials strongly depend on the geographiclocation.73
The facilities run by Cambridge City Council, Southampton CityCouncil and Milton Keynes Council recycling schemes will be brie¯ydescribed:Cambridge City Council operates a high-density ``Bring Scheme'', which
was launched in 1990 and consists of 28 Neighbourhood Recycling Centrescomprising various sizes of wheeled-bin containers for the collection ofpaper, glass, metal cans and plastic bottles. In Southampton, the city councilencourages the voluntary collection of aluminium cans and glass bottles/jars for recycling. Currently 75% of the city's schools and many othergroups collect aluminium cans. Since 1990, eleven Community RecyclingCentres have been introduced into the city at schools and community cen-tres. These are seen as a partnership between the waste-collection authorityand community groups in encouraging the provision and promotion ofadditional recycling facilities at points which are convenient and accessible tothe public. In Milton Keynes, an extensive weekly curbside collection systemwas introduced in 1990, with 5600 out of the total 90 000 properties of the
TABLE 15
Estimated labour requirements for an MRF plant by throughput capacity54
Throughput capacity (tonnes per day)
10 100 500
Manager 1 1 1Foreman/operator 1 1 to 2 3 to 4Sorters 1 to 2 13 to 25 60 to 80Maintenance 0 to 1 1 to 2 4Othera 0 4 to 5 10 to 12Administrativeb 0 1 to 2 2 to 3Total 3 to 5 21 to 37 80 to 104
aIncludes rolling stock operators, equipment monitors and cleanup sta�.bIncludes scale monitors, bookkeepers and clerical sta�.
248 E. Daskalopoulos, O. Badr, S. D. Probert
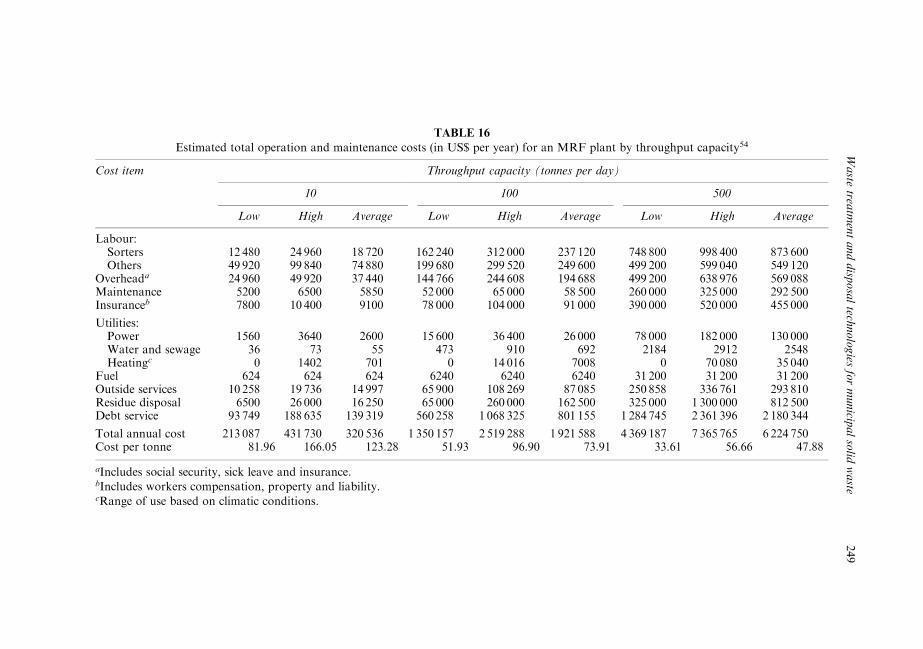
TABLE 16
Estimated total operation and maintenance costs (in US$ per year) for an MRF plant by throughput capacity54
Cost item Throughput capacity (tonnes per day)
10 100 500
Low High Average Low High Average Low High Average
Labour:Sorters 12 480 24 960 18 720 162 240 312 000 237 120 748 800 998 400 873 600Others 49 920 99 840 74 880 199 680 299 520 249 600 499 200 599 040 549 120
Overheada 24 960 49 920 37 440 144 766 244 608 194 688 499 200 638 976 569 088Maintenance 5200 6500 5850 52 000 65 000 58 500 260 000 325 000 292 500Insuranceb 7800 10 400 9100 78 000 104 000 91 000 390 000 520 000 455 000
Utilities:Power 1560 3640 2600 15 600 36 400 26 000 78 000 182 000 130 000Water and sewage 36 73 55 473 910 692 2184 2912 2548Heatingc 0 1402 701 0 14 016 7008 0 70 080 35 040
Fuel 624 624 624 6240 6240 6240 31 200 31 200 31 200Outside services 10 258 19 736 14 997 65 900 108 269 87 085 250 858 336 761 293 810Residue disposal 6500 26 000 16 250 65 000 260 000 162 500 325 000 1 300 000 812 500Debt service 93 749 188 635 139 319 560 258 1 068 325 801 155 1 284 745 2 361 396 2 180 344
Total annual cost 213 087 431 730 320 536 1 350 157 2 519 288 1 921 588 4 369 187 7 365 765 6 224 750Cost per tonne 81.96 166.05 123.28 51.93 96.90 73.91 33.61 56.66 47.88
aIncludes social security, sick leave and insurance.bIncludes workers compensation, property and liability.cRange of use based on climatic conditions.
Waste
treatm
entanddisp
osaltech
nologies
formunicip
alsolid
waste
249
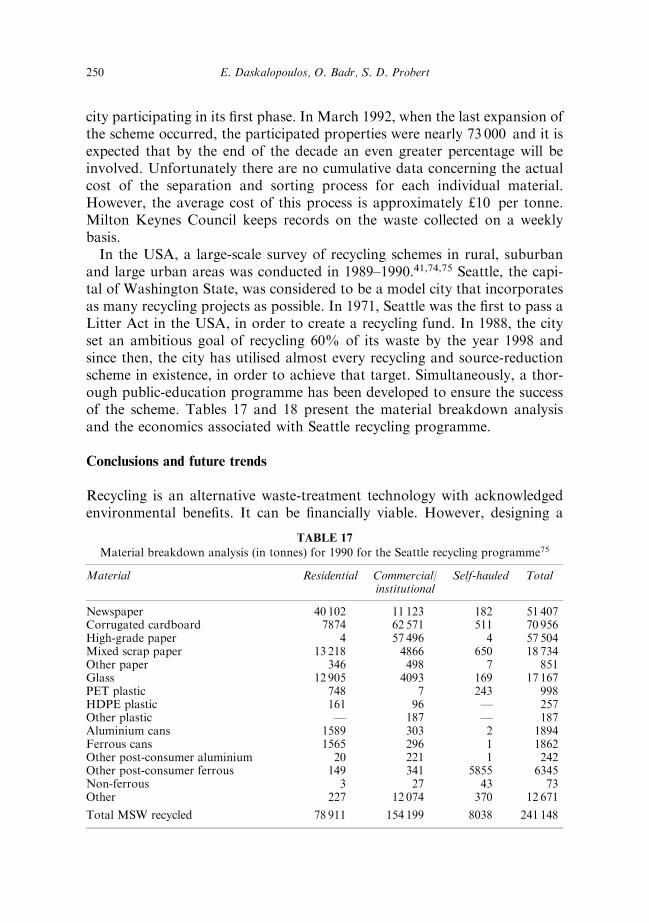
city participating in its ®rst phase. In March 1992, when the last expansion ofthe scheme occurred, the participated properties were nearly 73 000 and it isexpected that by the end of the decade an even greater percentage will beinvolved. Unfortunately there are no cumulative data concerning the actualcost of the separation and sorting process for each individual material.However, the average cost of this process is approximately £10 per tonne.Milton Keynes Council keeps records on the waste collected on a weeklybasis.In the USA, a large-scale survey of recycling schemes in rural, suburban
and large urban areas was conducted in 1989±1990.41,74,75 Seattle, the capi-tal of Washington State, was considered to be a model city that incorporatesas many recycling projects as possible. In 1971, Seattle was the ®rst to pass aLitter Act in the USA, in order to create a recycling fund. In 1988, the cityset an ambitious goal of recycling 60% of its waste by the year 1998 andsince then, the city has utilised almost every recycling and source-reductionscheme in existence, in order to achieve that target. Simultaneously, a thor-ough public-education programme has been developed to ensure the successof the scheme. Tables 17 and 18 present the material breakdown analysisand the economics associated with Seattle recycling programme.
Conclusions and future trends
Recycling is an alternative waste-treatment technology with acknowledgedenvironmental bene®ts. It can be ®nancially viable. However, designing a
TABLE 17
Material breakdown analysis (in tonnes) for 1990 for the Seattle recycling programme75
Material Residential Commercial/institutional
Self-hauled Total
Newspaper 40 102 11 123 182 51 407Corrugated cardboard 7874 62 571 511 70 956High-grade paper 4 57 496 4 57 504Mixed scrap paper 13 218 4866 650 18 734Other paper 346 498 7 851Glass 12 905 4093 169 17 167PET plastic 748 7 243 998HDPE plastic 161 96 Ð 257Other plastic Ð 187 Ð 187Aluminium cans 1589 303 2 1894Ferrous cans 1565 296 1 1862Other post-consumer aluminium 20 221 1 242Other post-consumer ferrous 149 341 5855 6345Non-ferrous 3 27 43 73Other 227 12 074 370 12 671
Total MSW recycled 78 911 154 199 8038 241 148
250 E. Daskalopoulos, O. Badr, S. D. Probert
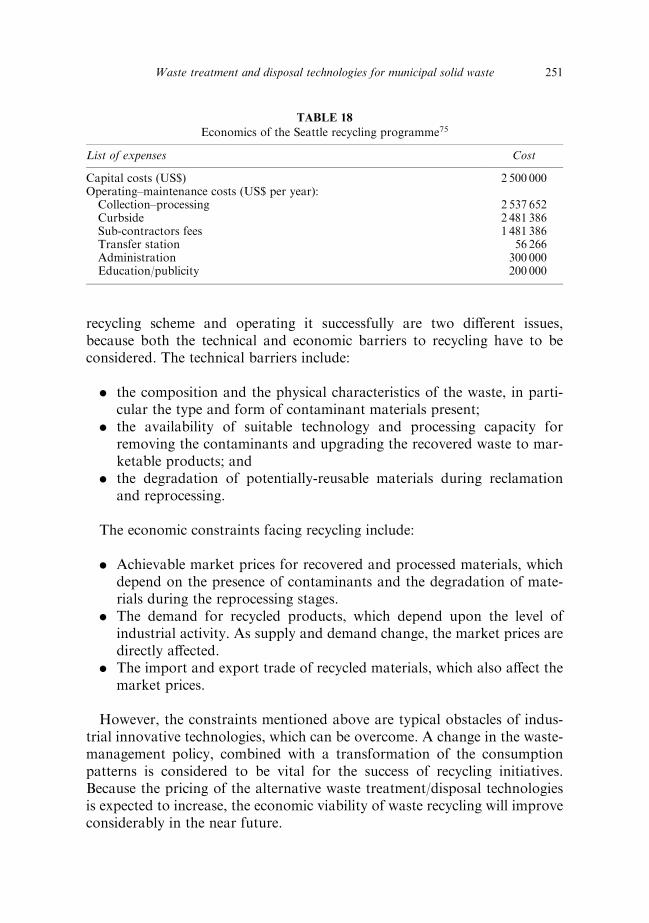
recycling scheme and operating it successfully are two di�erent issues,because both the technical and economic barriers to recycling have to beconsidered. The technical barriers include:
. the composition and the physical characteristics of the waste, in parti-cular the type and form of contaminant materials present;
. the availability of suitable technology and processing capacity forremoving the contaminants and upgrading the recovered waste to mar-ketable products; and
. the degradation of potentially-reusable materials during reclamationand reprocessing.
The economic constraints facing recycling include:
. Achievable market prices for recovered and processed materials, whichdepend on the presence of contaminants and the degradation of mate-rials during the reprocessing stages.
. The demand for recycled products, which depend upon the level ofindustrial activity. As supply and demand change, the market prices aredirectly a�ected.
. The import and export trade of recycled materials, which also a�ect themarket prices.
However, the constraints mentioned above are typical obstacles of indus-trial innovative technologies, which can be overcome. A change in the waste-management policy, combined with a transformation of the consumptionpatterns is considered to be vital for the success of recycling initiatives.Because the pricing of the alternative waste treatment/disposal technologiesis expected to increase, the economic viability of waste recycling will improveconsiderably in the near future.
TABLE 18
Economics of the Seattle recycling programme75
List of expenses Cost
Capital costs (US$) 2 500 000Operating±maintenance costs (US$ per year):Collection±processing 2 537 652Curbside 2 481 386Sub-contractors fees 1 481 386Transfer station 56 266Administration 300 000Education/publicity 200 000
Waste treatment and disposal technologies for municipal solid waste 251
REFERENCES
1. Cornwell, D. A. and Mackenzie, L. D., Introduction to Environmental Engi-neering, 2nd edn. McGraw-Hill, New York, 1991.
2. Campbell, D. J. V., Land®ll-gas migration, e�ects and control. In SanitaryLand®lling: Process, Technology and Environmental Impact, eds T. H. Chris-tensen, R. Cossu and R. Stegmann. Academic Press, London, 1989.
3. DoE, Pollution Paper No. 27: Dioxins in the Environment. Department of theEnvironment, HMSO, London, 1989.
4. IPCC, Climate Change 1992: The Supplementary Report to the IPCC Scienti®cAssessment. Cambridge University Press, Cambridge, UK, 1992.
5. Gendebien, A., Pauwels, M., Constyant, M., Ledrut-Damanert, M. J., Nyns, E.J., Willumsen, H. C., Butson, J., Fabry, R. and Ferrero, G. L., Land®ll Gasfrom Environment to Energy. EUR 14017/1 EN, Commission of the EuropeanCommunities, Luxembourg, 1992.
6. Young, P. J. and Parker, A., Origin and control of land®ll odours. Chemistryand Industry, 1984, 9, 329±334.
7. Young, P. J. and Heasman, L. A., The Composition and Environmental Impact ofHousehold Waste Derived Land®ll-Gas: The First Six Months of Gas Production.AERE G3369, Harwell Laboratory, Oxon., UK, 1985.
8. European Commission, Draft Directive on the Land®ll of Waste. O�cial Journalof the European Commission, OJC 212, Luxembourg, 1993.
9. Behrmann J., Cenci, C. and Emerson, C., California's land®ll gas testing pro-gramme: an overview and preliminary state-wide results. Paper presented at theGRCDA 12th Annual International Land®ll-Gas Symposium, 20±23 March1989, Monterey, CA, USA.
10. Christensen T. H., Land®lling of Waste: Leachate. Elsevier Science, London,1992.
11. Knox, K., Practice and Trends in Land®ll in the UK. See Christensen T. H.,Land®lling of Waste: Leachate. Elsevier Science, London, 1992, pp. 533±548.
12. Croft, B. and Campbell, D., Characterisation of 100 UK land®ll sites. HarwellWaste-Management Symposium Proceedings, 1989.
13. DoE, Externalities from Land®ll and Incineration. Department of the Environ-ment, HMSO, London, 1993.
14. DoE, Waste-management paper no. 26: Land®lling wastes, a technical memor-andum for the disposal of wastes on land®ll sites. Department of the Environ-ment, HMSO, London, 1986.
15. DoE, Draft Waste-Management Paper 26A: Land®ll Completion. Department ofthe Environment, HMSO, London, 1993.
16. RCEP, Incineration of Waste, 17th Report. Royal Commission on Environ-mental Pollution, HMSO, London, 1993.
17. Kut, D. and Gerard H., Waste Recycling for Energy Conservation. ArchitecturalPress, London, 1981.
18. ETSU, An assessment of mass-burn incineration costs. Energy TechnologySupport Unit Report No. BR1 /00341/REP, by WS Atkins Consultants Ltd.Department of Trade and Industry, London, 1993.
19. Hagenmaier, H., Brunner, H., Haag, R., Kraft, M. and Lutzke, K., Problemsassociated with the measurement of PCDD and PCDF emissions from wasteincineration plants. Paper presented at the Specialised Seminar on Incinerator
252 E. Daskalopoulos, O. Badr, S. D. Probert
Emissions of Heavy Metals and Particulate, 18±19 September 1987, Copen-hagen, Denmark.
20. Buekens, A. and Schoeters, J., Thermal methods in waste disposal. Study per-formed for the EEC under contract number ECI 1011/B7210/83/B, EuropeanCommission, Brussels, 1984.
21. Krause, H. H., In Incinerating Municipal and Industrial Waste, ed. R. W. Bryers.Hemisphere, New York 1991.
22. Law, S. L. and Gordon, G. E., Sources of metals in municipal incineratoremissions. Environmental Science Technology, 1979, 13, 432±438.
23. Buekens, A. and Patrick, P. K., In Solid Waste-Management, ed. M. J. Suess,World Health Organisation, Copenhagen, 1985.
24. Bouscaren, R., Reduction of the emissions of heavy metals in incineration ofwastes. Paper presented at the Seminar on Recovery of Energy from Municipaland Industrial Waste through Combustion, 21±24 June 1988, Churchill College,Cambridge, UK.
25. Greenberg, R. R., Zoller, W. H. and Gordon, G. E., Composition and size dis-tribution of particles relased in refuse incineration. Environmental ScienceTechnology, 1978, 12, 566±573.
26. Brunner, P. H. and Monch, H., The ¯ux of metals through municipal solidwaste incinerators. Paper presented at the Specialised Seminar on IncineratorEmissions of Heavy Metals and Particulates, 18±19 September, 1985, Copen-hagen, Denmark.
27. Brunner, C. R., Hazardous Air Emissions from Incineration. Chapman and Hall,New York, 1985.
28. Frankiewitz, W. T., Energy from Waste, London, 1978.29. Reimann, D. O., Treatment of waste-water from refuse incineration. Waste
Management Resource, 1987, 5(2), 147±157.30. Barnes, N., Operational performance of waste-to-energy plants. Paper presented
at the Seminar organised by the Steam Plant Committee, 26 February 1985.Power Industry Division, Institution of Mechanical Engineers, StrathclydeUniversity, UK.
31. Brock, P., CHP/DH: the incineration challenge. MSc. thesis, School ofMechanical Engineering, Cran®eld University, UK, 1992.
32. Haug, R. T., Compost Engineering. Ann Arbor Science, New York, 1980.33. Haug, R. T., A Practical Handbook on Compost Engineering. Lewis, 1993.34. Goldstein, N. and Steuteville, R., Solid waste seeks its niche. Biocycle, Novem-
ber 1994, 30±35.35. Goldstein, N. and Steuteville, R., 1994 Biocycle MSW survey: solid waste com-
posting plants in a steady state. Biocycle, February, 1995, 48±56.36. Liss, G., Yard-waste collection spreads branches of growth. World Wastes,
1994, 34±40.37. Gies, G., Canada explores approaches for source separated organics. Biocycle,
November, 1994, 36±38.38. Javoral, P.,Low-cost collection: drop-o� programme diverts yard trimmings.
Biocycle, June, 1994, 38±40.39. Brinton R. E. and Brinton, W. F., Bavarian on-farm composting. Biocycle,
June, 1994, 47±49.40. Biocycle, Composting Source Separated Organics. JG Press, Emmaus, PA, USA,
1994.
Waste treatment and disposal technologies for municipal solid waste 253
41. Platt, B. A., Friedman, N., Grodinsky, C. and Suozzo, M., In Depth Studies ofRecycling and Composting Programmes: Designs, Costs and Results, Vol. 1:Rural Communities. Institute for Local Self Reliance, Washington DC, 1992.
42. Epstein, E, Alpert, J. E. and Gould, M., Composting: engineering practices andeconomic analysis. Water Science Technology, 1983, 15), 157±163.
43. Taylor, A. C. and Kashmanian, R. M., Study Assessment of Eight Yard-wasteComposting Programmes Across the United States. US Environmental Protec-tion Agency, 1988.
44. Marowski, D. G., Environmental Viewpoints, Gale Research International Ltd,1992.
45. Noll, E.K., Haas, C. H., Schmidt C. and Kodukula, P. (eds) Recovery, Recycleand Reuse of Industrial Waste. Lewis, 1985.
46. Barton, J. R., Recycling of packaging: source separation or centralised treat-ment. Paper presented at the one day symposium, Institute of Wastes Manage-ment, 4 October 1989, Baden Powell House, Kensington, London.
47. EDF, Coming Full Circle. Successful Recycling Today. The EnvironmentalDefense Fund, New York, 1987.
48. Hahn, E., Ecological urban reconstruction: urban environmental problems andenvironmental strategies in di�erent social systems. Paper presented to theEuropean Colloquium, 4±6 December 1989, Academy of the Urban Environ-ment, Urban Ecology and Urban Open-Space Planning, Berlin, Germany, 1991.
49. Pollock, C., Mining Urban Wastes: The Potential for Recycling. WorldWatchPaper 76. WorldWatch Institute, Washington, DC, USA, 1987.
50. Gandy, M., Recycling and Waste: An Exploration of Contemporary Environ-mental Policy. Aldershot, Avebury, 1993.
51. DeYoung, R., Some Psychological Aspects of Recycling: The Structure ofConservations Satisfactions. Environment and Behaviour, 1986, 18(4), 435±449.
52. Vining, J. and Ebreo, A., What makes a recycler? A comparison of recyclers andnon-recyclers. Environment and Behaviour, 1990, 22(1), 55±73.
53. Langer, H., Strategies for the use of waste paper outside the paper industry.Proceedings of the International Recycling Congress, Recycling Berlin '79,Berlin, Germany, 1979.
54. Swartzbaugh, J. T., Diaz, L. F., Duval, D. S. and Savage, G. M., RecyclingEquipment and Technology for Municipal Solid Waste Materials Recovery Facil-ities. Noyes Data, Park Ridge, NJ, USA, 1993.
55. Daly, H., The Steady State Economy; What, Why and How? The SustainableSociety: Implications for Limited Growth. Praeger, London, 1977.
56. Hayes, D., Repairs, Reuse, Recycling: First Steps Toward a Sustainable Society.Worldwatch Paper 23. Worldwatch Institute, Washington, DC, 1978.
57. Schumacher, E. F., Small is Beautiful. Abacus, London, 1974.58. Thomas, C., Material Gains: Reclamation, Recycling and Reuse. Earth Resour-
ces, London, 1979.59. Young, J. E., Discarding the Throwaway Society. Worldwatch Institute,
Washington, DC, USA, 1991.60. Castle, K., The Recyclers Guide to Greater London and Beyond: A Handbook for
Resource Recovery. London Energy and Employment Network, London, 1986.61. Cointreau, S. J., Gunnerson, C. G., Huls, J. M. and Sheldman, N. N., Recycling
from Municipal Refuse: A State-of-the-Art Review and Annotated Bibliography.The World Bank, New York, 1984.
254 E. Daskalopoulos, O. Badr, S. D. Probert
62. Linberg, R. A. and Akagi, R. H., Reclamation 1975±2000: A Key to EconomicalSurvival. Dun and Bradstreet, New York, 1974.
63. GLC, Recycling Begins at Home: The GLC Recycling Programme 1981±1986.Greater London Council, London, 1986.
64. Gandy, M., The recycling of household waste: urban environmental policy inLondon and Hamburg. Ph.D. thesis, London School of Economics, London,UK, 1992.
65. Chapman, P. F., Energy costs of producing copper and aluminium from pri-mary and secondary sources. Paper presented to the Conservation of MaterialsConference, 26±27 March 1974, Harwell, UK.
66. Schertz, W., Possibilities for separating and recycling lined cardboard contain-ers. In Thome-Kosmiensky editions, Berlin, Germany, 1984.
67. Elkin, T. and McLaren, D., Reviving the City: Towards Sustainable UrbanDevelopment. Friends of the Earth and the Policy Studies Institute, London,1991.
68. Chandler, W. U., Materials Recycling: The Virtue of Necessity. WorldwatchPaper 56, Worldwatch Institute, Washington, DC, USA, 1983.
69. Dyson, B. H., E�cient utilisation of materials: one answer to our balance ofpayments problem. Paper presented to the Conservation of Materials Con-ference, 26±27 March 1974, Harwell, UK.
70. Risch, R. W. K., The raw-material supply of the European Community: Theimportance of secondary raw materials. Resource Policy, 1978, 4), 181±188.
71. Letcher, R. C. and Scheil, M., Source separation and citizen recycling. In TheSolid-Waste Handbook: A Practical Guide, ed. W. D. Robinson. John Wiley andSons, New York, 1986.
72. Roderique J., Four MRFs in action. Biocycle, March, 1989, 54±59.73. DoE, A survey of English Local Authority Recycling Plans. A study by Coopers
and Lybrand for the Department of the Environment, HMSO, London, 1993.74. Platt, B. A., Friedman, N., Grodinsky, C. and Suozzo, M., In Depth Studies of
Recycling and Composting Programmes: Designs, Costs and Results, Vol. II:Suburban Areas/Small Cities. Institute for Local Self Reliance, Washington,DC, USA, 1992.
75. Platt, B. A., Friedman, N., Grodinsky, C. and Suozzo, M., In Depth Studies ofRecycling and Composting Programmes: Designs, Costs and Results, Vol. III:Urban Areas. Institute for Local Self Reliance, Washington, DC, USA, 1992.
Waste treatment and disposal technologies for municipal solid waste 255