economic analysis of anaerobic digestion- a case of...
TRANSCRIPT
1
Economic analysis of anaerobic digestion- A case of Green power biogas plant in the Netherlands
Abstract One of the key concerns of biogas plants is the disposal of comparatively large amounts of digestates in an
economically and environmentally sustainable manner. This paper analyses the economic performance of
anaerobic digestion of a given biogas plant. A scenario analysis is carried out based on a linear
programming model to identify feedstocks that optimize electricity production and to determine the
optimal application of digestate. The economic analysis is also based on NPV and IRR concepts, to assess
the cost-effectiveness of the biogas system. In addition to a default scenario, management and policy
scenarios were investigated. Our findings show that treating RO as green fertilizer as opposed to manure
(default scenario) is not only lucrative for the plant but also lessens the environmental burden of long
distance transportation of concentrates. This paper also concludes that given the uncertainty of regulations
concerning RO and the currently low values of digestate and heat, high investment and operating costs
limit the feasibility of anaerobic digestion of wastes of farm origin and other co-substrates unless subsidies
are provided.
Key words: Anaerobic digestion, biogas plant, methane yield, reverse osmosis (RO), linear programming (LP) model 1. Introduction Manure residues from livestock industries have for long been identified as a major source of
environmental pollution. Traditionally, these wastes have been disposed of, directly or after composting,
as soil amendments in the agricultural industry. Since this practice has resulted in the degradation of air,
soil, and water resources, new regulations for protecting the environment have been promulgated to
control land application of animal manure (Van Horn et al., 1994). The nitrate-directive, 91/676/EEC
regulates the input of nitrate on farmland, aiming to protect the ground and surface water environment
from nitrate pollution. In principle, not more than 170 kg animal manure N may be applied per ha per year
insofar as this is not in conflict with application standard for total P (Schroder and Neeteson 2008). The
implementation of these environmental measures entails high costs of manure disposal for livestock
farmers. As such, livestock industries and regulatory agencies are seeking alternatives for managing
manure residues in an economically feasible and environmentally friendly manner. Several studies have
shown that anaerobic digestion (AD) of organic wastes has the potential to manage these problems in a
cost effective and environmentally sustainable manner.
Interest has recently been growing in the AD of organic waste of farm origin such as manure, crop
residues and organic residues from food and agro-industries to generate renewable energy (Braun et al.,
Finance - Borrowing - Lending17th International Farm Management Congress, Bloomington/Normal, Illinois, USA Case Study
July 2009
2
2002 and Weiland and Hassan, 2001). Processing manure to biogas through AD recovers energy that
contributes no net carbon to the atmosphere (Martin, 2003) and reduces the risk from pathogens from land
spreading, as thermophilic or mesophilic AD with a sanitization step destroys all or virtually all pathogens
(Birkmose, 2000).
Besides biogas, AD produces digestate, which consists of a mixture of liquid and solid fractions.
Applying digestate to the land is the most attractive option in terms of environmental issues (Gomez et al.
2005). A reliable and generally accepted means of disposing of the comparatively large amounts of
digestate produced is of crucial importance for the economic and environmental viability of a biogas plant
(Borjesson and Berglund, 2006). Murphy and Power (2008) investigated biogas production utilizing three
different crop rotations to optimize energy production. Georgakakis et al. (2003) developed an economic
evaluation model based on the concept of NPV to assess the cost-effectiveness of biogas production
systems fed with pig manure. However, a complete economic analysis of AD incorporating outcomes
from the production and application of digestate is still lacking.
The aim of this study is to analyse the economic performance of AD of a given biogas plant. A
linear programming (LP) model is developed to identify feedstocks that optimize electricity production
and determine optimal application of digestate. Green power biogas plant, a relatively large plant, located
in the northern part of the Netherlands forms the basis for our analysis.
The paper is structured as follows. Section 2 introduces the case study. Section 3 will elaborate on
the general framework, the data and assumptions made for developing the optimization model. Section 4
will analyze the model results and scenarios assessed. The final section contains the discussion and major
conclusions.
2. Case study description Green power biogas plant was established in 2007 by 50 swine farmers with an installation capacity of
70,000 tons of input on an annual basis. The total investment cost of the plant was €6.75 million, which
accounts for silos, CHP unit, decanter, dryer and land. The important starting point for the plant was its
commitment to process a contracted amount of pig manure from its member farmers. A schematic of
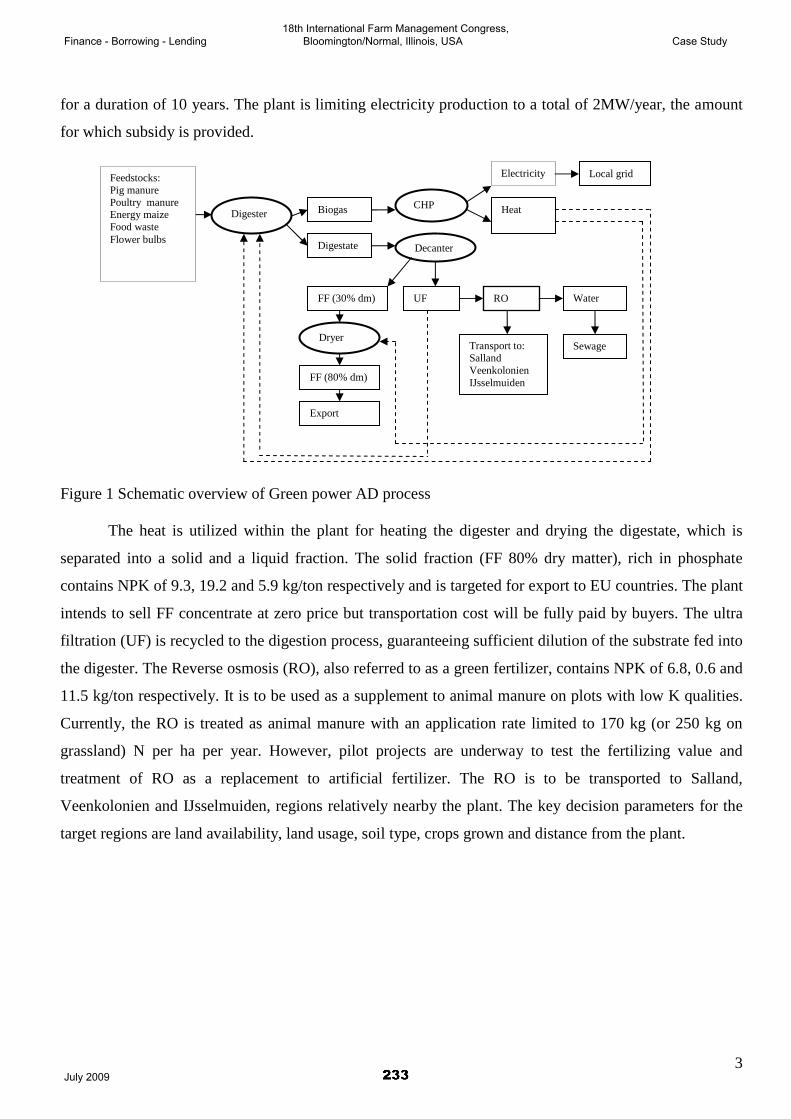
Green power AD process is given in Figure 1.
The input materials are mixed, grinded and pumped to 2 pre-fomenters of 600 m3 each. The
fermentation starts and the mixture stays a week in these silos. This pre-fermented product flows to the
main fermentor of 1800m3 and stays there for 40 days at 40 degrees. The biogas is burned in a combined
heat and power generation (CHP) unit to generate electric power and heat. The electricity produced is sold
to the local grid at a market price of €0.06/kwh with additional receipt of an MEP subsidy (€0.097/kwh)
Finance - Borrowing - Lending18th International Farm Management Congress, Bloomington/Normal, Illinois, USA Case Study
July 2009
3
for a duration of 10 years. The plant is limiting electricity production to a total of 2MW/year, the amount
for which subsidy is provided.
Figure 1 Schematic overview of Green power AD process
The heat is utilized within the plant for heating the digester and drying the digestate, which is
separated into a solid and a liquid fraction. The solid fraction (FF 80% dry matter), rich in phosphate
contains NPK of 9.3, 19.2 and 5.9 kg/ton respectively and is targeted for export to EU countries. The plant
intends to sell FF concentrate at zero price but transportation cost will be fully paid by buyers. The ultra
filtration (UF) is recycled to the digestion process, guaranteeing sufficient dilution of the substrate fed into
the digester. The Reverse osmosis (RO), also referred to as a green fertilizer, contains NPK of 6.8, 0.6 and
11.5 kg/ton respectively. It is to be used as a supplement to animal manure on plots with low K qualities.
Currently, the RO is treated as animal manure with an application rate limited to 170 kg (or 250 kg on
grassland) N per ha per year. However, pilot projects are underway to test the fertilizing value and
treatment of RO as a replacement to artificial fertilizer. The RO is to be transported to Salland,
Veenkolonien and IJsselmuiden, regions relatively nearby the plant. The key decision parameters for the
target regions are land availability, land usage, soil type, crops grown and distance from the plant.
Electricity
Heat
Digestate
Local grid
FF (30% dm) RO UF Water
Feedstocks: Pig manure Poultry manure Energy maize Food waste Flower bulbs
Biogas Digester CHP
Decanter
Dryer
FF (80% dm)
Export
Transport to: Salland Veenkolonien IJsselmuiden
Sewage
Finance - Borrowing - Lending18th International Farm Management Congress, Bloomington/Normal, Illinois, USA Case Study
July 2009
4
3. Model description 3.1 Linear programming (LP) After specifying a set of decision variables and constraints, linear programming is used in this study to
maximize profit of the plant from sales of electricity and digestate application. A standard LP model with
a profit-maximizing objective can be expressed as:
MjX
NibXa
toSubject
XcZMaximize
j
ij
m
jij
m
jjj
K
K
10
1
:
1
1
=≥
=≤
=
∑
∑
=
=
where X= vector of activities; cj = gross margin per unit of activity j; aij = technical coefficients;
and bi = availability of resource i.
The activities which were identified as being relevant for the current study are classified as
producing and selling of electricity and digestates, transporting of biomass to factory, hiring of people,
transporting RO to target regions and storing digestates. The constraints relate to treatment capacity of the
plant and digestate application. Moreover, the model will take cognizance of nutrient content of the
concentrate as well as nutrient uptake of crops per each type of soil in each region and hence, the total
amount of nutrients transported to a region should be less than or equal to the maximum nutrient uptake of
that region.
3.2 Model parameterization and assumptions Table 1, derived from the plant’s records, depicts labor allocated to final products and the current
proportion and cost of each feedstock. The model will only consider the feedstocks currently used by the
plant but will vary the proportion of feedstocks to see how the methane yield varies.
Finance - Borrowing - Lending18th International Farm Management Congress, Bloomington/Normal, Illinois, USA Case Study
July 2009
5
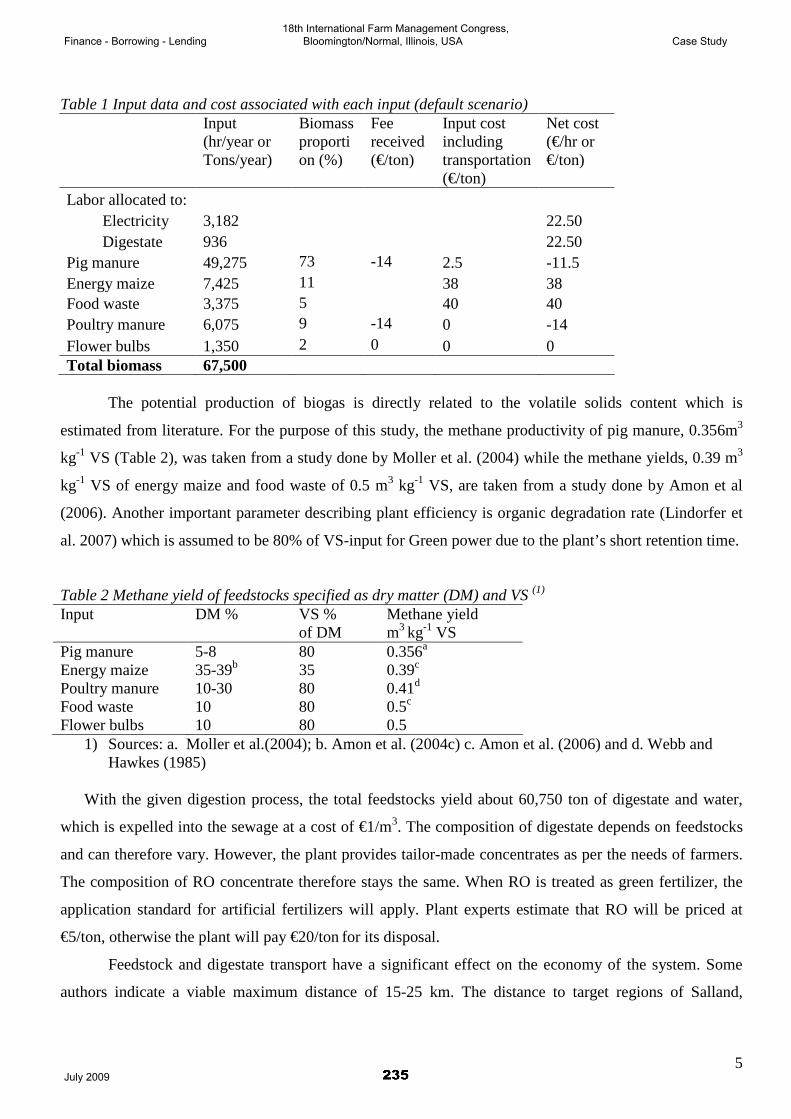
Table 1 Input data and cost associated with each input (default scenario) Input
(hr/year or Tons/year)
Biomass proportion (%)
Fee received (€/ton)
Input cost including transportation (€/ton)
Net cost (€/hr or €/ton)
Labor allocated to: Electricity 3,182 22.50 Digestate 936 22.50 Pig manure 49,275 73 -14 2.5 -11.5 Energy maize 7,425 11 38 38 Food waste 3,375 5 40 40 Poultry manure 6,075 9 -14 0 -14 Flower bulbs 1,350 2 0 0 0 Total biomass 67,500
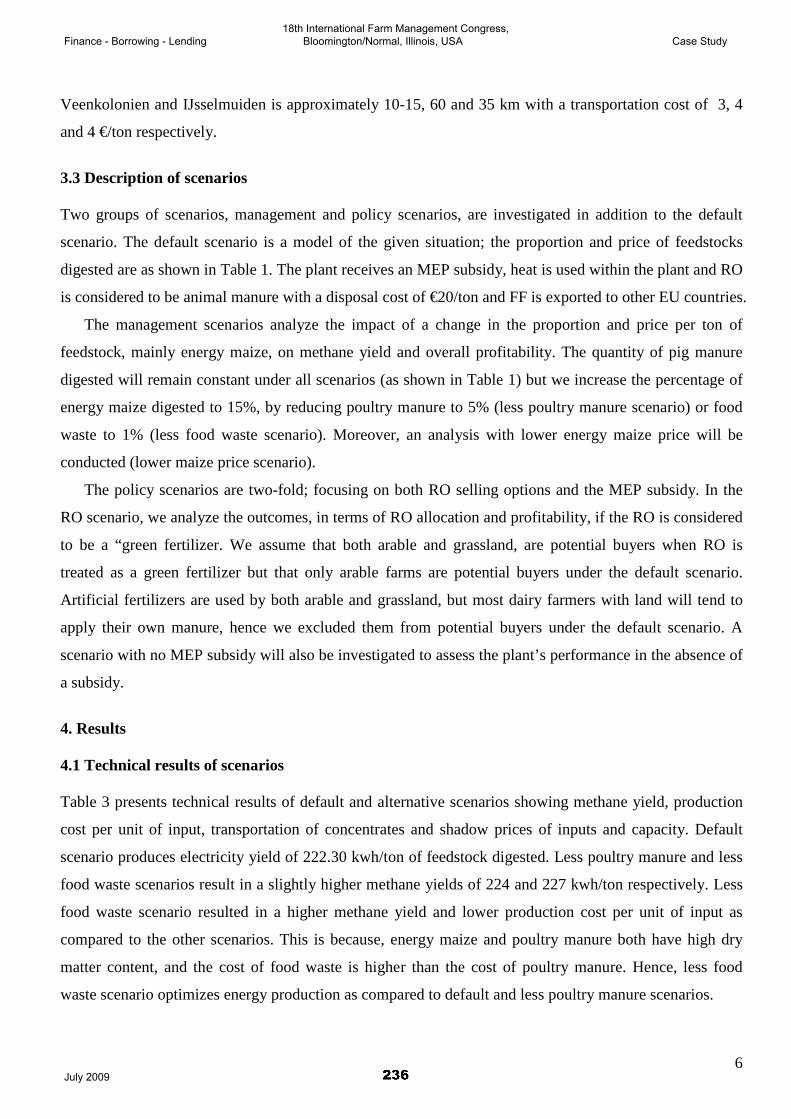
The potential production of biogas is directly related to the volatile solids content which is
estimated from literature. For the purpose of this study, the methane productivity of pig manure, 0.356m3
kg-1 VS (Table 2), was taken from a study done by Moller et al. (2004) while the methane yields, 0.39 m3
kg-1 VS of energy maize and food waste of 0.5 m3 kg-1 VS, are taken from a study done by Amon et al
(2006). Another important parameter describing plant efficiency is organic degradation rate (Lindorfer et
al. 2007) which is assumed to be 80% of VS-input for Green power due to the plant’s short retention time.
Table 2 Methane yield of feedstocks specified as dry matter (DM) and VS (1) Input DM % VS %
of DM Methane yield m3 kg-1 VS
Pig manure 5-8 80 0.356a Energy maize 35-39b 35 0.39c Poultry manure 10-30 80 0.41d Food waste 10 80 0.5c Flower bulbs 10 80 0.5
1) Sources: a. Moller et al.(2004); b. Amon et al. (2004c) c. Amon et al. (2006) and d. Webb and Hawkes (1985)
With the given digestion process, the total feedstocks yield about 60,750 ton of digestate and water,
which is expelled into the sewage at a cost of €1/m3. The composition of digestate depends on feedstocks
and can therefore vary. However, the plant provides tailor-made concentrates as per the needs of farmers.
The composition of RO concentrate therefore stays the same. When RO is treated as green fertilizer, the
application standard for artificial fertilizers will apply. Plant experts estimate that RO will be priced at
€5/ton, otherwise the plant will pay €20/ton for its disposal.
Feedstock and digestate transport have a significant effect on the economy of the system. Some
authors indicate a viable maximum distance of 15-25 km. The distance to target regions of Salland,
Finance - Borrowing - Lending18th International Farm Management Congress, Bloomington/Normal, Illinois, USA Case Study
July 2009
6
Veenkolonien and IJsselmuiden is approximately 10-15, 60 and 35 km with a transportation cost of 3, 4
and 4 €/ton respectively.
3.3 Description of scenarios Two groups of scenarios, management and policy scenarios, are investigated in addition to the default
scenario. The default scenario is a model of the given situation; the proportion and price of feedstocks
digested are as shown in Table 1. The plant receives an MEP subsidy, heat is used within the plant and RO
is considered to be animal manure with a disposal cost of €20/ton and FF is exported to other EU countries.
The management scenarios analyze the impact of a change in the proportion and price per ton of
feedstock, mainly energy maize, on methane yield and overall profitability. The quantity of pig manure
digested will remain constant under all scenarios (as shown in Table 1) but we increase the percentage of
energy maize digested to 15%, by reducing poultry manure to 5% (less poultry manure scenario) or food
waste to 1% (less food waste scenario). Moreover, an analysis with lower energy maize price will be
conducted (lower maize price scenario).
The policy scenarios are two-fold; focusing on both RO selling options and the MEP subsidy. In the
RO scenario, we analyze the outcomes, in terms of RO allocation and profitability, if the RO is considered
to be a “green fertilizer. We assume that both arable and grassland, are potential buyers when RO is
treated as a green fertilizer but that only arable farms are potential buyers under the default scenario.
Artificial fertilizers are used by both arable and grassland, but most dairy farmers with land will tend to
apply their own manure, hence we excluded them from potential buyers under the default scenario. A
scenario with no MEP subsidy will also be investigated to assess the plant’s performance in the absence of
a subsidy.
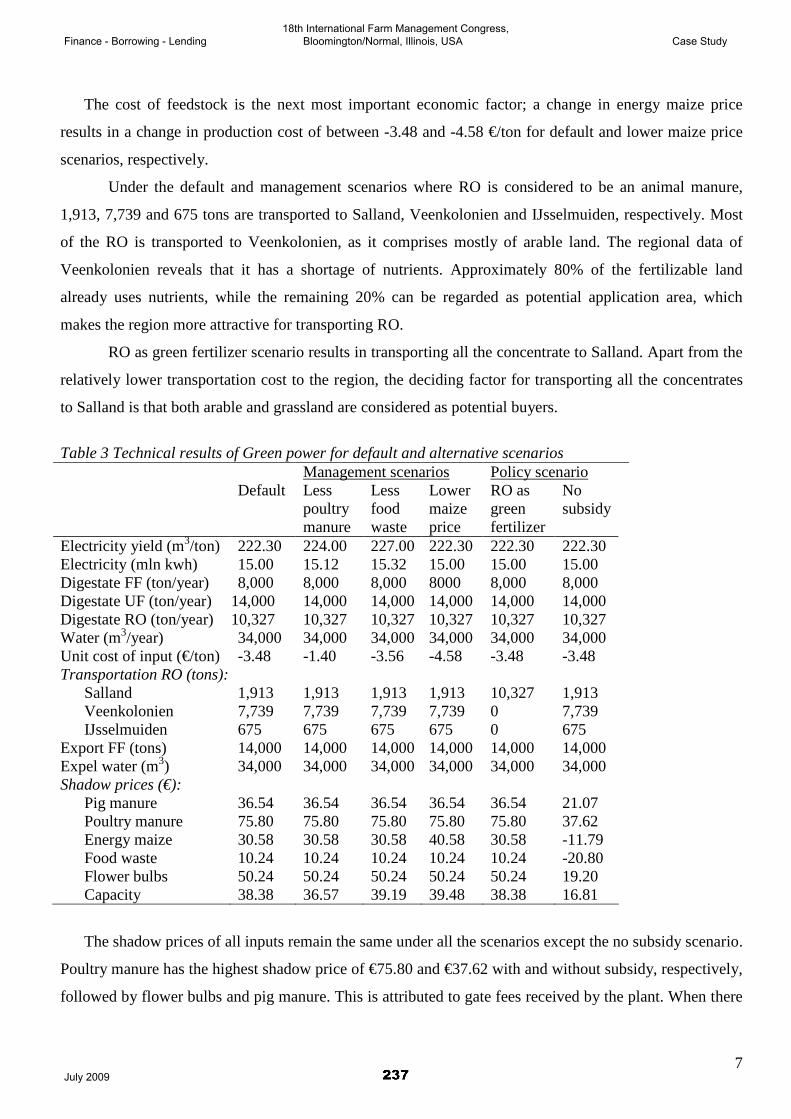
4. Results 4.1 Technical results of scenarios Table 3 presents technical results of default and alternative scenarios showing methane yield, production
cost per unit of input, transportation of concentrates and shadow prices of inputs and capacity. Default
scenario produces electricity yield of 222.30 kwh/ton of feedstock digested. Less poultry manure and less
food waste scenarios result in a slightly higher methane yields of 224 and 227 kwh/ton respectively. Less
food waste scenario resulted in a higher methane yield and lower production cost per unit of input as
compared to the other scenarios. This is because, energy maize and poultry manure both have high dry
matter content, and the cost of food waste is higher than the cost of poultry manure. Hence, less food
waste scenario optimizes energy production as compared to default and less poultry manure scenarios.
Finance - Borrowing - Lending18th International Farm Management Congress, Bloomington/Normal, Illinois, USA Case Study
July 2009
7
The cost of feedstock is the next most important economic factor; a change in energy maize price
results in a change in production cost of between -3.48 and -4.58 €/ton for default and lower maize price
scenarios, respectively.
Under the default and management scenarios where RO is considered to be an animal manure,
1,913, 7,739 and 675 tons are transported to Salland, Veenkolonien and IJsselmuiden, respectively. Most
of the RO is transported to Veenkolonien, as it comprises mostly of arable land. The regional data of
Veenkolonien reveals that it has a shortage of nutrients. Approximately 80% of the fertilizable land
already uses nutrients, while the remaining 20% can be regarded as potential application area, which
makes the region more attractive for transporting RO.
RO as green fertilizer scenario results in transporting all the concentrate to Salland. Apart from the
relatively lower transportation cost to the region, the deciding factor for transporting all the concentrates
to Salland is that both arable and grassland are considered as potential buyers.
Table 3 Technical results of Green power for default and alternative scenarios Management scenarios Policy scenario Default Less
poultry manure
Less food waste
Lower maize price
RO as green fertilizer
No subsidy
Electricity yield (m3/ton) Electricity (mln kwh) Digestate FF (ton/year) Digestate UF (ton/year) Digestate RO (ton/year) Water (m3/year) Unit cost of input (€/ton) Transportation RO (tons):
Salland Veenkolonien IJsselmuiden
Export FF (tons) Expel water (m3) Shadow prices (€):
Pig manure Poultry manure Energy maize Food waste Flower bulbs Capacity
222.30 15.00 8,000
14,000 10,327 34,000 -3.48 1,913 7,739 675 14,000 34,000 36.54 75.80 30.58 10.24 50.24 38.38
224.00 15.12 8,000 14,000 10,327 34,000 -1.40 1,913 7,739 675 14,000 34,000 36.54 75.80 30.58 10.24 50.24 36.57
227.00 15.32 8,000 14,000 10,327 34,000 -3.56 1,913 7,739 675 14,000 34,000 36.54 75.80 30.58 10.24 50.24 39.19
222.30 15.00 8000 14,000 10,327 34,000 -4.58 1,913 7,739 675 14,000 34,000 36.54 75.80 40.58 10.24 50.24 39.48
222.30 15.00 8,000 14,000 10,327 34,000 -3.48 10,327 0 0 14,000 34,000 36.54 75.80 30.58 10.24 50.24 38.38
222.30 15.00 8,000 14,000 10,327 34,000 -3.48 1,913 7,739 675 14,000 34,000 21.07 37.62 -11.79 -20.80 19.20 16.81
The shadow prices of all inputs remain the same under all the scenarios except the no subsidy scenario.
Poultry manure has the highest shadow price of €75.80 and €37.62 with and without subsidy, respectively,
followed by flower bulbs and pig manure. This is attributed to gate fees received by the plant. When there
Finance - Borrowing - Lending18th International Farm Management Congress, Bloomington/Normal, Illinois, USA Case Study
July 2009
8
is no subsidy, energy maize and food waste have significantly lower or negative shadow prices, implying
that increasing these feedstocks is not economical. Though energy maize and food waste both have high
methane yields, their high costs result in a lower shadow prices. Therefore, increasing poultry manure in
the total feedstocks would bring a better result under all the scenarios as compared to increasing other
feedstocks. The shadow prices of energy maize and capacity are sensitive to price of energy maize. A one
unit (ton) increase in capacity will result in an increase in gross margin of €38.38 under default scenario
but the increase is larger, €39.48, with a lower energy maize price. The shadow prices are important
decision parameters, as they allow model users to determine whether certain potential changes in the given
situation might actually increase profitability.
4.2 Economic results of scenarios
Table 4 shows gross revenues, costs, profit before taxes, net present value (NPV) and internal rate of
return (IRR) for all scenarios investigated. The economic results follow from the technical results. Default
scenario resulted in earning a profit before tax of €1.2 million, showing a positive NPV of €4.2 million
and an IRR of 21%. The IRR is the discount rate for which the total present value of future cash flows
equals the cost of the investment. With subsidy, less poultry manure scenario resulted in the least profit
before tax and NPV due to higher total feedstock costs. RO as green fertilizer scenario resulted in the
highest profit before tax and an NPV of €1.4 million and €6.3 million respectively as a result of increased
revenues from selling RO as a green fertilizer. In no subsidy situation, the plant operates under a loss and
a substantial decline in NPV and IRR (showing a negative value) is observed, implying the subsidy plays
a great role in the profitability of the plant.
Finance - Borrowing - Lending18th International Farm Management Congress, Bloomington/Normal, Illinois, USA Case Study
July 2009
9
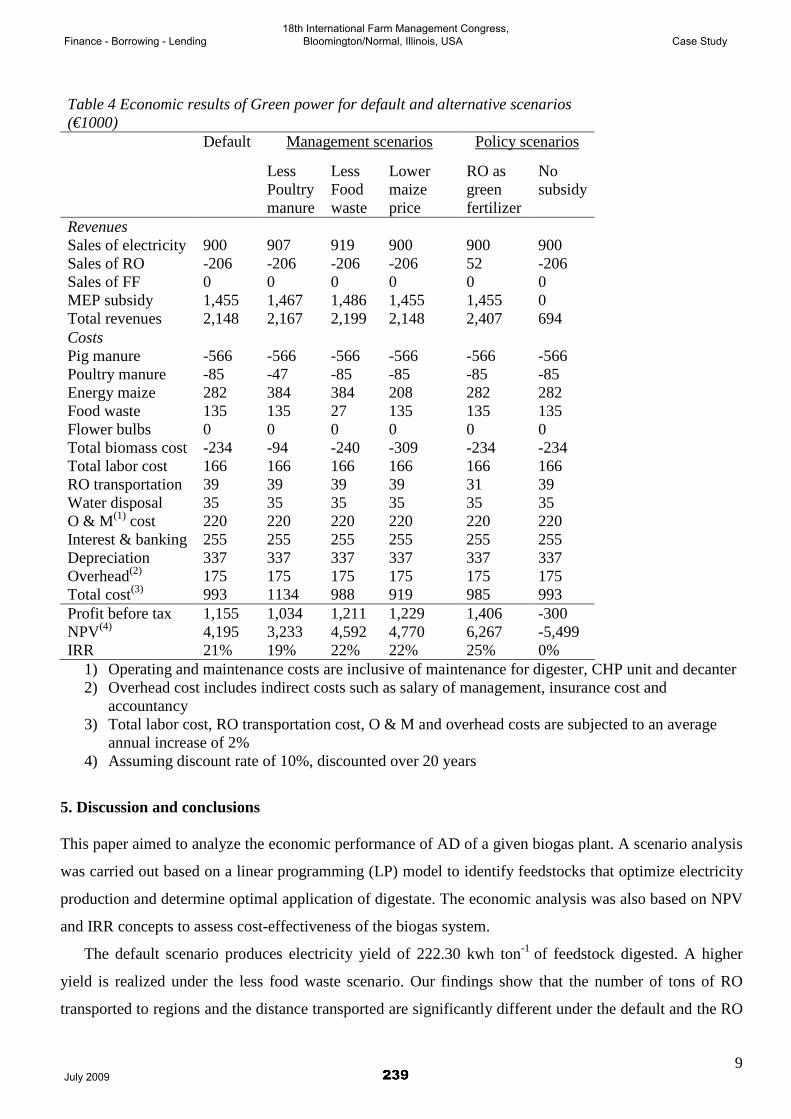
Table 4 Economic results of Green power for default and alternative scenarios (€1000)
Default Management scenarios Policy scenarios
Less Poultry manure
Less Food waste
Lower maize price
RO as green fertilizer
No subsidy
Revenues Sales of electricity 900 907 919 900 900 900 Sales of RO -206 -206 -206 -206 52 -206 Sales of FF 0 0 0 0 0 0 MEP subsidy 1,455 1,467 1,486 1,455 1,455 0 Total revenues 2,148 2,167 2,199 2,148 2,407 694 Costs Pig manure -566 -566 -566 -566 -566 -566 Poultry manure -85 -47 -85 -85 -85 -85 Energy maize 282 384 384 208 282 282 Food waste 135 135 27 135 135 135 Flower bulbs 0 0 0 0 0 0 Total biomass cost -234 -94 -240 -309 -234 -234 Total labor cost 166 166 166 166 166 166 RO transportation 39 39 39 39 31 39 Water disposal 35 35 35 35 35 35 O & M(1) cost 220 220 220 220 220 220 Interest & banking 255 255 255 255 255 255 Depreciation 337 337 337 337 337 337 Overhead(2) 175 175 175 175 175 175 Total cost(3) 993 1134 988 919 985 993 Profit before tax 1,155 1,034 1,211 1,229 1,406 -300 NPV(4) 4,195 3,233 4,592 4,770 6,267 -5,499 IRR 21% 19% 22% 22% 25% 0%
1) Operating and maintenance costs are inclusive of maintenance for digester, CHP unit and decanter 2) Overhead cost includes indirect costs such as salary of management, insurance cost and
accountancy 3) Total labor cost, RO transportation cost, O & M and overhead costs are subjected to an average
annual increase of 2% 4) Assuming discount rate of 10%, discounted over 20 years
5. Discussion and conclusions This paper aimed to analyze the economic performance of AD of a given biogas plant. A scenario analysis
was carried out based on a linear programming (LP) model to identify feedstocks that optimize electricity
production and determine optimal application of digestate. The economic analysis was also based on NPV
and IRR concepts to assess cost-effectiveness of the biogas system.
The default scenario produces electricity yield of 222.30 kwh ton-1 of feedstock digested. A higher
yield is realized under the less food waste scenario. Our findings show that the number of tons of RO
transported to regions and the distance transported are significantly different under the default and the RO
Finance - Borrowing - Lending18th International Farm Management Congress, Bloomington/Normal, Illinois, USA Case Study
July 2009
10
as green fertilizer scenarios. The concentrate will stay closer to the plant when it is treated as green
fertilizer, thus resulting in lower transportation costs and less environmental impact. Therefore, treating
RO as green fertilizer is not only lucrative for the plant but also lessens the environmental burden of long
distance transportation of concentrates. Moreover, it results in saving energy consumption for the
production of chemical fertilizers.
A synthesized economic evaluation of all scenarios except the no subsidy scenario shows a
positive NPV. The highest NPV and IRR values are observed under RO as green fertilizer scenario due to
increased revenues from selling RO. The no subsidy scenario results in a negative NPV, implying that
subsidy plays a great role in the profitability of the plant.
The economic analysis done in this study was based on a number of assumptions. The estimated
methane yield of feedstocks was generated from literature as the plant is in its starting up phase, and a
reliable estimate of technical performance could not be obtained. To insure that technical performance is
not overestimated, values for yield were corrected by 80% due to the plant’s short retention time. The
investment costs accounted for in the study include land value, which, in the given situation, is treated as
agricultural land as opposed to an industrial segment. The average price for an industrial segment is more
than six times the average price for agricultural land (Segeren and Luijt, 2002).
The implementation of this environmentally friendly technique depends widely on a political
framework that creates and provides an economically attractive incentive for running AD plants. Dutch
renewables policy has been criticized for having been too unstable to provide sufficient incentives for
investments in renewable energy technologies (van Rooijen and van Wees, 2006). The uncertainty in
receiving subsidies makes a highly cost-efficient system important. Our recommendations for biogas
plants to be profitable without a subsidy is to look for alternative revenues, for instance, from digestate
and heat or savings in feedstock costs by making a contract with arable farms to supply them with RO
concentrate in return for less expensive energy crops. At the moment, however, we can conclude that,
given the uncertainty of regulations concerning RO and the currently low values of digestate and heat,
high investment and operating costs limit the feasibility of AD of pig manure and other co-substrates
unless subsidies are provided.
Acknowledgement The study was funded by the agricultural economics research institute (LEI). Many thanks to the chairman
of Green power biogas plant, Mr. Jan Schokker for the interviews and for giving us a tour of the plant.
Finance - Borrowing - Lending18th International Farm Management Congress, Bloomington/Normal, Illinois, USA Case Study
July 2009
11
References Al Seadi T., Holm-Nielsen J. B. and Madsen M., 2006. Report on quality criteria for application of AD
sludge as bio- fertilizer in agriculture. Agrobiogas: Deliverable 5.
Amon T., Amon B., Krvvoruchko V., Machmuller A., Hopfner-sixt K., Bodiroza V., Hrbek R., Friedel J.,
Potsch E., Wagentristl H., Schreiner M., and Zollitsch W., 2007. Methane production through
anaerobic digestion of various energy crops grown in sustainable crop rotations. Bioresource
technology 98: 3204-3212.
Aucamp D.C. and Steinberg D.I., 1982. The Computation of Shadow Prices in Linear Programming.
Journal of the Operational Research Society 33: 557- 565.
Birkmose T., 2000. The Danish Agricultural Advisory Centre, The National Department of Crop
Production.
Borjesson P. and Berguld M., 2006. Environmental systems analysis of biogas systems- Part I: Fuel-cycle
emissions. Biomass and bioenergy 30: 469-485.
Braun R., 2007. Anaerobic digestion: a multi-faceted process for energy, environmental management and
rural development. Improvement of Crop Plants for Industrial End Uses: 335–416.
Braun R., Brachtl E. and Grasmug M., 2002. Potential of biowaste co-digestion, Proceedings of the
Seventh FAO/SREN-WORKSHP on Anaerobic digestion for Sustainability in Waste (Water)
Treatment and Re-use, 19–22 May 2002, Moscow, Russia, pp. 184–193.
CBS, 2006. StatLine data bank, Dierlijke mest.
European Commission, 1991. Council directive, 91/676/EEC of 12 December 1991 concerning the
protection of water against pollution caused by nitrates from agricultural sources. Off. J. Eur.
Commun. L375(12), 1–8.
Georgakakis D., Christopoulou N., Chatziathanassiou A. and Venetis T., 2003. Development and use of
an economic evaluation model to assess establishment of local centralized rural biogas plants in
Greece. Applied biochemistry and biotechnology 109:275-284.
Gomez X., Cuetos M.J., Garcıa A.I. and Moran A., 2005. Evaluation of digestate stability from anaerobic
process by thermogravimetric analysis. Thermochimica Acta 426: 179–184.
Henkens P. and Van Keulen H., 2001. Mineral policy in the Netherlands and nitrate policy within the
European Community. NJAS wageningen journal of life sciences, North America, 49: 117-134.
IEA bioenergy, task 24, Good practice in Quality Management of AD Residues.
Karpenstein-Machan M., 2005. Energiepflanzenbau fur Biogasanlagen-betreiber. DLG-Verlags-GmbH,
Frankfurt am Main, Germany.
Finance - Borrowing - Lending18th International Farm Management Congress, Bloomington/Normal, Illinois, USA Case Study
July 2009
12
Lindorfer H., Lopez P., Resch C., Braun R. and Kirchmayr R., 2007. The impact of increasing energy crop
addition on process performance and residual methane potential in anaerobic digestion. Water
science and technology 56: 55-63.
Lopez C.P., Kirchmayr R., Neureiter M. and Braun R., 2007. Effect of physical and chemical pre-
treatments on methane yield from maize silage and grains. Institute for Environmental
Biotechnology, department for Agrobiotechnology, BOKU-University of Natural Resources and
Applied Life Sciences, Vienna, Austria.
Martin J. H., 2003. Report submitted to US Environmental Protection Agency. EPA Contract No. 68-W7-
0068.
Moller H.B., Sommer S.G and Ahring B.K., 2004. Methane productivity of manure, straw and solid
fractions of manure. Biomass and Bioenergy 26: 485–495.
Murphy J.D. and Power N., 2008. Technical and economic analysis of biogas production in Ireland
utilizing three different crop rotations. Applied energy 10: 3-15.
Murphy J.D., Mckeorgh E. and Kiely G., 2007. Technical/economic/environmental analysis of biogas
utilization. Applied Energy 77: 407–427.
Murto M., Bjornsson L. and Mattiasson B., 2004. Impact of food industrial waste on anaerobic co-
digestion of sewage sludge and pig manure. Journal of environmental management 70: 101-107.
Pesta G., 2006. Anaerobic digestion of organic residues and wastes. Technische Universita¨t Mu¨nchen.
Energy and Environmental Technologies of the Food Industry, Germany.
Schroder J.J. and Neeteson J.J., 2008. Nutrient management regulations in The Netherlands. Geoderma
144: 418–425.
Segeren A. and Luijt J., 2003. Segmenting the market for agricultural land in the Netherlands. Tijdschrift
voor Economische en Sociale Geografie 93: 570-575.
Singh K.J. and Singh S., 2004. Comparative study of economics of different models of family size of
biogas plants for state of Punjab, India. Energy conversion and management 45: 1329-1341.
Van Horn H.H., Wilkie A.C., Powers W.J. and Nordstedt R.A., 1994. Components of dairy waste
management systems. J. Dairy Sci. 77: 2008–2030.
Van Rooijen S.N.M and Van Wees M.T, 2006. Green electricity policies in the Netherlands: an analysis of
policy decisions. Energy Policy 34: 60–71.
Webb A. R. and Hawkest F.R., 1985. The Anaerobic Digestion of Poultry manure: Variation of Gas Yield
With Influent Concentration and Ammonium-Nitrogen Levels. Agricultural Wastes 14:135-156
Weiland P. and Hassan E., 2001. Production of biogas from forage beets. Proceedings of the Ninth World
Congress, Anaerobic Conversion for Sustainability, 2–6 September 2001, Antwerpen, Belgium, pp.
631–633.
Finance - Borrowing - Lending18th International Farm Management Congress, Bloomington/Normal, Illinois, USA Case Study
July 2009
13
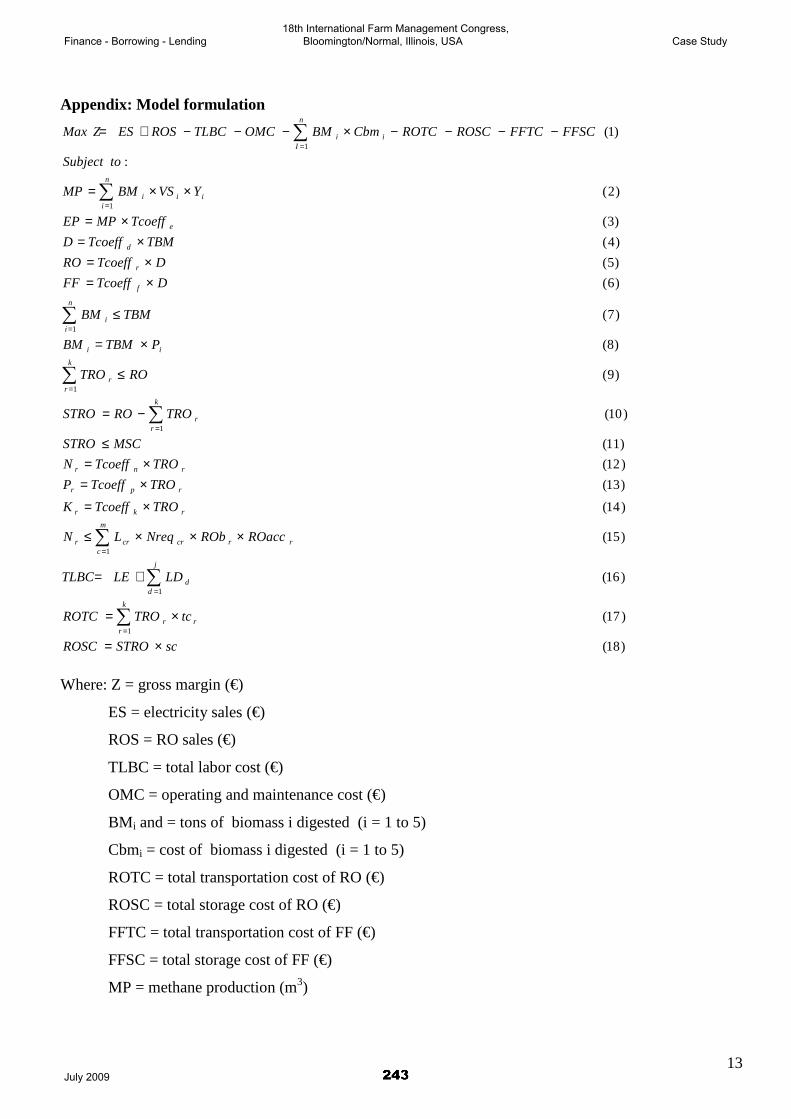
Appendix: Model formulation
)18(
)17(
)16(
)15(
)14(
)13(
)12(
)11(
)10(
)9(
)8(
)7(
)6(
)5(
)4(
)3(
)2(
:
)1(
1
1
1
1
1
1
1
1
scSTROROSC
tcTROROTC
LDLETLBC
ROaccRObNreqLN
TROTcoeffK
TROTcoeffP
TROTcoeffN
MSCSTRO
TROROSTRO
ROTRO
PTBMBM
TBMBM
DTcoeffFF
DTcoeffRO
TBMTcoeffD
TcoeffMPEP
YVSBMMP
toSubject
FFSCFFTCROSCROTCCbmBMOMCTLBCROSESZMax
r
k
rr
j
dd
rrcr
m
ccrr
rkr
rpr
rnr
k
rr
k
rr
ii
n
ii
f
r
d
e
ii
n
ii
i
n
Ii
×=
×=
+=
×××≤
×=
×=×=
≤
−=
≤
×=
≤
×=×=
×=×=
××=
−−−−×−−−+=
∑
∑
∑
∑
∑
∑
∑
∑
=
=
=
=
=
=
=
=
Where: Z = gross margin (€)
ES = electricity sales (€)
ROS = RO sales (€)
TLBC = total labor cost (€)
OMC = operating and maintenance cost (€)
BM i and = tons of biomass i digested (i = 1 to 5)
Cbmi = cost of biomass i digested (i = 1 to 5)
ROTC = total transportation cost of RO (€)
ROSC = total storage cost of RO (€)
FFTC = total transportation cost of FF (€)
FFSC = total storage cost of FF (€)
MP = methane production (m3)
Finance - Borrowing - Lending18th International Farm Management Congress, Bloomington/Normal, Illinois, USA Case Study
July 2009
14
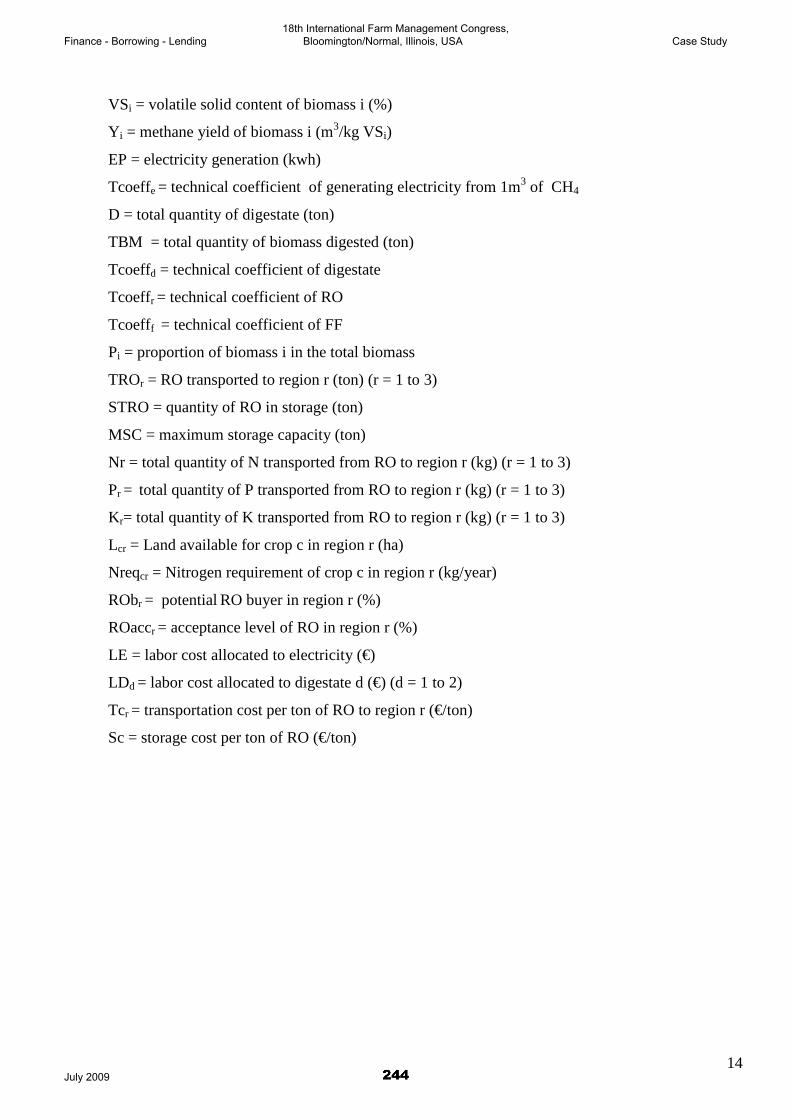
VSi = volatile solid content of biomass i (%)
Yi = methane yield of biomass i (m3/kg VSi)
EP = electricity generation (kwh)
Tcoeffe = technical coefficient of generating electricity from 1m3 of CH4
D = total quantity of digestate (ton)
TBM = total quantity of biomass digested (ton)
Tcoeffd = technical coefficient of digestate
Tcoeffr = technical coefficient of RO
Tcoefff = technical coefficient of FF
Pi = proportion of biomass i in the total biomass
TROr = RO transported to region r (ton) (r = 1 to 3)
STRO = quantity of RO in storage (ton)
MSC = maximum storage capacity (ton)
Nr = total quantity of N transported from RO to region r (kg) (r = 1 to 3)
Pr = total quantity of P transported from RO to region r (kg) (r = 1 to 3)
Kr= total quantity of K transported from RO to region r (kg) (r = 1 to 3)
Lcr = Land available for crop c in region r (ha)
Nreqcr = Nitrogen requirement of crop c in region r (kg/year)
RObr = potential RO buyer in region r (%)
ROaccr = acceptance level of RO in region r (%)
LE = labor cost allocated to electricity (€)
LDd = labor cost allocated to digestate d (€) (d = 1 to 2)
Tcr = transportation cost per ton of RO to region r (€/ton)
Sc = storage cost per ton of RO (€/ton)
Finance - Borrowing - Lending18th International Farm Management Congress, Bloomington/Normal, Illinois, USA Case Study
July 2009