econ rev 2013 - senwes · 2014 compiled by directorate: statistics and economic analysis private...
TRANSCRIPT

agriculture,forestry & fisheriesDepartment:Agriculture, Forestry and FisheriesREPUBLIC OF SOUTH AFRICA
2013

Economic Review
of the
South African
Agriculture
2013
DEPARTMENT OF AGRICULTURE, FORESTRY AND FISHERIES

2014
Compiled by
Directorate: Statistics and Economic Analysis Private Bag X246 PRETORIA 0001
Published in the Republic of South Africa by
Department of Agriculture, Forestry and Fisheries
Obtainable from
Resource Centre Directorate: Knowledge and Information Management Private Bag X144 PRETORIA 0001
Tel. 012 319 7141
ISBN 978-1-86871-388-2
This publication or any part thereof may be reproduced without prior permission, provided that the Directorate Statistics and Economic Analysis, Department of Agriculture, Forestry and Fisheries, is acknowledged as the source.

iii
CONTENTS
Foreword ............................................................................................................................................... v
Economic review of South African agriculture for the year ended 31 December 2013 ......................... 1
Summary ............................................................................................................................................... 1
Volume of agricultural production .......................................................................................................... 1
Producer prices of agricultural products ................................................................................................ 2
Gross value of agricultural production ................................................................................................... 2
Farming income ..................................................................................................................................... 3
Expenditure on intermediate goods and services.................................................................................. 4
Prices of farming requisites ................................................................................................................... 5
Domestic terms of trade in agriculture (2005 = 1) ................................................................................. 6
Contribution of agriculture to value added at basic prices ..................................................................... 6
Capital assets and investment in agriculture ......................................................................................... 7
Farming debt ......................................................................................................................................... 7
Cash fl ow of farmers.............................................................................................................................. 8
Consumption expenditure on food......................................................................................................... 8
Consumer prices ................................................................................................................................... 9
Imports and exports of agricultural products ......................................................................................... 9

v
FOREWORD
Despite its relatively small share of the total GDP, primary agriculture is an important sector in the South African economy. Agriculture remains a signifi cant provider of employment, especially in the rural areas, and a major earner of foreign exchange.
The value of agricultural production in South Africa was R187 678 million in 2013, while its contribution to the GDP was approximately R72 billion. The primary agricultural sector has grown by an average of ap-proximately 9,9% per annum since 1970, while the total economy has grown by 12,9% per annum over the same period, resulting in a drop in agriculture’s share of the GDP from 7,1% in 1970 to 2,6% in 2013.
Agriculture’s prominent, indirect role in the economy is a function of backward and forward linkages to other sectors. Purchases of goods such as fertilisers, chemicals and implements form backward linkages with the manufacturing sector, while forward linkages are established through the supply of raw materials to the manufacturing industry. About 70% of agricultural output is used as intermediate products in the sector. Agriculture is therefore a crucial sector and an important engine of growth for the rest of the economy.
This publication, which appears every 6 months, offers easy-to-fi nd information to give some idea of the macroeconomic position of agriculture. The focus areas are the calculation of agriculture’s contribution to the national economy and the determination of trends with regard to the most important agricultural eco-nomic indicators.
Whether you are involved directly or only have an interest in agriculture, you will fi nd this publication useful and informative. We welcome your observations on its content and format. If you have comments or ques-tions, please contact the Acting Director: Statistics and Economic Analysis.
Tel. 012 319 8454
Fax 012 319 8031
E-mail [email protected]
PRETORIA Ms Ellen Matsei
February 2014 Director: Statistics and Economic Analysis

1Department of Agriculture, Forestry and Fisheries
ECONOMIC REVIEW OF SOUTH AFRICAN AGRICULTURE FOR THE YEAR ENDED 31 DECEMBER 2013
Summary
Gross farming income from all agricultural products for the year ended 31 December 2013 is estimated at R182 966 million, which is 8,6% higher than the previous year.
Gross farming income from fi eld crops increased by 6,1% and amounted to R47 744 million. The income from horticultural products rose by 13,4%, from R42 126 million to R47 785 million. Income from animal products increased by 7,4% and amounted to R87 437 million.
Prices received by farmers for agricultural products increased on average by 4,0%, while prices paid by farmers for farming requisites rose by 7,1%, resulting in the terms of trade weakening from 0,86 to 0,84 during the period under review.
The weighted average price of fi eld crops increased by 1,0% because of increases in the prices of winter grains by 19,1%, dry beans by 15,4% tobacco by 13,8%, hay by 11,0% and oilseeds by 5,2%, while the prices of summer grain, cotton and sugar cane dropped by 5,6%, 1,6% and 0,4% respectively.
Prices of horticultural products increased by 7,7%. Prices of fruit, vegetables and viticultural products in-creased by 8,9%, 6,5% and 6,2% respectively.
Prices of animal products increased by 4,4%. Prices of pastoral products, dairy products and poultry prod-ucts increased by 13,8%, 8,6% and 6,6% respectively, whereas the prices of slaughtered stock decreased by 1,8%.
The prices paid for farming requisites rose by 7,1%, compared to 14,5% in the previous year. Prices paid for tractors increased by 10,8%, seeds by 10,5%, packing material and feeds by 7,1% each, animal health and crop protection by 6,8%, building material by 6,5%, fuel by 6,4%, trucks by 6,3%, fertilisers by 5,9% and fencing material by 5,3%. Net farming income increased by 7,3% and amounted to R56 245 million for the 12 months up to 31 December 2013.
Volume of agricultural production
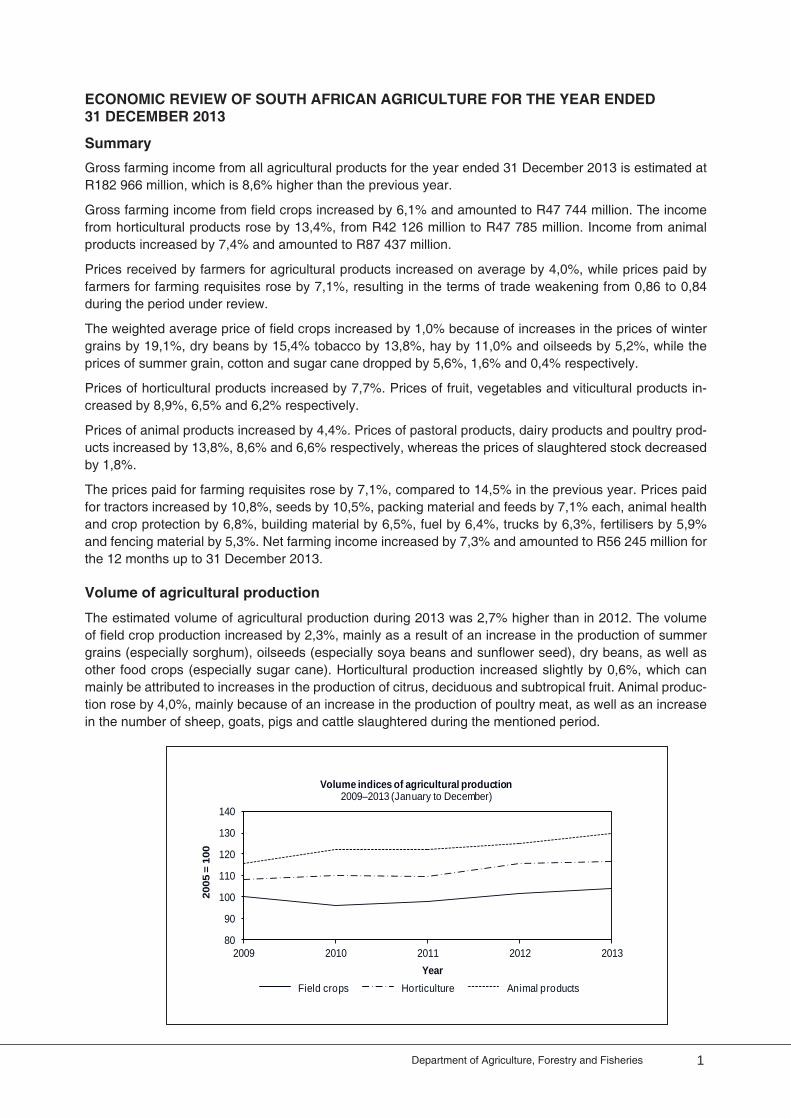
The estimated volume of agricultural production during 2013 was 2,7% higher than in 2012. The volume of fi eld crop production increased by 2,3%, mainly as a result of an increase in the production of summer grains (especially sorghum), oilseeds (especially soya beans and sunfl ower seed), dry beans, as well as other food crops (especially sugar cane). Horticultural production increased slightly by 0,6%, which can mainly be attributed to increases in the production of citrus, deciduous and subtropical fruit. Animal produc-tion rose by 4,0%, mainly because of an increase in the production of poultry meat, as well as an increase in the number of sheep, goats, pigs and cattle slaughtered during the mentioned period.
80
90
100
110
120
130
140
2009 2010 2011 2012 2013
2005
= 1
00
Year
Volume indices of agricultural production2009–2013 (January to December)
Field crops Horticulture Animal products

2 Economic Review of the South African Agriculture 2013
Producer prices of agricultural products
Producer prices of agricultural products increased on average by 4,0% from 2012 to 2013.
The weighted average price of fi eld crops increased by 1,1%. The prices of winter grains increased by 19,1%, dry beans by 15,4%, tobacco by 13,8%, hay by 11,0% and oilseeds by 5,2% while the prices for summer grains, cotton and sugar cane declined by 5,6%, 1,6% and 0,4% respectively.
Producer prices of horticultural products rose by 7,7%. Prices of fruit increased by 8,9%, vegetables by 6,5% and viticultural products by 6,2%.
Producer price indices2009–2013 (January to December)
100
140
180
220
260
300
2009 2010 2011 2012 2013Year
2005
= 1
00
Field crops Horticulture Animal products
Gross value of agricultural production2009–2013 (January to December)
020 00040 00060 00080 000
100 000
2009 2010 2011 2012 2013
Year
R'm
illio
n
Field crops Horticulture Animal products
The weighted average price of animal products increased by 4,4%. Prices of pastoral products, dairy prod-ucts, and poultry meat increased by 13,8%, 8,6% and 6,6% respectively, while the average price of slaugh-tered stock decreased by 1,8%.
Gross value of agricultural production
The total gross value of agricultural production (total production during the production season valued at the average basic prices received by producers) for 2013 is estimated at R187 678 million, compared to R172 974 million the previous year, an increase of 8,5%.This increase can be attributed mainly to increases in the value of sugar cane, soya-bean, citrus and deciduous fruit, mutton and poultry meat production.
The gross value of animal products, fi eld crops and horticultural products contributed 46,6%, 27,5% and 25,9% respectively to the total gross value of agricultural production. The poultry meat industry made the largest contribution with 17,5%, followed by maize with 13,2% and cattle and calves slaughtered with 9,7%.

3Department of Agriculture, Forestry and Fisheries
Farming income
The gross income of producers (the value of sales and production for other uses, plus the value of changes in inventories) for the year ended 31 December 2013 amounted to R182 987 million, compared to R168 506 million the previous year, an increase of 8,6%. The increase can be ascribed mainly to increases in the production of oilseeds, sugar cane, fruit, mutton and poultry meat. Prices received by farmers for other horticultural and animal products showed moderate increases.
Gross farm sector income (GFI)2009–2013 (January to December)
0
20 000
40 000
60 000
80 000
100 000
2009 2010 2011 2012 2013
Year
R'm
illio
n
Field crops Horticulture Animal products
The gross income from fi eld crops increased by 6,1% to R47 744 million for the year ended 31 December 2013. Income from maize was R23 928 million, or 0,1% less than in the previous 12 months. Income from wheat also decreased by 0,1% to R5 318 million. Income from soya beans and sunfl ower seed showed increases of 53,7% and 17,6% respectively. Income from sugar cane at R7 005 million was 14,5% higher than in the previous 12 months. Income from tobacco increased by 8,4% to R457 million. Income from dry beans showed an improvement of 44,5%.
Gross income from major products2013 compared to 2012 (January to December)
0 5 000 10 000 15 000 20 000 25 000 30 000 35 000
Sugar cane (+14,5%)
Milk (+9,6%)
Vegetables (+8,2%)
Fruit (+19,4%)
Maize (-0,1%)
Red meat (+3,7%)
Poultry meat (+11,3%)
R'million2012 2013
The gross income from horticultural products increased by 13,5%, from R42 126 million in 2012 to R47 806 million in 2013. Income from deciduous fruit at R12 815 million was 23,7% up on 2012. Income from veg-etables increased by 8,2% to R15 923 million, and that from viticulture by 5,2% to R4 346 million. Income from citrus increased by 21,0% and amounted to R9 565 million. Income from subtropical fruit, however, decreased by 2,0% to R2 562 million.
The gross income from animal products was 7,4% higher in 2013 and amounted to R87 437 million, com-pared to R81 379 million for the previous year. Producers earned R18 517 million from slaughtered cattle

4 Economic Review of the South African Agriculture 2013
Expenditure on intermediate goods and services2009-2013 (January to December)
5 000
10 000
15 000
20 000
25 000
2009 2010 2011 2012 2013
Year
R'm
illio
n
Farm feeds Fuel Farm services
and calves, as against the previous R18 150 million—an increase of only 2,0%. Income from poultry meat showed an increase of 11,3% to R32 916 million. Income from egg production, at R8 590 million, was 6,8% higher than in the previous year. Producers earned R12 433 million from milk production, which is 9,9% more than in the previous year. Income from wool, however, decreased by 9,0% to R2 322 million.
The net farm income (after the deduction of all production expenditure, excluding expenditure on fi xed as-sets and capital goods) amounted to R56 245 million for the 12 months that ended on 31 December 2013, which is 7,3% higher than in the previous 12 months. Payments for salaries and wages, which represented 10,6% of the total farming costs, amounted to R14 017 million. Interest paid by farmers to banks and other fi nanciers during the 12 months up to 31 December 2013 is estimated at R6 174 million, or 4,7% of the total farming cost.
Net farm income (NFI)2009–2013 (January to December)
10 000 20 000 30 000 40 000 50 000 60 000
2009 2010 2011 2012 2013Year
R'm
illio
n
20
25
30
35
40
Perc
enta
ge
NFI (left axis) NFI AS % OF GFI (right axis)
Expenditure on intermediate goods and services
Intermediate expenditure refers to the value of goods and services that were purchased for con-sumption as inputs during the production process.
Expenditure on intermediate goods and services during 2013 is estimated at R104 260 million, which is an increase of 8,9% from the R95 765 million of 2012. Expenditure on seeds and plants rose by 12,0%, maintenance and repairs of machinery by 11,7%, packing material by 9,8 %, building and fencing material by 9,1%, animal health and crop protection by 9,0%, farm feeds by 8,2%, fuel by 7,3%, farm services by 6,8% and fertilisers rose by 6,1%.
5Department of Agriculture, Forestry and Fisheries
Price indices of farming requisites2009–2013 (January to December)
100130160190220250280
2009 2010 2011 2012 2013Year
2005
= 1
00
Machinery and implements Fixed improvements Intermediate goods and services
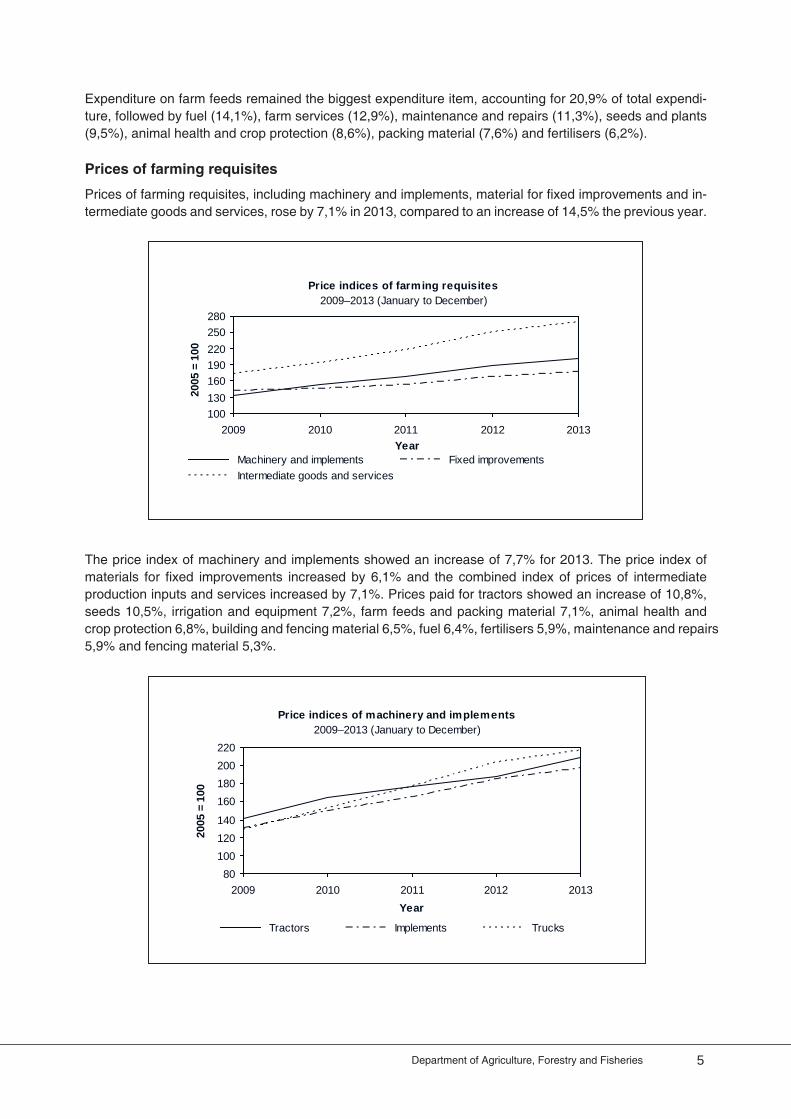
Expenditure on farm feeds remained the biggest expenditure item, accounting for 20,9% of total expendi-ture, followed by fuel (14,1%), farm services (12,9%), maintenance and repairs (11,3%), seeds and plants (9,5%), animal health and crop protection (8,6%), packing material (7,6%) and fertilisers (6,2%).
Prices of farming requisites
Prices of farming requisites, including machinery and implements, material for fi xed improvements and in-termediate goods and services, rose by 7,1% in 2013, compared to an increase of 14,5% the previous year.
Price indices of machinery and implements 2009–2013 (January to December)
80100120140
160180200220
2009 2010 2011 2012 2013Year
2005
= 1
00
Tractors Implements Trucks
The price index of machinery and implements showed an increase of 7,7% for 2013. The price index of materials for fi xed improvements increased by 6,1% and the combined index of prices of intermediate production inputs and services increased by 7,1%. Prices paid for tractors showed an increase of 10,8%, seeds 10,5%, irrigation and equipment 7,2%, farm feeds and packing material 7,1%, animal health and crop protection 6,8%, building and fencing material 6,5%, fuel 6,4%, fertilisers 5,9%, maintenance and repairs 5,9% and fencing material 5,3%.
6 Economic Review of the South African Agriculture 2013
Price indices of certain intermediate goods 2009–2013 (January to December)
140
180
220
260
300
340
2009 2010 2011 2012 2013Year
2005
= 1
00
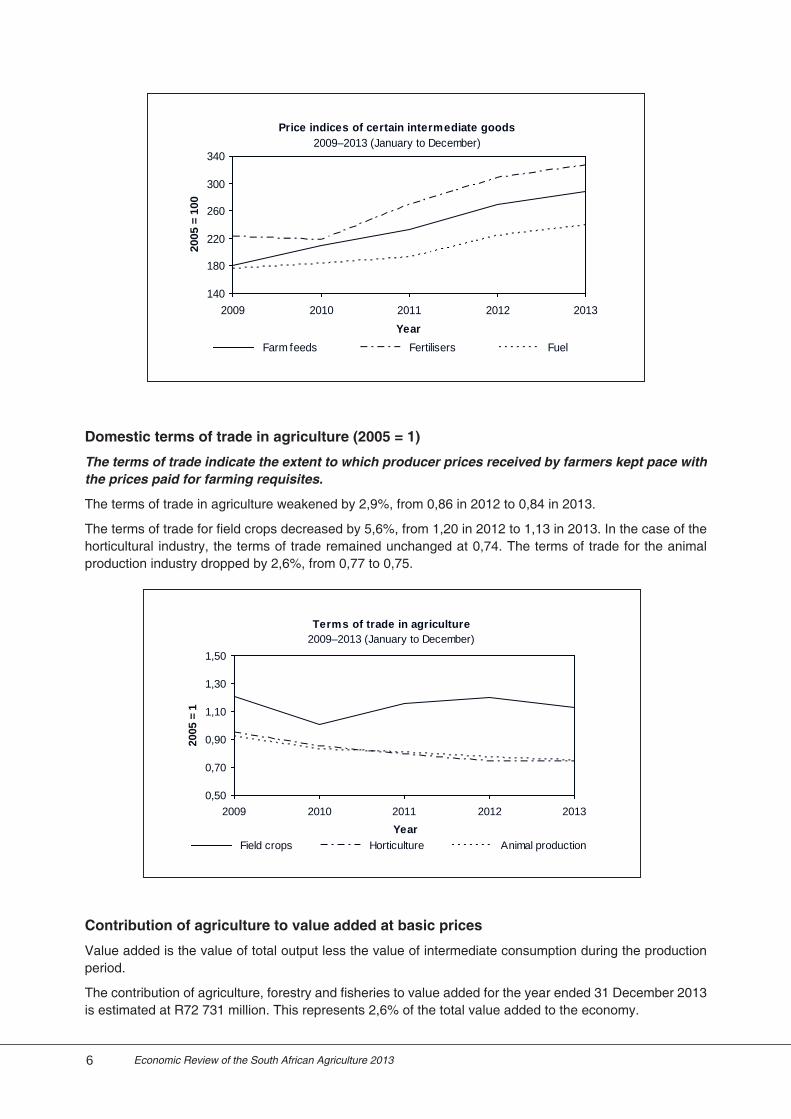
Farm feeds Fertilisers Fuel
Terms of trade in agriculture2009–2013 (January to December)
0,50
0,70
0,90
1,10
1,30
1,50
2009 2010 2011 2012 2013Year
2005
= 1
Field crops Horticulture Animal production
Domestic terms of trade in agriculture (2005 = 1)
The terms of trade indicate the extent to which producer prices received by farmers kept pace with the prices paid for farming requisites.
The terms of trade in agriculture weakened by 2,9%, from 0,86 in 2012 to 0,84 in 2013.
The terms of trade for fi eld crops decreased by 5,6%, from 1,20 in 2012 to 1,13 in 2013. In the case of the horticultural industry, the terms of trade remained unchanged at 0,74. The terms of trade for the animal production industry dropped by 2,6%, from 0,77 to 0,75.
Contribution of agriculture to value added at basic prices
Value added is the value of total output less the value of intermediate consumption during the production period.
The contribution of agriculture, forestry and fi sheries to value added for the year ended 31 December 2013 is estimated at R72 731 million. This represents 2,6% of the total value added to the economy.
7Department of Agriculture, Forestry and Fisheries
Year
Total value added
R’million
Contribution of agriculture
to value added
R’million
Contribution of agriculture
as % of total value added
%
2002
2003
2004
2005
2006
2007
2008
2009
2010
2011
2012
2013*
1 065 696
1 155 150
1 270 600
1 401 066
1 572 319
1 792 075
2 027 751
2 179 995
2 423 359
2 635 032
2 820 261
3 030 263
37 758
33 108
32 763
30 213
37 475
45 152
50 263
52 903
48 759
51 497
56 795
72 431
3,5
2,9
2,6
2,2
2,4
2,5
2,5
2,4
2,1
2,0
2,0
2,4
*Note: Figure is for agriculture, forestry and fi sheries.
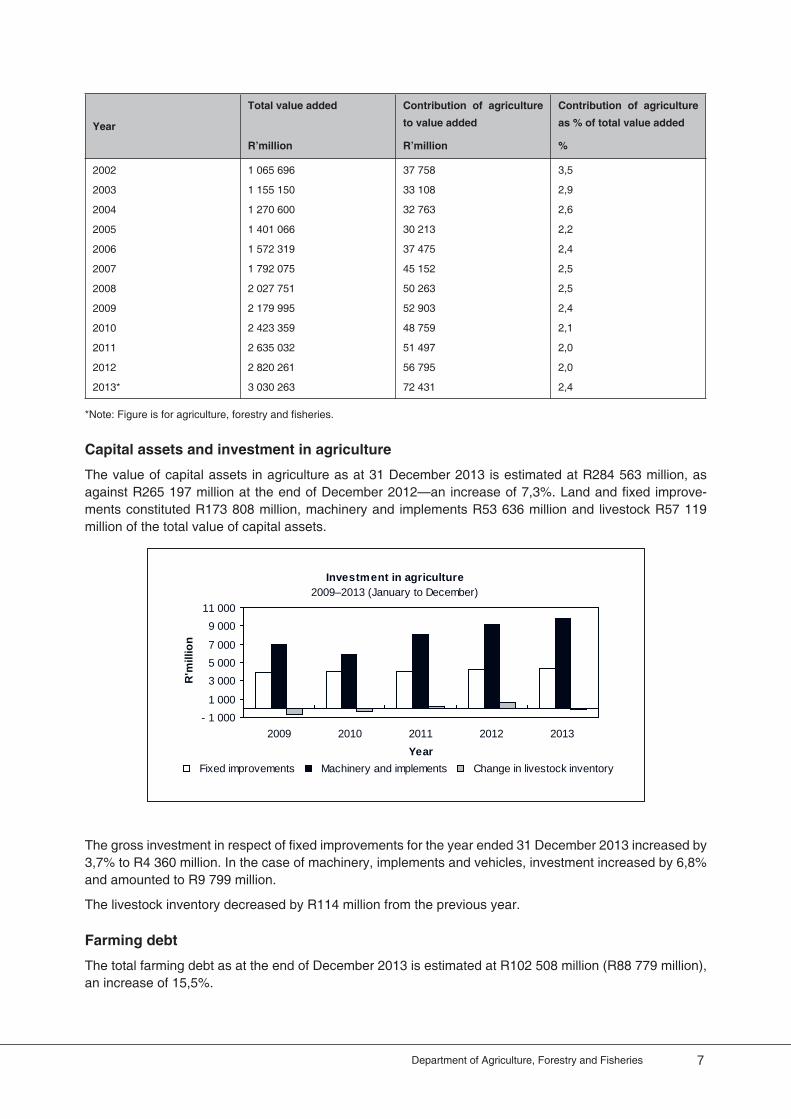
Capital assets and investment in agriculture
The value of capital assets in agriculture as at 31 December 2013 is estimated at R284 563 million, as against R265 197 million at the end of December 2012—an increase of 7,3%. Land and fi xed improve-ments constituted R173 808 million, machinery and implements R53 636 million and livestock R57 119 million of the total value of capital assets.
Investment in agriculture2009–2013 (January to December)
- 1 000 1 000
3 000 5 000 7 000
9 000 11 000
2009 2010 2011 2012 2013Year
R'm
illio
n
Fixed improvements Machinery and implements Change in livestock inventory
The gross investment in respect of fi xed improvements for the year ended 31 December 2013 increased by 3,7% to R4 360 million. In the case of machinery, implements and vehicles, investment increased by 6,8% and amounted to R9 799 million.
The livestock inventory decreased by R114 million from the previous year.
Farming debt
The total farming debt as at the end of December 2013 is estimated at R102 508 million (R88 779 million), an increase of 15,5%.
8 Economic Review of the South African Agriculture 2013
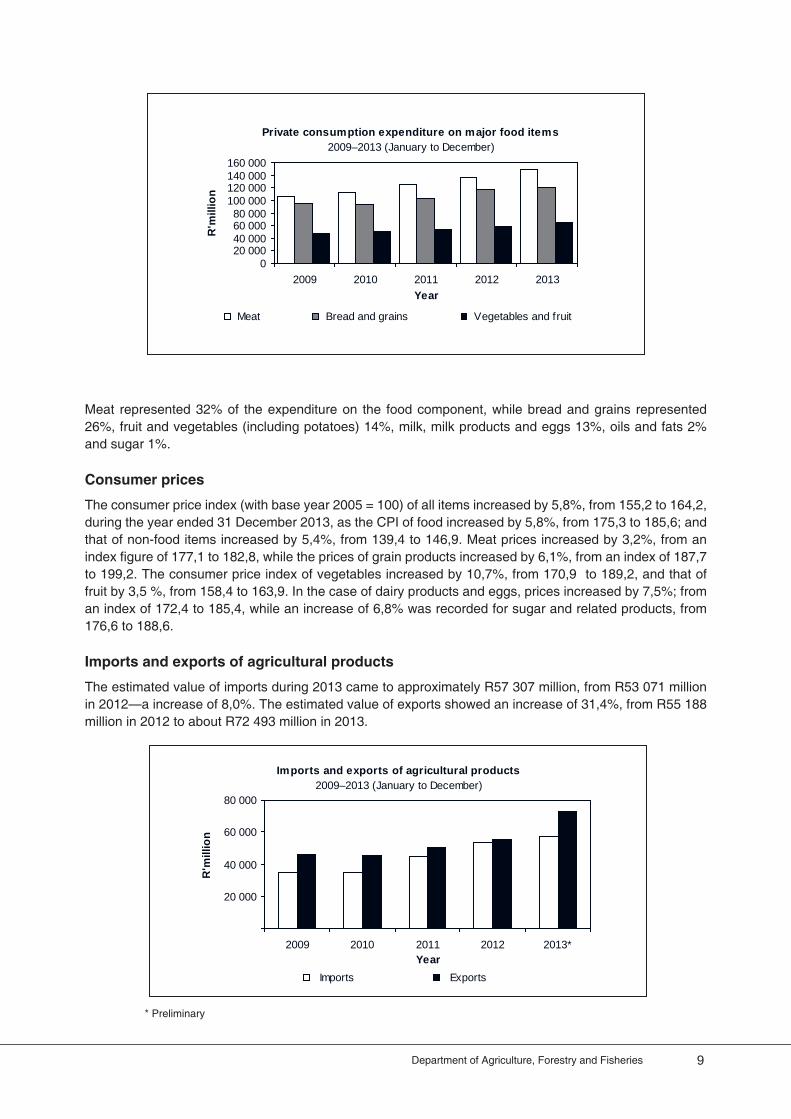
Consumption expenditure on food
The consumption expenditure on food for the year ended 31 December 2013 increased by 7,1% and amounted to R460 639 million, as against the R429 982 million of the previous year. Expenditure on all food items, except sugar, rose during 2013. Expenditure on meat increased by 8,8%, from R136 592 million to R148 625 million, bread and grain by 2,1%, from R118 001 million to R120 423 million and on fruit and vegetables by 11,4%, from R58 356 million to R65 033 million. Expenditure on sugar decreased by 2,6%, from R6 555 million in 1012 to R6 385 million in 2013.
Cash flow of farmers 2009–2013 (January to December)
10 000
20 000
30 000
40 000
50 000
60 000
2009 2010 2011 2012 2013Year
R'm
illio
n
15
20
25
30
35
40
Perc
enta
ge
Cash f low (left axis) Cash f low as % of GFI (right axis)
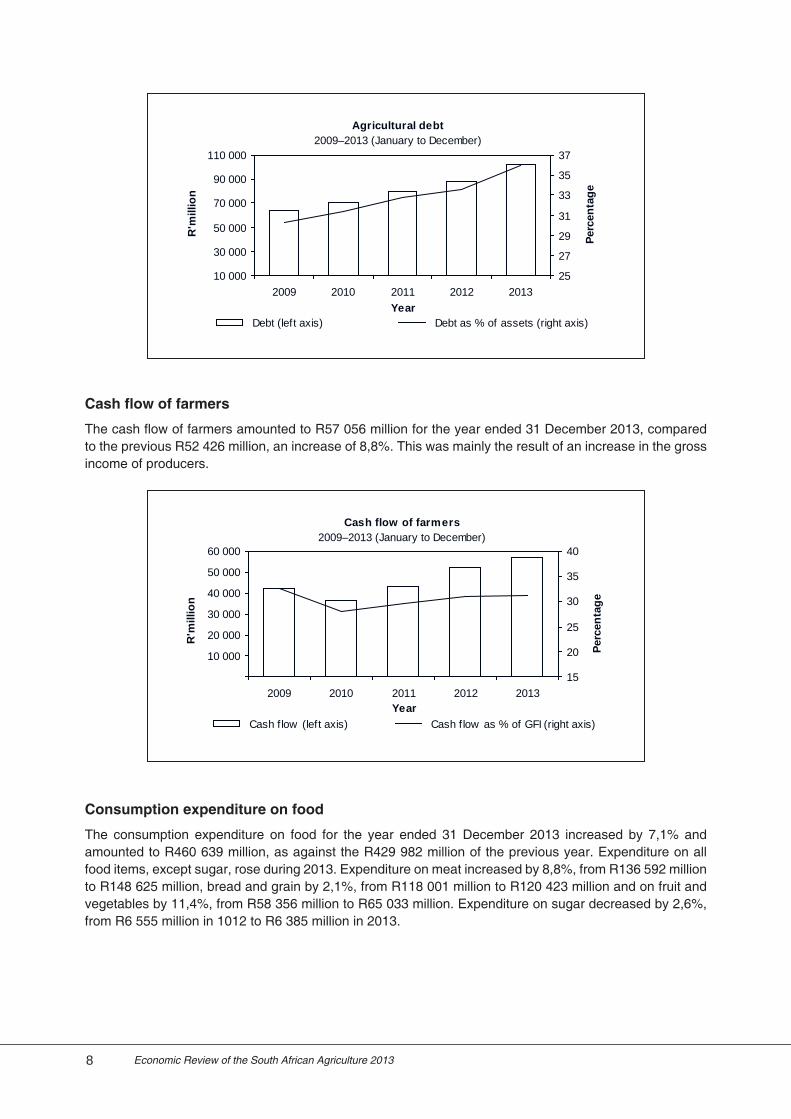
Cash fl ow of farmers
The cash fl ow of farmers amounted to R57 056 million for the year ended 31 December 2013, compared to the previous R52 426 million, an increase of 8,8%. This was mainly the result of an increase in the gross income of producers.
Agricultural debt2009–2013 (January to December)
10 000
30 000
50 000
70 000
90 000
110 000
2009 2010 2011 2012 2013Year
R'm
illio
n
25
27
29
31
33
35
37
Perc
enta
ge
Debt (left axis) Debt as % of assets (right axis)
9Department of Agriculture, Forestry and Fisheries
Private consumption expenditure on major food items 2009–2013 (January to December)
020 00040 00060 00080 000
100 000120 000140 000160 000
2009 2010 2011 2012 2013Year
R'm
illio
n
Meat Bread and grains Vegetables and fruit
Meat represented 32% of the expenditure on the food component, while bread and grains represented 26%, fruit and vegetables (including potatoes) 14%, milk, milk products and eggs 13%, oils and fats 2% and sugar 1%.
Consumer prices
The consumer price index (with base year 2005 = 100) of all items increased by 5,8%, from 155,2 to 164,2, during the year ended 31 December 2013, as the CPI of food increased by 5,8%, from 175,3 to 185,6; and that of non-food items increased by 5,4%, from 139,4 to 146,9. Meat prices increased by 3,2%, from an index fi gure of 177,1 to 182,8, while the prices of grain products increased by 6,1%, from an index of 187,7 to 199,2. The consumer price index of vegetables increased by 10,7%, from 170,9 to 189,2, and that of fruit by 3,5 %, from 158,4 to 163,9. In the case of dairy products and eggs, prices increased by 7,5%; from an index of 172,4 to 185,4, while an increase of 6,8% was recorded for sugar and related products, from 176,6 to 188,6.
Imports and exports of agricultural products
The estimated value of imports during 2013 came to approximately R57 307 million, from R53 071 million in 2012—a increase of 8,0%. The estimated value of exports showed an increase of 31,4%, from R55 188 million in 2012 to about R72 493 million in 2013.
* Preliminary
Imports and exports of agricultural products2009–2013 (January to December)
20 000
40 000
60 000
80 000
2009 2010 2011 2012 2013*Year
R'm
illio
n
Imports Exports

10 Economic Review of the South African Agriculture 2013
According to the 2013 agricultural export fi gures, citrus fruit (R9 335 million); wine (R7 933 million); maize (R6 198 million); apples, pears and quinces (R5 927 million); and grapes (R4 982 million) were the fi ve most important export products in terms of value.
With regard to agricultural imports during 2013, rice (R6 280 million), wheat and meslin (R4 024 million), poultry meat (R3 899 million), undenatured ethyl alcohol (R3 762 million) and oil-cake and other solid resi-dues (R3 172 million) were the fi ve major products in terms of value.
In terms of exports of agricultural products by South Africa during 2013, the fi ve largest trading partners were the Netherlands, with exports to the value of R7 604 million, the United Kingdom (R6 261 million), Zimbabwe (R5 639 million), Mozambique (R4 325 million) and Japan (R3 472 million).
The fi ve largest trading partners from whom South Africa imported agricultural products during 2013 were Argentina, with imports valued at R5 536 million, Brazil (R4 728 million), China (R4 528 million), the United Kingdom (R3 839 million) and the Netherlands (R3 128 million).