echnical eview - mapnaturbine.ir review-no.… · echnical eview no.7 - march 2017 ... was made use...
TRANSCRIPT

INSIDE:
MAPNA Power Solutio
ns 2017
MAPNA TURBINE ENGINEERING & MANUFACTURING CO. (TUGA)echnical eview
No.7 - March 2017
Willpower to Empower Generations

Cover PageIGV+; The Power of Knowledge
Dear Colleagues, Partners and Professionals,
Developing smart, innovative and state-of-the-art solutions to overcome persistent and continuously emerging challenges facing local, regional and global energy sector has always been a distinctive feature of MAPNA Turbine as a key player in the power generation industry.
It is with great delight announced that an innovative engineering design project known as “IGV+” put forth by MAPNA Turbine engineers was chosen as one of the prominent projects by the developmental research panel of the 30th Khwarizmi International Award. This innovative solution paves the way for injection of additional 1000 MW of power into Iranian national grid just by increasing the power output of the existing power generation fleet at the lowest possible cost. That is why we are proud to introduce to you, our valued readers, different technological aspects and features of such a magnificent initiative, in the first article of this edition of MAPNA Turbine Technical Review.
The second article deals with repair of broaching tools which are used in cutting turbine disk grooves in the manufacturing process. Broaching tools are made of high speed tool steels and hence it is more economical and cost-effective to refurbish them through welding operation rather than replacing them with new tools. A detailed experimental investigation of the effects of preheating temperature and cool-down regime on the properties of the welding area is presented. An optimal welding procedure to ensure a quality weld, free from any defects, along with appropriate hardness level is then scrutinized through optimization of the conditions.
In the third essay the innovative, tailor-made ultrasonic phased array inspection techniques developed at MAPNA Turbine are elaborated on. These techniques make it possible to inspect and assess different
parts and components of gas and steam turbines with distinctively complicated geometries.
Gas turbine semi-dynamic simulation laboratory designed and developed to provide a potent, all-inclusive platform for engineers and designers to analyze and adjust the performance and functionality of different logic control systems prior to implementation in the actual working condition is introduced in the last article of this edition. This laboratory can also serve as an advanced interactive training module for plant operators as well as an online condition monitoring system for MAPNA Turbine’s large fleet of products.
Finally, as we Iranians and Persian-speaking people all around the world are going to celebrate Nowruz in a few days, I would like to take this opportunity to offer my sincerest wishes to all readers.
Respectfully,
Mohammad Owliya, PhD
Vice President for Engineering and R&D
MAPNA Turbine Company (TUGA) -
March 2017
EDITORIAL


CO
MBI
NED
C
YCLE
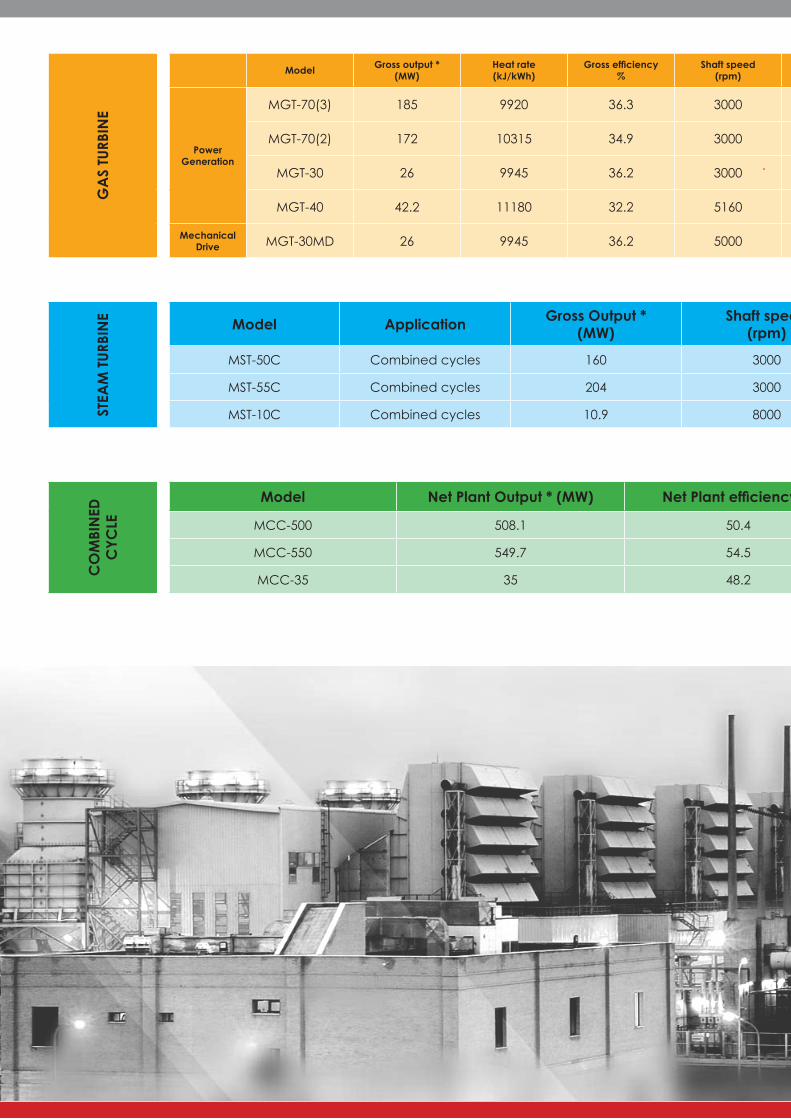
Model Net Plant Output * (MW) Net Plant efficiency % Heat rate (kJ/kWh) Pressure ratio Notes
MCC-500 508.1 50.4 7149 12 2p non-reheat
MCC-550 549.7 54.5 6606 12 3p reheat
MCC-35 35 48.2 7467 22 2p non-reheat
STEA
M TU
RBIN
E Model Application Gross Output *(MW)
Shaft speed(rpm)
Dimensions L*W*H (metres)
Inlet temp (deg C)
Inlet pressure (bar) Notes
MST-50C Combined cycles 160 3000 6.7 * 4.7 * 5 520 90 2p non-reheat
MST-55C Combined cycles 204 3000 13.8 * 8.2 * 8.5 530 130 3p reheat
MST-10C Combined cycles 10.9 8000 3.5 * 2.1 * 3.8 470 40 2p non-reheat
GA
S TU
RBIN
E
Model Gross output *(MW)
Heat rate (kJ/kWh)
Gross efficiency %
Shaft speed (rpm) Pressure ratio Turbine inlet
temperature (ºC)Exhaust mass flow
(kg/s)Exhaust temperature
(ºC)NOx emissions
(ppmv)Weight
(tonnes)Dimensions
L*W*H (metres)
Power Generation
MGT-70(3) 185 9920 36.3 3000 12 1090 553.6 544.4 25 186 10.2 * 3.9 * 3.7
MGT-70(2) 172 10315 34.9 3000 11.9 1090 535.3 556.4 25 186 10.2 * 3.9 * 3.7
MGT-30 26 9945 36.2 3000 22 1120 90 478 25 15.1 6.3 * 2.4 * 2.5
MGT-40 42.2 11180 32.2 5160 12.3 1082 147.5 548 42 ppm (water injection) 43 6.4 * 3.3 * 3.3
Mechanical Drive MGT-30MD 26 9945 36.2 5000 21.5 1125 89 487 25 14.2 6.3 * 2.3 * 2.3
MAPNA Power Solutions 2017
The technical data contained in this document is provided for information only and may not apply in all cases. MAPNA reserves the right to revise or change this information at any time without prior notice.
* Nominal Power at ISO conditions.
GR1
00-0

CO
MBI
NED
C
YCLE
Model Net Plant Output * (MW) Net Plant efficiency % Heat rate (kJ/kWh) Pressure ratio Notes
MCC-500 508.1 50.4 7149 12 2p non-reheat
MCC-550 549.7 54.5 6606 12 3p reheat
MCC-35 35 48.2 7467 22 2p non-reheat
STEA
M TU
RBIN
E Model Application Gross Output *(MW)
Shaft speed(rpm)
Dimensions L*W*H (metres)
Inlet temp (deg C)
Inlet pressure (bar) Notes
MST-50C Combined cycles 160 3000 6.7 * 4.7 * 5 520 90 2p non-reheat
MST-55C Combined cycles 204 3000 13.8 * 8.2 * 8.5 530 130 3p reheat
MST-10C Combined cycles 10.9 8000 3.5 * 2.1 * 3.8 470 40 2p non-reheat
GA
S TU
RBIN
E
Model Gross output *(MW)
Heat rate (kJ/kWh)
Gross efficiency %
Shaft speed (rpm) Pressure ratio Turbine inlet
temperature (ºC)Exhaust mass flow
(kg/s)Exhaust temperature
(ºC)NOx emissions
(ppmv)Weight
(tonnes)Dimensions
L*W*H (metres)
Power Generation
MGT-70(3) 185 9920 36.3 3000 12 1090 553.6 544.4 25 186 10.2 * 3.9 * 3.7
MGT-70(2) 172 10315 34.9 3000 11.9 1090 535.3 556.4 25 186 10.2 * 3.9 * 3.7
MGT-30 26 9945 36.2 3000 22 1120 90 478 25 15.1 6.3 * 2.4 * 2.5
MGT-40 42.2 11180 32.2 5160 12.3 1082 147.5 548 42 ppm (water injection) 43 6.4 * 3.3 * 3.3
Mechanical Drive MGT-30MD 26 9945 36.2 5000 21.5 1125 89 487 25 14.2 6.3 * 2.3 * 2.3
MAPNA Power Solutions 2017
The technical data contained in this document is provided for information only and may not apply in all cases. MAPNA reserves the right to revise or change this information at any time without prior notice.
* Nominal Power at ISO conditions.
GR1
00-0

MAPNA Turbine • March 2017
6
Table of Contents
IGV+The Power of Knowledge
The Effects of Preheating Temperature and Cooling Method in Restorative Welding of Broaching Tool Steels
Phased Array Inspection for Testing Turbine Parts during Overhaul and Life Time Extension
Gas Turbine Semi-dynamic Simulation Laboratory at a Glance
01020304
7
13
21
25

MAPNA Turbine • March 2017
7
The strategic decision made by the Ministry of Energy to develop local manufacturing of power generation
equipment in late 1990’s, followed by an effective performance towards management and domestic development of the required technical know-how has resulted in an incredible position for Iran in the power sector.
After MAPNA Group managed to make the best use of engineering modifications on a section of operating gas turbine engines to increase the national power generation fleet capacity by 200 MW at almost no cost, in the summer of 2015, another innovative improvement, known as ‘IGV+’ came into action to smoothly pass the 2016
summer peak. IGV+ technology, as a part of the commercial package OPTIMAPTM, was made use of on 99 V94.2 machines so for, to increase the real capacity (in local ambient conditions) by 400 MW at negligible cost compared with investing in a new power plant to attain a similar increase. The modification is currently being conducted on all the remaining machines in the fleet to accommodate the upcoming 2017 summer peak.
IGV+ technology increases the capacity of the national grid by an overall of 1000 MW (ISO conditions) while involving no capital expenditure. This lead to the initiative becoming one of the prominent picks in the 30th Kharazmi International Award.
01 IGV+The Power of Knowledge
Introduction
Figure 1: Kharazmi Award Statuette
MAPNA Turbine • March 2017
8
MAPNA has been making a genuine effort in research, development and innovation to improve the portfolio of the offered products and services in the last 7 years. The results of such endeavors are now made clear, one of which is the development of MGT-70(3) gas turbine under the project MAP2B and its side soft-products in enhancing MAPNA technology and expanding domestic know-how. The gas turbine machine family, V94.2, is one of the largest fleets in operation in Iran and all over the globe which makes the payoff for investment in any upgrade or optimization of power output and efficiency extremely handsome. Therefore, this machine has been an object of interest and focus for MAPNA Turbine R&D, when coming up with new improvement and optimization packages. Winning the 3000 MW RUMAILA power plant construction in Iraq (SHAMARA Project) based on MAP2B technology, is by itself a great milestone. IGV+ is an offshoot of a redesign of compressor section in the MAP2B project.
After inception years ago and getting mature, the technology was tested in 2015 thanks to the operators of Parehsar and Yazd power plants. The capacity of the initiative to considerably increase the power output in a short time and at very little cost was afterwards put forth to the management board of Thermal Power Plants Holding Company (TPPH, affiliated to the Ministry of Energy) which was well received and the trial implementation at Ferdowsi Power Plant was accomplished and the increase in capacity was confirmed by the national grid load dispatching authority subsequently. The final agreement on the inclusive implementation of IGV+ after the trial implementation was officially announced by TPPH and Tavanir on the 9th of April 2016 as the outcome of negotiations with all relevant authorities and stakeholders.
On top of being an honor for MAPNA Group, this achievement manifested the constructive approach of the Ministry of Energy in nurturing the national production and domestic knowledge-based technology to fill the serious existing gap and optimize the operation of the existing power generation fleet.
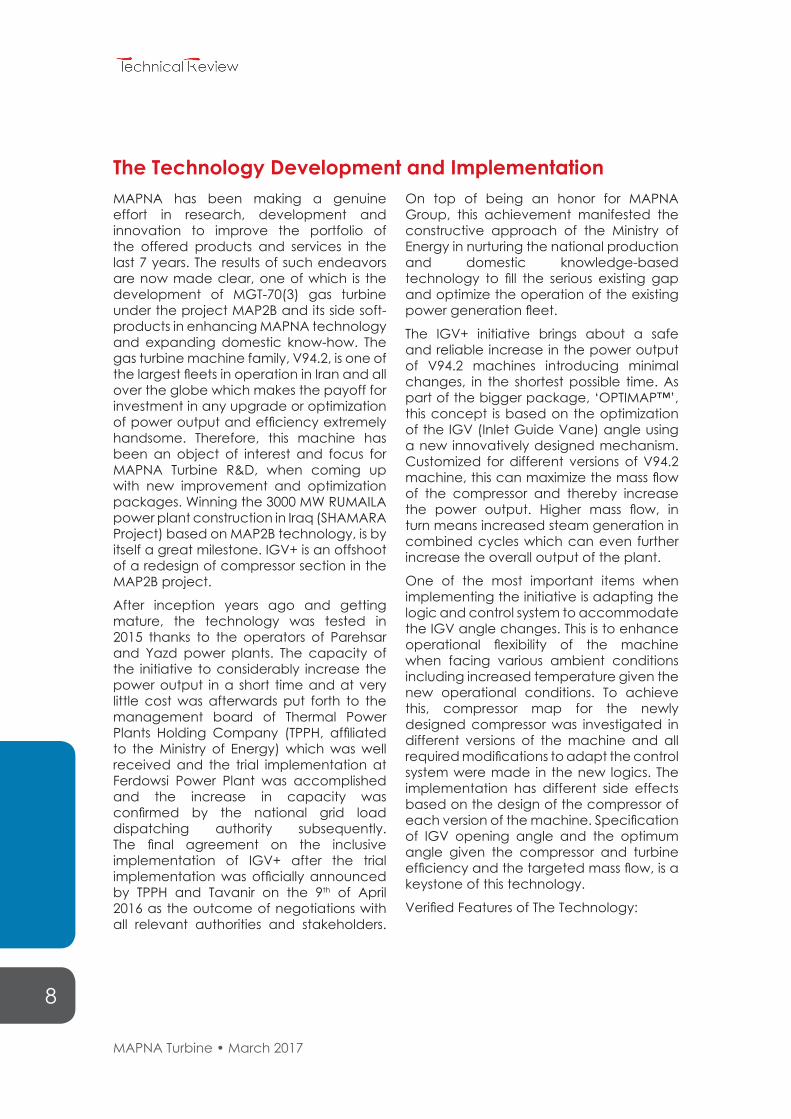
The IGV+ initiative brings about a safe and reliable increase in the power output of V94.2 machines introducing minimal changes, in the shortest possible time. As part of the bigger package, ‘OPTIMAP™’, this concept is based on the optimization of the IGV (Inlet Guide Vane) angle using a new innovatively designed mechanism. Customized for different versions of V94.2 machine, this can maximize the mass flow of the compressor and thereby increase the power output. Higher mass flow, in turn means increased steam generation in combined cycles which can even further increase the overall output of the plant.
One of the most important items when implementing the initiative is adapting the logic and control system to accommodate the IGV angle changes. This is to enhance operational flexibility of the machine when facing various ambient conditions including increased temperature given the new operational conditions. To achieve this, compressor map for the newly designed compressor was investigated in different versions of the machine and all required modifications to adapt the control system were made in the new logics. The implementation has different side effects based on the design of the compressor of each version of the machine. Specification of IGV opening angle and the optimum angle given the compressor and turbine efficiency and the targeted mass flow, is a keystone of this technology.
Verified Features of The Technology:
The Technology Development and Implementation
MAPNA Turbine • March 2017
9
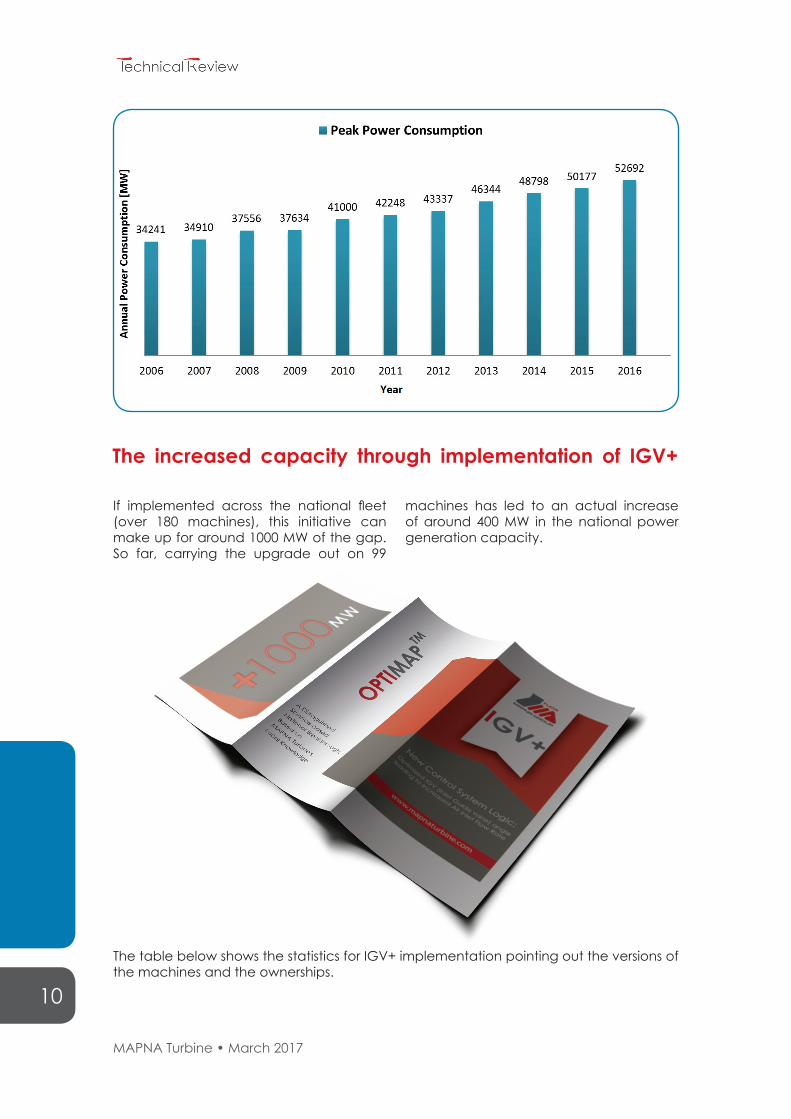
National Demand and IGV+ solutionEvery year as power demand hits the peak values in summer, the Ministry of Energy has a big challenge which if not overcome can lead to blackouts in numerous areas across the country.
Growth in the consumption (households, businesses and industries) increases the summer peak by around 5% annually which would mean costly construction of new peaking power plants to operate and
supply in a time interval as long as 2 months at the most. The following chart depicts the maximum energy consumption in the last 10 years as reported by the National Power Grid Management Company. As demonstrated, the average growth in demand is higher than 5% annually. To fill this gap construction of new power plants of an overall capacity of 2000 MW seems inevitable at the first look.
• 5 MW increase in power output in actual conditions at base load for version 3 of V94.2 machines.
• 3 MW increase in power output in actual conditions at base load for version 5 and higher of V94.2 machines.
• Proportionate increase in the relevant steam turbines combined with the a.m.
gas turbines.
• Certain small increase in the efficiency of the gas turbine.
• Optimal operation of the machines: a) Peak operation during summer, b) lower turbine inlet temperatures and thereby higher lifespan for hot gas path components during off-peak period.
MAPNA Turbine • March 2017
10
If implemented across the national fleet (over 180 machines), this initiative can make up for around 1000 MW of the gap. So far, carrying the upgrade out on 99
machines has led to an actual increase of around 400 MW in the national power generation capacity.
The increased capacity through implementation of IGV+
The table below shows the statistics for IGV+ implementation pointing out the versions of the machines and the ownerships.

MAPNA Turbine • March 2017
11
Power Increase
(MW)
Number of Machines
Number of Power Plants
Power Plant Ownership
Upgraded to higher MAPNA versions
VER.05 VER.03
117 4 8 14 5 State135.5 4 23 13 9 MAPNA142.9 3 17 13 5 Others395.3 11 48 40 19
99
Top Pick of the 30th Kharazmi International AwardIGV+ was introduced by MAPNA to the Kharazmi International Award and underwent three technical and economic reviews conducted by the expert committees in the festival. It was finally announced to be the top pick of the developmental section of the
festival. Among the reasons for such an achievement, the followings stand out: Successful commercialization, added value and considerable savings from a national point of view, and customer satisfaction as for quality, timing and cost of the implementation.
The following table gives a comparison between the costs and timing of IGV+ implementation and those involved should alternative solutions i.e. construction/capacity increase of power plants be adopted. Another important feature of IGV+ is that the subsequent increase in the power generated is scattered just as are the power plants themselves whereas the power generated in any newly constructed power plant is concentrated in the location of the power plant and needs
to be distributed through transmission lines which means even more investment in infrastructure and power losses. The current high demand is only a challenge during the peak season and the IGV+ initiative addresses this need specifically, as opposed to other alternatives that encounter permanent increase in capacity that is not actually required. The timeframe for implementation of the initiative is also substantially shorter than any other alternative solutions.
MAPNA Turbine • March 2017
12
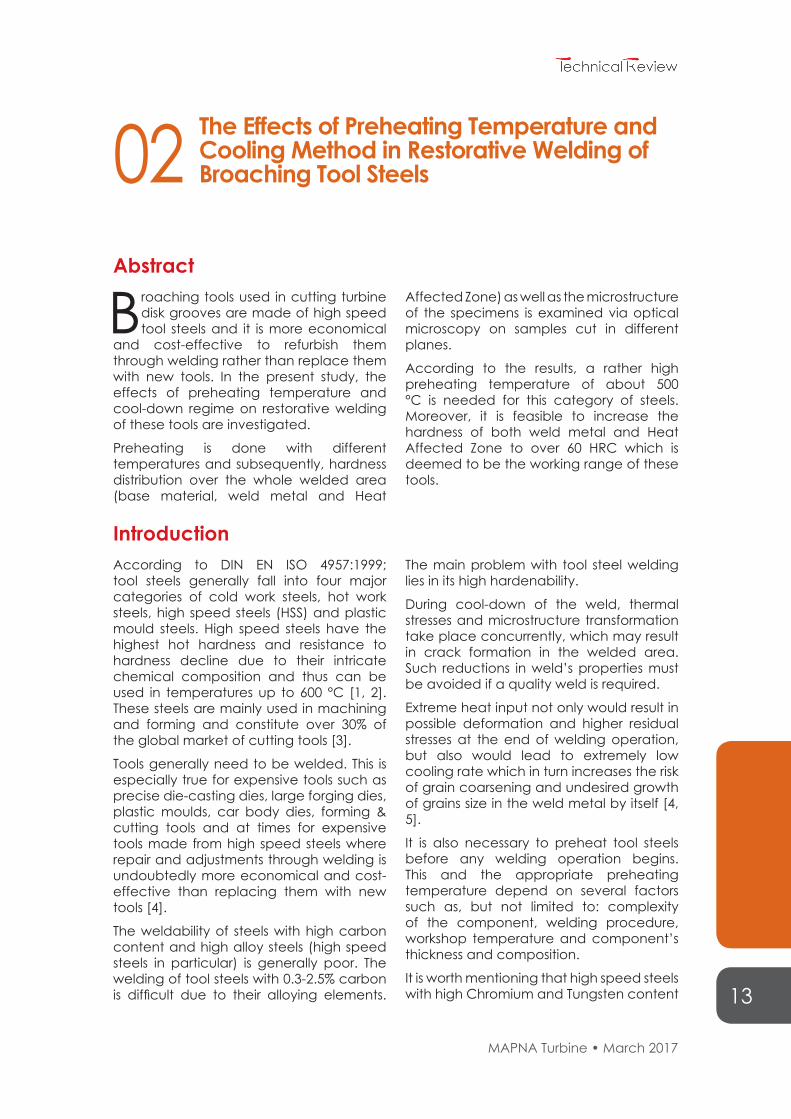
Table 2: A Comparison between Different Case Scenarios for 1000 MW
Model Assumptions Total Cost Predicted Time Frame Requirements
1Construction of
Combined Cycle Power Plants
$625M 24 Months,at Minimum
Foreign Investment
2Construction of Simple
CyclePower Plants
$267M 16 Months, at Minimum
Foreign Investment
3 Inlet Air Cooling $82M 3 Months for Each Unit, at Minimum
Access to Water Resources
4 IGV+ Application $10M 1 Day for Each Unit -
Last, but not the least is the cost of implementation which is incomparably low for IGV+. The complete A-to-Z completion of IGV+ costs $10M in the maximum which
is minimal compared with similar solutions internationally offered in the services market (e.g. GE’s $328M contract in Iraq in 2016).
MAPNA Turbine • March 2017
13
Broaching tools used in cutting turbine disk grooves are made of high speed tool steels and it is more economical
and cost-effective to refurbish them through welding rather than replace them with new tools. In the present study, the effects of preheating temperature and cool-down regime on restorative welding of these tools are investigated.
Preheating is done with different temperatures and subsequently, hardness distribution over the whole welded area (base material, weld metal and Heat
Affected Zone) as well as the microstructure of the specimens is examined via optical microscopy on samples cut in different planes.
According to the results, a rather high preheating temperature of about 500 °C is needed for this category of steels. Moreover, it is feasible to increase the hardness of both weld metal and Heat Affected Zone to over 60 HRC which is deemed to be the working range of these tools.
02 The Effects of Preheating Temperature and Cooling Method in Restorative Welding of Broaching Tool Steels
Abstract
IntroductionAccording to DIN EN ISO 4957:1999; tool steels generally fall into four major categories of cold work steels, hot work steels, high speed steels (HSS) and plastic mould steels. High speed steels have the highest hot hardness and resistance to hardness decline due to their intricate chemical composition and thus can be used in temperatures up to 600 °C [1, 2]. These steels are mainly used in machining and forming and constitute over 30% of the global market of cutting tools [3].
Tools generally need to be welded. This is especially true for expensive tools such as precise die-casting dies, large forging dies, plastic moulds, car body dies, forming & cutting tools and at times for expensive tools made from high speed steels where repair and adjustments through welding is undoubtedly more economical and cost-effective than replacing them with new tools [4].
The weldability of steels with high carbon content and high alloy steels (high speed steels in particular) is generally poor. The welding of tool steels with 0.3-2.5% carbon is difficult due to their alloying elements.
The main problem with tool steel welding lies in its high hardenability.
During cool-down of the weld, thermal stresses and microstructure transformation take place concurrently, which may result in crack formation in the welded area. Such reductions in weld’s properties must be avoided if a quality weld is required.
Extreme heat input not only would result in possible deformation and higher residual stresses at the end of welding operation, but also would lead to extremely low cooling rate which in turn increases the risk of grain coarsening and undesired growth of grains size in the weld metal by itself [4, 5].
It is also necessary to preheat tool steels before any welding operation begins. This and the appropriate preheating temperature depend on several factors such as, but not limited to: complexity of the component, welding procedure, workshop temperature and component’s thickness and composition.
It is worth mentioning that high speed steels with high Chromium and Tungsten content
MAPNA Turbine • March 2017
14
must be preheated slowly in order to avoid cracks stemming from stresses caused by low heat conductivity of such materials.
Welding of a cold tool results in rapid cooling of the weld metal and heat affected zone. The subsequent transformation to a brittle martensitic structure also leads to higher risk of cracking.
The cracks formed in the weld could well propagate over the entire tool if it is already cold. During multi-run welding of a well preheated tool at a proper temperature, most of the weld remains austenitic during welding and transforms gradually as the temperature goes down. Hence, a uniform hardness and microstructure is guaranteed over the whole weld [5].
The consumables used in tool steel welding must be capable of producing a high quality weld free from any kind of crack, porosity and non-metallic impurities. Generally, the chemical composition of welding consumables used for tool steels must be the same as the base metal. While welding in the annealed condition such as when a mould needs to be adjusted
during the process of manufacture, it is of critical importance that the consumables have the same heat treatment properties as the base metal; otherwise the welding area of the finished tool will have a different hardness level. Large differences in chemical composition also increase the risk of crack formation due to hardening [2, 5].
Broaching tools are used to form turbine disk grooves which accommodate turbine blades. After a while, due to severe wear tool dimensions fall out of admissible tolerance range and practically, new tools are required. Since the price of these tools are substantially high, refurbishment using welding is a lot more economical and cost-effective than supplying new tools.
In the present essay, the effects of preheating temperature on the properties of welding area are evaluated and how to produce a crack-free weld with appropriate hardness is scrutinized through optimization of the conditions following the selection of a proper filler and development of the right welding procedure.
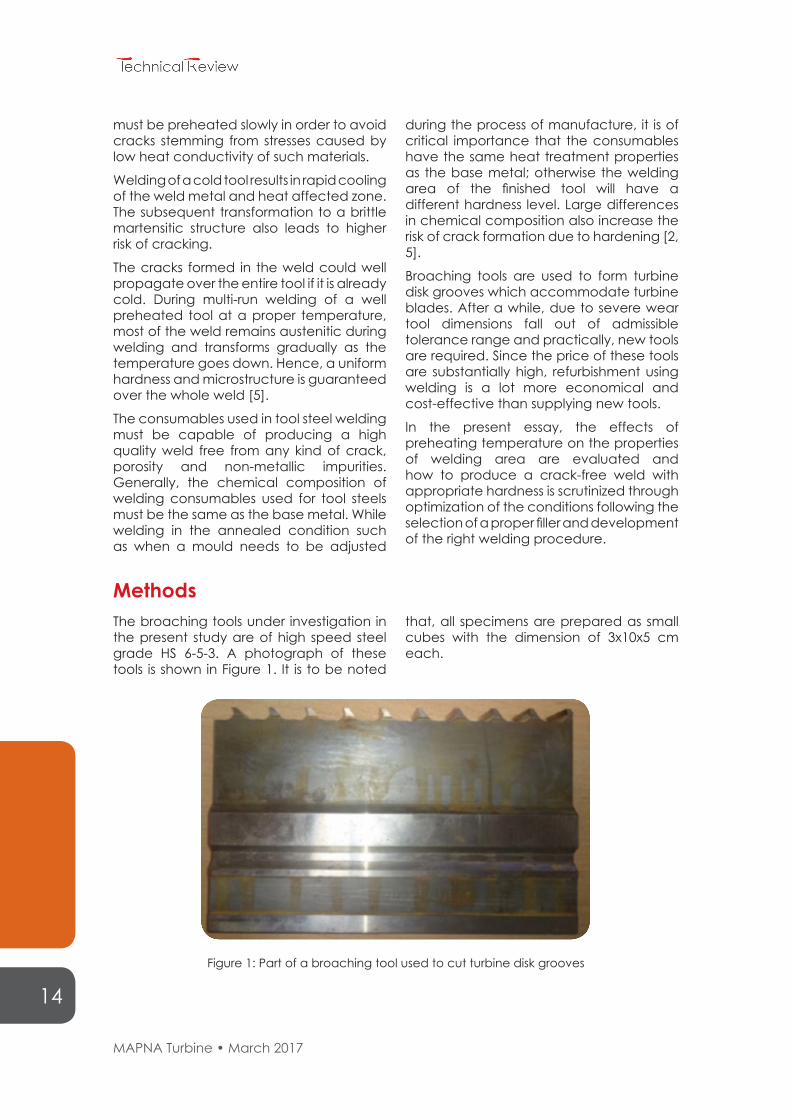
MethodsThe broaching tools under investigation in the present study are of high speed steel grade HS 6-5-3. A photograph of these tools is shown in Figure 1. It is to be noted
that, all specimens are prepared as small cubes with the dimension of 3x10x5 cm each.
Figure 1: Part of a broaching tool used to cut turbine disk grooves
MAPNA Turbine • March 2017
15
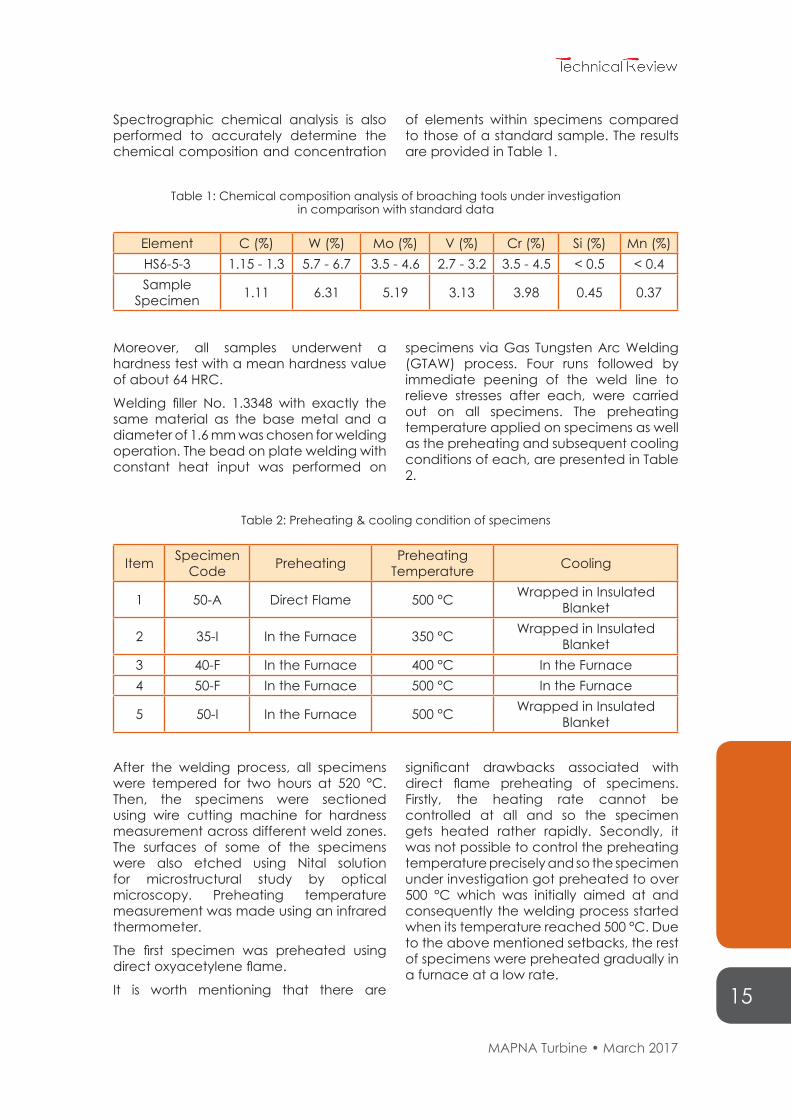
Spectrographic chemical analysis is also performed to accurately determine the chemical composition and concentration
of elements within specimens compared to those of a standard sample. The results are provided in Table 1.
Table 1: Chemical composition analysis of broaching tools under investigationin comparison with standard data
Table 2: Preheating & cooling condition of specimens
Element C (%) W (%) Mo (%) V (%) Cr (%) Si (%) Mn (%)HS6-5-3 1.15 - 1.3 5.7 - 6.7 3.5 - 4.6 2.7 - 3.2 3.5 - 4.5 < 0.5 < 0.4Sample
Specimen 1.11 6.31 5.19 3.13 3.98 0.45 0.37
Moreover, all samples underwent a hardness test with a mean hardness value of about 64 HRC.
Welding filler No. 1.3348 with exactly the same material as the base metal and a diameter of 1.6 mm was chosen for welding operation. The bead on plate welding with constant heat input was performed on
specimens via Gas Tungsten Arc Welding (GTAW) process. Four runs followed by immediate peening of the weld line to relieve stresses after each, were carried out on all specimens. The preheating temperature applied on specimens as well as the preheating and subsequent cooling conditions of each, are presented in Table 2.
Item Specimen Code Preheating Preheating
Temperature Cooling
1 50-A Direct Flame 500 °C Wrapped in Insulated Blanket
2 35-I In the Furnace 350 °C Wrapped in Insulated Blanket
3 40-F In the Furnace 400 °C In the Furnace4 50-F In the Furnace 500 °C In the Furnace
5 50-I In the Furnace 500 °C Wrapped in Insulated Blanket
After the welding process, all specimens were tempered for two hours at 520 °C. Then, the specimens were sectioned using wire cutting machine for hardness measurement across different weld zones. The surfaces of some of the specimens were also etched using Nital solution for microstructural study by optical microscopy. Preheating temperature measurement was made using an infrared thermometer.
The first specimen was preheated using direct oxyacetylene flame.
It is worth mentioning that there are
significant drawbacks associated with direct flame preheating of specimens. Firstly, the heating rate cannot be controlled at all and so the specimen gets heated rather rapidly. Secondly, it was not possible to control the preheating temperature precisely and so the specimen under investigation got preheated to over 500 °C which was initially aimed at and consequently the welding process started when its temperature reached 500 °C. Due to the above mentioned setbacks, the rest of specimens were preheated gradually in a furnace at a low rate.
MAPNA Turbine • March 2017
16
Table 3: Preheating & cooling condition of specimens
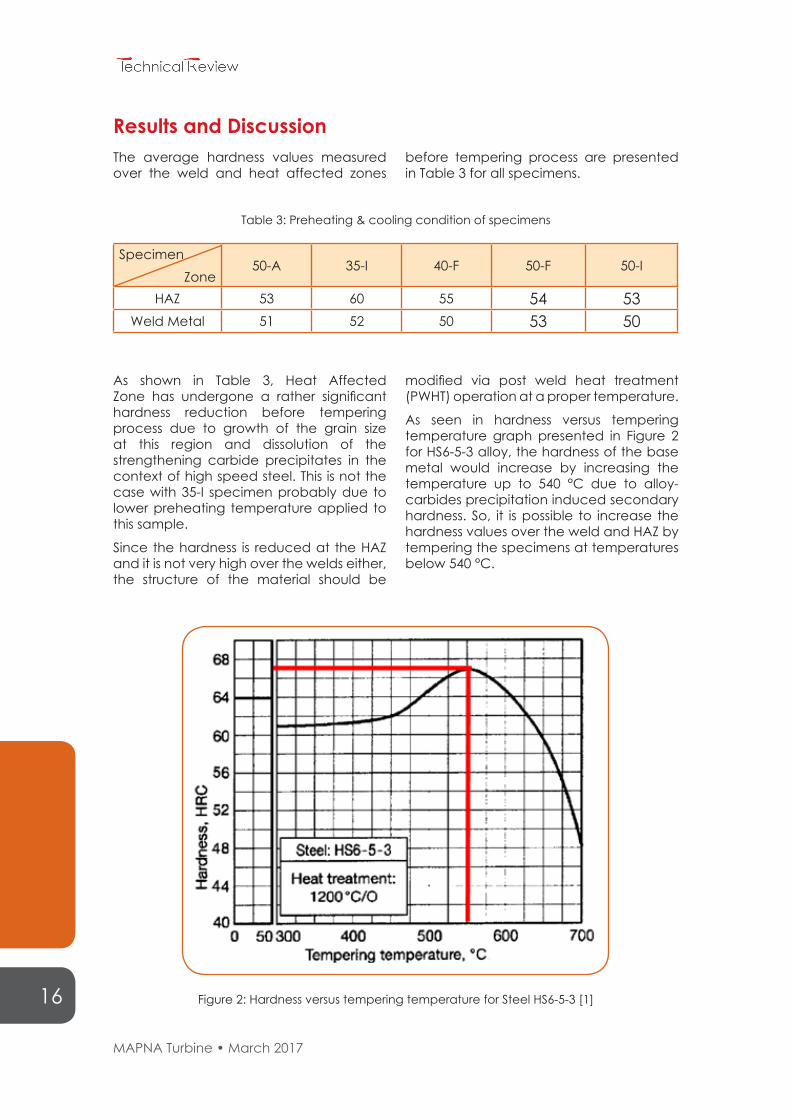
Results and DiscussionThe average hardness values measured over the weld and heat affected zones
before tempering process are presented in Table 3 for all specimens.
SpecimenZone
50-A 35-I 40-F 50-F 50-I
HAZ 53 60 55 54 53Weld Metal 51 52 50 53 50
As shown in Table 3, Heat Affected Zone has undergone a rather significant hardness reduction before tempering process due to growth of the grain size at this region and dissolution of the strengthening carbide precipitates in the context of high speed steel. This is not the case with 35-I specimen probably due to lower preheating temperature applied to this sample.
Since the hardness is reduced at the HAZ and it is not very high over the welds either, the structure of the material should be
modified via post weld heat treatment (PWHT) operation at a proper temperature.
As seen in hardness versus tempering temperature graph presented in Figure 2 for HS6-5-3 alloy, the hardness of the base metal would increase by increasing the temperature up to 540 °C due to alloy-carbides precipitation induced secondary hardness. So, it is possible to increase the hardness values over the weld and HAZ by tempering the specimens at temperatures below 540 °C.
Figure 2: Hardness versus tempering temperature for Steel HS6-5-3 [1]

MAPNA Turbine • March 2017
17
SpecimenZone
50-A 35-I 40-F 50-F 50-I
Base Metal 47 64 65 65 64HAZ 63 64 61 61 63
Weld Metal 67 62 61 61 65
It is apparent that for the specimen 50-A which is preheated via direct flame, the hardness of the base metal has substantially decreased. It is probably because the preheating temperature has transcended the initial tempering temperature of the base metal as a result of its uncontrollable nature and hence prompting a substantial decrease in hardness due to grain coarsening. Furthermore, since the precipitates have just coarsened and not dissolved, the hardness has not increased during the PWHT operation either. Such reductions in hardness values were not observed in other cases, corroborating the favorable effect of uniform preheating carried out in the furnace.
As expected, the hardness values over the
weld and HAZ exhibit a favorable increase close to that of the base metal due to proper temperature chosen for tempering operation.
For further investigation the specimens are etched and examined using an optical microscope. Figure 3 shows a crack developed in the base metal of the specimen 35-I. This can be attributed to tensile stresses induced by contraction of the weld zone which leads to cracking of the specimen from its sharp edge. It seems cracking would have been avoided with higher preheating temperatures which leads to lower thermal gradients as no cracks are observed in other specimens which have undergone higher preheating temperatures.
Figure 3: An optical microscope view of the crack developed at the base metal of the specimen 35-I
Mean hardness values of the specimens measured over different zones after being
tempered at 520 °C are presented in Table 4.
Table 4: Post-tempering mean hardness values measured over different zones
MAPNA Turbine • March 2017
18
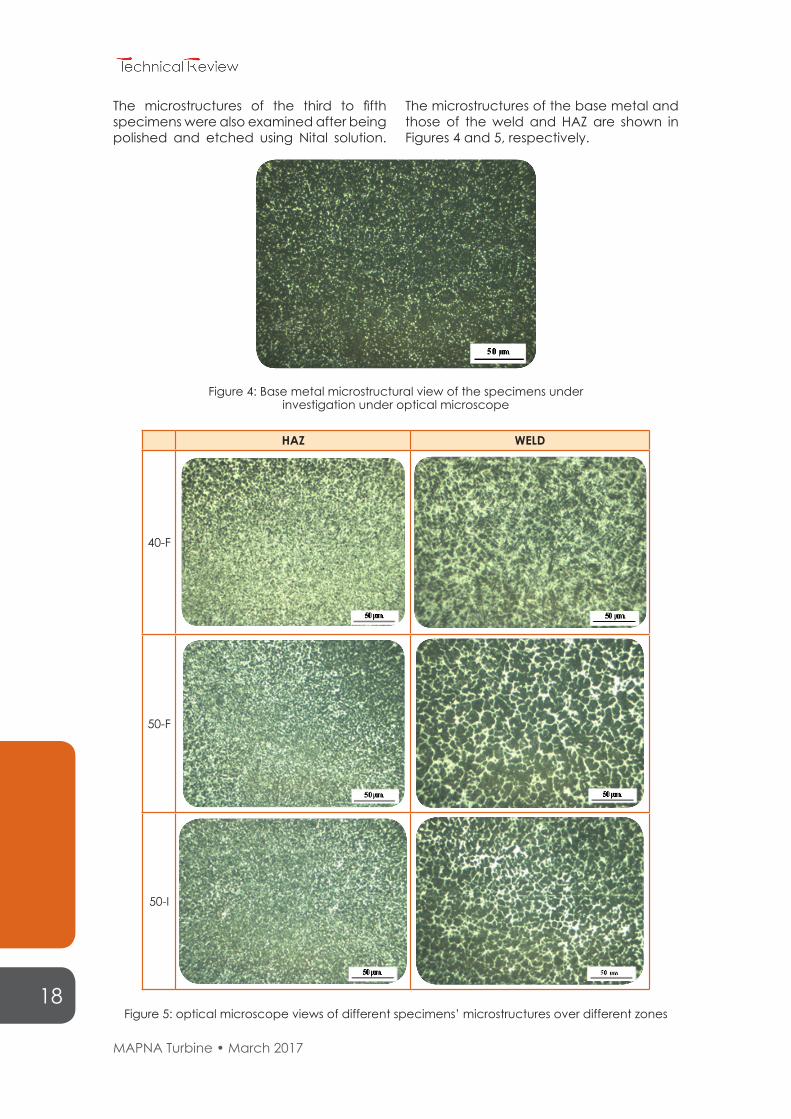
The microstructures of the third to fifth specimens were also examined after being polished and etched using Nital solution.
The microstructures of the base metal and those of the weld and HAZ are shown in Figures 4 and 5, respectively.
Figure 4: Base metal microstructural view of the specimens under investigation under optical microscope
HAZ WELD
40-F
50-F
50-I
Figure 5: optical microscope views of different specimens’ microstructures over different zones
MAPNA Turbine • March 2017
19
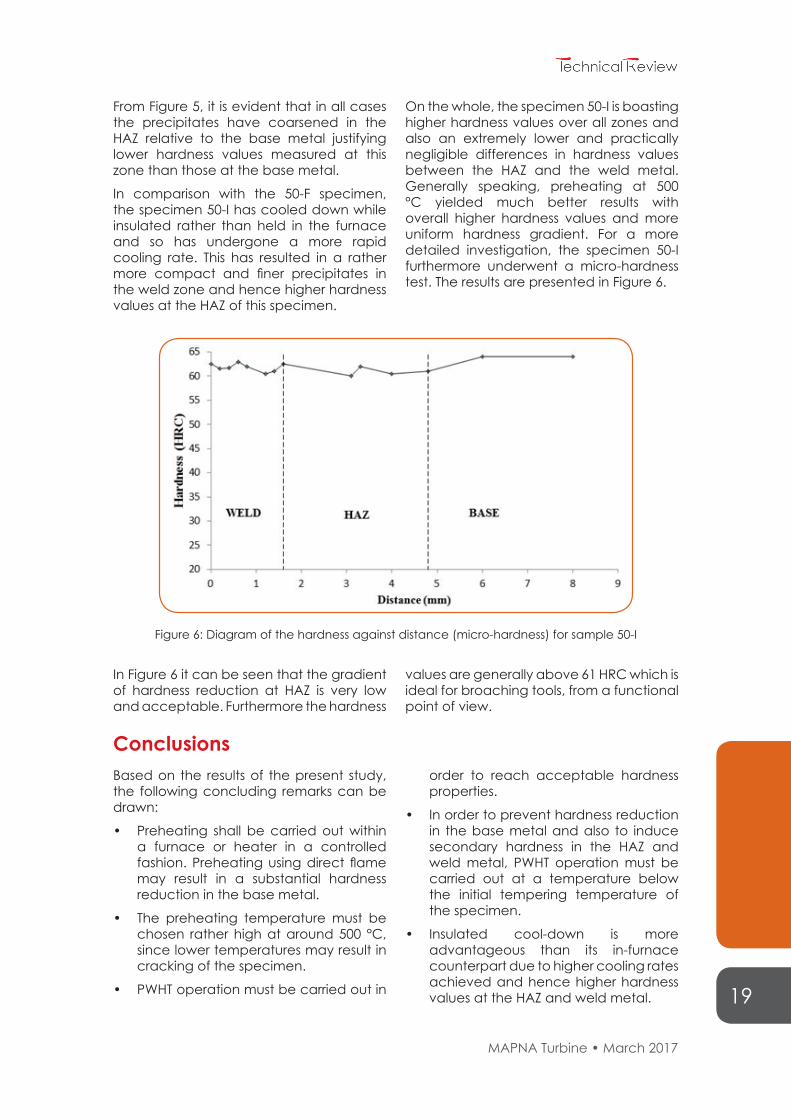
Figure 6: Diagram of the hardness against distance (micro-hardness) for sample 50-I
From Figure 5, it is evident that in all cases the precipitates have coarsened in the HAZ relative to the base metal justifying lower hardness values measured at this zone than those at the base metal.
In comparison with the 50-F specimen, the specimen 50-I has cooled down while insulated rather than held in the furnace and so has undergone a more rapid cooling rate. This has resulted in a rather more compact and finer precipitates in the weld zone and hence higher hardness values at the HAZ of this specimen.
On the whole, the specimen 50-I is boasting higher hardness values over all zones and also an extremely lower and practically negligible differences in hardness values between the HAZ and the weld metal. Generally speaking, preheating at 500 °C yielded much better results with overall higher hardness values and more uniform hardness gradient. For a more detailed investigation, the specimen 50-I furthermore underwent a micro-hardness test. The results are presented in Figure 6.
In Figure 6 it can be seen that the gradient of hardness reduction at HAZ is very low and acceptable. Furthermore the hardness
values are generally above 61 HRC which is ideal for broaching tools, from a functional point of view.
ConclusionsBased on the results of the present study, the following concluding remarks can be drawn:
• Preheating shall be carried out within a furnace or heater in a controlled fashion. Preheating using direct flame may result in a substantial hardness reduction in the base metal.
• The preheating temperature must be chosen rather high at around 500 °C, since lower temperatures may result in cracking of the specimen.
• PWHT operation must be carried out in
order to reach acceptable hardness properties.
• In order to prevent hardness reduction in the base metal and also to induce secondary hardness in the HAZ and weld metal, PWHT operation must be carried out at a temperature below the initial tempering temperature of the specimen.
• Insulated cool-down is more advantageous than its in-furnace counterpart due to higher cooling rates achieved and hence higher hardness values at the HAZ and weld metal.

MAPNA Turbine • March 2017
20
References[1] DIN EN ISO 4957: 1999.
[2] A.F. Rousseau, J.G. Partridge, Y.M. Gozükara, S. Gulizia, D.G. McCulloch, “Carbon evolution during vacuum heat treatment of High Speed Steel”,Vacuum 124, 85-88, 2016.
[3] Mümin Sahin, “Joining with friction welding of high-speed steel and medium-carbon steel”, Journal of Materials Processing Technology 168, 202–210, 2010.
[4] Steeve Thompson, Handbook of mold, tool and die repair welding, Woodhead Publishing Ltd, 1999.
[5] BÖHLER brochure on Welding in tool making, “A guideline for welding of cold work steels, hot work steels, high speed steels, plastic mould steels including PM steels”, UTP Schweißmaterial GmbH.
MAPNA Turbine • March 2017
21
03 Phased Array Inspection for Testing Turbine Parts during Overhaul and Life Time Extension
Introduction
There is a great demand for more novel and effective inspection methods for power generation equipment with
distinctively complicated geometries and defects. These methods must be applicable to assess the condition of parts in situ, all over their service lifetime. Moreover, the results of such inspections are generally used as input data to estimate remained lifetime of parts and equipment and hence they need to be as precise and accurate as possible. So, advanced Non-Destructive Test (NDT) methods are needed.
In recent years, ultrasonic phased array
evaluation method has attracted more attention from NDT specialists compared to conventional approaches because of its capabilities in assessment of equipment with complicated geometries without the need for multiple probe positioning and numerous variations in incident angles. This feature makes ultrasonic phased array test method an appropriate solution for turbine parts in situ inspections.
Keeping up with the pace of evolving technology, MAPNA Turbine has focused on developing these novel methods and taking full advantage of them.
Technical ExplanationIn a conventional ultrasonic test, mono-crystal probes with divergent beams are utilized. Generally, ultrasonic waves propagate along an acoustic axis with a single refracted angle. In some cases, dual-element probes or mono-crystals with focused lenses are used to decrease the dead zone area whilst increasing the defects resolution.
One of the greatest limitations associated with single-angle pattern is size of detectable disoriented defects. Most of the “good practice” test methods add supplementary scans area with an extra angle, generally 10 – 15 degrees apart, to enhance the probability of defect detection.
It is evident that, the more complicated the geometries and the higher the thickness of the parts, the more difficult the inspection procedure to be carried out, as the probe carrier has a limited scanning accessibility. So to perform the inspection of these parts, a phased array multi-crystal probe with focused beams activated by a dedicated piece of hardware is advantageous.
In order to assess the conditions of the blade roots, some in situ inspection techniques have been developed that allow highly stressed areas of the blades roots to be inspected.
Remarkable advantages of these techniques are as follows:

MAPNA Turbine • March 2017
22
Figure 1: Top Left: Schematic representation of mono-crystal single-angle probe; Top Right and Bottom: Schematic representation of linear array probe
Speed: The phased array technology has electronic scanning capability typically one order of magnitude faster than its conventional scanning counterpart.
Flexibility: A single phased array probe can cover a wide range of applications, unlike conventional ultrasonic probes.
Electronic setups: These setups are accomplished in a simple manner by loading a file and calibrating it. Parameters accommodation set easily by prepared files.
Small probe dimensions: For some
applications, limited access is a major concern and one small phased array probe can perform the job as effectively as multiple single-transducer probes.
Reliable defect detection: Phased array can detect defects with an increased signal-to-noise ratio using focused beams. Moreover, the probability of detection (POD) is increased due to angular beam deflection (S-scan).
Imaging: Phased arrays offer new and unique imaging techniques such as S-scans which allow easier interpretation and analysis.
ApplicationsTUGA started to develop ultrasonic phased array techniques to decrease inspection times and to improve data evaluation for different gas turbine components. Some of these techniques include methods for inspecting gas turbine disc bores, shafts and blade roots during LTE (Life Time Extension) and overhaul time intervals. To assess the condition of the blade roots, techniques have been developed that allow highly stressed areas of the part to be inspected. Similarly, phased array methods are appropriate method to detect some
service damages to blades without a need to disassemble them from their grooves on turbine discs (In situ inspection).
- Disc Bore
The modeling of the beam has been carried out at MAPNA Turbine in the engineering department, considering the shapes and effects of the surface curvature on the sound beam. It should be noted that, all the required corrections were made during calibration. In case of continuously changing surfaces with complex geometry,

MAPNA Turbine • March 2017
23
-Fir Tree Root on Turbine Blade In the beginning of 2015 the engineering department of MAPNA Turbine was assigned to develop a customized phased array ultrasonic technique to inspect steam
turbine components. To serve this purpose, it was necessary to develop a test strategy for low pressure rotating blades, and a test block with exact product shape and material was thus manufactured (Figure 3).
Figure 2: Top: 3D Model of disk bore; Bottom: Manipulator used for testing with phased array technique
Figure 3: Left: 3D Model & Right: Manufactured fir tree root test block
there are instances where the curvature is positive in one direction and negative in another one. This affects the soundness of the beam differently and shall be modeled to get a sensible and accurate set of focal
laws for an examination. A 3D model of a disk bore along with the manipulator used for testing with phased array technique is shown in Figure 2.

MAPNA Turbine • March 2017
24
-Dovetail Groove on Compressor Disk TUGA established an advanced phased array technique for detecting discontinuities in the surface of dovetail
grooves. Therefore, a test block with artificial notches was modeled and manufactured by MAPNA Turbine engineers as shown in Figure 4.
MAPNA Turbine is continuing to develope novel ultrasonic phased array test methods to be able to inspect all critical turbine components. A few ongoing projects with regard to this method are as follows:
• Testing of vane roots and tip tenons.
• Assessment of all piping related to steam and gas turbine.
• Establishing a research and training center to develop knowledge and offering of these services to the customers.
Figure 4: Left: 3D & Right: Manufactured dovetail groove test block
Prospects of Phased Array Technology in MAPNA Turbine

MAPNA Turbine • March 2017
25
04 Gas Turbine Semi-dynamic Simulation Laboratory at a Glance
Introduction
The steadily increasing diversity in MAPNA Turbine products accentuates more than ever the need for analytical,
simulating and condition monitoring systems related to these products. In fact, the risk involved in implementing any control logic on an actual machine, after designing each new product or during modifications and upgrades of the current fleet, would be so high that setting up such a laboratory is inevitable. Within this context, the semi-dynamic simulation laboratory with the capability to test different operational conditions of turbine and auxiliary systems was developed. Testing logic control system with the
possibility of immediate incorporation of different equipment items such as fuel valves in the test loop is also covered for different versions of MGT-70 and MGT-30 gas turbines. Moreover, the design and development of condition monitoring systems for different products and MGT-70 in particular, is currently being conducted in this laboratory.
It is also worth mentioning that all the processing units, algorithms, software programs and the developed hardware required for achieving the above mentioned goals have been designed and developed at this laboratory and relying exclusively on the local knowledge.
Logic Control System AnalyzerOne of the most important applications of any simulation system is testing the logic control system to ensure its proper function in addition to evaluation and analysis of the performance of new logic control systems.
In this laboratory, there are basically two approaches in place to designing simulators with entirely different capabilities in terms of hardware and software structures.
In the first approach the simulator is connected to the PLC via industrial Ethernet protocol, enabling the user to send and receive data in a short time span of about 180 ms.
Since no data is transferred by means of hardware in this method, it is required to change all hardware addresses within the logic control system. On the other hand, the use of Bus Ethernet for data transfer makes the whole test process practically free of charge. This method can be utilized in cases where there is not enough time for preparation and setting up of the required hardware or when the costs are of great concern.
It is worth mentioning that this method has
been successfully employed in testing the local logic control system developed for the governor of the MGT-30mobile turbo generator with spectacular outcomes with respect to detection and resolving several logical and processing defects and setbacks that would have resulted in irreparable damages, had they remained unresolved.
In the second approach, the control system is connected to simulators without any alteration and with all the input and output terminals in place via the developed intermediary hardware.
In this method, the data is transferred using a data bus and so none of the addresses are changed in the logic control system. Therefore, it is practically executed and tested in circumstances most closely resembling those in the real operating conditions.
Additionally, a single program cycle comprising reading the outputs of the control system, data transfer to the model, complete execution of the model and generation of the output data within the model as well as the data transfer to the
MAPNA Turbine • March 2017
26
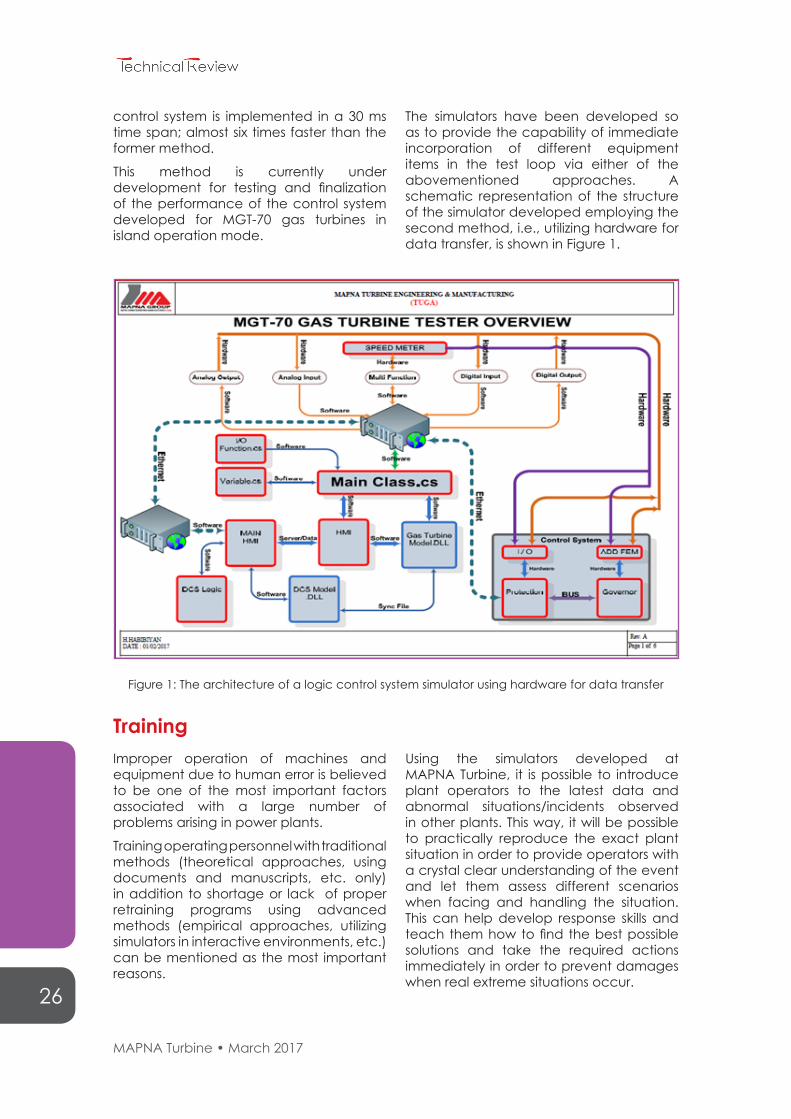
control system is implemented in a 30 ms time span; almost six times faster than the former method.
This method is currently under development for testing and finalization of the performance of the control system developed for MGT-70 gas turbines in island operation mode.
The simulators have been developed so as to provide the capability of immediate incorporation of different equipment items in the test loop via either of the abovementioned approaches. A schematic representation of the structure of the simulator developed employing the second method, i.e., utilizing hardware for data transfer, is shown in Figure 1.
Figure 1: The architecture of a logic control system simulator using hardware for data transfer
TrainingImproper operation of machines and equipment due to human error is believed to be one of the most important factors associated with a large number of problems arising in power plants.
Training operating personnel with traditional methods (theoretical approaches, using documents and manuscripts, etc. only) in addition to shortage or lack of proper retraining programs using advanced methods (empirical approaches, utilizing simulators in interactive environments, etc.) can be mentioned as the most important reasons.
Using the simulators developed at MAPNA Turbine, it is possible to introduce plant operators to the latest data and abnormal situations/incidents observed in other plants. This way, it will be possible to practically reproduce the exact plant situation in order to provide operators with a crystal clear understanding of the event and let them assess different scenarios when facing and handling the situation. This can help develop response skills and teach them how to find the best possible solutions and take the required actions immediately in order to prevent damages when real extreme situations occur.

MAPNA Turbine • March 2017
27
Figure 2: Screenshots of control system simulator in training mode
In addition to formidable capabilities and graphical appeal of the simulators, the interactive assessment of the system’s behavior also provides more enduring effects within the context of skill development in personnel, compared to traditional training methods. Several screenshots of control system simulator representing graphical appeal of simulator environment are presented in Figure 2.
Understanding the performance and behavior of the system in different conditions is also of great importance for engineers and designers. The use of simulators is extremely valuable in training the design engineering team in an interactive environment, which allows the study of the performance of the machine in both normal and abnormal conditions, especially given the limited access to power plants.
Turbine Condition MonitoringTurbine condition monitoring system has been designed in a way that allows communication and connection to each power plant database which makes it possible to analyze the data associated with each and every single power plant unit utilizing the intelligent models and algorithms developed.
This system is currently under development in three working stages.
At the first stage, the received data from central server is automatically evaluated and a condition report with respect to normal or abnormal performance of the machine is sent to power plant operators as well as the specialists located at MAPNA Turbine.

MAPNA Turbine • March 2017
28
Figure 3: Condition Monitoring System Fundamentals
At the second stage and in case of an abnormal condition diagnosis, following the first stage, a detailed investigation of the performance of the machine will be carried out by a professional team of specialists using the assessment system available at this stage and the data provided by the system at the first stage. Therefore, the main reasons and root causes of the faults and abnormal condition of the machine will be established and sent back to power plants along with the remedial solutions to fix the problem.
At the third stage, which is meant to be the last stage in the condition monitoring process and will be performed after accomplishment of the database enreachment and success in the first two stages, a prediction of the machine performance over the subsequent month will be provided by evaluation of the machine condition using the artificial intelligence algorithms, neural networks, intelligent data filters and classifications, data processing techniques and the enriched database developed.


Factory: Mapna blvd., Fardis, Karaj, I.R.Iran.Post code: 31676-43594 Tel: +98 (26) 36630010 Fax: +98 (26) 36612734
Head Office: 231 Mirdamad Ave. Tehran, I.R.Iran.P.O.Box: 15875-5643Tel: +98 (21) 22908581Fax: +98 (21) 22908654
© MAPNA Group 2017The technical and other data contained in this Technical Review is provided for information only and may not apply in all cases.
GR96-0