echnical eview - mapnaturbine.ir review-no.6... · (tuga) echnical eview no.6 - october 2016...
TRANSCRIPT

MAPNA TURBINE ENGINEERING & MANUFACTURING CO. (TUGA)echnical eview
No.6 - October 2016
Will
pow
er to
Em
pow
er G
ener
atio
ns

Cover PageMGT-30mobile

���������� ������� ������ 1
“Excellence is the gradual result of always striving to do better” Pat Riley
Dear Customers, Partners and Professionals,Over its entire life of brilliant achievements and steadfast dedication to excellence, MAPNA Turbine has sought to serve the power sector effectively. There is growing evidence that interim, fast-track power systems will be needed in evolving markets of energy in the context of fundamental transition towards small-scale, distributed power generation. So, we are extremely pleased to introduce the MGT-30mobile Power Plant as the dawn of a new era in providing mobile power ����������������������� ���������� ������ �current edition. Gas turbine exhaust casing deformation has long been a known issue with the ����������� ������!�"#��� �$�"%����'���turbines. The meticulous steps taken to ��%������������� ����%�*�$�% � + %����solutions to address this issue is presented in the second article, as another testament to dedication of MAPNA Turbine to +�%�����������%��*'�% ����������' �� ��of products.In the third essay an interactive simulation environment developed to study the dynamic behavior of centrifugal compressors in different modes of operation using a modular dynamic model is introduced. The dynamic simulator enables design and optimization of compressor anti-surge control system. It can also serve as an educational tool by providing the user with an extremely reliable platform to examine design of the control system or to develop and test any control strategy and logics. The fourth article takes a look at the newly established MAPNA Turbine’s Combustion Test Stand and points out its different features. It also provides insights into the potential applications of the
data obtained from the laboratory in optimization and upgrading of the current burners and combustors, as well as in design and development of new generations of combustion systems in the future.Finally, the last article provides an in-depth look at the design stages of an outstanding 10 MW steam turbine developed to obtain �� � ��'� ��� *����� � ���� � ���� ���� ��%�power when combined with a 25 MW MGT-30 gas turbine.
Respectfully, Mohammad Owliya, PhD
Vice President for Engineering and R&D MAPNA Turbine Company (TUGA) -October 2016
EDITORIAL

���������� ������� ������2
TABLE OF CONTENTS
An Analytical-Experimental Approach to Prevent Exhaust Casing / ��+����������� �4���������7� ������!�"#��!������� ��2
��' ���#�"���
MGT-30mobile Power Plant; Power on the Ride1Pages 3 - 6
Compression Systems Dynamic Simulator for Anti-Surge Control System Design & Development3
MAPNA Turbine’s Combustion Test Stand at a Glance4
MST-10C; A Small Steam Turbine Designed to Be Outstanding5
��' ����8�"��#
Pages 18 - 21
��' ������"��#

���������� ������� ������ 3
In order to bring fast-track solutions into the currently available power options on offer, MGT-30mobile Power Plant Project
was planned and pursued within MAPNA Group and TUGA. Making maximum use of already available MGT-30 turbines and accessories, this project enables rapid installation of a 25 MW power generation block connected to the power distribution grid or as a local generation unit.
MGT-30mobile is capable of producing up to 25 MW of mobile power, depending on ambient conditions. It can run on, and switch seamlessly between, gas and liquid
fuels (dual fuel feature) and is quick to dispatch, reaching its full power in about 25 minutes. The high power density of this power plant enables fast power provision for a wide range of applications on a temporary, permanent or semi-permanent basis.
The trailer-mounted Power Plant is packaged on a six-trailer platform as shown in Figure 1, and is available as a Skid-Mounted, Easy-to-Erect power generation unit. It boasts a space-conscious design :���������#<+�=��<+���� �� ����� ����� �all the trailers and auxiliaries.
1 MGT-30mobile Power Plant; Power on the Ride
Introduction
Lube. Oil Coolers
Exhaust
Turbine
FUB
MV Cubicle
Dry TransformerEEM2EEM1Junction Box
Junction Box
FFSAir Intake
Generator
Figure 1: MGT-30mobile Power Plant General Arrangement

���������� ������� ������4
! � ����* ���������������� ����� ��� ����� %������� ��@
Key Features
Trailer No. Trailer’s Type No. of
AxlesTotal Weight
(Kg)
The weight of the Equipment
(Kg)
Trailer’sWeight
(Kg)
Trailer’s Dimensions
(m)T1 Flat Bed 2 18500 11500 #��� 12600 x 2600T2 Flat Bed 3 33500 18000 15500 14455 x 3800T3 Heavy Duty 6 105333 69333 46000 �#��� x 3800T4 Goose neck 3 Q#XX< 25885 22000 19185 x 3800T5 Heavy Duty 13 212015 135015 ##��� �Q8#� x 4000T6 Heavy Duty 4 55650 33150 22500 13200 x Q�#X
��� ���Y��� ��������Z* ���������������� ��!�"8�+��� �� ���������� %������� ��@
The main features of the MGT-30mobile include, but are not limited to the following:
�� Quick installation and commissioning: Power can be generated in less than one month after site preparation & trailers’ arrival.
�� Mobility: Mounted on a mobile, 6-trailer platform, MGT-30mobile can be transported via land and/or sea to remote places. The mobile nature of the power plant means that it can be swiftly deployed to other sites within days when it is no longer required at the original site.
�� Distributed power: Localized power supply, eliminating the need for additional transmission and generation infrastructures.
�� Modular, reliable power: Able to add 25 MW blocks of power as demand increases.
�� Dual fuel capability: MGT-30mobile is capable of running on both natural gas and/or fuel oil at an output of up to 25 MW.
��� ��]��!�"8�+��� ����� �^�� ��������Z* ����������
Item Parameter (Unit) Fuel Gas Fuel Oil1 Output (MW) �<@#* 24.5*2 `���� ����{|} 35 34.33 Power turbine shaft speed (RPM) 3000 30004 `=��������:�{~'�� �} 90 895 Exhaust gas temp (°C) Q#X 4806 Generator Rated Voltage (V) 11000 11000# Generator frequency (Hz) 50 50
Table 2: MGT-30mobile Technical Characteristics
* ISO rated power

���������� ������� ������ 5
ApplicationsMGT-30mobile is designed to address a number of challenges in supplying electrical energy such as:
�� /�������� ��� ��� ��� �� � � ����� '�%]�Shortage or lack of transmission and distribution infrastructures required by remote, isolated and/or mobile facilities.
�� Lengthy construction of electricity
generation infrastructure: Long construction times as well as unpredicted delays.
�� Emergencies and natural disasters: when power generation sources have been destroyed.
�� Rapid demand growth: growth of electricity demand rates during seasonal or peak periods.
Design FeaturesAlthough one of the main objectives in the development of MGT-30mobile power plant was to exploit the already available MGT-30 turbines and accessories and hence minimize the changes required, some pieces of equipment such as air intake and exhaust systems were needed to be redesigned and reconstructed in order to be more compatible with the trailer assembly.
Trailer structures are not only meant to carry equipment to sites but also serve as a foundation for power plant operation. So, the design and manufacture of the trailers proved to be one of the main challenges
associated with this project, given the variety of structural and operational loads applied on these structures as well as transportation requirements.
��� ����� ���� =��� �� � ��'�������� ����� �' �to overcome was the vibrational analysis and design of the 5th trailer (T5) carrying turbine and generator. The dynamic load of the gas turbine - generator shaft rotor train comprises three sources of vibration by three separate shafts of the gas turbine with different rotational speeds in addition to that of the generator.
Some representative results of structural analyses are depicted in Figures 2 and 3.
Figure 2: Structural Analysis Results for Trailer T5 During Acceleration

���������� ������� ������6
A number of measures have been taken in order to minimize on-site installation time of the MGT-30mobile power plant. The trailers, chassis and jacks thereof are optimally designed to reduce on-site �����'� ��%� ��$��� :�~�@� ���� ���*+ ���pieces are packaged on trailers. Piping are pre-fabricated and tested, cabling are of quick-connection socket type and access platforms are also designed so as to keep
the required site assembly process as far down as possible. Large portion of piping and cabling activities have also been done beforehand in order to get the plant up and running at the shortest possible time. Also, to prevent the outbreak of any problem, all power plant once assembled is tested, commissioned and trial-operated �����:��� � �� � ��'��������*��~�' %@
The main objective of the MGT-30mobile was to develop a mobile power plant using the already available land-based equipment. Transportation has been added as an integral part of the design.
Currently, this kind of power plant is also available with no trailers, using chassis and skid instead. In this case, the objective is
just easy and quick installation of a 25 MW power plant and so transportation would no longer be served as a design criterion.
The next ambitious step for MGT-30mobile power plant will be to reduce the number of its trailers to two, paving the way for its entrance into the global markets.
Figure 3: Structural Analysis Results for Trailer T5 Under Seismic Loading

���������� ������� ������ #
2 An Analytical-Experimental Approach to Prevent Exhaust Casing Deformation in the Ubiquitous Fleet of MGT-70 Gas Turbines
Introduction
M!�"#�� � �$�"%���� '��� ���� ��+�~ � �*� �� �����% �� � � �� ���Iran and around the world due to
their high reliability, availability and low cost characteristics. It takes high quality product service and support to keep it up and maintain marketability.
Like other OEMs, MAPNA Turbine Company (TUGA) has focused on monitoring of ���� � �@� �� � � ������ � �� ��� �� $ � �� �problems and defects occurring during operation.
One of the main gas turbine parts in need of being monitored during operation is exhaust casing. The exhaust casing supports half of the machine’s weight and makes the rotor coaxial with the casing and is considered as a critical downstream component. The high durability against thermal loadings and high capability for axial and radial expansion are the main characteristics of this component. So, any malfunctioning of this part indirectly impairs operation of a few main components. Deformation of exhaust casing is one of the main observed defects that have
been repeatedly reported. A common offshoot of the exhaust casing deformation observed during overhauls is the gap between the lower and upper halves, which makes the assembly process rather %�������@�
In order to study the behavior of exhaust casing under operating conditions, an analytical-experimental research was conducted at TUGA. The results were applied in a root cause analysis of deformation in order to develop remedial actions. This research project included three phases:
Phase 1: Numerical analysis and experimental measurements of exhaust casing deformation in actual operation condition.
Phase 2: Providing an improvement action relevant to the results of numerical-experimental analyses.
Phase 3: Implementation of the chosen action and evaluation through practical measurements.
Phase 1:Numerical Analysis of MGT-70 Exhaust Casing Deformation and Practical Measurements in Actual Operation ConditionsThis phase includes numerical analysis and experimental measurements during actual operation condition. This analysis is carried out over the whole inlet to outlet length of the exhaust casing. The mechanical analysis results are shown in Figure 1.
The results show some stresses exceed the allowable range for the exhaust casing, but the levels are not enough to cause any excessive deformation of the casing.

���������� ������� ������8
Figure 1: Numerical results of the exhaust casing stress distribution
Figure 2: Numerical results of the Exhaust Casing Deformation
A thermal analysis was carried out to identify critical temperature points on the part. The results of this analysis showed more critical temperature points on outer surfaces of the upper half of the exhaust
casing and at the contact surfaces of intermediate struts with the casing. The numerical results of the exhaust casing deformation are also presented in Figure 2.
In order to verify the results of numerical analysis in actual operation condition, an experimental measurement through thermocouples was designed to measure temperatures at the critical points. The actual temperatures and stress distribution were obtained in this test.
In Figure 3, the exhaust casing deformation results obtained from the mentioned test under actual operation condition is shown.

���������� ������� ������ 9
Figure 3: Exhaust Casing deformation in actual operation condition
The results of numerical and actual �* ������������ ������+�������� �� *�mechanism is the main reason for the exhaust casing deformation. The increased temperatures caused the increased strains
of base material which exceeded the allowable range of creep and so it caused permanent deformation of the exhaust casing.
Phase 2:Providing an Improvement Approach Related to the Results of Numerical-Experimental AnalysesThe increased temperature of exhaust casing is caused by the heat transferred from the hot gas passing through internal sections of the casing. In order to avoid excessive heat transfer to exhaust casing
����!�"#��'������� ������� +��������������is installed between outer casing and the liner. The positioning of this insulation is shown in Figure 4.
Figure 4: The positioning of inner insulation of the exhaust casing

���������� ������� ������10
Current insulation is not capable enough to prevent the above mentioned heat transfer and so, increased temperatures on the exhaust casing are inevitable. Therefore, applying new insulations with lower thermal conductivity seems to be one of the best approaches to reduce the exhaust casing deformation. In addition �����:��� ���� �������� +������%����$�����the new insulation should also have the following characteristics:
�� Ability to maintain its primary structure and thermal properties during long-time operation at working temperatures.
�� Low shrinkage ratio.
Out of this approach, a new insulation :���� 8�|� ��: � �� +��� ���%����$���� :���applied.
The comparison of the new and the current insulation in terms of their thermal conductivity is presented in Figure 5.
Figure 5: Comparison of thermal conductivity between the new and the current insulation
Phase 3:���������� ���� �� �� ������ �������� �� �� �� ������� � �� exhaust casing����% ����$���%�� ��� ��� +��� ���� �������the new insulation in preventing excessive increase of exhaust casing temperatures, an experimental investigation was performed through exhaust casing temperature measurements before and after installation of the new insulation on a power plant unit.
This experimental test included three main steps:
1- Installation of a series of thermocouples to record the casing temperature data before changing the insulation, in actual operating condition of the unit.
2- Replacement of inner insulations of the exhaust casing upper half with the improved one.
3- Installation of a series of thermocouples to record the casing temperature data after changing the insulation, in actual operation condition of the unit.

���������� ������� ������ 11
36 critical temperature points were chosen on upper and lower exhaust casing to install the thermocouples on, before and after the insulation replacement.
After installation of the thermocouples, the measured temperatures were transferred to a data logger system designed for this purpose. Before insulation replacement, the data was recorded under the base load operation of the gas turbine on natural gas fuel.
Similar thermocouples and data logger system were also used to conduct exhaust casing temperature measurements after replacement of the insulation and the measured data were recorded under base load operation of the gas turbine on fuel oil.
In Figure 6, the measured temperatures for two points on the exhaust casing upper half are shown, before and after applying the new insulation.
Figure 6: Insulation replacement effects on measured temperatures for two points on the exhaust casing upper half
(Left: Position I - Right: Position II)
7�'� �#]�� ��� %�� +* ��� ��%��������������� � =�����������'� �� �and after replacement of the insulation

���������� ������� ������12
ConclusionIn the present work, the deformation *�� +� ��� �!�"#�� '��� ���� � =������casing was studied through numerical and experimental methods. This study shows the creep mechanism resulted by increased temperature, is the root cause of such deformations. To decrease heat transfer into the exhaust casing, a new �����������:�����+*�$ %��� +��� ���� ����characteristics was applied on the exposed walls of the exhaust casing. Results of applying such insulation show that the temperature distribution intensity on the
exhaust casing is decreased, especially for the critical points triggering thermal deformation of the exhaust casing.
Out of the results of the present study and in order to avoid the effects of exhaust casing deformation on gas turbine operational condition, this insulation improvement approach can be adopted both for aged units (along with replacement of ‘most probably’ deformed exhaust casings) and for younger ones (without any need to replace the exhaust casings).
1 Temperature measurements are performed only for outer exhaust casing and other parts such �����������%� ���'�������'����:�����7�'� �#�� ����������% %@
��� 7�'� � #�� �� � %���������� ��� ��% %�temperatures on the exhaust casing is
shown before and after the insulation replacement1.

���������� ������� ������ 13
3 Compression Systems Dynamic Simulator for Anti-Surge Control System Design & Development
Introduction
Since compression systems serve as major, expensive and critical elements in most plants in the oil
and gas industry, it is essential to protect them against potential damages caused by a dangerous dynamic phenomenon: Compressor Surge!
Several studies and research activities have been conducted to develop knowledge in design and optimization of compressor anti -surge control system. MAPNA TURBINE, as a major manufacturer of turbo-machines, especially centrifugal compressors, in Iran and in the region, planned to develop the
required tools in this area. The objective of this project was to develop a simulator for compression systems’ dynamic behavior. To serve this purpose, a modular dynamic model of a centrifugal compressor and its surrounding process equipment was developed. A non-linear one-dimensional model provides a description of the compression system performance during start-up, normal operation and emergency shutdown which can be used to test control strategies and logics. Several screenshots of the compression system dynamic simulator are shown in Figures 1, 2 and 3.
Figure 1: Compression Plant Simulator Overview

���������� ������� ������14
Compression SystemMost sectors of the oil and gas industry require expensive compression facilities for different applications such as transmission, storage, gas gathering, gas export, gas injection and LNG. The majority of compression systems employ centrifugal compressors driven by gas turbines or electric motors. These critical systems must be carefully protected to achieve a high level of production sustainability and operational reliability. Cost of damages to ��+* �������� +������� �%������'��������capital losses and long plant downtimes.
Taking into account various design and
performance requirements of centrifugal compressors depending on the industry and application, MAPNA TURBINE has provided the capability and technical know-how in the design and manufacture of compressors with conspicuous major advantages compared with other manufacturers in the market. The ��+* ������ �% ��'� %������:��� �����a wide range of 500 to 30000 sm3/min and discharge pressures from 2 to 200 bars. Z* ����������� ��� ��*����� ��+* ����� � �listed in Table 1.
Compressor type Number of stage(s) Speed (rpm)
Impeller diameter
(mm)
Commercial output Pressure ratio
���"�X"8��"�#�� 3 5000 ##< 28 1.4���"��"Q��"�#�� 2 5000 835 39 �@8#���"�X"Q��"<�#� 3 5000 835 �#@< 1.52MCC-C5-200-3395 6 X�#� 596 X@#X8 2.83���"�#"�X�"�8Q# 4 6100 ##8 8.558 2.08MCC-C4-146-4592 4 8200 <#8 8.558 2.05
Compressor control system must provide the assurance that the compressors are not subjected to damage while undergoing rapid dynamic events. During transient condition, a centrifugal compressor may come close to surge; a violent instability that often damages the compressor due to excessive stress and vibration. Anti-surge control systems are therefore employed to be activated to prevent surge. Anti-surge regulators are used in multi-processor control systems of mechanical drives to control gas compressor units. The anti-surge regulation consists of three functional blocks: diagnostic block of pre-surge conditions, block of surge reserve calculation and ASV (Anti-Surge Valve) control block. Typical control scenarios that have to be considered are process control, starting and stopping, and emergency shutdowns. The possibilities of practically
testing anti-surge control strategies and logics on a full scale compressor are limited because of the consequences of such failures. Moreover, the experimental facility can be very expensive to set up. In other words, experimenting with large industrial compressors controllers is both risky and expensive. Albeit, the reliability of the control system must be examined before the Site Acceptance Test begins. To get it materialized, it is necessary to simulate the plant’s real conditions by simulation tools to verify the system design and to test the control logic across the whole operating range of the compressor * ��+��� @� �� �� �� �� ��'�� �% �����compression system dynamic simulation environment was developed by MAPNA TURBINE in order to design a control system with enhanced control capabilities.
��� ��]��������4����`���*�������+* ������* ����������

���������� ������� ������ 15
Dynamic Simulation of the Compression SystemThe modern surge control design process often involves analyses using dynamic simulation of the compression system involved. The dynamic simulator enables the designer to test new control logics and see the results before implementing it on the governor system. This will increase the reliability and prevent undesirable costs resulting from practical trial and error processes.
Having such simulators is deemed to be essential to serve other applications during all stages of the product life cycle, including but not limited to the following:
�� To simulate real critical conditions in a virtual environment
�� Site Acceptance Test (SAT) and Factory Acceptance Test (FAT) expected capabilities
�� Educational tool to train operators and
improve their skills before and after start-up
�� ��� ��+���� � *���� �� ����'�������operation and develop a load sharing system
�� To conduct “What If” analyses
�� Plant design optimization at Front End Engineering Design (FEED) stage
The project tasks were developed in the four following stages:
1. Review the existing models for Dynamic Simulation of Compression Systems
2. Create a dynamic model for a desired compression system
3. Develop the model in FORTRAN programming language
4. Validate the model with experimental ��%�� �%�%����
Figure 2: Typical Compressor Performance Curve

���������� ������� ������16
A sketch of the system under consideration is presented in Figure 3. The system is composed of the compressor and the surrounding pieces of equipment which are characterized by complex non-linear behavior. In addition, the driver might have complex dynamics which in turn affects the system.
The model also includes a cooler for gas cooling, a scrubber for liquid draining, and a recycle line with a control valve for anti-surge control.
Figure 3: Sketch of Compression System Comprising Compressor and Ancillary Equipment
The model is one-dimensional and simulates * ��� ��� +* ��� ���%�+������:��������system components, and also compressor shaft speed. It is derived in a modular fashion, using mass, momentum and energy balance. Compressor characteristics maps from the compressor test bench are used
to determine compressor pressure ratio ��%� ���� ���@� �� � +��� +������� +�% ��has been developed in FORTRAN and $ �� %� �'������ ��+*���^�� � ��� ����experimental results and those produced ��������� �� �%�%��������� %���+�Z�����Pars 19th phase gas export plant.
Qualitative information on compressor behavior may be obtained by testing compressors. The information obtained on these machines may be used to better understand the physical phenomena and to validate mathematical models. In MAPNA TURBINE, a performance
and mechanical running test bench for centrifugal compressors Figure 4 had been already launched in 2014. Numerous machines of various capacities have been successfully tested at the local test bench. The test facility is equipped with a 2.5 MW driving electromotor and a variable speed
Compressor Dynamic Test

���������� ������� ������ �#
gearbox generating an output speed varying from 0 to 5000 rpm. Compressors of higher velocity are tested using an accessory set-up gearbox coupled to the output shaft of this main gearbox. All test bench equipment pieces and inlet/outlet accessories as well as test instructions follow the requirements of PTC10. In particular, the facility was designed to perform
compressor steady state characterization, such as specifying performance map and identifying compressor surge point. This facility has also been used to carry out dynamic analyses and dynamic simulation validation aiming at investigation of compressor behavior in transient unsteady conditions.
Figure 4: A Photograph of Compressor Test Bench

���������� ������� ������18
4 MAPNA Turbine’s Combustion Test Stand at a Glance
Introduction
Combustion chamber is the most challenging section within a gas turbine engine; where combustion
takes place at the highest pressures and temperatures attained therein. Regardless of recent developments in theoretical approaches and computational simulations, experimental tests still hold their own in producing the greatest value in design and development of combustion systems. Measurements under realistic operating conditions for combustors in gas turbines are, however, limited by the experimental methods and tools available. As a result, combustion test stands have been developed in order to characterize several aspects of gas turbine combustion systems.
Gas turbine combustion test stands are used to study combustion performance and
characteristics of a designed combustion system. Combustors’ operability issues such ��� � ��� ��:� ���� ��+����� ��+ � ������~��auto-ignition and combustion dynamics can be investigated experimentally for development programs. Validation of computational models for turbulent combustion and simulation of the realistic ���� � ��� �� � +* ��� � *��� � ��� : ���as measuring the liner wall temperature distribution and combustor pressure drop may also be carried out by means of a combustion test stand. Furthermore, it helps the study of fuel and air mixing quality regarding dry low emission combustion system. The exact measurement of exhaust gas pollutants may also be performed using the appropriate equipment.
Figure 1: MGT-30 combustor test rig
Main FeaturesTUGA Combustion Test Stand (TCTS) is designed and developed to complete the design procedure of new combustion systems and optimization of existing ��+�����@����������+�%��������'�������which can be rearranged according to the ��� + ������� �����* �������+����@�The test stand operates at atmospheric
and intermediate pressures up to 2.5 bara. �� � � ��� �'� ���� � � %� ����'� $������gaseous fuels and has the capability of ���%�����'��� ��� =�������� ���@��**�*��� �facilities for using light and heavy liquid fuels are also available at the TCTS. The main characteristics of the TCTS at the test section are as follows:
���������� ������� ������ 19
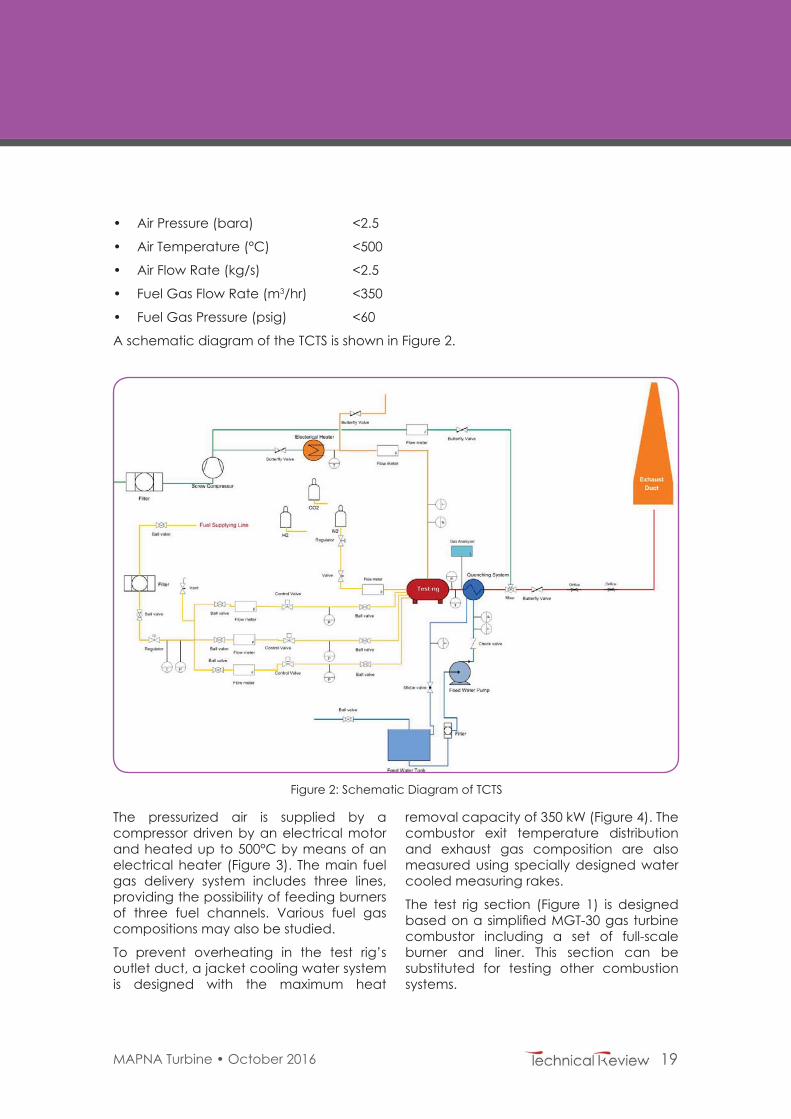
Figure 2: Schematic Diagram of TCTS
�� Air Pressure (bara) <2.5
�� Air Temperature (°C) <500
�� Air Flow Rate (kg/s) <2.5
�� Fuel Gas Flow Rate (m3/hr) <350
�� Fuel Gas Pressure (psig) <60
A schematic diagram of the TCTS is shown in Figure 2.
The pressurized air is supplied by a compressor driven by an electrical motor and heated up to 500°C by means of an electrical heater (Figure 3). The main fuel gas delivery system includes three lines, providing the possibility of feeding burners of three fuel channels. Various fuel gas compositions may also be studied.
To prevent overheating in the test rig’s outlet duct, a jacket cooling water system is designed with the maximum heat
removal capacity of 350 kW (Figure 4). The combustor exit temperature distribution and exhaust gas composition are also measured using specially designed water cooled measuring rakes.
The test rig section (Figure 1) is designed �� %��������+*��� %��!�"8��'������� �combustor including a set of full-scale burner and liner. This section can be substituted for testing other combustion systems.

���������� ������� ������20
Figure 4: Cooling water system
Figure 3: Electrical heater
InstrumentationVarious instruments and techniques such as thermocouples of different types, RTD’s, gas analyzer, thermal paint, and static and dynamic pressure transmitters are used to
measure intended parameters at certain locations. Moreover, development of some optical measurement techniques is in progress for practical research purposes.

���������� ������� ������ 21
It is important to monitor and control the whole system through parameters like � +* ��� �� * ��� �� ��:� �� ��� ��@� ���fact, all the mentioned parameters are closely related to the safety and state of
the combustion test rig. The control system is a hierarchical hardware-software set comprising the following levels as depicted Figure 5.
Figure 5: Control system concept
Control System
�� �� � ���� � $ �� ��� ��+*�� %� ��� � ����� ��%� �����+ ���� {* ��� � ����+��� ����� +����*� �����:+ � ����������$��$ ��� ��@}
�� The second level controls the facilities, collects data and provides interaction with the higher system level; and
�� The third level comprises server and HMI connected to the PLC via a network.

���������� ������� ������22
5 MST-10C; A Small Steam Turbine Designed to Be Outstanding
Introduction
There might be different ways to ��� �� � �� � ���� ���� ��� �!�"8��simple cycle gas turbines such as steam
injection in the gas path. However, the +���� ���� ���:������������$ ���� ���+*� �cycle into a combined cycle with various ����'��������� �� � �:�� +���� ��++���of which being 1x1 and 2x1, i.e. one gas and one steam turbine or two gas turbines along with one steam turbine.
The initial market demand investigations ���%��� %���������Z�� ������ �*�$ %�
that a 1X1 arrangement would be a more attractive option.
����� ���' + ��� �* ��� �� �� �+� ���� �nominal power to some extent. As a rule of thumb, the power of the steam section is approximately half of that produced by the gas portion. So, a steam turbine with a nominal power of about 10-12 MW is expected to be the right match for MGT-30; bearing in mind the nominal power of 25 MW for this gas turbine.
AssumptionsThe exhaust conditions of the MGT-30 gas turbine are assumed to be conforming to the values provided in Table 1.
NO. DESCRIPTION UNIT Value
1 Design Compressor inlet temperature °C 152 Design Compressor inlet Relative Humidity | 603 Design Compressor inlet Atmospheric pressure kPa 1004 Design Output kW �<#��5 Design Heat Rate kJ/kWh 102856 Design Heat Consumption kJ/h*10^6 259# / ��'�� =��������:��� � kg/sec 908 Design exhaust temperature °C Q#X
��� ��]��� +�%���+���*��+ � ������!�"8���* ����'����%
Based on the data provided in Table 1, the thermodynamic parameters of a desirable Combined Cycle Power Plant (CCPP) were set in collaboration with MAPNA sub-companies, namely MAPNA Boiler and MAPNA Cooling. The result is presented in Figure 1 as the Heat Balance Diagram (HBD) of the combined cycle. The back pressure is always provided by the designer of the cooling system or otherwise, it is estimated based on condenser’s type and site conditions.
The main and admission steam temperatures are set taking into account the exhaust temperature of the gas turbine, so that a temperature difference of about 20 °C is considered economical but not � � ������� �% ���� ��+� ���� ���� *����� ���view. The less this temperature difference, the more costly the boiler and the higher �� � ���� ����:���� ������ ���+ ���+ @�7��the present cycle, this value is selected to be 12 °C in order to reach a good ��+*�+�� � �: ���������%� ���� ���@

���������� ������� ������ 23
Figure 1: Heat Balance Diagram (HBD)
The pressure is normally assumed to be neither too high nor too low. Although a higher pressure for the main steam ��� �� ���� ����� � ���� ������� ���% ��would need to be shortened as a result, :����� ��� ����� :���%� ��: � �� � ���� ������� �� � ��% �@� �� �$ �� �� � %��������� ���manufacturing extra short blades has to be taken into consideration. One may suppose that the blades could be longer with a thinner rotor. It should be noted that �� ����� ���� ��� %���+������� +� � � =�� �while in operation, which gives rise to more lateral vibration. To avoid rubbing between the rotor and casings, the blades’ tip clearances have to be relatively large.
This, in turn, leads to more steam leakages at the tip of the blades which will result in decreased power.
On the other hand, too low main steam * ��� ��:���� ����������: ����� � ���� ����and too long blades. The longer the HP (High Pressure) blades, the higher the possibility of having twisted blades even in the HP section, which is not good news for the workshop. This would also affect the total price of the machine.
For a typical 10 MW Steam turbine, a main steam pressure of 40 bar is a quite common practice among turbine manufacturers.
For the admission steam pressure the situation is not so critical. Normally the designer of the HRSG boiler recommends �����$��� �:��������% ���� �����Y �������� �turbine designer’s consent. Nevertheless,
the admission pressure can be selected from a relatively wide range of 3 to 8 bar. Although this value affects the cycle ���� ������� ��+*����������� +�~�� @

���������� ������� ������24
Design FeaturesOnce the primary assumptions to set up the combined cycle are determined, each system manufacturer can start designing the equipment in their scope of work.
Prior to starting the basic design, it is required that the different features of the turbine be selected among various types and kinds of each. For instance, there could be various attitudes toward the lube oil tank. The tank could be separated as an individual equipment or integrated with
the turbine base frame; or the exhaust ���' ������ ����� �+�'��� � ��� ��=����to allow ACC-compatible steam duct, upward or downward. There are pros and cons to each of the features mentioned. For instance, a downward exhaust would ��� � ��� � ���� �� � ���� � $������ ��+�the ground for the turbo-generator set in order to allow proper placement of the condenser at the ground level (Figure 2).
Figure 2: Typical downward exhaust ����'������
7�'� �8]���*������*:�%� =����������'������
On the contrary, upward exhaust (Figure 3) allows for ground level arrangement of the STG (Steam Turbo Generator). This way the steam turbine and generator are much more accessible to operators. In addition, the foundation costs are far less compared to the downward exhaust. Considering the advantages of the upward exhaust, ����� ����'������� :��� � � �� %� ��� �� �����'������� ��� ����� � ��� �� � * � ���design process.
Other features such as the number and positions of the main and admission
steam valves were also studied and it was decided to consider one main steam $��$ ����' %������ ���: ����������� ���� �casing at one side. This makes the overhaul procedure a lot easier as there would be no need to dismantle the main valve for rotor inspection.
Another important feature is the steam path arrangement. For a typical 10 MW machine there could be two main ����'��������� �@ @� ���'� � ��%� ����� "��:� *����� ���' + ���@� �� � � � �� %�����'������������������ %����{7�'� �Q}@

���������� ������� ������ 25
��� ����� "��:� ����'�������� �� � +����steam enters the machine through the middle of the outer casing into the HP ��� � �����'� ��%� ��:�� � ��:�%� {��~��'��'� � Q� ��� ���� � �� }@� ��� � =����'�the HP section, it turns back to the IP/LP (Intermediate/Low Pressure) section. In this arrangement, the thrust force generated in the HP section counteracts the one
produced in the IP/LP section; hence there is no need for a balance piston ��� ��� �� � ��� � :���� �� ��*����� ���'� � ��:�����'����������:������� ��� �+�%� ������does not change throughout the whole steam path. Since there is no balance piston, the magnitude of rotor’s lateral vibrations would be less which allows for tighter clearances at the tip of the blades.
7�'� �Q]������ "��:��� �+�*���
Calculations��$��'� �� � �� �+� *���� ����'�������selected, the next thing to proceed with the design process is to determine the groups of blades and the number of stages for each group. But prior to that, appropriate Last Stage Blade (LSB) should preferably be selected among well-proven existing sets. Based on the condenser pressure, the ~��:��+������:���~ ����+��� ���/���%�the exhaust velocity (chosen based on site
conditions and condenser’s type) a proper annular area was calculated. Then a well-proven LSB was taken as a reference and ���� %�%�:���������� ��������� %� =������area. From there, the running speed of the machine was calculated to be 8000 rpm which will be converted via a gearbox to 3000 rpm at last. The chosen LSB also �* ��� %� �� � �� � %��+ � � ��� �� � ���section.
Figure 5: Steam path draft

���������� ������� ������26
Based on the inlet and outlet steam parameters for each blade groups, the ���� ��%� ����� �:�� : � % ��'� %�� ��� �����dimensions of the blades were calculated. �� � %�+ �������� �* ����������� ��� ��% �rows in between were also optimized for each group in order to have the highest *����� � ���� ���@�
Consequently a draft design of the rotor accommodating the steam path (Figure5),
sealing area, bearing areas and the coupling to the gearbox was made (Figure 6). Other components of the machine such as inner and outer casings, IP blades carriers and stationary blade rings were also designed based on the working conditions of each. Putting all together, the complete 3D model of the machine :���* *� %��������:�����7�'� �#@
Figure 6: 3D model representation of the rotor
7�'� �#]�8/�+�% ������� ��Z�"������ �+�����

���������� ������� ������ �#
Steam Turbine-Generator LayoutAs mentioned earlier, the exhaust of the machine was selected to be of upward type, so that the rotor train is laid on �� � '���%� ���@� ����� *�$�% �� �� � ���accessibility to the turbine and generator. Moreover the volume of the foundation will be much less compared to the downward or even axial exhaust types.
��� �� � ���� � %���� ����� �=� ���� ��� �located somewhere beneath the turbine ����� �* �����%������ �� ���:���*��� %� �����large pit. The same is also true for the lube oil tank, as the oil return from the rotor train bearings to the main tank is made possible by gravitational forces. Figure 8 ���:�� �� � ����� �� �+� ���� "' � ����arrangement.
Figure 8: Steam Turbine-Gearbox-Generator Arrangement


Factory: Mapna blvd., Fardis, Karaj, I.R.Iran.�������% ]����8��#�"Q8<�Q�Tel: +98 (26) 36630010 7�=]� ��X�{��}�8����#8Q
���� ������ 231 Mirdamad Ave. Tehran, I.R.Iran.�@�@��=]�����������<X#<"<�Q8Tel: +98 (21) 22908581Fax: +98 (21) 22908654
© MAPNA Group 2016 The technical and other data contained in this Technical Review is provided for information only and may not apply in all cases.
GR053-0